cartographic techniques - home of the montana … techniques ... to perform a spatial join, the ......
TRANSCRIPT
78 Number 37, Fall 2000cartographic perspectives
cartographic techniques
Desktop Hachure Maps fromDigital Elevation Models
Patrick J. KennellyGIS ManagerMontana Tech of theUniversity of MontanaMontana Bureau of Mines andGeology1300 W. Park St.Butte, MT 59701Phone: (406) 496-2986Fax: (406) 496-4451E-mail: [email protected]
A. Jon KimerlingProfessorOregon State UniversityDepartment of GeosciencesCorvallis, OR 97331Phone: (541) 737-1225Fax: (541) 737-1200E-mail: [email protected]
Introduction
A classic cartographic techniquefor representing three-dimen-sional topography on a two-dimensional map involves the useof hachures. A fine line or hachureis generally drawn in the directionof steepest topographic gradient.Hachuring across an area createstonal variations throughout themap. These tonal variations are aform of analytical hillshading,creating a three-dimensionalrepresentation of the topography.Such hillshading can employvertical or oblique lightingtechniques to create such effects.
Hachures display quantitativemeasures of the topography’sslope and aspect. The slope is theangle from horizontal of thesteepest topographic gradient,while the aspect is the azimuthalangle from north measured in theclockwise direction. Because ha-chures are quantitative represen-
tations of these components of to-pography, rules have been estab-lished for the construction of suchgraphics. The general rules varydepending on whether the ha-chure is part of a large-scale orsmall-scale map, and whether atheoretical vertical or obliquelighting is used to illuminate thehachures.
Large-scale hachure maps withvertical illumination effect
Major J.G. Lehmann in 1799 wasthe first to systematically repre-sent the terrain with hachures. Heused lines oriented in the aspectdirection with the thickness of theline proportional to the slope. Theresulting maps proved especiallyuseful for construction of large-scale topographic military maps(Robinson et. al., 1995). Increasingthe hachure thickness with slopewas named “slope hachuring”and can be equated to analyticalhillshading with vertical illumina-tion.
Imhof (1982) outlined five rulesfor the creation of slope hachuresfor large-scale maps:
1) Hachures follow the direc-tion of steepest gradient
2) Hachures are arranged inhorizontal rows
3) Hachure length correspondsto the local horizontaldistance between assumedcontours of a certain inter-val
4) Hachure width is thicker forsteeper slopes
5) Hachure density remainsconstant throughout themap area.
All of the above rules should beobeyed when constructing large-scale hachure maps with verticalillumination. To create hachureswith the appearance of oblique il-lumination, rule five is modified.To create hachures for a small-scale map, defined by Imhof
(1982) as smaller than 1:500,000,more rules are relaxed to allowwhat Imhof calls a freer graphicportrayal.
Large-scale hachure maps withoblique illumination
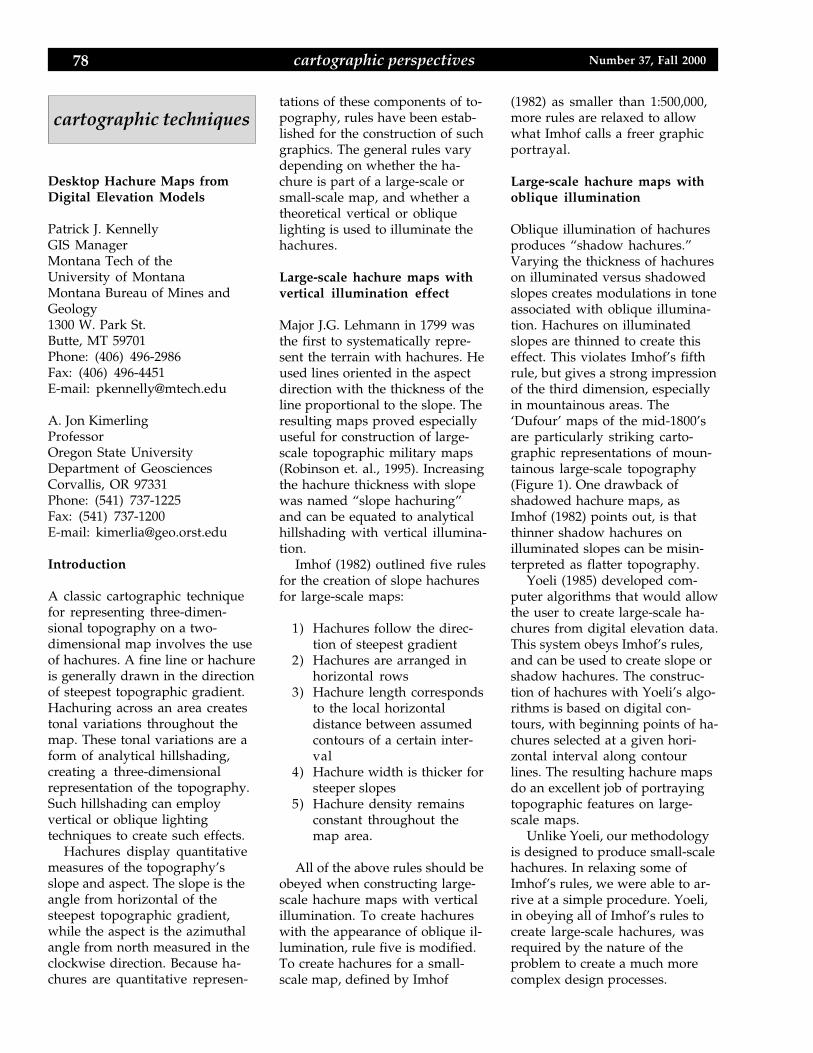
Oblique illumination of hachuresproduces “shadow hachures.”Varying the thickness of hachureson illuminated versus shadowedslopes creates modulations in toneassociated with oblique illumina-tion. Hachures on illuminatedslopes are thinned to create thiseffect. This violates Imhof’s fifthrule, but gives a strong impressionof the third dimension, especiallyin mountainous areas. The‘Dufour’ maps of the mid-1800’sare particularly striking carto-graphic representations of moun-tainous large-scale topography(Figure 1). One drawback ofshadowed hachure maps, asImhof (1982) points out, is thatthinner shadow hachures onilluminated slopes can be misin-terpreted as flatter topography.
Yoeli (1985) developed com-puter algorithms that would allowthe user to create large-scale ha-chures from digital elevation data.This system obeys Imhof’s rules,and can be used to create slope orshadow hachures. The construc-tion of hachures with Yoeli’s algo-rithms is based on digital con-tours, with beginning points of ha-chures selected at a given hori-zontal interval along contourlines. The resulting hachure mapsdo an excellent job of portrayingtopographic features on large-scale maps.
Unlike Yoeli, our methodologyis designed to produce small-scalehachures. In relaxing some ofImhof’s rules, we were able to ar-rive at a simple procedure. Yoeli,in obeying all of Imhof’s rules tocreate large-scale hachures, wasrequired by the nature of theproblem to create a much morecomplex design processes.

79cartographic perspectivesNumber 37, Fall 2000
Figure 1. A portion of a large-scale topographicmap using obliquely illuminated hachures torepresent topography. (From Sheet 19 [1858],Switzerland, 1;100,000, the “Dufour map.”)
Small-scale hachure maps withoblique illumination
Small-scale hachure maps do notreadily comply with the five rulesoutlined by Imhof (1982). Unlikelarge-scale hachure maps, whichare derived based on the contour’sstructural elements, small-scalemaps appear more free-form.Most of these small-scale hachuremaps are obliquely illuminated.
In this paper, we outline amethodology for creating small-scale hachure maps with obliqueillumination directly from a Digi-tal Elevation Model (DEM). Aswith most small-scale hachuremaps, we violate Imhof’s rules 2and 3, but obey all of the otherrules. We use a grey backgroundwith black and white hachures torender oblique illumination whileobeying Imhof’s rule 4. This tonalmethod is similar to that used byTanaka (1950) in creating an ob-liquely illuminated contour mapof a portion of Kyushu, Japan. Werefer to the map resulting fromour method as an illuminated ha-chure map.
Location, Data Source, andSoftware
We have created an illumi-nated hachure map thatcovers a portion of the Cas-cade Mountains of westernWashington state. This areaincludes the volcanoes of MtAdams, Mt. St. Helens andMt. Rainier. This landscapelends itself to hachure map-ping with its frequent vari-ations in slope and aspect.
The source data for thismap are a 3-arc secondDigital Elevation Model(DEM) from the United
States Geological Survey (USGS).The DEM is a square grid withcells measuring 92 m. The DEMwas derived from an elevationmodel produced by the DefenseMapping Agency from sourcedata at a 1:250,000 scale.
We used ESRI’s ArcView Ver-sion 3.2 for Windows software tocreate our illuminated hachuremap from this DEM. Because itwas necessary for us to manipu-late grids, we also used theArcView Spatial Analyst Version2.0 for Windows extension. In thispaper, we outline all ArcView op-erations and list equivalent com-mands for ESRI’s ARC/INFO Ver-sion 7.2 software with the GRIDmodule. Other Geographic Infor-mation System (GIS) softwarethat can manipulate and displaygrids and spatially referencedpoints could be adaptable to ourmethodology.
Methodology
To produce a small-scale obliquelyilluminated hachure map, wecreated a point theme from theDEM that contains both slope andaspect data. We oriented thehachures using aspect data. Next,we created oblique illuminationwith both slope and aspect data.We used aspect data to dividepoint data into illuminated and
non-illuminated hachures. Inaddition, we used the slope datato vary the thickness of individualhachures. We present a step-by-step guide to our methodologybelow.
The first step was to aggregategrid cells of the 92 meter DEM tocreate a 277 meter DEM using amean value of the nine contribut-ing grid cells. This aggregationwas necessary to create an attrac-tive and legible hachure map atour selected scale. We aggregatedthe grid by cutting and pasting ashort script in ArcView Help (un-der Aggregate, then Example). Inthe ARC/INFO GRID module, usethe Aggregate command.
In order to make illuminatedhachures, it is necessary to haveboth slope and aspect informa-tion. We calculated slope and as-pect grids for the aggregated DEMusing the Derive Slope and DeriveAspect items under the Surfacedropdown menu. We convertedthese floating point grids to inte-ger grids, a step necessary beforethey can be converted to pointthemes. To do this, we used theMap Calculator under the Analy-sis menu. The calculation dia-logue box prompts for a gridtheme (slope or aspect), and thenan operation to apply to thistheme. In this example, we usedthe arithmetic Integer operation,which truncates the floating pointaspect or slope number. In theARC/INFO GRID module, usecommands Slope, Aspect and Intto perform the same operations.
Next, we converted slope andaspect grids into point themes. Weused a sample ArcScript from theESRI website (www.esri.com). TheRaster to Vector Conversionscript, written in Avenue by Ken-neth McVay, converts a grid to apoint theme. We gave unique at-tribute field names to slope andgrid values in the point themes. InARC/INFO, use the commandGridpoint to convert a grid to apoint coverage.
80 Number 37, Fall 2000cartographic perspectives
We joined the slope and aspectthemes in ArcView based on loca-tion. To perform a spatial join, the
table of one theme is the source,the other is the destination. We se-lect the Shape field in both tables.
We use the Join button or the Joinoption under the Table dropdownmenu to combine attributes into a
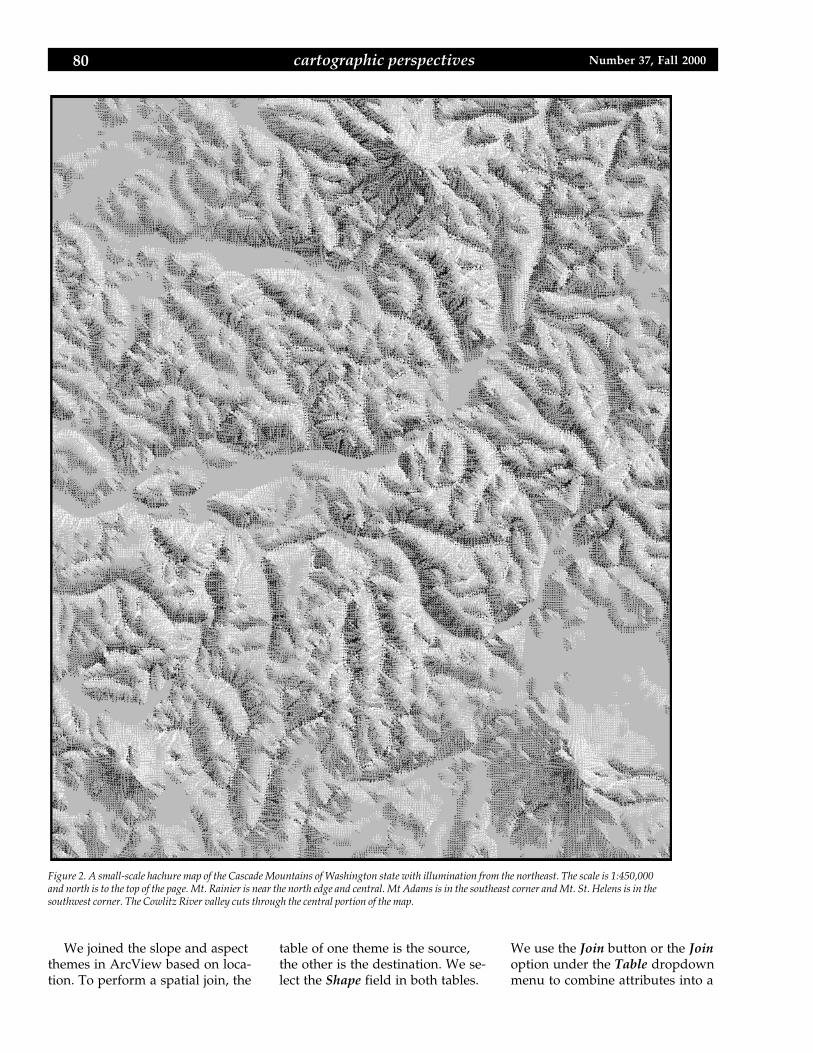
Figure 2. A small-scale hachure map of the Cascade Mountains of Washington state with illumination from the northeast. The scale is 1:450,000and north is to the top of the page. Mt. Rainier is near the north edge and central. Mt Adams is in the southeast corner and Mt. St. Helens is in thesouthwest corner. The Cowlitz River valley cuts through the central portion of the map.

81cartographic perspectivesNumber 37, Fall 2000
single table. The resulting spatialjoin for two point themes willwrite all attributes from thesource table to the nearest point inthe destination table, making allslope and aspect informationavailable in one theme. No com-mand exists in ARC/INFO to per-form a spatial join, but the sameresult could be achieved through aseries of commands or a script.One option would be to Buffer onepoint coverage, then Intersect itwith the other.
We used aspect values to orienthachures in the direction of steep-est slope. The convention for ro-tating point symbols in ArcView iscounterclockwise from north,while the convention for aspectangle is clockwise from north. Assuch, we multiplied the aspectvalue by -1. The modified aspectvalues define the direction inwhich hachures are drawn. Wespecified this variable as the Rota-tion Field in the Advanced optionof the legend editor for the pointtheme. In ARC/INFO’s ArcPlotmodule, rotate the hachure withthe Markerangle command.
We used both aspect and slopevalues to create the illusion of ob-lique illumination. We separatedpoints representing hachures inthe illuminated and non-illumi-nated direction into two newthemes. We selected an illumina-tion azimuth of 45°. Then we se-lected all points with aspect val-ues within 90° of the illuminationdirection (original aspect range -45°through 135°) and saved theseto a new theme. These are the illu-minated hachures, which we dis-played as white arrows. We savedall other points to a second theme.These are the non-illuminated ha-chures, which we displayed withblack arrows. We made the back-ground gray so that both blackand white hachures are visible.
We enhanced the illuminationeffect by varying arrow thicknesswith slope. In this example, wechose three classes of slope: the
first from 2° to 4.6° was drawnwith a 6 point arrow, the secondfrom 4.6° to 7.2° with an 8 pointarrow, and the third from 7.2° tothe maximum slope, 17.4° with a10 point arrow. Because hachuresgenerally do a poor job of repre-senting gently sloping topogra-phy, we did not include any ha-chures with slopes below 2°.
Discussion
The resulting hachure map ispresented at a scale of 1:450,000 inFigure 2. The hachures generallyrepresent the topography in anaccurate and easily interpretablemanner. Black and white ha-chures on gray remove theambiguity of slope steepnessassociated with some shadowhachure maps. The use of arrowsfurther eliminates any confusionthat could arise from bi-direc-tional lines in determining azi-muth in topographically complexareas.
Our process obeys three ofImhof’s five rules of hachuring.Hachures follow the direction ofsteepest gradient, as in nearly allhachure maps. Hachure width isthicker for steeper slopes, madepossible with oblique illuminationby using black and white arrowson a gray background. Lastly, ha-chure density remains constantthroughout the map area, exceptin areas of slope less than 2°. Thisresult follows from using a regulargrid as the source data. Althoughhachures are evenly spaced, thesubtle changes in orientation (1°of aspect) and the small size of thehachure produces a map we be-lieve has the free-form look asso-ciated with small-scale hachuremaps.
Figure 2 includes some smallareas of hachures within a largerwhite area with slopes less than2°. These isolated areas of ha-chures have often been excludedin hand rendered hachure maps.If it is desirable to eliminate these
hachures, the offending points canbe selected by location and deletedfrom the GIS point themes.
Lastly, we stress that the ha-chure map here is a generalizationand does not fully exploit the datain the DEM. One generalizationwas the aggregation of the DEMfrom 92 to 277 meters, a step nec-essary for clarity. Also, an analyti-cal hillshading of the data wouldshow more detail of landscapethan this hachure map. One ex-ample of this is the Mt. St. Helenscaldera, discernible with analyti-cal hillshading of the 277 m DEM.The transition from shaded areasused in hillshading to linear pointsymbols used in hachuring is ageneralization inherent in the ha-churing process.
Bibliography
Imhof, E. 1982. Cartographic ReliefPresentation. Berlin and New York:Walter de Gruyter.
Lehmann, J. G. 1799. Darstellungeiner nueun Theorie derBergzeichnung der schiefen Flächenim Grundriss oder derSituationszeichnung der Berge,Leipzig.
Robinson, A.H., J.L. Morrison, P.C.Muehrcke, A.J. Kimerling, andS.C. Guptill. 1995. Elements ofCartography, 6th ed. New York:John Wiley and Sons.
Tanaka, K. 1950. “The reliefcontour method of representingtopography on maps.” Geographi-cal Review 40:444-56.
Yoeli, P. 1985. “Topographic reliefdepiction by hachures withcomputer and plotter.” Carto-graphic Journal 22: 111-24.