cartographies of race and class: mapping the class...
TRANSCRIPT

Cartographies of Race and Class: Mappingthe Class-Monopoly Rents of AmericanSubprime Mortgage Capital
ELVIN WYLY, MARKUS MOOS, DANIEL HAMMEL andEMANUEL KABAHIZI
Abstractijur_870 332..354
The worst global financial crisis since the Great Depression has drawn worldwideattention to America’s subprime mortgage sector and its linkages with predatoryexploitation in working-class and racially marginalized communities. During nearly twodecades of expansion, agents of subprime capital fought regulation and reform by (1)using the doctrine of risk-based pricing to equate financial innovation with democratizedaccess to capital, (2) appealing to the cultural myths of the ‘American Dream’ ofhomeownership, and (3) dismissing well-documented cases of racial discrimination andpredatory abuse as anecdotal evidence of rare problems confined to a few lost-causeplaces in what is otherwise a benevolent free-market landscape. In this article, wechallenge these three tactics. Properly adapted and updated, Harvey’s (1974) theory ofclass-monopoly rent allows us to map and interpret the localized, neighborhoodexploitations of class and race in several hundred US metropolitan areas as they werewoven through Wall Street securitization conduits into global networks of debt andinvestment. Understanding the structural inequalities of class-monopoly rent is essentialfor analysis, organizing, and policy responses to the crisis.
Subprime goes prime timeIt is universally recognized, by analysts across the political spectrum, that subprimelending is disproportionately concentrated among racial and ethnic minority individualsand neighborhoods. For more than a decade, progressives have documented theproliferation of ever more aggressive tactics of deception, fraud and legal-yet-abusivepractices in the subprime market, and advocates have sought regulatory reforms tocombat the syndrome of racially discriminatory and ‘predatory’ lending (HUD–TreasuryJoint Task Force, 2000; Engel and McCoy, 2002). Yet conservatives have applaudedsubprime lending as a case of benevolent, risk-based pricing, and have subverted nearlyall reform efforts by appealing to the American ideology of consumer sovereignty.Progressives’ answers to this argument were detailed, rigorous, precise and thus easilyignored amidst a national credit binge fueled by falling interest rates and rising homeprices.
This material is based upon work while Daniel J. Hammel was serving at the US National ScienceFoundation. Any opinions, findings, and conclusions or recommendations expressed in this material arethose of the authors and do not necessarily reflect the views of the National Science Foundation. Theauthors would like to acknowledge the helpful comments on a previous draft of this article by ManuelAalbers, Jesus Hernandez and Kevin Gotham. The authors also thank the IJURR reviewers for theirinsight and advice. The authors retain responsibility for all errors and opinions.
Volume 33.2 June 2009 332–54 International Journal of Urban and Regional ResearchDOI:10.1111/j.1468-2427.2009.00870.x
© 2009 The Authors. Journal Compilation © 2009 Joint Editors and Blackwell Publishing Ltd. Published by BlackwellPublishing. 9600 Garsington Road, Oxford OX4 2DQ, UK and 350 Main St, Malden, MA 02148, USA

But if it was easy to ignore the complaints of scholars and advocates for working-classfamilies and communities of color, it would prove more difficult to brush aside theconcerns of the armada of securities analysts and bond traders working to protect theinterests of capital. Most American home loans are securitized almost immediately:banks and mortgage companies make loans, and then sell the obligations to investors inreturn for a fresh infusion of capital that can be used to make more loans. In theconventional prime market, loans are typically sold to one of the giant GovernmentSponsored Enterprises (GSEs), Fannie Mae or Freddie Mac; but the subprime market isdominated by private trusts and Special-Purpose Vehicles (SPVs) that acquire loans andpool them into Collateralized Debt Obligations (CDOs) and Mortgage-Backed Securities(MBSs) underwritten by Wall Street investment banks. MBS and CDO shares are oftenheld by national banks’ off-balance-sheet Structured Investment Vehicles (SIVs), and arealso traded in various risk categories (‘tranches’) to individual and institutional investorson global financial markets. Since the mid-1990s, the specialized field that spawned allthese acronyms — structured finance — seemed to have achieved financial alchemy,packaging individually risky subprime loans into high-yield MBSs that received (for thetop tranches) the highest, triple-A grades from bond-rating agencies (Fabozzi, 2001;Dymski, 2007; Engel and McCoy, 2007; Peterson, 2007).
In a climate of steadily rising home values, even the most egregious predatoryschemes involved surprisingly low risks for investors, since borrowers who fell behindon their payments could be forced into a quick refinance — generating new up-front feescharged against the borrower’s home equity — or into a quick distress sale to pay off thedebt without entering foreclosure. Brokers and bankers continued to enjoy healthy profitsfrom up-front fees and charges, lenders earned healthy margins on sales to the secondarymarket, and once borrowers’ repayment capacity or home equity was stripped bare, loanservicers would force sales to protect MBS investors from losses. The only consistentlosers were the homeowners stripped of their assets and forced into the rental market.
Initially, this system worked well for brokers, lenders, investment banks, bond-ratinganalysts and investors. Subprime originations mushroomed from $65 billion in 1995 to$332 billion in 2003 (Chomsisengphet and Pennington-Cross, 2006: 37), and then to$625 billion in 2006 (Andrews, 2007) even as national home prices crested. But in early2007 financial analysts began to see trouble as the speed of delinquencies, defaults andforeclosures on the last cohort of loans made in 2006 accelerated dramatically. Aproliferation of banner headlines chronicled the credit crunch, mortgage meltdown,subprime slide and scores of other alliterative announcements as it became clear thatsubprime losses that had devastated marginalized borrowers might eventually take a tollon investors too. First the riskiest subprime originators filed for bankruptcy protection.Over the next year the time bombs of default risk in MBS shares exploded in investmentportfolios around the world, devastating the investor confidence that had sustained theoptimistic market values attached to simple bank stocks as well as more complex MBSissues, derivatives and credit default swaps. The fearful response of investors and lendersbegan to shut down activity in key arteries of the global credit markets, forcing a seriesof government interventions unprecedented since the Great Depression: low-interest,short-term Federal Reserve loans to banks, eventually totaling more than $200 billion, atakeover of Fannie Mae and Freddie Mac along with liabilities for their $5.2 trillion ofinsured mortgages, a $700 billion plan to buy mortgage assets of unknown value in anattempt to purge the balance sheet of troubled institutions, and eventually (with the USreluctantly following the lead of European officials) direct government ownership stakesin banks along with increased guarantees for deposits, money-market mutual funds, andother instruments once regarded as safe as cash.
Market imperfections and the flat subprime world
Amidst the disorienting worldwide maelstrom of business-press coverage, it is easy tooverlook two foundational axioms that have framed mainstream discussion and public
Class-monopoly rents of American subprime mortgage capital 333
International Journal of Urban and Regional Research 33.2© 2009 The Authors. Journal Compilation © 2009 Joint Editors and Blackwell Publishing Ltd.

policy; these assumptions are the focus of our analysis. First, the collapse of subprimesecuritization is assumed to result from regrettable but unpredictable mistakes and‘market imperfections’ (Federal Reserve, 2007: 14). Bankrupt mortgage companies andinner-city homeowners facing foreclosure are the result of unusual circumstances, butthere is nothing fundamentally wrong with the innovations of subprime ‘risk-basedpricing’ (c.f. Litan, 2001). The subprime boom just went too far, the industry’s defendersclaim, because brokers and lenders tried to help too many consumers who were morethan willing to borrow beyond their means. Put simply: mistakes were made, borrowersmust accept their share of responsibility, and the market must be allowed to adjust withthe absolute minimum degree of public intervention.
The second axiom holds that geography is empirically interesting but theoreticallyirrelevant. To be sure, the subprime boom has etched out intricate urban and regionalpatterns; even the most conservative major newspaper in America, the Wall StreetJournal, compiled detailed rankings and maps of ‘The United States of Subprime’(Brooks and Ford, 2007). But these patterns are almost always understood as nothingmore than the result of demand-side factors — the needs, preferences, qualifications oreducation of homeowners and homebuyers, or the distinctive circumstances of particularplaces. From day to day, the geographical details of this narrative change, but the logicremains the same. The spatiality of subprime credit is assumed to be a Pareto-optimalresponse to the geography of demand among consumers unable or unwilling to meet thestandards for the prime market. Put simply, after controlling for consumer qualifications,the subprime world is flat (Berkovec et al., 1994; Ambrose et al., 2000; Chomsisengphetand Pennington-Cross 2006; c.f. Friedman, 2007).
In the rest of this article, we provide a challenge and an alternative to these twofoundational axioms. Subprime lending exploits the legal and regulatory loopholesjustified by risk-based pricing in order to provide opportunities to realize class-monopolyrent. Even after accounting for the qualifications and risk profiles of borrowers, subprimeAmerica is anything but flat: credit flows etch out intricate urban and regionalgeographies of class-monopoly rent that are rooted in generations of racializedinequalities. Our story unfolds in four parts. First, we review the theories of creditrationing and risk-based pricing, which provide the dominant economic and policyexplanations for the subprime boom and its associated racial–geographical disparities.Second, we explain how contemporary inequalities in the subprime market should beunderstood not as market ‘imperfections’, but as latter-day incarnations of Harvey’s(1974) class-monopoly rent. Third, we describe a simple protocol for measuring andmapping the racial and class dimensions of class-monopoly rent. Finally, we use thisprotocol to map the geography of the subprime boom at its peak (2004–6) across severalhundred metropolitan areas in the US. We use several approaches to test whethervariations in market penetration simply mirror borrower qualifications (as predicted byrisk-based pricing), or reflect more systematic inequalities (as suggested by class-monopoly rent).
Rationing, risk and raceCredit is fascinating for economists (and especially neo-classical economists), because itis vulnerable to a dilemma first identified by Adam Smith. If the interest rate is set toohigh, ‘the greater part of the money to be lent, would be lent to prodigals and profectors’(Wealth of Nations, 1776, cited in Stiglitz and Weiss, 1992: 694). Two centuries on, ‘Thefundamental problem facing capital markets can be put starkly: there is an infinite supplyof charlatans in the market’ (Greenwald and Stiglitz, 1991: 8). Charlatans disrupt theentire system, because credit is not like other commodities. Money circulates not forcurrent goods and services, but in exchange for contingent promises about the future(ibid.). The dilemma becomes intractable under conditions of asymmetric information,
334 Elvin Wyly et al.
International Journal of Urban and Regional Research 33.2© 2009 The Authors. Journal Compilation © 2009 Joint Editors and Blackwell Publishing Ltd.

when lenders do not have enough information to know borrowers’ true abilities orintentions to honor their debts. In this situation, a perverse problem of adverse selectionsets in when lenders raise the cost of credit to cover the expected losses on borrowerswho appear to be more risky. The higher price will deter the prudent borrowers who willwork hard to honor the debt, but it will not discourage the charlatans who have nointention of repaying. If lenders do not have enough information to distinguish betweenthese good and bad risks, they will overreact by setting qualification standards too high,they will resort to idiosyncratic or irrational criteria in attempts to avoid the charlatansand they will ration credit on supply rather than price. The result is a systemic creditshortage for many qualified borrowers (Stiglitz and Weiss, 1981).
Credit rationing is the dominant neoclassical explanation for the racial redlining anddiscrimination that plagued American cities for generations, through the 1980s (Stiglitzand Weiss, 1981; Vandell, 1984; Berkovec et al., 1994). If the ontological appeal of thetheory for conservatives is obvious, so is the solution: get more and better information onconsumers to eliminate information asymmetries. As lenders are able to acquire morerelevant and reliable information to help distinguish borrowers with good and badintentions, they will once again be able to use the price mechanism to allocate creditmore efficiently to more people. This expanded screening capacity arrived in the 1990s,with a revolution in consumer credit reporting and surveillance systems (Saunders andAllen, 2002; White, 2002; Miller, 2003).
For at least two decades, risk-based pricing has been the central doctrine of America’sderegulatory policy stance on financial services. There is now a compelling body ofevidence that contradicts the rosy predictions of the theory. Most of this evidence comesfrom specialized empirical and legal analysis of actual industry practices (for reviews,see Engel and McCoy, 2002; 2007; White, 2004). Unfortunately, much of this researchchallenges only the empirical predictions of risk-based pricing — not its underlyingphilosophy. Risk-based pricing thus retains enormous popular acceptance. It seems onlylogical and reasonable that lenders should be encouraged to serve people in need, and beallowed to charge rates tailored to the risk of consumer default. Even in the midst of thecurrent catastrophe, many progressives fall into the trap set by conservative advocates ofrisk-based pricing — accepting the presumptions that subprime lenders got into troublebecause they were too generous with risky borrowers, and that attempts to regulate theindustry will discourage lenders from serving low-income and minority consumers, thushurting those we wish to help. Beneath these assumptions lies the bedrock, bipartisanpolicy consensus that deregulated financial markets are the only way to allow allhouseholds an opportunity to achieve the ‘American Dream’ of homeownership.
Renting capitalIf risk-based pricing and credit rationing boast a genealogy to the great Adam Smithhimself, so does the theory of class-monopoly rent:
The rent of land, considered as a price paid for the use of the land, is naturally a monopolyprice. It is not at all proportioned to what the landlord may have laid out upon the improvementof the land, or to what he can afford to take; but to what the farmer can afford to give. (Wealthof Nations, 1776, cited in Evans, 1991: 2).
For unimproved land, the cost of ‘production’ for the landowner is zero, and yet still theowner receives a price for its use; the class of landowners, by definition, enjoy amonopoly that commands rent. This insight was ‘a feature of classical economics’(Evans, 1991: 4) in the eras of Ricardo, Smith, Mill and Marx. But it ‘virtually disappearsfrom the literature’ (ibid.: 3) in the twentieth century, and ‘class’ was virtually erasedfrom the literature on rent until Harvey’s (1974: 240) reminder of the inescapably socialrelations of tenure:
Class-monopoly rents of American subprime mortgage capital 335
International Journal of Urban and Regional Research 33.2© 2009 The Authors. Journal Compilation © 2009 Joint Editors and Blackwell Publishing Ltd.

Tenants are not easily convinced that the rent collector merely represents a scarce factor ofproduction. The social consequences of rent are important and cannot be ignored simplybecause rent appears so innocently in the neoclassical doctrine of social harmony throughcompetition.
Through the 1960s, considerable attention focused on the adaptation of agriculturalland-rent theory — especially differential land rent — to understand the spatial structureof cities. Harvey, however, understood class-monopoly rent as conceptually distinct fromdifferential rent. Each element of class-monopoly rent is crucial. Class matters because,in all capitalist societies, the rights and privileges of ownership are central to powerrelations, political conflict and social inequality. Monopoly matters not primarilybecause, as Marx suggests, the supply of land is limited, nor because landowners canbecome price-makers, but rather because of the inherent monopoly associated with thelegal status of ownership. Owners enjoy a collective power in the marketplace by virtueof the fact that they are not renters. Owners’ rights are codified in law and backed up bystate protection and, if necessary, armed police force; owners’ protection is by no meansabsolute nor unconditional, but it is much more than the security given to renters. Finally,rent is the simple yet crucial economic measure enabling owners’ claims on the use ofany capitalizable asset with return subject to the ‘outcome of a conflict with a class ofconsumers of that resource’ (ibid.: 239).
These conflicts are mediated by various financial institutions providing credit forthose who can only become owners through mortgage debt: ‘All of these institutions . . .operate together to relate national policies to local and individual decisions and, in theprocess, create localized structures within which class-monopoly rents can be realized’(ibid.: 245). For empirical illustration, Harvey mapped the anatomy of class-monopolyrent in neighborhood submarkets of Baltimore, Maryland. Although part of his analysisdealt with conflicts between speculator-developers and suburban middle- and upper-income homebuyers, the most shocking exploitation was apparent in the urban core,where urban and regional context inscribed localized variations on the deeply entrenchedand fundamental American dilemma of white racism against African Americans. In oneinner-city submarket, home and land sales were ‘dominated by cash and private loantransactions with scarcely a vestige of institutional or government involvement in theused housing market’ (ibid.: 245). The most severe class-monopoly rent inequalities inthis submarket follow the landlord-tenant binary, as mediated by American urban racism.‘Professional landlords are anxious to disinvest’ from real estate so they can earn higherreturns in the financial markets,
but they still manage to get a rate of return around 13 percent . . . The tenants are low-incomeand for the most part black. They are poorly organized, exercise little political control and areeffectively trapped in this sub-market. Class-monopoly rents are here realized by professionallandlords who calculate their rate of return to match the opportunity cost of capital (ibid.: 245).
In a separate submarket of West Baltimore, by contrast, lower-middle-class blacks hadsufficient incomes to consider homeownership. Yet they faced discrimination frommainstream financial institutions, and could only access ownership through the land-installment contract, a usurious and risk-filled path to homeownership. Only if thiscourse was successfully navigated for several years could a ‘buyer’ reduce the principalenough to obtain conventional financing and achieve ‘true’ ownership. These types ofschemes were common in US cities through the 1960s, and allowed speculators to chargesteep premiums to African Americans excluded from mainstream credit flows. Most ofthese ‘owners’ were really the tenants of capital.
Subprime lending as class-monopoly rent
The fundamental essence of the subprime lending boom involves the use of highlymortgaged ‘homeownership’ to connect national and transnational capital markets to the
336 Elvin Wyly et al.
International Journal of Urban and Regional Research 33.2© 2009 The Authors. Journal Compilation © 2009 Joint Editors and Blackwell Publishing Ltd.

lucrative profit margins of local class-monopoly rents. Two long-term shifts establishedand strengthened these connections. First, a durable bipartisan Washington consensus onthe virtues of homeownership has steadily undermined rental housing markets,especially for low-cost units. Second, deregulated financial innovation and creative debtmanagement became key instruments of privatized public policy. Especially in housing,spending and redistribution policies were downplayed in favor of a new emphasis on taxcredits and other incentives to encourage market-based solutions. This shift wasbipartisan, too: Reagan championed regressive tax cuts, while Clinton permittedunprecedented banking-sector consolidation while using a combination of deregulatorycarrots and fair-lending enforcement sticks to encourage private market solutions toproblems (like redlining, urban disinvestment and discrimination) that had insufficientpublic support for direct government intervention (Listokin and Wyly, 2000). Thefinancial services industry had already begun searching for new market opportunities asgrowth rates moderated among its traditional demand base, and Wall Street was creatingan ever-broader array of new kinds of credit default swaps and asset-backed securitiesmarkets for every conceivable debt instrument (Fabozzi, 2001). After the landmarkdeficit-taming budget deals of the first year of the Clinton administration in 1993 reducedlong-term interest rates amidst a climate of expanded free trade and transnationalinvestment, the mortgage industry began to accelerate its reorientation away from abusiness model premised on long-term repayments to a pass-through model earningup-front fees on mortgages quickly sold in the secondary market. Through most of the1990s, the Federal Housing Administration (FHA) and the GSEs Fannie Mae andFreddie Mac led the effort to encourage traditional but flexible lending to underservedmarkets — a record that conservatives are now working to distort with claims that theworldwide financial crisis resulted from misguided government efforts to encourage easycredit for minorities. In fact, the subprime boom was in direct competition with publiclysubsidized affordable lending, and most subprime lenders preferred to avoid the rulesand regulations of FHA insurance and the loan-screening policies of the GSEs in favorof unregulated private securitization through Wall Street investment banks. Thanks to aseries of 1980s laws that had exempted certain types of lenders and certain kinds of loansfrom state usury limits (Engel and McCoy, 2007), and after the Bush administrationbegan to fight state-level efforts to crack down on predatory practices, more and moreinstitutions and investors began to pursue the higher up-front fees of subprime lending.
The combined effects of state and federal regulatory structures and competition in thelending industry brought an institutional transformation in the 1990s. Many large lendershad maintained affordable lending divisions that bolstered public relations withtraditional loans made to underserved markets; but, beginning around 2000, more andmore banks faced competitive threats from thinly capitalized, non-bank mortgagecompanies that were exempt from most state interest rate caps and had direct sources ofcapital from Wall Street investment banks. A growing number of large banks bought upexisting subprime firms and organized them as national subsidiaries exempt from stateregulation; other banks created their own subsidiaries to cash in on the boom. KatheNewman (2009, this issue) astutely analyzes the effects of this transformation:communities that had struggled for years to gain access to (traditional, safe, sustainable)mortgage credit were soon devastated by high-risk, predatory capital aggressivelyseeking access to communities where a history of financial exclusion had made it easy todeceive consumers into expensive debt obligations. Steadily rising home values allowedpredators to refinance borrowers who fell behind, earning more fees and hiding abusivepractices behind artificially low default rates. Together, these changes propelled anunprecedented wave of capital investment targeted mostly but not exclusively to low-income people and places, racially and ethnically marginalized borrowers andcommunities, and other ‘new markets’.
Of course these markets were new only for mainstream financial institutions, and forWall Street investment conduits. ‘Underserved’ markets have long been familiar to slumlandlords, abusive storefront lenders, payday lenders, pawn shops and foreclosure
Class-monopoly rents of American subprime mortgage capital 337
International Journal of Urban and Regional Research 33.2© 2009 The Authors. Journal Compilation © 2009 Joint Editors and Blackwell Publishing Ltd.

specialists. Subsidiary structure and securitization, however, allowed large nationalbanks and Wall Street investment houses to tap into the extractive profits of ‘newmarkets’ while avoiding state usury law and the reputational risks of deceptive, abusivebusiness practices. Citigroup, HSBC, and many other global banking brands bought upnotorious subprime firms and moved aggressively into high-cost lending. Industrycompetition combined with federal pre-emption of state law led to the selectivereplacement and de-localization of many of the individual actors described by Harvey.Yesterday’s local landlords and speculators financed by local or regional banks havebeen replaced by today’s network of local brokers, working independently or for variouskinds of non-bank mortgage companies or bank subsidiaries. Nearly all of them sellloans to obtain fresh capital flows from private investors and SPVs working with nationallenders and Wall Street investment banks.
Since the 1970s, the individual actors have changed but the material relations ofexploitation are the same. Today, fewer inner-city African American renters are forced topay class-monopoly rent to slum landlords, and fewer aspiring black homeowners areforced to accept the terms of speculators peddling land installment contracts. Yet manymore African Americans (and Latinas and Latinos, and others) are pushed into high-costsubprime mortgage credit — even when they are qualified for better-priced prime credit,and often (in the case of home improvement and refinance loans) when they are not evenseeking credit in the first place (Stein, 2001; Lax et al., 2004; Renuart, 2004; Squires,2004; Peterson, 2005). Anyone trapped in the web of high-cost subprime credit is forcedto pay a wide range of interest-rate premiums and complex fees and charges, many ofthem carefully disguised. These excessive payments are sustained by informationasymmetries (the econometric term for deception) and by savvy exploitation of manyconsumers’ belief that they are unable to qualify for mainstream credit. The excessivepayment stream is allocated, by negotiation as well as competition, amongst brokers,lenders, appraisers, home-improvement contractors, investment banks and investorsseeking maximum risk-adjusted yields in MBS shares.
It is entirely possible for abusive subprime lending to flourish even when all of theindividual actors involved have honorable intentions of providing fair treatment to thecustomers they deal with directly: a subsidiary develops an innovative, flexible mortgageavailable to all, but markets heavily through racialized minority advertising channels andbroker networks; a broker working in a low-income, inner-city neighborhood treats allborrowers the same regardless of race or ethnicity, but happens to specialize only inhigh-cost subprime adjustable-rate mortgages with stiff pre-payment penalties; a WallStreet investment banker can truthfully claim to have no knowledge of the racialidentities of individuals struggling with monthly payments collateralizing subprimeMBS shares. Even when individuals have honorable intentions, however, thetransformation of the collateralized house into a traded financial instrument that stretchesthe distance between the underlying asset and global financial markets (Sassen, 2009,this issue) also breaks the ethical and economic interdependencies between savers,lenders and borrowers. The new actors involved in what Sassen (2009) diagnoses as theglobal circulation of mortgages — local brokers and lenders, transnational banks,investment houses and hedge funds, and worldwide MBS investors — have for the mostpart replaced the slum landlords and land-installment speculators of a previous age. Butjust as in Harvey’s account of Baltimore, ‘owners’ have only the most precarious abilityto ‘have, possess’ according to the etymology of the Old English agnian and agen.Millions of home ‘owners’ drawn into the subprime system are, in material and housing-class terms, barely distinguishable from renters. In the subprime market, homeownersare simply paying rent to the new landlord, subprime mortgage capital. In thesecircumstances, the cultural symbolism of homeownership is nothing more than adeceptive illusion (Krueckeberg, 1999).
Up-scaling of the extraction of class-monopoly rent from a localized submarket,described by Harvey, to the entire US urban system presents challenges (Wyly et al.,2006). In Baltimore, class-monopoly rents were typically taken by a loosely organized
338 Elvin Wyly et al.
International Journal of Urban and Regional Research 33.2© 2009 The Authors. Journal Compilation © 2009 Joint Editors and Blackwell Publishing Ltd.

group of landlords operating in collusion with one another. We do not suggest collusionamong subprime lenders, but that informal agreements are not even necessary in a(neoliberal) market formed through deregulation and enticement to exploit new markets.Harvey also describes a situation where the extraction of class-monopoly rent was, to adegree, sustainable due again to informal mechanisms to prevent landlords fromextracting more capital than the low-income tenants could bear. Such a set ofmechanisms does not exist when class-monopoly rent is extracted through rampantsubprime lending at a scale removed from the day-to-day experience of theneighborhood. With sophisticated risk management and securitization, risks werepartitioned, priced and exchanged on markets worldwide — seemingly freed of thematerial constraints of inner-city homeowners struggling to make the monthly payments.These risk management mechanisms failed spectacularly when it became clear thatexploitation had its limits. But the trillions of dollars of investor losses in 2007 and 2008have not weakened or eliminated the inequalities of class-monopoly rent: federal policyinterventions to help homeowners facing foreclosure have been limited (often involvingvoluntary programs to encourage servicers to consider loan modifications). By contrast,US government commitments to buy MBS, to inject capital into banks, and even to partlynationalize financial institutions have been forceful, decisive and aggressive — to thetune of a potential total public exposure of at least $5 trillion. Notably, one of theproposals that conservatives refused even to consider in the $700 billion rescue packagepassed in October 2008 would have revised household bankruptcy law to allow judges tomodify the terms of first-lien mortgages for families in bankruptcy proceedings. Thisprovision would have cost the Treasury not a penny, but it would significantly alter theterms and conditions of class-monopoly rent.
Metropolitan market penetrationand racial–geographic segmentationOur perspective on class-monopoly rent is not new. The argument was sketched clearlyby Harvey in 1974, and refined in the subsequent decade (Harvey, 1978; 1981; 1985).Our theory is implicit in, and complementary to, other lines of inquiry in a rich literature,including historiographies of the Community Reinvestment Movement (Squires, 1992;2003; 2004), legal-economic diagnoses of segmented subprime credit markets and globalfinance (Engel and McCoy, 2002; 2007), long-term measures of the transformation fromthe old inequalities of exclusion to the new inequalities of stratified inclusion (Williamset al., 2005; Ashton, 2008; Immergluck, 2008; Hernandez, 2009), and especiallyPeterson’s (2007) notion of ‘predatory structured finance’ and Gotham’s (2006; 2009,this issue) analysis of securitization as the secondary circuit of capital. Our purpose is toadd an explicit, consistent and multivariate urban and regional dimension to thisliterature. If we were to map Harvey’s (1974) relations of class-monopoly rent as itcirculates through Berry’s (1964) cities as systems within systems of cities, what wouldwe see in this cartography of capital?
Our analysis rests upon two claims, which we evaluate during the peak of thesubprime boom from 2004 to 2006. First, we examine metropolitan market penetrationby beginning with the risk-based pricing notion that subprime credit will be mostcommon in places marginalized by urban and regional inequalities of deindustrializationand uneven development. Even after accounting for these factors, however, wehypothesize that the geography of race and ethnicity still matters. In the distorted worldof subprime marketing, targeting racially and ethnically marginalized communities is anefficient, economically rational way to find consumers who feel excluded frommainstream credit markets, and who are likely to be more vulnerable to deception andabuse. Second, we hypothesize that the racial–geographic segmentation of class-monopoly rent can best be understood by analyzing mortgage-industry subsidiary
Class-monopoly rents of American subprime mortgage capital 339
International Journal of Urban and Regional Research 33.2© 2009 The Authors. Journal Compilation © 2009 Joint Editors and Blackwell Publishing Ltd.
structure and secondary-market circuits — rather than the presumed credit blemishes ofindividual borrowers at the heart of risk-based pricing.
DataMany different kinds of data source provide complementary yet partial views of specificfacets of the subprime market (Immergluck, 2008; Newman, 2009, this issue). Since wewish to measure the market consistently across nearly all cities and suburbs across thenation, the only comprehensive source comes from the annual application-level recordsreported by lending institutions that comply with the Home Mortgage Disclosure Act(HMDA) (FFIEC, annual). HMDA provides, inter alia, the requested loan amount,purpose, and income of each consumer applying for a mortgage loan from a coveredlender, along with the location of the collateral property, the outcome of the application,and (for loans approved and originated) information on whether the loan was sold in thesame calendar year to a secondary-market investor.
HMDA has many well-documented limitations, but (1) unlike specialized industrydatasets, it provides unparalleled coverage of most of the market, (2) unlike specializedhousing surveys or internal lender files, it is a full enumeration rather than a sample, and(3) it is the only comprehensive source of information on applicants’ racial and ethnicidentities for specific types of loans in particular places. Additionally, some of thelimitations of HMDA ensure that it will understate the true extent of exploitation andbias.1 Beginning in 2004, expanded disclosure rules required lenders to identifyoriginations classified as high-cost, or ‘rate-spread’ loans2 — where the annualpercentage rate cost of borrowing, including up-front points and fees, is more than threepercentage points higher than the reported yield for US Treasury securities ofcomparable maturity for first mortgages, and five percentage points higher forsubordinate liens (see FDIC, 2005).
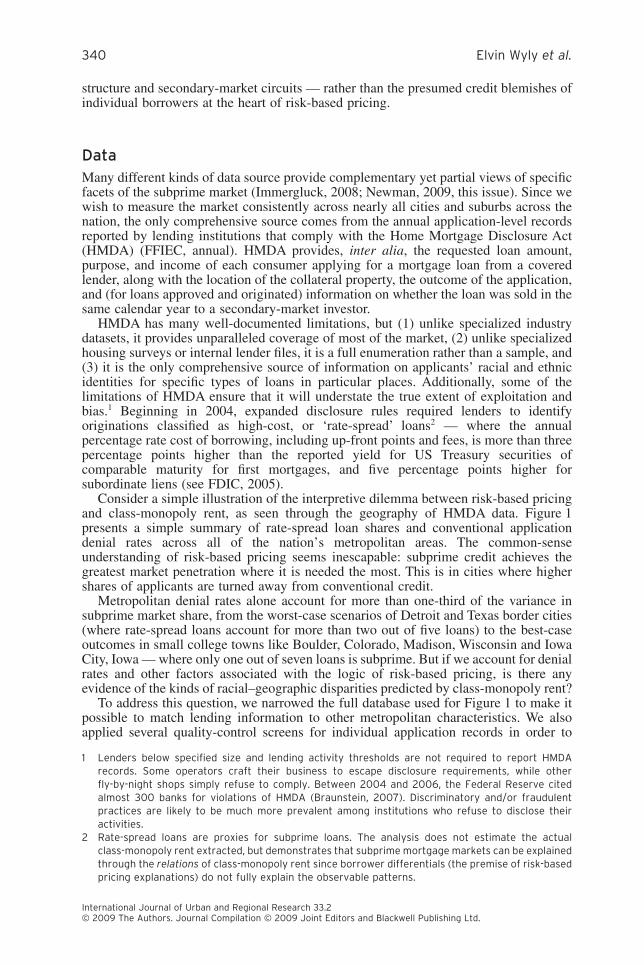
Consider a simple illustration of the interpretive dilemma between risk-based pricingand class-monopoly rent, as seen through the geography of HMDA data. Figure 1presents a simple summary of rate-spread loan shares and conventional applicationdenial rates across all of the nation’s metropolitan areas. The common-senseunderstanding of risk-based pricing seems inescapable: subprime credit achieves thegreatest market penetration where it is needed the most. This is in cities where highershares of applicants are turned away from conventional credit.
Metropolitan denial rates alone account for more than one-third of the variance insubprime market share, from the worst-case scenarios of Detroit and Texas border cities(where rate-spread loans account for more than two out of five loans) to the best-caseoutcomes in small college towns like Boulder, Colorado, Madison, Wisconsin and IowaCity, Iowa — where only one out of seven loans is subprime. But if we account for denialrates and other factors associated with the logic of risk-based pricing, is there anyevidence of the kinds of racial–geographic disparities predicted by class-monopoly rent?
To address this question, we narrowed the full database used for Figure 1 to make itpossible to match lending information to other metropolitan characteristics. We alsoapplied several quality-control screens for individual application records in order to
1 Lenders below specified size and lending activity thresholds are not required to report HMDArecords. Some operators craft their business to escape disclosure requirements, while otherfly-by-night shops simply refuse to comply. Between 2004 and 2006, the Federal Reserve citedalmost 300 banks for violations of HMDA (Braunstein, 2007). Discriminatory and/or fraudulentpractices are likely to be much more prevalent among institutions who refuse to disclose theiractivities.
2 Rate-spread loans are proxies for subprime loans. The analysis does not estimate the actualclass-monopoly rent extracted, but demonstrates that subprime mortgage markets can be explainedthrough the relations of class-monopoly rent since borrower differentials (the premise of risk-basedpricing explanations) do not fully explain the observable patterns.
340 Elvin Wyly et al.
International Journal of Urban and Regional Research 33.2© 2009 The Authors. Journal Compilation © 2009 Joint Editors and Blackwell Publishing Ltd.

ensure precise measures that build in a conservative bias against any finding of race–class–geographical exploitation and discrimination.3 The final database providesinformation on 16.1 million applicants in 2004, and 17.4 million in 2006 (see Table 1).Between 2004 and 2006, denial rates edged up slightly, a reminder that relaxedunderwriting did not quite allow credit for ‘anyone this side of life support’ (Stiglitz,2007) as almost a quarter of requests in 2006 were rejected.
Yet among those who did get loans, the share exceeding the rate-spread (high cost)trigger shot up from 16.6% in 2004 to 29.7% in 2006. Lenders retained only a third ofthe loans they made, and sold the other two-thirds. A growing share of secondary-marketsales is bypassing the GSEs in favor of a wide variety of private investor conduits. Thedataset also confirms the deeply racialized character of the subprime boom (see Table 2).Non-Hispanic whites comprise an absolute majority of subprime borrowers, and theshare of whites with high-cost loans jumped from 13% to 22%. But market penetrationwas far higher for blacks and Latinos. The ratio of black-to-white subprime share fellslightly, from 2.86 to 2.44, but the secular expansion of subprime share meant that by
3 Metropolitan areas in Puerto Rico, where the industry operates in a distinctive legal regime, wereexcluded from the final database. We also excluded all files with missing or invalid information onincome or location, applications for government-insured loans, records for multifamily properties orwith no formal mortgage lien, and records with either validity or quality edit failures. We alsoexcluded applications in many of the new micropolitan areas defined by the Census Bureau in 2004— since it is not possible to match these records to the detailed socioeconomic and housingcharacteristics reported in the 2000 Census. Finally, we sought to distinguish the subprime crisisfrom other disasters: Tables 1 through 4 exclude applications on properties located in New Orleansand Houma, Louisiana, and Gulfport-Biloxi, Mississippi.
0.55
0.45
Miami, FL Detroit, MI
McAllen, TX
Brownsville, TX
Laredo, TX
El Centro, CA Odessa, TX
Pine Bluff, AR
Ft. Lauderdale, FL
0.35
Chicago
Phoenix, AZ
Cape Coral, FL
Alexandria, LA
Goldsboro, NC
Sumter, SC
Rocky Mount, NC
Lakeland, FL
Memphis, TN
Lawton, OK
Danville, VA
Beaumont, TX
Riverside, CAVisalia, CA
Bakersfield, CA
0.25Rat
e-sp
read
Sha
rea
Bismarck, ND
Winchester, VA
Baltimore, MD
Washington, DCFarmington, NM
Johnstown, PAErie, PABethesda, MD
0.15 Madison, WI
Ames, IA
Bend, ORFargo, ND
Pittsburgh, PA
Philadelphia, PA
0.05
Iowa City, IA
San Juan, PR Fajardo, PR
San Francisco, CABoulder, CO
0.10 0.15 0.20 0.25 0.30 0.35 0.40
Conventional denial rate
Note: Circle sizes are proportional to the number of rate-spread originations (e.g. 618 inIowa City, 72,022 in Miami, 124,215 in Riverside, CA)
Figure 1 Denial rate for conventional mortgage applications, vs. rate-spread share ofconventional loan originations, by metropolitan area, 2006 (source: FFIEC, 2007)
Class-monopoly rents of American subprime mortgage capital 341
International Journal of Urban and Regional Research 33.2© 2009 The Authors. Journal Compilation © 2009 Joint Editors and Blackwell Publishing Ltd.
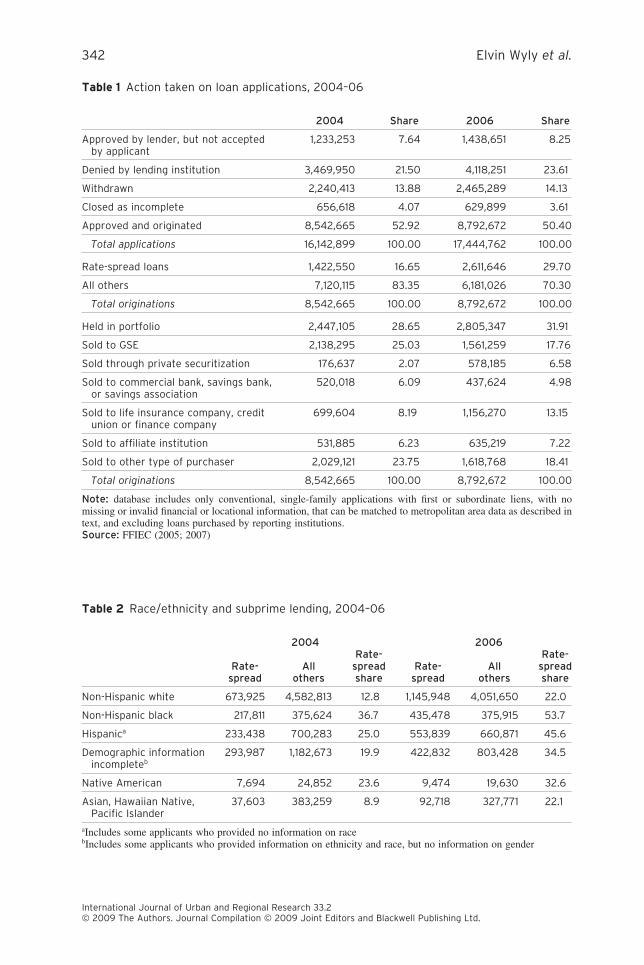
Table 1 Action taken on loan applications, 2004–06
2004 Share 2006 Share
Approved by lender, but not acceptedby applicant
1,233,253 7.64 1,438,651 8.25
Denied by lending institution 3,469,950 21.50 4,118,251 23.61
Withdrawn 2,240,413 13.88 2,465,289 14.13
Closed as incomplete 656,618 4.07 629,899 3.61
Approved and originated 8,542,665 52.92 8,792,672 50.40
Total applications 16,142,899 100.00 17,444,762 100.00
Rate-spread loans 1,422,550 16.65 2,611,646 29.70
All others 7,120,115 83.35 6,181,026 70.30
Total originations 8,542,665 100.00 8,792,672 100.00
Held in portfolio 2,447,105 28.65 2,805,347 31.91
Sold to GSE 2,138,295 25.03 1,561,259 17.76
Sold through private securitization 176,637 2.07 578,185 6.58
Sold to commercial bank, savings bank,or savings association
520,018 6.09 437,624 4.98
Sold to life insurance company, creditunion or finance company
699,604 8.19 1,156,270 13.15
Sold to affiliate institution 531,885 6.23 635,219 7.22
Sold to other type of purchaser 2,029,121 23.75 1,618,768 18.41
Total originations 8,542,665 100.00 8,792,672 100.00
Note: database includes only conventional, single-family applications with first or subordinate liens, with nomissing or invalid financial or locational information, that can be matched to metropolitan area data as described intext, and excluding loans purchased by reporting institutions.Source: FFIEC (2005; 2007)
Table 2 Race/ethnicity and subprime lending, 2004–06
2004 2006
Rate-spread
Allothers
Rate-spreadshare
Rate-spread
Allothers
Rate-spreadshare
Non-Hispanic white 673,925 4,582,813 12.8 1,145,948 4,051,650 22.0
Non-Hispanic black 217,811 375,624 36.7 435,478 375,915 53.7
Hispanica 233,438 700,283 25.0 553,839 660,871 45.6
Demographic informationincompleteb
293,987 1,182,673 19.9 422,832 803,428 34.5
Native American 7,694 24,852 23.6 9,474 19,630 32.6
Asian, Hawaiian Native,Pacific Islander
37,603 383,259 8.9 92,718 327,771 22.1
aIncludes some applicants who provided no information on racebIncludes some applicants who provided information on ethnicity and race, but no information on gender
342 Elvin Wyly et al.
International Journal of Urban and Regional Research 33.2© 2009 The Authors. Journal Compilation © 2009 Joint Editors and Blackwell Publishing Ltd.

2006, an outright majority of all African American borrowers were pushed into high-costloans. For Hispanics, the disparities with whites jumped from 1.95 to 2.07.
ResultsMetropolitan market segmentation
Our first hypothesis is that subprime credit proliferates in economically marginalizedareas, but that risk factors cannot fully explain the sharp patterns of racial–ethnicinequality documented by so many researchers and journalists (Brooks and Ford, 2007;Immergluck, 2008; Rivera et al., 2008). We aggregated the loan-level files tometropolitan-area summaries, and then matched the summaries to a standard set ofmeasures of economic, housing market and demographic variables from the 2000Census. We also developed a simple proxy for overall credit risk — the share of denialswhere underwriters cited credit history as a reason.4
Risk-based pricing suggests that subprime lending should achieve greatest marketpenetration in areas with low incomes and poor credit — and that holding these factorsconstant, subprime credit flows should reduce denial rates. Standard OLS regressionsprovide mixed and inconsistent support for these expectations.5 On the one hand, thereis evidence that the subprime flood spread throughout the urban system. In 2004, a dozensimple measures can account for 77% of the variance in subprime share, but only 65%in 2006. Subprime shares also increase as expected in areas with higher denial rates,lower per capita incomes, and greater market shares of applicants rejected for bad credit.
Even after accounting for these factors, racial segmentation remains crucial — and itsimpact worsened at the height of the boom. In 2004, a one-standard-deviation increase inthe metropolitan share of non-Hispanic Blacks increases subprime market penetration by0.32 standard deviations; this elasticity of racial inequality increased to 0.36 two yearslater. Subprime penetration showed no significant bias towards cities with large Latinopopulations in 2004 (after accounting for income and other controls in the models), butyields a 0.34 standardized beta in 2006. For many years, subprime credit was mostpervasive in African American communities (HUD-Treasury Joint Task Force, 2000;Squires, 2003), whereas predators found it more difficult to penetrate Hispaniccommunities and other minority ethnic niches. This seems to have changed rapidly asbrokers and lenders responded to Wall Street pressures to find more ‘underserved’markets.
Racial–geographic segmentation
Aggregate measures of market segmentation are helpful in mapping the broad contoursof credit inequalities, but precise measurements require the analysis of outcomes forindividual borrowers. To evaluate our second hypothesis — that lending industrydynamics and class monopoly rent account for racially unequal credit better than risk-based pricing — we analyze the 8.54 million loans in the dataset that were approved andoriginated in 2004, and the 8.79 million for 2006. We use logistic regression, the standardworkhorse of the banking and lending literatures, augmented with an instrumentalvariable technique that provides an estimate of the credit risk for each individualapplicant (see Abariotes et al., 1993; Holloway, 1998).
4 HMDA does not provide credit history information for all applicants, but certain types of lenders arerequired to cite up to three reasons when they decide to reject an application. ‘Credit history’ is oneof nine options lenders can choose from.
5 To conserve space, full results are not presented here. All multicollinearity tolerance statistics arewell below problematic thresholds.
Class-monopoly rents of American subprime mortgage capital 343
International Journal of Urban and Regional Research 33.2© 2009 The Authors. Journal Compilation © 2009 Joint Editors and Blackwell Publishing Ltd.
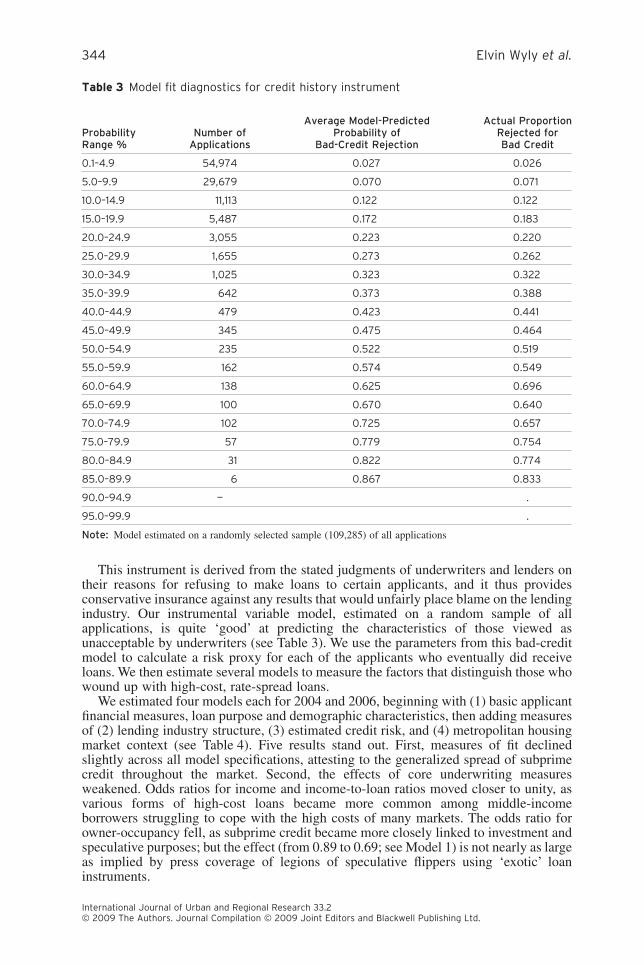
This instrument is derived from the stated judgments of underwriters and lenders ontheir reasons for refusing to make loans to certain applicants, and it thus providesconservative insurance against any results that would unfairly place blame on the lendingindustry. Our instrumental variable model, estimated on a random sample of allapplications, is quite ‘good’ at predicting the characteristics of those viewed asunacceptable by underwriters (see Table 3). We use the parameters from this bad-creditmodel to calculate a risk proxy for each of the applicants who eventually did receiveloans. We then estimate several models to measure the factors that distinguish those whowound up with high-cost, rate-spread loans.
We estimated four models each for 2004 and 2006, beginning with (1) basic applicantfinancial measures, loan purpose and demographic characteristics, then adding measuresof (2) lending industry structure, (3) estimated credit risk, and (4) metropolitan housingmarket context (see Table 4). Five results stand out. First, measures of fit declinedslightly across all model specifications, attesting to the generalized spread of subprimecredit throughout the market. Second, the effects of core underwriting measuresweakened. Odds ratios for income and income-to-loan ratios moved closer to unity, asvarious forms of high-cost loans became more common among middle-incomeborrowers struggling to cope with the high costs of many markets. The odds ratio forowner-occupancy fell, as subprime credit became more closely linked to investment andspeculative purposes; but the effect (from 0.89 to 0.69; see Model 1) is not nearly as largeas implied by press coverage of legions of speculative flippers using ‘exotic’ loaninstruments.
Table 3 Model fit diagnostics for credit history instrument
ProbabilityRange %
Number ofApplications
Average Model-PredictedProbability of
Bad-Credit Rejection
Actual ProportionRejected forBad Credit
0.1–4.9 54,974 0.027 0.026
5.0–9.9 29,679 0.070 0.071
10.0–14.9 11,113 0.122 0.122
15.0–19.9 5,487 0.172 0.183
20.0–24.9 3,055 0.223 0.220
25.0–29.9 1,655 0.273 0.262
30.0–34.9 1,025 0.323 0.322
35.0–39.9 642 0.373 0.388
40.0–44.9 479 0.423 0.441
45.0–49.9 345 0.475 0.464
50.0–54.9 235 0.522 0.519
55.0–59.9 162 0.574 0.549
60.0–64.9 138 0.625 0.696
65.0–69.9 100 0.670 0.640
70.0–74.9 102 0.725 0.657
75.0–79.9 57 0.779 0.754
80.0–84.9 31 0.822 0.774
85.0–89.9 6 0.867 0.833
90.0–94.9 — .
95.0–99.9 .
Note: Model estimated on a randomly selected sample (109,285) of all applications
344 Elvin Wyly et al.
International Journal of Urban and Regional Research 33.2© 2009 The Authors. Journal Compilation © 2009 Joint Editors and Blackwell Publishing Ltd.

Table 4 Subprime segmentation models
Odds ratios from logit models
Model 1 Model 2 Model 3 Model 42004 2006 2004 2006 2004 2006 2004 2006
Income (log) 0.592 0.789 0.540 0.702 0.666 0.794 0.737 0.846
Income-to-loan ratio (log) 1.400 1.107 1.738 1.320 1.524 1.263 1.329 1.157
Owner-occupied 0.886 0.693 0.954 0.673 0.855 0.648 0.827 0.640
Subordinate lien 1.755 1.427 0.849 0.865 0.910 0.853 1.220 0.995*
Pre-approval requested 0.660 0.336 0.516 0.301 0.702 0.362 0.691 0.359
Home improvement 0.603 0.486 0.648 0.679 0.294 0.541 0.322 0.560
Refinance 1.111 1.011 1.128 0.999* 0.898 0.898 0.932 0.911
Incomplete demographicinformation
1.579 1.728 1.197 1.466 1.075 1.235 1.108 1.259
Female primary applicant 1.244 1.203 1.160 1.152 1.150 1.079 1.174 1.094
Hispanic or Latino 2.037 2.863 1.662 2.400 1.138 1.951 1.239 1.972
Native American 1.975 1.690 1.747 1.709 1.026* 1.002* 1.091 1.031*
Asian 0.843 1.076 0.868 1.068 0.756 0.878 0.849 0.937
Black or African Ameican 3.480 3.783 2.645 3.267 1.659 2.326 1.638 2.360
OCC-regulated bank 0.269 0.351 0.208 0.331 0.207 0.333
OTS-regulated thrift 0.219 0.912 0.199 0.845 0.208 0.853
FDIC-regulated bank 0.407 0.466 0.323 0.445 0.332 0.452
HUD-supervised mortgagecompany
2.258 1.377 1.921 1.329 1.973 1.350
Sold to GSE 0.046 0.154 0.043 0.151 0.043 0.151
Sold to private investor 0.779 3.282 0.731 3.199 0.745 3.233
Sold to bank 0.871 1.352 0.789 1.339 0.806 1.344
Sold to life insurance co., creditunion, mtg. bank, or finance co.
0.575 1.803 0.559 1.796 0.565 1.790
Sold to affiliate institution 0.796 1.201 0.771 1.189 0.762 1.191
Sold to other type of purchaser 0.931 2.056 0.908 2.042 0.923 2.061
Credit history instrument 1.433 1.239 1.420 1.235
Conventional denial rate 1.048 1.110
Share of applications requestingFHA insurance
0.980 0.972
Non-Hispanic Black population 1.053 0.962
Hispanic population 0.981 0.959
Per capita income 0.908 0.905
Ratio of Non-Hispanic White toBlack per capita income
1.057 1.068
Ratio of Non-Hispanic White toHispanic per capita income
0.951 0.965
Share of owner-occupied housingbuilt before 1950
0.982 0.983
Share of owner-occupied housingbuilt 1995–2000
0.970 0.949
Class-monopoly rents of American subprime mortgage capital 345
International Journal of Urban and Regional Research 33.2© 2009 The Authors. Journal Compilation © 2009 Joint Editors and Blackwell Publishing Ltd.

Third, racial disparities worsened. For blacks and Latinos, the results are strikingacross all specifications. Subprime disparities increased from 3.5 to 3.8 for AfricanAmericans, and from 2.0 to 2.9 for Hispanic borrowers.6 Accounting for differences inlender type (Model 2) and estimated credit risk (Model 3) certainly reduces theseinequalities. However, even after giving every benefit of the doubt to lenders with aninstrumental variable that itself captures disparate-impact racial discrimination, AfricanAmericans are 1.6 times more likely than non-Hispanic whites to have subprime creditin 2004, and 2.3 times more likely in 2006. For Latinos, the corresponding increase isfrom 1.1 to 1.9. This result aligns with the aggregate, metropolitan-level analysis, andconfirms that the subprime boom consolidated African American segmentation even asthe industry made new inroads into Latino communities. At the same time, the centralplank to justify risk-based pricing slid away. In 2004, increasing the credit risk measureby one standard deviation increased the likelihood that a borrower received a subprimeloan by a factor of 1.43; only two years later, this ratio slipped to 1.24.
The fourth finding confirms the crucial role of institutional processes and capitalcircuits in connecting individual borrowers to transnational investment networks.Subprime lending has traditionally been most common among small, thinly capitalizedindependent mortgage companies, which disclose their activity to the US Department ofHousing and Urban Development (HUD), but escape the closer supervision of the fourmain banking regulators. Yet, as the federal banking regulators ‘shrugged’ whenconfronted with proliferating abuses (Andrews, 2007), many traditional banks began topursue the profits of the subprime boom by purchasing or establishing their ownsubprime subdivisions. The odds ratio comparing independent mortgage companies tolarge national banks regulated by the Federal Reserve (the reference category) fell from
6 We use these categories with an understanding of the complexities of the social construction of raceand ethnicity. In the case of HMDA data, loan applicants are asked to self-identify race or ethnicityby choosing from a list of categories. They may decline to do so.
Table 4 Continued
Odds ratios from logit models
Model 1 Model 2 Model 3 Model 42004 2006 2004 2006 2004 2006 2004 2006
Median gross rent as share ofhousehold income
0.924 0.960
Median owner-occupied value asshare of household income
0.927 0.943
Share of owner-occupied housingunits with no mortgage
1.036 0.976
Share of mortgaged units with asecond mortgage
0.954 0.991
Nagelkerke max R-squared 0.131 0.116 0.333 0.303 0.338 0.305 0.346 0.310
Percent concordant 71.0 67.7 83.4 79.1 83.8 79.2 84.1 79.5
Observations for 2004 models:8,542,665
Observations for 2006 models:8,792,672
*Not significant at P < 0.01; all other coefficients significant at P < 0.001.Note: For continuous variables (income, income-to-loan ratio, credit instrument, and metropolitan variables), oddsratios report the change in odds with a one-standard-deviation increase in the respective predictor.Source: FFIEC (2005; 2007)
346 Elvin Wyly et al.
International Journal of Urban and Regional Research 33.2© 2009 The Authors. Journal Compilation © 2009 Joint Editors and Blackwell Publishing Ltd.

1.92 in 2004 to 1.32 two years later (Model 3). Traditional, locally oriented savings andloan institutions reporting to the Office of Thrift Supervision (OTS) became almostindistinguishable from the national, Federal Reserve-regulated banks. Moreover, asbanking structures evolved to create new channels for subprime credit on the front end,the back end was also shifting, as lenders accelerated their sales to the secondary market.
For quite a few years, the majority of home loans have been securitized. Until recently,however, most lenders held many of the non-conforming, non-traditional or high-riskloans in their own portfolio for a year or more. This practice, known as ‘seasoning’, wasparticularly important in the 1990s as secondary-market investors reacted cautiously tofront-line lenders who were relaxing underwriting criteria in order to reach new markets(Listokin and Wyly, 2000). Our analysis reveals that this practice changed dramaticallybetween 2004 and 2006. In 2004, subprime loans posted low odds ratios for all types ofsecondary purchasers. Compared to prime loans (which are commonly sold quickly tothe GSEs), subprime loans were, overall, more likely to be held in portfolio long enoughto stretch past the same-year sale reporting requirements of HMDA.
As investors flooded the MBS market and investment banks became more aggressive,front-line lenders responded with more risky loans passed on to the secondary marketmore quickly. In 2006, a loan approved and sold to a private investor was 3.2 times morelikely to be subprime compared to an otherwise identical loan that was held in portfoliopast the end of the year. A loan sold to an ‘other type of purchaser’ — usually an SPV thatpackages the loans before passing on to a trust or SIV — was more than twice as likelyto be subprime. In light of what is now known about the deteriorating quality of loansmade in the latter months of 2006, it is clear that the securitization system had fused atoxic brew from the most volatile compounds of economic chemistry (adverse selection,principal-agents dilemmas, information asymmetries) to create perverse incentivesencouraging loans destined to end in foreclosure (Dymski, 2007; Immergluck, 2008).
The fifth finding suggests no clear role for urban and regional context. Adding a vectorof theoretically relevant metropolitan measures adds almost nothing to model fit, andyields standardized odds ratios that all fall in a narrow range between 0.94 and 1.11(Model 4). The largest effects are for metropolitan denial rates and white-black incomeinequality (both positive) but the effects are modest for all metropolitan indicators. Afteraccounting for secondary investment networks, banking industry structure and applicantcharacteristics, it seems that class-monopoly rent displays no contextual bias towardsparticular kinds of places. This finding appears to undermine one of our importanthypotheses.
Acknowledging geographical contingency
Adding ‘metropolitan indicators’ to a model is only one way to capture the distinctionsof place. Another approach is to recognize that the processes summarized in a particularmodel may vary across different settings. There are several intricate ways to analyze thisvariation (expansion techniques, multilevel models) but here we consider the simplestapproach: estimating Model 3 (Table 4) separately for all metropolitan areas. This boostsmodel fit considerably for most places, and yields varied coefficient estimates forrelations of particular concern. We focus here on the geographical contingency of racialsubprime segmentation for African Americans (Figure 2) and Latinas/Latinos (Figure 3),and the nexus of subprime segmentation, applicant income and secondary-market salesnetworks (Figure 4).
These graphs offer vivid portraits of the contextual landscape of capital flows.Subprime credit is deeply racialized across most but not all housing markets. Mostmetropolitan areas appear in the top portion of the graphs in Figures 2 and 3. For AfricanAmericans, many of the larger cities post coefficients between 0.75 and 1.00 — all elseconstant, blacks are between 2.1 and 2.7 times more likely than otherwise identicalnon-Hispanic whites to wind up with subprime credit. For Hispanics, most of the oddsratios range from 1.65 to 2.7. Likewise, the general pattern of class segmentation and
Class-monopoly rents of American subprime mortgage capital 347
International Journal of Urban and Regional Research 33.2© 2009 The Authors. Journal Compilation © 2009 Joint Editors and Blackwell Publishing Ltd.

secondary-market sales conduits is clear. Most metropolitan areas in Figure 4 appear inthe upper-left quadrant. All else constant, in most places subprime loans are targetedtowards lower-income borrowers, and are more likely than prime loans to be soldimmediately to SPVs and other purchasers. These general patterns conform well to thehypothesis that class-monopoly rents are extracted from across the urban system — butin uneven ways that inscribe distinctive local credit environments.
Nevertheless, urban and regional contingencies matter. Quite a few metropolitan areascluster along one of the axes, indicating no statistically significant segmentation forrace/ethnicity (Figures 2 and 3) or class/secondary circuits (Figure 4). In severalmetropolitan areas, the prevailing patterns are reversed. Subprime segmentation issignificantly less likely for African Americans in places like Flint, Michigan, Rochester,New York, and Pensacola, Florida; for Latinas and Latinos, these effects appear inPueblo, Colorado, and the locally transnationalized, multi-generational Texas bordercities of El Paso and Laredo. There are even more exceptional cases for income andloan-sales networks: in four dozen metropolitan areas, subprime credit is ceteris paribusmore likely for higher-income applicants.
The effects are not substantively large,7 but they provide a direct counterpart to thegeneral trend. Given the controls included in the models, these effects cannot beattributed to a greater prevalence of investor-buyers, higher debt burdens or a differentmix of homebuyers and applicants seeking to refinance. After accounting for thesefactors, part of the subprime boom appears to have involved higher-income applicants
7 For metropolitan areas near Minneapolis-St. Paul on the graph, increasing applicant income fromabout $100,000 to $350,000 increases the odds of subprime selection by a ratio of about 1.07.
2.25
ClevelandChi
1.50
1.75
2.00
Naples, FLSan Francisco
Newark, NJ
Chicago 35,175 rate-spread originations to Blacks
Jackson, MS
New YorkAthens, GA
Gary, IN
Ocean City, NJ
Bridgeport, CT(1,448)
Savannah, GA
DallasAtlantaBethesda, MD
0.75
1.00
1.25
West Palm Beach, FL
New Orleans
Port St. Lucie, FL
MiamiMilwaukee
Cape Coral, FL
Monroe LA
Sarasota, FL
Lafayette, LA
Fort Lauderdale, FLLos AngelesMemphisWashington, DC
Houston
Baton Rouge, LA
Alexandria, LA
Baltimore,MD
0.00
0.25
0.50
3.532.521.51
Shreveport, LA
Monroe, LA
Ratio of white/black per capita income, 2000
Rochester, NY
Myrtle Beach, SC
Jacksonville, FL
MD
-0.75
-0.50
-0.25
Flint, Michigan
Pensacola, FL
-1.50
-1.25
-1.00
-1.75
Note: Beta coefficient in subprime logit model, after controlling for income, debt ratio, creditinstrument and other factors; coefficients not significant at P < 0.05 are shown as 0.00.Circle sizes are proportional to the number of rate-spread originations to non-Hispanicblacks
Figure 2 Metropolitan coefficients of racial segmentation, non-Hispanic African Americanborrowers, 2006 (sources: FFIEC, 2007; US Census 2000, per capita income data)
348 Elvin Wyly et al.
International Journal of Urban and Regional Research 33.2© 2009 The Authors. Journal Compilation © 2009 Joint Editors and Blackwell Publishing Ltd.

responding to the imperatives of extremely tight housing markets in big cities — such asthe Twin Cities, San Diego, Salt Lake City, Portland and Sacramento. But even strongereffects appear in smaller regional trade centers, and in exurban towns transformed bydramatic increases in long-distance commuter suburbs. Some of these places — SanDiego, Minneapolis-St. Paul, Portland — are highlighted in Immergluck’s (2008)analysis of the expansion of ARMs and zero-down-payment loans in the cumulative-causation cycle of ‘exotic’ mortgages in the home purchase market. Rising prices inoverheated markets induce lenders and buyers to use more flexible instruments, which inturn enable sellers to demand still higher prices. Many other cities on our graph do notcorrespond neatly with Immergluck’s analyses (see Immergluck, 2008: 7, 9, 13).Compared with the durable divisions of race and ethnicity, there is considerablemetropolitan contingency in the class focus of subprime capital.
ConclusionsAs America’s subprime lending boom reached its crescendo and then began its descentbetween 2004 and 2006, the share of African Americans pushed into high-cost loans shotup from 37% to 54%, and the share for Latinas and Latinos jumped from 25% to 46%.In this article, we challenged the dominant, risk-based pricing explanation for these kindsof disparities. Even after accounting for a wide range of demand-side factors, AfricanAmericans and Latinas/Latinos approved for credit were still twice as likely as otherwiseidentical non-Hispanic whites to wind up with high-cost loans in 2006. Inequalities areeven more severe for African Americans in cities like Cleveland, Chicago, Newark and
1.50
Naples, FL2,511
Chicago
Essex County, MASanta Cruz, CA
San Jose, CA
San Francisco
Santa Ana, CASalinas, CA
Bridgeport, CT
Barnstable, MA
Washington, DC
Lake County / Kenosha, WI
1.00
Los Angeles60,611 rate-spread originations to Hispanics
g
New York
Orlando, FL
Phoenix, AZ
Santa Barbara
Dallas
Brownsville, TX
Oxnard, CA
San Diego, CA
Riverside, CA
Atlanta, GA
0.50
McAllen, TX
Miami, FL
0.001.25 1.75 2.25 2.75 3.25 3.75
Ratio of non-Hispanic White/Hispanic per capita Income, 2000
El Paso, TX
Laredo, TX
Pueblo, CO
-0.50
-1.00
Note: Beta coefficient in subprime logit model, after controlling for income, debt ratio, creditinstrument and other factors; coefficients not significant at P < 0.05 are shown as 0.00.Circle sizes are proportional to the number of rate-spread originations to Hispanics
Figure 3 Metropolitan coefficients of racial segmentation, Latino/Latina borrowers, 2006(sources: FFIEC, 2007; US Census 2000, per capita income data)
Class-monopoly rents of American subprime mortgage capital 349
International Journal of Urban and Regional Research 33.2© 2009 The Authors. Journal Compilation © 2009 Joint Editors and Blackwell Publishing Ltd.

New York; for Latinos, in smaller cities in Massachusetts, and in Bridgeport,Connecticut, Washington, DC, Chicago and the San Francisco Bay Area. The analysisdemonstrates that the geography of the subprime lending boom was not simply a randomdeviation from mainstream market outcomes: rather, the pattern was inscribed throughthe mutual interplay between regional histories of race and uneven urban developmentacross the American urban system and the competitive moves of brokers, lenders andWall Street investment houses working to maximize short-term profits in an anti-regulation climate that favors the interests of financial capital over the needs ofconsumers. Although our findings are tempered by significant data limitations, ourresults complement and amplify Hernandez’s (2009, this issue) historical analysis of the‘seemingly place-less and colorblind’ wave of subprime capital that reorganized thespaces of vulnerability created in previous generations of racialized exclusion. Ourmeasures of the rapid changes in securitization networks at the height of the boom alsocomplements Gotham’s (2009, this issue) important Lefebvrian analysis of the role ofsecuritization innovations in accelerating the fluidity and velocity of leveraged markettransactions — annihilating space by time in a dangerous shift to unsustainable, short-term relations of extraction and exploitation.
The framework of risk-based pricing certainly can be refined and adapted to helpdisentangle the information asymmetries among lenders, investors, investment banks,and bond-ratings agencies (cf. Greenwald and Stiglitz, 1991). But the theory of risk-based pricing has become doctrine and ideology, used for well over a decade to blameconsumers for the consequences of an abusive industry, to justify a deregulatory stancethat encourages usury as ‘innovation’, and to sustain the mirage of an ‘American Dream’backed by high-risk, predatory credit. That is not to say that critical treatments of
2.50β for loans sold to "other" purchasers
1.50
2.00
Essex Co., MA Providence, RIYakima, WA
Toledo, OH
Canton, OH Huntington, WV
Odessa, TX
Chicago, ILNewark, NJ
South Bend, IN
Allentown, PA
Scranton, PA
1.00 Oshkosh, WI
Manchester, NH
Tampa, FL
Poughkeepsie, NY
Worcester, MA
Cleveland, OHAkron, OH
Columbus, GA
H t TX
Greenville, SC
Macon, GA
Athens, GANassau-Suffolk, NY
Seattle, WA
New York, NYTerre Haute, IN
Miami, FL
, Allentown, PA
Atlanta, GA
Phoenix, AZ
Shreveport, LA
Bloomington, INColumbus, OH
Youngstown, OH
Pittsburgh, PA Springfield, MA
Baltimore, MD
0.00
0.50
-1 25 -1 00 -0 75 -0 50 -0 25 0 00 0 25 0 50 0 75 1 00
β for applicant income
Riverside CA
Sacramento, CA
Rapid City, SD
Minneapolis-St. Paul, MN
Modesto, CAJackson, MS
Houston, TX
Texarkana, TX
Dallas, TXLubbock, TX
St. Louis, MOLos Angeles, CA
Washington, DC
Las Vegas, NV
Stockton, CA
Salt Lake City, UT
Portland OR
Merced, CA
Bremerton, WA
San Diego, CA
Greensboro, NC
KansasCity, MO
Memphis, TN
,
Austin, TX
-0.50
1.25 1.00 0.75 0.50 0.25 0.00 0.25 0.50 0.75 1.00
Anchorage, AK
Riverside, CA
Santa Rosa, CA Cheyenne, WYBurlington, VT
Provo, UTLittle Rock, AR
Springfield, MO
San Jose, CA
Joplin, MOMontgomery, AL
Santa Barbara, CA
Portland, OR
Fayetteville, AR
-1.50
-1.00
Monroe, LA
Grand Forks, ND
Jonesboro, AR
-2.00
Note: Beta coefficient in subprime logit model, after controlling for income, debt ratio, creditinstrument and other factors; coefficients not significant at P < 0.05 are shown as 0.00.Circle sizes are proportional to the number of rate-spread originations
Figure 4 Metropolitan coefficients of income segmentation and SPV sales conduits, 2006(source: FFIEC, 2007)
350 Elvin Wyly et al.
International Journal of Urban and Regional Research 33.2© 2009 The Authors. Journal Compilation © 2009 Joint Editors and Blackwell Publishing Ltd.

risk-based pricing and credit scoring need be viewed purely in ideological terms(Langley, 2007; Burton, 2008). But Harvey’s (1974) analysis of class-monopoly rentprovides a compelling theoretical and strategic alternative that emphasizes the socialrelations of the rights of property, ownership and profit — against the use values of home,community and security. Subprime lending and Wall Street securitization have replacedthe abusive local loan sharks and slum landlords with entrepreneurial brokers and lenderspushing high-cost credit backed by mortgage companies, subsidiaries of large nationalbanks and the entire array of investment bankers, bond traders, ratings analysts andyield-hungry investors. The agents may be different, but the exploitation remains.Challenging this exploitation will be an important part of political struggle in the comingyears, as the crisis evolves and devastates households, neighborhoods and cities — aswell as many investors and pensioners. The politics of scale will be central to thisstruggle — community organizations fighting foreclosures (Newman, 2009), statelegislatures fighting federal pre-emption of consumer protections, and Europeangovernments taking the lead against the US in proposals for new policies on banksupervision, accounting and market disclosure (Aalbers, 2009, this issue). Wainwright’s(2009, this issue) work makes it clear that these struggles are by no meanspredetermined: the migration, adoption and adaptation of US securitization practices inthe UK was deeply contextual, shaped by the distinctive features of tax law, accountingstandards and banking regulation. Put simply, the details of political economy matter.And some of these details can be changed. There are encouraging possibilities forpost-crisis consumer protection law in the US, given the outcome of the Presidential andCongressional elections, and recent moves by Britain, France and other nations todemand reforms to America’s curiously parochial-yet-globally-significant regulatoryinfrastructure. The framework of class-monopoly rent must be at the heart of thesediscussions if we are to restore any balance in the rights and protections available topeople who need the use values of home, security, stability and community — and whoselives are being so painfully disrupted by the irresponsible exploitations of speculativecapital accumulation.
Elvin Wyly ([email protected]), Markus Moos ([email protected])and Emanuel Kabahizi ([email protected]), Department of Geography,The University of British Columbia, 1984 West Mall Vancouver, BC, V6T 1Z2 Canada, andDaniel J. Hammel ([email protected]) Department of Geography and Planning,The University of Toledo, Mail Stop 932, UH4390 Toledo, OH, 43606 USA.
ReferencesAalbers, M. (2009) The globalization
and Europeanization of mortgagemarkets. International Journal ofUrban and Regional Research33.2, 389–410.
Abariotes, A., S. Ahuja, H. Feldman, C.Johnson, L. Subaiya, N. Tiller, J. Urbanand S.L. Myers, Jr. (1993) Disparities inmortgage lending in the Upper Midwest.Paper presented at the Fannie MaeUniversity Colloquium on Race, Poverty,and Housing Policy, Minneapolis, MN, 3December.
Ambrose, B.W. and A. Pennington-Cross(2000) Local economic risk factors and the
primary and secondary mortgage markets.Regional Science and Urban Economics30, 683–701.
Andrews, E. (2007) Fed and regulatorsshrugged as the subprime crisis spread.New York Times 18 December, A1.
Ashton, P. (2008) Advantage or disadvantage?The changing institutional landscape ofunderserved mortgage markets. UrbanAffairs Review 43.3, 352–402.
Berkovec, J.A., G.B. Canner, S.A. Gabrieland T.H. Hanman (1994) Race, redlining,and mortgage loan performance. Journalof Real Estate Finance and Economics 9.3,263–94.
Class-monopoly rents of American subprime mortgage capital 351
International Journal of Urban and Regional Research 33.2© 2009 The Authors. Journal Compilation © 2009 Joint Editors and Blackwell Publishing Ltd.

Berry, B.J.L. (1964) Cities as systems withinsystems of cities. Papers of the RegionalScience Association 13, 147–63.
Braunstein, S.F. (2007) Statement of SandraF. Braunstein, Federal Reserve Division ofConsumer Affairs. CongressionalTestimony, 25 July. Washington, DC:States News Service/Federal ReserveBoard.
Brooks, R. and C.M. Ford (2007) The UnitedStates of subprime: data show bad loanspermeate the nation. Wall Street Journal11 October, A1.
Burton, D. (2008) Credit and consumersociety. Routledge, New York.
Chomsisengphet, S. and A. Pennington-Cross(2006) The evolution of the subprimemortgage market. Federal Reserve Bank ofSt. Louis Review 88, 31–56.
Dymski, G.A. (2007) From financialexploitation to global banking instability:two overlooked roots of the subprimecrisis. Paper presented at the conference Acrisis of financialization, 30 May 2008,School of Criental and African Studies,London [WWW document]. URL http://www.soas.ac.uk/economics/events/crisis/43938.pdf (accessed 14 May 2009).
Engel, K.C. and P.A. McCoy (2002) A tale ofthree markets: the law and economics ofpredatory lending. Texas Law Review 80.6,1255–381.
Engel, K.C. and P.A. McCoy (2007) Turninga blind eye: Wall Street finance ofpredatory lending. Fordham Law Review75.4, 2039–103.
Evans, A.W. (1991) On monopoly rent. LandEconomics 67.1, 1–14.
Fabozzi, F. (ed.) (2001) Handbook ofmortgage-backed securities. Fifth edition,McGraw-Hill, New York.
FDIC (Federal Deposit InsuranceCorporation) (2005) Frequently askedquestions about the new HMDA data.FDIC, Washington, DC.
FFIEC (Federal Financial InstitutionsExamination Council) (annual) HMDA rawdata loan application register data onCD-ROM. Board of Governors of theFederal Reserve, Washington, DC.
Friedman, T.L. (2007) The world is flat.Picador, New York.
Gotham, K.F. (2006) The secondary circuit ofcapital reconsidered: globalization and theUS real estate sector. American Journal ofSociology 112.1, 231–75.
Gotham, K.F. (2009) Creating liquidity out ofspatial fixity: the secondary circuit ofcapital and the evolving subprime mortgagecrisis. International Journal of Urban andRegional Research 33.2, 355–71.
Greenwald, B. and J.E. Stiglitz (1991)Information, finance, and markets: thearchitecture of allocative mechanisms.Working Paper 3652, National Bureau ofEconomic Research, Cambridge, MA.
Harvey, D. (1974) Class-monopoly rent,finance capital and the urban revolution.Regional Studies 8, 239–55.
Harvey, D. (1978) The urban process undercapitalism: a framework for analysis.International Journal of Urban andRegional Research 2, 101–31.
Harvey, D. (1981) The limits to capital.University of Chicago Press, Chicago.
Harvey, D. (1985) The urbanization ofcapital. Johns Hopkins University Press,Baltimore.
Hernandez, J. (2009) Redlining revisited:mortgage lending patterns in Sacramento,1930–2004. International Journal ofUrban and Regional Research 33.2,291–313.
Holloway, S.R. (1998) Exploring theneighborhood contingency of racediscrimination in mortgage lending inColumbus, Ohio. Annals of the Associationof American Geographers 88.2, 252–76.
HUD-Treasury Joint Task Force (2000) Finalreport of The Joint Task Force onpredatory lending. US Department ofHousing and Urban Development,Washington, DC.
Immergluck, D. (2008) From the subprime tothe exotic: excessive mortgage market riskand foreclosures. Journal of the AmericanPlanning Association 74.1, 1–18.
Krueckeberg, D. (1999) The grapes of rent: ahistory of renting in a country of owners.Housing Policy Debate 10.1, 9–30.
Langley, P. (2007) The everyday life of globalfinance: saving and borrowing inAnglo-America. Oxford University Press,New York.
Lax, H., M. Manti, P. Raca, and P. Zorn(2004) Subprime lending: an investigationof economic efficiency. Housing PolicyDebate 15.3, 533–71.
Listokin, D. and E.K. Wyly (2000) Makingnew mortgage markets: case studies ofinstitutions, homebuyers and communities.Fannie Mae Foundation, Washington DC.
352 Elvin Wyly et al.
International Journal of Urban and Regional Research 33.2© 2009 The Authors. Journal Compilation © 2009 Joint Editors and Blackwell Publishing Ltd.

Litan, R.E. (2001) A prudent approach topreventing ‘predatory’ lending. BrookingsInstitution, Washington, DC.
Miller, M.J. (ed.) (2003) Credit reportingsystems and the international economy.MIT Press, Cambridge, MA.
Newman, K. (2009) Post-industrial widgets:capital flows and the production of theurban. International Journal of Urban andRegional Research 33.2, 314–31.
Peterson, C. (2005) Federalism and predatorylending: unmasking the deregulatoryagenda. Temple Law Review 78.1,1–98.
Peterson, C. (2007) Predatory structuredfinance. Cardozo Law Review 28.5,2186–282.
Renuart, E. (2004) An overview of thepredatory lending process. Housing PolicyDebate 15.3, 467–502.
Rivera, A., B. Cotto-Escalera, A. Desai, J.Huezo and D. Muhammad (2008)Foreclosed: state of the dream 2008.United for a Fair Economy, Boston.
Sassen, S. (2009) When housing becomes anelectronic instrument: the globalcirculation of mortgages. InternationalJournal of Urban and Regional Research33.2, 411–26.
Saunders, A. and L. Allen (2002) Credit riskmeasurement: new approaches to value atrisk and other paradigms. Wiley,Hoboken, NJ.
Squires, G.D. (ed.) (1992) From redlining toreinvestment. Temple University Press,Philadelphia.
Squires, G.D. (ed.) (2003) Organizing accessto capital. Temple University Press,Philadelphia.
Squires, G.D. (ed.) (2004) Why the poor paymore: how to stop predatory lending.Praeger, Westport, CT.
Stein, E. (2001) Quantifying the economiccost of predatory lending. Center forResponsible Lending, Durham, NC.
Stiglitz, J.E. (2007) The economicconsequences of Mr. Bush. Vanity FairDecember.
Stiglitz, J.E. and A. Weiss (1981) Creditrationing in markets with imperfectinformation. American Economic Review71.3, 393–410.
Stiglitz, J.E. and A. Weiss (1992) Asymmetricinformation in credit markets and itsimplications for macro-economics. OxfordEconomic Papers 44, 694–724.
Vandell, K.D. (1984) Imperfect information,uncertainty, and credit rationing: commentand extension. Quarterly Journal ofEconomics 99.4, 841–63.
Wainwright, T. (2009) Laying the foundationsfor a crisis: mapping thehistorico-geographical construction ofRMBS securitization in the UK.International Journal of Urban andRegional Research 33.2, 372–88.
White, A.M. (2004) Risk-based mortgagepricing: present and future research.Housing Policy Debate 15.3, 503–31.
White, L.J. (2002) The credit reportingindustry: an industrial organizationanalysis. In R.M. Levitch, C. Majnoni andC. Reinhart (eds.), Ratings, ratingsagencies and the global financial system,Kluwer, Boston.
Williams, R., R. Nesiba and E.D. McConnel(2005) The changing face of inequality inhome mortgage lending. Social Problems52.2, 181–208.
Wyly, E.K., M. Atia, H. Foxcroft, D.J.Hammel, and K. Phillips-Watts (2006)American home: predatory mortgagecapital and neighborhood spaces of raceand class exploitation in the UnitedStates. Geografiska Annaler 88B.1,105–32.
RésuméLa crise financière mondiale la plus grave depuis la Grande Dépression a attiré le regardde la planète sur le secteur américain des prêts hypothécaires à risque (subprime) et surses liens avec une exploitation abusive au sein des communautés ouvrières et racialesmarginalisées. Durant près de vingt ans de prospérité, les établissements de crédithypothécaire à risque ont combattu réglementations et réformes: ils ont appliqué une‘tarification au risque’ pour rapprocher innovation financière et accès démocratisé aucapital; ils ont tiré parti des mythes culturels liés au ‘Rêve américain’ de la propriété
Class-monopoly rents of American subprime mortgage capital 353
International Journal of Urban and Regional Research 33.2© 2009 The Authors. Journal Compilation © 2009 Joint Editors and Blackwell Publishing Ltd.

individuelle; ils ont écarté les cas vérifiés de discrimination raciale et de comportementabusif, sous prétexte d’anecdotes isolées circonscrites à de rares sites voués à l’échec dansce qui est par ailleurs une sphère bienveillante du libéralisme de marché. L’article met encause ces trois tactiques. Une fois adaptée et actualisée, la théorie de Harvey (1974) surles rentes de monopole de classe permet de cartographier les exploitations localisées(quartiers) de classes et de races dans plusieurs centaines de zones métropolitainesaméricaines, et d’expliquer comment elles ont glissé, via les canaux de titrisation de WallStreet, jusqu’aux réseaux internationaux d’endettement et de placement. Il fautappréhender les inégalités structurelles des rentes de monopole de classe pour pouvoiranalyser, organiser et répondre à la crise par des politiques publiques.
354 Elvin Wyly et al.
International Journal of Urban and Regional Research 33.2© 2009 The Authors. Journal Compilation © 2009 Joint Editors and Blackwell Publishing Ltd.