cascading effects ccs2016
TRANSCRIPT
Cascading effects of critical transitions in social-ecological systems
Juan Carlos Rocha @juanrocha

The Anthropocene

The Anthropocene
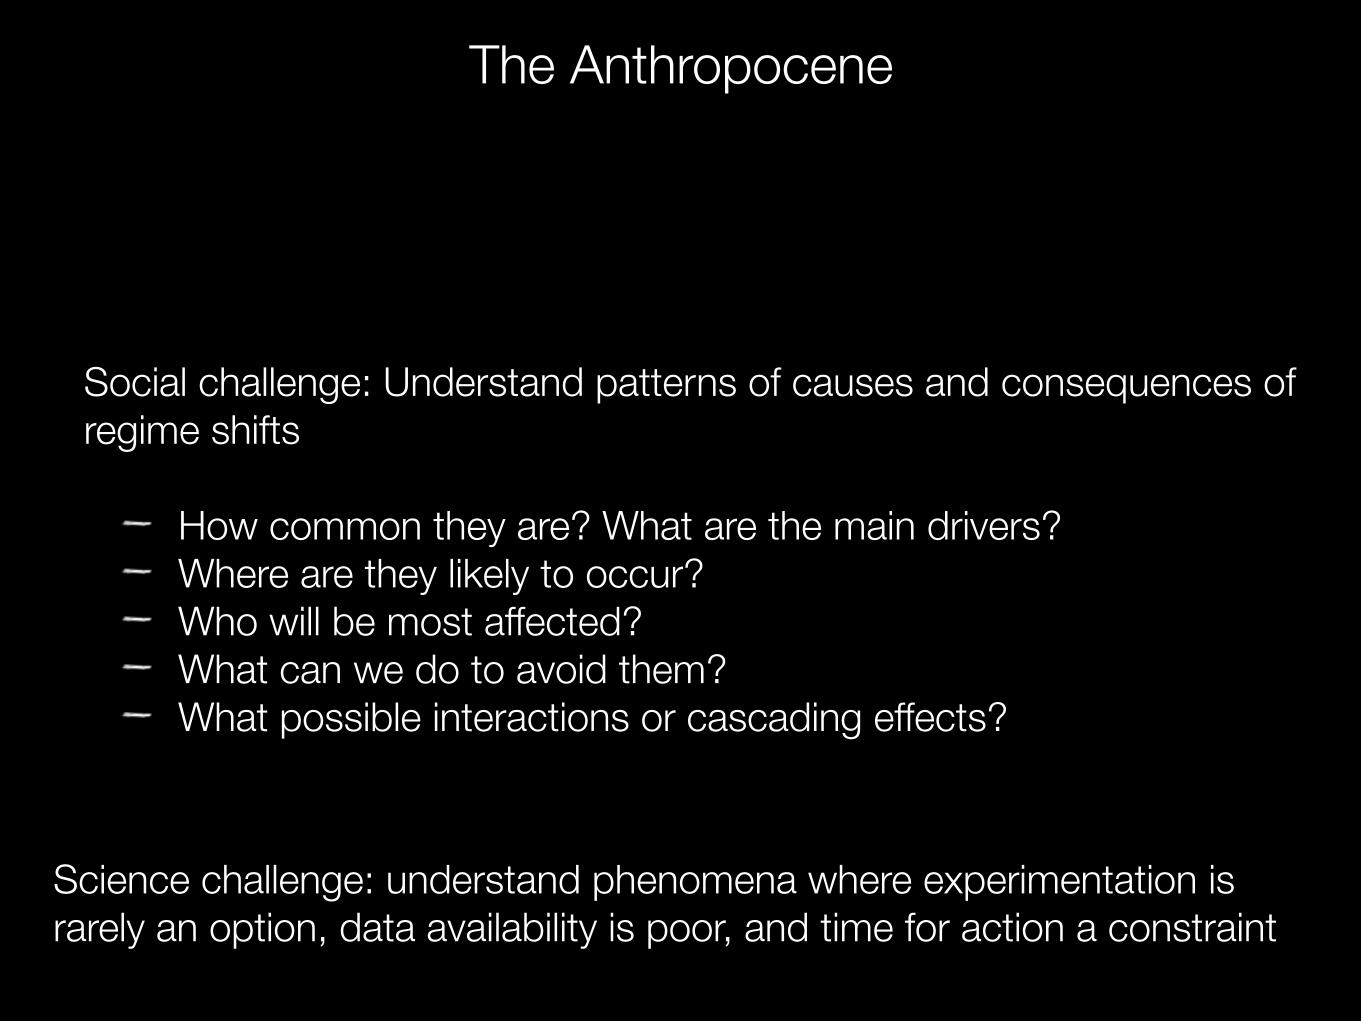
Social challenge: Understand patterns of causes and consequences of regime shifts
How common they are? What are the main drivers? Where are they likely to occur? Who will be most affected? What can we do to avoid them? What possible interactions or cascading effects?
Science challenge: understand phenomena where experimentation is rarely an option, data availability is poor, and time for action a constraint
The Anthropocene


Can the occurrence of one regime shift in an area of the world increase or decrease the likelihood of other regime
shifts in apparently disconnected systems?
Can the study of regime shifts networks help us elucidate potential hypothesis for these tele-connections?
1. A comparative framework: the data 2. Forks: Global drivers & Impacts 3. Domino effects 4. Inconvenient feedbacks
Outline
@juanrocha
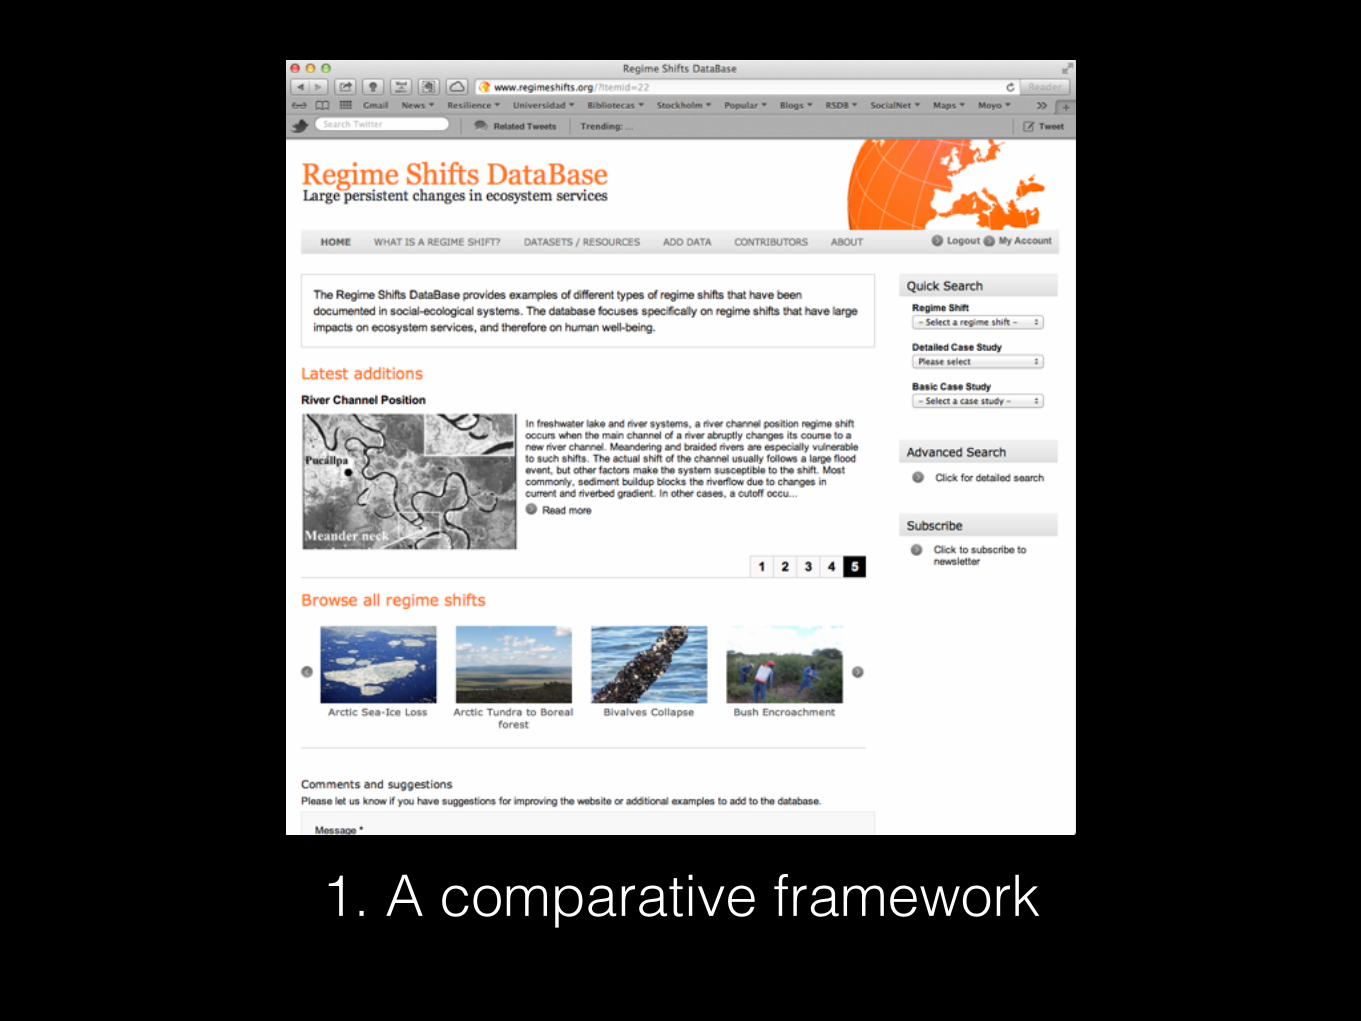
1. A comparative framework

1. A comparative frameworkBiggs, et al. 2015. bioRxiv:018473.

Regime Shifts DataBase
The shift substantially affect the set of ecosystem services provided by a social-ecological system
Established or proposed feedback mechanisms exist that maintain the different regimes.
The shift persists on time scale that impacts on people and society
@juanrocha
www.regimeshifts.org
@juanrocha
@juanrocha
@juanrocha
@juanrocha


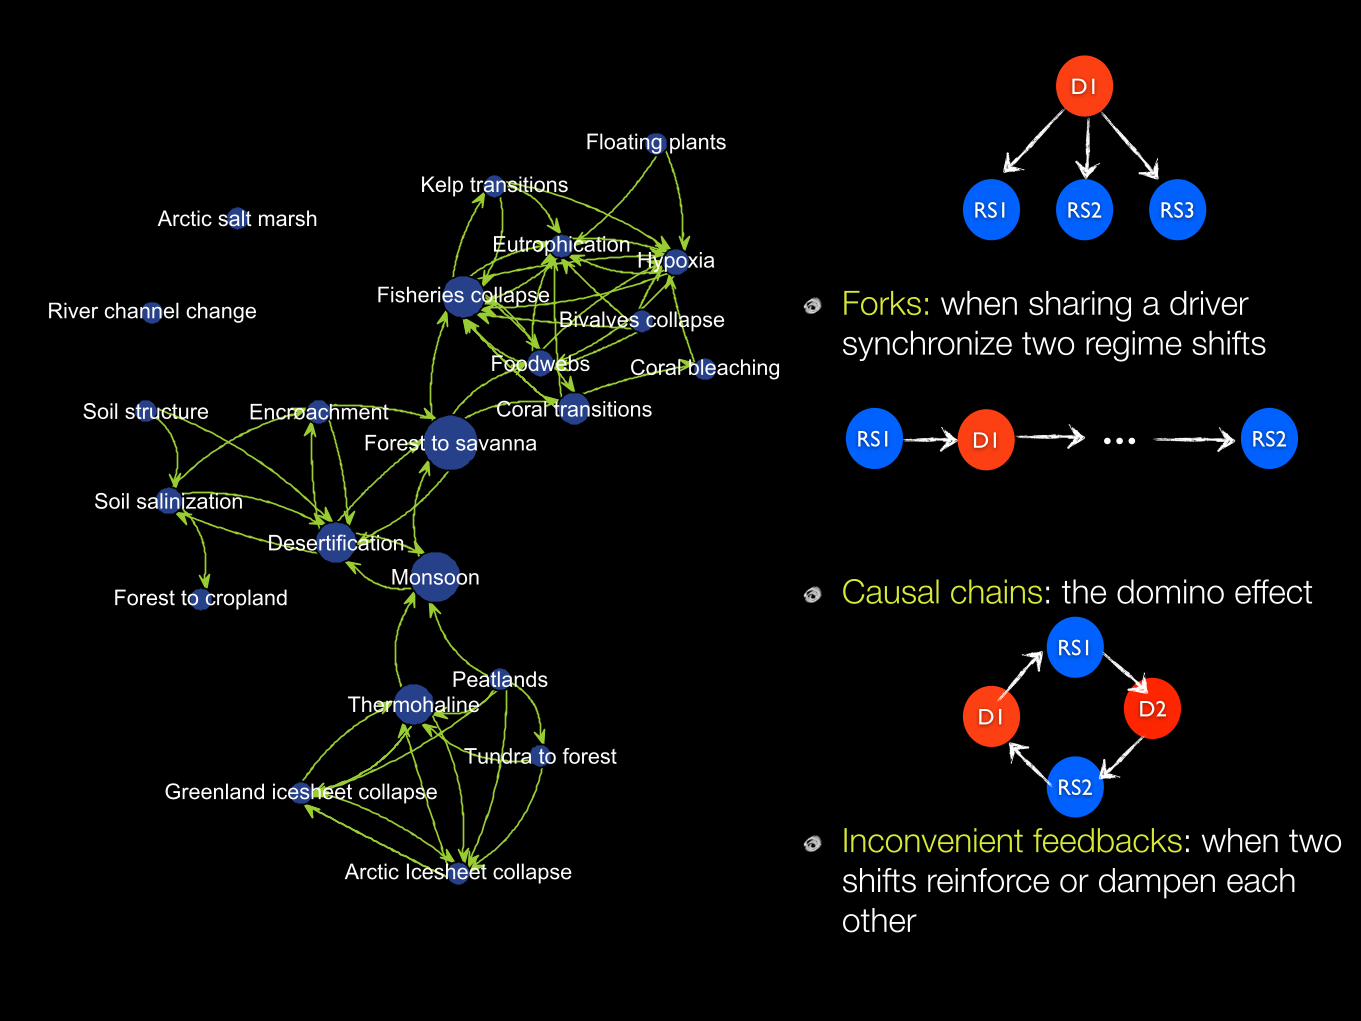
Forks: when sharing a driver synchronize two regime shifts
Causal chains: the domino effect
Inconvenient feedbacks: when two shifts reinforce or dampen each other
RS1 RS2 RS3
D1
RS1 RS2D1 ...
RS1
RS2
D2D1
Arctic Icesheet collapse
Bivalves collapse
Coral bleaching
Coral transitions
Desertification
Encroachment
Eutrophication
Fisheries collapse
Floating plants
Foodwebs
Forest to cropland
Forest to savanna
Greenland icesheet collapse
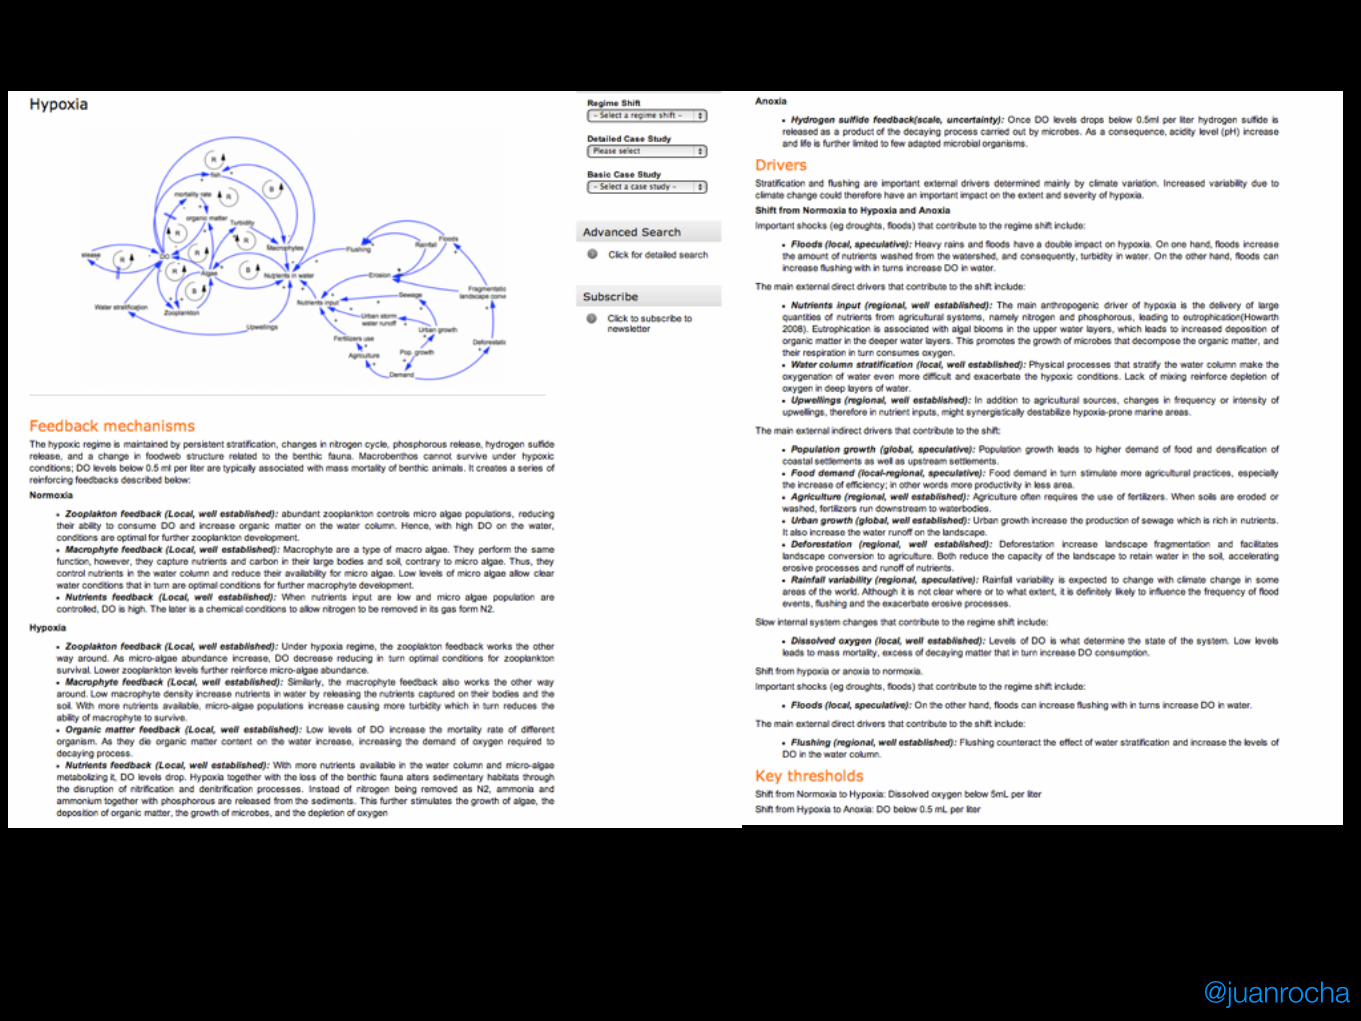
Hypoxia
Kelp transitions
Monsoon
Peatlands
Soil salinization
Soil structure
Thermohaline
Tundra to forest
Arctic salt marsh
River channel change

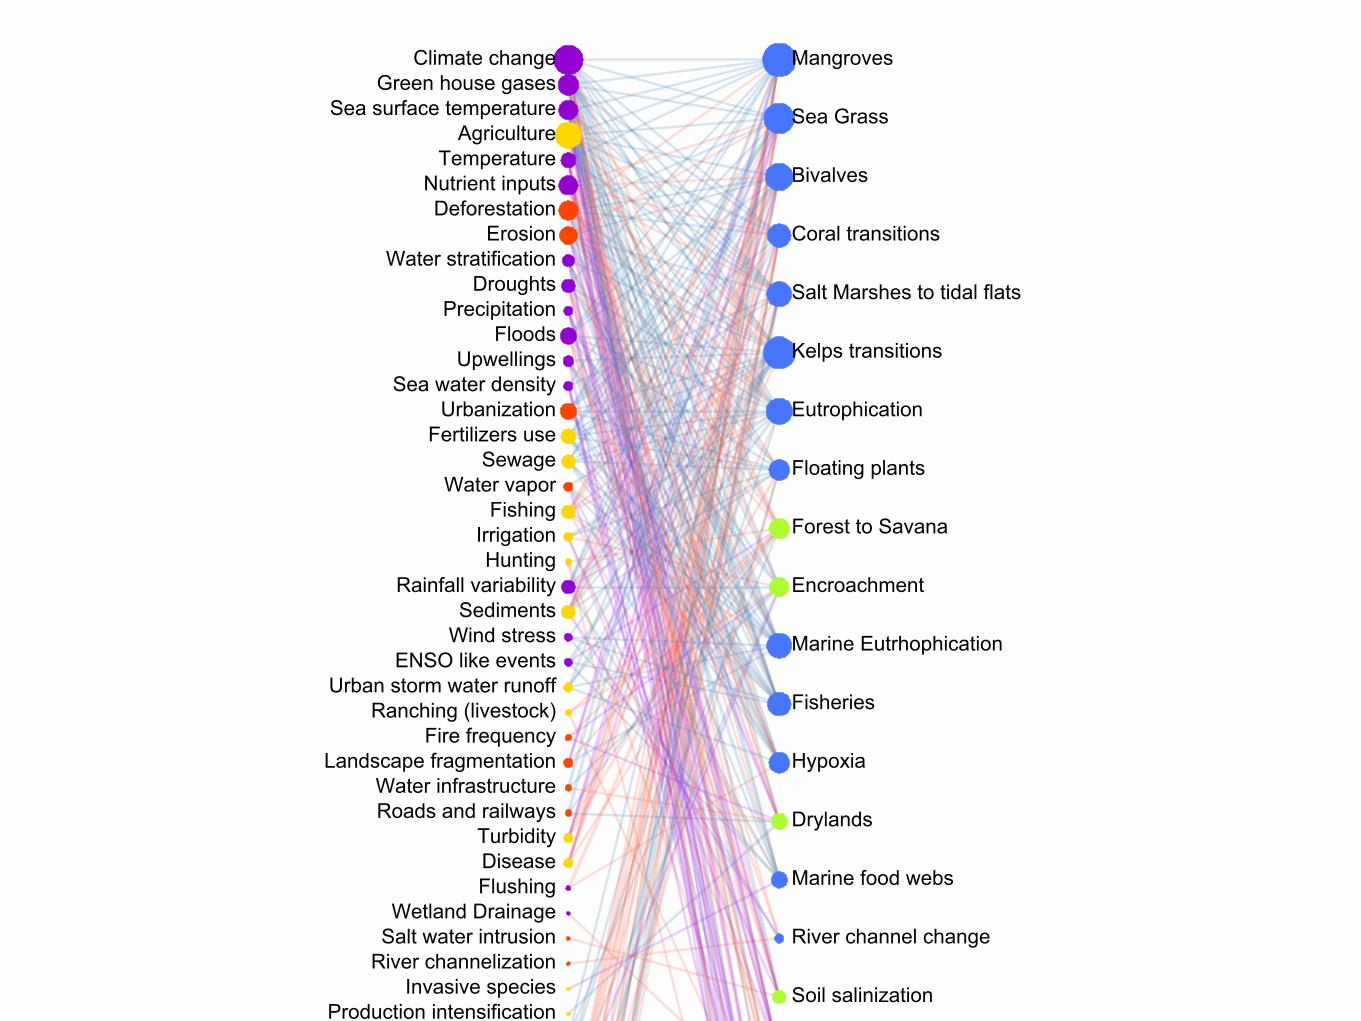
2. Forks: Drivers, Risk & ResilienceRocha, et al. PLoS ONE 10:e0134639
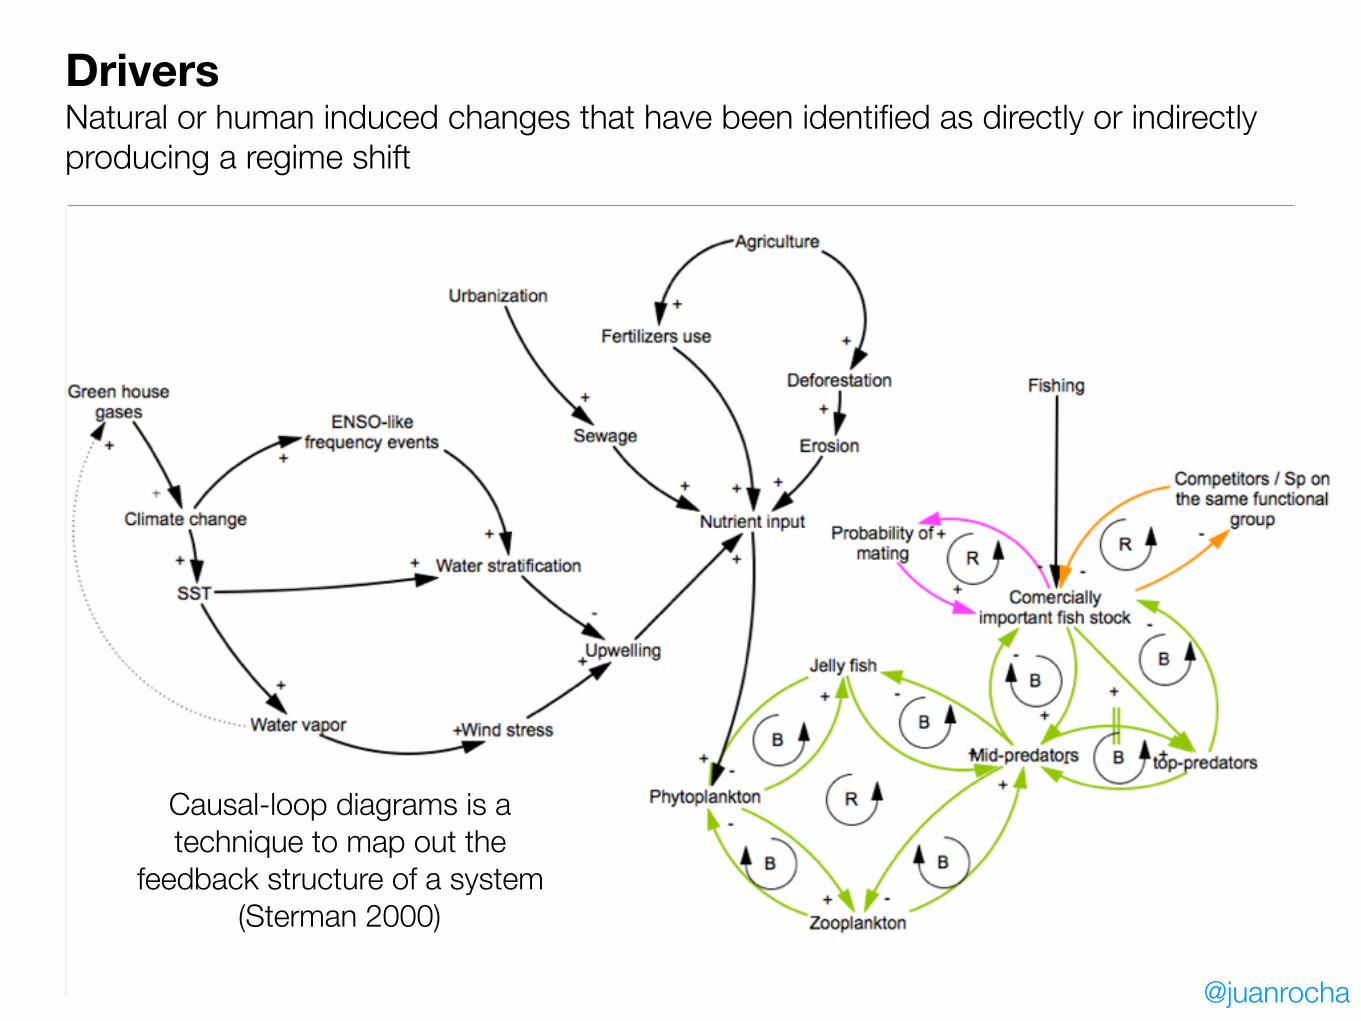
Drivers Natural or human induced changes that have been identified as directly or indirectly producing a regime shift
Causal-loop diagrams is a technique to map out the
feedback structure of a system (Sterman 2000)
@juanrocha
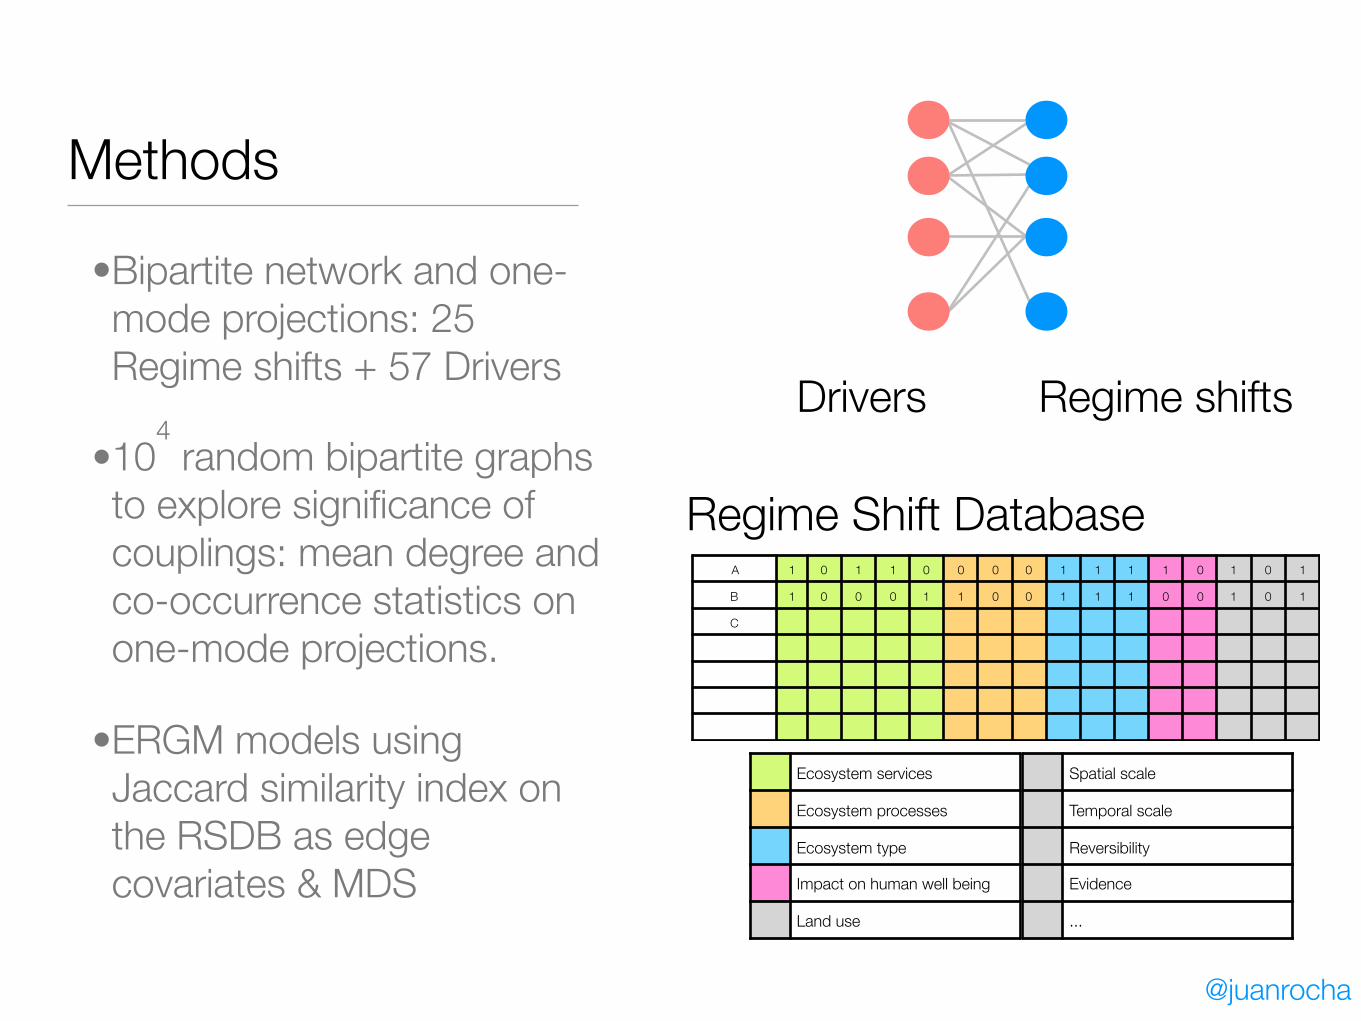
Methods
•Bipartite network and one-mode projections: 25 Regime shifts + 57 Drivers
•104 random bipartite graphs
to explore significance of couplings: mean degree and co-occurrence statistics on one-mode projections.
•ERGM models using Jaccard similarity index on the RSDB as edge covariates & MDS
Regime shiftsDrivers
A 1 0 1 1 0 0 0 0 1 1 1 1 0 1 0 1
B 1 0 0 0 1 1 0 0 1 1 1 0 0 1 0 1
C
Regime Shift Database
Ecosystem services
Ecosystem processes
Ecosystem type
Impact on human well being
Land use
Spatial scale
Temporal scale
Reversibility
Evidence
...
@juanrocha

Agriculture
Aquaculture
Aquifers depletion
Climate change
Coastal erosion
Deforestation
Disease
Droughts
ENSO like events
Erosion
Estuarine fresh water inputEstuarine salinity
Fertilizers use
Fire frequency
Fishing
Floods
Flushing
Green house gases
Harvesting (animals)
Hunting
Ice melt water
Impoundments
Invasive species
Irrigation
Landscape fragmentation
Logging
Low tides
Nutrient inputs
Ocean acidification
Pollutants
Precipitation
Production intensification
Rainfall variability
Ranching (livestock)
River channelization
Roads and railways
Salt water intrusion
Sea level rise
Sea surface temperature
Sea water density
Sediments
Sewage
Soil moistureStorms
Temperature
Thermal anomalies in summer
Turbidity
Upwellings
Urban storm water runoff
Urbanization
Water depth
Water infrastructure
Water level fluctuation
Water stratification
Water vapor
Wetland Drainage
Wind stress
Arctic Sea Ice
Bivalves
Coral transitions
Drylands
Encroachment
Eutrophication
Fisheries
Floating plants
Forest to Savana
Greenland
Hypoxia
Kelps transitions
Mangroves
Marine Eutrhophication
Marine food webs
Moonson
Peatlands
River channel change
Salt Marshes to tidal flats
Sea Grass
Soil salinization
Steppe to tundra
Thermohaline
Tundra to forest
WAIS
AgricultureClimate change
DeforestationDisease
DroughtsErosion
Fertilizers use
FishingFloods
Green house gases
Landscape fragmentationNutrient inputs
Rainfall variability
Sea surface temperature
SedimentsSewage
Temperature
Urbanization
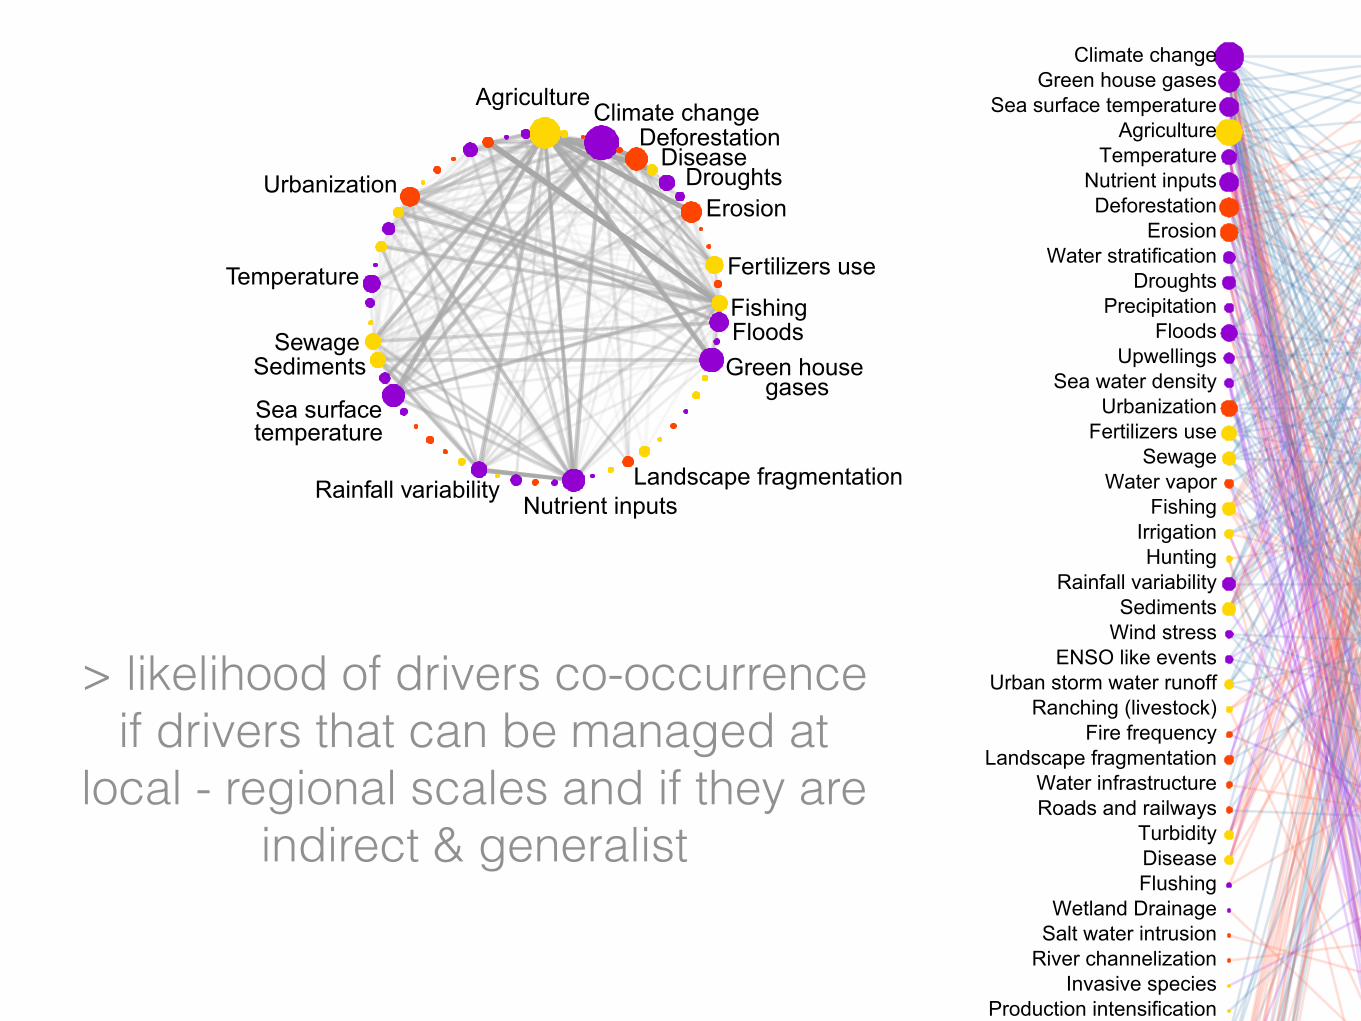
> likelihood of drivers co-occurrence if drivers that can be managed at
local - regional scales and if they are indirect & generalist

Agriculture
Aquaculture
Aquifers depletion
Climate change
Coastal erosion
Deforestation
Disease
Droughts
ENSO like events
Erosion
Estuarine fresh water inputEstuarine salinity
Fertilizers use
Fire frequency
Fishing
Floods
Flushing
Green house gases
Harvesting (animals)
Hunting
Ice melt water
Impoundments
Invasive species
Irrigation
Landscape fragmentation
Logging
Low tides
Nutrient inputs
Ocean acidification
Pollutants
Precipitation
Production intensification
Rainfall variability
Ranching (livestock)
River channelization
Roads and railways
Salt water intrusion
Sea level rise
Sea surface temperature
Sea water density
Sediments
Sewage
Soil moistureStorms
Temperature
Thermal anomalies in summer
Turbidity
Upwellings
Urban storm water runoff
Urbanization
Water depth
Water infrastructure
Water level fluctuation
Water stratification
Water vapor
Wetland Drainage
Wind stress
Arctic Sea Ice
Bivalves
Coral transitions
Drylands
Encroachment
Eutrophication
Fisheries
Floating plants
Forest to Savana
Greenland
Hypoxia
Kelps transitions
Mangroves
Marine Eutrhophication
Marine food webs
Moonson
Peatlands
River channel change
Salt Marshes to tidal flats
Sea Grass
Soil salinization
Steppe to tundra
Thermohaline
Tundra to forest
WAIS
Arctic Sea IceBivalves
Coral transitionsDrylands
Encroachment
Eutrophication
Fisheries
Floating plants
Forest to SavanaGreenland
HypoxiaKelps transitions
MangrovesMarine EutrhophicationMarine food webs
MoonsonPeatlands
River channel change
Salt marshes to tidal flats
Sea Grass
Soil salinizationSteppe to tundra
ThermohalineTundra to forest
WAIS
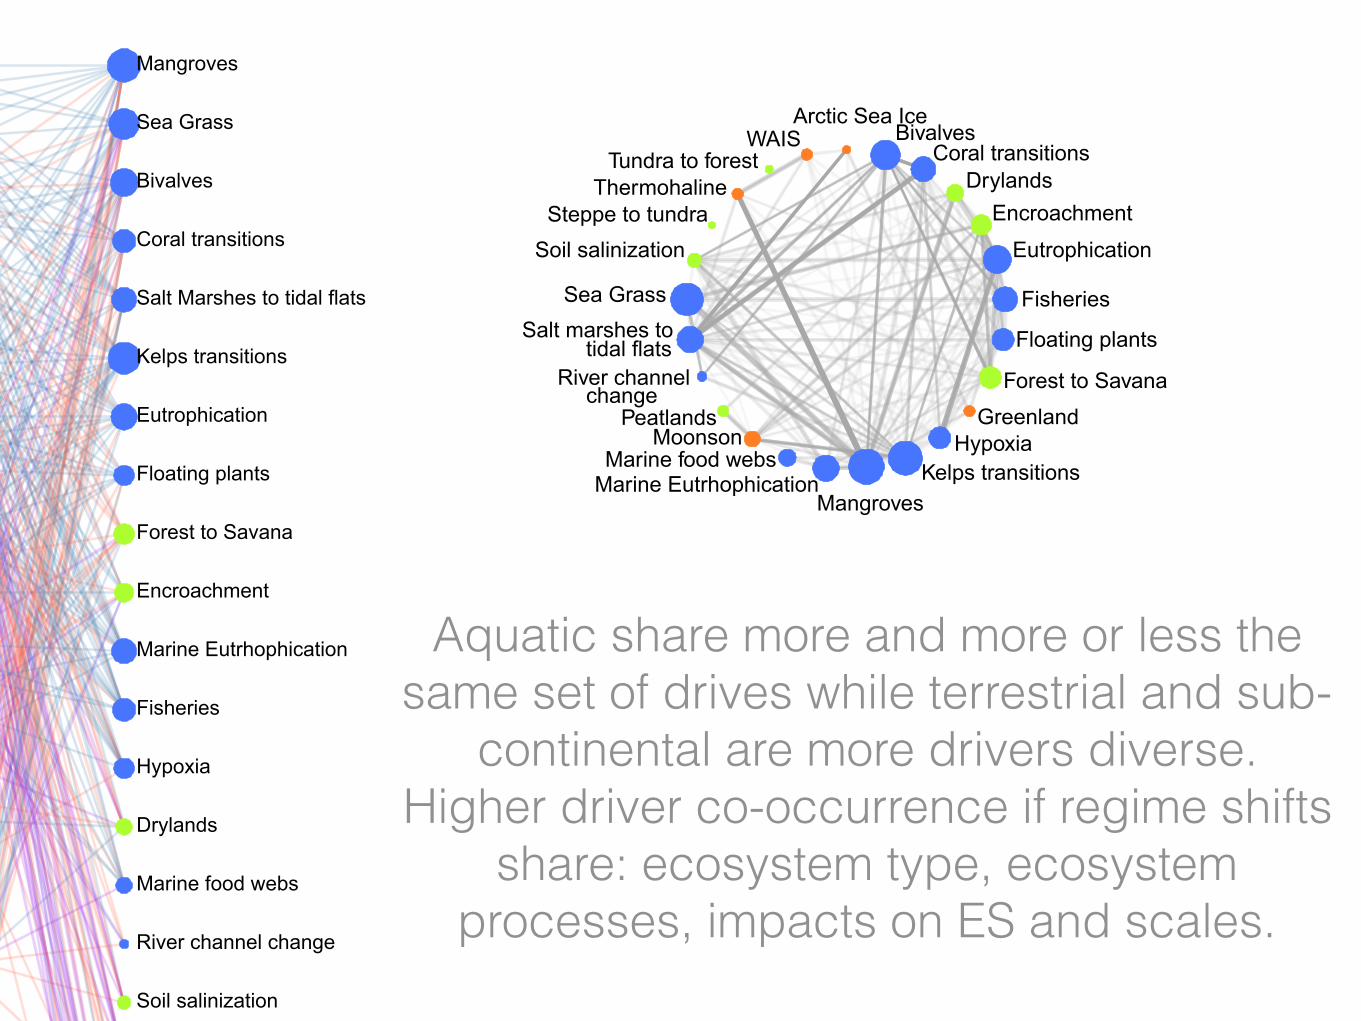
Aquatic share more and more or less the same set of drives while terrestrial and sub-
continental are more drivers diverse. Higher driver co-occurrence if regime shifts
share: ecosystem type, ecosystem processes, impacts on ES and scales.
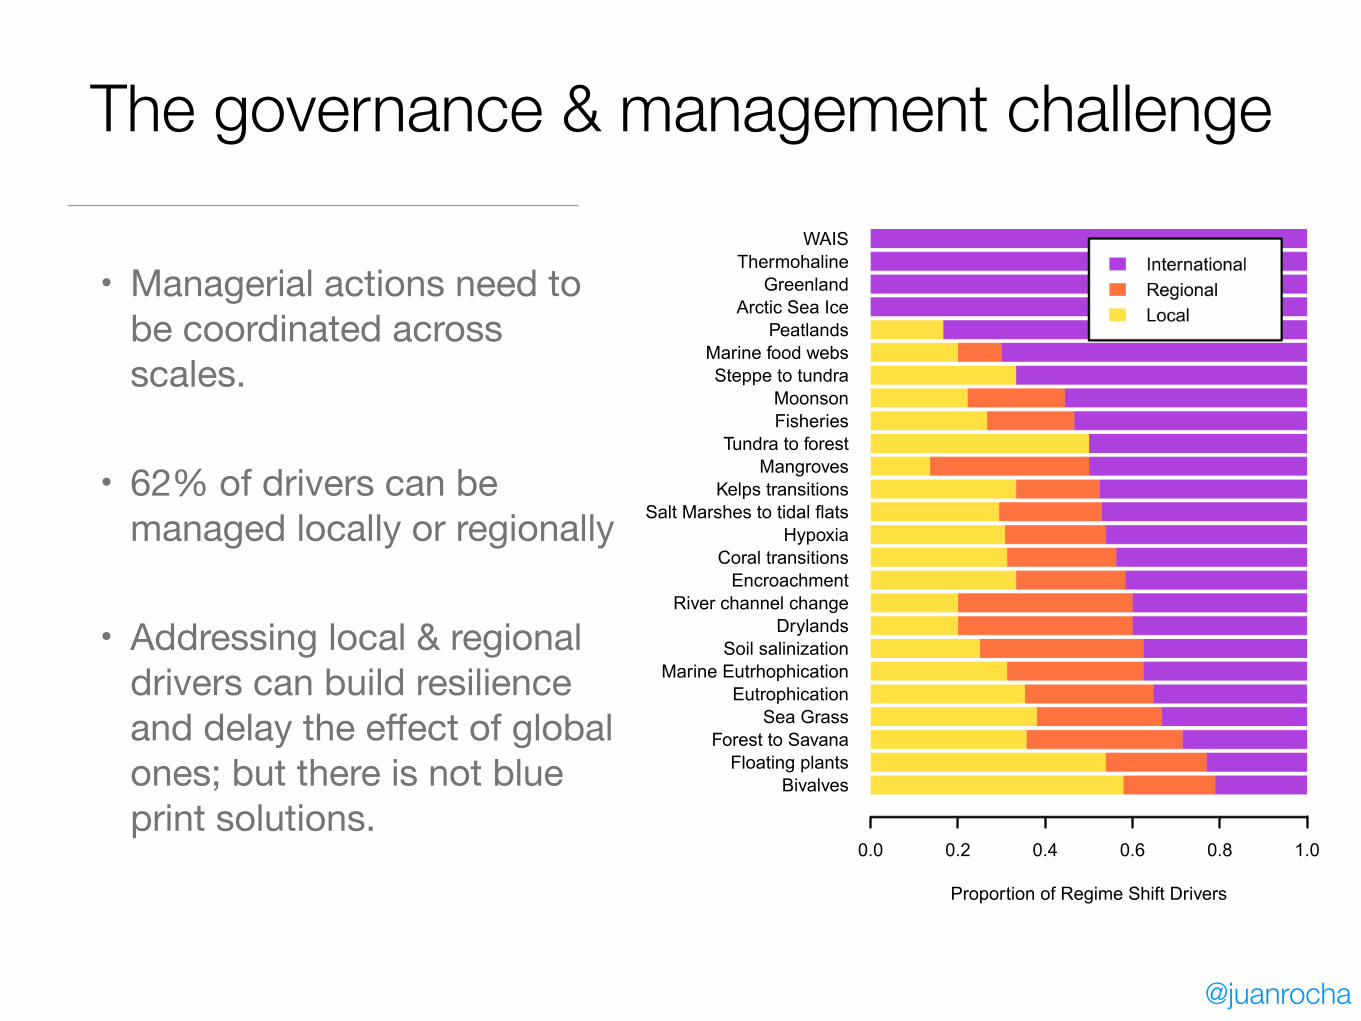
The governance & management challenge
• Managerial actions need to be coordinated across scales.
• 62% of drivers can be managed locally or regionally
• Addressing local & regional drivers can build resilience and delay the effect of global ones; but there is not blue print solutions.
@juanrocha

3. Cascading & domino effects [work in progress]

Causal-loop diagrams
Causal-loop diagrams is a technique to map out the
feedback structure of a system (Sterman 2000)
Agriculture
Coral abundance
CPUE
DeforestationDemand
Disease outbreak
ErosionFertilizers use
Fishing
Food supply
Global warming
Green house gases
Herbivores
Human population
Hurricanes
Logging
Low tides frequency
Macroalgae abundance
Nutrients input
Ocean acidification
Other competitorsPollutants
SedimentsSewage
Space
SST
Thermal annomalies
Top predators
Turbidity
Unpalatability
Urbanization
Zooxanthellae
A
B C
Agriculture
Fertilizers useDeforestation
Coral abundance
Zooxanthellae
SpaceDisease outbreak
CPUE Food supply
Erosion
DemandFishing
Logging
Herbivores
Sediments
Nutrients input
Top predators
Global warmingSST
Green house gasesOcean acidification
Macroalgae abundance
Human population
Hurricanes
Low tides frequencyUnpalatability
Turbidity
Other competitors
Pollutants
Sewage
Thermal annomaliesUrbanization
D
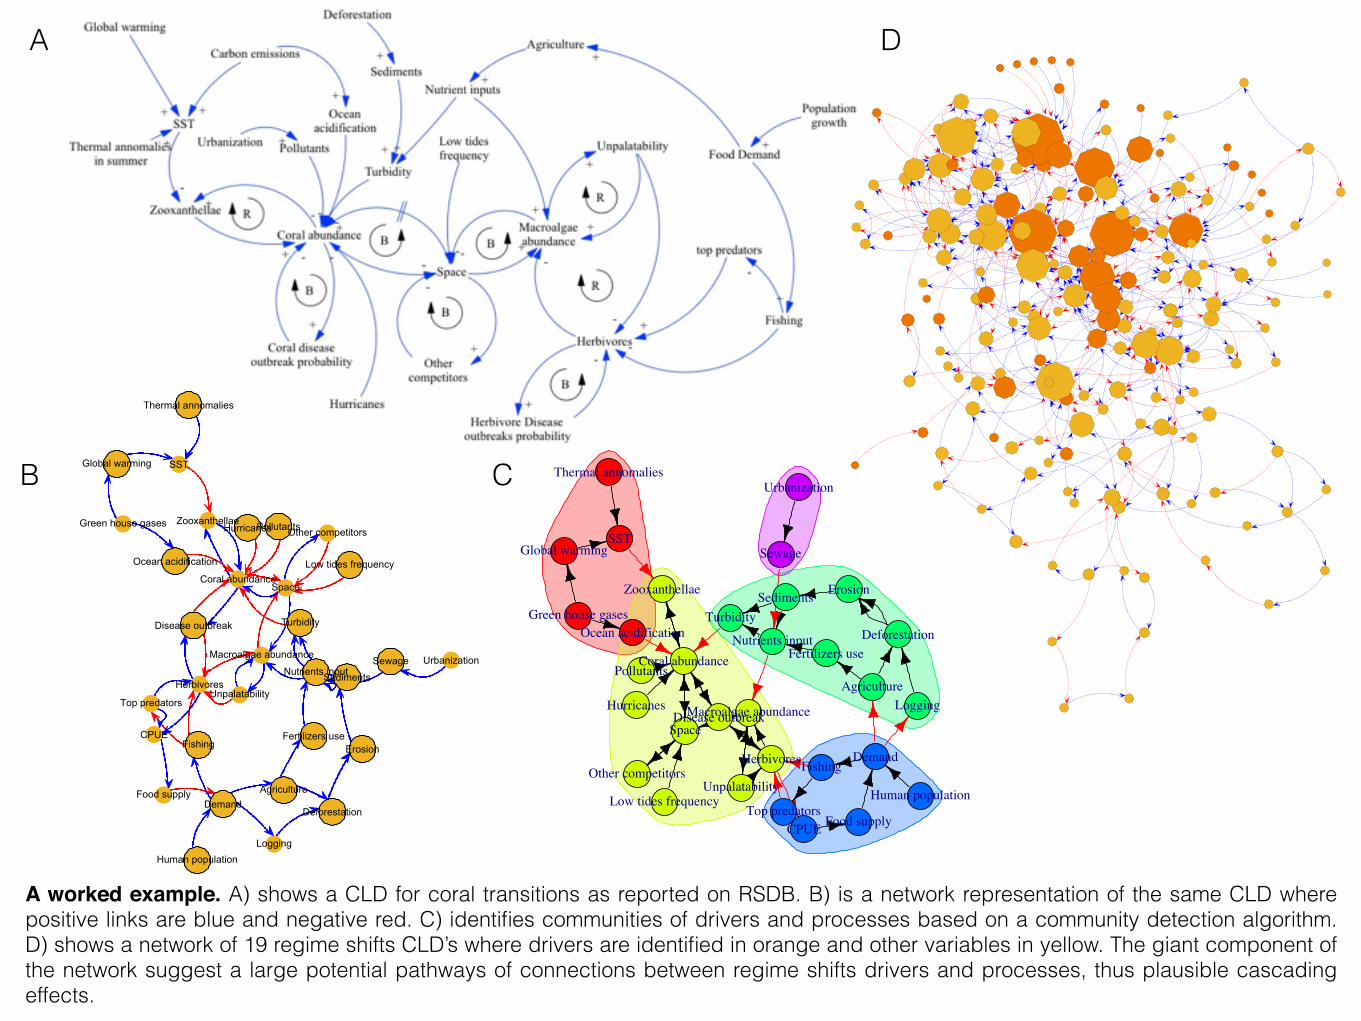
A worked example. A) shows a CLD for coral transitions as reported on RSDB. B) is a network representation of the same CLD where positive links are blue and negative red. C) identifies communities of drivers and processes based on a community detection algorithm. D) shows a network of 19 regime shifts CLD’s where drivers are identified in orange and other variables in yellow. The giant component of the network suggest a large potential pathways of connections between regime shifts drivers and processes, thus plausible cascading effects.

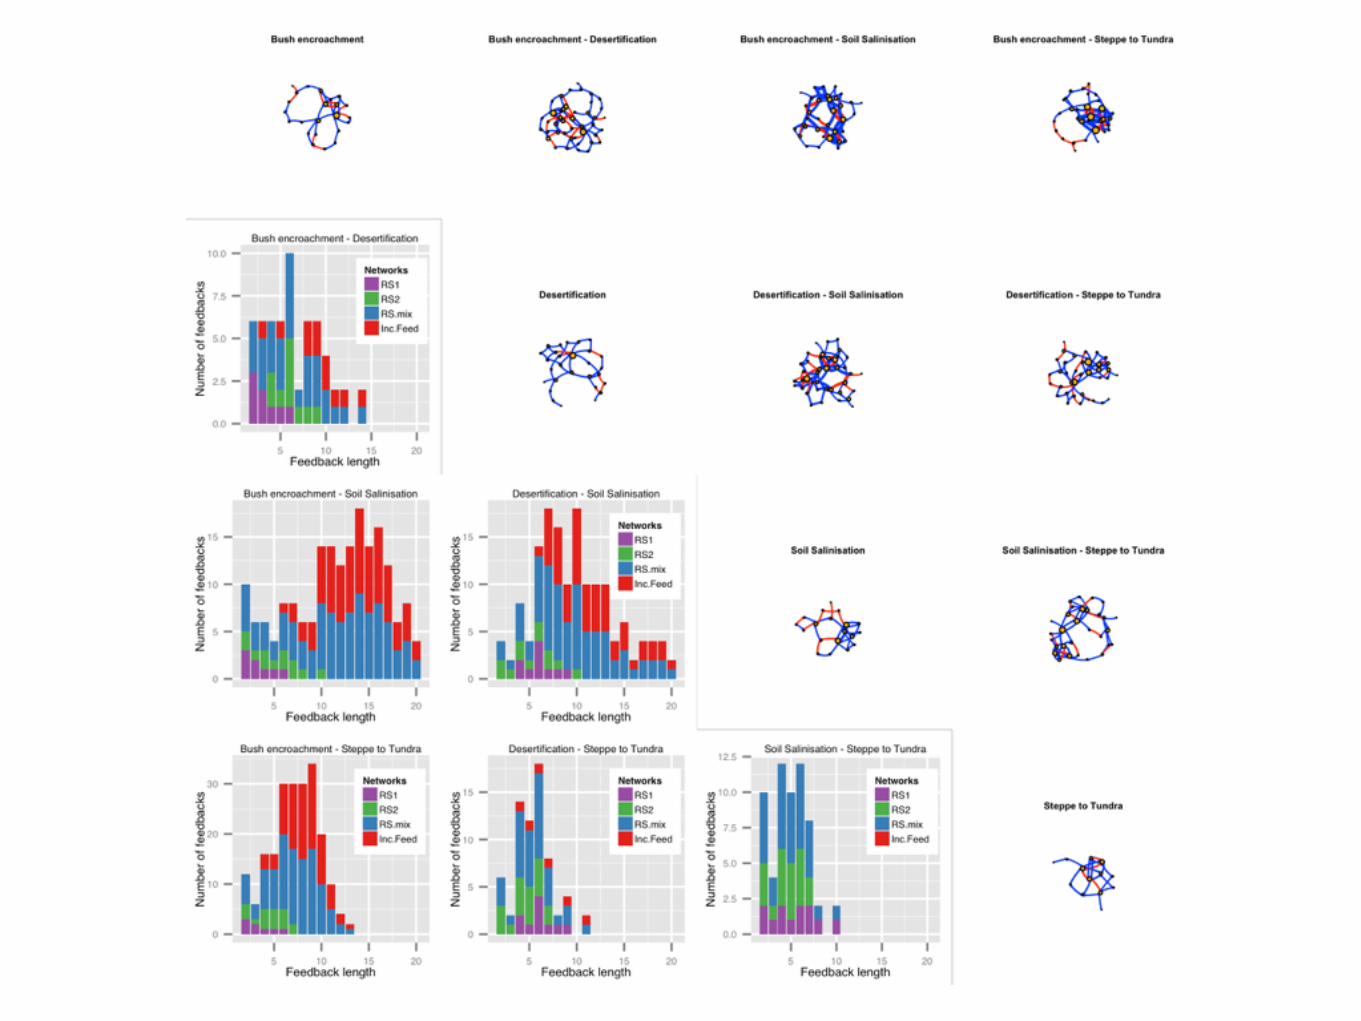
4. Inconvenient feedbacks [work in progress]

4. Inconvenient feedbacks [work in progress]


Desertification Soil Salinisation Desertification - Soil Salinisation
0
5
10
15
5 10 15 20Feedback length
Num
ber o
f fee
dbac
ks
NetworksRS1
RS2
RS.mix
Inc.Feed
Desertification - Soil Salinisation
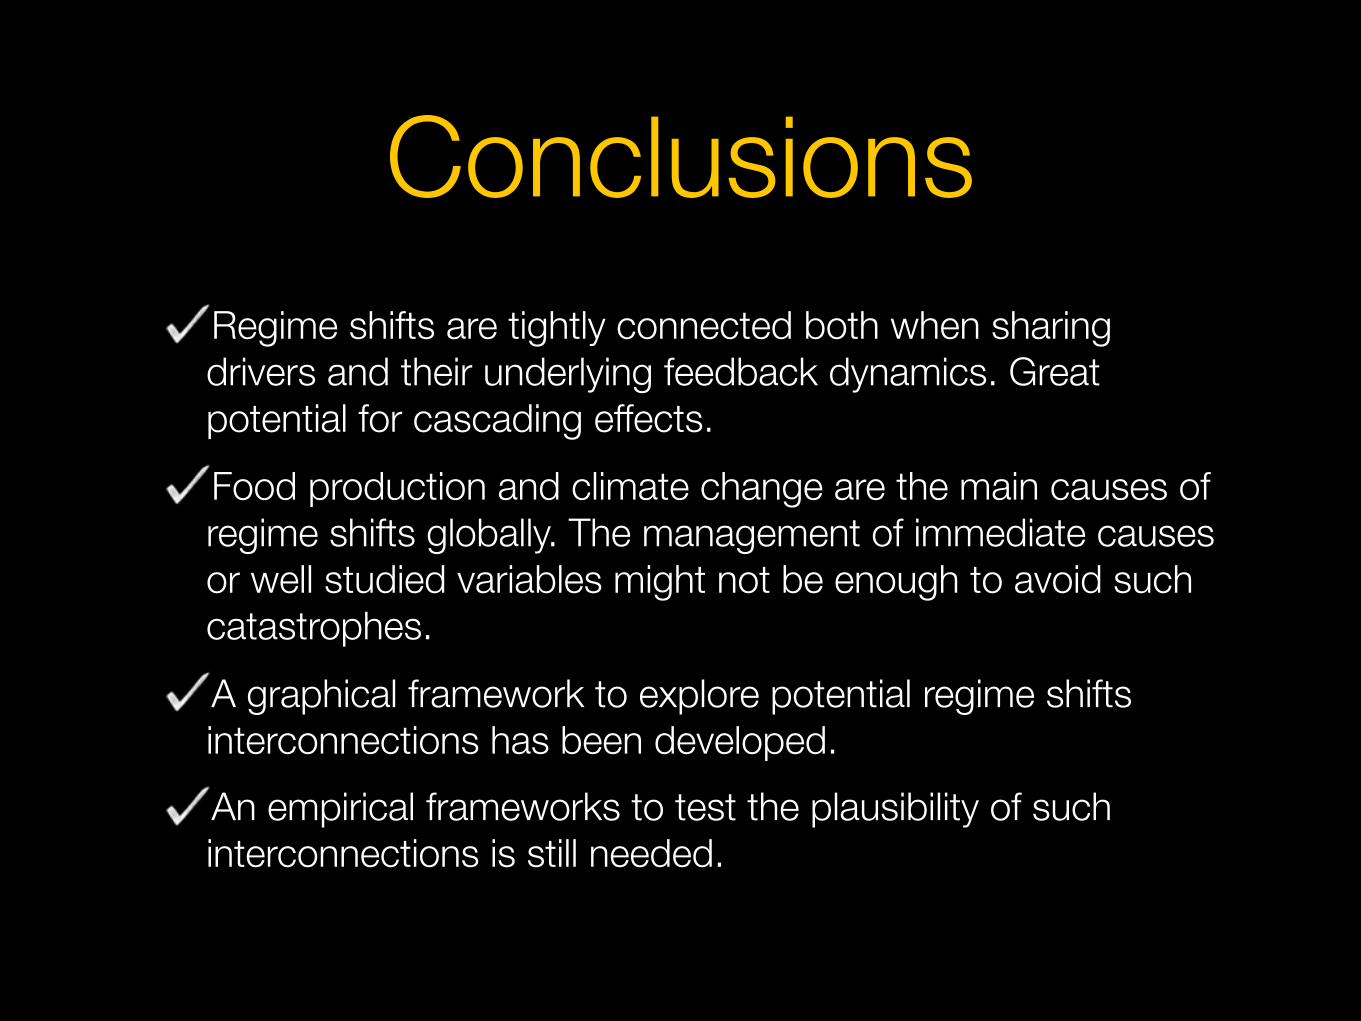
Regime shifts are tightly connected both when sharing drivers and their underlying feedback dynamics. Great potential for cascading effects. Food production and climate change are the main causes of regime shifts globally. The management of immediate causes or well studied variables might not be enough to avoid such catastrophes. A graphical framework to explore potential regime shifts interconnections has been developed. An empirical frameworks to test the plausibility of such interconnections is still needed.
Conclusions

Questions?? e-mail: [email protected] twitter: @juanrocha
slides: http://criticaltransitions.wordpress.com/ | data: www.regimeshifts.rog
Questions?? e-mail: [email protected] twitter: @juanrocha
slides: http://criticaltransitions.wordpress.com/ | data: www.regimeshifts.rog

Regime shifts are abrupt reorganisation of a system’s structure and function.
collapse
collapse
recovery
Prec
ipita
tion
Vegetation Prec
ipita
tion
Vegetation Prec
ipita
tion
Vegetation Prec
ipita
tion
Vegetation
Precipitation Precipitation Precipitation Precipitation
low high low high low high low high
Vegetation
low
high
Vegetation
low
high
Vegetation
low
high
Vegetation
low
high
StabilityLandscape
Equilibria
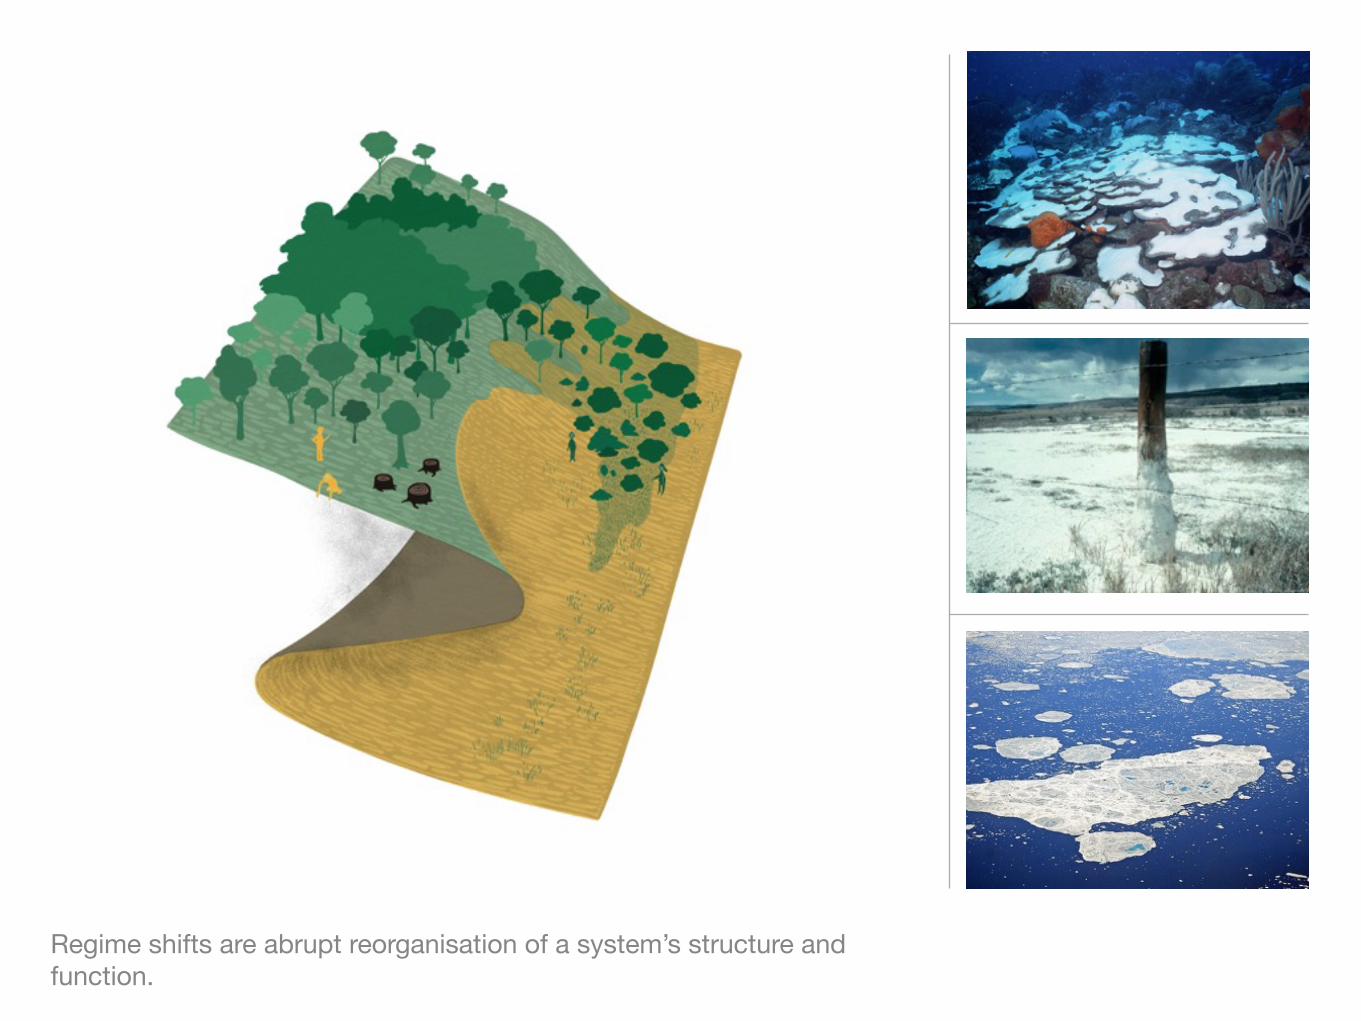
Regime shifts are abrupt reorganisation of a system’s structure and function.