case 1: managing geopolitical risk in investment decision-makingcharvey/teaching/ba453... ·...
TRANSCRIPT

Case 1Page 1
Sixth Global Fixed IncomeCapital Markets/Investment Management Workshop/Retreat
July 20-24, 2002Aspen, Colorado
Asia Strategy
CASE 1:
Managing Geopolitical Risk InInvestment Decision-Making
CASE MODERATOR:
Campbell Russell Harvey,Professor of International BusinessDuke University—Fuqua School of Business
CASE PREPARATION:
Jack MalveyLars PedersenJoseph Di CensoCharles ReinhardSteve GruppoMark Patrick
The case preparers would like to thankJonathan Carmel, Bruce Phelps, Dexter Senft,and Jeff Applegate for their helpful comments.

Case 1Page 2
Sixth Global Fixed IncomeCapital Markets/Investment Management Workshop/Retreat
July 20-24, 2002Aspen, Colorado
9:45 amJuly 11, 2002The summer morning was perfect. Gentle surf splashed Sarah Campbell’s bare feet as sheglided through her daily three-mile run along the Bridgehampton beach.
Her runner’s high lasted briefly. Before she even turned to walk back to her imposingbeach house, this cloudless, low humidity, mid-70s temperature day reminded her of theideal weather on that awful day, September 11, 2001, and to her pressing responsibilitiesas the new chief investment officer for all global fixed-income assets at Diamond AssetManagement Company, the asset management arm of Universal Investment & Commer-cial Banking Corp. With offices scattered across all major financial centers, Diamond’sdebt arm alone presided over $175.0 billion of assets in money markets, mutual funds,and large institutional accounts.
The morning news on CNBC had been disheartening. So far, the summer equity rally hadbeen a fizzle. Another homicide bombing on the West Bank claimed the lives of seveninnocents. The Bush administration confirmed the New York Times front-page story ofJuly 5, 2002; the U.S. military was drawing up plans to engineer a regime change in Iraqduring early 2003. A small South Korean patrol boat was sunk in contested waters off theNorth Korean coast with the loss of a dozen lives. The SEC announced plans to investigateanother 25 large U.S. firms for potential accounting misrepresentations. In response tothese unsettling developments, Asian equity markets shed 2.5% overnight; Europeanequity markets had already given up nearly 2.0% on this fair morning; and U.S. equityfutures pointed to another big down day on Wall Street. The dollar was off 1%, mostmajor yield curves had rallied 3-5 bp, producing a nearly equivalent spread expansionacross investment-grade spread product; high-yield corporate and emerging-marketdebt prices were down $2.00-$3.00 on average; and gold, which her funds unfortunatelycouldn’t own, was up $5.50 per ounce.
Now exactly 10 months after September 11, 2001, Sarah was certain that Diamond AssetManagement had done very little to formally incorporate geopolitical risk into its invest-ment decision-making process. They had tried. Several investment committee meetingswere convened to focus exclusively on geopolitical risk. Professor Charles Bohlen from JohnHopkins, a noted authority on international relations and the Middle East in particular, haddelivered a fascinating guest lecture to Diamond’s investment committee in February 2002.Separately, on a one-on-one basis, her team had buttonholed economics and financeacademics at conferences and during their regular visits to Diamond about portfolio
Case 1Page 3
Sixth Global Fixed IncomeCapital Markets/Investment Management Workshop/Retreat
July 20-24, 2002Aspen, Colorado
optimization during periods of high geopolitical risk. So far, the responses had not beenespecially helpful. Diamond’s asset management team already knew that extra cautionshould be exercised, but it wasn’t sure what else it should be doing.
The subject of geopolitical risk commanded more than passing academic interest forSarah and her team. Arguably, her immediate predecessor and respected mentor ofnearly two decades, Arang Nabar, had fallen on his career sword in early 2002 partiallydue to Diamond’s failure to have a detailed contingency plan for geopolitical events likeSeptember 11. In promoting Sarah to the CIO slot, Al Grupe—a former chairman of theU.S. Export-Import Bank (Exim)—had thinned the legacy of her predecessor forDiamond’s “geopolitical planning void” as he put it:
“Sarah, I’ve met third-rate U.S. exporters of zippers at Exim with a greater awarenessand preparation for international risks than Arang. Over the next two years, you canmiss on duration, you can miss on spreads, but don’t blow up our performance byfailing to be prepared on the international front. There’s no excuse. Assume that theworld’s on a wartime footing. I’ve praised you to the hilt to our Universal bosses. Don’tlet me down. You can start by acing a presentation on geopolitical risks at our annualAspen offsite. Be great.”
Three months into her new position, Sarah was using this working vacation, her first inover a year, to prepare an address on “Managing Geopolitical Risk in InvestmentDecision-Making” at the annual offsite of all the senior investment management teamsof Diamond and Universal at Aspen, Colorado, on July 22, 2002. As she restlessly strodeinto her cozy office on the second floor of her beach house with the commanding viewof the smooth blue sea and bright beach, she fired up her computer to check her e-mailsand dialed into her 10:00 am conference call with her senior investment staff.

Case 1Page 4
Sixth Global Fixed IncomeCapital Markets/Investment Management Workshop/Retreat
July 20-24, 2002Aspen, Colorado
THE CONFERENCE CALL
Sarah: “Is everyone here? Okay, let’s get started. We need to review this Aspen assign-ment. Even prior to 9/11, the geopolitical risk thermostat had risen above its 1990ssettings. For this offsite, our colleagues have asked us to examine the current andmedium-term outlook for geopolitical risk, attempt to quantify these risks, consider theeffects of these risks for the overall global capital markets, and analyze how investors/riskmanagers can best manage financial assets during periods of potentially high geopoliticalstress. If possible, our colleagues would like us to comment on how investment firms dealtwith 9/11 and also how financial institutions grappled with the geopolitical events of theearly and mid-20th centuries.
As a reminder: please e-mail your written presentations to me by the end of Monday,July 15. I will need all of next week to pull this material together for our Aspen offsite.Have a great week. And with that, let me get back to the beach.”

Case 1Page 5
Sixth Global Fixed IncomeCapital Markets/Investment Management Workshop/Retreat
July 20-24, 2002Aspen, Colorado
To: Sarah Campbell July 12, 2002From: Samuel Weaver
DirectorGeorgetown Center for Peace & Security Studies (CPASS)
Re: Strategic Geopolitical Risk AssessmentCC: Dennis Toffler, Maureen Patrick, Alvin Pearle
Dear Sarah,
As you requested on June 10, my colleagues and I at the Georgetown Center for Peace &Security Studies are providing your team with this attached overview in slide form ofstrategic geopolitical risks to be used in your investment decision-making. Given thatyour fine firm actually manages our pension fund assets, I very much hope that this reportenhances your investment results through time.
We are delighted that you solicited our views. The global capital markets lie outside of ourexpertise. From our less knowledgeable perspective, the capital markets generally appearsomewhere between complacent to outright indifferent about geopolitical affairs. Againand again, our Center members are puzzled by the capital markets’ chaotic reactions tovery familiar geopolitical problems. Although 9/11 caught us all off guard, a likelycollusion between the Taliban and Muslim extremists against the West has beenanticipated for years. For example, the front cover of Foreign Affairs, November/December 1999 issue, cited two articles, “The Taliban: Exporting Extremism” by AhmedRashid and “Kashmir: Fundamentalism Takes Root” by Jonah Blank.
The topic of your forthcoming offsite looks timely and holds great relevance, in ouropinion. The end of the Cold War helped spark the freest movement of people and capitalever. In the spirit of post-Cold War triumphalism, the exciting, almost intoxicatingpromise of global capitalism was heralded in popular treatises, such as Tom Friedman’sThe Lexus and the Olive Tree (May 2000), during the 1990s and early Oughts. In additionto raising living standards, the celebrants of global capitalism also claim liberty anddemocracy as collateral benefits. As seen in the Asian financial crisis of 1997, these rapidmovements, especially of capital, ironically may be destabilizing and contribute toheightened geopolitical risk from cultures accustomed to a slower pace of change.
In his masterpiece, The Structure of Evolutionary Theory, the late Stephen Jay Gould notesthe application of his concept of punctuated equilibrium to economics and political science(p. 977). The global historical order now appears in the midst of straining to find a newpunctuated equilibrium in the welcome wake of the cold war.

Case 1Page 6
Sixth Global Fixed IncomeCapital Markets/Investment Management Workshop/Retreat
July 20-24, 2002Aspen, Colorado
At the turn of the 21st century, great geopolitical risks abound. Vital natural resources,such as oil, are concentrated in unstable areas. Governments and global organizations willhave to proceed wisely to avoid conflicts. Like the British from the Victorian era throughthe onset of World War I, the U.S. holds the geopolitical leadership position. Thisresponsibility carries many challenges.
The stakes are high. Our friend Walter Russell Mead writes in his forthcoming With Godon Our Side: American Apocalypse and the Mall at the End of the World: “As the twenty firstcentury progresses, fears of mass destruction and the end of the world will become moreprevalent even than during the Cold War. There will be more and more actors capable ofwielding more and more weapons of mass destruction.”
Mead’s not a doomsayer: “Just as the 20th century unleashed good and evil beyondthe ability of 19th century humanity to comprehend or cope with, so too the twentyfirst century will witness unimaginable blessings and horrors. .With bodies and evensouls remade by the marvels of genetic engineering and the fusion of the biologicaland mechanical kingdoms, our descendents may inhabit mental and physicaluniverses only dimly imagined today.” (p. 25)
The U.S. may have the means to head off this apocalyptic course. But in so doing, theU.S. must guard against the perception of hegemonic hubris, a vision shared even bysome of the European allies of the U.S. Rather than seeking unilateral solutions, theU.S. and the greater geopolitical good would be better served by improved multipo-lar cooperation. As currency union has proceeded in Europe, the global order mightalso benefit from consideration of an eventual global currency. As non-economists,we are struck by the frequency of currency crises and their tendency to overwhelmeven sound governments. And a global parliament might make a worthy successor tothe tired U.N. Ultimately, though, the avoidance of apocalyptic military engage-ments lies in the provision of better health care, education, economic aid, andenvironmental protection. With our imperfect institutions presided over by imper-fect human beings, this progressive route cannot be fully assured. But our globalcivilization will have a higher probability of successfully negotiating the perilous 21st
century if sovereign governments work ever more closely together to turn thisprogressive vision into reality.
As always, we would be delighted to consult further with your investment team on anyof the enclosed topics. Our slides for your conference follow:

Case 1Page 7
Sixth Global Fixed IncomeCapital Markets/Investment Management Workshop/Retreat
July 20-24, 2002Aspen, Colorado
GEOPOLITICAL RISKS DURINGTHE FIRST QUARTER OF THE 21ST CENTURY
Two Dominant Themes• Globalization versus fragmentation• Proliferation and accessibility of weapons of mass destruction
Definition of Geopolitical Risk for Capital Markets• Putting the “Political” back in front of “Economy”: It’s back to “Political Economy”
and time for “Geopolitical Economics”• Geopolitical risk: term coined by Rudolf Kjeflen (1916), Swedish political scientist,
to consider role of geography in international relations• Modern capital market connotation of geopolitical risk: any international event
(incident, war, threat of war, disruption of major trade flow (oil), revolution,terrorist action, coup, assassination) that adversely affects global commerce andcapital markets
• Sharper definition required: “sudden geopolitical shocks” vs. long-term strategicrealignments—end of Cold War and this unfolding “Clash of Civilizations”
The Late 20th/Early 21st Century View of Geopolitical HistoryAs former U.N. Ambassador Richard Holbrooke noted:
• First half of 20th century will be remembered for defeat of fascism• Second half of 20th century will be recalled for defeat of communism
So, too, we believe that:
• First quarter of 21st century, and hopefully in less time, will be recalled for the defeatof terrorism
A Longer View of Geopolitical History• Technology and information have accelerated the flow of world history• Geopolitical specialists grapple with defining this new era• Fukuyama’s The End of History (1989)
– History follows universal reason– Horizontal analyses looking at the forces operating across all regions

Case 1Page 8
Sixth Global Fixed IncomeCapital Markets/Investment Management Workshop/Retreat
July 20-24, 2002Aspen, Colorado
• Huntington’s The Clash of Civilizations and the Remaking of World Order (1996)– History flows from “irrepressible conflicts and irreconcilable logics”– Vertical analyses of world politics, shaped by region and culture
• Mead’s forthcoming With God on Our Side: American Apocalypse and the Mall at theEnd of the World– Proposes a third way, an integration of the Fukuyama and Huntington theses
• Yergin and Stanislaw’s The Commanding Heights (1998)– Proclaims political triumph of free market ideology over statist economic
models in the last quarter of the 20th century
Incidence of Geopolitical Risk: 1900-July 2002The 1990s Were an Exception; Commonplace Historically• For global capital markets, major geopolitical event occurs about once every decade
and a half: World War I (1914-1918); World War II (1939-1945); Korean War(1950-1953); Cuban Missile Crisis (1962); Vietnam War (1965-1973); Arab OilEmbargo (1973); Iranian Revolution (1979); Gulf War (1990-1991); 9/11/01
• Minor incidents more frequent, a sample includes: Berlin Blockade (1948); HungarianRevolution (1956): “Suez Crisis” (1956); “Cultural Revolution” in China (1965); Soviettank invasion of Prague (1968); Pueblo incident (1968); Watergate denouement (1974);U.S. hostages in Tehran (1979); U.S. invasion of Grenada (1983); U.S. invasion ofPanama (1989); Tiananmen Square (1989); potential Russian Coup (1991); WorldTrade Center Bombing (1993); Chinese missile testing over Taiwan (1996); India andPakistan nuclear testing (1998); U.S. reconnaissance plane in China (2001)
• Expect higher frequency of geopolitical events in a more integrated world of 189U.N. member nations
Major Geopolitical Risks: 2002-2020
Dispute Framework:“Old” Problems, “New Old” Problems, “New” Problems
“Old” Problems• Liberal capitalism, with attendant “creative destruction” or kinder “socialist
recidivism”• Religious tolerance or “clash of civilizations”• Lack of compromise among sovereigns and ideological factions• Corruption

Case 1Page 9
Sixth Global Fixed IncomeCapital Markets/Investment Management Workshop/Retreat
July 20-24, 2002Aspen, Colorado
“New Old” Problems• Role of terrorism as a tool to engender geopolitical change• Political and economic convergence to regional aggregates (eurozone) or national-
ist-fueled unraveling into smaller units (Balkans)• Shift in the global balance of power• Distributionist policies: trade, technology, information, healthcare, wealth• Modernization of Bretton Woods institutions: World Bank and IMF
“New” Problems• Radical Muslims struggle to renew the Arab world through conflict with the West• Proliferation and potential use of weapons of mass destruction• Reduced barriers to substantive terrorist operations thanks to technology• Reduction in the efficacy of nation-state borders due to the enormous trade,
information, and population flows increased by economic globalization• Accountability for long-term environmental issues under the 1997 Kyoto Protocol• AIDS and possibility of new pandemics• Cyber sabotage• Genetically modified food• Intellectual property rights• Eclipse of European military and diplomatic power and emergence of U.S. as only
credible activist military/security power in an increasingly unipolar world
Regional Risks
East Asia• Rising influence of China; its political/economic stability; Taiwan question• Japan’s economic recovery and potential veer to nationalism• Korean unification• Muslim terrorists in the Philippines• Indonesian unbundling• Singapore’s role
South Central Asia• India/Pakistan conflict• Economic liberalization vs. traditionalism

Case 1Page 10
Sixth Global Fixed IncomeCapital Markets/Investment Management Workshop/Retreat
July 20-24, 2002Aspen, Colorado
Middle East• Resolution of the Palestinian question• Iraq: longevity of current regime• Iran: moderation of theocracy and partial turn to the West• Future of Saudi monarchy, Egypt, Jordan, and other “moderate” Arab states: a turn
toward the West or fundamentalism• Potential power vacuum should the radical Middle Eastern states collapse: Iran, Iraq,
Syria, Libya• Turkey: stability; West or East
Europe• Expansion of the EU• Economic integration offsetting political differences vs. rejection of capitalism and
embracing of populist economics and right-wing politics• Support current U.S.-based order or advocate for new global order• Russia’s role: domestic social and economic stability• Separatist agitators: Basques, Ireland, Balkans• Future of NATO
Latin America• Democracy, capitalism, populism, or authoritarianism• Final lessons from Argentine devaluation/default? Failed experiment in liberal
capitalism or bad local and IMF policy-making• Venezuela: which political model• Brazil: moving on Argentine or Mexican path• Mexico: extent of reform; into the First World or back to the Third World
Africa• Mainstreaming the “lagging continent”• HIV epidemic• Will the wealth, health, technology, and education divide narrow or widen• Addressing “state failures”
North America• Will the U.S. amend its superpower role by taking either a unilateralist or multi-
lateralist route

Case 1Page 11
Sixth Global Fixed IncomeCapital Markets/Investment Management Workshop/Retreat
July 20-24, 2002Aspen, Colorado
Geopolitical Risks Contribute Directlyto Interanational Financial Crises• Between 1980 and 2000, the Council on Foreign Relations reported that at least 125
countries experienced some banking problems, with half becoming insolvent• Global interconnectivity has never been higher. U.S. exports represented 5% of GDP
in 1960, 7.5% in 1980, and 15% by 2000• Global economic system racing to incorporate quickening technological changes
will frequently fall on the cusp of deflationary excess supply—a natural breedingground for political instabilities
Finally, as with many decision-makers, perhaps guided by their subscriptions to countryrisk rating services, you asked us to assign probabilities to the menu of geopolitical risks.We can and, in the past, have made up “subjective” or “heuristic” risk probabilities forour quantitatively inclined clients. These euphemisms cannot camouflage the “back-of-the-envelope” nature of such “probability inventions.”
For example, we can assert that the probability of Korean unification looks high (80%-90%) over the next 25 years. But we cannot state the when or how with any precision. Inour opinion, our clients would be ill served by our assignment of such probabilityinventions. In our experience, the temptation to rely on such probability figures canengender complacencies. As we often have learned the hard way, the sudden emergenceof low probability events can be far more unsettling than the occurrence of a perceivedhigh probability event. We advise Diamond to refrain from this practice. Think indepen-dently, view all risks as high, and be ready for the unexpected.
We very much look forward to your feedback.
Best wishes,Samuel

Case 1Page 12
Sixth Global Fixed IncomeCapital Markets/Investment Management Workshop/Retreat
July 20-24, 2002Aspen, Colorado
To: Sarah Campbell July 13, 2002From: Maureen Patrick
Research Director, Diamond Asset ManagementRe: Geopolitical Risk Scenarios for Aspen OffsiteCC: Samuel Weaver, Alvin Pearle, Dennis Toffler
SCENARIO PLANNING EXERCISE OVERVIEW
Using Samuel Weaver’s excellent preliminary input from late June, my research teamand I identified geopolitical risks to the global capital markets that could have majoreffects on our portfolio performance during 2002-2003. From numerous possibilities,we concentrated on the two major crisis scenarios with the highest probabilities, in ourview, for further analyses to illustrate our methodology. Specifically, we looked at aMiddle East crisis and terrorist attack(s). If you’d like, we can easily extend thisframework to analyze other geopolitical events of a lower likelihood, such as anoutright war between India and Pakistan or political unification of the Koreanpeninsula, over your suggested timeframe. To make our analyses hopefully clearer, wealso have supplied a tree diagram of the market’s likely reaction to the two maingeopolitical risks reviewed in this memo.
Unfortunately, the likelihood of these two chosen scenarios taking place looks uncom-fortably high as of mid-July 2002. After further consultation with Samuel Weaver and histeam and despite their cautionary counsel, we created subjective probabilities for thesescenarios, ranging anywhere from minor to devastating, and then evaluated the potentialeconomic and market effects. Finally, we studied the likely effects on our portfolios.

Case 1
Page 13
SeriousImpact (25%)
Catastrophic ImpactScenario (5%)
MARKET IMPACT
GDP Slower global growthMonetary/Fiscal Policy No action b/c tied btwn easing & fighting inflationInflation Increase in oil-importing countriesFund Flows Positive U.S. inflows on safe-haven tradeOil Temporary oil shock, $40 oil for 3-6 monthsFX U.S. dollar gain 5-10% as safe-haven tradeEquity Drop 10-20%; regain within 1-3 monthsNew Origination Few effects for liquidity or CP marketsCurves First curve rallies in “flight-to-quality,” later sell-off from
inflation concernsSpreads Securitized spreads 5-10 bp wider
Credit spreads: Aaa(+10 bp);weak Baa(+250 bp)High yield and EMG fall 3-7 points
GDP Recession a year or moreMonetary/Fiscal Policy Ease then tightenInflation Accelerates in oil-importing countriesFund Flows U.S. capital flows reverse as investors stay localOil Brent crude oil to $50+ for 1 year or moreFX Dollar weakens 15% on global recession, budget defi-
cits, inflation threatsEquity All markets -15-20%, 6 months to stabilizeNew Origination Slow primary mkts., secondary mkt. liquiditysuffersCurves Curves whipped around; rally on recession/easings and
sell off on inflation and tighteningsSpreads MBS 20-30 bp wider
Credit: Aaa (+20 bp); troubled crossovers +500 bpHigh yield and EMG drop 10-20 bp
GDP Deep depressionMonetary/Fiscal Policy Ease sharply, Fed Funds to 0.50%Inflation Accelerating inflationFund Flows In loss of confidence in U.S., capital flows reverse and
rebalances current acct. deficitOil Gulf oil supplies seriously disrupted for 1-2 yrs; oil at $50-
$75 for 3-6 months, remain at $40 for 1-2 yearsFX Dollar appreciates 3-5%Equity Global equity markets plummet 30%-40% and depressed
for 1-2 yearsNew Origination Access only to Aaa/AAA-rated securitized and credit is-
suers; secondary liquidity suffers for allCurves Steepen as investors herd assets to 1-5 year maturitiesSpreads MBS 50-75 bp wider on prepayment wave
Credit :Aaa 25-40 bp wider; Baa 300-1,000 bp widerHigh yield and EMG lose as much as 20 points in somesectors
ASSET ALLOCATION RECOMMENDATION
Dollar overweight
Curve steepeners, short duration posture
Long securitized sectors
Short credit: long energy firms and energy-producing sovsShort energy-dependent industries (e.g. airlines)
Dollar underweight
Initially curve steepeners, then moving to flatteners; long du-ration and then switching to short-duration postureLong agencies and ABS; short MBS and creditFavor energy producers and non-cyclicals, while shedding en-ergy-dependent credits and cyclicals
Stay long dollar
Curve steepeners, then short durationUnderweight all spread product; restrain rebound trade im-pulse
Modest ImpactScenario (70%)
Middle East CrisisDue to:
a) U.S. Led Attack on Iraqb) Arab Street Rises
Probability: 70%-80%Horizon: 1-2 years
Probability Tree for Scenario I: Middle East Crises

Case 1
Page 14
SeriousImpact (25%)
Case B
Catastrophic ImpactScenario (5%)
Case C
MARKET IMPACT
GDP Short-term growth derailed; Long-term growth unaffectedMonetary/Fiscal Policy No actionInflation No effectFund Flows No effectFX Currency of affected country vulnerable to 1-5% depreciationEquity Major equity markets initially down 10-15%, recover in 3-6 wksNew Origination Liquidity tapers off slightly (securitized) to moderately (credit sec-
tors)Curves Rally in front-end by 20-50 bp; intermediate sector stays within 15-
20 bp range around pre-attack yields, flatten shortly; long-end yields10-30 bp higher; yield curves flatten 2-4 wks after incident
Spreads Agencies unaffected, w/ marginal bias to tightenMBS 5-15 bp wider on heightened vol/prepayment riskShort-term credit markets operate normally; term credit mkts preferhigher-quality namesCredit Aaa, Aa 5-20 bp wider; A 10-25 bp wider; Baa 20-50 bp widerHigh yield (off 3-5 points); EMG (off 2-7 points)Credit mkts begin to improve in 1-2 mo, assuming no more attacks
GDP Slower global growth; U.S., Europe, Japan may enterrecession
Monetary/Fiscal Policy Central banks ease; accommodative fiscal policyInflation Inflation in check, potential deflation as global agg. demand fadesFund Flows DecreaseFX Currency of affect country 5-10% depreciationEquity Drop 15-25%New Origination Close for 1-3 months before restarting; tier II CP may stallCurves Short-dated rally first (25-100 bp); long-dated sector rallies
25-50 bp
Spreads Agencies and supras remain safe havensMBS 20-30 bp wider on higher vol and prepayment riskABS 20-50 bp wider
Credit: Aaa and Aa (20-30 bp wider); A and Baa could widen50 bp to several hundred depending on sector/issuerHigh yield and EMG lose 5-15 points
GDP Depression, paralysisMonetary/Fiscal Policy Deploy all policy tools available; swing toward protectionist, national-
security oriented politicsInflationFund Flows International trade flows plunge; globalization set back
1-2 decadesFinancial System Markets closed for some time; non-affected areas open to low vol-
ume; global settlement/clearing systems impairedFX Currency of affected country loses 10-25%Equity Close for extended interval: lose 25-50% or moreNew Origination Origination halts 3 months to 1 year; CP market suffers prolonged
seizureCurves Short-dated treasuries soar; with lag, long end rallies due to scar-
city of alternativeBonds Except for Treasuries, agencies, and supras, bonds trade on price
basisSpreads Credit: A 1,000-1,500 bp wider
Global default rate could be 15% (Europe/Asia) and 20%-25% inU.S.; bankruptcies top Great Depression rateSecuritized sectors fare better than corporates, but segments ofABS, MBS, and CMBS not immune
Altern. Investments Gold, real estate, tangible stores of value soar
ASSET ALLOCATION RECOMMENDATION
Reduce duration
Reduce spread sector exposure in cash and derivativemarketsIf terrorist attack was isolated incident, then reverse coursewith 1-2 weeks(e.g., add duration and spread exposure)
Maximum defense for 1-2 months, with additions of high-quality exposureWith mkt stabilization and no evidence of recurrence, con-sider “rebound” trade through spread sectors
Focus on 100% capital preservation; avoid “bottom fishing”because knock-on effects difficult to predict and could belong lasting
Modest ImpactScenario (70%)
Case A
Terrorist Attack Due to:
A) Car Bomb/Homicide BombersB) 9/11 ReduxC) WMD Attack
Probability: 70%-80%Horizon: 1-2 years
Probability Tree for Scenario II: Terrorist Attack

Case 1Page 15
Sixth Global Fixed IncomeCapital Markets/Investment Management Workshop/Retreat
July 20-24, 2002Aspen, Colorado
I. MIDDLE EAST CRISIS:PROBABILITY OF AN EVENT IN 1-2 YEARS = 70%-80%
Base Scenario: A Middle East crisis leading to a major and sustained shock in world oilprices develops due to one or a combination of the following factors:
a) U.S.-Led Attack on Iraq:
i. The invasion succeeds but unleashes waves of political unrest in the Middle Eastthat prove far more difficult and costly to contain than anticipated. Results inU.S./Western oil embargo by some or all Middle Eastern exporters.
ii. Iraq employs weapons of mass destruction (WMD) against U.S. troop concen-trations, Israel, or oil production and shipping in the Persian Gulf. Slows themilitary campaign against Iraq and raises the economic, military and diplomaticcost of engineering a regime shift. Complicates the task of cleaning up after thewar and creating a more peaceful regional order.
iii. The U.S. experiences unexpected early setbacks in the invasion leading to loss ofsupport from regional allies, causing supply line disruptions and depriving theU.S. of potential staging areas for next phases of the invasion. In the worst case,due to effective use of WMD, the U.S. invasion bogs down and the U.S. is caughtin a morass and/or abandons the invasion.
iv. The invasion destabilizes the region such that the U.S. cannot win the peace inIraq or neighboring countries. This could take the form of extended, expen-sive, and dangerous military occupation of one or more countries in theregion. It could result in oil embargoes from individual states or persistentsupply disruptions.
b) Further Deterioration of Israel/Palestine Crisis (and/or a U.S.-led Invasion ofIraq) Provokes Arab Street to Rise Against Regional Leaders:
i. Could result in the overthrow of one or more of the Saudi, Jordanian, Syrian, orother regional regimes
ii. Could provoke a broader political, diplomatic and/or military crisis than theU.S. and its allies are able to contain, leading to sustained disruption of oilproduction and transportation in the region

Case 1Page 16
Sixth Global Fixed IncomeCapital Markets/Investment Management Workshop/Retreat
July 20-24, 2002Aspen, Colorado
Middle East Crisis Scenario Effects• Political: A Middle East crisis as outlined above would have severe political conse-
quences that would hurt the global economy:
– Loss of Credibility: Since the Gulf War in 1991, the U.S. has enjoyed a highdegree of credibility for its capacity to project military force. There is everyreason to expect success in a new war against Iraq. Should the use of WMD slowthe invasion and/or result in an even less stable regional order, global percep-tions of the U.S. government’s capacity to project force to protect key globalinterests may diminish substantially.• Arguably, the misapplication of massive military force to resolve a compli-
cated geopolitical problem in Vietnam caused such a blow to U.S. credibility.• Such an outcome could embolden potential adversaries and rivals of the U.S.
and NATO, leading to an upsurge of low intensity guerilla and terroristconflicts around the globe.
• U.S.-NATO and/or U.S.-Europe infighting could negatively affect Westernunity and limit the effectiveness and perceived legitimacy of the exercise ofU.S. diplomatic and military power
• The risks associated with potential rogue state attacks and with majorregional conflicts such as China/Taiwan and India/Pakistan would requirerecalculation by market players.
– U.S. Political Weakness: The Bush administration could suffer a sharp drop inU.S. political support and enter a period of political malaise, hurting its abilityto inspire market confidence and to run a coherent fiscal policy.
• Economic: Since the Arab-Israeli conflict of October 1973 (Yom Kippur War), it’sbecome axiomatic to predict oil price shocks each time tensions rise in the MiddleEast. True, an oil price shock could occur. But perhaps even worse than the pricefluctuation of a capricious commodity such as oil, business and consumer confi-dence throughout much of the world would be dented. Such conditions could leadto another global recession.
– Japan and emerging-market Asia would suffer from both of these effects: theIMF projects a 0.4%-0.9% loss in GDP growth for Asian EMG oil importingcountries due to every permanent $5.00 per barrel increase in crude oil prices.

Case 1Page 17
Sixth Global Fixed IncomeCapital Markets/Investment Management Workshop/Retreat
July 20-24, 2002Aspen, Colorado
– Non-Arab oil exporters, such as Russia, Venezuela, Ecuador, Indonesia, Nigeria,and Mexico, stand to profit from higher oil prices, though the slowdown inglobal demand would still be detrimental as those countries strive to createbroader-based export sectors and to generate greater domestic demand.
Potential Market Effects and Associated Probabilities:Middle East CrisisIn the event that a Middle East crisis scenario does take place in the next 1-2 years, hereis our best guess at the range and probability of market effects:
• Modest Impact Scenario (70%): A temporary oil price shock sending Brent Crudeto $40 per barrel for 3-6 months is the most likely crisis outcome. Knock-on effectswould include slower global growth marked by a delayed pickup in domesticdemand and investment in the U.S. and Europe, as well as slower export growthin Asia. Overall inflation rates would pick up in oil importing countries. Centralbanks would be over a barrel, trapped between a tightening impulse to fend offinflation and an easing disposition to compensate for possible recession. Thedollar likely would gain by 5%-10% as the safe-haven currency of choice. Globalequity markets would drop (10%-20%) in the initial phase of the crisis but wouldlikely recover within 1-3 months. After first strengthening on the flight-to-qualityshift by asset managers, bond prices would fall in the presence of higher inflationexpectations. We envision few effects for capital market liquidity or the commer-cial paper market under this scenario. The securitized spread sectors would farereasonably well, with only minor initial spread expansion (5-10 bp), if at all. Amarch toward recession would slap all credit sectors, with investment-gradesectors widening by 10 bp (Aaa/AAA’s) to 250 bp (weak Baa/BBB’s). High-yieldand emerging-market debt would fall by 3-7 points. At Diamond, we’d recom-mend a dollar overweight, curve steepener, short duration, long securitizedsectors, and short credit sector portfolio posture. Naturally, we’d want to be longenergy firms and energy-producing sovereigns and short energy-dependent in-dustries such as airlines.
• Serious Impact Scenario (25%): More serious oil supply disruptions send BrentCrude to $50+ for a year or more. The U.S., Europe, and Asia plunge back intorecession for at least a year. Inflation accelerates dramatically in oil importingcountries. Focusing on recession first, central banks initially ease and then tighten asinflation vigilance wins out over worries about economic growth. The dollarweakens by 15% on global recession, trade and budget deficits, and inflation threats.

Case 1Page 18
Sixth Global Fixed IncomeCapital Markets/Investment Management Workshop/Retreat
July 20-24, 2002Aspen, Colorado
U.S. capital flows reverse as non-U.S. investors stay in their regional markets. Allequity markets fall sharply (15%-20%) in the first few weeks of the crisis and take sixmonths or more to stabilize at lower levels. Yield curves are whipped around: rallyingon recession and easings, selling off on inflation and central bank reversals. Primarymarkets slow. Secondary market liquidity suffers. MBS widens by 20-30 bp onincreased volatility. The credit markets sustain a frontal assault from recession, withspreads leaping from 20 bp for Aaa/AAA’s to up to 500 bp for problematiccrossovers. The high-yield corporate and emerging-debt markets drop 10-20 points.For Diamond, we’d suggest a dollar underweight, curve steepener then flattener,long duration then short duration, long agencies and ABS, short MBS and creditportfolio position. Again, we’d favor energy producers and non-cyclicals, whileshedding energy-dependent and cyclicals.
• Catastrophic Impact Scenario (5%): Persian Gulf oil supplies are seriouslydisrupted for 1-2 years, perhaps in a last-ditch stand by Iraq, and U.S. and G-7resources are diverted to war and reconstruction needs. Oil prices soar to $50-$75 for the first 3-6 months and then remain in the $40 range for 1-2 yearsafterward. Investors lose confidence in the U.S. economy, reversing capital flowsand forcing the current account deficit into balance rapidly as imports dry upand inflation accelerates. European and Asian economies also enter prolongeddeep recessions. On balance, the dollar appreciates slightly (3%-5%) on lowerU.S. import demand and its role as the preferred global currency store of value.Of course, the Swiss franc soars. Global stock markets plummet by 30%-40%and remain depressed for 1-2 years. Major central banks decide to look the otherway on inflation, easing sharply. The Federal funds rate falls to 50 bp. Yieldcurves steepen and remain steep as risk aversion herds asset managers into the1-5 year areas of major yield curves. The primary markets afford access only toAaa/AAA rated securitized and credit issuers. Secondary liquidity suffers for allspread sectors. The MBS sector widens 50-75 bp in OAS on a massive prepay-ment wave. Credit spreads lift off in a standard recession configuration: Aaa/AAA’s rise 25-40 bp; Baa/BBB’s zoom 300-1000 bp. High-yield corporate andemerging-market debt loses as much as 20 points in some sectors. In such anenvironment, Diamond should play dollar long, curve steepeners, long thenshort duration (with a lag of up to a year), and underweight all spread product.The natural impulse to pursue the rebound trade should be restrained. Thegreatest virtue would be patience. An energy price calamity of this magnitudewould likely have unforeseen, secondary consequences that might not becomemanifest for six months or longer.

Case 1Page 19
Sixth Global Fixed IncomeCapital Markets/Investment Management Workshop/Retreat
July 20-24, 2002Aspen, Colorado
II. TERRORIST ATTACK:PROBABILITY OF AN EVENT IN 1-2 YEARS = 70%-80%
Base Scenario: A successful attack–or campaign–against New York, Washington, Lon-don, or another key world political or financial center. The range of possibilities for theterrorist attack scenario spans from small homicide bombings to the use of weapons ofmass destruction:
a) Car Bomb/Homicide Bombers: In many parts of the world and throughouthistory, terrorist organizations have opted for a larger number of smaller scalebombing attacks, kidnappings, assassinations, or other forms of terrorism. Europemay be even more susceptible than the U.S. to such attacks, but both arevulnerable. The macroeconomic and market impacts of a sustained “smaller”terror campaign certainly would be less serious than in the “WMD Attack” or “9/11 Redux” scenario variations.
b) 9/11 Redux: A conventional attack on the scale of the 9/11 disaster in New York oranother key city, while hopefully less devastating than the “WMD Attack” variation,would have many of the same results. It would also force the public to view massiveterrorist attacks as an ongoing reality and to adjust their market and macroeconomicexpectations accordingly.
c) WMD Attack: Between 2002 and approximately 2005, the most serious attackcould take the form of a dirty nuclear bomb detonation in a major American city(New York, Washington), the deployment of a chemical weapon (recall the nervegas attack in the Tokyo subway system), or biological weapon (the U.S. already hassustained an anthrax attack; the release of other agents in to the food or watersupply could occur). Sometime after 2005, and hopefully well beyond 2010, aconventional nuclear weapon might be used. The legendary Warren Buffet haseven suggested the likely use of a nuclear weapon against New York or Washingtonat some point over the next 50 years. Such attack(s) would lead to enormous lossof life, catastrophic property damage, and the likely incapacitation of the targetcity and most businesses operating within it, destroy much of the financial center(if in New York), divert national economic and political resources indefinitely,terrorize the general population, and seriously disrupt world financial markets foran indefinite period of time.

Case 1Page 20
Sixth Global Fixed IncomeCapital Markets/Investment Management Workshop/Retreat
July 20-24, 2002Aspen, Colorado
III. THE EASY WESTERN WIN
Alternate Scenario: Once identified and targeted, the terrorists are tracked down. Theiractual resources are few when facing a determined and focused police action. All are killedor brought to justice in short order with minor collateral damage. Nations and states allover the Islamic world correctly perceive that the terrorists are at least as great a dangerto them as to the Western world. Unusual alliances emerge in local law enforcementagencies that help apprehend the terrorists, coupled with severe and certain justice thatserves to dissuade potential followers.
The terrorist attempt to embroil the West into a conflict with the broader Islamic worldfails. Technological advantages of the Western nations come through, and a relativelyquick return to the status quo follows. The initial market acknowledgement of thisscenario would be a glorious upward burst in equity valuations, business/consumerconfidence, and credit market performance.
First-Order Effects• Politically, renewed terrorist attacks could generate one of three outcomes depend-
ing on their severity and the government’s response:
– The attacks produce a salutary, uniting effect in the West, increasing publicsupport for and confidence in government efforts to fight terrorism and protectthe economy
– Renewed attacks succeed at making the government look ineffective and baffled,reducing public confidence in the Bush administration and in the U.S.’s abilityto lead a successful war on terrorism. The NATO alliance begins to unravel. InAsia, Japan, South Korea, and Taiwan begin to pursue political agendas that callfor less reliance on the U.S. military shield.
– In a quest for general civilian safety, some populations would become moreprone to subscribe to right wing and even fascist ideology.
In each case, pressure likely would mount for the U.S. to take direct military actionagainst state sponsors of terrorism, especially Iraq.
• Economically, renewed terrorist attacks would increase pressure on governmentbudgets due to recovery costs, increased defense and security spending, the contin-gent liability on the government of terrorist insurance for businesses and specific

Case 1Page 21
Sixth Global Fixed IncomeCapital Markets/Investment Management Workshop/Retreat
July 20-24, 2002Aspen, Colorado
industry sectors, and other factors. U.S. budget constraints likely would weaken thedollar, add to inflationary and interest rate pressures, and reduce investment inflows.
Potential Market Effects and Associated Probabilities:Terrorist AttackThe market effects of a terrorist attack(s) are difficult to predict—hence our expressionin terms of wide ranges—and even more uncomfortable to contemplate. Should such anattack(s) occur, the following “general” market responses would follow, in our opinion.Note: we did not try to forecast potential market responses down to the intra-asset classlevel. For example, certain elements of the equity and credit markets might rally (defense,large blue chips, consumer non-cyclicals), while other sectors would be even moreadversely affected (airlines, autos, other cyclicals, B-rated high-yield corporates). Thesefiner forecasts should be supplied by our asset managers and sector analysts in asubsequent, more-detailed analysis. As a first approximation for further discussion,however, we have included general recommended portfolio responses by Diamond toeach terrorist scenario.
• Modest Impact Scenario (70%) Associated with Car Bomb Type-Incidents/Homicide Bombings: Long-term global economic growth prospects are unaf-fected, but short-term growth is derailed for 1-2 quarters as consumer andexecutive confidence briefly wilts. There is no effect on inflation. The Fed andother major central banks likely do not react. Settlements and clearing areunaffected. The currency of the affected nation would be vulnerable to a 1%-5%temporary slide. Major equity markets trade off initially by 10%-15%, but thenrecover completely within 3-6 weeks. Short-dated treasuries in major governmentbond markets immediately rally by 20-50 bp as the classic “flight-to-quality, safe-haven trade” is executed. Intermediate treasury obligations stay within a 15-20 bprange around pre-attack yields. Long-dated treasury obligations see a 10-30 bpyield expansion as investors rotate to the front end of yield curves. Two weeks toa month after the terrorist incident, yield curves flatten as investors regainconfidence and seek incremental yield. The liquidity of the spread markets tails offslightly (securitized sectors) to moderately (credit sectors). Agency spreads re-main largely unaffected, with a marginal bias to tighten on the “safe-haven effect.”MBS spreads move out by 5-15 bp OAS on heightened volatility and prepaymentrisk concern. The short-term credit markets operate normally. The long-datedcredit markets exhibit a preference for higher quality. Credit spreads expand inrelation to credit quality; the highest quality credits (Aaa/AAA’s and Aa/AA’s)

Case 1Page 22
Sixth Global Fixed IncomeCapital Markets/Investment Management Workshop/Retreat
July 20-24, 2002Aspen, Colorado
suffer a 5 bp-20 bp upward bump: single-A’s (10 bp-25 bp), Baa’s (20 bp-50 bp),high-yield corporates (3-5 points), and emerging-market debt (2-7 points) follow.Credit markets begin to recover within 1-2 months assuming no additional follow-up attacks. If this scenario occurs, then the best immediate debt portfolio strategy forDiamond would be maximum short-term defense: reduce duration, credit, andspread-sector exposure in the cash (if possible) and the derivatives markets. If ourevaluation suggested that the terrorist attack was an isolated incident unlikely to berepeated over the short term, then our debt asset mangers should consider reversingcourse within 1-2 weeks: add duration and spread sector exposure.
• Serious Impact Scenario (25%), Consequence of 9/11 Redux: Economic growthwould slow in most regions. A more serious outcome might be that the U.S., Europe,and Japan enter recession for 2-3 quarters. Inflation not only stays in check, butelements of deflation appear as global aggregate demand suddenly shrinks. Majorcentral banks ease. Central governments boost fiscal spending. The currency of theaffected nation would be vulnerable to a 5%-10% slide. Equity markets trade downsubstantially (15%-25%) and stay depressed for six months or more. Again, govern-ment bonds (treasuries, agencies, supranationals) remain a safe haven, with short-dated bonds (1-5 years) faring best, rallying by 25-100 bp on correct anticipation ofeasing. With a lag, long-dated treasuries also rally by 25-50 bp as the primary marketsfor spread-product effectively close for 1-3 months before restarting in a sequencesimilar to the phased reopening of the credit markets after the Great Spread SectorCrash of August-October 1998. As shown in late 2001, the Tier II commercial papermarket may stall. All spreads widen, and secondary liquidity falls in spread-sectormarkets. Like the 2-month period immediately after 9/11, agency spreads likelysuffer the least damage among spread sectors and even could tighten slightly asinvestors search for some spread-sector participation. MBS would widen 20-30 bpon heightened volatility and prepayment risk. ABS would participate in the gener-alized expansion of credit spreads, potentially adding 20-50 bp of spread premium.Credit spreads would detonate, with high-yield corporate and EMG bonds losing5-15 points. Investment-grade credits would be fortunate to add only 20-30 bp inAaa/AAA’s and Aa/AA’s. Single A-rated and Baa/BBB’s could gap by 50 bp to severalhundred bp depending on the industry and the issuer. Diamond’s optimal debtportfolio strategy would be maximum defense for 1-2 months, with situationaladditions of high-quality positions that sustained some collateral market damage.With capital market stabilization and if our evaluation suggests no immediateattacks of similar magnitude, then our portfolio should consider the “rebound

Case 1Page 23
Sixth Global Fixed IncomeCapital Markets/Investment Management Workshop/Retreat
July 20-24, 2002Aspen, Colorado
trade” through the addition of spread-sector exposures. Given our mandate topreserve capital, our asset managers should avoid trying to be too early.
• Catastrophic Impact Scenario (5%) Stemming from the Use of WMD: We did nottry to differentiate among weapons of mass dislocation (e.g., a dirty nuclear bombthat renders a 10-block grid of Manhattan or London uninhabitable for 2-5 years, aconfined nerve gas attack in a single subway station, the use of biological agents suchas anthrax and smallpox, or the detonation of a suitcase nuclear weapon). The actualeconomic and market effects naturally would hinge on the severity of the attack. Thesingular use of nerve gas in a subway system would have an immediate but atransitory impact akin to our modest impact scenario above. A broad disseminationof anthrax might function like the serious scenario outlined above. Here, we addressthe worst case: the use of a weapon of mass dislocation (property damage andbusiness disruption effects running into the hundreds of billions of dollars, withfortunately little immediate loss of human life) and a weapon of mass destruction(tens of thousands of fatalities/casualties, property damage/business interruptionupwards of a trillion dollars). This worst-case outcome could lead to a depressionand even a paralysis of the global economy. International trade flows plunge; theprocess of globalization is set back by 1-2 decades. A major swing toward protection-ist, national-security oriented right wing politics would likely result in many nations.Central banks and central governments would deploy all monetary and fiscal toolsto resurrect the global financial system. In particular, infrastructure and defensespending would proceed at a wartime pace. Markets could be closed for an extendedinterval. Markets in non-affected regions would reopen more quickly to very thintrading. Global settlements and clearing could sustain a prolonged setback. Uponthe general reopening of global markets, the currency of the affected nation wouldbe subject to a 10%-25% loss in value. There would be a major selloff in financialassets. Equities might retreat by 25%-50% or more. Short-dated treasuries (1-3years) in the U.S. and European markets would soar, with yields collapsing todouble-digit JGB standards. With a lag, longer-dated treasury obligations also wouldrally given the scarcity of alternative choices, central bank easing, and deflation. Thecommercial paper market might suffer a prolonged seizure. Spread-sector origina-tion would be halted for an extended period of 3 months to a year. The corporate andindividual bankruptcy rate would skyrocket and probably top the Great Depressionof the 1930s given higher systemic leverage. The global default rate would run fromthe 15% area (Europe and Asia) to 20%-25% (U.S.). Except for treasuries, agencies,and surpranationals, most bonds would be trading on price basis for an extended

Case 1Page 24
Sixth Global Fixed IncomeCapital Markets/Investment Management Workshop/Retreat
July 20-24, 2002Aspen, Colorado
period. On a spread basis, A-rated paper easily might be trading at spreads in excessof 1,000-1,500 bp. Securitized debt (ABS, MBS, and CMBS) would fare better thanstandard corporate debt. But segments of the ABS market (home equity loans,manufactured housing, and even credit cards) and CMBS markets would not beimmune. Gold, some real estate (think log cabins in Idaho), the Swiss franc, andother tangible assets would be the preferred store of value. At Diamond, our assetmanagement goal would be 100% capital preservation. With markets largely non-operational in the immediate aftermath of such a catastrophic incident, Diamondand other market participants would not likely be able to implement any defensivemeasures. Portfolio prices, especially for spread products, would be estimates for anextended period. Index comparisons might be meaningless for a while. “Bottom-fishing expeditions” should be avoided. Like the U.S. and Europe in the 1930s andJapan in the 1990s, the knock-on effects would be difficult to predict and could belong lasting.
Hopefully, none of these awful geopolitical risks will ever materialize. But our team verymuch supports your new approach at Diamond. You have forced us to contemplate somevery unpleasant possibilities. Please let us know if you would like us to extend our analysisto other geopolitical risks.
Maureen

Case 1Page 25
Sixth Global Fixed IncomeCapital Markets/Investment Management Workshop/Retreat
July 20-24, 2002Aspen, Colorado
To: Sarah Campbell July 14, 2002From: Dennis Toffler, Senior Portfolio ManagerRe: Historical Capital-Market Reactions to Geopolitical EventsCC: Maureen Patrick, Alvin Pearle, Samuel Weaver
Along with nearly a dozen portfolio manager colleagues at Diamond, we scoured aplethora of sources for guidance in capital market reactions to geopolitical events.Initially, we were struck by the lack of academic perspectives: the economics and financeprofession operate mainly within conventional boundaries. Alternatively, foreign policythink tanks have put forth insightful research on this matter. For example, the Councilon Foreign Relations published an excellent book, Stress Testing the System: Simulatingthe Global Consequences of the Next Financial Crisis, by Roger Kubarych. Still, our analysiswas formed mainly by reviewing the historical record.
We readily concede methodological caveats. The structure of the global capital marketshas shifted markedly since many of these events. However fascinating, the response of theU.K. equity market to the arrival of the Great War on August 1, 1914, may not be thatinstructive for the global capital markets of the early 21st century.
Here’s what we think that we know. An outright military campaign against Iraq, whileeconomically adverse, would probably not be as unsettling to long-term investorconfidence as would continued terrorist attacks on non-military targets. If investors drawthe conclusion that the human and physical capital employed to generate profits are notsafe, then a higher equity risk premium would become required. As a result, fewerprojects would clear this higher investment hurdle rate, slowing the rate of innovation.Moreover, the need for contingencies planning would increase redundancy.
Although the equity risk premium discounted by the market has risen from 3% to 5%since 9/11, it is difficult to attribute this rise solely to geopolitical risk. The 2% jump inthe equity risk premium is almost as high as that reverse engineered in current U.S.equivalent terms to replicate the 33% U.K. stock market correction following theSeptember 1941 London bombings, assuming the U.K. market was fairly valued before-hand. Arguably, Germany in the mid-20th century was a more imposing foe than today’sterrorist organizations—at least the enemy was external and identifiable.
While external terrorists abound, the current situation has an added complexity because theU.S. is a nation of immigrants. Geopolitical risks have the potential to develop from within

Case 1Page 26
Sixth Global Fixed IncomeCapital Markets/Investment Management Workshop/Retreat
July 20-24, 2002Aspen, Colorado
as well as from without. In addition, internal and external reactions must be taken intoaccount as the U.S. manages this war on terror. For example, there are roughly 7 millionMuslims living in the U.S., about a quarter of whom are of Middle-Eastern Arabic descent.
Regardless of how the scenarios ultimately unfold, the market is apt to revert to firstprinciples when assessing and coping with geopolitical risk. Just as the fixed-incomemarkets may reduce duration or gravitate to higher-quality credits to reign in risk duringtimes of heightened uncertainty, equities will react in a similar manner. For instance, thetime-weighted duration of stock market earnings equals the price/earnings ratio. Whenperceived risk rises, the market favors lower P/E ratio stocks. All else being equal, equityinvestors gravitate to stocks with slower EPS growth, higher earnings predictability,higher dividend yields, and lower betas.
In the short run, the market could become preoccupied with geopolitical risks. But overthe longer term, the market will continue to weigh earnings on a scale calibrated forinterest rates and a few other determinants such as economic and profitability growth.Assuming the doomsday scenario does not materialize, coping with geopolitical risksshould not deter the market from its long-term tendency to rise.
For your further review, I am enclosing an appendix of charts from which I sketched abroad analysis. But before delving into the data, I’d like to offer a contrarian suggestion.
After immersing myself in these historical data since September 11, 2001, I have come totwo conclusions. First, many crisis incidents are wholly unpredictable. Second, otherthan an “event-related ripple” of variable magnitude and duration, academic researchsuggests that other factors better explain security prices, namely the classical macroeco-nomic analysis and credit fundamentals. For example, in “The Effects of News on BondPrices: Evidence from the United Kingdom, 1900-1920” (The Review of Economics andStatistics, May 1996), Elmendorf and Hirschfeld conclude that “much of the variabilityin bond prices cannot be explained by news” (p. 344). Therefore, I suggest that we try toignore the uncertain gravitational pulls of geopolitical events.
At your behest, I also tried to review the historical record to learn how major institutionscoped with geopolitical risks in the past. Other than some observations in publicationssuch as Forbes, Businessweek, and The Economist, I am not sure that our searches revealedmuch. Much like now, forecasting capital market parameters during the Great War was,at best, conjecture. For instance, a Forbes article from the end of April 1917 (2 weeks after

Case 1Page 27
Sixth Global Fixed IncomeCapital Markets/Investment Management Workshop/Retreat
July 20-24, 2002Aspen, Colorado
the U.S. entered World War I) chronicled bank managers’ views on the trajectory of short-term interest rates, supply of “government loans,” and overall investment posture. Surpris-ingly, their insights ring of the same themes currently circulating in the financial press: theimportance of liquidity during bouts of geopolitical uncertainty, increased governmentborrowing during wartime, and the purported outperformance of higher-quality credits.
But enough anecdotal evidence, now onto the hard data.
I. HISTORICAL PERSPECTIVE POST-9/11
Per a well-known Ned Davis Research study dated September 11, 2001 (Figure A1), theU.S. Dow Jones Industrial Average fell by 4.34% on average during 41 separate crisisperiods, subsequently rebounding by 7.80% over the ensuing 126 trading days.
Of course, not all crises and market reactions are equal. The U.S. invasion of Grenada onOctober 24, 1983, paled in comparison with Pearl Harbor on December 7, 1941. And ofthese 41 episodes, 11 are purely U.S. events, such as Truman’s upset victory in 1948,Eisenhower’s heart attack in 1955, Nixon’s resignation in 1974, and the Oklahoma Citybombing in 1995. Another six events cannot really be classified as geopolitical: the U.K.currency crisis in 1992, Orange County default in 1994, the Asian Contagion in 1997, andRussia/LTCM in 1998. Accordingly, we extracted these 15 events and decomposed theaverages, observing a similar pattern.
Next, we ranked the crises in terms of severity. The beginning of World War II, the KoreanWar, and the Cuban Missile Crisis occupy the upper echelon of major geopolitical events forthe capital markets. In retrospect, Sputnik, the Russian invasion of Afghanistan, the U.S.invasion of Grenada and Panama, and the Gorbachev Coup can be characterized as class-Bevents. We rated the Falklands War and the U.S. embassy bombings in Africa as class-C events.
Initial capital market reaction to U.S. political events precipitated an average 8.80%(median 6.54%) decline in the Dow, followed by a 9.98% mean recovery during thefollowing 126 trading sessions. Interestingly, the mean reaction to geopolitical crisestranslated into a milder 3.99% decline or 2.25% median market selloff.
Just as initial market responses often prove misguided, proper hindsight is imperativewhen evaluating capital market reactions. In fairness, we are just approaching the neededperspective for September 11, 2001.
Case 1Page 28
Sixth Global Fixed IncomeCapital Markets/Investment Management Workshop/Retreat
July 20-24, 2002Aspen, Colorado
As of June 30, 2002, all major equity markets reported losses vis-à-vis September 11, 2001,with the Dow’s 3.77% decline counterbalanced by a 3.98% drop in the French CAC and-1.89% return by the FTSE (only the DAX managed a positive return, 2.55%). Twofactors may be at work: a) the underlying geopolitical risk revealed by the WTC attack(i.e., global terrorism) has not been fully contained; b) additional exogenous shocks wereintroduced, namely a crisis in U.S. corporate governance.
The U.S. dollar’s initial appreciation on the major crosses during the fourth quarter of2001 (in part a manifestation of flight-to-quality maneuvers) withered by the second halfof 2002. With respect to the euro, the U.S. dollar has lost 7.90% since September 11, 2001,reversing a 2.65% appreciation during the fourth quarter of 2001. Similarly, the greenback’s10.25% gain vis-à-vis the yen (as of December 2001) morphed into a meager 0.04%cumulative appreciation as of June 30, 2002.
The U.S. curve behaved in classical fashion during the initial weeks following the WTC attack:the 10-year rallied 26 bp from 4.84% on September 11 to 4.58% by September 30 and 2-yearyields sank to 2.84% as the Fed’s rapid injection of liquidity dominated the first phase of post-9/11. Accordingly, the curve steepened as the 2-30s spread pushed out 66 bp to 258 bp.
Yet the rally in major non-U.S. bellwethers was less pronounced during the second halfof September 2001. By December 2001, G-7 (ex-Japan) 10-year government bond yieldsleapt 7-20 bp from September 11 troughs (of course, JGBs rallied 5 bp). Nine monthslater, the 10-year rally proved especially ephemeral, with the U.S. 10-year note only 2 bplower on June 30 (at 4.82%) than on September 11, 2001 (4.84%).
This mild global government rebound is further evident in the Lehman Brothers GlobalTreasury (ex-U.S.) Index post-9/11, which produced a 3.97% annualized total returnfrom September 11, 2001 through June 2002—a mere half of this index’s average 8.27%annual return. Overall, investment-grade bond markets in the U.S. (6.36% total return)outpaced Europe (4.92%) and Asia (1.96%).
Finally, nearly all global spreads edged wider (aside from U.S. agencies and MBS) duringthe weeks following September 11. In particular, U.S. agencies and securitized sectorsmanaged double-digit spread compression over the ensuing nine months. The LehmanAgency Index OAS tightened 11 bp, to 33 bp. MBS option-adjusted spreads declined43 bp, to a 48 bp OAS on June 30, 2002 versus 9/11, whereas ABS came in 13 bp, to76 bp, and CMBS spreads fell 22 bp, to 98 bp OAS. As very familiar to our team at
Case 1Page 29
Sixth Global Fixed IncomeCapital Markets/Investment Management Workshop/Retreat
July 20-24, 2002Aspen, Colorado
Diamond, credit has been less constructive, albeit due more to non-geopolitical shocks.U.S. investment-grade credit spreads lofted 14 bp vis-à-vis 9/11 to 170 bp OAS, and high-yield spreads climbed 53 bp, to 768 bp. Though to a lesser extent, European (out 15 bp)and Asian (out 4 bp) investment-grade credit spreads are also wider.
II. CAPITAL MARKET PARAMETERS DURING CRISIS EPISODESAND WARS: THE LONG VIEW
Currency perturbations are always at the forefront of crises. We examined the supposed“safe haven” status of the U.S. dollar following geopolitical crises/military engagements inthe post-Bretton Woods world, for which the Arab Oil Embargo of 1973 provided the firsttest. Our examination suggests that the dollar’s initial performance during crisis eventsconfounds the “flight-to-quality” hypothesis. For instance, during the first month follow-ing a geopolitical crisis, the Fed’s trade-weighted dollar index declined 1.21% on average,with a higher median decline (1.61%). The dollar’s immediate reaction to major geopoliti-cal events is ambiguous: the dollar index gained 3.53% during the first month of the ArabOil Embargo; lost 2.55% in the first month following the Gulf War Ultimatum (December24, 1990); and appreciated only 0.15% one month after the WTC attack. Similarly,international political/economic incidents, on average, exerted a meager 0.06% downwardpressure on the dollar within one month. More importantly, the dollar index consistentlygained during the ensuing 6 months only after episodes of high geopolitical risk, appreci-ating a maximum 4.86% by the fourth month of the crisis. Though simple averages acrossindependent events can belie short-term currency movements, we do not discern aconvincing case of dollar appreciation immediately following crisis episodes.
Despite our limited sample of full-scale wars, the dollar’s appreciation within 4 months ofthe conclusion of each major U.S. military engagement is noteworthy: 4.49% after theVietnam Conflict; 8.17% following the Gulf War and 5.13% after the U.S. began bombingAfghanistan. In other words, timing the dollar after military conflicts may be crucial.
Next, we looked at the reaction of long government bonds in the U.S., U.K., France, Germany,and Japan during a broad set of geopolitical events from 1901 through June 2002, using dailyyields when possible. Briefly, we found that long yields fall (as expected) on economic crisesand geopolitical crises, but generalizations across episodes can be misleading.
Beginning with the Gulf War (the military conflict for which we have the best dailydata), global bellwether bond yields display mixed responses. For instance, four

Case 1Page 30
Sixth Global Fixed IncomeCapital Markets/Investment Management Workshop/Retreat
July 20-24, 2002Aspen, Colorado
months after Iraq invaded Kuwait (and U.S. intervention seemed imminent), U.S. 30-year yields had fallen 1.78%, mirrored by 20-year JGBs (1.71% decline in yield) and 30-year Gilts (-6.30%). In contrast, French and German long treasuries actually sold off,with French yields increasing by 4.36% and German yields climbing 2.73%.
In military terms, the Gulf War was relatively short-lived, but it it provides the mostrecent lesson about how financial markets sort out winners and losers. The decade-longVietnam Conflict may present better historical parallels for this war on terrorism. In thiscase, the Gulf of Tonkin incident on August 2, 1964 (and subsequent U.S. air strikesagainst North Vietnam) provoked little change in the U.S. 30-year (0.48% increase inyields one month after August 2, 1964) and non-dollar bellwether yields increased duringthe initial reaction month. Though the markets missed the significance of U.S. involve-ment in Vietnam, a global bond market rally coincided with the conclusion of thisconflict. One month after the North Vietnamese capture of Saigon in 1975, 30-year U.S.Treasury yields fell 3.25%, matched by a 1.58% decline in U.K. Gilts and followed by a3.49% fall in Bund yields and a 2.26% reduction in JGB yields within 2 months. Of coursein fairness, the global economy was still gripped in 1975 by the aftermath of severerecession. This underscores the frequent difficulty in sorting out the effects of multiplefactors in determining the value of financial assets.
How about credit spreads? Regrettably, non-U.S. spread series are rare, so we’ll confineour analysis to Moody’s Baa industrial spreads since 1919. Corporate spreads react quitedifferently to explicit military conflicts from episodic bouts of geopolitical/economicuncertainty. For instance, Baa industrial spreads tightened (at some point) during thefirst four months of each major U.S. military campaign and fell on average 4.81% by thefourth month. Aside from the uniqueness of U.S. involvement in Vietnam, further spreadcompression was evident through 6 months (a cumulative 3.74%, on average), 12months (8.42%), and 24 months (11.89%) after initial military action in each conflict.Wartime economic production suggests one possible explanation, whereby accelerateddefense-induced spending benefits industrial credits. Secondly, military success in theGulf War and Afghanistan bombings seemed imminent almost immediately, such thatthe actual invasion provided a harbinger of the conflict’s resolution.
Fortunately, political/economic events are more frequent than wars, but it is harder toestimate their ultimate magnitude and time-to-resolution. In addition, bouts ofpolitical uncertainty rarely accompany the defense spending characteristic of wartime.Accordingly, corporates tightened much less during geopolitical incidents (on average

Case 1Page 31
Sixth Global Fixed IncomeCapital Markets/Investment Management Workshop/Retreat
July 20-24, 2002Aspen, Colorado
a mere 0.23% one month later), and two-thirds of political crises precipitated spreadexpansion. Moody’s Baa industrial spreads widened an average 13.34% during the firstmonth following a political/economic crisis (albeit the median widening was only4.83%). More importantly, spreads continued to widen for four months after the initialmarket reaction.
Moving into total return space, bonds generally underperformed equities both duringmilitary conflicts and in the 12 months following the conclusion of war. We mined ourglobal bond and equity databases for the longest total return series for the U.S., U.K.,France, Germany, and Japan back to the first U.S. conflict, the War of 1812. (Yes, we didresearch the Hundred Years’ War, but to little avail). The thesis of government bondoutperformance over equities during wartime has debatable traction. In the U.S.,government bonds lagged equities two-thirds of the time, on average by 21.48%. In fact,government bonds trailed equities during every major U.S. war in the 20th century,underperforming on average by an annualized 15.58%. U.K., French, and Japanese seriesdisplay a similar trend, as bonds lagged equities during episodes of military conflict.Interestingly, global government bonds displayed a better record versus local equities oneyear prior to military engagement than during and after wartime. This suggests that theanticipation of armament may be more powerful for the “flight-to-quality” trade than theactual conflict resolution.
Please let us know if you would like us to dive deeper into the data. A concluding thought:we found this exercise fascinating. As a result, we may be better equipped to deal withfuture crises. But our reading of history also shows that there’s no substitute forindependent analysis of each event. Although there are many market similarities acrosscrises, there are also variations. We shouldn’t be guided by this data to pursue mindlesslyan automatic portfolio response based on these long-term averages of market reactionsto past crises.
Dennis

Case 1Page 32
Sixth Global Fixed IncomeCapital Markets/Investment Management Workshop/Retreat
July 20-24, 2002Aspen, Colorado
To: Sarah Campbell July 15, 2002From: Alvin Pearle, Head of Diamond Risk ManagementRe: Aspen Offsite: Recommended Action StepsCC: Maureen Patrick, Dennis Toffler, Samuel Weaver
As the chief risk manager for Diamond Asset Management since 1999 and as a creditanalyst and debt asset manager since 1973, I’ve been thinking about geopolitical risks forthree decades. Unfortunately, I’m not sure that I have any bulletproof advice to renderto you and our senior management colleagues at Aspen.
Below, I’ve included several more slides for your presentation. First, I’d like to commenton several points raised in the prior e-mails on this topic.
a) The sclerotic behavior of the global capital markets in 2002 can be attributed to manyfactors: corporate misbehavior, bogus accounting, the threat of trade protectionism, stilllofty P/E ratios, and concern about economic/earnings growth during the second half of2002. In my view, this high state of geopolitical risk constitutes the single biggest check.Osama bin Laden has not been brought to justice. Al Qaeda remains on the loose. Thetimetable to conclude the Afghanistan, or should we say Western Pakistan campaign,looks indeterminate. The U.S. seems to be preparing for a war with Iraq. A calming, nevermind a resolution, of West Bank tensions looks over the horizon. How can the capitalmarkets possibly regain their jaunty step until some of these uncertainties recede?
b) We are “market people,” not political scientists. We do not and never will have anyoverwhelming geopolitical expertise. However tempting and with all due respect toour economists and strategists who frequently freelance in the political area, weshould refrain from major investment decisions based on our internally derivedexplicit or implicit assumptions about geopolitical outcomes. For example, we reallydon’t have a very good handle on the denouement of the apparently planned U.S./Iraq conflict in 2003.
c) We can and must overcome our current geopolitical deficiency. Just as we previouslycontemplated adding a demographer and a meteorologist to our staff, we shouldseriously consider adding a full-time geopolitical strategist to our staff. Given thepart-time nature of requisite demographic and meteorological input, we concludedthat a part-time consulting relationship made more economic sense. For the nextseveral years, the urgency of this rapidly changing geopolitical environment arguesthough for a full-time specialist at Diamond. Historically, I am not sure that we everplaced great stock in the prognostications of outside experts. Without listening to

Case 1Page 33
Sixth Global Fixed IncomeCapital Markets/Investment Management Workshop/Retreat
July 20-24, 2002Aspen, Colorado
them on a regular basis, it’s hard to gauge their independence and to detect theirbiases, which seem to be an occupational hazard. As previously stated at our 2001offsite by you, Sarah, “The path to portfolio performance during this decade maywell run right through an accurate geopolitical evaluation.” Before we hire the nextcredit analyst and foreign exchange modeler, I think Diamond would be betterserved by getting some daily help on the geopolitical risk side.
d) The list of potential crisis events supplied by Samuel Weaver is very thorough.Perhaps both for internal political correctness and given the sheer unpredictability,we didn’t attempt to forecast history-altering events such as revolutions, coups, andassassinations. Unfortunately, history teaches that some of these events will materi-alize and affect the market. And perhaps it’s just me, but we seem to take the arrayof current geopolitical risks as a given. What are the root causes? What are theobjectives of the agents of geopolitical risks? Why exactly are Muslim fundamental-ists so annoyed with the West and especially the U.S.? Why has the U.S. become sucha target of animosity in some cultures?
e) Although our teams attempted to be globally comprehensive, the data still have avery large U.S. bias. For example, I wonder what happened to the French equitymarket after Dien Bien Phu on May 8, 1954? How did the Argentine equity marketperform when Juan Peron fell and the military later seized power in 1955? Whathappened to Chilean and South American equity markets when Allende wasassassinated in 1973? I could go on and on. I think that we need to undertake a moredetailed study. There may be some additional lessons that we are missing.
f) The sketched scenarios lack precision. Perhaps thinking too much of the oil shocksin 1973-1975, 1979, and 1990, we seem to over-emphasize swings in the price of oil.In reality, the realization of each scenario would unleash a slew of forces, somecountervailing, acting on the global financial system. I would feel better with moredefinitive global and regional economic forecasts for each scenario.
g) I don’t have any confidence in the subjective probabilities assigned to variouspotential geopolitical events. For example, the Korean peninsula may stay status quoover the next 20 years, suddenly re-unify like Germany in 1989, slowly re-unify overa 5-10 year period-the preferred course by the South Korean government, or windup in a 1950-1953 conflagration. If we are totally honest, we are literally just makingup probabilities of each outcome. As shown so often in the past, like the surprise (atleast to the West) at the fall of the Shah of Iran in 1979 and the U.S.S.R. in 1989, biggeopolitical turns are regular events.
h) Given that we cannot define every geopolitical risk and assign accurate probabili-ties, should we just throw up our hands and forget about considering these risks

Case 1Page 34
Sixth Global Fixed IncomeCapital Markets/Investment Management Workshop/Retreat
July 20-24, 2002Aspen, Colorado
in our portfolio processes? At one level, a cynic might suggest that our decision-making would just as well be served by regularly attending the annual cosmologyconferences in Aspen and pondering the origin and fate of the universe and itsimplications for our investment policies. I naturally think such a laissez-faire routewould be a large mistake. While we cannot predict every twist and turn in history,I believe that an understanding of the broad flows can enhance our decision-making. At present, only a hermit without media access would fail to appreciatethe arrival of cloudier geopolitical risk in the early stages of this decade. From myvantage point, these clouds may be overhanging the markets for years. Perhapsbefitting my role as our risk manager, this environment naturally reinforces mygeneric and continuous recommendation that we steer a very conservative port-folio course over the next several years. We’d rather be wrong for missing the bigcredit rallies than get blasted by a bout of severe spread turbulence. After all,looking back to 1997, how many early warning tremors do we really need?
i) Naturally, some of our gymnastic portfolio managers, perhaps convinced of theirclairvoyance, will insist on fx, curve, and spread timing expeditions launched onthe basis of their interpretations of FT headlines and talking heads on the media.For example, in late July 2002, can we seriously doubt the intent of the Bushadministration to wage a preemptive strike against Iraq’s development of weaponsof mass destruction? If so, why do we have any exposure to lower-quality credits,long-dated maturities, and peripheral currencies of oil-importing nations? Canwe pretend to such portfolio agility that we can shift our positions around intime to prevent damage from a messy, Gulf War-style campaign? I think not.And more important, I don’t think that there’s any such thing as “geopoliticalrisk insurance.” How do we economically offload credit exposure once theheadlines hit? We can’t. As we learned during the last four months of 1990, weare stuck with the exposure.
j) Our analysis would benefit from the consideration of some basic principles. First,what do our clients, individual investors and plan sponsors, expect from us underthese various geopolitical risk scenarios? Will Diamond be expected to outperforman index, preserve capital, or have maximum liquidity to accommodate skittishclients that might prefer cash? We would do well to spend time with our clients toget their views; otherwise, I am not sure how we can possibly plan without a concreteset of portfolio objectives. Second, would our analysis and reaction contingencies beenhanced by classifying and unbundling geopolitical risks into systematic andidiosyncratic risks? Methodologically, such an approach might help us betterconsider whether we should try to hedge if possible.

Case 1Page 35
Sixth Global Fixed IncomeCapital Markets/Investment Management Workshop/Retreat
July 20-24, 2002Aspen, Colorado
k) Finally, I am convinced that our organization would benefit from a consultation with anindustrial or military psychologist to gain a better grip on the mindset of decision-makersduring and immediately after a major crisis. Looking back at our experience as a NewYork-headquartered firm in the days and weeks after September 11, 2001, severalobservations stand out. Although our mid-town Manhattan premises were spared directloss, a low-level depression permeated our firm. Work hours decreased. Many employeessought counseling. Insomnia was common. Some people lost a lot of weight. Moreoften, some people gained weight. Irritability became common. Although everyoneprofessed sympathy for the victims and gratitude to be spared, our annual title andcompensation process was especially grueling. For our part, we did little during the firstweek after September 11. We checked positions, prices, and settlements as well as theTV. A relief rally was likely. But we jumped in about a week late. Our top leadership anddivision leadership were superb. But some of our local managers wilted, providing littleguidance to their teams. Like an aircraft commander, I think that we should developan organizational checklist of action steps to take immediately after a crisis. Thischecklist should be amended regularly. There’s clearly work to be done. For example,how many of us have all the home telephone numbers and e-mail addresses for ourteams and senior leadership nearly a year after September 11?
With these caveats, I believe that you should offer the following advice to our seniormanagement colleagues in Aspen:
EVALUATING GEOPOLITICAL RISKS
Especially with portfolio globalization, formally incorporate into investment decision-making process
How?• Hire full-time geopolitical analyst and subscribe to political risk consulting service• Develop contacts with State Department and CIA• Read publications such as Foreign Affairs and non-local media• Insist that senior asset managers visit major regions at least annually and spend time
with local central bankers• Never invest in a country without a prior visit by some member of our investment staff• Like military planners, conduct detailed scenario analyses drills. For example, what
would Diamond Asset Management do if North Korea invaded South Korea orIndia/Pakistan have a nuclear exchange?

Case 1Page 36
Sixth Global Fixed IncomeCapital Markets/Investment Management Workshop/Retreat
July 20-24, 2002Aspen, Colorado
Global Debt Portfolio Responses: No Single Formula• At first, if possible, implement “risk aversion trades”• Check clearance and settlements• Recognize that the ensuing reality usually won’t be as bad as some of the initial
conjectures• Cover long futures/options positions in the 10-year maturity sector and beyond;
hedge spread risks if possible• Buy short-duration Treasury paper (2-year neighborhood)• Buy high-quality (Aa/AA above) credit paper on spread expansion; U.S. agencies
and ABS especially attractive• Regional debt managers should overweight local currency debt• Depending on the geopolitical event, investigate the following trades after 2-4 weeks
– Extend duration: buy the long end of yield curves– Buy downtrodden peripheral currencies– Add lower-quality spread product– Buy “war industry” securities
Crisis Management Checklist
Preparation• Discuss portfolio objectives with clients if crisis occurs• Rigorous semi-annual disaster recovery drills• All managers should have employee home telephone numbers, e-mail and fax
addresses stored at offsite locations• Mandatory annual presentation to all employees on action steps to take in the event
of a crisis
If a Crisis Hits• Check employee safety, building and system integrity• Senior management should strive to over- communicate: hold daily conference
calls, put out intra-day e-mail bulletins to all employees as information becomesavailable
• Division and line management should spend extra time talking to all direct reports• Try to avoid major portfolio decisions, other than to reduce risk• Consult with all clients

Case 1Page 37
Sixth Global Fixed IncomeCapital Markets/Investment Management Workshop/Retreat
July 20-24, 2002Aspen, Colorado
The Medium-Term Aftermath• Sustain high level of communications with employees and clients• Depending upon the magnitude of the event, be aware that organizational psychol-
ogy will not return to normal for 6 months to a year. Be alert for team members whowould benefit from counseling.
• Gradually restore investment decision-making processes
Recommendations• Begin each investment policy committee with an overview of geopolitical risk• Develop a “threat radar system” with rankings• Using capital market history as a starting point, develop contingency plans and
rehearse• Senior asset managers should broaden their inputs:
– Even pure U.S. asset managers would benefit from yearly visits to Asia andEurope
– Extend international political readings– Join/attend sessions by international political/economic experts
Sarah, you will undoubtedly want to fine-tune some of these recommendations. I lookforward to hearing your views at Aspen. Please let me know if there are any additionalways that I can help your presentation.
Alvin

Case 1Page 38
Sixth Global Fixed IncomeCapital Markets/Investment Management Workshop/Retreat
July 20-24, 2002Aspen, Colorado
CASE QUESTIONS
1) How will history define the early 21st century: a period of intermittent crisis or, likethe early 20th century, a prelude to a vast restructuring of the geopolitical landscape?
2) Have the global capital markets become more susceptible to changes in geopoliticalrisks? If so, should financial institutions devote more resources to considering theimplications of geopolitical risks?
3) Has Sarah’s team defined too many or too few geopolitical risk scenarios in this case?How should institutions identify geopolitical risks? How can institutions do a betterjob of evaluating geopolitical risks?
4) Should asset managers strive to assign subjective probabilities to geopolitical risks?If so, how?
5) Especially in the case of awful geopolitical events such as the use of weapons of massdestruction, do ex ante economic and market forecasts have any reliability?
6) Do you concur with the likely market effects under the multiple geopolitical riskscenarios presented in this case? What are the potential geopolitical risk surprises?
7) Given their unpredictability, should asset managers just ignore geopolitical risks? Ifnot, how can asset managers incorporate geopolitical risks into a coherent portfoliostrategy? Do equity markets do a better job than debt markets in dealing withgeopolitical risks? Is there any such thing as geopolitical risk insurance?
8) Has Sarah’s team adequately considered the psychological consequences for themarkets and her team of challenging geopolitical risks?
9) In a prolonged era of heightened geopolitical risks, will the global financial systembe characterized by regular instabilities with attendant major valuation swings? If so,should asset managers generally aim for more conservative performance targets?
10) Do you think Sarah’s colleagues at the Aspen offsite will be comfortable with herrecommendations? If you were Sarah, what additional research would you like to see?


Figure A1. U.S. Equity Reactions to Various Crises, 1916 through June 2002
Cumulative Dow JonesIndustrial Performance
Crisis Date Range After Reaction Dates* (%)Grade Event Market Reaction Dates Gain/Loss (%) 22 Days 63 Days 126 Days
Geopolitical CrisisA Pearl Harbor 12/06/1941-12/10/1941 -5.94 1.79 -2.29 -10.04A Korean War 6/23/1950-7/13/1950 -11.99 7.70 13.68 15.96A Cuban Missile Crisis 10/19/1962-10/27/1962 -0.74 10.89 14.48 15.94A Gulf of Tonkin Incident 8/2/1964-8/7/1964 -1.42 1.20 5.90 4.24A Arab Oil Embargo 10/18/1973-12/05/1973 -17.86 7.95 4.61 7.03A Gulf War Ultimatum 12/24/1990-1/16/1991 -4.29 12.03 14.47 16.00A Attack on World Trade Center and Pentagon 9/11/01-9/30/01 -7.89 5.98 11.35 11.98B Fall of France 5/09/1940-6/22/1940 -17.25 -0.80 2.23 6.97B France Falls at Dien Bien Phu 3/13/1954-5/8/1954 6.51 1.86 6.05 8.21B Sputnik 10/03/1957-10/22/1957 -9.88 2.45 2.22 4.07B Soviet Tanks Invade Prague 8/20/1968-10/28/1968 7.77 0.94 -1.32 -5.13B Iranian Revolution 1/16/1979-2/11/1979 -1.58 0.60 5.85 2.54B U.S.S.R. Invasion of Afghanistan 12/24/1979-1/03/1980 -2.25 6.80 0.95 -0.62B U.S. Invades Grenada 10/24/1983-11/07/1983 -2.73 5.96 5.88 -4.90B Invasion of Panama 12/15/1989-12/20/1989 -1.88 2.71 -3.88 -0.80B Gorbachev Coup 8/16/1991-8/19/1991 -2.36 2.92 5.60 4.30C Easter Rebellion in Ireland 4/14/1916-6/30/1916 -2.24 -0.47 1.80 18.64C U.S. Bombs Cambodia 4/29/1970-5/26/1970 -14.41 11.65 15.89 20.55C Falkland Islands War 4/01/1982-5/07/1982 4.32 -5.71 -6.34 4.33C U.S. Bombs Libya 4/15/1986-4/21/1986 2.56 -3.80 0.45 0.86C U.S. Embassy Bombings in Nairobi and Dar es Salaam 8/07/1998-8/10/1998 -0.27 -8.72 -6.69 1.41
Political/Economic Crisis1 U.S. Stock Market Crash of 1907 10/28/1929-10/29/1929 -11.73 4.85 8.00 18.881 Truman Upset Victory 11/02/1948-11/10/1948 -8.34 -0.19 3.89 0.901 Eisenhower Heart Attack 9/23/1955-9/26/1955 -6.54 -1.53 5.58 2.631 JFK Assasination 11/21/1963-11/22/1963 -2.89 6.84 10.06 14.681 Kent State Shootings 5/04/1970-5/14/1970 -4.17 1.50 5.64 10.641 Nixon Resigns 8/9/1974-8/29/1974 -15.50 2.12 1.32 -3.781 Hunt Silver Crisis 2/13/1980-3/27/1980 -15.92 0.45 11.35 23.071 U.S. Stock Market Crash of 1987 10/02/1987-10/19/1987 -34.16 8.02 14.47 17.341 World Trade Center Bombing 2/26/1993-3/1/1993 -0.46 3.17 2.71 3.831 Orange County, CA Bankruptcy & Financial Crisis 12/06/1994-12/31/1994 2.36 0.91 4.05 13.271 Oklahoma City Bombing 4/19/1995-4/20/1995 0.55 4.73 8.49 8.272 Bloody Sunday (N. Ireland) 11/21/1920-11/30/1920 3.99 -11.86 -0.74 0.162 Earthquake in Tokyo 9/1/1923-9/15/1923 -4.10 -0.25 0.78 7.422 Riots and Labor Strike in France 5/6/1968-5/26/1968 -2.10 0.91 -0.76 4.302 ERM U.K. Currency Crisis 9/14/1992-10/16/1992 -5.98 2.07 4.37 4.662 Poison Gas Attack in Tokyo Subway 3/20/1995-3/21/1995 -0.27 3.07 8.93 15.762 Terrorist Attack in Paris Metro 7/25/1995-7/26/1995 -0.16 -1.62 1.17 8.472 Mexico - Tequila Crisis 12/19/1994-12/31/1995 34.99 2.00 8.20 7.052 Asian Stock Market Crisis 10/07/1997-10/27/1997 -12.44 6.84 8.82 19.402 Russian LTCM Crisis 8/18/1998-10/08/1998 -11.28 11.13 14.35 21.10
OverallMean -4.34 2.61 5.16 7.80Median -2.73 2.07 5.58 7.03Geopolitical RiskMean -3.99 3.04 4.33 5.79Median -2.25 2.45 4.61 4.30Political RiskMean -4.71 2.16 6.03 9.90Median -4.13 2.03 5.61 8.37High Geopolitical Risk (A)Mean -7.16 6.79 8.89 8.73Median -5.94 7.70 11.35 11.98Medium Geopolitical Risk (B)Mean -2.63 2.60 2.62 1.63Median -2.25 2.45 2.23 2.54Low Geopolitical Risk (C)Mean -2.01 -1.41 1.02 9.16Median -0.27 -3.80 0.45 4.33U.S. Political/Economic Crisis (1)Mean -8.80 2.81 6.87 9.98Median -6.54 2.12 5.64 10.64Non-U.S. Political/Economic Crisis (2)Mean 0.30 1.36 5.01 9.81Median -2.10 2.00 4.37 7.42
* Days = Market days.Sources: Ned Davis Research and Lehman Brothers Research.
Crisis Code Key: A = High Geopolitical Risk; B = Medium Geopolitical Risk; C = Low Geopolitical Risk; 1 = U.S. Political Crisis; 2 = Non-U.S. Political Crisis.

Figure A2. Global Capital Market Parameters, September 11, 2001, through June 30, 2002
Change (bp)12/31/01 6/30/02
vs vs9/11/01 9/30/01 12/31/01 1/31/02 2/28/02 3/31/02 4/30/02 5/31/02 6/30/02 9/11/01 9/11/01
U.S. Treasury Bellwethers (%)2-Year 3.52 2.84 3.05 3.15 3.05 3.73 3.22 3.21 2.82 -47 -705-Year 4.33 3.79 4.34 4.37 4.18 4.83 4.41 4.36 4.05 1 -2810-Year 4.84 4.58 5.04 5.03 4.87 5.42 5.09 5.05 4.82 20 -230-Year 5.44 5.42 5.48 5.43 5.42 5.82 5.60 5.62 5.52 4 810-Year TIPS 3.25 3.14 3.55 3.43 3.23 3.31 3.11 3.06 3.07 29 -1830-Year TIPS 3.37 3.45 3.45 3.46 3.30 3.40 3.26 3.18 3.08 8 -292s-10s Spread (bp) 132 174 199 188 182 169 187 184 200 67 682s-30s Spread (bp) 192 258 243 228 237 209 237 241 270 51 78
Non-Dollar 10-Year Bellwethers (%)Canada 5.23 5.34 5.36 5.44 5.34 5.79 5.62 5.50 5.43 12 20France 4.94 4.90 5.06 4.98 5.04 5.31 5.21 5.25 5.00 13 7Germany 4.85 4.79 4.99 4.90 4.96 5.24 5.12 5.16 4.94 14 9Italy 5.17 5.15 5.24 5.17 5.23 5.49 5.37 5.39 5.16 7 -1Japan 1.42 1.41 1.37 1.48 1.53 1.39 1.37 1.39 1.31 -5 -11U.K. 4.90 4.87 5.05 4.88 4.98 5.29 5.19 5.25 5.03 16 13Australia 5.63 5.53 6.01 6.01 5.95 6.32 6.08 6.26 6.06 38 43Korea 6.35 6.04 7.01 7.12 6.87 7.28 7.23 6.90 6.68 67 33
World Equity Indices(in local currency terms) Change (%)
Dow Jones Industrial Avg 9,606 8,848 10,022 9,920 10,106 10,404 9,946 9,925 9,243 4.33 -3.77S&P 500 1,093 1,041 1,148 1,130 1,107 1,147 1,077 1,067 990 5.08 -9.40NASDAQ Composite 1,695 1,499 1,950 1,934 1,731 1,845 1,688 1,616 1,463 15.04 -13.69TOPIX 1,058 1,023 1,032 972 1,014 1,060 1,082 1,120 1,025 -2.46 -3.14Korean Composite 541 480 694 748 820 896 842 796 743 28.33 37.40Hang Seng Stock 10,417 9,951 11,397 10,725 10,483 11,033 11,498 11,302 10,599 9.41 1.74Kuala Lumpur Composite 691 615 696 719 709 756 794 742 725 0.80 5.05Nikkei 225 10,293 9,775 10,543 9,998 10,588 11,025 11,493 11,764 10,622 2.43 3.20Australian All Ordinaries 3,183 2,988 3,360 3,404 3,359 3,363 3,300 3,325 3,163 5.55 -0.63U.K. FTSE 100 4,746 4,903 5,217 5,165 5,101 5,272 5,166 5,085 4,656 9.93 -1.89German DAX (Xetra) 4,274 4,308 5,160 5,108 5,039 5,397 5,041 4,818 4,383 20.75 2.55French CAC 40 4,060 4,079 4,625 4,462 4,463 4,688 4,463 4,275 3,898 13.91 -3.98Russian RTS 206 180 260 288 291 351 386 391 354 26.16 71.63Argentine Merval 272 244 295 439 398 436 388 318 351 8.46 28.75Brazilian Bovespa 10,828 10,636 13,578 12,721 14,033 13,255 13,085 12,861 11,139 25.39 2.87Mexican Bolsa 5,531 5,404 6,372 6,928 6,734 7,362 7,481 7,032 6,461 15.21 16.81
Appreciation of USDSelected Currency Rates (per USD) Relative to Curr (%)
Japanese Yen 119.42 119.56 131.66 134.68 133.36 132.73 128.54 124.22 119.47 10.25 0.04Euro* 0.913 0.911 0.890 0.859 0.869 0.872 0.901 0.934 0.991 2.65 -7.90British Pound* 1.476 1.474 1.455 1.411 1.417 1.426 1.458 1.455 1.534 1.49 -3.73Canadian Dollar 1.565 1.579 1.593 1.589 1.602 1.595 1.568 1.528 1.517 1.80 -3.04Australian Dollar* 0.522 0.491 0.509 0.508 0.518 0.533 0.538 0.567 0.563 2.41 -7.40New Zealand Dollar* 0.433 0.407 0.417 0.416 0.422 0.440 0.447 0.481 0.487 3.94 -11.13Danish Krone 8.135 8.161 8.348 8.650 8.550 8.533 8.257 7.957 7.492 2.62 -7.90Swedish Krona 10.495 10.686 10.481 10.652 10.429 10.359 10.251 9.743 9.160 -0.14 -12.73Brazilian Real 2.664 2.670 2.311 2.413 2.364 2.325 2.361 2.513 2.818 -13.27 5.76Mexican Peso 9.515 9.514 9.158 9.148 9.119 9.035 9.395 9.645 9.947 -3.76 4.53Thai Baht 44.40 44.51 44.21 44.06 43.67 43.50 43.24 42.34 41.51 -0.43 -6.51South Korean Won 1,283.5 1,304.5 1,313.5 1,311.5 1,318.0 1,327.0 1,294.1 1,221.5 1,201.3 2.34 -6.40Indonesian Rupiah 9,090 9,715 10,400 10,313 10,151 9,825 9,330 8,830 8,713 14.41 -4.15
Appreciation of EURSelected Currency Rates (per Euro) Relative to Curr (%)
Japanese Yen 109.04 108.97 117.11 115.73 115.93 115.70 115.75 116.05 118.44 7.40 8.62
Appreciation of GBPSelected Currency Rates (per GBP) Relative to Curr (%)
Euro 1.617 1.618 1.635 1.642 1.631 1.636 1.619 1.558 1.547 1.14 -4.33Japanese Yen 176.30 176.27 191.51 190.01 189.02 189.26 187.41 180.78 183.21 8.63 3.92
* U.S. dollar/non-U.S. currency.

Figure A3. Option-Adjusted Spreads (bp) for Select Lehman Indices, September 10, 2001, through June 30, 2002
Change in OAS (bp)12/31/01 6/30/02
vs vs9/10/01 Sep 01 Dec 01 Jan 02 Feb 02 Mar 02 Apr 02 May 02 Jun 02 9/10/01 9/10/01
Multiverse 70 74 69 69 68 62 63 62 68 -1 -2Global Aggregate 43 43 42 42 42 39 40 36 39 -1 -4Global Governments (Excl U.S.) 4 4 1 3 2 2 2 2 2 -2 -2U.S. Universal 131 138 121 117 114 104 107 106 117 -10 -14U.S. Aggregate 82 83 78 76 74 68 71 64 70 -5 -13U.S. Agency 43 36 40 38 37 35 32 35 33 -4 -11U.S. MBS 91 73 71 68 62 51 50 46 48 -20 -43U.S. ABS 89 97 95 88 86 80 76 76 76 6 -13U.S. Investment-Grade CMBS 119 132 122 114 107 99 95 97 98 3 -22U.S. Investment-Grade Credit 156 185 164 161 165 157 172 149 170 8 14144-A: Investment Grade 196 233 205 205 200 190 204 200 230 9 34Eurodollar 90 97 93 91 96 92 102 87 99 3 10U.S. Corporate High Yield 715 899 728 701 731 627 626 666 768 13 53Emerging Markets 773 880 630 603 502 469 480 572 729 -143 -44Pan-European Aggregate 25 28 18 21 22 21 22 22 25 -6 0Euro-Aggregate 23 26 20 21 21 20 21 21 24 -4 1Pan-European Credit 76 89 73 74 78 73 78 77 91 -3 15Pan-European High Yield 1113 1373 1133 1125 1218 1056 1017 985 1054 20 -59Asian Pacific Aggregate 6 6 6 5 6 6 5 5 5 1 0Asian-Pacific Credit 29 29 33 33 39 39 34 33 33 4 4

Figure A4. A History of Long-Term Monthly U.S. Interest Rates During U.S. and World Military Conflicts1800 through June 30, 2002
7.06%1/1800
1997Asian
Contagion
Gulf War1990-91
1987 U.S. equity
crash
1986Oil pricecollapse
1980Basis for
web created
1975Era of financial futures opens
1974ERISA enacted
1973Collapse
ofBretton Woods
1966U.S. credit
crunch
1944Bretton Woods
conference
1933U.S. leaves
gold standard
1925Florida real
estate bubble
1914Federal Reserve
Board opens
1907U.S. panic
1903"Rich Man’s Panic"
1890U.S. bank panic
1896U.S. bank panic
1884U.S. bank panic
1998Great
SpreadSectorCrash
5.41%9/28/01
1816Second Bank of
the U.S. granted a20-yr charter
10/73OPEC quadruples
oil prices
1836Beginning of
"Free Banking Era"for 3 decades
5.28%5/66
Mexican War1846-48
1873U.S. bank panic
0.0
2.0
4.0
6.0
8.0
10.0
12.0
14.0
16.0
1800 1810 1818 1830 1840 1850 1860 1870 1880 1890 1900 1910 1920 1930 1940 1950 1960 1970 1980 1990 2000
Yield (%)
0.0
2.0
4.0
6.0
8.0
10.0
12.0
14.0
16.0
War of 1812
Civil War1861-65
Sources:1800-1819 Federal Government Bonds1820-1839 New England Municipals1840-1859 Federal Gov’t Average New Issues1860-1899 Highest Grade Corporate Bonds (Rail Road)1900-1976 30-year Prime Corporates1977-Present 30-year Bond Yield
World War I1914-18
Korean War1950-53
Vietnam War1965-73
World War II1939-45
Great Depression1930-39
Mean 5.26%
Min 2.45% 2/1/1947
Max 14.87% 9/1/81
Spanish American War: 1898
Persian GulfWar: Jan 1991-Feb 1991
* Shaded areas denote military conflicts since January 1800.
Figure A5. A History of Long-term U.S. Interest Rates and Thirty-Two U.S. Business Cycles1800 through June 30, 2002
1873U.S. bank panic
Mexican War1846-48
5.28%5/66
1836Beginning of
"Free Banking Era"for 3 decades
10/73OPEC quadruples
oil prices
1816Second Bank of
the U.S. granted a20-yr charter
5.41%9/28/01
1998Great
SpreadSectorCrash
1884U.S. bank panic
1896U.S. bank panic
1890U.S. bank panic
1903"Rich Man’s Panic"
1907U.S. Panic
1914Federal Reserve
Board opens
1925Florida real
estate bubble
1933U.S. leaves
gold standard
1944Bretton Woods
conference
1966U.S. credit
crunch
1973Collapse
ofBretton Woods
1974ERISA enacted
1975Era of financial futures opens
1980Basis for
web created1986
Oil pricecollapse
1987 U.S. equity
crash
Gulf War1990-91
1997Asian
Contagion
7.06%1/1800
0.0
2.0
4.0
6.0
8.0
10.0
12.0
14.0
16.0
1800 1818 1840 1860 1880 1900 1920 1940 1960 1980 2000
Yield (%)
0.0
2.0
4.0
6.0
8.0
10.0
12.0
14.0
16.0
War of 1812
Civil War1861-65
Sources:1800-1819 Federal Government Bonds1820-1839 New England Municipals1840-1859 Federal Gov’t Average New Issues1860-1899 Highest Grade Corporate Bonds (Rail Road)1900-1976 30-year Prime Corporates1977-Present 30-year Bond Yield
World War I1914-18
Korean War1950-53
Vietnam War1965-73
World War II1939-45
Great Depression1930-39
Mean 5.26%
Min 2.45% 2/1/1947
Max 14.87% 9/1/81
* Shaded areas denote military conflicts since January 1800.
5.51%6/30/02
War onTerror
on 9/11
5.51%6/30/02
War onTerror
on 9/11

Figure A6. Historical Total Returns of U.S., U.K., French, German and Japanese Bonds and Equities During Periods of War, 1812 to June 2002
Total Return (%) 1 Year Before Annualized Total Return (%) During Total Return (%) 1 Year AfterStart End U.S. U.K. France Germany Japan U.S. U.K. France Germany Japan U.S. U.K. France Germany Japan
BondsWar of 1812 June 19,1812 Feb 17, 1815 4.87 -0.20 16.03 - - 4.88 2.39 9.32 - - 8.89 14.76 6.74 - -Mexican American War May 13, 1846 Feb 2,1848 5.41 5.99 9.26 - - 3.86 6.00 11.01 - - 5.73 -0.50 6.59 - -Crimean War March 27, 1854 Feb25, 1856 5.79 -5.14 -14.14 - - 3.05 3.06 9.77 - - 4.10 5.66 0.32 - -U.S. Civil War April 12, 1861 April 9,1865 1.36 0.26 3.39 - - 7.85 3.12 4.22 - - 5.30 -1.53 4.21 - -Franco Prussian War July 15,1870 Jan 28, 1871 3.95 3.41 7.41 - - 1.65 3.07 -40.42 - - 4.54 3.28 11.84 - -Spanish American War April 25, 1898 Dec 10, 1898 2.97 2.30 4.40 - 45.95 4.95 0.84 1.10 - 7.72 4.18 -6.46 -0.05 - 2.83
Boer War Oct 11,1899 May 31, 1902 3.71 -2.40 1.26 - 6.37 3.60 -0.56 3.41 - 6.09 2.39 9.09 -1.30 - 7.05Russo Japanese War Feb 8, 1904 Sep 6, 1905 2.73 6.61 0.76 - -10.05 3.12 4.24 4.31 - 18.30 2.47 -0.87 -0.54 - 1.90World War I Apr 6, 1917 Nov 11, 1918 2.92 4.85 2.35 - 3.21 3.47 -0.43 -1.61 - 4.69 -3.45 -11.81 0.20 - 1.66World War II Dec 7, 1941 Aug 14, 1945 3.44 11.99 16.80 4.93 5.18 3.16 4.61 4.47 4.66 4.80 3.16 14.61 -4.54 2.05 3.75Korean War Jun 25, 1950 Jul 27, 1953 4.49 -10.83 -1.77 6.26 6.46 -1.47 -0.31 5.08 5.73 5.64 12.86 16.34 5.68 3.33 1.70Vietnam Aug 4, 1964 Jan 27, 1973 2.32 -4.77 5.68 4.71 1.68 2.28 2.17 3.56 5.71 10.62 5.33 -14.52 -3.95 3.40 -10.20Arab Israeli War Jun 5, 1967 Jun 10, 1967 3.43 10.89 2.77 16.91 18.18 -31.64 -21.55 -15.93 1.69 7.10 1.34 -3.92 5.99 9.94 6.07Yom Kippur War Oct 6, 1973 Oct 25, 1973 4.47 -8.50 -2.63 -0.30 -0.99 10.43 51.65 2.81 16.96 -0.09 4.17 -18.29 -0.54 3.71 -3.51Falkland Islands Apr 1, 1982 May 7, 1982 11.35 10.49 8.53 12.07 10.11 11.02 10.93 28.34 6.48 -3.94 24.91 41.14 27.28 14.41 11.69Gulf War Jan 16, 1991 Feb 26, 1991 8.55 9.56 6.85 2.32 1.10 10.03 40.07 40.88 24.90 15.82 12.10 14.58 11.10 10.03 11.52War on Terror Sep 11, 2001 11.27 7.34 8.50 8.14 5.35 4.04 1.23 2.79 2.58 1.26 - - - - -
Average 4.88 2.46 4.44 6.88 7.71 2.60 6.50 4.30 8.59 6.50 6.13 3.85 4.31 6.70 3.13
EquitiesWar of 1812 June 19,1812 Feb 17, 1815 -3.97 -2.65 - - - 3.43 4.01 - - - -5.19 - - - -Mexican American War May 13, 1846 Feb 2,1848 -19.67 3.91 - - - 28.38 12.57 - - - 4.36 1.61 - - -Crimean War March 27, 1854 Feb25, 1856 -4.66 -0.37 - - - -10.31 3.24 - - - 9.72 7.58 - - -U.S. Civil War April 12, 1861 April 9,1865 30.13 6.52 - - - 18.95 5.43 - - - 9.56 5.35 - - -Franco Prussian War July 15,1870 Jan 28, 1871 6.41 0.45 - - - -1.59 9.97 - - - 15.43 4.13 - - -Spanish American War April 25, 1898 Dec 10, 1898 15.22 9.81 10.56 - - 34.36 5.79 9.83 - - 9.72 -2.28 6.56 - -
Boer War Oct 11,1899 May 31, 1902 25.09 0.57 8.15 - - 15.31 0.79 -1.60 - - -6.67 0.02 -0.69 - -Russo Japanese War Feb 8, 1904 Sep 6, 1905 -17.43 -0.96 2.56 - - 25.95 -0.86 16.40 - - 12.77 -5.17 5.46 - -World War I Apr 6, 1917 Nov 11, 1918 5.47 12.86 -1.36 - - 6.12 0.37 10.40 - - 21.24 6.62 18.56 - -World War II Dec 7, 1941 Aug 14, 1945 -8.27 33.28 169.21 10.22 2.06 21.71 13.53 6.00 5.14 7.85 11.36 17.55 114.66 3.23 -38.93Korean War Jun 25, 1950 Jul 27, 1953 36.81 -2.03 -4.96 93.54 -31.99 15.87 8.24 25.47 19.21 64.20 31.77 42.84 32.61 55.84 -10.11Vietnam Aug 4, 1964 Jan 27, 1973 24.05 13.08 -11.98 17.25 1.42 7.37 12.20 6.42 4.73 23.52 -14.02 -24.26 0.48 -16.26 -18.45Arab Israeli War Jun 5, 1967 Jun 10, 1967 7.09 -0.99 -7.65 -3.77 12.15 27.16 75.06 -3.39 -13.58 -7.72 13.36 51.20 17.95 52.01 6.70Yom Kippur War Oct 6, 1973 Oct 25, 1973 1.04 -5.51 1.51 -12.07 8.10 2.00 29.29 27.24 -91.76 14.35 -28.79 -54.88 -40.57 -16.36 -23.64Falkland Islands Apr 1, 1982 May 7, 1982 -13.07 11.78 -1.55 9.14 2.48 -2.22 1.20 -9.39 -8.51 4.61 61.18 49.81 35.45 45.33 25.28Gulf War Jan 16, 1991 Feb 26, 1991 -4.13 -9.81 -21.96 -14.67 -38.62 44.28 97.55 145.27 51.50 105.33 23.26 12.32 16.51 7.30 -20.25War on Terror Sep 11, 2001 -14.42 -17.41 -27.73 -29.25 -22.12 -12.74 -4.17 -9.55 -6.05 -4.87 - - - - -
Average 3.86 3.09 9.57 8.80 -8.31 13.18 16.13 18.59 -4.91 25.91 10.57 7.50 18.82 18.73 -11.34
Bond Outperformance over EquitiesWar of 1812 June 19,1812 Feb 17, 1815 8.84 2.45 - - - 1.45 -1.63 - - - 14.08 14.76 - - -Mexican American War May 13, 1846 Feb 2,1848 25.08 2.08 - - - -24.52 -6.57 - - - 1.37 -2.12 - - -Crimean War March 27, 1854 Feb25, 1856 10.45 -4.76 - - - 13.36 -0.17 - - - -5.62 -1.92 - - -U.S. Civil War April 12, 1861 April 9,1865 -28.78 -6.26 - - - -11.10 -2.31 - - - -4.26 -6.88 - - -Franco Prussian War July 15,1870 Jan 28, 1871 -2.45 2.97 - - - 3.24 -6.89 - - - -10.89 -0.85 - - -Spanish American War April 25, 1898 Dec 10, 1898 -12.24 -7.51 -6.15 - - -29.42 -4.96 -8.73 - - -5.54 -4.18 -6.61 - -
Boer War Oct 11,1899 May 31, 1902 -21.37 -2.98 -6.89 - - -11.71 -1.35 5.01 - - 9.06 9.07 -0.60 - -Russo Japanese War Feb 8, 1904 Sep 6, 1905 20.16 7.58 -1.80 - - -22.84 5.10 -12.08 - - -10.30 4.30 -6.00 - -World War I Apr 6, 1917 Nov 11, 1918 -2.55 -8.01 3.71 - - -2.66 -0.80 -12.01 - - -24.68 -18.43 -18.36 - -World War II Dec 7, 1941 Aug 14, 1945 11.71 -21.29 -152.41 -5.28 3.11 -18.55 -8.92 -1.54 -0.48 -3.06 -8.20 -2.94 -119.20 -1.18 42.69Korean War Jun 25, 1950 Jul 27, 1953 -32.32 -8.80 3.19 -87.28 38.45 -17.34 -8.55 -20.39 -13.48 -58.56 -18.91 -26.50 -26.93 -52.51 11.81Vietnam Aug 4, 1964 Jan 27, 1973 -21.73 -17.84 17.65 -12.55 0.27 -5.09 -10.03 -2.86 0.97 -12.89 19.35 9.75 -4.43 19.66 8.25Arab Israeli War Jun 5, 1967 Jun 10, 1967 -3.66 11.88 10.41 20.68 6.03 -58.80 -96.61 -12.54 15.27 14.82 -12.01 -55.12 -11.97 -42.06 -0.63Yom Kippur War Oct 6, 1973 Oct 25, 1973 3.43 -3.00 -4.14 11.78 -9.09 8.43 22.36 -24.43 108.72 -14.44 32.96 36.59 40.03 20.08 20.14Falkland Islands Apr 1, 1982 May 7, 1982 24.42 -1.30 10.08 2.93 7.63 13.24 9.73 37.73 14.98 -8.55 -36.27 -8.67 -8.17 -30.92 -13.59Gulf War Jan 16, 1991 Feb 26, 1991 12.68 19.37 28.81 17.00 39.72 -34.25 -57.48 -104.38 -26.60 -89.51 -11.15 2.26 -5.41 2.73 31.77War on Terror Sep 11, 2001 25.69 24.75 36.23 37.39 27.46 16.78 5.40 12.34 8.63 6.13 - - - - -
Average 1.02 -0.63 -5.11 -1.92 14.20 -10.57 -9.63 -11.99 13.50 -20.76 -4.44 -3.18 -15.24 -12.03 14.35
Avg Bond Outperf. 17.38 10.15 15.73 17.95 17.53 9.42 10.65 8.67 29.72 10.47 10.96 12.79 40.03 14.16 22.93Avg Equity Outperf. -15.64 -8.17 -34.28 -35.04 -9.09 -21.48 -15.87 -22.11 -13.52 -31.17 -13.44 -12.76 -20.77 -31.67 -7.11
Frequency of BondsOutperforming Equities 53% 41% 58% 63% 88% 35% 12% 25% 63% 25% 33% 40% 10% 50% 83%
Source: Lehman Brothers Fixed-Income Reseaarch and Global Financial Data.

Figure A7. Daily U.S. Trade-Weighted Dollar* Index (Major Currencies) Reactions to Various Crisis Events1973 through June 2002
Cumulative % Change in Trade-Weighted Dollar IndexCrisis in Number of Months after ReactionGrade Crisis Events Date 1 2 3 4 6A Arab Oil Embargo 10/18/1973 3.53 4.80 9.08 6.63 3.22A Gulf War Ultimatum 12/24/1990 -2.55 -2.32 2.54 4.79 6.52A WTC Attack 9/11/2001 0.15 0.64 1.70 3.15 2.70B Iranian Revolution 1/16/1979 0.48 0.93 1.71 1.91 0.37B USSR Invasion of Afghanistan 12/24/1979 -0.93 0.56 4.06 3.66 -3.02B U.S. Invades Grenada 10/24/1983 1.42 2.43 3.36 2.03 1.28B Invasion of Panama 12/15/1989 -1.09 -0.39 1.52 1.57 0.74B Gorbachev Coup 8/16/1991 -2.73 -3.09 -4.78 -5.86 -4.62C Falkland Islands War 4/1/1982 -2.12 -0.42 4.40 4.05 6.44C U.S. Bombs Libya 4/15/1986 -4.74 -3.99 -4.99 -7.27 -8.20C U.S. Embassy Bombings in Nairobi and Dar es Salaam 8/7/1998 -3.06 -5.08 -7.86 -6.66 -7.69
1 Nixon Resigns 8/9/1974 1.37 0.67 0.02 -0.50 -1.971 Hunt Silver Crisis 2/13/1980 3.54 4.66 0.07 -2.81 -1.261 U.S. Stock Market Crash of 1987 10/2/1987 -3.68 -6.85 -11.45 -8.11 -10.251 WTC Bombing 2/26/1993 -1.16 -3.68 -3.97 -1.93 -1.371 Orange County, CA Bankruptcy & Financial Crisis 12/6/1994 0.36 -0.28 -4.37 -6.91 -7.101 Oklahoma City Bombing 4/19/1995 3.37 2.10 2.52 7.54 6.312 ERM U.K. Currency Crisis 9/14/1992 0.96 5.08 6.00 8.13 6.822 Mexico - Tequila Crisis 12/19/1994 -0.38 -1.95 -5.49 -9.60 -7.822 Poison Gas Attack in Tokyo Subway 3/20/1995 -4.63 -1.42 -2.63 -2.23 4.222 Terrorist Attack in Paris Metro 7/25/1995 4.45 3.52 3.75 3.82 7.222 Asian Stock Market Crisis 10/7/1997 -0.10 3.25 5.17 2.99 5.732 Russia, LTCM Crisis 8/18/1998 -4.87 -9.06 -6.92 -7.99 -7.90
OverallMean -0.54 -0.43 -0.29 -0.42 -0.42Median -0.38 -0.28 1.52 1.57 0.37
Geopolitical RiskMean -1.06 -0.54 0.98 0.73 -0.20Median -1.09 -0.39 1.71 2.03 0.74
Political EventsMean -0.06 -0.33 -1.44 -1.47 -0.61Median 0.13 0.19 -1.30 -2.08 -1.32
High Geopolitical Risk (A)Mean 0.38 1.04 4.44 4.86 4.15Median 0.15 0.64 2.54 4.79 3.22
Medium Geopolitical Risk (B)Mean -0.57 0.09 1.17 0.66 -1.05Median -0.93 0.56 1.71 1.91 0.37
Low Geopolitical Risk (C)Mean -3.31 -3.16 -2.82 -3.29 -3.15Median -3.06 -3.99 -4.99 -6.66 -7.69
U.S. Political Events (1)Mean 0.63 -0.56 -2.86 -2.12 -2.61Median 0.86 0.19 -1.98 -2.37 -1.67
Non-U.S. Political Events (2)Mean -0.76 -0.10 -0.02 -0.81 1.38Median -0.24 0.92 0.56 0.38 4.98
* A weighted average of the value of the U.S. dollar against major currencies.Sources: Lehman Brothers Fixed-Income Research, Global Financial Data, and Federal Reserve Board of Governors.
Crisis Grade Key: A = High Geopolitical Risk, B = Medium Geopolitical Risk, C = Low Geopolitical Risk, 1 = U.S. Political Event, 2 = Non-U.S. Political Event

FIgure A8. Performance of Daily U.S. Dollar Trade-Weighted Index Before and After Military Conflicts, 1975 through June 2002
Cumulative % Appreciation (Depreciation) in U.S. Dollar IndexU.S. Dollar in 24 Months Before/After Military Conflict
Date Index -24 -12 -6 -4 -2 -1 1 2 4 6 12 24Vietnam
North Vietnam Overtakes Saigon 4/30/1975 100.28 -0.49 0.99 -2.54 -0.76 2.46 0.72 -0.33 0.77 4.49 4.62 6.21 6.09
Gulf WarIraq Invades Kuwait 8/2/1990 87.56 -4.03 -5.28 -3.02 -5.32 -3.62 -1.95 -1.78 -3.72 -5.15 -6.06 1.46 -5.84U.N. Authorizes Force 11/29/1990 82.79 -3.16 -9.64 -8.87 -4.93 -2.53 0.33 0.79 -0.36 6.87 5.99 1.53 6.12Desert Storm Begins 1/17/1991 83.06 -6.67 -8.87 -6.22 -2.06 1.63 0.39 -1.53 4.41 6.72 8.11 1.08 7.51Ground Assault Begins 2/24/1991 82.66 -7.40 -9.74 -2.72 0.56 -1.96 0.07 6.34 7.40 8.70 7.48 4.13 7.77Kuwait Liberated 2/27/1991 83.11 -7.22 -9.59 -3.36 0.71 -0.40 0.75 6.46 7.03 8.17 6.76 3.66 6.16
War on TerrorismAfghanistan-U.S. Bombing Begins 10/7/2001 103.27 12.80 1.92 -2.00 -2.34 -1.74 -0.59 1.53 2.31 5.13 4.15 -3.78 -
Mean -2.31 -5.74 -4.10 -2.02 -0.88 -0.04 1.64 2.55 4.99 4.44 2.04 4.64Median -4.03 -8.87 -3.02 -2.06 -1.74 0.33 0.79 2.31 6.72 5.99 1.53 6.14
*U.S. Dollar Index 1973 = 100.Sources: Lehman Brothers Fixed-Income Reseaarch and Global Financial Data.
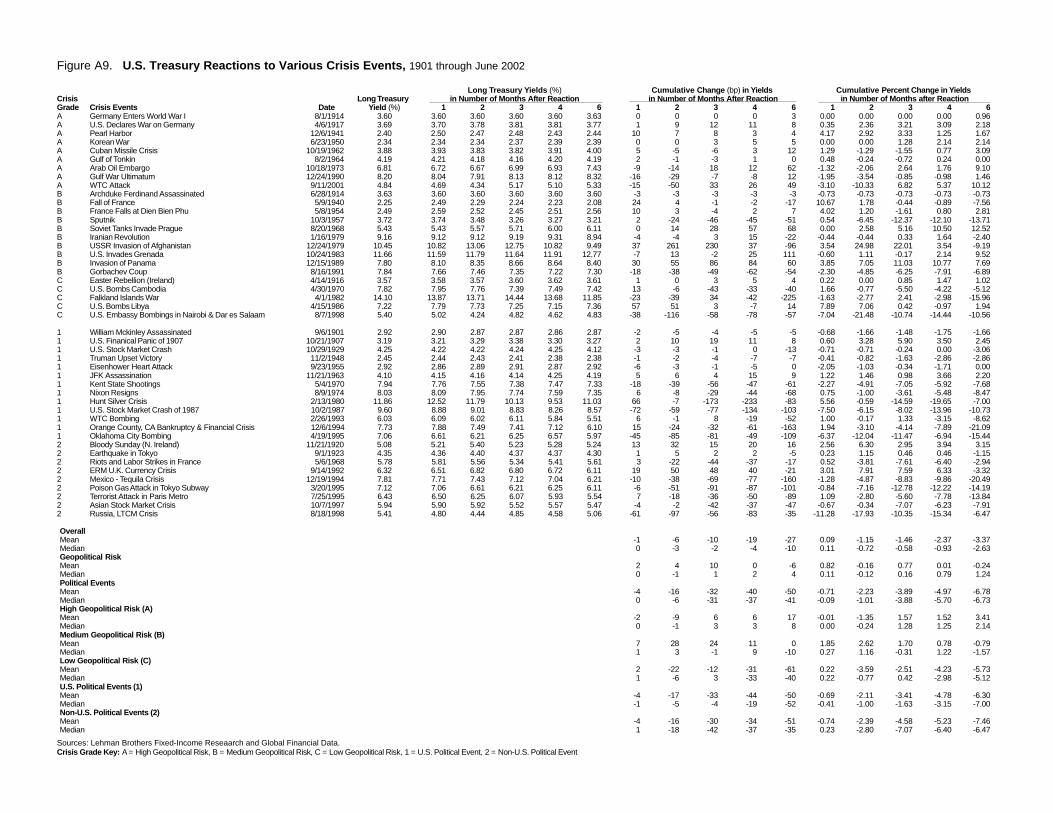
Figure A9. U.S. Treasury Reactions to Various Crisis Events, 1901 through June 2002
Long Treasury Yields (%) Cumulative Change (bp) in Yields Cumulative Percent Change in YieldsCrisis Long Treasury in Number of Months After Reaction in Number of Months After Reaction in Number of Months after ReactionGrade Crisis Events Date Yield (%) 1 2 3 4 6 1 2 3 4 6 1 2 3 4 6A Germany Enters World War I 8/1/1914 3.60 3.60 3.60 3.60 3.60 3.63 0 0 0 0 3 0.00 0.00 0.00 0.00 0.96A U.S. Declares War on Germany 4/6/1917 3.69 3.70 3.78 3.81 3.81 3.77 1 9 12 11 8 0.35 2.36 3.21 3.09 2.18A Pearl Harbor 12/6/1941 2.40 2.50 2.47 2.48 2.43 2.44 10 7 8 3 4 4.17 2.92 3.33 1.25 1.67A Korean War 6/23/1950 2.34 2.34 2.34 2.37 2.39 2.39 0 0 3 5 5 0.00 0.00 1.28 2.14 2.14A Cuban Missile Crisis 10/19/1962 3.88 3.93 3.83 3.82 3.91 4.00 5 -5 -6 3 12 1.29 -1.29 -1.55 0.77 3.09A Gulf of Tonkin 8/2/1964 4.19 4.21 4.18 4.16 4.20 4.19 2 -1 -3 1 0 0.48 -0.24 -0.72 0.24 0.00A Arab Oil Embargo 10/18/1973 6.81 6.72 6.67 6.99 6.93 7.43 -9 -14 18 12 62 -1.32 -2.06 2.64 1.76 9.10A Gulf War Ultimatum 12/24/1990 8.20 8.04 7.91 8.13 8.12 8.32 -16 -29 -7 -8 12 -1.95 -3.54 -0.85 -0.98 1.46A WTC Attack 9/11/2001 4.84 4.69 4.34 5.17 5.10 5.33 -15 -50 33 26 49 -3.10 -10.33 6.82 5.37 10.12B Archduke Ferdinand Assassinated 6/28/1914 3.63 3.60 3.60 3.60 3.60 3.60 -3 -3 -3 -3 -3 -0.73 -0.73 -0.73 -0.73 -0.73B Fall of France 5/9/1940 2.25 2.49 2.29 2.24 2.23 2.08 24 4 -1 -2 -17 10.67 1.78 -0.44 -0.89 -7.56B France Falls at Dien Bien Phu 5/8/1954 2.49 2.59 2.52 2.45 2.51 2.56 10 3 -4 2 7 4.02 1.20 -1.61 0.80 2.81B Sputnik 10/3/1957 3.72 3.74 3.48 3.26 3.27 3.21 2 -24 -46 -45 -51 0.54 -6.45 -12.37 -12.10 -13.71B Soviet Tanks Invade Prague 8/20/1968 5.43 5.43 5.57 5.71 6.00 6.11 0 14 28 57 68 0.00 2.58 5.16 10.50 12.52B Iranian Revolution 1/16/1979 9.16 9.12 9.12 9.19 9.31 8.94 -4 -4 3 15 -22 -0.44 -0.44 0.33 1.64 -2.40B USSR Invasion of Afghanistan 12/24/1979 10.45 10.82 13.06 12.75 10.82 9.49 37 261 230 37 -96 3.54 24.98 22.01 3.54 -9.19B U.S. Invades Grenada 10/24/1983 11.66 11.59 11.79 11.64 11.91 12.77 -7 13 -2 25 111 -0.60 1.11 -0.17 2.14 9.52B Invasion of Panama 12/15/1989 7.80 8.10 8.35 8.66 8.64 8.40 30 55 86 84 60 3.85 7.05 11.03 10.77 7.69B Gorbachev Coup 8/16/1991 7.84 7.66 7.46 7.35 7.22 7.30 -18 -38 -49 -62 -54 -2.30 -4.85 -6.25 -7.91 -6.89C Easter Rebellion (Ireland) 4/14/1916 3.57 3.58 3.57 3.60 3.62 3.61 1 0 3 5 4 0.22 0.00 0.85 1.47 1.02C U.S. Bombs Cambodia 4/30/1970 7.82 7.95 7.76 7.39 7.49 7.42 13 -6 -43 -33 -40 1.66 -0.77 -5.50 -4.22 -5.12C Falkland Islands War 4/1/1982 14.10 13.87 13.71 14.44 13.68 11.85 -23 -39 34 -42 -225 -1.63 -2.77 2.41 -2.98 -15.96C U.S. Bombs Libya 4/15/1986 7.22 7.79 7.73 7.25 7.15 7.36 57 51 3 -7 14 7.89 7.06 0.42 -0.97 1.94C U.S. Embassy Bombings in Nairobi & Dar es Salaam 8/7/1998 5.40 5.02 4.24 4.82 4.62 4.83 -38 -116 -58 -78 -57 -7.04 -21.48 -10.74 -14.44 -10.56
1 William Mckinley Assassinated 9/6/1901 2.92 2.90 2.87 2.87 2.86 2.87 -2 -5 -4 -5 -5 -0.68 -1.66 -1.48 -1.75 -1.661 U.S. Finanical Panic of 1907 10/21/1907 3.19 3.21 3.29 3.38 3.30 3.27 2 10 19 11 8 0.60 3.28 5.90 3.50 2.451 U.S. Stock Market Crash 10/29/1929 4.25 4.22 4.22 4.24 4.25 4.12 -3 -3 -1 0 -13 -0.71 -0.71 -0.24 0.00 -3.061 Truman Upset Victory 11/2/1948 2.45 2.44 2.43 2.41 2.38 2.38 -1 -2 -4 -7 -7 -0.41 -0.82 -1.63 -2.86 -2.861 Eisenhower Heart Attack 9/23/1955 2.92 2.86 2.89 2.91 2.87 2.92 -6 -3 -1 -5 0 -2.05 -1.03 -0.34 -1.71 0.001 JFK Assassination 11/21/1963 4.10 4.15 4.16 4.14 4.25 4.19 5 6 4 15 9 1.22 1.46 0.98 3.66 2.201 Kent State Shootings 5/4/1970 7.94 7.76 7.55 7.38 7.47 7.33 -18 -39 -56 -47 -61 -2.27 -4.91 -7.05 -5.92 -7.681 Nixon Resigns 8/9/1974 8.03 8.09 7.95 7.74 7.59 7.35 6 -8 -29 -44 -68 0.75 -1.00 -3.61 -5.48 -8.471 Hunt Silver Crisis 2/13/1980 11.86 12.52 11.79 10.13 9.53 11.03 66 -7 -173 -233 -83 5.56 -0.59 -14.59 -19.65 -7.001 U.S. Stock Market Crash of 1987 10/2/1987 9.60 8.88 9.01 8.83 8.26 8.57 -72 -59 -77 -134 -103 -7.50 -6.15 -8.02 -13.96 -10.731 WTC Bombing 2/26/1993 6.03 6.09 6.02 6.11 5.84 5.51 6 -1 8 -19 -52 1.00 -0.17 1.33 -3.15 -8.621 Orange County, CA Bankruptcy & Financial Crisis 12/6/1994 7.73 7.88 7.49 7.41 7.12 6.10 15 -24 -32 -61 -163 1.94 -3.10 -4.14 -7.89 -21.091 Oklahoma City Bombing 4/19/1995 7.06 6.61 6.21 6.25 6.57 5.97 -45 -85 -81 -49 -109 -6.37 -12.04 -11.47 -6.94 -15.442 Bloody Sunday (N. Ireland) 11/21/1920 5.08 5.21 5.40 5.23 5.28 5.24 13 32 15 20 16 2.56 6.30 2.95 3.94 3.152 Earthquake in Tokyo 9/1/1923 4.35 4.36 4.40 4.37 4.37 4.30 1 5 2 2 -5 0.23 1.15 0.46 0.46 -1.152 Riots and Labor Strikes in France 5/6/1968 5.78 5.81 5.56 5.34 5.41 5.61 3 -22 -44 -37 -17 0.52 -3.81 -7.61 -6.40 -2.942 ERM U.K. Currency Crisis 9/14/1992 6.32 6.51 6.82 6.80 6.72 6.11 19 50 48 40 -21 3.01 7.91 7.59 6.33 -3.322 Mexico - Tequila Crisis 12/19/1994 7.81 7.71 7.43 7.12 7.04 6.21 -10 -38 -69 -77 -160 -1.28 -4.87 -8.83 -9.86 -20.492 Poison Gas Attack in Tokyo Subway 3/20/1995 7.12 7.06 6.61 6.21 6.25 6.11 -6 -51 -91 -87 -101 -0.84 -7.16 -12.78 -12.22 -14.192 Terrorist Attack in Paris Metro 7/25/1995 6.43 6.50 6.25 6.07 5.93 5.54 7 -18 -36 -50 -89 1.09 -2.80 -5.60 -7.78 -13.842 Asian Stock Market Crisis 10/7/1997 5.94 5.90 5.92 5.52 5.57 5.47 -4 -2 -42 -37 -47 -0.67 -0.34 -7.07 -6.23 -7.912 Russia, LTCM Crisis 8/18/1998 5.41 4.80 4.44 4.85 4.58 5.06 -61 -97 -56 -83 -35 -11.28 -17.93 -10.35 -15.34 -6.47
OverallMean -1 -6 -10 -19 -27 0.09 -1.15 -1.46 -2.37 -3.37Median 0 -3 -2 -4 -10 0.11 -0.72 -0.58 -0.93 -2.63Geopolitical RiskMean 2 4 10 0 -6 0.82 -0.16 0.77 0.01 -0.24Median 0 -1 1 2 4 0.11 -0.12 0.16 0.79 1.24Political EventsMean -4 -16 -32 -40 -50 -0.71 -2.23 -3.89 -4.97 -6.78Median 0 -6 -31 -37 -41 -0.09 -1.01 -3.88 -5.70 -6.73High Geopolitical Risk (A)Mean -2 -9 6 6 17 -0.01 -1.35 1.57 1.52 3.41Median 0 -1 3 3 8 0.00 -0.24 1.28 1.25 2.14Medium Geopolitical Risk (B)Mean 7 28 24 11 0 1.85 2.62 1.70 0.78 -0.79Median 1 3 -1 9 -10 0.27 1.16 -0.31 1.22 -1.57Low Geopolitical Risk (C)Mean 2 -22 -12 -31 -61 0.22 -3.59 -2.51 -4.23 -5.73Median 1 -6 3 -33 -40 0.22 -0.77 0.42 -2.98 -5.12U.S. Political Events (1)Mean -4 -17 -33 -44 -50 -0.69 -2.11 -3.41 -4.78 -6.30Median -1 -5 -4 -19 -52 -0.41 -1.00 -1.63 -3.15 -7.00Non-U.S. Political Events (2)Mean -4 -16 -30 -34 -51 -0.74 -2.39 -4.58 -5.23 -7.46Median 1 -18 -42 -37 -35 0.23 -2.80 -7.07 -6.40 -6.47
Sources: Lehman Brothers Fixed-Income Reseaarch and Global Financial Data.Crisis Grade Key: A = High Geopolitical Risk, B = Medium Geopolitical Risk, C = Low Geopolitical Risk, 1 = U.S. Political Event, 2 = Non-U.S. Political Event

Figure A10. Performance of Long U.S. Treasuries Before and After Military Conflicts, 1914 through June 2002
Long Treasury Yields (%) Cumulative Percent Change (%) in Treasury YieldsLong Treasury in Number of Months Before/After Military Conflict in Number of Months Before/After Military Conflict
Date Yield (%) -24 -12 -6 -4 -2 -1 1 2 4 6 12 24 -24 -12 -6 -4 -2 -1 1 2 4 6 12 24World War I
Assassination in Sarajevo 6/28/1914 3.63 3.50 3.51 3.61 3.54 3.55 3.56 3.60 3.60 3.60 3.60 3.60 3.57 3.57 3.34 0.40 2.49 2.16 1.93 -0.73 -0.73 -0.73 -0.73 -0.84 -1.51Austria Declares War on Serbia 7/28/1914 3.60 3.50 3.60 3.58 3.54 3.56 3.63 3.60 3.60 3.60 3.63 3.62 3.60 2.81 0.11 0.56 1.74 1.18 -0.73 0.00 0.00 0.00 0.96 0.51 0.06U.S. Declares War on Germany 4/6/1917 3.69 3.58 3.57 3.61 3.63 3.63 3.61 3.70 3.78 3.81 3.77 3.81 4.70 3.00 3.35 2.31 1.73 1.73 2.25 0.35 2.36 3.09 2.18 3.21 27.34Austria, Hungary, & Germany Surrender 11/11/1918 3.77 3.59 3.79 3.80 3.76 3.75 3.76 3.75 3.75 4.70 4.72 4.71 5.08 4.95 -0.59 -0.71 0.35 0.59 0.35 -0.53 -0.53 24.70 25.23 24.96 34.78
World War IIGermany Invades Poland 9/1/1939 2.27 2.80 2.52 2.39 2.27 2.19 2.14 2.74 2.51 2.30 2.32 2.25 2.04 -18.93 -9.92 -5.02 0.00 3.65 6.07 20.70 10.57 1.32 2.20 -0.88 -10.13Germany Invades France 5/10/1949 2.38 2.20 2.43 2.45 2.42 2.38 2.38 2.39 2.27 2.23 2.21 2.30 2.60 8.18 -2.06 -2.86 -1.65 0.00 0.00 0.42 -4.62 -6.30 -7.14 -3.36 9.24France Surrenders 6/22/1940 2.33 2.54 2.16 2.32 2.31 2.27 2.43 2.29 2.28 2.09 1.87 2.02 2.43 -8.27 7.87 0.43 0.87 2.64 -4.12 -1.72 -2.15 -10.30 -19.74 -13.30 4.29Pearl Harbor 12/7/1941 2.40 2.37 1.92 2.03 2.01 2.01 2.34 2.50 2.47 2.43 2.44 2.48 2.48 1.27 25.00 18.23 19.40 19.40 2.56 4.17 2.92 1.25 1.67 3.33 3.33Germany Surrenders 5/7/1945 2.39 2.46 2.49 2.48 2.45 2.38 2.39 2.37 2.34 2.37 2.35 2.14 2.20 -2.85 -4.02 -3.63 -2.45 0.42 0.00 -0.84 -2.09 -0.84 -1.67 -10.46 -7.95Hiroshima/Nagasaki and Japanese Surrender 8/14/1945 2.34 2.47 2.48 2.40 2.38 2.36 2.34 2.37 2.35 2.32 2.14 2.23 2.25 -5.26 -5.65 -2.50 -1.68 -0.85 0.00 1.28 0.43 -0.85 -8.55 -4.70 -3.85
KoreaNorth Korea Invades 6/25/1950 2.34 2.44 2.38 2.18 2.25 2.30 2.31 2.34 2.34 2.39 2.38 2.65 2.61 -4.10 -1.68 7.34 4.00 1.74 1.30 0.00 0.00 2.14 1.71 13.25 11.54Cease Fire Signed 7/27/1953 3.01 2.59 2.63 2.80 2.94 3.11 3.09 3.01 2.93 2.86 2.67 2.46 2.88 16.22 14.45 7.50 2.38 -3.22 -2.59 0.00 -2.66 -4.98 -11.30 -18.27 -4.32
VietnamGulf of Tonkin 8/2/1964 4.19 3.99 4.00 4.15 4.25 4.19 4.15 4.21 4.18 4.20 4.19 4.20 5.02 5.01 4.75 0.96 -1.41 0.00 0.96 0.48 -0.24 0.24 0.00 0.24 19.81U.S. Marines Sent 3/8/1965 4.23 3.92 4.22 4.22 4.15 4.20 4.22 4.20 4.20 4.21 4.27 5.00 4.73 7.91 0.24 0.24 1.93 0.71 0.24 -0.71 -0.71 -0.47 0.95 18.20 11.82North Vietnam Overtakes Saigon 4/30/1975 8.31 6.81 7.65 7.80 7.40 7.46 8.01 8.04 7.95 8.28 8.00 7.59 7.30 22.03 8.63 6.54 12.30 11.39 3.75 -3.25 -4.33 -0.36 -3.73 -8.66 -12.15
Gulf WarIraq Invades Kuwait 8/2/1990 8.41 9.36 8.03 8.50 8.55 8.44 8.40 8.86 8.71 8.26 8.05 8.20 6.85 -10.15 4.73 -1.06 -1.64 -0.36 0.12 5.35 3.57 -1.78 -4.28 -2.50 -18.55U.N. Authorizes Force 11/29/1990 8.32 9.07 7.82 8.44 8.29 8.82 8.70 8.14 8.06 8.05 8.07 7.44 6.78 -8.27 6.39 -1.42 0.36 -5.67 -4.37 -2.16 -3.13 -3.25 -3.00 -10.58 -18.51Desert Storm Begins 1/17/1991 8.05 8.95 8.27 8.48 8.88 8.30 7.99 7.78 8.15 8.08 8.27 6.85 6.63 -10.06 -2.66 -5.07 -9.35 -3.01 0.75 -3.35 1.24 0.37 2.73 -14.91 -17.64Ground Assault Begins 2/24/1991 7.91 9.26 8.59 8.94 8.63 8.15 8.06 8.13 8.07 8.33 7.88 7.42 6.35 -14.58 -7.92 -11.52 -8.34 -2.94 -1.86 2.78 2.02 5.31 -0.38 -6.19 -19.72Kuwait Liberated 2/27/1991 7.98 9.24 8.54 8.86 8.70 8.14 8.06 8.05 8.06 8.32 7.91 7.45 6.34 -13.64 -6.56 -9.93 -8.28 -1.97 -0.99 0.88 1.00 4.26 -0.88 -6.64 -20.55
War on TerrorismAfghanistan-U.S. Bombing Begins 10/7/2001 4.84 5.93 5.15 4.82 5.19 4.98 4.97 4.47 4.87 4.84 5.23 - - -18.33 -6.12 0.30 -6.73 -2.88 -2.67 -7.62 0.67 0.04 8.02 - -
OverallMean -1.88 1.51 0.05 0.29 1.18 0.14 0.74 0.17 0.61 -0.75 -1.88 -0.63Median -2.85 0.11 0.24 0.35 0.42 0.12 0.00 0.00 0.00 -0.38 -2.93 -2.68
World War IMean 3.58 1.55 0.64 1.58 1.41 0.95 -0.23 0.28 6.76 6.91 6.96 15.17Median 3.29 1.73 0.48 1.74 1.46 1.14 -0.26 -0.26 1.55 1.57 1.86 13.70
World War IIMean -4.31 1.87 0.78 2.41 4.21 0.75 4.00 0.84 -2.62 -5.54 -4.90 -0.84Median -4.05 -3.04 -2.68 -0.83 1.53 0.00 0.85 -0.83 -0.85 -4.41 -4.03 -0.26
VietnamMean 11.65 4.54 2.58 4.27 4.04 1.65 -1.16 -1.76 -0.20 -0.93 3.26 6.49Median 7.91 4.75 0.96 1.93 0.71 0.96 -0.71 -0.71 -0.36 0.00 0.24 11.82
Gulf WarMean -11.34 -1.20 -5.80 -5.45 -2.79 -1.27 0.70 0.94 0.98 -1.16 -8.16 -18.99Median -10.15 -2.66 -5.07 -8.28 -2.94 -0.99 0.88 1.24 0.37 -0.88 -6.64 -18.55
Sources: Lehman Brothers Fixed-Income Reseaarch and Global Financial Data.

Figure A11. U.K. Gilt Reactions to Various Crisis Events, 1914 through June 2002
Long Gilt Yields (%) Change (bp) in Yields Cumulative Percent Change in YieldsCrisis Long Gilt in Number of Months After Reaction in Number of Months After Reaction in Number of Months after ReactionGrade Crisis Events Date Yield (%) 1 2 3 4 6 1 2 3 4 6 1 2 3 4 6A Germany Enters World War I 8/1/1914 3.62 3.62 3.65 3.65 3.65 3.65 0 3 3 3 2 0.00 0.73 0.73 0.73 0.65A U.S. Declares War on Germany 4/6/1917 4.55 4.51 4.56 4.51 4.47 4.49 -4 1 -4 -8 -6 -0.79 0.11 -0.79 -1.79 -1.40A Pearl Harbor 12/6/1941 3.05 3.05 3.02 3.03 3.01 3.03 0 -3 -2 -4 -2 0.00 -0.98 -0.66 -1.31 -0.66A Korean War 6/23/1950 3.61 3.55 3.61 3.55 3.48 3.44 -6 0 -6 -13 -17 -1.66 0.00 -1.66 -3.60 -4.71A Cuban Missile Crisis 10/19/1962 5.28 4.87 5.13 5.04 5.05 5.36 -41 -15 -24 -23 8 -7.77 -2.84 -4.55 -4.36 1.52A Gulf of Tonkin 8/2/1964 5.63 5.68 5.69 5.77 5.86 6.26 5 6 14 23 63 0.89 1.07 2.49 4.09 11.19A Arab Oil Embargo 10/18/1973 11.30 11.25 12.44 12.23 12.85 13.29 -5 115 94 155 200 -0.41 10.17 8.30 13.77 17.68A Gulf War Ultimatum 12/24/1990 10.94 10.46 10.10 10.31 10.31 10.58 -48 -83 -62 -63 -36 -4.35 -7.62 -5.71 -5.77 -3.26A WTC Attack 9/11/2001 4.93 4.91 4.43 4.97 4.99 5.23 -2 -49 4 7 30 -0.31 -10.01 0.85 1.35 6.12B Archduke Ferdinand Assassinated 6/28/1914 3.37 3.34 3.62 3.65 3.65 3.65 -3 26 28 28 28 -0.75 7.60 8.39 8.39 8.39B Easter Rebellion (Ireland) 4/14/1916 4.37 4.36 4.21 4.16 4.23 4.33 -1 -17 -21 -14 -4 -0.22 -3.84 -4.79 -3.28 -0.98B Fall of France 5/9/1940 3.45 3.42 3.48 3.47 3.42 3.35 -3 3 2 -3 -10 -0.87 0.87 0.58 -0.87 -2.90B France Falls at Dien Bien Phu 5/8/1954 3.80 3.72 3.78 3.69 3.66 3.66 -8 -2 -11 -14 -14 -2.11 -0.53 -2.89 -3.68 -3.68B Sputnik 10/3/1957 5.32 5.44 5.48 5.41 5.50 5.46 12 16 9 18 14 2.26 3.01 1.69 3.38 2.63B Soviet Tanks Invade Prague 8/20/1968 7.69 7.55 7.50 7.52 7.73 8.26 -14 -19 -17 4 57 -1.82 -2.47 -2.21 0.52 7.41B Iranian Revolution 1/16/1979 13.17 14.08 12.03 11.17 11.51 12.55 91 -115 -201 -166 -62 6.88 -8.70 -15.23 -12.59 -4.73B USSR Invasion of Afghanistan 12/24/1979 14.54 13.91 14.41 14.51 13.89 13.14 -64 -13 -3 -65 -141 -4.37 -0.90 -0.22 -4.47 -9.67B Falkland Islands War 4/1/1982 13.76 14.20 13.89 13.81 13.02 11.60 44 13 6 -73 -216 3.22 0.95 0.43 -5.34 -15.70B Gorbachev Coup 8/16/1991 10.06 9.62 9.80 9.65 9.58 9.34 -44 -26 -41 -48 -72 -4.39 -2.61 -4.07 -4.79 -7.18C U.S. Bombs Cambodia 4/30/1970 8.16 7.76 7.76 7.45 7.69 7.63 -40 -40 -71 -47 -53 -4.84 -4.84 -8.67 -5.80 -6.50C U.S. Invades Grenada 10/24/1983 11.24 10.89 10.98 11.13 11.01 11.20 -35 -26 -10 -23 -4 -3.11 -2.29 -0.92 -2.05 -0.35C U.S. Bombs Libya 4/15/1986 8.92 9.10 9.35 9.73 9.74 10.88 18 43 81 82 196 2.00 4.86 9.10 9.14 21.93C Invasion of Panama 12/15/1989 10.56 10.79 11.21 12.30 12.50 11.69 23 65 173 194 113 2.16 6.12 16.41 18.36 10.68C U.S. Embassy Bombings in Nairobi and Dar es Salaam 8/7/1998 5.66 5.37 4.69 5.03 4.64 4.30 -29 -97 -63 -102 -136 -5.08 -17.15 -11.15 -18.05 -23.98
1 Bloody Sunday (N. Ireland) 11/21/1920 5.58 5.66 5.28 5.30 5.30 5.32 8 -30 -28 -28 -26 1.49 -5.41 -5.03 -5.03 -4.661 Hunt Silver Crisis 2/13/1980 14.24 14.46 13.90 13.47 13.42 13.32 22 -35 -77 -82 -93 1.53 -2.45 -5.41 -5.76 -6.531 ERM U.K. Currency Crisis 9/14/1992 9.12 8.95 8.23 8.40 8.50 7.74 -16 -88 -72 -62 -138 -1.81 -9.70 -7.93 -6.81 -15.082 William Mckinley Assassinated 9/6/1901 2.94 2.96 3.00 2.96 2.93 2.93 3 6 2 -1 -1 0.94 2.11 0.67 -0.33 -0.332 U.S. Finanical Panic of 1907 10/21/1907 3.02 3.05 3.02 2.96 2.87 2.87 2 -1 -6 -16 -15 0.80 -0.22 -2.00 -5.16 -5.022 Earthquake in Tokyo 9/1/1923 4.28 4.28 4.28 4.36 4.45 4.42 0 0 8 17 14 -0.05 -0.05 1.85 3.89 3.322 U.S. Stock Market Crash 10/29/1929 4.56 4.68 4.75 4.75 4.63 4.39 12 19 19 7 -17 2.63 4.17 4.17 1.54 -3.732 Truman Upset Victory 11/2/1948 3.18 3.16 3.14 3.12 3.09 3.10 -2 -4 -6 -9 -8 -0.63 -1.26 -1.89 -2.83 -2.522 Eisenhower Heart Attack 9/23/1955 4.34 4.48 4.30 4.38 4.39 4.61 14 -4 4 5 27 3.23 -0.92 0.92 1.15 6.222 JFK Assassination 11/21/1963 4.77 4.98 5.08 5.23 5.31 5.42 21 31 46 54 65 4.40 6.50 9.64 11.32 13.632 Riots and Labor Strikes in France 5/6/1968 7.27 7.36 7.61 7.69 7.55 7.52 9 34 42 28 25 1.24 4.68 5.78 3.85 3.442 Kent State Shootings 5/4/1970 8.16 7.76 7.45 7.58 7.69 7.79 -40 -71 -58 -47 -37 -4.84 -8.67 -7.11 -5.80 -4.552 Nixon Resigns 8/9/1974 13.17 14.03 13.46 14.17 14.75 12.72 87 29 100 158 -45 6.59 2.20 7.59 12.03 -3.402 U.S. Stock Market Crash of 1987 10/2/1987 10.39 9.56 9.48 9.74 9.52 9.33 -83 -91 -64 -87 -106 -7.97 -8.73 -6.21 -8.40 -10.202 WTC Bombing 2/26/1993 7.93 7.96 8.03 8.18 7.87 7.16 3 10 25 -6 -77 0.33 1.24 3.16 -0.78 -9.752 Orange County, CA Bankruptcy & Financial Crisis 12/6/1994 8.64 8.77 8.63 8.71 8.44 7.75 13 -2 7 -21 -89 1.54 -0.18 0.81 -2.38 -10.332 Mexico - Tequila Crisis 12/19/1994 8.54 8.77 8.68 8.54 8.36 8.21 23 14 0 -17 -32 2.68 1.69 0.04 -2.03 -3.782 Poison Gas Attack in Tokyo Subway 3/20/1995 8.50 8.48 8.13 8.21 8.26 7.84 -2 -37 -29 -24 -66 -0.26 -4.36 -3.41 -2.88 -7.812 Oklahoma City Bombing 4/19/1995 8.48 8.13 8.21 8.26 8.18 8.14 -35 -27 -22 -30 -35 -4.11 -3.15 -2.62 -3.51 -4.082 Terrorist Attack in Paris Metro 7/25/1995 8.28 8.10 8.02 8.22 7.72 7.31 -19 -26 -7 -57 -97 -2.28 -3.16 -0.83 -6.82 -11.732 Asian Stock Market Crisis 10/7/1997 6.35 6.68 6.56 6.16 6.15 5.79 33 20 -19 -20 -56 5.16 3.22 -3.00 -3.22 -8.882 Russia, LTCM Crisis 8/18/1998 5.60 5.01 5.10 4.93 4.49 4.54 -59 -50 -67 -111 -106 -10.52 -8.91 -11.96 -19.77 -18.86
OverallMean -3 -11 -7 -11 -21 -0.55 -1.32 -0.81 -1.43 -2.22Median -1 -2 -5 -14 -16 -0.24 -0.71 -0.81 -2.61 -3.54Geopolitical RiskMean -6 -9 -5 -6 -3 -1.06 -1.22 -0.61 -0.75 0.10Median -3 -2 -3 -11 -4 -0.77 -0.71 -0.72 -1.92 -0.82Political EventsMean 0 -14 -9 -16 -42 0.00 -1.43 -1.03 -2.17 -4.76Median 3 -3 -6 -19 -36 0.87 -0.57 -1.36 -2.85 -4.60High Geopolitical Risk (A)Mean -11 -3 2 9 27 -1.60 -1.04 -0.11 0.35 3.01Median -4 0 -2 -4 2 -0.41 0.00 -0.66 -1.31 0.65Medium Geopolitical Risk (B)Mean 1 -13 -25 -33 -42 -0.22 -0.66 -1.83 -2.27 -2.64Median -3 -8 -7 -14 -12 -0.81 -0.71 -1.21 -3.48 -3.29Low Geopolitical Risk (C)Mean -13 -11 22 21 23 -1.78 -2.66 0.95 0.32 0.35Median -29 -26 -10 -23 -4 -3.11 -2.29 -0.92 -2.05 -0.35U.K. Political Events (1)Mean 5 -51 -59 -57 -85 0.40 -5.85 -6.13 -5.87 -8.75Median 8 -35 -72 -62 -93 1.49 -5.41 -5.41 -5.76 -6.53Non-U.K. Political Events (2)Mean -1 -8 -1 -9 -35 -0.06 -0.73 -0.23 -1.59 -4.13Median 3 -1 0 -16 -35 0.80 -0.18 0.04 -2.38 -4.08
Sources: Lehman Brothers Fixed-Income Reseaarch and Global Financial Data.Crisis Grade Key: A = High Geopolitical Risk, B = Medium Geopolitical Risk, C = Low Geopolitical Risk, 1 = U.K. Political Event, 2 = Non-U.K. Political Event

Figure A12. Performance of Long U.K. Gilts Before and After Military Conflicts, 1914 through June 2002
Long Gilt Yields (%) Cumulative Percent Change (%) in Gilt YieldsLong Gilt in Number of Months Before/After Military Conflict in Number of Months Before/After Military Conflict
Date Yield (%) -24 -12 -6 -4 -2 -1 1 2 4 6 12 24 -24 -12 -6 -4 -2 -1 1 2 4 6 12 24World War I
Assassination in Sarajevo 6/28/1914 3.37 3.33 3.44 3.48 3.28 3.30 3.34 3.34 3.62 3.65 3.65 3.78 4.21 1.09 -2.06 -3.32 2.78 2.02 0.67 -0.75 7.60 8.39 8.39 12.23 24.92Austria Declares War on Serbia 7/28/1914 3.34 3.33 3.39 3.42 3.31 3.34 3.37 3.62 3.65 3.65 3.65 3.84 4.16 0.50 -1.38 -2.42 0.92 -0.08 -0.75 8.42 9.21 9.21 9.12 14.99 24.62U.S. Declares War on Germany 4/6/1917 4.55 3.76 4.37 4.33 4.57 4.83 4.72 4.51 4.56 4.47 4.49 4.56 4.33 21.16 4.04 5.06 -0.34 -5.69 -3.58 -0.79 0.11 -1.79 -1.40 0.17 -4.77Austria, Hungary, & Germany Surrender 11/11/1918 4.13 4.47 4.48 4.46 4.46 4.29 4.13 4.20 4.22 4.33 4.49 4.90 5.50 -7.63 -7.89 -7.48 -7.43 -3.82 -0.21 1.74 2.32 5.04 8.87 18.67 33.27
World War IIGermany Invades Poland 9/1/1939 3.85 3.39 3.34 3.58 3.77 3.67 3.73 4.01 3.84 3.69 3.49 3.47 3.05 13.57 15.27 7.54 2.12 4.90 3.22 4.16 -0.26 -4.16 -9.35 -9.87 -20.78Germany Invades France 5/10/1949 3.10 2.63 3.28 3.18 3.14 3.09 3.11 3.08 3.21 3.48 3.56 3.62 3.73 17.87 -5.49 -2.52 -1.27 0.32 -0.32 -0.65 3.55 12.26 14.84 16.77 20.32France Surrenders 6/22/1940 3.42 3.39 3.71 3.69 3.49 3.41 3.45 3.48 3.47 3.39 3.31 3.20 3.03 0.88 -7.82 -7.32 -2.01 0.29 -0.87 1.75 1.46 -0.88 -3.22 -6.43 -11.40Pearl Harbor 12/7/1941 3.05 3.69 3.31 3.20 3.05 3.04 3.04 3.05 3.02 3.01 3.03 3.06 3.14 -17.34 -7.85 -4.69 0.00 0.33 0.33 0.00 -0.98 -1.31 -0.66 0.33 2.95Germany Surrenders 5/7/1945 3.00 3.06 3.16 3.14 3.06 3.03 3.01 3.01 3.00 2.89 2.80 2.60 2.64 -1.96 -5.06 -4.46 -1.96 -0.99 -0.33 0.33 0.00 -3.67 -6.67 -13.33 -12.00Hiroshima/Nagasaki and Japanese Surrender 8/14/1945 3.00 3.11 3.16 3.04 3.01 3.01 3.00 2.89 2.82 2.75 2.71 2.58 2.78 -3.54 -5.06 -1.32 -0.33 -0.33 0.00 -3.67 -6.00 -8.33 -9.67 -14.00 -7.33
KoreaNorth Korea Invades 6/25/1950 3.61 3.27 3.21 3.62 3.59 3.62 3.62 3.55 3.61 3.48 3.44 3.81 4.26 10.40 12.46 -0.28 0.56 -0.28 -0.28 -1.66 0.00 -3.60 -4.71 5.54 18.01Cease Fire Signed 7/27/1953 4.08 3.80 4.43 4.21 4.25 4.16 4.12 4.13 4.12 3.93 3.89 3.78 4.15 7.37 -7.90 -3.09 -4.00 -1.92 -0.97 1.23 0.98 -3.68 -4.66 -7.35 1.72
VietnamGulf of Tonkin 8/2/1964 5.63 5.88 4.98 5.23 5.42 5.44 5.51 5.68 5.69 5.86 6.26 6.69 6.96 -4.25 13.05 7.65 3.87 3.49 2.18 0.89 1.07 4.09 11.19 18.83 23.62U.S. Marines Sent 3/8/1965 6.33 5.20 5.31 5.68 5.77 6.26 6.43 6.40 6.56 6.69 6.80 6.52 6.57 21.73 19.21 11.44 9.71 1.12 -1.56 1.11 3.63 5.69 7.42 3.00 3.79North Vietnam Overtakes Saigon 4/30/1975 12.78 9.84 13.04 14.17 15.21 12.76 11.83 12.58 12.58 12.29 12.90 12.37 11.18 29.88 -1.99 -9.76 -15.96 0.15 8.01 -1.58 -1.58 -3.84 0.89 -3.21 -12.53
Gulf WarIraq Invades Kuwait 8/2/1990 11.62 9.94 10.03 11.17 12.19 11.88 11.71 11.92 11.98 10.89 10.42 10.23 9.08 16.89 15.79 3.98 -4.68 -2.18 -0.82 2.60 3.11 -6.30 -10.30 -11.90 -21.80U.N. Authorizes Force 11/29/1990 10.93 10.29 10.85 11.88 11.55 12.02 11.51 10.97 10.41 10.21 10.44 9.97 8.36 6.19 0.71 -7.96 -5.33 -9.03 -5.01 0.32 -4.74 -6.63 -4.51 -8.79 -23.55Desert Storm Begins 1/17/1991 10.53 9.77 11.25 11.65 12.01 11.42 10.81 10.09 10.40 10.51 10.26 9.59 8.33 7.80 -6.36 -9.64 -12.35 -7.81 -2.60 -4.18 -1.23 -0.20 -2.53 -8.93 -20.90Ground Assault Begins 2/24/1991 10.10 9.88 11.84 12.06 11.58 10.94 10.40 10.34 10.26 10.60 10.01 9.35 8.05 2.29 -14.69 -16.20 -12.71 -7.62 -2.86 2.29 1.53 4.91 -0.93 -7.45 -20.31Kuwait Liberated 2/27/1991 10.18 9.91 11.93 11.92 11.51 10.97 10.41 10.21 10.35 10.65 10.01 9.38 8.02 2.80 -14.65 -14.57 -11.52 -7.14 -2.21 0.22 1.64 4.59 -1.69 -7.93 -21.20
War on TerrorismAfghanistan-U.S. Bombing Begins 10/7/2001 4.84 5.93 5.15 4.82 5.19 4.98 4.97 4.47 4.87 4.84 5.23 - - -18.33 -6.12 0.30 -6.73 -2.88 -2.67 -7.62 0.67 0.04 8.02 - -
OverallMean 5.11 -0.66 -2.81 -3.17 -1.77 -0.51 0.20 1.05 0.47 0.40 -0.43 -1.17Median 2.80 -5.06 -3.09 -1.96 -0.33 -0.75 0.32 0.98 -0.88 -1.40 -4.82 -6.05
World War IMean 3.78 -1.82 -2.04 -1.02 -1.89 -0.97 2.15 4.81 5.21 6.25 11.51 19.51Median 0.79 -1.72 -2.87 0.29 -1.95 -0.48 0.49 4.96 6.72 8.63 13.61 24.77
World War IIMean 1.58 -2.67 -2.13 -0.58 0.75 0.34 0.32 -0.37 -1.01 -2.45 -4.42 -4.71Median -0.54 -5.28 -3.49 -0.80 0.31 -0.16 0.17 -0.13 -2.49 -4.94 -8.15 -9.37
VietnamMean 15.79 10.09 3.11 -0.79 1.59 2.88 0.14 1.04 1.98 6.50 6.21 4.96Median 21.73 13.05 7.65 3.87 1.12 2.18 0.89 1.07 4.09 7.42 3.00 3.79
Gulf WarMean 7.19 -3.84 -8.88 -9.32 -6.76 -2.70 0.25 0.06 -0.73 -3.99 -9.00 -21.55Median 6.19 -6.36 -9.64 -11.52 -7.62 -2.60 0.32 1.53 -0.20 -2.53 -8.79 -21.20
Sources: Lehman Brothers Fixed-Income Reseaarch and Global Financial Data.

Figure A13. French Treasury Reactions to Various Crisis Events, 1914 through June 2002
Long Treasury Yields (%) Cumulative Change (bp) in Yields Cumulative Percent Change in YieldsCrisis Long Treasury in Number of Months After Reaction in Number of Months After Reaction in Number of Months after ReactionGrade Crisis Events Date Yield (%) 1 2 3 4 6 1 2 3 4 6 1 2 3 4 6A Germany Enters World War I 8/1/1914 4.00 4.00 3.95 4.00 4.11 4.07 0 -5 0 11 7 0.00 -1.32 0.00 2.74 1.63A U.S. Declares War on Germany 4/6/1917 4.87 4.92 4.98 4.91 4.82 4.94 5 12 4 -5 7 1.06 2.41 0.90 -1.04 1.48A Pearl Harbor 12/6/1941 3.14 3.13 3.11 3.13 3.17 3.11 -1 -3 -1 3 -3 -0.32 -0.96 -0.32 0.96 -0.96A Korean War 6/23/1950 5.06 4.97 5.10 5.30 5.24 5.39 -9 4 24 18 33 -1.78 0.79 4.74 3.56 6.52A Cuban Missile Crisis 10/19/1962 4.97 5.01 4.98 4.87 4.87 5.06 4 1 -10 -10 9 0.80 0.20 -2.01 -2.01 1.81A Gulf of Tonkin 8/2/1964 4.97 5.06 5.10 5.08 5.11 5.07 9 13 11 14 10 1.81 2.62 2.21 2.82 2.01A Arab Oil Embargo 10/18/1973 9.42 9.50 9.50 9.65 10.21 10.69 8 8 23 79 127 0.85 0.85 2.44 8.39 13.48A Gulf War Ultimatum 12/24/1990 9.97 9.65 9.02 9.09 8.88 9.17 -32 -95 -88 -109 -80 -3.21 -9.53 -8.83 -10.93 -8.02A WTC Attack 9/11/2001 4.93 4.91 4.43 4.97 4.99 5.23 -2 -49 4 7 30 -0.31 -10.01 0.85 1.35 6.12B Archduke Ferdinand Assassinated 6/28/1914 3.61 3.85 4.00 3.95 4.00 4.16 23 39 34 39 55 6.48 10.73 9.28 10.73 15.19B Fall of France 5/9/1940 4.03 4.27 4.27 4.14 4.01 3.79 24 24 11 -2 -24 5.96 5.96 2.73 -0.50 -5.96B France Falls at Dien Bien Phu 5/8/1954 5.48 5.45 5.52 5.25 5.33 5.29 -3 4 -23 -15 -19 -0.55 0.73 -4.20 -2.74 -3.47B Sputnik 10/3/1957 6.11 6.11 5.90 5.92 5.95 6.00 0 -21 -19 -16 -11 0.00 -3.44 -3.11 -2.62 -1.80B Soviet Tanks Invade Prague 8/20/1968 5.82 5.96 5.95 5.81 5.77 5.93 14 13 -1 -5 11 2.41 2.23 -0.17 -0.86 1.89B Iranian Revolution 1/16/1979 9.94 9.68 9.77 9.65 9.64 10.71 -26 -17 -29 -30 77 -2.62 -1.71 -2.92 -3.02 7.75B USSR Invasion of Afghanistan 12/24/1979 12.09 12.59 12.52 14.11 14.44 13.49 50 43 202 235 140 4.14 3.56 16.71 19.44 11.58B U.S. Invades Grenada 10/24/1983 14.03 14.15 13.16 12.84 12.91 12.86 12 -87 -119 -112 -117 0.86 -6.20 -8.48 -7.98 -8.34B Invasion of Panama 12/15/1989 9.14 9.47 10.00 10.02 9.58 9.76 33 86 88 44 62 3.60 9.40 9.62 4.80 6.77B Gorbachev Coup 8/16/1991 9.05 8.79 8.73 8.69 8.78 8.48 -26 -32 -36 -27 -57 -2.87 -3.54 -3.98 -2.98 -6.30C Easter Rebellion (Ireland) 4/14/1916 4.76 4.78 4.81 4.69 4.71 4.91 2 5 -7 -6 15 0.40 0.96 -1.56 -1.18 3.11C U.S. Bombs Cambodia 4/30/1970 7.68 7.68 7.49 7.69 7.56 7.52 0 -19 1 -12 -16 0.00 -2.47 0.13 -1.56 -2.08C Falkland Islands War 4/1/1982 16.35 16.29 16.13 15.98 15.98 15.79 -6 -22 -37 -37 -56 -0.37 -1.35 -2.26 -2.26 -3.43C U.S. Bombs Libya 4/15/1986 8.05 7.79 8.22 7.96 7.76 8.38 -26 17 -9 -29 33 -3.23 2.11 -1.12 -3.60 4.10C U.S. Embassy Bombings in Nairobi and Dar es Salaam 8/7/1998 4.65 4.37 3.95 4.26 3.98 3.79 -28 -70 -39 -67 -86 -6.02 -15.05 -8.39 -14.41 -18.49
1 Hunt Silver Crisis 2/13/1980 12.52 14.11 14.44 13.95 13.49 13.43 159 192 143 97 91 12.70 15.34 11.42 7.75 7.271 Riots and Labor Strikes in France 5/6/1968 5.72 5.96 5.94 5.82 5.96 5.81 24 22 10 24 9 4.20 3.85 1.75 4.20 1.571 Terrorist Attack in Paris Metro 7/25/1995 7.29 7.16 7.31 7.46 6.81 6.15 -13 2 17 -48 -114 -1.78 0.27 2.33 -6.58 -15.642 William Mckinley Assassinated 9/6/1901 2.98 2.98 2.96 2.97 2.98 2.98 0 -2 -1 0 0 0.00 -0.67 -0.34 0.00 0.002 U.S. Finanical Panic of 1907 10/21/1907 3.19 3.14 3.14 3.11 3.08 3.11 -5 -5 -8 -11 -8 -1.57 -1.57 -2.51 -3.45 -2.512 Bloody Sunday (N. Ireland) 11/21/1920 5.33 5.14 5.08 5.12 5.15 5.24 -20 -25 -21 -18 -9 -3.68 -4.66 -4.01 -3.43 -1.752 Earthquake in Tokyo 9/1/1923 5.27 5.39 5.39 5.50 5.63 5.30 12 12 23 37 3 2.24 2.24 4.40 6.95 0.622 U.S. Stock Market Crash 10/29/1929 3.87 3.72 3.61 3.61 3.34 3.41 -15 -26 -26 -53 -46 -3.88 -6.72 -6.72 -13.70 -11.892 Truman Upset Victory 11/2/1948 4.57 4.66 4.69 4.01 3.95 4.82 9 12 -56 -62 25 1.97 2.63 -12.25 -13.57 5.472 Eisenhower Heart Attack 9/23/1955 5.22 5.26 5.29 5.28 5.22 5.12 4 7 6 0 -10 0.77 1.34 1.15 0.00 -1.922 JFK Assassination 11/21/1963 4.94 4.99 4.89 4.99 5.03 5.05 5 -5 5 9 11 1.01 -1.01 1.01 1.82 2.232 Kent State Shootings 5/4/1970 7.68 7.49 7.69 7.56 7.56 7.77 -19 1 -12 -12 9 -2.47 0.13 -1.56 -1.56 1.172 Nixon Resigns 8/9/1974 11.40 11.40 11.38 11.14 11.17 10.90 0 -2 -26 -23 -50 0.00 -0.18 -2.28 -2.02 -4.392 U.S. Stock Market Crash of 1987 10/2/1987 10.54 10.09 9.83 9.96 9.11 9.46 -45 -71 -58 -143 -108 -4.27 -6.74 -5.50 -13.57 -10.252 ERM U.K. Currency Crisis 9/14/1992 8.81 8.46 7.99 8.14 7.90 7.32 -35 -82 -67 -91 -149 -3.97 -9.31 -7.60 -10.33 -16.912 WTC Bombing 2/26/1993 7.52 7.23 7.12 7.12 6.72 6.22 -29 -40 -40 -80 -130 -3.86 -5.32 -5.32 -10.64 -17.292 Orange County, CA Bankruptcy & Financial Crisis 12/6/1994 7.82 8.31 7.98 8.05 7.72 7.30 49 16 23 -10 -52 6.27 2.05 2.94 -1.28 -6.652 Mexico - Tequila Crisis 12/19/1994 8.05 8.11 7.94 7.91 7.77 7.51 6 -11 -14 -28 -54 0.75 -1.37 -1.74 -3.48 -6.712 Poison Gas Attack in Tokyo Subway 3/20/1995 7.92 7.81 7.39 7.51 7.33 7.07 -11 -53 -41 -59 -85 -1.39 -6.69 -5.18 -7.45 -10.732 Oklahoma City Bombing 4/19/1995 7.81 7.39 7.51 7.33 7.22 7.39 -42 -30 -48 -59 -42 -5.38 -3.84 -6.15 -7.55 -5.382 Asian Stock Market Crisis 10/7/1997 5.43 5.66 5.43 5.18 5.12 4.85 23 0 -25 -31 -58 4.24 0.00 -4.60 -5.71 -10.682 Russia, LTCM Crisis 8/18/1998 4.57 4.11 4.23 4.27 3.89 3.90 -46 -34 -30 -68 -67 -10.07 -7.44 -6.56 -14.88 -14.66
OverallMean 1 -6 -6 -14 -15 -0.02 -0.88 -0.98 -2.20 -2.05Median 0 -2 -9 -12 -9 0.00 -0.42 -1.56 -2.01 -1.77Geopolitical RiskMean 1 -6 -1 -1 6 0.30 -0.54 0.09 -0.12 1.02Median 0 2 -1 -5 8 0.00 0.47 -0.25 -1.11 1.72Political EventsMean 1 -6 -11 -29 -38 -0.37 -1.26 -2.15 -4.48 -5.41Median -2 -3 -18 -26 -44 -0.69 -0.84 -2.39 -3.46 -4.88High Geopolitical Risk (A)Mean -2 -13 -4 1 16 -0.12 -1.66 0.00 0.65 2.67Median 0 1 4 7 9 0.00 0.20 0.85 1.35 1.81Medium Geopolitical Risk (B)Mean 10 5 11 11 12 1.74 1.77 1.55 1.43 1.73Median 13 8 -10 -10 0 1.63 1.48 -1.54 -1.74 0.04Low Geopolitical Risk (C)Mean -12 -18 -18 -30 -22 -1.84 -3.16 -2.64 -4.60 -3.36Median -6 -19 -9 -29 -16 -0.37 -1.35 -1.56 -2.26 -2.08French Political Events (1)Mean 57 72 57 24 -5 5.04 6.49 5.17 1.79 -2.27Median 24 22 17 24 9 4.20 3.85 2.33 4.20 1.57Non-French Political Events (2)Mean -8 -18 -22 -37 -43 -1.23 -2.48 -3.31 -5.47 -5.91Median -5 -5 -25 -28 -46 -1.39 -1.37 -4.01 -3.48 -5.38
Sources: Lehman Brothers Fixed-Income Reseaarch and Global Financial Data.Crisis Grade Key: A = High Geopolitical Risk, B = Medium Geopolitical Risk, C = Low Geopolitical Risk, 1 = French Political Event, 2 = Non-French Political Event

Figure A14. Performance of Long French Treasuries Before and After Military Conflicts, 1914 through June 2002
Long Treasury Yields (%) Cumulative Percent Change (%) in Treasury YieldsLong Treasury in Number of Months Before/After Military Conflict in Number of Months Before/After Military Conflict
Date Yield (%) -24 -12 -6 -4 -2 -1 1 2 4 6 12 24 -24 -12 -6 -4 -2 -1 1 2 4 6 12 24World War I
Assassination in Sarajevo 6/28/1914 3.61 3.26 3.49 3.51 3.44 3.46 3.50 3.85 4.00 4.00 4.16 4.26 4.81 10.84 3.55 2.83 5.00 4.28 3.07 6.48 10.73 10.73 15.19 17.88 33.09Austria Declares War on Serbia 7/28/1914 3.85 3.24 3.36 3.47 3.48 3.50 3.61 4.00 3.95 4.11 4.07 4.35 4.69 18.85 14.43 10.90 10.58 9.74 6.48 4.00 2.63 6.85 5.69 13.04 21.87U.S. Declares War on Germany 4/6/1917 4.87 4.14 4.76 4.91 4.92 4.86 4.89 4.92 4.98 4.82 4.94 5.13 4.75 17.44 2.19 -0.89 -1.05 0.16 -0.49 1.06 2.41 -1.04 1.48 5.38 -2.30Austria, Hungary, & Germany Surrender 11/11/1918 4.77 4.92 5.02 5.00 4.85 4.80 4.84 4.87 4.71 4.75 4.83 5.00 5.42 -3.02 -5.01 -4.61 -1.67 -0.64 -1.43 2.19 -1.33 -0.32 1.29 4.74 13.59
World War IIGermany Invades Poland 9/1/1939 4.09 4.01 4.03 3.60 3.69 3.98 3.94 4.45 4.35 4.18 4.04 4.14 3.30 2.00 1.49 13.61 10.84 2.76 3.81 8.80 6.36 2.20 -1.22 1.22 -19.32Germany Invades France 5/10/1949 4.82 3.66 4.65 4.57 4.69 3.95 4.74 4.79 4.91 5.06 4.92 5.15 5.58 31.69 3.66 5.47 2.77 22.03 1.69 -0.62 1.87 4.98 2.07 6.85 15.77France Surrenders 6/22/1940 4.27 4.03 3.79 4.18 4.04 4.07 4.03 4.27 4.14 4.01 3.55 3.18 3.11 5.96 12.66 2.15 5.69 4.91 5.96 0.00 -3.04 -6.09 -16.86 -25.53 -27.17Pearl Harbor 12/7/1941 3.14 4.18 3.55 3.18 3.30 3.13 3.18 3.13 3.11 3.17 3.11 3.09 3.10 -24.88 -11.55 -1.26 -4.85 0.32 -1.26 -0.32 -0.96 0.96 -0.96 -1.59 -1.27Germany Surrenders 5/7/1945 2.98 3.13 3.09 2.97 2.99 2.98 2.96 2.94 3.00 2.99 3.00 3.07 3.61 -4.79 -3.56 0.34 -0.33 0.00 0.68 -1.34 0.67 0.34 0.67 3.02 21.14Hiroshima/Nagasaki and Japanese Surrender 8/14/1945 3.00 3.13 2.91 2.96 2.96 2.94 3.00 2.99 3.00 3.01 3.04 3.21 4.01 -4.15 3.09 1.35 1.35 2.04 0.00 -0.33 0.00 0.33 1.33 7.00 33.67
KoreaNorth Korea Invades 6/25/1950 5.06 4.84 4.91 5.00 5.26 4.96 5.15 4.97 5.10 5.24 5.39 5.48 5.20 4.55 3.05 1.20 -3.80 2.02 -1.75 -1.78 0.79 3.56 6.52 8.30 2.77Cease Fire Signed 7/27/1953 5.43 5.39 5.32 5.31 5.54 5.39 5.38 5.27 5.32 5.36 5.43 5.52 5.21 0.74 2.07 2.26 -1.99 0.74 0.93 -2.95 -2.03 -1.29 0.00 1.66 -4.05
VietnamGulf of Tonkin 8/2/1964 4.97 5.10 5.04 4.99 4.97 5.15 5.36 5.06 5.10 5.11 5.07 5.25 5.40 -2.55 -1.39 -0.40 0.00 -3.50 -7.28 1.81 2.62 2.82 2.01 5.63 8.65U.S. Marines Sent 3/8/1965 5.39 5.03 5.03 5.06 5.08 5.07 5.08 5.30 5.31 5.25 5.22 5.30 5.44 7.16 7.16 6.52 6.10 6.31 6.10 -1.67 -1.48 -2.60 -3.15 -1.67 0.93North Vietnam Overtakes Saigon 4/30/1975 10.36 8.62 10.70 11.14 11.21 10.69 10.34 10.36 10.31 10.20 10.10 10.29 10.88 20.19 -3.18 -7.00 -7.58 -3.09 0.19 0.00 -0.48 -1.54 -2.51 -0.68 5.02
Gulf WarIraq Invades Kuwait 8/2/1990 9.63 9.31 8.32 9.67 9.54 9.67 9.56 10.26 10.52 10.05 9.54 9.19 8.97 3.44 15.80 -0.41 0.94 -0.41 0.73 6.54 9.24 4.36 -0.93 -4.57 -6.85U.N. Authorizes Force 11/29/1990 10.07 8.71 9.00 9.67 9.50 10.60 10.31 9.98 9.58 9.09 8.99 8.92 8.06 15.61 11.85 4.14 6.00 -5.00 -2.33 -0.89 -4.87 -9.73 -10.72 -11.42 -19.96Desert Storm Begins 1/17/1991 9.70 8.64 9.59 9.51 10.48 10.28 9.88 9.02 9.00 8.84 9.11 8.43 7.99 12.31 1.15 2.00 -7.44 -5.64 -1.82 -7.01 -7.22 -8.87 -6.08 -13.09 -17.63Ground Assault Begins 2/24/1991 9.02 9.09 10.28 10.28 10.25 9.99 9.54 9.17 8.89 9.24 9.01 8.53 7.76 -0.79 -12.26 -12.26 -12.00 -9.71 -5.45 1.66 -1.44 2.44 -0.11 -5.43 -13.97Kuwait Liberated 2/27/1991 9.09 9.15 10.33 10.26 10.31 9.98 9.58 9.09 8.91 9.15 9.03 8.52 7.76 -0.68 -12.00 -11.40 -11.83 -8.92 -5.11 0.00 -1.98 0.66 -0.66 -6.27 -14.63
War on TerrorismAfghanistan-U.S. Bombing Begins 10/7/2001 4.84 5.93 5.15 4.82 5.19 4.98 4.97 4.47 4.87 4.84 5.23 - - -18.33 -6.12 0.30 -6.73 -2.88 -2.67 -7.62 0.67 0.04 8.02 - -
OverallMean 4.36 1.29 0.71 -0.48 0.74 0.00 0.38 0.63 0.42 0.05 0.22 1.47Median 3.44 2.07 1.20 -0.33 0.16 0.00 0.00 0.00 0.34 0.00 1.44 -0.17
World War IMean 11.03 3.79 2.06 3.21 3.39 1.91 3.43 3.61 4.06 5.91 10.26 16.56Median 14.14 2.87 0.97 1.97 2.22 1.29 3.10 2.52 3.27 3.59 9.21 17.73
World War IIMean 0.97 0.97 3.61 2.58 5.34 1.81 1.03 0.82 0.45 -2.49 -1.51 3.80Median -1.08 2.29 1.75 2.06 2.40 1.18 -0.33 0.34 0.65 -0.14 2.12 7.25
VietnamMean 8.26 0.86 -0.29 -0.49 -0.09 -0.33 0.05 0.22 -0.44 -1.22 1.10 4.87Median 7.16 -1.39 -0.40 0.00 -3.09 0.19 0.00 -0.48 -1.54 -2.51 -0.68 5.02
Gulf WarMean 5.98 0.91 -3.59 -4.87 -5.94 -2.80 0.06 -1.25 -2.23 -3.70 -8.16 -14.61Median 3.44 1.15 -0.41 -7.44 -5.64 -2.33 0.00 -1.98 0.66 -0.93 -6.27 -14.63
Sources: Lehman Brothers Fixed-Income Reseaarch and Global Financial Data.

Figure A15. German Bund Reactions to Various Crisis Events, 1914 through June 2002
Long Bund Yields (%) Cumulative Change (bp) in Yields Cumulative Percent Change in YieldsCrisis Long Bund in Number of Months After Reaction in Number of Months After Reaction in Number of Months after ReactionGrade Crisis Events Date Yield (%) 1 2 3 4 6 1 2 3 4 6 1 2 3 4 6A Germany Enters World War I 8/1/1914 4.06 4.17 4.17 4.17 4.17 4.17 11 11 11 11 11 2.70 2.70 2.70 2.70 2.70A U.S. Declares War on Germany 4/6/1917 4.71 4.71 4.71 4.71 4.71 4.71 0 0 0 0 0 0.00 0.00 0.00 0.00 0.00A Pearl Harbor 12/6/1941 4.35 4.35 4.35 4.35 4.35 4.35 0 0 0 0 0 0.00 0.00 0.00 0.00 0.00A Korean War 6/23/1950 5.17 5.21 5.23 5.14 5.11 5.16 4 6 -3 -6 -1 0.78 1.18 -0.51 -1.15 -0.13A Cuban Missile Crisis 10/19/1962 6.00 6.20 6.20 6.10 6.00 6.00 20 20 10 0 0 3.33 3.33 1.67 0.00 0.00A Gulf of Tonkin 8/2/1964 6.30 6.30 6.40 6.40 6.40 6.40 0 10 10 10 10 0.00 1.59 1.59 1.59 1.59A Arab Oil Embargo 10/18/1973 9.60 9.70 9.50 9.60 9.60 10.40 10 -10 0 0 80 1.04 -1.04 0.00 0.00 8.33A Gulf War Ultimatum 12/24/1990 9.06 9.10 8.51 8.56 8.55 8.48 4 -55 -50 -51 -58 0.44 -6.07 -5.52 -5.63 -6.40A WTC Attack 9/11/2001 4.74 4.53 4.21 4.73 4.82 5.13 -21 -53 -1 8 39 -4.43 -11.18 -0.21 1.69 8.23B Archduke Ferdinand Assassinated 6/28/1914 4.03 4.04 4.06 4.17 4.17 4.17 1 3 14 14 14 0.31 0.65 3.37 3.37 3.37B Fall of France 5/9/1940 4.46 4.46 4.46 4.46 4.46 4.40 0 0 0 0 -6 0.00 0.00 0.00 0.00 -1.35B France Falls at Dien Bien Phu 5/8/1954 5.31 5.30 5.29 5.24 5.12 5.04 0 -2 -7 -19 -27 -0.09 -0.39 -1.32 -3.52 -5.11B Sputnik 10/3/1957 7.60 7.70 7.70 7.70 7.70 7.40 10 10 10 10 -20 1.32 1.32 1.32 1.32 -2.63B Soviet Tanks Invade Prague 8/20/1968 6.40 6.30 6.30 6.30 6.30 6.30 -10 -10 -10 -10 -10 -1.56 -1.56 -1.56 -1.56 -1.56B Iranian Revolution 1/16/1979 6.38 6.73 6.85 6.97 7.68 7.84 35 47 59 130 146 5.49 7.37 9.25 20.38 22.88B USSR Invasion of Afghanistan 12/24/1979 7.91 8.10 8.62 9.75 9.09 7.99 19 71 184 118 8 2.40 8.98 23.26 14.92 1.01B U.S. Invades Grenada 10/24/1983 8.08 8.08 8.24 8.15 8.00 7.87 0 16 7 -8 -21 0.00 1.98 0.87 -0.99 -2.60B Invasion of Panama 12/15/1989 7.54 7.93 8.79 8.93 8.90 9.03 39 125 139 136 149 5.17 16.58 18.44 18.04 19.76B Gorbachev Coup 8/16/1991 8.68 8.60 8.46 8.47 8.42 7.96 -8 -22 -21 -26 -72 -0.92 -2.53 -2.42 -3.00 -8.29C Easter Rebellion (Ireland) 4/14/1916 4.73 4.73 4.73 4.73 4.73 4.73 0 0 0 0 0 0.00 0.00 0.00 0.00 0.00C U.S. Bombs Cambodia 4/30/1970 8.10 8.10 8.40 8.70 8.70 8.50 0 30 60 60 40 0.00 3.70 7.41 7.41 4.94C Falkland Islands War 4/1/1982 9.17 8.74 8.80 9.38 9.18 8.55 -43 -37 21 1 -62 -4.69 -4.03 2.29 0.11 -6.76C U.S. Bombs Libya 4/15/1986 5.47 5.81 5.86 5.85 5.64 5.86 34 39 38 17 39 6.22 7.13 6.95 3.11 7.13C U.S. Embassy Bombings in Nairobi and Dar es Salaam 8/7/1998 4.61 4.38 3.98 4.19 3.98 3.78 -23 -63 -42 -63 -83 -4.99 -13.67 -9.11 -13.67 -18.00
1 Hunt Silver Crisis 2/13/1980 8.37 9.33 9.53 8.64 8.25 7.71 96 116 27 -12 -66 11.47 13.86 3.23 -1.43 -7.892 William Mckinley Assassinated 9/6/1901 3.61 3.63 3.64 3.63 3.62 3.52 2 3 2 1 -9 0.55 0.83 0.55 0.28 -2.492 U.S. Finanical Panic of 1907 10/21/1907 3.77 3.79 3.82 3.82 3.81 3.83 2 5 5 4 6 0.53 1.33 1.33 1.06 1.592 Bloody Sunday (N. Ireland) 11/21/1920 6.50 6.37 5.98 6.21 6.16 5.93 -13 -53 -30 -35 -58 -2.05 -8.09 -4.54 -5.34 -8.852 Earthquake in Tokyo 9/1/1923 0.01 0.00 0.00 0.00 0.00 8.05 -1 -1 -1 -1 804 -97.60 -97.60 -97.60 -97.60 64300.002 U.S. Stock Market Crash 10/29/1929 6.48 6.49 6.48 6.48 6.45 6.28 1 0 0 -3 -20 0.15 0.00 0.00 -0.46 -3.092 Truman Upset Victory 11/2/1948 5.14 5.57 5.56 5.14 4.91 5.24 43 41 0 -23 9 8.36 8.06 0.00 -4.42 1.832 Eisenhower Heart Attack 9/23/1955 4.89 4.91 4.93 4.96 4.98 6.07 2 4 7 9 118 0.38 0.75 1.34 1.74 24.192 JFK Assassination 11/21/1963 6.10 6.00 6.00 5.90 5.90 6.20 -10 -10 -20 -20 10 -1.64 -1.64 -3.28 -3.28 1.642 Riots and Labor Strikes in France 5/6/1968 6.60 6.40 6.40 6.40 6.30 6.30 -20 -20 -20 -30 -30 -3.03 -3.03 -3.03 -4.55 -4.552 Kent State Shootings 5/4/1970 8.10 8.40 8.70 8.70 8.40 8.70 30 60 60 30 60 3.70 7.41 7.41 3.70 7.412 Nixon Resigns 8/9/1974 10.70 10.70 10.70 10.70 10.40 9.30 0 0 0 -30 -140 0.00 0.00 0.00 -2.80 -13.082 U.S. Stock Market Crash of 1987 10/2/1987 6.29 6.11 5.88 5.88 5.86 5.66 -18 -41 -41 -43 -63 -2.86 -6.52 -6.52 -6.84 -10.022 ERM U.K. Currency Crisis 9/14/1992 7.99 7.55 7.27 7.17 6.94 6.26 -44 -72 -82 -105 -173 -5.51 -9.01 -10.26 -13.14 -21.652 WTC Bombing 2/26/1993 6.45 6.44 6.52 6.67 6.56 6.21 -1 7 22 11 -24 -0.16 1.09 3.41 1.71 -3.722 Orange County, CA Bankruptcy & Financial Crisis 12/6/1994 7.48 7.75 7.53 7.38 7.05 6.57 27 5 -10 -43 -91 3.61 0.67 -1.34 -5.75 -12.172 Mexico - Tequila Crisis 12/19/1994 7.58 7.65 7.46 7.20 7.05 6.78 7 -12 -38 -53 -80 0.92 -1.58 -5.01 -6.99 -10.552 Poison Gas Attack in Tokyo Subway 3/20/1995 7.19 7.02 6.78 6.78 6.76 6.28 -17 -41 -41 -43 -91 -2.36 -5.70 -5.70 -5.98 -12.662 Oklahoma City Bombing 4/19/1995 7.02 6.78 6.78 6.76 6.71 6.33 -24 -24 -26 -31 -69 -3.42 -3.42 -3.70 -4.42 -9.832 Terrorist Attack in Paris Metro 7/25/1995 6.75 6.62 6.29 6.33 6.06 5.46 -13 -46 -42 -69 -129 -1.93 -6.81 -6.22 -10.22 -19.112 Asian Stock Market Crisis 10/7/1997 5.22 5.51 5.32 5.15 4.94 4.82 29 10 -7 -28 -40 5.56 1.92 -1.34 -5.36 -7.662 Russia, LTCM Crisis 8/18/1998 4.50 4.13 4.13 4.25 3.90 3.81 -37 -37 -25 -60 -69 -8.22 -8.22 -5.56 -13.33 -15.33
OverallMean 3 1 4 -5 1 -1.76 -2.17 -1.70 -3.01 1395.68Median 0 0 0 -2 -10 0.00 0.00 0.00 -0.73 -2.03Geopolitical RiskMean 3 6 18 14 7 0.52 0.67 2.43 1.88 1.13Median 0 1 4 0 0 0.00 0.32 0.43 0.00 0.00Political EventsMean 2 -5 -12 -26 -7 -4.25 -5.26 -6.22 -8.34 2917.00Median 0 -1 -9 -29 -49 -0.08 -0.79 -2.19 -4.48 -7.77High Geopolitical Risk (A)Mean 3 -8 -3 -3 9 0.43 -1.06 -0.03 -0.09 1.59Median 4 0 0 0 0 0.44 0.00 0.00 0.00 0.00Medium Geopolitical Risk (B)Mean 9 24 37 34 16 1.21 3.24 5.12 4.89 2.55Median 1 6 9 5 -8 0.16 0.98 1.09 0.66 -1.45Low Geopolitical Risk (C)Mean -6 -6 15 3 -13 -0.69 -1.37 1.51 -0.61 -2.54Median 0 0 21 1 0 0.00 0.00 2.29 0.11 0.00German Political Events (1)Mean 96 116 27 -12 -66 11.47 13.86 3.23 -1.43 -7.89Median 96 116 27 -12 -66 11.47 13.86 3.23 -1.43 -7.89Non-German Political Events (2)Mean -3 -11 -14 -27 -4 -5.00 -6.17 -6.67 -8.67 3056.28Median -1 -1 -10 -30 -40 -0.16 -1.58 -3.03 -4.55 -7.66
Sources: Lehman Brothers Fixed-Income Reseaarch and Global Financial Data.Crisis Grade Key: A = High Geopolitical Risk, B = Medium Geopolitical Risk, C = Low Geopolitical Risk, 1 = German Political Event, 2 = Non-German Political Event

Figure A16. Performance of Long German Bunds Before and After Military Conflicts, 1914 through June 2002
Long BundYields (%) Cumulative Percent Change (%) in Bund YieldsLong Bund in Number of Months Before/After Military Conflict in Number of Months Before/After Military Conflict
Date Yield (%) -24 -12 -6 -4 -2 -1 1 2 4 6 12 24 -24 -12 -6 -4 -2 -1 1 2 4 6 12 24World War I
Assassination in Sarajevo 6/28/1914 4.03 3.90 4.12 4.11 4.01 4.06 4.02 4.04 4.06 4.17 4.17 4.17 4.73 3.36 -2.16 -1.92 0.63 -0.63 0.16 0.31 0.65 3.37 3.37 3.37 17.32Austria Declares War on Serbia 7/28/1914 4.04 3.91 4.15 4.10 4.01 4.02 4.03 4.06 4.17 4.17 4.17 4.17 4.73 3.41 -2.57 -1.38 0.95 0.47 0.31 0.34 3.05 3.05 3.05 3.05 16.96U.S. Declares War on Germany 4/6/1917 4.71 4.17 4.73 4.73 4.73 4.71 4.71 4.71 4.71 4.71 4.71 4.68 5.12 12.94 -0.50 -0.50 -0.50 0.00 0.00 0.00 0.00 0.00 0.00 -0.58 8.90Austria, Hungary, & Germany Surrender 11/11/1918 4.68 4.73 4.71 4.68 4.68 4.68 4.68 4.68 4.68 5.12 5.26 5.44 6.50 -1.07 -0.58 0.00 0.00 0.00 0.00 0.00 0.00 9.53 12.41 16.18 39.02
World War IIGermany Invades Poland 9/1/1939 4.54 4.52 4.50 4.54 4.54 4.54 4.54 4.54 4.54 4.54 4.50 4.46 4.35 0.44 0.89 0.00 0.00 0.00 0.00 0.00 0.00 0.00 -0.88 -1.76 -4.19Germany Invades France 5/10/1949 5.24 4.51 4.46 5.14 5.56 4.91 5.12 5.32 5.28 5.09 5.08 5.16 5.64 16.16 17.52 1.83 -5.76 6.54 2.23 1.59 0.92 -2.80 -2.92 -1.42 7.67France Surrenders 6/22/1940 4.46 4.50 4.54 4.54 4.50 4.49 4.46 4.46 4.46 4.41 4.44 4.35 4.35 -0.89 -1.76 -1.76 -0.89 -0.67 0.00 0.00 0.00 -1.12 -0.45 -2.47 -2.47Pearl Harbor 12/7/1941 4.35 4.54 4.44 4.35 4.35 4.35 4.35 4.35 4.35 4.35 4.35 4.35 4.25 -4.19 -2.03 0.00 0.00 0.00 0.00 0.00 0.00 0.00 0.00 0.00 -2.30Germany Surrenders 5/7/1945 4.21 4.35 4.21 4.21 4.21 4.21 4.21 4.21 4.21 4.21 4.21 4.53 4.51 -3.22 0.00 0.00 0.00 0.00 0.00 0.00 0.00 0.00 0.00 7.53 7.06Hiroshima/Nagasaki and Japanese Surrender 8/14/1945 4.21 4.24 4.21 4.21 4.21 4.21 4.21 4.21 4.21 4.21 4.53 4.53 4.46 -0.71 0.00 0.00 0.00 0.00 0.00 0.00 0.00 0.00 7.58 7.56 5.82
KoreaNorth Korea Invades 6/25/1950 5.17 4.46 5.28 5.08 5.10 5.13 5.16 5.21 5.23 5.11 5.16 5.67 4.87 16.00 -2.20 1.68 1.42 0.65 0.13 0.78 1.18 -1.15 -0.13 9.77 -5.71Cease Fire Signed 7/27/1953 4.94 5.83 4.91 4.75 4.73 4.80 4.88 4.98 5.09 5.14 5.25 5.29 4.92 -15.23 0.65 3.99 4.40 2.83 1.28 0.86 3.11 4.05 6.33 7.07 -0.40
VietnamGulf of Tonkin 8/2/1964 6.30 5.90 6.10 5.90 6.00 6.30 6.30 6.30 6.40 6.40 6.40 7.10 8.40 6.78 3.28 6.78 5.00 0.00 0.00 0.00 1.59 1.59 1.59 12.70 33.33U.S. Marines Sent 3/8/1965 6.50 6.00 5.90 6.30 6.40 6.40 6.40 6.50 6.60 7.10 7.30 7.60 7.50 8.33 10.17 3.17 1.56 1.56 1.56 0.00 1.54 9.23 12.31 16.92 15.38North Vietnam Overtakes Saigon 4/30/1975 8.60 8.80 10.40 10.70 9.80 8.80 8.70 8.60 8.30 8.20 8.30 7.50 6.18 -2.27 -17.31 -19.63 -12.24 -2.27 -1.15 0.00 -3.49 -4.65 -3.49 -12.79 -28.14
Gulf WarIraq Invades Kuwait 8/2/1990 8.79 6.52 6.77 8.12 8.74 8.98 8.84 9.08 9.22 9.03 8.98 8.87 8.33 34.82 29.84 8.25 0.57 -2.12 -0.57 3.30 4.89 2.73 2.16 0.91 -5.23U.N. Authorizes Force 11/29/1990 9.03 6.30 7.62 8.98 8.73 9.24 9.09 9.10 9.01 8.62 8.43 8.47 7.30 43.33 18.50 0.56 3.44 -2.27 -0.66 0.78 -0.22 -4.54 -6.64 -6.20 -19.16Desert Storm Begins 1/17/1991 9.15 6.56 8.04 8.69 9.14 9.11 8.95 8.46 8.50 8.52 8.73 8.12 6.96 39.48 13.81 5.29 0.11 0.44 2.23 -7.54 -7.10 -6.89 -4.59 -11.26 -23.93Ground Assault Begins 2/24/1991 8.51 6.86 9.04 9.08 9.09 9.06 9.00 8.61 8.53 8.50 8.69 8.01 6.79 24.05 -5.86 -6.28 -6.38 -6.07 -5.44 1.18 0.24 -0.12 2.12 -5.88 -20.21Kuwait Liberated 2/27/1991 8.56 6.93 9.08 9.08 9.09 9.10 9.01 8.62 8.54 8.55 8.69 8.01 6.76 23.52 -5.73 -5.73 -5.83 -5.93 -4.99 0.70 -0.23 -0.12 1.52 -6.43 -21.03
War on TerrorismAfghanistan-U.S. Bombing Begins 10/7/2001 4.54 5.38 5.47 4.70 4.98 4.87 4.74 4.23 4.68 4.84 5.10 - - -15.61 -17.00 -3.40 -8.84 -6.78 -4.22 -6.83 3.08 6.61 12.33 - -
OverallMean 9.02 1.76 -0.43 -1.06 -0.68 -0.43 -0.22 0.44 0.89 2.17 1.81 0.93Median 3.41 -0.50 0.00 0.00 0.00 0.00 0.00 0.00 0.00 1.52 0.46 -1.35
World War IMean 4.66 -1.45 -0.95 0.27 -0.04 0.12 0.16 0.92 3.99 4.71 5.51 20.55Median 3.38 -1.37 -0.94 0.32 0.00 0.08 0.16 0.32 3.21 3.21 3.21 17.14
World War IIMean 1.27 2.44 0.01 -1.11 0.98 0.37 0.27 0.15 -0.65 0.55 1.57 1.93Median -0.80 0.00 0.00 0.00 0.00 0.00 0.00 0.00 0.00 -0.22 -0.71 1.76
VietnamMean 4.28 -1.29 -3.22 -1.89 -0.24 0.14 0.00 -0.12 2.06 3.47 5.61 6.86Median 6.78 3.28 3.17 1.56 0.00 0.00 0.00 1.54 1.59 1.59 12.70 15.38
Gulf WarMean 33.04 10.11 0.42 -1.62 -3.19 -1.89 -0.32 -0.49 -1.79 -1.09 -5.77 -17.91Median 34.82 13.81 0.56 0.11 -2.27 -0.66 0.78 -0.22 -0.12 1.52 -6.20 -20.21
Sources: Lehman Brothers Fixed-Income Reseaarch and Global Financial Data.

Figure A17. JGB Reactions to Various Crisis Events, 1914 through June 2002
Long JGB Yields (%) Cumulative Change (bp) in Yields Cumulative Percent Change in YieldsCrisis Long JGB in Number of Months After Reaction in Number of Months After Reaction in Number of Months after ReactionGrade Crisis Events Date Yield (%) 1 2 3 4 6 1 2 3 4 6 1 2 3 4 6A Germany Enters World War I 8/1/1914 5.88 5.88 5.88 5.88 5.88 5.68 0 0 0 0 -20 0.00 0.00 0.00 0.00 -3.41A U.S. Declares War on Germany 4/6/1917 5.12 5.12 5.25 5.18 5.18 5.19 -1 13 6 5 7 -0.10 2.52 1.14 1.03 1.35A Pearl Harbor 12/6/1941 3.82 3.82 3.81 3.80 3.80 3.79 0 -1 -2 -2 -3 0.08 -0.31 -0.45 -0.58 -0.71A Korean War 6/23/1950 5.50 5.50 5.50 5.50 5.50 5.50 0 0 0 0 0 0.00 0.00 0.00 0.00 0.00A Cuban Missile Crisis 10/19/1962 10.65 10.58 10.31 9.79 9.04 8.76 -7 -34 -86 -161 -189 -0.66 -3.19 -8.08 -15.12 -17.75A Gulf of Tonkin 8/2/1964 9.74 9.66 9.65 9.94 9.91 9.83 -8 -9 20 17 9 -0.82 -0.92 2.05 1.75 0.92A Arab Oil Embargo 10/18/1973 7.52 7.61 7.71 8.78 9.00 9.20 9 19 126 148 168 1.20 2.53 16.76 19.68 22.34A Gulf War Ultimatum 12/24/1990 6.73 6.84 6.33 6.55 6.70 6.80 11 -40 -18 -3 7 1.66 -5.92 -2.65 -0.42 1.07A WTC Attack 9/11/2001 1.42 1.36 1.32 1.35 1.38 1.47 -6 -10 -7 -4 5 -4.23 -7.04 -4.93 -2.82 3.52B Archduke Ferdinand Assassinated 6/28/1914 5.19 5.33 5.88 5.88 5.88 5.92 14 69 69 69 73 2.67 13.24 13.24 13.24 14.04B Fall of France 5/9/1940 3.79 3.79 3.79 3.79 3.79 3.88 0 0 0 0 9 -0.05 -0.11 0.05 -0.03 2.29B France Falls at Dien Bien Phu 5/8/1954 6.32 6.32 6.32 6.32 6.32 6.32 0 0 0 0 0 0.00 0.00 0.00 0.00 0.00B Sputnik 10/3/1957 10.80 10.80 10.70 11.20 10.60 9.30 0 -10 40 -20 -150 0.00 -0.93 3.70 -1.85 -13.89B Soviet Tanks Invade Prague 8/20/1968 7.04 7.04 7.05 7.05 7.05 7.05 0 1 1 1 1 0.00 0.14 0.14 0.14 0.14B Iranian Revolution 1/16/1979 6.10 6.11 6.37 6.95 7.66 8.07 1 27 85 156 197 0.16 4.43 13.93 25.57 32.30B USSR Invasion of Afghanistan 12/24/1979 8.76 8.64 8.52 9.32 9.97 8.40 -12 -24 56 121 -36 -1.37 -2.80 6.43 13.85 -4.11B U.S. Invades Grenada 10/24/1983 7.72 7.57 7.40 7.43 7.41 7.18 -15 -32 -29 -31 -54 -1.94 -4.15 -3.76 -4.02 -6.99B Invasion of Panama 12/15/1989 5.47 6.18 6.36 6.82 6.89 6.66 71 88 135 141 119 12.93 16.13 24.59 25.83 21.68B Gorbachev Coup 8/16/1991 6.54 6.07 5.94 5.85 5.61 5.51 -47 -60 -69 -93 -103 -7.19 -9.17 -10.55 -14.22 -15.75C Easter Rebellion (Ireland) 4/14/1916 5.26 5.15 5.25 5.05 5.12 5.03 -11 -1 -21 -14 -24 -2.01 -0.10 -3.99 -2.71 -4.47C U.S. Bombs Cambodia 4/30/1970 7.16 7.16 7.17 7.19 7.19 7.21 0 1 3 3 5 0.00 0.14 0.42 0.42 0.70C Falkland Islands War 4/1/1982 7.73 7.70 8.10 8.52 8.52 8.44 -3 37 79 79 71 -0.39 4.79 10.22 10.22 9.18C U.S. Bombs Libya 4/15/1986 4.95 5.04 5.18 5.13 5.11 5.71 9 23 18 16 76 1.82 4.65 3.63 3.19 15.36C U.S. Embassy Bombings in Nairobi and Dar es Salaam 8/7/1998 1.48 1.33 0.73 0.86 1.09 2.34 -15 -75 -62 -39 86 -10.14 -50.68 -41.89 -26.35 58.11
1 Hunt Silver Crisis 2/13/1980 8.52 9.32 9.97 9.94 8.40 8.47 81 146 142 -12 -4 9.49 17.12 16.72 -1.35 -0.531 Earthquake in Tokyo 9/1/1923 5.70 5.85 5.85 5.84 5.70 5.75 15 15 14 0 6 2.69 2.69 2.51 0.06 0.981 Poison Gas Attack in Tokyo Subway 3/20/1995 3.96 3.32 3.18 2.95 2.92 3.01 -64 -78 -101 -104 -95 -16.16 -19.70 -25.51 -26.26 -23.991 Asian Stock Market Crisis 10/7/1997 1.86 1.72 1.73 1.89 1.99 1.91 -14 -13 3 13 5 -7.53 -6.99 1.61 6.99 2.692 William Mckinley Assassinated 9/6/1901 5.23 5.23 5.19 5.19 4.94 4.82 0 -3 -3 -29 -41 0.00 -0.65 -0.65 -5.56 -7.832 U.S. Finanical Panic of 1907 10/21/1907 4.79 4.76 4.78 4.73 4.88 4.91 -3 -1 -6 9 12 -0.59 -0.30 -1.18 1.83 2.452 Bloody Sunday (N. Ireland) 11/21/1920 6.12 6.01 5.79 5.88 5.94 5.91 -11 -33 -24 -18 -21 -1.86 -5.44 -4.00 -2.97 -3.492 U.S. Stock Market Crash 10/29/1929 5.05 5.05 5.05 5.05 5.21 5.25 0 0 0 16 20 0.00 0.00 0.00 3.15 3.902 Truman Upset Victory 11/2/1948 3.69 3.69 5.54 5.55 5.56 5.52 0 185 186 187 183 0.00 50.15 50.37 50.58 49.552 Eisenhower Heart Attack 9/23/1955 11.00 10.10 9.50 8.70 8.60 8.50 -90 -150 -230 -240 -250 -8.18 -13.64 -20.91 -21.82 -22.732 JFK Assassination 11/21/1963 8.85 9.01 9.56 9.50 9.47 9.40 16 71 65 62 55 1.81 8.02 7.34 7.01 6.212 Riots and Labor Strikes in France 5/6/1968 7.02 7.03 7.03 7.04 7.04 7.05 1 1 2 2 3 0.14 0.14 0.28 0.28 0.432 Kent State Shootings 5/4/1970 7.16 7.17 7.19 7.19 7.20 7.22 1 3 3 4 6 0.14 0.42 0.42 0.56 0.842 Nixon Resigns 8/9/1974 9.07 9.33 9.53 9.41 9.59 9.70 26 46 34 52 63 2.87 5.07 3.75 5.73 6.952 U.S. Stock Market Crash of 1987 10/2/1987 6.10 4.81 5.02 4.96 4.30 4.55 -129 -108 -114 -180 -155 -21.15 -17.70 -18.69 -29.51 -25.412 ERM U.K. Currency Crisis 9/14/1992 4.82 4.86 4.62 4.62 4.43 3.95 4 -20 -20 -39 -87 0.83 -4.15 -4.15 -8.09 -18.052 WTC Bombing 2/26/1993 3.87 4.19 4.43 4.60 4.41 4.14 32 56 73 54 27 8.27 14.47 18.86 13.95 6.982 Orange County, CA Bankruptcy & Financial Crisis 12/6/1994 4.63 4.72 4.68 4.21 3.52 2.90 9 5 -42 -111 -173 1.94 1.08 -9.07 -23.97 -37.372 Mexico - Tequila Crisis 12/19/1994 4.62 4.67 4.58 3.91 3.19 2.95 5 -4 -71 -143 -167 1.08 -0.87 -15.37 -30.95 -36.152 Oklahoma City Bombing 4/19/1995 3.32 3.18 2.95 2.92 3.25 2.66 -14 -37 -40 -7 -66 -4.22 -11.14 -12.05 -2.11 -19.882 Terrorist Attack in Paris Metro 7/25/1995 2.86 3.21 2.65 2.81 2.69 2.96 35 -21 -5 -17 10 12.24 -7.34 -1.75 -5.94 3.502 Russia, LTCM Crisis 8/18/1998 1.44 0.84 0.87 0.85 1.36 2.08 -60 -57 -59 -8 64 -41.67 -39.58 -40.97 -5.56 44.44
OverallMean -4 0 3 -3 -8 -1.48 -1.42 -0.70 -0.59 1.07Median 0 0 0 0 5 0.00 -0.11 0.00 0.00 0.77Geopolitical RiskMean 0 -1 14 16 11 -0.35 -1.53 0.83 1.95 4.83Median 0 0 1 0 5 0.00 -0.05 0.10 0.00 0.81Political EventsMean -7 0 -9 -23 -28 -2.72 -1.29 -2.38 -3.36 -3.02Median 0 -2 -4 -7 4 0.07 -0.47 -0.92 -1.73 0.63High Geopolitical Risk (A)Mean 0 -7 4 0 -2 -0.32 -1.37 0.43 0.39 0.82Median 0 -1 0 0 5 0.00 -0.31 0.00 0.00 0.92Medium Geopolitical Risk (B)Mean 1 6 29 34 6 0.52 1.68 4.78 5.85 2.97Median 0 0 20 0 0 0.00 -0.05 1.92 0.07 0.07Low Geopolitical Risk (C)Mean -4 -3 3 9 43 -2.14 -8.24 -6.32 -3.05 15.77Median -3 1 3 3 71 -0.39 0.14 0.42 0.42 9.18Japanese Political Events (1)Mean 5 18 15 -26 -22 -2.88 -1.72 -1.16 -5.14 -5.21Median 1 1 9 -6 0 -2.42 -2.15 2.06 -0.65 0.22Non-Japanese Political Events (2)Mean -10 -4 -14 -23 -29 -2.69 -1.19 -2.65 -2.97 -2.54Median 0 -2 -5 -7 4 0.07 -0.47 -1.47 -2.54 0.63
Sources: Lehman Brothers Fixed-Income Reseaarch and Global Financial Data.Crisis Grade Key: A = High Geopolitical Risk, B = Medium Geopolitical Risk, C = Low Geopolitical Risk, 1 = Japanese Political Event, 2 = Non-Japanese Political Event
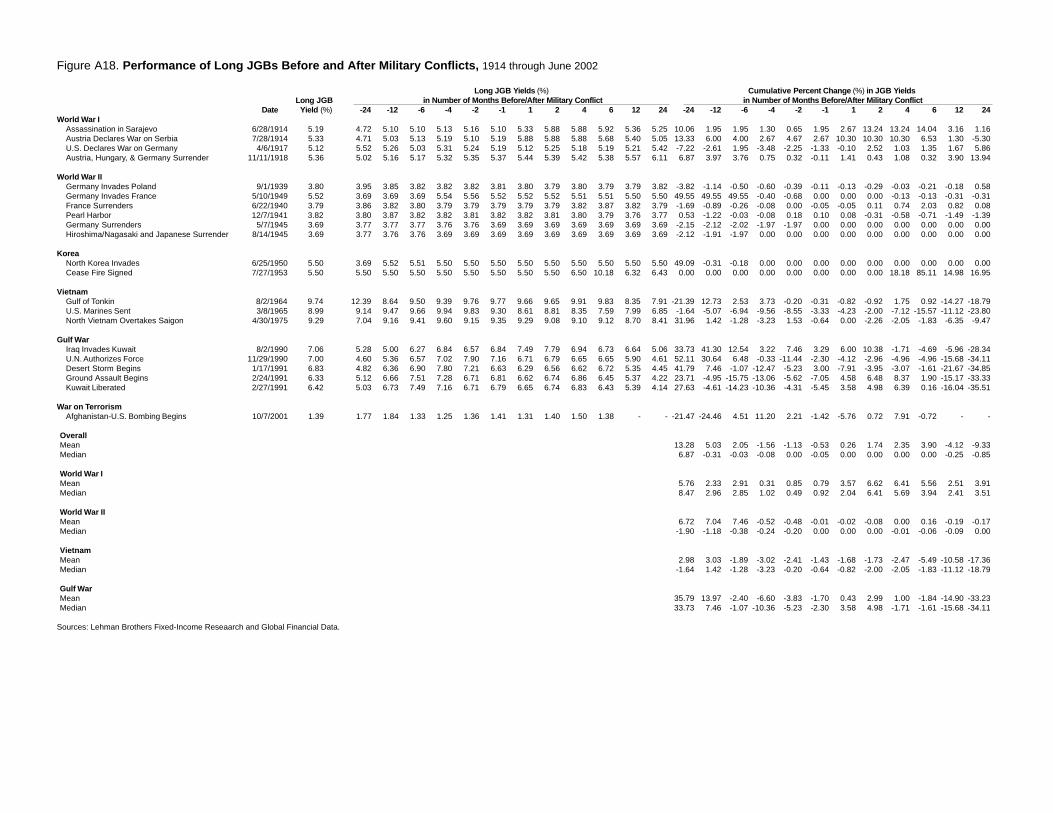
Figure A18. Performance of Long JGBs Before and After Military Conflicts, 1914 through June 2002
Long JGB Yields (%) Cumulative Percent Change (%) in JGB YieldsLong JGB in Number of Months Before/After Military Conflict in Number of Months Before/After Military Conflict
Date Yield (%) -24 -12 -6 -4 -2 -1 1 2 4 6 12 24 -24 -12 -6 -4 -2 -1 1 2 4 6 12 24World War I
Assassination in Sarajevo 6/28/1914 5.19 4.72 5.10 5.10 5.13 5.16 5.10 5.33 5.88 5.88 5.92 5.36 5.25 10.06 1.95 1.95 1.30 0.65 1.95 2.67 13.24 13.24 14.04 3.16 1.16Austria Declares War on Serbia 7/28/1914 5.33 4.71 5.03 5.13 5.19 5.10 5.19 5.88 5.88 5.88 5.68 5.40 5.05 13.33 6.00 4.00 2.67 4.67 2.67 10.30 10.30 10.30 6.53 1.30 -5.30U.S. Declares War on Germany 4/6/1917 5.12 5.52 5.26 5.03 5.31 5.24 5.19 5.12 5.25 5.18 5.19 5.21 5.42 -7.22 -2.61 1.95 -3.48 -2.25 -1.33 -0.10 2.52 1.03 1.35 1.67 5.86Austria, Hungary, & Germany Surrender 11/11/1918 5.36 5.02 5.16 5.17 5.32 5.35 5.37 5.44 5.39 5.42 5.38 5.57 6.11 6.87 3.97 3.76 0.75 0.32 -0.11 1.41 0.43 1.08 0.32 3.90 13.94
World War IIGermany Invades Poland 9/1/1939 3.80 3.95 3.85 3.82 3.82 3.82 3.81 3.80 3.79 3.80 3.79 3.79 3.82 -3.82 -1.14 -0.50 -0.60 -0.39 -0.11 -0.13 -0.29 -0.03 -0.21 -0.18 0.58Germany Invades France 5/10/1949 5.52 3.69 3.69 3.69 5.54 5.56 5.52 5.52 5.52 5.51 5.51 5.50 5.50 49.55 49.55 49.55 -0.40 -0.68 0.00 0.00 0.00 -0.13 -0.13 -0.31 -0.31France Surrenders 6/22/1940 3.79 3.86 3.82 3.80 3.79 3.79 3.79 3.79 3.79 3.82 3.87 3.82 3.79 -1.69 -0.89 -0.26 -0.08 0.00 -0.05 -0.05 0.11 0.74 2.03 0.82 0.08Pearl Harbor 12/7/1941 3.82 3.80 3.87 3.82 3.82 3.81 3.82 3.82 3.81 3.80 3.79 3.76 3.77 0.53 -1.22 -0.03 -0.08 0.18 0.10 0.08 -0.31 -0.58 -0.71 -1.49 -1.39Germany Surrenders 5/7/1945 3.69 3.77 3.77 3.77 3.76 3.76 3.69 3.69 3.69 3.69 3.69 3.69 3.69 -2.15 -2.12 -2.02 -1.97 -1.97 0.00 0.00 0.00 0.00 0.00 0.00 0.00Hiroshima/Nagasaki and Japanese Surrender 8/14/1945 3.69 3.77 3.76 3.76 3.69 3.69 3.69 3.69 3.69 3.69 3.69 3.69 3.69 -2.12 -1.91 -1.97 0.00 0.00 0.00 0.00 0.00 0.00 0.00 0.00 0.00
KoreaNorth Korea Invades 6/25/1950 5.50 3.69 5.52 5.51 5.50 5.50 5.50 5.50 5.50 5.50 5.50 5.50 5.50 49.09 -0.31 -0.18 0.00 0.00 0.00 0.00 0.00 0.00 0.00 0.00 0.00Cease Fire Signed 7/27/1953 5.50 5.50 5.50 5.50 5.50 5.50 5.50 5.50 5.50 6.50 10.18 6.32 6.43 0.00 0.00 0.00 0.00 0.00 0.00 0.00 0.00 18.18 85.11 14.98 16.95
VietnamGulf of Tonkin 8/2/1964 9.74 12.39 8.64 9.50 9.39 9.76 9.77 9.66 9.65 9.91 9.83 8.35 7.91 -21.39 12.73 2.53 3.73 -0.20 -0.31 -0.82 -0.92 1.75 0.92 -14.27 -18.79U.S. Marines Sent 3/8/1965 8.99 9.14 9.47 9.66 9.94 9.83 9.30 8.61 8.81 8.35 7.59 7.99 6.85 -1.64 -5.07 -6.94 -9.56 -8.55 -3.33 -4.23 -2.00 -7.12 -15.57 -11.12 -23.80North Vietnam Overtakes Saigon 4/30/1975 9.29 7.04 9.16 9.41 9.60 9.15 9.35 9.29 9.08 9.10 9.12 8.70 8.41 31.96 1.42 -1.28 -3.23 1.53 -0.64 0.00 -2.26 -2.05 -1.83 -6.35 -9.47
Gulf WarIraq Invades Kuwait 8/2/1990 7.06 5.28 5.00 6.27 6.84 6.57 6.84 7.49 7.79 6.94 6.73 6.64 5.06 33.73 41.30 12.54 3.22 7.46 3.29 6.00 10.38 -1.71 -4.69 -5.96 -28.34U.N. Authorizes Force 11/29/1990 7.00 4.60 5.36 6.57 7.02 7.90 7.16 6.71 6.79 6.65 6.65 5.90 4.61 52.11 30.64 6.48 -0.33 -11.44 -2.30 -4.12 -2.96 -4.96 -4.96 -15.68 -34.11Desert Storm Begins 1/17/1991 6.83 4.82 6.36 6.90 7.80 7.21 6.63 6.29 6.56 6.62 6.72 5.35 4.45 41.79 7.46 -1.07 -12.47 -5.23 3.00 -7.91 -3.95 -3.07 -1.61 -21.67 -34.85Ground Assault Begins 2/24/1991 6.33 5.12 6.66 7.51 7.28 6.71 6.81 6.62 6.74 6.86 6.45 5.37 4.22 23.71 -4.95 -15.75 -13.06 -5.62 -7.05 4.58 6.48 8.37 1.90 -15.17 -33.33Kuwait Liberated 2/27/1991 6.42 5.03 6.73 7.49 7.16 6.71 6.79 6.65 6.74 6.83 6.43 5.39 4.14 27.63 -4.61 -14.23 -10.36 -4.31 -5.45 3.58 4.98 6.39 0.16 -16.04 -35.51
War on TerrorismAfghanistan-U.S. Bombing Begins 10/7/2001 1.39 1.77 1.84 1.33 1.25 1.36 1.41 1.31 1.40 1.50 1.38 - - -21.47 -24.46 4.51 11.20 2.21 -1.42 -5.76 0.72 7.91 -0.72 - -
OverallMean 13.28 5.03 2.05 -1.56 -1.13 -0.53 0.26 1.74 2.35 3.90 -4.12 -9.33Median 6.87 -0.31 -0.03 -0.08 0.00 -0.05 0.00 0.00 0.00 0.00 -0.25 -0.85
World War IMean 5.76 2.33 2.91 0.31 0.85 0.79 3.57 6.62 6.41 5.56 2.51 3.91Median 8.47 2.96 2.85 1.02 0.49 0.92 2.04 6.41 5.69 3.94 2.41 3.51
World War IIMean 6.72 7.04 7.46 -0.52 -0.48 -0.01 -0.02 -0.08 0.00 0.16 -0.19 -0.17Median -1.90 -1.18 -0.38 -0.24 -0.20 0.00 0.00 0.00 -0.01 -0.06 -0.09 0.00
VietnamMean 2.98 3.03 -1.89 -3.02 -2.41 -1.43 -1.68 -1.73 -2.47 -5.49 -10.58 -17.36Median -1.64 1.42 -1.28 -3.23 -0.20 -0.64 -0.82 -2.00 -2.05 -1.83 -11.12 -18.79
Gulf WarMean 35.79 13.97 -2.40 -6.60 -3.83 -1.70 0.43 2.99 1.00 -1.84 -14.90 -33.23Median 33.73 7.46 -1.07 -10.36 -5.23 -2.30 3.58 4.98 -1.71 -1.61 -15.68 -34.11
Sources: Lehman Brothers Fixed-Income Reseaarch and Global Financial Data.

Figure A19. Performance of Moody’s Long U.S. Industrial Spreads After Crisis Events, 1920 through June 2002
Baa Spread (bp) Cumulative Change (bp) in Spread Cumulative Percent Change in SpreadCrisis Baa Industrial in Number of Months After Reaction in Number of Months After Reaction in Number of Months after ReactionGrade Crisis Events Date Spread 1 2 3 4 6 1 2 3 4 6 1 2 3 4 6A Pearl Harbor 12/6/1941 113.00 114.00 115.00 116.00 110.00 106.00 100 200 300 -300 -700 0.88 1.77 2.65 -2.65 -6.19A Korean War 6/23/1950 53.00 54.00 53.00 49.00 48.00 46.00 100 0 -400 -500 -700 1.89 0.00 -7.55 -9.43 -13.21A Cuban Missile Crisis 10/19/1962 102.00 104.00 103.00 102.00 97.00 94.00 200 100 0 -500 -800 1.96 0.98 0.00 -4.90 -7.84A Gulf of Tonkin 8/2/1964 71.00 68.00 68.00 68.00 72.00 71.00 -300 -300 -300 100 0 -4.23 -4.23 -4.23 1.41 0.00A Arab Oil Embargo 10/18/1973 94.00 87.00 100.00 90.00 91.00 68.00 -700 600 -400 -300 -2600 -7.45 6.38 -4.26 -3.19 -27.66A Gulf War Ultimatum 12/24/1990 266.00 267.00 242.00 214.00 203.00 166.00 100 -2400 -5200 -6300 -10000 0.38 -9.02 -19.55 -23.68 -37.59A WTC Attack 9/11/2001 265.00 291.00 255.00 233.95 215.95 207.40 2600 -1000 -3105 -4905 -5760 9.81 -3.77 -11.72 -18.51 -21.74B Fall of France 5/9/1940 184.00 199.00 192.00 190.00 188.00 191.00 1500 800 600 400 700 8.15 4.35 3.26 2.17 3.80B France Falls at Dien Bien Phu 5/8/1954 80.00 84.00 96.00 92.00 86.00 79.00 400 1600 1200 600 -100 5.00 20.00 15.00 7.50 -1.25B Sputnik 10/3/1957 130.00 147.00 167.00 151.00 151.00 144.00 1700 3700 2100 2100 1400 13.08 28.46 16.15 16.15 10.77B Soviet Tanks Invade Prague 8/20/1968 171.00 167.00 158.00 165.00 160.00 140.00 -400 -1300 -600 -1100 -3100 -2.34 -7.60 -3.51 -6.43 -18.13B Iranian Revolution 1/16/1979 102.00 89.00 95.00 103.00 105.00 118.00 -1300 -700 100 300 1600 -12.75 -6.86 0.98 2.94 15.69B USSR Invasion of Afghanistan 12/24/1979 149.00 132.00 60.00 130.00 263.00 297.00 -1700 -8900 -1900 11400 14800 -11.41 -59.73 -12.75 76.51 99.33B U.S. Invades Grenada 10/24/1983 137.00 135.00 139.00 149.00 118.00 113.00 -200 200 1200 -1900 -2400 -1.46 1.46 8.76 -13.87 -17.52B Invasion of Panama 12/15/1989 213.00 188.00 182.00 179.00 171.00 201.00 -2500 -3100 -3400 -4200 -1200 -11.74 -14.55 -15.96 -19.72 -5.63B Gorbachev Coup 8/16/1991 168.00 173.00 172.00 171.00 176.00 151.00 500 400 300 800 -1700 2.98 2.38 1.79 4.76 -10.12C U.S. Bombs Cambodia 4/30/1970 180.00 158.00 171.00 230.00 225.00 234.00 -2200 -900 5000 4500 5400 -12.22 -5.00 27.78 25.00 30.00C Falkland Islands War 4/1/1982 318.00 336.00 336.00 271.00 295.00 350.00 1800 1800 -4700 -2300 3200 5.66 5.66 -14.78 -7.23 10.06C U.S. Bombs Libya 4/15/1986 335.00 303.00 308.00 337.00 333.00 225.00 -3200 -2700 200 -200 -11000 -9.55 -8.06 0.60 -0.60 -32.84C U.S. Embassy Bombings in Nairobi and Dar es Salaam 8/7/1998 155.00 184.00 222.00 212.00 216.00 200.00 2900 6700 5700 6100 4500 18.71 43.23 36.77 39.35 29.03
1 U.S. Stock Market Crash 10/29/1929 258.00 300.00 289.00 278.00 270.00 245.00 4200 3100 2000 1200 -1300 16.28 12.02 7.75 4.65 -5.041 Truman Upset Victory 11/2/1948 72.00 71.00 68.00 68.00 69.00 67.00 -100 -400 -400 -300 -500 -1.39 -5.56 -5.56 -4.17 -6.941 Eisenhower Heart Attack 9/23/1955 62.00 66.00 64.00 65.00 67.00 62.00 400 200 300 500 0 6.45 3.23 4.84 8.06 0.001 JFK Assassination 11/21/1963 79.00 76.00 75.00 74.00 70.00 75.00 -300 -400 -500 -900 -400 -3.80 -5.06 -6.33 -11.39 -5.061 Kent State Shootings 5/4/1970 158.00 171.00 230.00 225.00 241.00 234.00 1300 7200 6700 8300 7600 8.23 45.57 42.41 52.53 48.101 Nixon Resigns 8/9/1974 79.00 118.00 155.00 182.00 194.00 227.00 3900 7600 10300 11500 14800 49.37 96.20 130.38 145.57 187.341 Hunt Silver Crisis 2/13/1980 60.00 130.00 263.00 305.00 297.00 179.00 7000 20300 24500 23700 11900 116.67 338.33 408.33 395.00 198.331 U.S. Stock Market Crash of 1987 10/2/1987 172.00 210.00 190.00 190.00 196.00 182.00 3800 1800 1800 2400 1000 22.09 10.47 10.47 13.95 5.811 WTC Bombing 2/26/1993 139.00 137.00 132.00 132.00 128.00 128.00 -200 -700 -700 -1100 -1100 -1.44 -5.04 -5.04 -7.91 -7.911 Orange County, CA Bankruptcy & Financial Crisis 12/6/1994 118.00 116.00 116.00 117.00 117.00 122.00 -200 -200 -100 -100 400 -1.69 -1.69 -0.85 -0.85 3.391 Oklahoma City Bombing 4/19/1995 117.00 115.00 122.00 125.00 129.00 131.00 -200 500 800 1200 1400 -1.71 4.27 6.84 10.26 11.972 Bloody Sunday (N. Ireland) 11/21/1920 285.00 314.00 327.00 295.00 315.00 291.00 2900 4200 1000 3000 600 10.18 14.74 3.51 10.53 2.112 Earthquake in Tokyo 9/1/1923 279.00 281.00 281.00 287.00 286.00 283.00 200 200 800 700 400 0.72 0.72 2.87 2.51 1.432 Riots and Labor Strikes in France 5/6/1968 155.00 182.00 189.00 171.00 167.00 165.00 2700 3400 1600 1200 1000 17.42 21.94 10.32 7.74 6.452 ERM U.K. Currency Crisis 9/14/1992 136.00 138.00 145.00 150.00 143.00 137.00 200 900 1400 700 100 1.47 6.62 10.29 5.15 0.742 Mexico - Tequila Crisis 12/19/1994 118.00 116.00 116.00 117.00 117.00 122.00 -200 -200 -100 -100 400 -1.69 -1.69 -0.85 -0.85 3.392 Poison Gas Attack in Tokyo Subway 3/20/1995 117.00 117.00 115.00 122.00 125.00 133.00 0 -200 500 800 1600 0.00 -1.71 4.27 6.84 13.682 Terrorist Attack in Paris Metro 7/25/1995 125.00 129.00 133.00 131.00 129.00 124.00 400 800 600 400 -100 3.20 6.40 4.80 3.20 -0.802 Asian Stock Market Crisis 10/7/1997 115.00 124.00 125.00 130.00 126.00 137.00 900 1000 1500 1100 2200 7.83 8.70 13.04 9.57 19.132 Russia, LTCM Crisis 8/18/1998 155.00 184.00 222.00 212.00 216.00 200.00 2900 6700 5700 6100 4500 18.71 43.23 36.77 39.35 29.03
OverallMean 725 1265 1360 1602 901 6.56 14.69 17.44 18.88 12.60Median 200 200 400 450 250 1.68 2.08 3.06 3.07 1.08Geopolitical RiskMean -30 -260 -165 190 -423 -0.23 -0.21 0.97 3.28 -0.05Median 100 50 50 -250 -700 0.63 0.49 0.30 -1.63 -5.91Political EventsMean 1480 2790 2885 3015 2225 13.34 29.58 33.91 34.49 25.26Median 400 850 900 950 500 4.83 6.51 5.84 7.29 3.39High Geopolitical Risk (A)Mean 300 -400 -1301 -1815 -2937 0.46 -1.13 -6.38 -8.71 -16.32Median 100 0 -400 -500 -800 0.88 0.00 -4.26 -4.90 -13.21Medium Geopolitical Risk (B)Mean -222 -811 -44 933 1111 -1.17 -3.57 1.52 7.78 8.55Median -200 200 300 400 -100 -1.46 1.46 1.79 2.94 -1.25Low Geopolitical Risk (C)Mean -175 1225 1550 2025 525 0.65 8.96 12.59 14.13 9.06Median -200 450 2600 2150 3850 -1.95 0.33 14.19 12.20 19.55U.S. Political Events (1)Mean 1782 3545 4064 4218 3073 19.01 44.79 53.93 55.06 39.09Median 400 500 800 1200 400 6.45 4.27 6.84 8.06 3.39Non-U.S. Political Events (2)Mean 1111 1867 1444 1544 1189 6.42 10.99 9.45 9.34 8.35Median 400 900 1000 800 600 3.20 6.62 4.80 6.84 3.39
Sources: Lehman Brothers Fixed-Income Reseaarch and Global Financial Data.Crisis Grade Key: A = High Geopolitical Risk, B = Medium Geopolitical Risk, C = Low Geopolitical Risk, 1 = U.S. Political Event, 2 = Non-U.S. Political Event

Figure A20. Performance of Moody’s U.S. Industrial Spreads Before and After Military Conflicts, 1939 through June 2002
Baa Industrial Spread (bp) Cumulative Percent Change (%) in Baa Industrial Spread Baa Industrial in Number of Months Before/After Military Conflict in Number of Months Before/After Military Conflict
Date Spread -24 -12 -6 -4 -2 -1 1 2 4 6 12 24 -24 -12 -6 -4 -2 -1 1 2 4 6 12 24World War II
Germany Invades Poland 9/1/1939 172 145 191 191 216 204 198 167 167 180 179 190 157 18.62 -9.95 -9.95 -20.37 -15.69 -13.13 -2.91 -2.91 4.65 4.07 10.47 -8.72Germany Invades France 5/10/1949 67 64 68 72 68 69 68 68 76 74 73 54 42 4.69 -1.47 -6.94 -1.47 -2.90 -1.47 1.49 13.43 10.45 8.96 -19.40 -37.31France Surrenders 6/22/1940 199 192 209 180 179 177 184 192 190 186 193 166 106 3.65 -4.78 10.56 11.17 12.43 8.15 -3.52 -4.52 -6.53 -3.02 -16.58 -46.73Pearl Harbor 12/7/1941 113 180 193 166 157 150 116 114 115 110 106 107 85 -37.22 -41.45 -31.93 -28.03 -24.67 -2.59 0.88 1.77 -2.65 -6.19 -5.31 -24.78Germany Surrenders 5/7/1945 57 96 68 60 58 59 59 62 63 58 56 65 66 -40.63 -16.18 -5.00 -1.72 -3.39 -3.39 8.77 10.53 1.75 -1.75 14.04 15.79Hiroshima/Nagasaki and Japanese Surrender 8/14/1945 62 83 63 61 59 62 63 58 58 55 68 57 66 -25.30 -1.59 1.64 5.08 0.00 -1.59 -6.45 -6.45 -11.29 9.68 -8.06 6.45
KoreaNorth Korea Invades 6/25/1950 53 63 68 71 61 55 54 54 53 48 46 45 55 -15.87 -22.06 -25.35 -13.11 -3.64 -1.85 1.89 0.00 -9.43 -13.21 -15.09 3.77Cease Fire Signed 7/27/1953 65 54 48 47 45 42 52 65 71 77 90 96 56 20.37 35.42 38.30 44.44 54.76 25.00 0.00 9.23 18.46 38.46 47.69 -13.85
VietnamGulf of Tonkin 8/2/1964 71 107 91 74 69 78 75 68 68 72 71 78 100 -33.64 -21.98 -4.05 2.90 -8.97 -5.33 -4.23 -4.23 1.41 0.00 9.86 40.85U.S. Marines Sent 3/8/1965 68 97 70 68 72 71 68 73 74 78 71 66 143 -29.90 -2.86 0.00 -5.56 -4.23 0.00 7.35 8.82 14.71 4.41 -2.94 110.29North Vietnam Overtakes Saigon 4/30/1975 194 90 71 182 194 202 202 220 235 181 199 206 124 115.56 173.24 6.59 0.00 -3.96 -3.96 13.40 21.13 -6.70 2.58 6.19 -36.08
Gulf WarIraq Invades Kuwait 8/2/1990 183 141 199 182 171 201 197 192 233 258 267 164 138 29.79 -8.04 0.55 7.02 -8.96 -7.11 4.92 27.32 40.98 45.90 -10.38 -24.59U.N. Authorizes Force 11/29/1990 258 184 213 201 183 192 233 266 267 214 181 171 145 40.22 21.13 28.36 40.98 34.38 10.73 3.10 3.49 -17.05 -29.84 -33.72 -43.80Desert Storm Begins 1/17/1991 267 200 188 197 192 258 266 242 214 181 164 170 143 33.50 42.02 35.53 39.06 3.49 0.38 -9.36 -19.85 -32.21 -38.58 -36.33 -46.44Ground Assault Begins 2/24/1991 242 181 179 183 233 266 267 214 203 166 168 151 139 33.70 35.20 32.24 3.86 -9.02 -9.36 -11.57 -16.12 -31.40 -30.58 -37.60 -42.56Kuwait Liberated 2/27/1991 242 181 179 183 233 266 267 214 203 166 168 151 139 33.70 35.20 32.24 3.86 -9.02 -9.36 -11.57 -16.12 -31.40 -30.58 -37.60 -42.56
War on TerrorismAfghanistan-U.S. Bombing Begins 10/7/2001 291 217 259 227 229 227 265 255 234 217 222 - - 34.10 12.36 28.19 27.07 28.19 9.81 -12.37 -19.61 -25.43 -23.88 - -
OverallMean 10.90 13.19 7.70 6.78 2.28 -0.30 -1.19 0.35 -4.81 -3.74 -8.42 -11.89Median 18.62 -1.59 1.64 3.86 -3.64 -1.85 0.00 0.00 -6.53 -1.75 -9.22 -24.68
World War IIMean -12.70 -12.57 -6.94 -5.89 -5.70 -2.34 -0.29 1.97 -0.60 1.96 -4.14 -15.88Median -10.83 -7.37 -5.97 -1.60 -3.14 -2.09 -1.01 -0.57 -0.45 1.16 -6.69 -16.75
VietnamMean 17.34 49.47 0.85 -0.89 -5.72 -3.10 5.51 8.58 3.14 2.33 4.37 38.35Median -29.90 -2.86 0.00 0.00 -4.23 -3.96 7.35 8.82 1.41 2.58 6.19 40.85
Gulf WarMean 34.18 25.10 25.78 18.96 2.17 -2.95 -4.90 -4.25 -14.22 -16.74 -31.13 -39.99
Sources: Lehman Brothers Fixed-Income Reseaarch and Global Financial Data.

Figure A21. U.S. Three-Month Treasury Bill Reactions to Various Crisis Events, 1916 through June 2002
3-Month Treasury Yields (%) Cumulative Change (bp) in Yields Cumulative Percent Change in YieldsCrisis 3-Month Treasury in Number of Months After Reaction in Number of Months After Reaction in Number of Months after ReactionGrade Crisis Events Date Yield (%) 1 2 3 4 6 1 2 3 4 6 1 2 3 4 6A Pearl Harbor 12/6/1941 0.30 0.35 0.25 0.25 0.25 0.38 5 -5 -5 -5 8 16.67 -16.67 -16.67 -16.67 26.67A Korean War 6/23/1950 1.14 1.16 1.16 1.30 1.30 1.31 2 2 16 16 17 1.75 1.75 14.04 14.04 14.91A Cuban Missile Crisis 10/19/1962 2.72 2.83 2.87 2.91 2.92 2.90 11 15 19 20 18 4.04 5.51 6.99 7.35 6.62A Gulf of Tonkin 8/2/1964 3.47 3.50 3.55 3.55 3.84 3.87 3 8 8 37 40 0.86 2.31 2.31 10.66 11.53A Arab Oil Embargo 10/18/1973 7.13 7.61 7.47 7.90 7.06 8.18 48 34 77 -7 105 6.73 4.77 10.80 -0.98 14.73A Gulf War Ultimatum 12/24/1990 6.53 6.14 5.95 5.87 5.71 5.57 -39 -58 -66 -82 -96 -5.97 -8.88 -10.11 -12.56 -14.70A WTC Attack 9/11/2001 3.19 2.23 1.80 1.68 1.65 1.77 -96 -139 -151 -154 -142 -30.09 -43.57 -47.34 -48.28 -44.51B Fall of France 5/9/1940 0.02 0.11 0.08 0.04 0.05 0.02 9 6 2 3 0 450.00 300.00 100.00 150.00 0.00B France Falls at Dien Bien Phu 5/8/1954 0.79 0.61 0.65 0.83 1.02 1.01 -18 -14 4 23 22 -22.78 -17.72 5.06 29.11 27.85B Sputnik 10/3/1957 3.53 3.59 3.09 2.75 1.55 1.10 6 -44 -78 -198 -243 1.70 -12.46 -22.10 -56.09 -68.84B Soviet Tanks Invade Prague 8/20/1968 5.14 5.16 5.33 5.44 6.00 6.05 2 19 30 86 91 0.39 3.70 5.84 16.73 17.70B Iranian Revolution 1/16/1979 9.44 9.26 9.52 9.66 9.57 9.30 -18 8 22 13 -14 -1.91 0.85 2.33 1.38 -1.48B USSR Invasion of Afghanistan 12/24/1979 12.05 12.02 13.38 15.15 12.25 6.74 -3 133 310 20 -531 -0.25 11.04 25.73 1.66 -44.07B U.S. Invades Grenada 10/24/1983 8.68 8.81 8.96 8.97 9.13 9.73 13 28 29 45 105 1.50 3.23 3.34 5.18 12.10B Invasion of Panama 12/15/1989 7.62 7.50 7.58 7.94 7.76 7.67 -12 -4 32 14 5 -1.57 -0.52 4.20 1.84 0.66B Gorbachev Coup 8/16/1991 5.26 5.16 4.96 4.63 4.15 3.75 -10 -30 -63 -111 -151 -1.90 -5.70 -11.98 -21.10 -28.71C Easter Rebellion (Ireland) 4/14/1916C U.S. Bombs Cambodia 4/30/1970 6.93 6.93 6.37 6.38 6.28 5.85 0 -56 -55 -65 -108 0.00 -8.08 -7.94 -9.38 -15.58C Falkland Islands War 4/1/1982 13.24 12.34 11.50 12.76 10.17 7.48 -90 -174 -48 -307 -576 -6.80 -13.14 -3.63 -23.19 -43.50C U.S. Bombs Libya 4/15/1986 5.81 6.17 6.17 5.77 5.57 5.06 36 36 -4 -24 -75 6.20 6.20 -0.69 -4.13 -12.91C U.S. Embassy Bombings in Nairobi and Dar es Salaam 8/7/1998 4.86 4.74 4.08 4.47 4.37 4.37 -12 -78 -39 -49 -49 -2.47 -16.05 -8.02 -10.08 -10.08
1 Truman Upset Victory 11/2/1948 1.15 1.16 1.16 1.17 1.17 1.17 1 1 2 2 2 0.87 0.87 1.74 1.74 1.741 Eisenhower Heart Attack 9/23/1955 2.04 2.21 2.38 2.66 2.30 2.25 17 34 62 26 21 8.33 16.67 30.39 12.75 10.291 JFK Assassination 11/21/1963 3.50 3.52 3.52 3.54 3.55 3.47 2 2 4 5 -3 0.57 0.57 1.14 1.43 -0.861 Kent State Shootings 5/4/1970 6.91 6.81 6.48 6.38 6.39 5.84 -10 -43 -53 -52 -107 -1.45 -6.22 -7.67 -7.53 -15.481 Nixon Resigns 8/9/1974 8.93 9.26 6.91 7.62 7.42 5.45 33 -202 -131 -151 -348 3.70 -22.62 -14.67 -16.91 -38.971 Hunt Silver Crisis 2/13/1980 12.18 15.25 13.99 8.28 6.20 8.83 307 181 -390 -598 -335 25.21 14.86 -32.02 -49.10 -27.501 U.S. Stock Market Crash of 1987 10/2/1987 6.66 5.27 5.55 5.68 5.64 5.75 -139 -111 -98 -102 -91 -20.87 -16.67 -14.71 -15.32 -13.661 WTC Bombing 2/26/1993 2.95 2.93 2.91 3.06 3.08 2.98 -2 -4 11 13 3 -0.68 -1.36 3.73 4.41 1.021 Orange County, CA Bankruptcy & Financial Crisis 12/6/1994 5.77 5.72 5.80 5.74 5.70 5.42 -5 3 -3 -7 -35 -0.87 0.52 -0.52 -1.21 -6.071 Oklahoma City Bombing 4/19/1995 5.62 5.69 5.49 5.44 5.44 5.32 7 -13 -18 -18 -30 1.25 -2.31 -3.20 -3.20 -5.342 Riots and Labor Strikes in France 5/6/1968 5.48 5.65 5.36 4.90 5.18 5.46 17 -12 -58 -30 -2 3.10 -2.19 -10.58 -5.47 -0.362 ERM U.K. Currency Crisis 9/14/1992 2.89 2.93 3.08 3.25 3.02 2.97 4 19 36 13 8 1.38 6.57 12.46 4.50 2.772 Mexico - Tequila Crisis 12/19/1994 5.56 5.71 5.70 5.74 5.61 5.49 15 14 18 5 -7 2.70 2.52 3.24 0.90 -1.262 Poison Gas Attack in Tokyo Subway 3/20/1995 5.73 5.62 5.69 5.49 5.44 5.30 -11 -4 -24 -29 -43 -1.92 -0.70 -4.19 -5.06 -7.502 Terrorist Attack in Paris Metro 7/25/1995 5.45 5.36 5.19 5.27 5.36 4.96 -9 -26 -18 -9 -49 -1.65 -4.77 -3.30 -1.65 -8.992 Asian Stock Market Crisis 10/7/1997 4.93 5.17 5.16 5.09 4.98 4.95 24 23 16 5 2 4.87 4.67 3.25 1.01 0.412 Russia, LTCM Crisis 8/18/1998 4.93 4.58 3.56 4.41 4.35 4.43 -35 -137 -52 -58 -50 -7.10 -27.79 -10.55 -11.76 -10.14
OverallMean 1 -16 -18 -46 -71 11.72 4.30 0.18 -1.49 -7.34Median 2 -4 -3 -7 -14 0.57 -0.52 -0.52 -1.21 -1.48Geopolitical RiskMean -8 -16 2 -36 -79 20.80 9.83 2.61 1.77 -7.58Median 1 -1 3 -1 -7 0.19 0.16 2.32 0.20 -0.74Political EventsMean 13 -16 -41 -58 -63 1.03 -2.20 -2.68 -5.32 -7.05Median 2 -4 -18 -9 -30 0.87 -0.70 -3.20 -1.65 -5.34High Geopolitical Risk (A)Mean -9 -20 -15 -25 -7 -0.86 -7.83 -5.71 -6.63 2.18Median 3 2 8 -5 17 1.75 1.75 2.31 -0.98 11.53Medium Geopolitical Risk (B)Mean -3 11 32 -12 -80 47.24 31.38 12.49 14.30 -9.42Median -3 6 22 14 0 -0.25 0.85 4.20 1.84 0.00Low Geopolitical Risk (C)Mean -17 -68 -37 -111 -202 -0.77 -7.77 -5.07 -11.69 -20.52Median -6 -67 -44 -57 -92 -1.23 -10.61 -5.78 -9.73 -14.25U.S. Political Events (1)Mean 21 -15 -61 -88 -92 1.61 -1.57 -3.58 -7.29 -9.48Median 2 -2 -11 -13 -33 0.72 -0.42 -1.86 -2.21 -5.70Non-U.S. Political Events (2)Mean 1 -18 -12 -15 -20 0.20 -3.10 -1.38 -2.51 -3.58Median 4 -4 -18 -9 -7 1.38 -0.70 -3.30 -1.65 -1.26
Sources: Lehman Brothers Fixed-Income Reseaarch and Global Financial Data.Crisis Grade Key: A = High Geopolitical Risk, B = Medium Geopolitical Risk, C = Low Geopolitical Risk, 1 = U.S. Political Event, 2 = Non-U.S. Political Event

Figure A22. Performance of U.S. 3-Month Treasury Bills Before and After Military Conflicts, 1939 through June 2002
3-Month Treasury Yields (%) Cumulative Percent Change (%) in 3-Month Treasury Yields3-Month Treasury in Number of Months Before/After Military Conflict in Number of Months Before/After Military Conflict
Date Yield (%) -24 -12 -6 -4 -2 -1 1 2 4 6 12 24 -24 -12 -6 -4 -2 -1 1 2 4 6 12 24World War II
Germany Invades Poland 9/1/1939 0.09 0.45 0.06 0.03 0.03 0.03 0.04 0.08 0.05 0.04 0.02 0.05 0.13 -80.00 50.00 200.00 200.00 200.00 125.00 -11.11 -44.44 -55.56 -77.78 -44.44 44.44Germany Invades France 5/10/1949 1.16 0.38 1.00 1.14 1.16 1.17 1.16 1.17 1.01 1.06 1.08 1.16 1.44 205.26 16.00 1.75 0.00 -0.85 0.00 0.86 -12.93 -8.62 -6.90 0.00 24.14France Surrenders 6/22/1940 0.09 0.04 0.03 0.04 0.02 0.02 0.03 0.04 0.04 0.02 0.02 0.13 0.38 125.00 200.00 125.00 350.00 350.00 200.00 -55.56 -55.56 -77.78 -77.78 44.44 322.22Pearl Harbor 12/7/1941 0.30 0.04 0.02 0.13 0.12 0.11 0.25 0.35 0.25 0.25 0.38 0.38 0.38 650.001400.00 130.77 150.00 172.73 20.00 16.67 -16.67 -16.67 26.67 26.67 26.67Germany Surrenders 5/7/1945 0.38 0.38 0.38 0.38 0.38 0.38 0.38 0.38 0.38 0.38 0.38 0.38 0.38 0.00 0.00 0.00 0.00 0.00 0.00 0.00 0.00 0.00 0.00 0.00 0.00Hiroshima/Nagasaki and Japanese Surrender 8/14/1945 0.38 0.38 0.38 0.38 0.38 0.38 0.38 0.38 0.38 0.38 0.38 0.38 0.75 0.00 0.00 0.00 0.00 0.00 0.00 0.00 0.00 0.00 0.00 0.00 97.37
KoreaNorth Korea Invades 6/25/1950 1.14 1.00 1.17 1.09 1.12 1.14 1.16 1.16 1.16 1.30 1.35 1.36 1.71 14.00 -2.56 4.59 1.79 0.00 -1.72 1.75 1.75 14.04 18.42 19.30 50.00Cease Fire Signed 7/27/1953 2.10 1.60 1.86 1.91 1.97 2.03 1.89 2.06 1.63 1.42 1.00 0.75 1.57 31.25 12.90 9.95 6.60 3.45 11.11 -1.90 -22.38 -32.38 -52.38 -64.29 -25.24
VietnamGulf of Tonkin 8/2/1964 3.47 2.82 3.29 3.51 3.52 3.48 3.48 3.50 3.55 3.84 3.87 3.81 4.84 23.05 5.47 -1.14 -1.42 -0.29 -0.29 0.86 2.31 10.66 11.53 9.80 39.48U.S. Marines Sent 3/8/1965 3.94 2.89 3.54 3.53 3.57 3.80 3.91 3.94 3.89 3.87 3.87 4.61 4.59 36.33 11.30 11.61 10.36 3.68 0.77 0.00 -1.27 -1.78 -1.78 17.01 16.50North Vietnam Overtakes Saigon 4/30/1975 5.50 6.00 8.82 7.78 7.06 5.40 5.53 5.20 5.78 6.42 5.72 4.92 4.52 -8.33 -37.64 -29.31 -22.10 1.85 -0.54 -5.45 5.09 16.73 4.00 -10.55 -17.82
Gulf WarIraq Invades Kuwait 8/2/1990 7.43 7.01 7.95 7.81 7.75 7.68 7.70 7.39 7.13 7.02 6.22 5.58 3.17 5.99 -6.54 -4.87 -4.13 -3.26 -3.51 -0.54 -4.04 -5.52 -16.29 -24.90 -57.34U.N. Authorizes Force 11/29/1990 7.03 7.88 7.55 7.68 7.42 7.14 7.14 6.45 6.25 5.74 5.40 4.42 3.15 -10.79 -6.89 -8.46 -5.26 -1.54 -1.54 -8.25 -11.10 -18.35 -23.19 -37.13 -55.19Desert Storm Begins 1/17/1991 6.12 8.33 7.73 7.54 7.39 7.08 6.73 5.91 5.84 5.40 5.59 3.82 3.10 -26.53 -20.83 -18.83 -17.19 -13.56 -9.06 -3.43 -4.58 -11.76 -8.66 -37.58 -49.35Ground Assault Begins 2/24/1991 5.95 8.57 7.81 7.48 7.13 6.48 6.17 5.86 5.61 5.56 5.39 3.85 2.93 -30.57 -23.82 -20.45 -16.55 -8.18 -3.57 -1.51 -5.71 -6.55 -9.41 -35.29 -50.76Kuwait Liberated 2/27/1991 6.03 8.66 7.76 7.39 7.14 6.45 6.25 5.74 5.62 5.55 5.41 3.93 2.93 -30.37 -22.29 -18.40 -15.55 -6.51 -3.52 -4.81 -6.80 -7.96 -10.28 -34.83 -51.41
War on TerrorismAfghanistan-U.S. Bombing Begins 10/7/2001 2.15 4.94 6.01 3.85 3.56 3.41 3.20 1.82 1.72 1.74 1.73 - - -56.48 -64.23 -44.16 -39.61 -36.95 -32.81 -15.35 -20.00 -19.07 -19.53 - -
OverallMean 49.87 88.88 19.89 35.12 38.86 17.67 -5.16 -11.55 -12.97 -14.31 -10.74 19.61Median 0.00 0.00 0.00 0.00 0.00 -0.29 -1.51 -5.71 -7.96 -8.66 -5.27 8.25
World War IIMean 150.04 277.67 76.25 116.67 120.31 57.50 -8.19 -21.60 -26.44 -22.63 4.44 85.81Median 62.50 33.00 63.38 75.00 86.36 10.00 0.00 -14.80 -12.64 -3.45 0.00 35.56
VietnamMean 17.02 -6.96 -6.28 -4.38 1.75 -0.02 -1.53 2.04 8.54 4.58 5.42 12.72Median 23.05 5.47 -1.14 -1.42 1.85 -0.29 0.00 2.31 10.66 4.00 9.80 16.50
Gulf WarMean -18.45 -16.07 -14.20 -11.73 -6.61 -4.24 -3.71 -6.44 -10.03 -13.57 -33.95 -52.81Median -26.53 20.83 -18.40 -15.55 -6.51 -3.52 -3.43 -5.71 -7.96 -10.28 -35.29 -51.41
Sources: Lehman Brothers Fixed-Income Reseaarch and Global Financial Data.

Figure A23. U.K. Three-Month Treasury Bill Reactions to Various Crisis Events, 1901 through June 2002
3-Month Treasury Yields (%) Cumulative Change (bp) in Yields Cumulative Percent Change in YieldsCrisis 3-Month Treasury in Number of Months After Reaction in Number of Months After Reaction in Number of Months after ReactionGrade Crisis Events Date Yield (%) 1 2 3 4 6 1 2 3 4 6 1 2 3 4 6A Germany Enters World War I 8/1/1914 3.01 3.39 3.39 3.39 3.39 3.39 38 38 38 38 38 12.62 12.62 12.62 12.62 12.62A U.S. Declares War on Germany 4/6/1917 5.58 4.73 4.81 4.75 4.81 4.81 -85 -77 -83 -77 -77 -15.23 -13.80 -14.87 -13.80 -13.80A Pearl Harbor 12/6/1941 1.00 1.01 1.01 1.02 1.01 1.00 1 1 2 1 0 1.00 1.00 2.00 1.00 0.00A Korean War 6/23/1950 0.51 0.51 0.51 0.51 0.52 0.51 0 0 0 1 0 0.00 0.00 0.00 1.96 0.00A Cuban Missile Crisis 10/19/1962 3.64 3.86 3.69 3.72 3.49 3.76 22 5 8 -15 12 6.04 1.37 2.20 -4.12 3.30A Gulf of Tonkin 8/2/1964 4.57 4.65 4.65 4.69 5.11 6.62 8 8 12 54 205 1.75 1.75 2.63 11.82 44.86A Arab Oil Embargo 10/18/1973 10.96 10.77 11.73 12.46 12.09 11.95 -19 77 150 113 99 -1.73 7.03 13.69 10.31 9.03A Gulf War Ultimatum 12/24/1990 13.41 13.30 12.19 11.59 11.25 10.69 -11 -122 -181 -216 -272 -0.82 -9.09 -13.52 -16.08 -20.28A WTC Attack 9/11/2001 4.84 4.34 3.82 3.93 3.98 4.01 -50 -102 -91 -86 -83 -10.33 -21.07 -18.80 -17.77 -17.16B Archduke Ferdinand Assassinated 6/28/1914 3.01 3.01 3.01 3.39 3.39 3.39 0 0 38 38 38 0.00 0.00 12.62 12.62 12.62B Easter Rebellion (Ireland) 4/14/1916 4.92 4.55 4.55 4.80 5.36 5.58 -37 -37 -12 44 66 -7.52 -7.52 -2.44 8.94 13.41B Fall of France 5/9/1940 1.03 1.02 1.02 1.02 1.02 1.02 -1 -1 -1 -1 -1 -0.97 -0.97 -0.97 -0.97 -0.97B France Falls at Dien Bien Phu 5/8/1954 2.09 1.84 1.61 1.57 1.60 1.59 -25 -48 -52 -49 -50 -11.96 -22.97 -24.88 -23.44 -23.92B Sputnik 10/3/1957 5.44 6.60 6.54 6.43 6.28 5.77 116 110 99 84 33 21.32 20.22 18.20 15.44 6.07B Soviet Tanks Invade Prague 8/20/1968 7.15 6.95 6.76 6.51 6.68 6.77 -20 -39 -64 -47 -38 -2.80 -5.45 -8.95 -6.57 -5.31B Iranian Revolution 1/16/1979 11.80 12.89 11.30 11.38 11.41 13.38 109 -50 -42 -39 158 9.27 -4.24 -3.58 -3.31 13.38B USSR Invasion of Afghanistan 12/24/1979 15.81 15.75 16.13 16.17 16.06 15.73 -6 31 36 25 -8 -0.40 1.98 2.27 1.58 -0.49B Falkland Islands War 4/1/1982 12.58 13.03 13.03 12.34 11.23 9.81 45 45 -23 -134 -277 3.60 3.60 -1.86 -10.68 -21.99B Gorbachev Coup 8/16/1991 10.25 9.63 9.84 9.75 10.03 9.78 -63 -41 -50 -22 -47 -6.10 -3.96 -4.88 -2.13 -4.57C U.S. Bombs Cambodia 4/30/1970 6.97 6.97 6.83 6.87 6.85 6.82 0 -14 -10 -12 -15 0.00 -2.01 -1.43 -1.72 -2.15C U.S. Invades Grenada 10/24/1983 8.88 8.84 8.88 8.75 8.88 8.41 -3 0 -13 0 -47 -0.35 0.00 -1.41 0.00 -5.28C U.S. Bombs Libya 4/15/1986 9.81 9.81 9.50 9.38 9.56 9.94 0 -31 -44 -25 13 0.01 -3.18 -4.46 -2.55 1.27C Invasion of Panama 12/15/1989 14.47 14.52 14.50 14.64 14.59 14.34 5 3 17 13 -13 0.32 0.22 1.19 0.86 -0.86C U.S. Embassy Bombings in Nairobi and Dar es Salaam 8/7/1998 7.60 7.56 7.23 6.49 6.38 5.55 -3 -37 -111 -122 -205 -0.41 -4.88 -14.58 -16.00 -26.93
1 Bloody Sunday (N. Ireland) 11/21/1920 6.61 6.61 6.61 6.61 6.61 6.09 0 0 0 0 -52 0.00 0.00 0.00 0.00 -7.871 Hunt Silver Crisis 2/13/1980 16.14 16.13 16.17 16.11 15.97 14.91 -2 3 -3 -17 -123 -0.10 0.19 -0.19 -1.06 -7.651 ERM U.K. Currency Crisis 9/14/1992 9.69 8.31 6.50 6.66 6.53 5.53 -138 -319 -303 -316 -416 -14.19 -32.90 -31.29 -32.58 -42.902 William Mckinley Assassinated 9/6/1901 3.48 3.48 3.48 3.48 3.48 2.96 0 0 0 0 -52 0.00 0.00 0.00 0.00 -14.942 U.S. Finanical Panic of 1907 10/21/1907 3.76 3.76 3.76 3.76 2.25 2.25 0 0 0 -151 -151 0.00 0.00 0.00 -40.16 -40.162 Earthquake in Tokyo 9/1/1923 3.13 3.16 3.12 3.19 3.19 3.26 3 -1 6 6 13 0.96 -0.32 1.92 1.92 4.152 U.S. Stock Market Crash 10/29/1929 5.63 6.19 5.30 4.75 4.04 2.55 56 -33 -88 -159 -308 9.95 -5.86 -15.63 -28.24 -54.712 Truman Upset Victory 11/2/1948 0.51 0.51 0.52 0.52 0.52 0.51 0 1 1 1 0 0.00 1.96 1.96 1.96 0.002 Eisenhower Heart Attack 9/23/1955 4.00 4.07 4.07 4.10 4.09 4.67 7 7 10 9 67 1.75 1.75 2.50 2.25 16.752 JFK Assassination 11/21/1963 3.74 3.74 3.72 3.72 3.92 4.30 0 -2 -2 18 56 0.00 -0.53 -0.53 4.81 14.972 Riots and Labor Strikes in France 5/6/1968 7.08 7.15 7.21 7.15 6.95 6.51 7 13 7 -13 -57 0.99 1.84 0.99 -1.84 -8.052 Kent State Shootings 5/4/1970 6.97 6.83 6.87 6.85 6.82 6.81 -14 -10 -12 -15 -16 -2.01 -1.43 -1.72 -2.15 -2.302 Nixon Resigns 8/9/1974 11.20 11.24 11.06 10.93 10.98 10.34 4 -14 -27 -22 -86 0.36 -1.25 -2.41 -1.96 -7.642 U.S. Stock Market Crash of 1987 10/2/1987 9.75 9.45 8.53 8.31 8.34 8.28 -30 -122 -144 -141 -147 -3.08 -12.50 -14.74 -14.42 -15.062 WTC Bombing 2/26/1993 5.59 5.44 5.59 5.44 5.47 5.16 -16 0 -16 -13 -44 -2.79 0.00 -2.79 -2.23 -7.822 Orange County, CA Bankruptcy & Financial Crisis 12/6/1994 6.03 6.31 6.47 6.41 6.19 6.25 28 44 38 16 22 4.66 7.25 6.22 2.59 3.632 Mexico - Tequila Crisis 12/19/1994 6.03 6.06 6.47 6.19 6.19 6.31 3 44 16 16 28 0.52 7.25 2.59 2.59 4.662 Poison Gas Attack in Tokyo Subway 3/20/1995 6.19 6.22 6.50 6.31 6.59 6.53 3 31 13 41 34 0.51 5.05 2.02 6.57 5.562 Oklahoma City Bombing 4/19/1995 6.22 6.50 6.31 6.59 6.59 6.59 28 9 38 38 38 4.52 1.51 6.03 6.03 6.032 Terrorist Attack in Paris Metro 7/25/1995 6.56 6.56 6.53 6.56 6.47 6.03 0 -3 0 -9 -53 0.00 -0.48 0.00 -1.43 -8.092 Asian Stock Market Crisis 10/7/1997 7.06 7.19 7.34 7.19 7.25 7.38 13 28 13 19 32 1.77 3.98 1.83 2.71 4.502 Russia, LTCM Crisis 8/18/1998 7.68 7.35 7.02 6.68 6.04 5.34 -33 -66 -100 -164 -234 -4.29 -8.58 -12.98 -21.32 -30.46
OverallMean -1 -15 -20 -28 -42 -0.07 -1.79 -2.29 -3.43 -4.66Median 0 0 -1 -5 -14 0.00 0.00 -0.10 -1.02 -1.56Geopolitical RiskMean 1 -12 -16 -18 -20 -0.11 -2.06 -2.05 -1.75 -1.13Median -1 -1 -11 -7 -4 -0.18 -0.49 -1.42 -1.35 -0.68Political EventsMean -4 -18 -25 -39 -66 -0.02 -1.50 -2.56 -5.27 -8.52Median 0 0 0 -5 -48 0.00 0.00 0.00 -0.53 -7.65High Geopolitical Risk (A)Mean -11 -19 -16 -21 -9 -0.74 -2.24 -1.56 -1.56 2.06Median 0 1 2 1 0 0.00 1.00 2.00 1.00 0.00Medium Geopolitical Risk (B)Mean 12 -3 -7 -10 -13 0.45 -1.93 -1.45 -0.85 -1.18Median -4 -19 -18 -11 -4 -0.68 -2.47 -2.15 -1.55 -0.73Low Geopolitical Risk (C)Mean 0 -16 -32 -29 -53 -0.09 -1.97 -4.14 -3.88 -6.79Median 0 -14 -13 -12 -15 0.00 -2.01 -1.43 -1.72 -2.15U.K. Political Events (1)Mean -46 -105 -102 -111 -197 -4.76 -10.90 -10.49 -11.21 -19.47Median -2 0 -3 -17 -123 -0.10 0.00 -0.19 -1.06 -7.87U.K. Political Events (2)Mean 3 -4 -13 -28 -45 0.73 -0.02 -1.30 -4.33 -6.79Median 3 0 0 0 -16 0.36 0.00 0.00 0.00 -2.30
Sources: Lehman Brothers Fixed-Income Reseaarch and Global Financial Data.Crisis Grade Key: A = High Geopolitical Risk, B = Medium Geopolitical Risk, C = Low Geopolitical Risk, 1 = U.K. Political Event, 2 = Non-U.K. Political Event

Figure A24. Performance of U.K. 3-Month Treasury Bills Before and After Military Conflicts, 1914 through June 2002
3-Month Treasury Yields (%) Cumulative Percent Change (%) in 3-Month Treasury Yields3-Month Treasury in Number of Months Before/After Military Conflict in Number of Months Before/After Military Conflict
Date Yield (%) -24 -12 -6 -4 -2 -1 1 2 4 6 12 24 -24 -12 -6 -4 -2 -1 1 2 4 6 12 24World War I
Assassination in Sarajevo 6/28/1914 3.01 3.04 3.48 3.48 3.01 3.01 3.01 3.01 3.01 3.39 3.39 2.77 4.55 -0.99 -13.51 -13.51 0.00 0.00 0.00 0.00 0.00 12.62 12.62 -7.97 51.16Austria Declares War on Serbia 7/28/1914 3.01 3.04 3.48 3.48 3.01 3.01 3.01 3.01 3.39 3.39 3.39 2.77 4.80 -0.99 -13.51 -13.51 0.00 0.00 0.00 0.00 12.62 12.62 12.62 -7.97 59.47U.S. Declares War on Germany 4/6/1917 5.58 3.39 4.92 5.58 5.58 5.58 5.58 4.73 4.81 4.81 4.81 3.53 3.53 64.60 13.41 0.00 0.00 0.00 0.00 -15.23 -13.80 -13.80 -13.80 -36.74 -36.74Austria, Hungary, & Germany Surrender 11/11/1918 3.53 5.58 4.81 3.53 3.53 3.53 3.53 3.53 3.53 3.53 3.53 4.35 6.61 -36.74 -26.61 0.00 0.00 0.00 0.00 0.00 0.00 0.00 0.00 23.23 87.25
World War IIGermany Invades Poland 9/1/1939 1.92 0.52 0.51 0.51 1.36 0.76 0.77 3.23 1.77 1.18 1.09 1.02 1.00 269.23 276.47 276.47 41.18 152.63 149.35 68.23 -7.81 -38.54 -43.23 -46.88 -47.92Germany Invades France 5/10/1949 0.51 0.51 0.51 0.51 0.52 0.52 0.52 0.52 0.52 0.52 0.52 0.51 0.51 0.00 0.00 0.00 -1.92 -1.92 -1.92 1.96 1.96 1.96 1.96 0.00 0.00France Surrenders 6/22/1940 1.02 0.59 0.70 1.18 1.09 1.02 1.03 1.02 1.02 1.02 1.02 1.00 1.00 72.88 45.71 -13.56 -6.42 0.00 -0.97 0.00 0.00 0.00 0.00 -1.96 -1.96Pearl Harbor 12/7/1941 1.00 1.18 1.02 1.00 1.00 1.01 1.00 1.01 1.01 1.01 1.00 1.00 1.00 -15.25 -1.96 0.00 0.00 -0.99 0.00 1.00 1.00 1.00 0.00 0.00 0.00Germany Surrenders 5/7/1945 1.01 1.01 1.01 1.00 1.01 1.00 1.00 1.00 1.00 1.00 0.75 0.51 0.51 0.00 0.00 1.00 0.00 1.00 1.00 -0.99 -0.99 -0.99 -25.74 -49.50 -49.50Hiroshima/Nagasaki and Japanese Surrender 8/14/1945 1.00 1.00 1.00 1.01 1.00 1.00 1.00 1.00 1.00 0.51 0.50 0.51 0.51 0.00 0.00 -0.99 0.00 0.00 0.00 0.00 0.00 -49.00 -50.00 -49.00 -49.00
KoreaNorth Korea Invades 6/25/1950 0.51 0.51 0.52 0.52 0.52 0.52 0.51 0.51 0.51 0.52 0.51 0.51 2.37 0.00 -1.92 -1.92 -1.92 -1.92 0.00 0.00 0.00 1.96 0.00 0.00 364.71Cease Fire Signed 7/27/1953 2.37 0.51 2.46 2.41 2.42 2.41 2.38 2.35 2.36 2.11 2.11 1.61 3.97 364.71 -3.66 -1.66 -2.07 -1.66 -0.42 -0.84 -0.42 -10.97 -10.97 -32.07 67.51
VietnamGulf of Tonkin 8/2/1964 4.57 3.89 3.76 3.72 4.30 4.35 4.44 4.65 4.65 5.11 6.62 5.59 5.69 17.48 21.54 22.85 6.28 5.06 2.93 1.75 1.75 11.82 44.86 22.32 24.51U.S. Marines Sent 3/8/1965 6.48 3.43 3.92 4.65 4.69 6.62 6.60 6.45 6.45 5.59 5.56 5.58 6.29 88.92 65.31 39.35 38.17 -2.11 -1.82 -0.46 -0.46 -13.73 -14.20 -13.89 -2.93North Vietnam Overtakes Saigon 4/30/1975 9.28 7.67 11.51 10.93 10.99 9.84 9.41 9.48 9.56 10.44 11.50 10.00 8.45 21.01 -19.36 -15.08 -15.55 -5.71 -1.33 2.19 3.03 12.46 23.91 7.74 -8.92
Gulf WarIraq Invades Kuwait 8/2/1990 14.34 10.75 13.34 14.48 14.61 14.48 14.28 14.28 14.34 12.88 13.23 10.50 9.53 33.43 7.49 -0.97 -1.82 -0.97 0.44 -0.44 0.00 -10.24 -7.73 -26.80 -33.55U.N. Authorizes Force 11/29/1990 12.64 12.63 14.61 14.48 14.38 14.26 13.34 13.59 13.25 11.56 10.78 10.16 6.69 0.12 -13.48 -12.73 -12.07 -11.36 -5.27 7.54 4.82 -8.53 -14.71 -19.65 -47.10Desert Storm Begins 1/17/1991 13.44 12.25 14.56 14.31 14.38 13.31 13.19 12.19 11.53 10.88 10.50 10.13 6.53 9.69 -7.73 -6.11 -6.52 0.94 1.90 -9.30 -14.19 -19.07 -21.86 -24.65 -51.39Ground Assault Begins 2/24/1991 12.19 12.38 14.48 14.22 13.33 13.41 13.27 11.63 11.19 10.69 10.16 9.66 5.50 -1.52 -15.86 -14.29 -8.56 -9.09 -8.13 -4.62 -8.21 -12.31 -16.67 -20.77 -54.87Kuwait Liberated 2/27/1991 12.00 12.38 14.50 14.28 13.34 13.59 13.25 11.56 11.25 10.72 10.16 9.69 5.50 -3.03 -17.24 -15.97 -10.07 -11.72 -9.43 -3.65 -6.25 -10.68 -15.36 -19.27 -54.17
War on TerrorismAfghanistan-U.S. Bombing Begins 10/7/2001 4.34 5.29 6.04 5.35 5.13 4.90 4.84 4.08 3.92 3.96 4.13 - - -17.98 -28.15 -18.88 -15.40 -11.43 -10.33 -5.99 -9.68 -8.81 -4.76 - -
OverallMean 41.22 12.71 10.02 0.16 4.80 5.52 1.96 -1.74 -6.77 -6.81 -15.19 10.83Median 0.00 -1.96 -1.66 -1.82 -0.97 0.00 0.00 0.00 -8.53 -7.73 -16.58 -5.93
World War IMean 6.47 -10.05 -6.75 0.00 0.00 0.00 -3.81 -0.29 2.86 2.86 -7.36 40.29Median -0.99 -13.51 -6.75 0.00 0.00 0.00 0.00 0.00 6.31 6.31 -7.97 55.32
World War IIMean 54.48 53.37 43.82 5.47 25.12 24.58 11.70 -0.97 -14.26 -19.50 -24.56 -24.73Median 0.00 0.00 0.00 0.00 0.00 0.00 0.50 0.00 -0.50 -12.87 -24.42 -24.94
VietnamMean 42.47 22.50 15.71 9.63 -0.92 -0.07 1.16 1.44 3.51 18.19 5.39 4.22Median 21.01 21.54 22.85 6.28 -2.11 -1.33 1.75 1.75 11.82 23.91 7.74 -2.93
Gulf WarMean 7.74 -9.36 -10.01 -7.81 -6.44 -4.10 -2.09 -4.76 -12.16 -15.27 -22.23 -48.22Median 0.12 -13.48 -12.73 -8.56 -9.09 -5.27 -3.65 -6.25 -10.68 -15.36 -20.77 -51.39
Sources: Lehman Brothers Fixed-Income Reseaarch and Global Financial Data.

Figure A25. French Three-Month Treasury Bill Reactions to Various Crisis Events, 1940 through June 2002
3-Month Treasury Yields (%) Cumulative Change (bp) in Yields Cumulative Percent Change in YieldsCrisis 3-Month Treasury in Number of Months After Reaction in Number of Months After Reaction in Number of Months after ReactionGrade Crisis Events Date Yield (%) 1 2 3 4 6 1 2 3 4 6 1 2 3 4 6A Pearl Harbor 12/6/1941 1.67 1.73 1.68 1.63 1.65 1.62 6 1 -4 -2 -5 3.59 0.60 -2.40 -1.20 -2.99A Korean War 6/23/1950 2.00 2.00 2.00 2.00 2.00 2.00 0 0 0 0 0 0.00 0.00 0.00 0.00 0.00A Cuban Missile Crisis 10/19/1962 3.22 3.41 3.39 3.38 3.35 3.30 19 17 16 13 8 5.90 5.28 4.97 4.04 2.48A Gulf of Tonkin 8/2/1964 3.79 3.51 3.40 3.78 3.69 3.68 -28 -39 -1 -10 -11 -7.39 -10.29 -0.26 -2.64 -2.90A Arab Oil Embargo 10/18/1973 10.37 11.36 11.18 11.36 13.43 12.33 99 81 99 306 196 9.55 7.81 9.55 29.51 18.90A Gulf War Ultimatum 12/24/1990 9.94 10.22 10.09 9.85 9.54 9.39 28 16 -9 -40 -55 2.80 1.57 -0.88 -3.98 -5.56A WTC Attack 9/11/2001 4.00 3.43 3.24 3.17 3.21 3.26 -57 -76 -83 -79 -74 -14.25 -19.00 -20.75 -19.75 -18.50B Fall of France 5/9/1940 2.00 2.00 2.00 2.00 2.00 2.00 0 0 0 0 0 0.00 0.00 0.00 0.00 0.00B France Falls at Dien Bien Phu 5/8/1954 3.00 3.00 3.00 3.00 3.00 3.00 0 0 0 0 0 0.00 0.00 0.00 0.00 0.00B Sputnik 10/3/1957 3.00 3.00 3.00 3.00 3.00 3.00 0 0 0 0 0 0.00 0.00 0.00 0.00 0.00B Soviet Tanks Invade Prague 8/20/1968 5.87 5.80 6.49 6.81 7.60 7.94 -7 62 94 173 207 -1.19 10.56 16.01 29.47 35.26B Iranian Revolution 1/16/1979 6.67 6.57 6.88 7.10 7.00 8.68 -10 21 43 33 201 -1.50 3.15 6.45 4.95 30.13B USSR Invasion of Afghanistan 12/24/1979 12.77 12.59 12.38 12.63 13.99 12.65 -18 -39 -14 122 -12 -1.41 -3.05 -1.10 9.55 -0.94B U.S. Invades Grenada 10/24/1983 12.61 12.63 12.50 12.36 12.62 12.72 2 -11 -25 1 11 0.16 -0.87 -1.98 0.08 0.87B Invasion of Panama 12/15/1989 10.46 10.81 10.28 10.99 10.63 9.75 35 -18 53 17 -71 3.35 -1.76 5.10 1.60 -6.79B Gorbachev Coup 8/16/1991 9.72 9.81 9.54 9.39 9.49 10.12 9 -18 -33 -23 40 0.88 -1.87 -3.40 -2.41 4.11C U.S. Bombs Cambodia 4/30/1970 8.95 8.95 9.02 9.59 9.10 8.28 0 7 64 15 -67 0.00 0.78 7.15 1.68 -7.49C Falkland Islands War 4/1/1982 15.25 16.36 16.19 15.86 15.86 14.68 111 94 61 61 -57 7.28 6.16 4.00 4.00 -3.74C U.S. Bombs Libya 4/15/1986 8.42 7.73 7.31 7.33 7.22 7.18 -69 -111 -109 -120 -124 -8.19 -13.18 -12.95 -14.25 -14.73C U.S. Embassy Bombings in Nairobi and Dar es Salaam 8/7/1998 3.48 3.49 3.45 3.42 3.45 3.03 1 -3 -6 -3 -45 0.22 -0.77 -1.77 -0.83 -12.91
1 Hunt Silver Crisis 2/13/1980 12.38 12.63 13.99 12.96 12.65 11.93 25 161 58 27 -45 2.02 13.00 4.68 2.18 -3.631 Riots and Labor Strikes in France 5/6/1968 5.14 5.37 5.75 5.87 5.80 6.81 23 61 73 66 167 4.47 11.87 14.20 12.84 32.491 Terrorist Attack in Paris Metro 7/25/1995 7.29 6.52 6.01 5.97 6.84 5.49 -77 -128 -132 -45 -180 -10.55 -17.55 -18.09 -6.23 -24.732 Truman Upset Victory 11/2/1948 2.00 2.00 2.00 2.00 2.00 2.00 0 0 0 0 0 0.00 0.00 0.00 0.00 0.002 Eisenhower Heart Attack 9/23/1955 3.00 3.00 3.00 3.00 3.00 3.00 0 0 0 0 0 0.00 0.00 0.00 0.00 0.002 JFK Assassination 11/21/1963 3.33 3.32 3.13 3.34 3.39 3.31 -1 -20 1 6 -2 -0.30 -6.01 0.30 1.80 -0.602 Kent State Shootings 5/4/1970 8.95 9.02 9.59 9.10 8.64 8.28 7 64 15 -31 -67 0.78 7.15 1.68 -3.46 -7.492 Nixon Resigns 8/9/1974 14.13 13.97 13.92 13.38 12.26 10.03 -16 -21 -75 -187 -410 -1.13 -1.49 -5.31 -13.23 -29.022 U.S. Stock Market Crash of 1987 10/2/1987 7.92 8.27 8.72 8.54 8.54 7.61 35 80 62 62 -31 4.42 10.10 7.83 7.83 -3.912 ERM U.K. Currency Crisis 9/14/1992 10.66 10.79 10.98 10.44 10.78 11.82 13 31 -22 11 115 1.18 2.91 -2.07 1.04 10.792 WTC Bombing 2/26/1993 11.65 11.82 11.40 9.18 7.73 7.69 16 -26 -247 -392 -396 1.41 -2.20 -21.18 -33.65 -33.972 Orange County, CA Bankruptcy & Financial Crisis 12/6/1994 5.53 5.38 5.81 5.80 7.93 7.59 -15 28 27 240 206 -2.67 5.10 4.83 43.33 37.202 Mexico - Tequila Crisis 12/19/1994 5.53 5.38 5.81 5.80 7.93 7.59 -15 28 27 240 206 -2.67 5.10 4.83 43.33 37.202 Poison Gas Attack in Tokyo Subway 3/20/1995 5.80 7.93 7.87 7.59 7.29 6.01 213 208 179 149 21 36.73 35.79 30.88 25.77 3.702 Oklahoma City Bombing 4/19/1995 7.93 7.87 7.59 7.29 6.52 5.97 -5 -34 -64 -141 -196 -0.69 -4.28 -8.02 -17.72 -24.662 Asian Stock Market Crisis 10/7/1997 3.30 3.47 3.55 3.53 3.49 3.48 18 26 24 20 18 5.38 7.78 7.20 5.95 5.532 Russia, LTCM Crisis 8/18/1998 3.48 3.49 3.45 3.42 3.45 3.03 1 -3 -6 -3 -45 0.22 -0.77 -1.77 -0.83 -12.91
OverallMean 9 12 2 13 -13 1.04 1.40 0.75 2.94 0.03Median 0 0 0 0 -2 0.00 0.00 0.00 0.00 -0.60Geopolitical RiskMean 6 -1 7 23 7 -0.01 -0.74 0.39 1.99 0.76Median 0 0 0 0 -2 0.00 0.00 0.00 0.00 -0.47Political EventsMean 13 27 -5 1 -38 2.27 3.91 1.18 4.06 -0.82Median 1 26 1 6 -2 0.22 2.91 0.30 1.04 -0.60High Geopolitical Risk (A)Mean 10 0 3 27 8 0.03 -2.00 -1.40 0.85 -1.22Median 6 1 -1 -2 -5 2.80 0.60 -0.26 -1.20 -2.90Medium Geopolitical Risk (B)Mean 1 0 13 36 42 0.03 0.68 2.34 4.81 6.96Median 0 0 0 1 0 0.00 0.00 0.00 0.08 0.00Low Geopolitical Risk (C)Mean 11 -3 2 -12 -73 -0.17 -1.75 -0.89 -2.35 -9.71Median 0 2 27 6 -62 0.11 0.01 1.11 0.42 -10.20French Political Events (1)Mean -10 31 0 16 -19 -1.35 2.44 0.27 2.93 1.38Median 23 61 58 27 -45 2.02 11.87 4.68 2.18 -3.63French Political Events (2)Mean 18 26 -6 -2 -41 3.05 4.23 1.37 4.30 -1.30Median 0 13 0 3 -1 0.11 1.46 0.15 0.52 -0.30
Sources: Lehman Brothers Fixed-Income Reseaarch and Global Financial Data.Crisis Grade Key: A = High Geopolitical Risk, B = Medium Geopolitical Risk, C = Low Geopolitical Risk, 1 = French Political Event, 2 = Non-French Political Event

Figure A26. Performance of French 3-Month Treasury Bills Before and After Military Conflicts, 1939 through June 2002
3-Month Treasury Yields (%) Cumulative Percent Change (%) in 3-Month Treasury Yields3-Month Treasury in Number of Months Before/After Military Conflict in Number of Months Before/After Military Conflict
Date Yield (%) -24 -12 -6 -4 -2 -1 1 2 4 6 12 24 -24 -12 -6 -4 -2 -1 1 2 4 6 12 24World War II
Germany Invades Poland 9/1/1939 1.88 3.86 2.47 1.72 1.77 1.84 1.81 1.98 2.00 2.00 2.00 2.00 1.84 -51.30 -23.89 9.30 6.21 2.17 3.87 5.32 6.38 6.38 6.38 6.38 -2.13Germany Invades France 5/10/1949 2.00 1.70 2.00 2.00 2.00 2.00 2.00 2.00 2.00 2.00 2.00 2.00 3.00 17.65 0.00 0.00 0.00 0.00 0.00 0.00 0.00 0.00 0.00 0.00 50.00France Surrenders 6/22/1940 2.00 2.31 1.77 2.00 2.00 2.00 2.00 2.00 2.00 2.00 2.00 1.84 1.62 -13.42 12.99 0.00 0.00 0.00 0.00 0.00 0.00 0.00 0.00 -8.00 -19.00Pearl Harbor 12/7/1941 1.67 2.00 2.00 1.84 1.84 1.81 1.66 1.73 1.68 1.65 1.62 1.66 1.67 -16.50 -16.50 -9.24 -9.24 -7.73 0.60 3.59 0.60 -1.20 -2.99 -0.60 0.00Germany Surrenders 5/7/1945 1.50 1.66 1.67 1.72 1.72 1.50 1.50 1.50 1.50 1.50 1.50 1.50 1.70 -9.64 -10.18 -12.79 -12.79 0.00 0.00 0.00 0.00 0.00 0.00 0.00 13.33Hiroshima/Nagasaki and Japanese Surrender 8/14/1945 1.50 1.70 1.72 1.50 1.50 1.50 1.50 1.50 1.50 1.50 1.50 1.50 1.70 -11.76 -12.79 0.00 0.00 0.00 0.00 0.00 0.00 0.00 0.00 0.00 13.33
KoreaNorth Korea Invades 6/25/1950 2.00 2.00 2.00 2.00 2.00 2.00 2.00 2.00 2.00 2.00 2.00 3.00 3.00 0.00 0.00 0.00 0.00 0.00 0.00 0.00 0.00 0.00 0.00 50.00 50.00Cease Fire Signed 7/27/1953 3.00 3.00 3.00 3.00 3.00 3.00 3.00 3.00 3.00 3.00 3.00 3.00 3.00 0.00 0.00 0.00 0.00 0.00 0.00 0.00 0.00 0.00 0.00 0.00 0.00
VietnamGulf of Tonkin 8/2/1964 3.79 3.38 3.31 3.34 3.46 3.22 3.74 3.51 3.40 3.69 3.68 3.21 2.98 12.13 14.50 13.47 9.54 17.70 1.34 -7.39 -10.29 -2.64 -2.90 -15.30 -21.37U.S. Marines Sent 3/8/1965 3.29 3.38 3.39 3.51 3.78 3.68 3.16 3.28 3.09 3.21 3.20 2.97 4.01 -2.66 -2.95 -6.27 -12.96 -10.60 4.11 -0.30 -6.08 -2.43 -2.74 -9.73 21.88North Vietnam Overtakes Saigon 4/30/1975 8.24 7.68 12.27 13.38 11.53 9.79 8.94 8.24 7.58 7.33 7.05 7.84 9.96 7.29 -32.84 -38.42 -28.53 -15.83 -7.83 0.00 -8.01 -11.04 -14.44 -4.85 20.87
Gulf WarIraq Invades Kuwait 8/2/1990 9.98 7.38 9.12 10.28 10.63 9.75 10.02 10.14 10.29 9.94 10.22 9.85 10.35 35.27 9.46 -2.85 -6.07 2.39 -0.33 1.56 3.09 -0.46 2.33 -1.33 3.67U.N. Authorizes Force 11/29/1990 9.99 8.08 10.46 9.75 9.98 10.29 10.29 9.94 10.22 9.85 9.50 9.39 10.98 23.63 -4.50 2.45 0.06 -2.94 -2.94 -0.52 2.26 -1.39 -4.90 -5.96 9.87Desert Storm Begins 1/17/1991 10.22 8.42 10.81 10.02 10.14 9.99 9.94 10.09 9.85 9.50 9.85 10.06 10.78 21.32 -5.50 1.99 0.75 2.26 2.80 -1.19 -3.57 -7.01 -3.58 -1.48 5.49Ground Assault Begins 2/24/1991 10.09 9.19 10.99 9.98 10.29 9.94 10.22 9.85 9.54 9.39 9.72 10.12 11.65 9.83 -8.19 1.11 -1.93 1.57 -1.19 -2.41 -5.46 -7.02 -3.66 0.30 15.44Kuwait Liberated 2/27/1991 10.09 9.19 10.99 10.14 10.29 9.94 10.22 9.85 9.54 9.39 9.72 10.12 11.65 9.83 -8.19 -0.45 -1.93 1.57 -1.19 -2.41 -5.46 -7.02 -3.66 0.30 15.44
War on TerrorismAfghanistan-U.S. Bombing Begins 10/7/2001 3.38 2.65 4.67 4.41 4.25 4.29 4.11 3.30 3.15 3.22 3.29 - - 27.55 -27.62 -23.36 -20.47 -21.21 -17.76 -2.37 -6.80 -4.73 -2.66 - -
OverallMean 3.48 -6.84 -3.83 -4.55 -1.80 -1.09 -0.36 -1.96 -2.27 -1.93 0.61 11.05Median 7.29 -5.50 0.00 0.00 0.00 0.00 0.00 0.00 -1.20 -2.66 -0.30 11.60
World War IIMean -14.16 -8.39 -2.12 -2.64 -0.93 0.74 1.49 1.16 0.86 0.56 -0.37 9.26Median -12.59 -11.49 0.00 0.00 0.00 0.00 0.00 0.00 0.00 0.00 0.00 6.67
VietnamMean 5.59 -7.10 -10.40 -10.65 -2.91 -0.79 -2.56 -8.13 -5.37 -6.69 -9.96 7.13Median 7.29 -2.95 -6.27 -12.96 -10.60 1.34 -0.30 -8.01 -2.64 -2.90 -9.73 20.87
Gulf WarMean 19.98 -3.38 0.45 -1.82 0.97 -0.57 -0.99 -1.83 -4.58 -2.69 -1.64 9.98Median 21.32 -5.50 1.11 -1.93 1.57 -1.19 -1.19 -3.57 -7.01 -3.66 -1.33 9.87
Sources: Lehman Brothers Fixed-Income Reseaarch and Global Financial Data.

Figure A27. German Three-Month Treasury Bill Reactions to Various Crisis Events, 1954 through June 2002
3-Month Treasury Yields (%) Cumulative Change (bp) in Yields Cumulative Percent Change in YieldsCrisis 3-Month Treasury in Number of Months After Reaction in Number of Months After Reaction in Number of Months after ReactionGrade Crisis Events Date Yield (%) 1 2 3 4 6 1 2 3 4 6 1 2 3 4 6A Cuban Missile Crisis 10/19/1962 2.50 2.63 2.63 2.63 2.63 2.63 13 13 13 13 13 5.00 5.00 5.00 5.00 5.00A Gulf of Tonkin 8/2/1964 2.63 2.63 2.63 2.63 2.63 2.63 0 0 0 0 0 0.00 0.00 0.00 0.00 0.00A Arab Oil Embargo 10/18/1973 7.00 7.00 7.00 7.00 7.00 7.00 0 0 0 0 0 0.00 0.00 0.00 0.00 0.00A Gulf War Ultimatum 12/24/1990 8.25 8.25 8.25 8.25 8.25 8.25 0 0 0 0 0 0.00 0.00 0.00 0.00 0.00A WTC Attack 9/11/2001 3.57 3.35 2.90 3.05 3.14 3.37 -22 -67 -52 -43 -20 -6.16 -18.77 -14.57 -12.04 -5.71B France Falls at Dien Bien Phu 5/8/1954 2.75 2.50 2.50 2.50 2.25 2.25 -25 -25 -25 -50 -50 -9.09 -9.09 -9.09 -18.18 -18.18B Sputnik 10/3/1957 3.88 3.50 3.50 3.75 3.41 3.63 -38 -38 -13 -47 -25 -9.68 -9.68 -3.23 -12.00 -6.32B Soviet Tanks Invade Prague 8/20/1968 2.75 2.75 2.75 2.75 2.75 2.75 0 0 0 0 0 0.00 0.00 0.00 0.00 0.00B Iranian Revolution 1/16/1979 4.00 4.04 4.22 4.22 4.75 5.49 4 22 22 75 149 1.00 5.50 5.50 18.75 37.25B USSR Invasion of Afghanistan 12/24/1979 6.95 7.94 7.87 7.87 8.17 8.40 99 92 92 122 145 14.24 13.24 13.24 17.55 20.86B U.S. Invades Grenada 10/24/1983 6.10 5.90 5.83 6.12 5.99 5.58 -20 -27 2 -11 -52 -3.28 -4.43 0.33 -1.80 -8.52B Invasion of Panama 12/15/1989 7.20 7.25 7.25 8.00 8.00 8.25 5 5 80 80 105 0.69 0.69 11.11 11.11 14.58B Gorbachev Coup 8/16/1991 8.25 8.25 8.25 8.25 8.25 8.50 0 0 0 0 25 0.00 0.00 0.00 0.00 3.03C U.S. Bombs Cambodia 4/30/1970 7.00 7.00 7.00 6.75 6.75 6.75 0 0 -25 -25 -25 0.00 0.00 -3.57 -3.57 -3.57C Falkland Islands War 4/1/1982 9.30 8.64 8.46 8.49 8.49 8.54 -66 -84 -81 -81 -76 -7.10 -9.03 -8.71 -8.71 -8.17C U.S. Bombs Libya 4/15/1986 3.90 3.61 3.50 3.88 3.90 3.80 -29 -40 -2 0 -10 -7.44 -10.26 -0.51 0.00 -2.56C U.S. Embassy Bombings in Nairobi and Dar es Salaam 8/7/1998 3.63 3.20 3.20 3.20 3.20 2.70 -43 -43 -43 -43 -93 -11.85 -11.85 -11.85 -11.85 -25.62
1 Hunt Silver Crisis 2/13/1980 7.87 7.87 8.17 8.40 8.40 8.09 0 30 53 53 22 0.00 3.81 6.73 6.73 2.802 Eisenhower Heart Attack 9/23/1955 3.00 3.25 3.38 3.38 3.38 3.38 25 38 38 38 38 8.33 12.50 12.50 12.50 12.502 JFK Assassination 11/21/1963 2.63 2.63 2.63 2.63 2.63 2.63 0 0 0 0 0 0.00 0.00 0.00 0.00 0.002 Riots and Labor Strikes in France 5/6/1968 2.75 2.75 2.75 2.75 2.75 2.75 0 0 0 0 0 0.00 0.00 0.00 0.00 0.002 Kent State Shootings 5/4/1970 7.00 7.00 6.75 6.75 6.75 6.25 0 -25 -25 -25 -75 0.00 -3.57 -3.57 -3.57 -10.712 Nixon Resigns 8/9/1974 5.63 5.63 5.63 5.63 5.63 5.13 0 0 0 0 -50 0.00 0.00 0.00 0.00 -8.892 U.S. Stock Market Crash of 1987 10/2/1987 3.35 3.77 3.28 3.15 3.15 3.15 42 -7 -20 -20 -20 12.54 -2.09 -5.97 -5.97 -5.972 ERM U.K. Currency Crisis 9/14/1992 8.75 8.60 7.70 7.50 7.50 7.00 -15 -105 -125 -125 -175 -1.71 -12.00 -14.29 -14.29 -20.002 WTC Bombing 2/26/1993 7.00 7.00 6.60 6.60 6.60 6.30 0 -40 -40 -40 -70 0.00 -5.71 -5.71 -5.71 -10.002 Orange County, CA Bankruptcy & Financial Crisis 12/6/1994 5.20 5.20 5.20 5.20 4.85 4.30 0 0 0 -35 -90 0.00 0.00 0.00 -6.73 -17.312 Mexico - Tequila Crisis 12/19/1994 5.20 5.20 5.20 5.20 4.85 4.30 0 0 0 -35 -90 0.00 0.00 0.00 -6.73 -17.312 Poison Gas Attack in Tokyo Subway 3/20/1995 5.20 4.85 4.65 4.30 4.35 4.35 -35 -55 -90 -85 -85 -6.73 -10.58 -17.31 -16.35 -16.352 Oklahoma City Bombing 4/19/1995 4.85 4.65 4.30 4.35 4.35 4.10 -20 -55 -50 -50 -75 -4.12 -11.34 -10.31 -10.31 -15.462 Terrorist Attack in Paris Metro 7/25/1995 4.35 4.35 4.35 4.10 3.90 3.80 0 0 -25 -45 -55 0.00 0.00 -5.75 -10.34 -12.642 Asian Stock Market Crisis 10/7/1997 3.20 3.75 3.75 3.75 3.57 3.50 55 55 55 37 30 17.19 17.19 17.19 11.56 9.372 Russia, LTCM Crisis 8/18/1998 3.63 3.20 3.20 3.20 3.20 2.70 -43 -43 -43 -43 -93 -11.85 -11.85 -11.85 -11.85 -25.62
OverallMean -3 -12 -9 -12 -21 -0.61 -2.19 -1.66 -2.33 -4.05Median 0 0 0 -11 -20 0.00 0.00 0.00 -1.80 -5.71Geopolitical RiskMean -7 -11 -2 -1 5 -1.98 -2.86 -0.96 -0.93 0.12Median 0 0 0 0 0 0.00 0.00 0.00 0.00 0.00Political EventsMean 1 -13 -17 -23 -49 0.85 -1.48 -2.40 -3.82 -8.47Median 0 0 -10 -30 -63 0.00 0.00 -1.79 -5.84 -10.36High Geopolitical Risk (A)Mean -2 -11 -8 -6 -2 -0.23 -2.75 -1.91 -1.41 -0.14Median 0 0 0 0 0 0.00 0.00 0.00 0.00 0.00Medium Geopolitical Risk (B)Mean 3 4 20 21 37 -0.76 -0.47 2.23 1.93 5.34Median 0 0 1 0 13 0.00 0.00 0.16 0.00 1.52Low Geopolitical Risk (C)Mean -35 -42 -38 -37 -51 -6.59 -7.78 -6.16 -6.03 -9.98Median -36 -42 -34 -34 -51 -7.27 -9.64 -6.14 -6.14 -5.87German Political Events (1)Mean 0 30 53 53 22 0.00 3.81 6.73 6.73 2.80Median 0 30 53 53 22 0.00 3.81 6.73 6.73 2.80Non-German Political Events (2)Mean 1 -16 -22 -29 -54 0.91 -1.83 -3.00 -4.52 -9.23Median 0 0 -20 -35 -70 0.00 0.00 -3.57 -5.97 -10.71
Sources: Lehman Brothers Fixed-Income Reseaarch and Global Financial Data.Crisis Grade Key: A = High Geopolitical Risk, B = Medium Geopolitical Risk, C = Low Geopolitical Risk, 1 = German Political Event, 2 = Non-German Political Event

Figure A28. Performance of German 3-Month Treasury Bills Before and After Military Conflicts, 1953 through June 2002
3-Month Treasury Yields (%) Cumulative Percent Change (%) in 3-Month Treasury Yields3-Month Treasury in Number of Months Before/After Military Conflict in Number of Months Before/After Military Conflict
Date Yield (%) -24 -12 -6 -4 -2 -1 1 2 4 6 12 24 -24 -12 -6 -4 -2 -1 1 2 4 6 12 24Korea
North Korea Invades 6/25/1950Cease Fire Signed 7/27/1953 2.88 - - - 3.25 3.25 3.25 2.88 2.88 3.00 3.00 2.50 2.63 - - - -11.54 -11.54 -11.54 0.00 0.00 4.35 4.35 -13.04 -8.52
VietnamGulf of Tonkin 8/2/1964 2.63 2.38 2.63 2.63 2.63 2.63 2.63 2.63 2.63 2.63 2.63 3.13 5.00 10.53 0.00 0.00 0.00 0.00 0.00 0.00 0.00 0.00 0.00 19.05 90.48U.S. Marines Sent 3/8/1965 3.13 2.63 2.63 2.63 2.63 2.63 3.13 3.13 3.13 3.13 3.88 4.00 4.13 19.05 19.05 19.05 19.05 19.05 0.00 0.00 0.00 0.00 24.00 28.00 32.00North Vietnam Overtakes Saigon 4/30/1975 5.40 5.75 5.63 5.63 5.63 4.63 5.40 5.40 5.40 5.40 5.40 5.24 4.78 -6.09 -4.00 -4.00 -4.00 16.76 0.00 0.00 0.00 0.00 0.00 -2.96 -11.48
Gulf WarIraq Invades Kuwait 8/2/1990 8.25 3.15 6.49 7.25 8.00 8.25 8.25 8.25 8.25 8.25 8.25 8.25 8.50 161.90 27.12 13.79 3.13 0.00 0.00 0.00 0.00 0.00 0.00 0.00 3.03U.N. Authorizes Force 11/29/1990 8.25 4.20 7.20 8.25 8.25 8.25 8.25 8.25 8.25 8.25 8.25 8.25 7.70 96.43 14.58 0.00 0.00 0.00 0.00 0.00 0.00 0.00 0.00 0.00 -6.67Desert Storm Begins 1/17/1991 8.25 4.20 7.25 8.25 8.25 8.25 8.25 8.25 8.25 8.25 8.25 8.50 7.50 96.43 13.79 0.00 0.00 0.00 0.00 0.00 0.00 0.00 0.00 3.03 -9.09Ground Assault Begins 2/24/1991 8.25 5.49 8.00 8.25 8.25 8.25 8.25 8.25 8.25 8.25 8.25 8.50 7.35 50.27 3.13 0.00 0.00 0.00 0.00 0.00 0.00 0.00 0.00 3.03 -10.91Kuwait Liberated 2/27/1991 8.25 5.49 8.00 8.25 8.25 8.25 8.25 8.25 8.25 8.25 8.25 8.50 7.35 50.27 3.13 0.00 0.00 0.00 0.00 0.00 0.00 0.00 0.00 3.03 -10.91
War on TerrorismAfghanistan-U.S. Bombing Begins 10/7/2001 3.35 3.00 4.77 3.95 3.99 3.85 3.57 2.90 3.05 3.37 3.45 - - 11.67 -29.77 -15.19 -16.04 -12.99 -6.16 -13.43 -8.96 0.63 2.93 - -
OverallMean 54.50 5.22 1.52 -0.94 1.13 -1.77 -1.34 -0.90 0.50 3.13 4.46 7.55Median 50.27 3.13 0.00 0.00 0.00 0.00 0.00 0.00 0.00 0.00 3.03 -8.52
VietnamMean 7.83 5.02 5.02 5.02 11.93 0.00 0.00 0.00 0.00 8.00 14.69 37.00Median 10.53 0.00 0.00 0.00 16.76 0.00 0.00 0.00 0.00 0.00 19.05 32.00
Gulf WarMean 91.06 12.35 2.76 0.63 0.00 0.00 0.00 0.00 0.00 0.00 1.82 -6.91Median 96.43 13.79 0.00 0.00 0.00 0.00 0.00 0.00 0.00 0.00 3.03 -9.09
Sources: Lehman Brothers Fixed-Income Reseaarch and Global Financial Data.

Figure A29. Japanese Three-Month Treasury Bill Reactions to Various Crisis Events, 1962 through June 2002
3-Month Treasury Yields (%) Cumulative Change (bp) in Yields Cumulative Percent Change in YieldsCrisis 3-Month Treasury in Number of Months After Reaction in Number of Months After Reaction in Number of Months after ReactionGrade Crisis Events Date Yield (%) 1 2 3 4 6 1 2 3 4 6 1 2 3 4 6A Cuban Missile Crisis 10/19/1962 6.08 6.08 6.08 6.08 6.08 6.08 0 0 0 0 0 0.00 0.00 0.00 0.00 0.00A Gulf of Tonkin 8/2/1964 5.71 5.71 5.71 5.71 5.71 5.71 0 0 0 0 0 0.00 0.00 0.00 0.00 0.00A Arab Oil Embargo 10/18/1973 5.55 5.80 5.80 5.80 6.83 6.83 25 25 25 128 128 4.50 4.50 4.50 23.06 23.06A Gulf War Ultimatum 12/24/1990 8.10 7.82 7.44 7.27 7.36 7.56 -28 -66 -83 -74 -54 -3.49 -8.12 -10.28 -9.16 -6.70A WTC Attack 9/11/2001 0.01 0.01 0.01 0.03 0.01 0.00 0 0 2 0 -1 0.00 0.00 200.00 0.00 -90.00B Soviet Tanks Invade Prague 8/20/1968 5.90 5.71 5.71 5.71 5.71 5.71 -19 -19 -19 -19 -19 -3.22 -3.22 -3.22 -3.22 -3.22B Iranian Revolution 1/16/1979 3.39 3.39 3.39 3.39 4.15 4.15 0 0 0 76 76 0.00 0.00 0.00 22.42 22.42B USSR Invasion of Afghanistan 12/24/1979 5.17 5.68 6.83 6.83 6.83 6.83 51 166 166 166 166 9.86 32.01 32.01 32.01 32.01B U.S. Invades Grenada 10/24/1983 5.42 4.91 4.91 4.91 4.91 4.91 -51 -51 -51 -51 -51 -9.39 -9.39 -9.39 -9.39 -9.39B Invasion of Panama 12/15/1989 6.44 5.99 6.43 6.77 7.16 7.40 -44 -1 33 72 96 -6.91 -0.17 5.17 11.15 14.86B Gorbachev Coup 8/16/1991 7.33 7.24 6.26 6.18 6.14 4.97 -9 -107 -115 -119 -236 -1.20 -14.61 -15.69 -16.20 -32.15C U.S. Bombs Cambodia 4/30/1970 5.93 5.93 5.93 5.93 5.93 5.93 0 0 0 0 0 0.00 0.00 0.00 0.00 0.00C Falkland Islands War 4/1/1982 5.42 5.42 5.42 5.42 5.42 5.42 0 0 0 0 0 0.00 0.00 0.00 0.00 0.00C U.S. Bombs Libya 4/15/1986 4.99 4.99 4.99 4.99 4.99 4.63 0 0 0 0 -37 0.00 0.00 0.00 0.00 -7.35C U.S. Embassy Bombings in Nairobi and Dar es Salaam 8/7/1998 0.37 0.30 0.15 0.00 0.10 0.22 -7 -22 -37 -27 -15 -17.87 -59.51 -100.00 -71.88 -39.62
1 Hunt Silver Crisis 2/13/1980 6.83 6.83 6.83 6.83 6.83 6.83 0 0 0 0 0 0.00 0.00 0.00 0.00 0.001 Poison Gas Attack in Tokyo Subway 3/20/1995 2.17 2.03 1.31 1.32 1.12 0.88 -14 -86 -85 -105 -129 -6.37 -39.62 -39.21 -48.48 -59.641 Asian Stock Market Crisis 10/7/1997 0.42 0.44 0.23 0.35 0.37 0.49 3 -19 -6 -5 7 6.24 -45.80 -15.35 -11.27 17.512 JFK Assassination 11/21/1963 5.71 5.71 5.71 5.71 5.71 5.71 0 0 0 0 0 0.00 0.00 0.00 0.00 0.002 Riots and Labor Strikes in France 5/6/1968 5.90 5.90 5.90 5.90 5.71 5.71 0 0 0 -19 -19 0.00 0.00 0.00 -3.22 -3.222 Kent State Shootings 5/4/1970 5.93 5.93 5.93 5.93 5.93 5.93 0 0 0 0 0 0.00 0.00 0.00 0.00 0.002 Nixon Resigns 8/9/1974 6.83 6.83 6.83 6.83 6.83 6.83 0 0 0 0 0 0.00 0.00 0.00 0.00 0.002 U.S. Stock Market Crash of 1987 10/2/1987 3.69 3.69 3.69 3.69 3.69 3.41 0 0 0 0 -29 0.00 0.00 0.00 0.00 -7.752 ERM U.K. Currency Crisis 9/14/1992 3.24 3.55 3.51 3.57 3.41 2.87 31 27 33 17 -37 9.63 8.18 10.06 5.12 -11.482 WTC Bombing 2/26/1993 3.38 2.87 3.04 3.16 3.17 2.94 -51 -34 -22 -21 -44 -15.15 -10.18 -6.48 -6.27 -13.142 Orange County, CA Bankruptcy & Financial Crisis 12/6/1994 2.28 2.25 2.23 2.17 2.03 1.32 -3 -5 -11 -25 -96 -1.23 -2.24 -4.95 -11.00 -42.222 Mexico - Tequila Crisis 12/19/1994 2.28 2.25 2.23 2.17 2.03 1.32 -3 -5 -11 -25 -96 -1.23 -2.24 -4.95 -11.00 -42.222 Oklahoma City Bombing 4/19/1995 2.03 1.31 1.32 1.12 0.82 0.40 -72 -71 -91 -121 -164 -35.52 -35.07 -44.98 -59.56 -80.542 Terrorist Attack in Paris Metro 7/25/1995 1.12 0.82 0.88 0.40 0.24 0.31 -30 -24 -72 -88 -81 -26.50 -21.67 -64.64 -78.33 -72.342 Russia, LTCM Crisis 8/18/1998 0.40 0.17 0.09 0.03 0.24 0.19 -24 -32 -37 -17 -21 -58.96 -78.86 -92.54 -41.47 -51.82
OverallMean -8 -11 -13 -9 -22 -5.23 -9.53 -5.33 -9.56 -15.43Median 0 0 0 0 -17 0.00 0.00 0.00 0.00 -4.96Geopolitical RiskMean -5 -5 -5 10 4 -1.85 -3.90 6.87 -1.41 -6.40Median 0 0 0 0 0 0.00 0.00 0.00 0.00 0.00Political EventsMean -11 -17 -20 -27 -47 -8.61 -15.17 -17.54 -17.70 -24.46Median 0 -5 -6 -17 -29 0.00 -2.24 -4.95 -6.27 -11.48High Geopolitical Risk (A)Mean -1 -8 -11 11 15 0.20 -0.72 38.84 2.78 -14.73Median 0 0 0 0 0 0.00 0.00 0.00 0.00 0.00Medium Geopolitical Risk (B)Mean -12 -2 2 21 5 -1.81 0.77 1.48 6.13 4.09Median -14 -10 -10 26 29 -2.21 -1.70 -1.61 3.97 5.82Low Geopolitical Risk (C)Mean -2 -6 -9 -7 -13 -4.47 -14.88 -25.00 -17.97 -11.74Median 0 0 0 0 -7 0.00 0.00 0.00 0.00 -3.67Japanese Political Events (1)Mean -4 -35 -30 -37 -41 -0.04 -28.48 -18.18 -19.92 -14.04Median 0 -19 -6 -5 0 0.00 -39.62 -15.35 -11.27 0.00Non-Japanese Political Events (2)Mean -13 -12 -18 -25 -49 -10.75 -11.84 -17.37 -17.14 -27.06Median -1 -3 -6 -18 -33 -0.61 -1.12 -2.48 -4.75 -12.31
Sources: Lehman Brothers Fixed-Income Reseaarch and Global Financial Data.Crisis Grade Key: A = High Geopolitical Risk, B = Medium Geopolitical Risk, C = Low Geopolitical Risk, 1 = Japanese Political Event, 2 = Non-Japanese Political Event

Figure A30. Performance of Japanese 3-Month Treasury Bills Before and After Military Conflicts, 1964 through June 2002
3-Month Treasury Yields (%) Cumulative Percent Change (%) in 3-Month Treasury Yields3-Month Treasury in Number of Months Before/After Military Conflict in Number of Months Before/After Military Conflict
Date Yield (%) -24 -12 -6 -4 -2 -1 1 2 4 6 12 24 -24 -12 -6 -4 -2 -1 1 2 4 6 12 24Vietnam
Gulf of Tonkin 8/2/1964 5.71 6.08 5.71 5.71 5.71 5.71 5.71 5.71 5.71 5.71 5.71 5.71 5.71 -6.09 0.00 0.00 0.00 0.00 0.00 0.00 0.00 0.00 0.00 0.00 0.00U.S. Marines Sent 3/8/1965 5.71 6.08 5.71 5.71 5.71 5.71 5.71 5.71 5.71 5.71 5.71 5.71 5.71 -6.09 0.00 0.00 0.00 0.00 0.00 0.00 0.00 0.00 0.00 0.00 0.00North Vietnam Overtakes Saigon 4/30/1975 6.83 4.91 6.83 6.83 6.83 6.83 6.83 6.83 6.83 6.31 6.06 5.68 5.55 39.10 0.00 0.00 0.00 0.00 0.00 0.00 0.00 -7.61 -11.27 -16.84 -18.74
Gulf WarIraq Invades Kuwait 8/2/1990 7.49 3.26 4.80 6.43 7.16 7.40 7.03 7.85 8.27 8.10 7.82 7.66 4.47 129.55 55.90 16.51 4.64 1.26 6.59 4.86 10.43 8.19 4.41 2.35 -40.29U.N. Authorizes Force 11/29/1990 8.08 4.46 6.44 7.40 7.49 8.27 8.27 8.10 7.82 7.27 7.41 6.18 3.51 81.34 25.57 9.32 7.96 -2.24 -2.24 0.21 -3.29 -10.09 -8.31 -23.60 -56.64Desert Storm Begins 1/17/1991 7.82 4.58 5.99 7.03 7.85 8.08 8.10 7.44 7.27 7.41 7.66 5.66 3.41 70.55 30.45 11.29 -0.43 -3.29 -3.49 -4.80 -7.04 -5.19 -1.97 -27.64 -56.43Ground Assault Begins 2/24/1991 7.44 4.39 6.77 7.49 8.27 8.10 7.82 7.27 7.36 7.56 7.33 4.97 3.38 69.39 9.92 -0.60 -9.99 -8.12 -4.80 -2.35 -1.13 1.55 -1.59 -33.23 -54.59Kuwait Liberated 2/27/1991 7.44 4.39 6.77 7.85 8.27 8.10 7.82 7.27 7.36 7.56 7.33 4.97 3.38 69.39 9.92 -5.21 -9.99 -8.12 -4.80 -2.35 -1.13 1.55 -1.59 -33.23 -54.59
War on TerrorismAfghanistan-U.S. Bombing Begins 10/7/2001 0.01 0.05 0.44 0.05 0.01 0.03 0.01 0.01 0.03 0.00 0.00 - - -78.72 -97.73 -80.00 0.00 -66.67 0.00 0.00 200.00 -90.00 -90.00 - -
OverallMean 40.94 3.78 -5.41 -0.87 -9.69 -0.97 -0.49 21.98 -11.29 -12.26 -16.52 -35.16Median 69.39 9.92 0.00 0.00 -2.24 0.00 0.00 0.00 0.00 -1.59 -20.22 -47.44
VietnamMean 8.98 0.00 0.00 0.00 0.00 0.00 0.00 0.00 -2.54 -3.76 -5.61 -6.25Median -6.09 0.00 0.00 0.00 0.00 0.00 0.00 0.00 0.00 0.00 0.00 0.00
Gulf WarMean 84.04 26.35 6.26 -1.56 -4.10 -1.75 -0.89 -0.43 -0.80 -1.81 -23.07 -52.51Median 70.55 25.57 9.32 -0.43 -3.29 -3.49 -2.35 -1.13 1.55 -1.59 -27.64 -54.59
Sources: Lehman Brothers Fixed-Income Reseaarch and Global Financial Data.