case fi l. nasa-sp 5110 copy 5110 55-nitinol---the ... u.s. government printing office, washington,...
TRANSCRIPT

CASE Fi L.COPY
NASA-SP 5110
55-NITINOL---THE ALLOY WITH A MEMORY:
ITS PHYSICAL METALLURGY,
PROPERTIES, AND APPLICATIONS
A REPORT
_iiiii_U_iiUiiiiiiiiiiiiii_!!_iiiii!_iiii_i_iii_ii_iiii_i_!_i_i!!_!!_iiii_iii!!iiiiii!_iii_i_i_iii_!i!_i_iiiii_!i__!!_iii!!_!_!iii_iiiiiiiii_iiiii_i!_iiii_i!_!_!i!iiii!i_!_!_iiii_!!_ii!_ii_iii!!i!_!!iii_ii_i!i!_!_ii_iiii_ii!_!i!_iiiii!i!!_iii_!iii_i_!_iiii_iiii_!_ii_i_!!!!_i_iiii_!!_iiii!i!_iii_i_i_iiii_ii_iiiii_ii_!_iiiiiiiiiiiiiiiiiiiiiiiiiiiii
https://ntrs.nasa.gov/search.jsp?R=19720022818 2018-06-15T21:05:51+00:00Z

LI

NASA-SP 511o
55-NITINOL---THE ALLOY WITH A MEMORY:
ITS PHYSICAL METALLURGY,
PROPERTIES, AND APPLICATIONS
A REPORT
By
C.M. Jackson, H.J. Wagner, and R.J. Wasilewski,
Prepared under contract for NASAby Battelle Memorial Institute
Technology Utilization Office 1972NATIONAL AERONAUTICS AND SPACE ADMINISTRATION
Washington, D.C.

NOTICE • This document was prepared under the sponsorship of the National
Aeronautics and Space Administration. Neither the United States Government nor any
person acting on behalf of the United States Government assumes any liability resultingfrom the use of the information contained in this document, or warrants that such use will
be free from privately owned rights.
For sale by the Superintendent of Documents,
U.S. Government Printing Office, Washington, D.C. 20402
Price $1.00
Library of Congress Catalog Card Number 74-177266

Foreword
The National Aeronautics and Space Administration has established a Technology
Utilization Program for the rapid dissemination of information on technological
developments that have potential utility outside the aerospace community. To assure the
greatest possible benefits to the public from the space program, emerging technology and
innovations are continuously screened and that which has potential industrial or
educational use is presented in a series of NASA publications. This report is one of a
series of such publications sponsored by the NASA Technology Utilization Office to help
industry and institutions benefit from research and development in the aerospace field.
A series of nickel-titanium alloys (55-Nitinol), which are unique in that they possess a
shape "memory," are described in this report. Components made of these materials that
are altered in their shapes by deformation under proper conditions will return to
predetermined shapes when they are heated to the proper temperature range. The shape
memory, together with the force exerted and the ability of the material to do mechanical
work as it returns to its predetermined shape, suggest a wide variety of industrial
applications for the alloys. This report also includes discussions of the physical metallurgy
and the mechanical, physical, and chemical properties of 55-Nitinol; procedures for
melting and processing the material into useful shapes; and a summary of applications
that have been suggested for these unique alloys.
Director
Technology Utilization Office
°.°
111
Acknowledgments
The published information used in preparing this report was obtained from articles in
technical journals and reports on Government-sponsored research programs. In locating
this material, the following information centers, libraries, and abstract services were
searched:
• Defense Metals Information Center
• The Libraries of Battelle-Columbus
• ASM Review of Metal Literature
• Chemical Abstracts
Additional data were obtained by personal contact, telephone, or written communication
with 31 individuals representing 19 organizations in the United States and foreign
countries. All the information in the report covers the period from 1955 to March 31,
1970.
The contributions of the individuals and organizations indicated above are acknowl-
edged with the authors' appreciation. The assistance of Vernon W. Ellzey, ProjectTechnical Coordinator of Battelle Memorial Institute, is also gratefully acknowledged.
iv
ContentsPage
CHAPTER 1. INTRODUCTION ..................................... 1
CHAPTER 2. PHYSICAL METALLURGY ............................. 3
Equilibrium Phases ........................................... 3
Crystal Structure ............................................. 4
Discussion of Crystal Structures ................................... 8
Mechanical-Memory Behavior .................................... 11
CHAPTER 3. PROCESSING PROCEDURES ............................ 15
Melting and Casting ........................................... 15
Mechanical Working 19Heat Treatment .............................................. 21
Joining ................................................... 22"
CHAPTER 4. PHYSICAL PROPERTIES ................................ 23
Melting Point ............................................... 23
Density ................................................... 23
Electrical Resistivity .......................................... 23
Thermoelectric Power ......................................... 28
Hall Coefficient .............................................. 29
Velocity of Sound ............................................ 30
Damping, Internal Friction, Dynamic Modulus , and Poisson's Ratio ........... 35
Heat Capacity and Latent Heat of Transformation ....................... 42
Magnetic Susceptibility ......................................... 47
Thermal Conductivity ......................................... 47
Thermal Expansion Effects and Shape Memory ......................... 4:.
CHAPTER 5. MECHANICAL PROPERTIES ............................ 57
Stress-Strain Characteristics ...................................... 57
Thermomechanical Recovery Force and Work .......................... 63Hardness .................................................. 68
Effects of Alloying ........................................... 70Impact Toughness ............................................ 71
Fatigue Strength ............................................. 71
Machinability ............................................... 73
CHAPTER 6. CHEMICAL PROPERTIES .............................. 75
Resistance to Corrosion ........................................ 75
Resistance to Oxidation ........................................ 75
Effect of Hydrogen Absorption ................................... 76
CHAPTER 7. APPLICATIONS FOR 55-NITINOL ........................ 77
CHAPTER 8. CONCLUSIONS AND RECOMMENDATIONS ................. 81
REFERENCES . ............................................... 83


CHAPTER 1
Introduction
Some 10 years ago, Buehler and Wiley of the U.S.
Naval Ordnance Laboratory developed a series of
engineering alloys that possess a unique mechanical
(shape) "memory" (ref. 1). The generic name of the
series of alloys is 55-Nitinol, where Nitinol stands for
Nickel TI___tanium N__avalO_rdnance Laboratory. These
alloys, which have chemical compositions in the range
from about 53 to 57 weight percent nickel, balance
titanium, are based on the intermetallic compound
NiTi.
The memory is such that, given the proper
conditions, Nitinol objects can be restored to their
original shape even after being "permanently" de-
formed out of that shape. The return to the original
shape is triggered by heating the alloy to a moderate
temperature. Considerable force is exerted, and me-
chanical work can be done, by the material as it
"snaps back" to its original shape. This mechanical
(shape) memory, which is otherwise unknown in
engineering alloy systems, furnishes design engineers
with the opportunity to design on the basis of an
entirely new principle.
The potential of these alloys in a wide variety of
industrial and Government applications prompted the
NASA Technology Utilization Office to sponsor the
preparation of this literature review by the Columbus
Laboratories of Battelle Memorial Institute. Signi-
ficant research on 55-Nitinol has been funded by
NASA.
The concept of a shape memory is new. Accord-
ingly, a brief description of this memory and how it is
imparted to Nitinol objects will be given first.
The steps in the Nitinol shape memory process are
shown in figure 1 (ref. 2). The material is first
obtained in a basic shape such as wire, rod, sheet,
tube, extrusion, and casting (step 1). This shape is
then formed into the shape that the alloy will later be
called upon to "remember," i.e., its "memory con-
figuration" (step 2). Next, the Nitinol shape is
clamped in a fixture that constrains it in the memory
configuration (step 3). The Nitinol, restrained from
moving by the FLxture, is given a heat treatment to
impart the memory and is then cooled (step 4).
(Drennen, Jackson, and Cross found 900 ° F to be the
optimum heat treatment temperature for several
55-Nitinol compositions (refs. 3 and 4). It was later
found that 900 ° F is also the optimum memory heat
treatment temperature for a number of other com-
positions of 55-Nitinol.) After the Nitinol part, in the
memory configuration, has cooled to below the
transformation temperature range (to be defined), the
part is strained to form the "intermediate shape"
(step 5). The intermediate shape is the shape that the
part is to retain until it is heated to restore it to the
memory configuration (step 6). The temperature to
which the part must be heated to return it to the
memory configuration depends on the chemical
composition of the alloy.
Buehler and Wang have shown that the trans-
formation temperature on heating, which corresponds
approximately to the top of the temperature range
through which the material must be heated to restore
it to its memory configuration, varies in binary
nickel-titanium alloys from about -50 ° to +166 ° C
(ref. 5). Furthermore they showed that, by substi-
tuting cobalt for some of the nickel in the alloy, the
transformation temperature can be decreased to
about -238 ° C (ref. 5).
Of considerable interest to potential users of the
alloy is the fact that the memory process (steps 5
through 7 in fig. 1) can be repeated many times. That
is, after the part has recovered its memory con-
figuration upon heating (step 6 in fig. 1) and cooled
to below its transformation temperature range (step
7), it can be deformed again to an intermediate shape
(step 5) and then heated to restore it to the memory
configuration (step 6). This repeatability of the
shape-memory effect has been demonstrated on
samples that have been subjected to steps 5, 6, and 7,thousands and even millions of times.
As the 55-Nitinol part, in its intermediate shape, is
heated to return it to its memory configuration, the

2 THEALLOYWITHAMEMORY
(1) OBTAIN 55-NITINOL IN A BASIC SHAPE: w_e, rod, sleet, tube, extrusion, ca_ing, etc.
(2) FORM THE DESIRED
"MEMORY CONFIGURATION"
(3) CLAMP MEMORY
CONEIGU RATION
IN A FIXTURE
(4) GIVE MEMORY HEAT
TREATMENT (MHTI
(5) STRAIN TO THE
INTERMEDIATE
SHAPE
Heat to about 900 F
HEAT TREATMENT (RHT)
{.300 to *275 F, depending
on composition]
(7) COOL TO AMBIENT TEMPERATURE
"-" k_)J'
This cycle is called a Strain.
Heat.Cool (SHC) Cycle.
FIGURE 1.-Steps in the Nitinol shape memory process.
alloy exerts very considerable force and can do
significant mechanical work. Accordingly, the appli-cations that have been envisioned for 55-Nitinol
utilize not only the shape change but also these force
and work capacities. Other applications are based on
the unusual changes in damping capacity and electri-
cal resistivity that occur over the transformation-
temperature range.
In the following chapters consideration will be
given to the physical metallurgy, processing, pro-
perties, and potential applications of 55-Nitinol-
"The Alloy With a Memory." It is extremely impor-
tant to keep in mind, when considering data on the
properties of 55-Nitinol, that these properties are
very sensitive-much more so than are the propertiesof other nickel- or titanium-base alloys-to the
chemical composition of the alloy. These propertiesare also sensitive to the methods by which the alloy is
processed and heat treated. Thus, data of different
investigators, measured on material that is nominally
the same, are often in disagreement. Through careful
control of the chemical composition and processing
history of these alloys, however, reproducible resultscan be obtained.

CHAPTER 2
Physical Metallurgy
EQU! LIBRI UM PHASES
The existence of the equiatomic compound NiTi
was first reported by Laves, who suggested the
structure to be ordered, CsC1 (B2) type (ref. 6). Later
work on the phase equilibria in the system Ti-Ni
established (1) that NiTi melts congruently, (2) that
the next titanium-rich compound Ti2Ni forms by a
peritectic reaction, and (3) that a eutectic reaction
takes place between NiTi and the congruently melting
Ni3Ti (refs. 7 and 8). In addition, both investigationsindicated an essentially vertical NiTi-phase-field
boundary on the titanium-rich side of the equiatomic
composition. Significant discrepancies, however, are
present in the reported melting and peritectic tem-
peratures, and the proposed boundaries of the single-
phase NiTi field. Basic differences arose in the
interpretation of the observations below appro-ximately 800 ° C. Margolin and Ence suggested NiTi
was stable over a wide composition range down to
room temperature (ref. 7). Poole and Hume-Rothery
suggested NiTi would "undergo a low temperature
decomposition into Ti2Ni + Ni3Ti" (ref. 8) in
agreement with the earlier suggestion of Duwez and
Taylor (ref. 9), who placed the eutectoid temperature
at >800 ° C. Subsequent work by Purdy and Parr didnot confirm the existence of the eutectoid reaction
(ref. 10). They suggested that there was a significantcontraction of the NiTi single-phase field at tem-
peratures <800 ° C, and also they were the first to
uncover the presence of a new structure (rr) forming
at 36 ° C in compositions containing <50 atomic
percent (< 55 weight percent) nickel.The three versions of the proposed equilibrium
_liagram in the vicinity of the equiatomic compositionare shown schematically in figure 2 (Buehler and
Wiley) (ref. 11). In critically evaluating these, it was
first noted that the broad homogeneity range suggest-
ed by Margolin et al. (ref. 7) was based on very
scanty data, hence the later determination (ref. 10) of
the NiTi composition limits is preferred. In later
work, some observations have been rationalized on
the assumption of the eutectoid reaction (refs. 11 to
15) and other observations on the assumption of its
absence (refs. 16 to 24); at times both assumptions
were successively used by the same investigators.A definitive evaluation of the published data is at
present-ttandicapped by the grossly inadequate char-acterization of the materials on which the observa-
tions were made. It is probable that most of the
experimental specimens were significantly con-taminated with interstitials-in particular, oxygen
and the extent to which such contamination may
affect the binary phase equilibria has not been
determined. An extensive investigation of the equil-
ibrium diagram close to the equiatomic composition
suggests the following (ref. 24):
(1) Maximum congruent melting occurs at 50.8 +-
0.2 atomic percent Ni, rather than (as previously
assumed) at the equiatomic composition.
(2) The nickel-rich phase boundary is in close
agreement with that determined by Purdy and Parr
(ref. 10). The homogeneity range of the NiTi below
500 ° C is very limited.
- B r- J C z iA
1300 _ e,_ _
?_ ,,oo_9oo ITI2Nq
E .I,.N,ii_- 700 | , , I Tilt NI +'1"1NI$
i i i3, ,_ _ _, ;, ;3 3,',3'=' _' ,,' _3NI, wt %
FIGURE 2.-The NiTi equilibrium diagram showing three
different versions of the TiNi-phase boundary.
469-815 0 - 72 - 2

4 THE ALLOY WITH A MEMORY
(3) A new phase, of approximate composition
Ni3 Ti2, forms (probably by a peritectoid reaction) at
625 + 20 ° C in nickel-rich compositions. Its structure
is closely related to that of Ni3Ti, and its formationcan be suppressed very readily.
(4) A diffusionless structural transformation takes
place in NiTi at approximately 60 ° C.
The above conclusions are basically in agreement
with the equilibrium diagram proposed by Purdy and
Parr, and the resulting diagram is shown in figure 3.On the basis of the observations on low-interstitial
compositions heat treated in the 600 ° C temperature
range (ref. 21), the existence of the eutectoid
composition can be ruled out. The diagram in figure
3, however, cannot be considered as completely
established. In particular, there are indications that
other structures may also form in annealing the
metastable, nickel-rich, compositions at temperatures
below 500 ° C, in addition to (or perhaps instead of)
the Ni3Ti 2 phase (ref. 24).
Significant segregation can be expected on solidi-
fication of the equiatomic melt, with the resultant
presence of fine Ti2Ni phase in the solid (fig. 3). This
has, in fact, been generally observed. Homogenizing
the cast material at 1000 ° C or (preferably) alternate
hot working and annealing in this temperature range
can be used to obtain essentially phase-pure NiTi,
provided the interstitial content is kept low. The
Ti2Ni structure, however, is stabilized by oxygen
(refs. 21 and 25) and nitrogen (ref. 26), and the
precipitate may be present even in nickel-rich compo-
sitions containing sufficient interstitials.
14oo
o_ IOoo 1025+20° /_ _
_= eoooo / 625 -+20°t_
E 6o0 TizNi+,B | (~ Ni3Ti2) V
1_'400 I Ni58Ti42----,1
2oo I /_+"Ni3Ti2" l
0 __nsit__TizNi+mortensite " T' "+ ""45 5o 55
Ni,ot.%
FIGURE 3.-Proposed equilibrium diagram of the NiTibinary system in the vicinity of the equiatomic composi-tion.
The essentially vertical phase field boundary on
the titanium-rich side suggests no major effects of
prior thermal history in the titanium-rich com-
positions. In contrast, the fact that "the nickel
solubility in the NiTi phase increases rapidly with
temperature presents a "precipitation-hardening"
type of phase diagram. The sluggishness of the
precipitation of Ni3Ti at higher temperatures and ofNi3Ti 2 below 625 ° C makes it very easy to retain the
metastable, supersaturated NiTi phase at room tem-
perature. The hardenability of nickel-rich composi-
tions, first reported by Buehler and Wiley is due to
solid solution and/or precipitation hardening, depend-
ing on the heat treatment (refs. 11 and 12).
The precipitation of an intermediate phase of the
approximate composition Ni3Ti 2 at 625 ° C and
below, has been positively established (ref. 24).
Whether this phase is representative of the equilib-
rium conditions, however, is not clear. Both the
Ni3Ti 2 and other related structures observed to
precipitate at <500 ° C may be transition structures in
the formation of Ni3Ti equilibrium precipitates. The
peritectic reaction proposed by Wasilewski et al. in
figure 3 must be considered tentative at this time, and
other possibilities (e.g., spinodal decomposition)can-
not be ruled out (ref. 24).
Standard metallographic examination of the mi-
crostructures of nickel-titanium compositions near
stoichiometric NiTi so far has been of very limited
significance. This is due primarily to the apparently
featureless structure of the martensitic phase, and
also to the generally present minor second-phase
precipitates in the (nominally single phase) NiTi
compositions. In the "commercial-purity" material,
titanium carbide, oxide and/or oxycarbide inclusions
are also common. In addition, the apparent structure
may depend sensitively on the mode of preparation
of the metallographic section (ref. 11).
It is considered that the few published examples of
structures are not sufficiently representative to war-rant a more detailed discussion. A meticulous investi-
gation of this area is indicated, preferably in conjunc-
tion with replica- and transmission-electron micro-
scopy.
CRYSTAL STRUCTURE
Ti2 Ni and Ni 3 Ti
The structures of the nonequiatomic compounds
previously reported have been well established. Ti2Ni

PHYSICALMETALLURGY 5
iscubic,face-centered(Fd3m),withacellcontaining32formulaunits(96atoms)andaparametergivenasao ---11.328(ref.9), 11.320(ref. 8), or 11.3193A(ref. 25). The ternary,oxygen-containingTi4Ni20crystallizesin the samestructure,but witha latticeparameterof ao= 11.3279A,indicatingonlya small(if any)latticeexpansionontheinclusionof the16oxygenatomsin theunitcell(ref.25).
Ni3Ti has a hexagonalstructure,DO24type,D63/mmc,consistingof anABACstackingof hexa-gonalclosepacked(hcp)planes.Thelatticeparame-tersreportedwere
(1)a = 5.1010A; c = 8.3067A (ref. 27)
(2)a = 5.104A; c = 8.292A (ref. 9)
(3)a = 5.110A; c = 8.319A (ref. 8)
(4)a = 5.108A; c = 8.321A (ref. 28)
Both Ti2Ni and Ni3Ti are believed to have very
narrow homogeneity ranges, and no lattice-parameter
variation with composition has been reported.
/ViTi
The structure of the equiatomic compound was
stated by Laves and Wallbaum to be of CsC1 type
(B2), but with no lattice-parameter data or evidence
of ordering (ref. 6). Subsequent investigations re-
ported a 0 ---2.986 (ref. 9), 3.011 (ref. 29), 3.013 (ref.8), and 3.010A (ref. 30). Observations based on "very
diffuse lines" obtained on quenched powders were
interpreted as indicating a lattice parameter increase
from 2.986A at 46 atomic percent to 3.012A at 51
atomic percent titanium (ref. 30), but this is an
overstatement of the experimental results presented;
the actual variation ranged from 3.00 to 3.012A only.
Purdy and Parr reported, however, no significant
lattice-parameter variation (ref. 10).
The earliest explicit proof of the ordered structure
was reported by Pietrokowsky and Youngkin, who
observed the presence of only the (100) superlattice
reflection, in a pattern obtained with monochromatic
CuKcx radiation (ref. 31). A similar observation was
subsequently reported by Gilfrich, who used MoK
radiation and observed the (100) reflection at tem-
peratures up to 1000°C, thus concluding that noorder-disorder' reaction occurs below that tempera-
ture (ref. 14).
A major novel structural investigation was carried
out by Wang and co-workers, who reported successful
growth of NiTi (nominal composition: 51 atomic
percent nickel) single crystals by a modified strain-
anneal technique (ref. 32). The subsequent structure
investigation by single-crystal diffraction methods
was interpreted as follows (refs. 17 and 33):
(1) Contrary to previously accepted views, the
NiTi structure is not a simple CsC1 type, but has a
large cubic cell corresponding to a superlattice struc-
ture, with a 0 = 9A. The unit cell thus consists of 27subcells of the CsC1 structure. This superlattice is
stable at moderately elevated temperatures only, and
is designated NiTi II. Its proposed atom arrangement
is shown in figure 4 (ref. 17).
(2) At a temperature between 6000 and 7000 C
this superlattice structure becomes disordered, and
the compound becomes simple body-centered cubic,
with random atom distribution, and a 0 = 3A. This
structure is designated NiTi I.
(3) The NiTi II large-cell superlattice structure
undergoes a displacive structural transformation (fig.
5) on cooling below 40 ° C, in the compound
containing 51 atomic percent Ni. The resulting
structure, denoted by NiTi III, was postulated to
exhibit a more metallic (nondirectional) bond char-
acter than the NiTi II, the latter exhibiting predomi-
nantly a covalent (directional)bond. (See ref. 17.)
c (O,O, O) lattice -T-T-N-T-T-
J (I12, 112, 112) latticea
N N
91 -
FIGURE 4.-The unit cell of the TiNi (ll) phase: The lattice
is composed of two distinct simple cubic networks,
(0,0,0) and (1/2,1/2,1/2) whose linear atomic sequences
are -Ti-Ti-Ni-Ti-Ti- and -Ni-Ni-Ti-Ni-Ni-, respectively.

6 THE ALLOY WITH A MEMORY
oo
\,
\\
\
\
4.24 \_ / \\ x
\\,,rio x,_x\ \\ \%, O"
,, e"'\\ _f \\ •
<, I>\ \\ \
/\\ _ \
\ \\\ , \ n,\ • \' \
\ \_ 'xI • \\
x \ I_ \\ • x \
\xA¢ \\ \ -\ \
,- [ llO]
--Ti ; • -- Ni
d,--3.0 d2--2.6FIGURE 5.-The (1]0) plane of the TiNi (II) structure whose
orientation is shown in figure 4. (The approximate
directions of the atomic movements initiated at the 40 ° C
transition are indicated by arrows. The dotted lines
indicate the final positions of the atoms which are not yet
attained at-70 ° C.)
(4) The transition NiTi II + NiTi III for the 51
atomic percent nickel composition is reported tostart, on cooling, at 40 ° C. The atom displacement
continues on continuing cooling, and the postulatedfinal positions are not attained even at -70 o C.
Considering the transformation as martensitic, there-
fore, M s is 40 ° C and Mfmust be below -700 C.Wang et al. do not give the cell parameters or the
atom positions in the final martensitic structure they
suggest. The cooperative atom movement they postu-
late, however (fig. 5), is interpreted as a "unique
martensitic pseudo-order-disorder transition." Ac-
cording to the qualitative argument proposed, the
true structure should be rhombohedral, both in NiTi
II and in NiTi III, inasmuch as one of the cubic
<111> directions must differ from the remaining
ones. The pseudocubic symmetry observed is ex-
plained in terms of random occurrence of the four
possible structure variants.
In X-ray and electron-diffraction, transmission
electron-microscopy, and electrical-resistivity studies
of polycrystalline materials, Dautovich and Purdy
obtained somewhat different results (ref. 18). They
investigated compositions containing 51.0, 50.4, and
50.0 atomic percent nickel, the nickel-rich composi-
tions having been prepared by levitation melting and
warm rolling. The interstitial content was not deter-
mined. Their findings can be summarized as follows:
(1) The 51 percent nickel composition, as recry-
stallized (15 min at 700°C), is single phase, CsC1
structure, with faint but sharp superlattice lines. The
comparison of X-ray and pycnometric densities in-
dicates that excess nickel is present as antistructureatoms on _the titanium sublattice, rather than causingthe formation of vacancies on titanium sites.
(2) Subsequent annealing at 500 o C causes the
Widmanstatten precipitation of a second phase, as-
sumed to be coherent Ti2Ni. Selected-area-diffraction
(SAE) patterns of the matrix usually showed CsC1
symmetry. Occasionally, however, additional spots
were observed, which could be indexed on the basis
of a unit cell of a0 = 3 X 3.01 = 9.03A. This was
tentatively ascribed to the ordering of the excess
nickel atoms, with an ideal "ordered" defect struc-
ture corresponding to 51.8 percent nickel. No cor-
responding diffraction lines were observed in (poly-
crystal) X-ray-diffraction patterns.
(3) The displacive transformations were followed
by X-ray and electron diffraction, and by electrical-
resistivity measurements. It was considered that the
transformation takes place in two stages, viz. Cubic
NiTi ÷ transition structure, observed to form grad-
ually on cooling from 50°to 23 ° C. The patternsobtained at 23 ° C could be indexed as either of the
foll owing:
(a) Monoclinic structure, a = 4.41A; b = 3.01A; c =4.14A;/3 = 92.3 °, or
(b) Rhombohedral structure, a = 6.02A; a =90.7 ° .
Both of these structures are consistent with the
observed doubling of the [110] interplanar spacing
observed by SAE. The rhombohedral structure was
preferred because of the better intensity agreement
between calculated and observed values, and the
nonsplitting of the strong (220) reflection. At 20 ° C
an abrupt transformation veers into a martensitic
product, reported of triclinic symmetry from elec-
tron-diffraction patterns. The unit cell proposed has:
a = 4.60A; b = 2.86A; c = 4.11A; a = 90.1°; t3 =
90-0°; ? = 96.7°; and SAE patterns suggest the
approximate orientation relationships: (010)m II
(010)cubic; (001)ml] (101)cubic . The authors iden-
tify the martensite with the n phase of Purdy and
Parr (ref. 10).
The X-ray diffraction results of Wasilewski et al.confirmed the existence of a diffusionless transforma-
tion of the NiTi structure, which was believed to be

PHYSICALMETALLURGY 7
"closelyrelatedto theCsC1structure"(ref.21).Thestructureof themartensiticproductwasnot deter-mined,but wassuggestedto becomplexandof lowsymmetry.In specimensnormalizedbyannealingfor1hr at 650° Candfurnacecooling,differencesin themartensiticpatternswereobservedin differentcom-positions.Thesewereinterpretedassuggestingtheformationof twodistinctmartensiticstructures,oneformingin compositionscontaining<50.2percentNi, andthe otherat >50.8percentNi. Theauthorsalsoconsideredthe natureof the reactiontakingplacein thevicinityof 650° C andfoundit occursonly in nickel-richcompositions.Theyconcludedthatin viewof theratherhighheatof formationofNiTi (8100cals/mole)the order-disorderreactionisunlikelytobeinvolved(ref.34).
It shouldbestressedthat theconclusionof twodifferentmartensitesforming,dependingon thecomposition,canbeconsideredsuspectinviewof thereportedpresenceof preferredorientationin thespecimensinvestigated(ref. 21).Furthermore,onlyonetype of martensitewasobservedby DautovichandPurdy,thoughondifferentlyheat-treatedmater-ials (500° C anneal)(ref. 18).Martensiticstructurevaryingwith compositionwas,however,unambigu-ouslydeterminedin anotherCsC1structure:AuCd(ChangandRead(ref.35)).
Hanlonet al.reportedthevariationof thetransi-tion temperaturewith composition(ref. 22). Asshownin figure6, the resultsof threeindependentinvestigationsof the effectof compositionon themartensitic-transitiontemperaturediffer markedly,althoughthe re_/sonsfor suchdiscrepancyarenotobvious.
Additionalworkoncrystalstructureswasreportedinaseriesof papersbyMarcinkowskiandco-workers,
who used predominantly transmission-electron mic-
roscopy. The presence of two distinct martensitic
structures was reported in a "well-annealed," equi-
atomic NiTi deformed "a few percent at room
temperature" (ref. 36). The shear movements of the
atoms leading to the two alternative product struc-
tures (fig. 7) were given. It was concluded that the
martensites form by two distinct simple shear dis-
placements," in the [_ 11] B2 direction and the
(1T2)B 2 plane. As the result, the parent structure
above the plane of shear is converted into a mono-
clinic martensite denoted M_ in figure 7, while below
the shear plane the (also mon0clinic) martensite M 0 is
formed. The c parameters of both martensites are
150
I00Hanlon et al(ref. 23)
Purdy (ref. II)
Wang et al(ref. 18)
\\\\
48 50 52 54Ni,at. %
FIGURE 6.-The effect of chemical composition on themartensitic transformation temperature of binary NiTialloys (refs. 10, 17, and 22).
nearly equal to a0 ,/-2-of the B2 unit cell. When thelamellae of the two martensite variants are equal in
width, the shears almost exactly compensate each
other, so that no lattice deformation by slip or
twinning is required to accommodate the transforma-
tion shear. This almost complete shear compensation
is suggested to account (qualitatively) for the revisionof the deformed material to its original shape uponreversion to the B2 structure. No other unit-cell
parameters (a, c, or 3) are given.
With respect to these conclusions it must be noted
that a certain ambiguity is inherent in the method of
specimen preparation used. From prior investigations,
it may be reasonably concluded that the equiatomic
NiTi undergoes a martensitic transformation above
25 ° C, even though the exact transition temperatures
vary. The need for some plastic deformation to
develop the martensitic structures observed seems,
therefore, unexpected; and the effects of such defor-
mation on either the structures or the morphology of
the martensite may be significant.

8 THEALLOYWITHA MEMORY
o - Tiatom inplaneofdrawing• Niatom inplaneofdrawingo - Tiatom immediatelyaboveorbelowplaneofdrawing
• - Niatom immediatelyaboveorbelowplaneofdrawing
OlO)B2plane
M I
b3
[OOdBz
[TIO]B2
Mb4
FIGURE 7.-Atom movements which produce true martens-itic structures in NiTi.
A more extensive investigation further developing
these concepts was reported by Marcinkowski et al.
(ref. 37). Transmission-electron microscopy was the
main experimental technique used, and the equi-
atomic (nominal) composition NiTi was investigated.
The specimens were heat treated as thin strips, about
0.004 in. thick, in evacuated quartz ampoules, at1050 ° C, and quenched from either 1050 ° C, or from
some lower temperature above 650 ° C.
While somewhat more documented, this work
presents essentially the same conclusions as the earlier
one (ref. 36). It is pointed out that the martensitic
structures may be considered as distorted HCP, if the
atom species are considered equivalent. The two
martensitic structures may be arranged either in
bands, or as a checker pattern. In the latter case, any
transformation-related macroscopic shear distortions
are "almost perfectly eliminated." Although the
shears involved in the martensitic formation may be
expressed in terms of dislocation formalism (the
partial dislocation having a Burgers vector of b =
(14/88) a0 [ll'l], referred to the B2 lattice), the
authors pointed out that "nothing is gained by
describing the shuffles in terms of dislocation motion,
since they give rise to no net shear." The parameters
of the martensitic structures are given as
(1) M': a = 5.19A; b = 5.51A; c = 4.25A;/3 =116 ° .
(2) M: a = 5.19A; b = 4.96A;c = 4.25A;/3 = 99 °.
A subsequent paper deals with some aspects of the
deformation behavior of NiTi, on the basis of the
above structures (ref. 38).
In their most recent paper the nature of the _650 °
C reactions is considered by Koskimaki et al. (ref.
16). Two compositions, stated as the equiatomic and
one containing 54.4 atomic percent nickel, were
investigated. The authors conclude that the eutectoidreaction
NiTi _ Ti2Ni + Ni3Ti
occurs at 640 ° + 10 ° C and approximately 51 atomic
percent nickel. This eutectoid decomposition is pre-
ceded by the formation of an intermediate, large
unit-cell (fcc, a0 = 15.2 to 15.9A transition precipi-
tate. The basic character of the equilibrium reaction,
however, is thus in agreement with that proposed in
figure 2(b) (refs. 8 and 9). The authors' conclusions
regarding the existence of the eutectoid, however,
were questioned in discussion by Wasilewski et al.
(ref. 23).
N� 3 T� 2
This phase, found to form below 625 ° C, is
suggested to have a structure related to that of Ni3Ti,
consisting of a stacking sequence of ten, rather than
four, hcp layers, in a composition analyzed by
electron microprobing as Ni58Ti42 (ref. 24). Thestructure determination was based on the earlier
patterns for such stacking variants in the Ti-Ni-Cu
ternary system by Pfeifer et al. (ref. 39). These
investigators found that, apart from the Ni3Ti struc-
ture (which they denote as A4, indicating four-layer
stacking), variants A9, A10, and A21 can also form.Wasilewski et al. indicated that A9 and A21 struc-
tures may form at temperatures below 500 ° C, but
conclusive confirmation was not obtained (ref. 24).
DISCUSSION OF CRYSTAL STRUCTURES
In view of the wide disagreement between the
reported crystal structure observed at, and in the

PHYSICALMETALLURGY 9
vicinityof, theequiatomicNiTi,anattemptwill bemadeto consider(1) theprobablecausesfor suchvariations,(2) theequilibriumdiagramfeaturesandthe crystalstructuresreliablyestablished,and(3)conclusionsregardingtheexperimentalworkrequiredtoclarifytheexistingcontroversies.
It is believedthat the principalreasonfor thediscrepanciesin the observedbehavioris theallbutcompletelackof evenminimalcharacterizationof theexperimentalmaterials.In themajorityof publishedworks,thematerialsinvestigatedaremerelyreferredto asNiTi,not eventhenominalcompositionbeinggiven.Furthermore,theimpuritycontenthasseldombeendetermined;at best,themanufacturer'stypicalanalysisof the startingmaterials,i.e., nickelandtitanium,usedfor the initial synthesisof the com-pound,is given.Theonly publishedworkin whichsomewhatmoreextensive-butstill far from ade-quate-materialcharacterizationhadbeenattemptedis thatof Butleret al. (refs.21,22and24),andthecalorimetricstudyof the martensitic transition by
Dautovich et al. (ref. 40).
The inadequate characterization is of particular
importance in NiTi for two reasons. First, even with
high purity and composition control of initial syn-thesis, the compound is readily contaminated by
oxygen in the subsequent processing into suitable
specimen shapes. The usual laboratory purificationmethods cannot be assumed to be effective in
interstitial removal from NiTi, e.g., the low-interstitial
compound prepared by levitation melting (ref. 18)
subjected to double electron-beam zone melting
"purification" showed an increase in oxygen contentfrom the very low starting value of _100 ppm (ref.
40) to 1500 ppm (ref. 41). Therefore, the nominal
purity of the starting materials may be of little
significance in determining that of the experimental
specimens. Also, there is indirect evidence that some
volatilization (or reaction) takes place during vacuum
anneals at temperatures of the order of 1000 ° C. This
leads to an apparent, or real, change in surface
composition and might be particularly significant inthe heat treatment of powder, or thin strip, material.
This effect can be minimized, however, by annealing
bulk, rather than high surface-to-volume ratio, speci-
mens.Second, for reasons of convenient martensitic
transition-temperature range, compositions with a
slight excess of nickel (50.5 to 51 percent)have most
frequently been sought in the work to date (refs. 11
and 12). Their behavior was considered as representa-tive of the inherent behavior of the "ideal" NiTi
structure, in spite of the presence of a large concen-
tration of the structural defects ('2 percent anti-
structure nickel atoms, according to ref. 18). This
assumption is not necessarily justified. In addition, it
is questionable whether equilibrium conditions can be
readily attained at, or close to, room temperature in
nickel-rich compositions, in view of the diffusion-
controlled reactions occurring in the vicinity of 650 °
C (ref. 21).If the experimental materials are, in fact, in a
metastable, nonequilibrium condition, their behavior
can be expected to be highly nonreproducible; the
chances of duplicating the exact degree of nonequili-
brium are obviously very slight. Most recent results of
Wasilewski et al. indicate this is most probably the
major factor (ref. 24).The following equilibrium diagram features can be
considered established:
(1) TiNi melts congruently at a composition
slightly nickel-rich, rather than equiatomic. The triple
points are:
(a) Ti2Ni - NiTi - liq: 1025+20 ° C, 49.75+0.25
atomic percent Ni.(b) NiTi - Ni3Ti - liq: 1120+20 ° C, 58.0+1-0 1
atomic percent Ni.
(2) The titanium-rich phase boundary is essen-
tially vertical below the peritectic temperature of
1025 ° C.
(3) The nickel-rich phase boundary slopes sharply
from 58.0 percent Ni at 1120 ° C to 51 percent Ni at
625 ° C. The cubic nickel-rich structure can be readily
retained by quenching from the single-phase field.
(4) The high-temperature NiTi structure is either
an ordered-CsCl type or one very closely related to it.
Neutron diffraction work by Freise strongly suggests
the former (ref. 42).
(5) The CsCl-structure NiTi undergoes a diffusion-less transformation slightly above 25 ° C. The M s
temperature and the temperature range M s to Mf may
vary with composition and with prior thermal his-
tory, which indicates nonequilibrium behavior. The
most probable equilibrium transition temperature is
approximately 60 ° C, and independent of composi-
tion (ref. 24).
(6) The diffusion-controlled reactions close to625 ° C in nickel-rich compositions involve the pre-
cipitation of one or more nickel-rich phases inter-mediate between NiTi and Ni3Ti. The precipitate

10 THE ALLOY WITH A MEMORY
structures are closely related to that of Ni3Ti. These
reactions are very sluggish, and can be easily sup-
pressed by moderately fast cooling.
(7) The structures and/or the number of the
martensitic products formed have not been unambig-
uously determined. Only the existence of the transi-tion and its diffusionless character were established.
The single-crystal diffraction work by Wang et al.,
presents the first major effort at determining the
various crystal structures present (refs. 17 and 33).
The work was carried out predominantly on a
noncharacterized, nominal 51 percent nickel com-
position, and the geometry of the shear transforma-
tion appears consistent. The results are interpreted in
terms of the ideal, equiatomic composition. There
are, however, some inconsistencies between the pro-
posed interpretation and the experimental data. Someof these results include:
(1) Strain-anneal single-crystal growth, by repeat-
ed cycling over the 500 ° to 9000 C range of a
nickel-rich composition, involves repeated crossing of
the diffusion-controlled reaction range. It is possible
that the streaks observed in the zone photographs
(ref. 17) may be due to a modulated structure (ref.
43) rather than to the proposed "displacement
disorder." In addition, the Laue patterns shown were
not, in fact, those of true single crystals.
(2) The pseudocubic 9A superlattice structure,
resulting from the random distribution of the four
variants of the rhombohedral domains, could be
readily confirmed by the appearance of (111)reflec-
tions. The interpretation based only on the zero-layer
precession patterns of poor quality cannot be ac-
cepted as fully convincing. In addition, the agreement
between the observed and the calculated interplanar
spacings given in table 1 of reference 17 is poor, in
some cases (lines 1, 10, 13, 14, 17, 29, 33),unacceptably so.
(3) The gradual transition to the martensitic
product proposed is not in agreement with either the
"burst" type martensite formation, or the nuclea-
tion-and-growth type martensites.
(4) The suggested coexistence of two or three
structures at the same composition over a tempera-ture range, proposed in reference 33 is thermo-
dynamically impossible in a binary sytem.
These single crystal observations should, therefore,
be treated with considerable caution, unless more
conclusive corroborating evidence is forthcoming.Similar caution should be exercised in the evaluation
of subsequent work, based on the acceptance of these
observations, as e.g., the postulated irreversible criti-
cal range in the martensitic transition. (ref. 44).
The X-ray and electron-diffraction results given in
reference 18 show the presence of a regular striped
contrast in the 51 percent Ni compound annealed at
700 ° C, i.e., close to the single-phase field boundary.
This, again, may have been due to a structure
modulation (ref. 43). The annealing of specimens in
thin-strip form may also have caused a significant
shift of the chemical composition of the specimen. As
regards the proposed transition phase and martensitic
structures, the agreement between the calculated and
the observed polycrystal-diffraction patterns is ob-
viously fair. It is doubtful, however, whether other
than rigorous single-crystal data on such complex
structures can be accepted as significant. Much the
same reservations can be voiced in respect to the
interpretation of the observations by Marcinkowski et
al., even though the transformation shears proposed
are a highly possible qualitative rationalization of
some aspects of the transformation behavior (refs. 15and 36 to 38).
The largely inconclusive results of Wasilewski et al.
(at least with regard to the crystal structures) reflect
the relative inferiority of the standard experimental
methods as compared with transmission electron
microscopy (refs. 21 to 24). The use of relatively
large specimens, however, permitted them to carryout a relatively extensive characterization of the
materials actually examined. The parallel investiga-
tion in which more than one experimental technique
was used on a range of compositions has shown
convincingly that differences in prior treatment cansignificantly affect both the microstructures and the
properties of NiTi compositions. Also, the investiga-
tion showed that the major effects can be obtained innickel-rich NiTi.
In view of the apparent great variety of possible
structures reported to date in the NiTi system it
seems the clarification of the existing discrepancies will
require further work on carefully characterized ma-
terial. It is essentially mandatory that the behavior
over a significant range of composition, with respect
to two or more properties, be investigated. The
conclusions based on one property alone may be
inconclusive. The comparison of these conclusions
with observations on differently prepared materials
may be misleading. Unquestionably, additional sin-
gle-crystal research on very rigorously characterized

PHYSICALMETALLURGY 11
material seems essential for the firm determination of
equilibrium structures.
MECHANICAL-MEMORY BEHAVIOR
The "mechanical-memory" behavior first reported
by Buehler et al. is based on the fact that this
material, when deformed below the transition tem-
perature, will return to its original undeformed shape
on heating through the transition range (ref. 13). The
deformed shape is not reversible on subsequent
cooling into the martensitic range. The mechanical-
and physical-property variation over the transforma-
tion range will be discussed in detail in subsequent
chapters. Only the suggested rationalizations for thisanomalous behavior and some reported observations
on the atomic displacements in the transition range
will be discussed here.
The original observation of the memory behavior
was rationalized in terms of stress-sensitive decom-
position of NiTi. It was indicated that Ti2Ni forms
preferentially under tensile stress, and Ni3Ti under
compressive stress (ref. 13). It was further suggestedthat both of these structures revert to the original
NiTi on heating to about 65°C. X-ray-diffraction data
interpreted as confirming this hypothesis were re-
ported (ref. 14). It is now, however, generally ac-
cepted that this hypothesis is incorrect, and that the
memory behavior is in some manner related to the
diffusionless-structure transformation.
Qualitatively similar anomalous behavior had been
previously observed in the martensitic transforma-
tions of the compounds AuCd (ref. 45) and InT1 (ref.
46). Both of these compounds, when severely de-formed in the martensitic structure under some
conditions, revert to the original configuration on
heating above the transition temperature. This effecthas been most extensively studied in single-crystal
Au-47.5 Cd. The semiquantitative rationalization
indicated that the martensite forms in two twin-
related orientations (refs. 47 and 48). On application
of stress, one of the twin orientations, more favorably
oriented with respect to the sense of stress, can grow
at the expense of the other. This growth may be
reversible On some cases) on the removal of stress;
but even when permanent deformation of the twin-ned martensite is affected, the original shape is
regained on heating into the B2 structure range. The
memory effect, therefore, may result from (1) an
invariant orientation relationship between the B2
parent structure and the twinned martensitic product
and (2) the strain accommodation by the growth ofone twin orientation at the expense of the other.
Whether this is correct, however, cannot yet be
definitely stated. In particular, the possible signifi-
cance of the atom shuffles, known to be involved in
the martensitic formation, is yet to be determined
(ref. 48).The situation in NiTi is far less clear. Although
substructures, interpreted as probable twins, have
been reported, it is not yet established whether or not
the deformation in the martensitic product structure
is a prerequisite for the memory behavior (ref. 21).
On the basis of the published interpretations, the
following alternatives may be considered possible:
(1) The deformation must occur in a partlytransformed material. This would be consistent with
the very extensive (Ms-Mr) range proposed by Wang
et al, (ref. 17) and with the suggested "strain-martensite" formation in rationalization of the low-
yield behavior (ref. 19).
(2) The deformation must occur above the M s
(but below the Md) temperature. As shown by Ball et
al in their investigation of polycrystalline Ni52Ti48,
the plastic strain "due to the formation of strain
martensite" could be repeatedly recovered on subse-
quent heating to 2000 C (ref. 49). (In all tests,
however, a substantial part of the total strain was
irreversible, and ascribed to dislocation flow.) A
similar assumption has been implied, though not
explicitly stated, by deLange and Zijderveld (ref. 50).
They suggested that a thermal martensite is formed asa random distribution of all the possible crystallo-
graphic orientations with respect to the parent lattice.Such random distribution would minimize the strains
arising from the (unknown) martensitic shear. Whenmartensite is formed in the presence of an applied
stress, however, some orientations will be favored,
and a preferred martensitic orientation (texture) willresult. This is schematically illustrated in figure 8.
(3) The deformation must occur below the Mf
temperature. In this case the twinned martensitic
hypothesis may apply, but the possibility of otheralternatives cannot be excluded (ref. 48).
There is, at present, very little reliable information
to permit an unequivocal choice between the abovealternatives, and a significant amount of work is
required to throw further light on the memory
phenomenon. It is probable that, by analogy with
Au-47.5Cd, deformation in the martensitic product
469-815 O - 72 _ 3

12 THE ALLOY WITH A MEMORY
(A)
(B)
Tension
(c)
FIGURE 8.-Schematic representation of the martensitic
transformation (hypothetical): (a) at 100° C: high-tem-perature phase with random orientation, (b) after coolingto 20° C: martensite with random orientation has formedin the high-temperature phase, and (c) after deformationat 20 ° C: (the plastic deformation is realized by theformation of martensite of preferred orientation. Thetension and compression sides of the specimen showdifferent textures of the martensite.
phase is a necessary prerequisite. This, however,
cannot now be accepted as established beyond doubt,particularly since essentially none of the martensitic
transformation parameters (Ms, Mr, Mr, As, and A fcomposition effects) is now unquestionably certain.
In the following section it will be assumed onlythat the memory behavior is directly related to the
martensitic transformation. The observations pertain-
ing to the nature of the structure change involved willbe discussed briefly.
Martensitic Transformation
As proposed by Wang et al. this reaction consists
of a progressive departure from the parent NiTi II
structure, hence, a second-order transition (ref. 17).The authors, however, state that "a considerable
amount (5.78 cal/g, which corresponds to about 307
cal/g atom for the alloy considered) of latent heat (is)involved at the.., transition." Since second-order
reactions are defined as involving a discontinuity in
the first derivative of the energy vs temperaturerelationship, the existence of latent heat is not
consistent with the proposed reaction order.
Dantovich and Purdy indicated that the intermedi-
ate transition structure is formed by a second-order
transformation mechanism, but leave open the ques-
tion of the order of the martensite formation (ref.
18). The observations by Wang et al. (ref. 44) are
interpreted as confirming the second-order character
of the transition above the martensitic transformation
temperature range; but whereas this transition to an
intermediate structure was found to exhibit no
hysteresis in reference 40, Wang et al. reported it to
be irreversible, and to occur only on cooling. Sub-
sequent interpretation of calorimetric data by Dauto-
vich et al. (fig. 9), implies that a discontinuity in Cwas assumed on martensite formation; the order o_
the martensitic reaction was not explicitly established(ref. 40).
X-ray-diffraction, calorimetric, dilatation, and
physical-property observations reported by Wasilew-
ski et al. were interpreted as indicating a first-order
reaction, and latent heat determined at 370+20 cal/g
atom (refs. 21,22, and 24). It is usually accepted that
martensitic reactions are, in general, first-order trans-
formations (ref. 48). The most recent work confirms
that the order of the transformation does not change
depending on the product structure observed (ref.24).
The above conflicting interpretations are all based
on comparably differing experimental behavior of the
(nominally the same) compositions investigated. Was-
A o Heating from 55 *C
o_ 20 /_ • Heating from 49 oC--. -- t_i, • Heating from 42.8 °C
_ Ct A Heating from 25 °C
J\
u
"_ I0 --
i_
54 58 62 66 70 74 78
Temperoture,°C
FIGURE 9.-Calorimetric data obtained during heating from
the temperatures indicated. (Each heating run was pre-
ceded by heating the sample to 95 ° C or above. The
broken line indicates the base values used in the graphical
integration.)

PHYSICAL METALLURGY 13
ilewski et al. concluded that most of the observations,
particularly those on the most commonly usednickel-rich compositions, had been made on nonequi-
librium materials (ref. 24). This would account for
the wide disagreement between different sets of
observations. The extent to which the nonequilibirum
condition of the material may affect the transition
temperature, the transition temperature range, and
possibly the nature of the product has not been
investigated to date.
The atom displacements involved in the marten-sitic transition of the second order, as [_roposed by
Wang have already been mentioned (ref. 17). Addi-
tional hypotheses, obtained basically by transmission-
electron-microscopy methods and due to Marcinkow-
ski and co-workers have also been referred to (refs. 15
and 36 to 38).
Chandra and Purdy, while giving no detailed atom
movements, suggest that the premartensitic-transition
structure is characterized by large-amplitude, short-
wavelength-atom displacements from their CsC1
lattice sites, reflecting incipient instability (ref. 51).
This interpretation of the observed streaks in the
electron-diffraction patterns does not agree with the
results of X-ray diffraction concurrently obtained on
other samples of the same (low-oxygen, typically 100
to 200 ppm) material, in that either the triclinicmartensite or the rhombohedral transition-structure
pattern was observed in these (ref. 18). (If only the
atom displacements from their equilibrium positions
were involved, the symmetry of the X-ray pattern
would not change. For random vibration variation, all
the lines should merely become uniformly more
diffuse, as with increasing temperature.)In considering the possible sequence of events at
the martensitic transition, the prior heat treatment
may also be of significance. Iwasaki and Hasiguti
observed the presence of antiphase-domain bound-
aries in NiTi containing 50.3 percent nickel and in the
ternary composition 47Ni-6-Co-47Ti (ref. 52). The
electron-diffraction pattern showed clearly many
spots not possible for the simple CsC1 structures, butno clear-cut structure was established. Antiphase
boundaries were observed in dark-field images, with a
superlattice reflection, in both "as-annealed" and
"as-deformed (in tension)" material. The antiphase
boundaries were found to lie on [112] B2 planes.
The domains were some three times larger and much
more sharply defined in the annealed specimens than
in the deformed material.
A precipitation phenomenon in both the stoichio-
metric and nickel-rich (51 percent nickel) material
was reported by Otsuka and Shimizu (ref. 53). The
precipitates observed were not Ti2Ni and Ni3Ti, and
in both compositions all the extraspots identified as
due to the precipitate lay in [112] B2 reciprocal
lattice planes. In both compositions the spacing and
the stacking sequence of the reciprocal lattice planesconstructed were the same as those of B2 lattice, and
had a period of six layers. The arrangement of the
reciprocal lattice points, however, was different in the
two compositions. In the equiatomic compound, the
pattern was indexed as monoclinic, while the nickel-
rich precipitate structure was indexed as orthor-
hombic. The equiatomic composition appeared single
phase, hence, the authors suggested that an "early
stage of precipitation" may have been involved. The
structure of the nickel-rich compound (annealed 72
hours at 500 ° C) showed the presence of plate-like
precipitate, in agreement with the observations in
reference 24 and figure 3.It is noted that a common feature of all the
transmission-electron-microscopy observations is the
significance of [112] B2 planes whether interpreted
as antiphase domain boundaries (ref. 52), precipitate
planes (ref. 53), or the plane of shear (ref. 38). In
conclusion, it appears that the information on the
martensitic transformation in NiTi is at present
highly inadequate. Assuming that the memory be-
havior is directly connected with this transformation,a considerable amount of additional experimental
work is required before reproducible behavior can be
reliably expected. Most, if not all, of the interpreta-tions to date must be considered as largely specu-
lative, and should be used with considerable caution
in future work, whether fundamental or applied.


CHAPTER 3
Processing Procedures
MELTING AND CASTING
The melting and casting of 55-Nitinol to obtain
sound, homogeneous material of the proper composi-
tion was once a critical problem in the utilization of
this unique alloy. Initially, in order to obtain material
for research projects the alloy was nonconsumable-arc
melted (ref. 12) or levitation melted (ref. 10).
Vacuum-induction melting and consumable-arc
methods were introduced later, because they better
fit commercial production conditions.
The principal features of each method, as regards
the end product are summarized in table 1 (ref. 54).
The arc and induction methods are discussed in detail
in the following paragraphs.
Vacuum Induction Melting
Crucible
Vacuum-induction-melting methods worked out
by Buehler and co-workers at the U.S. Naval
Ordnance Laboratory entailed the use of a high-
purity graphite crucible because it was found that
molten NiTi would absorb only a very limited
amount of carbon (ref. 54). Typically, the ingot will
contain about 0.03 to 0.08 wt percent C (ref. 55).
For vacuum-induction melting 70- to 80-1b heats,
Drennen, Jackson, and Wagner reported on the use of
ATJ graphite, a high-density, low-porosity form of
graphite (ref. 56). The melting crucible, which had a
100-1b capacity, was designed so that the crucible and
TABLE 1 .-Alloy Melting Methods for the Preparation of NiT_ and Associated Transition
Element Compounds.
Property
Melt purity
Chemical homo-
geneity
Compositioncontrol
Configuration
casting
Quantity pro-duction
Relative cost/
lb
Levitation
Superior
Excellent 2
Excelent
Good
Very limited
Highest
Melting method
Nonconsumable Consumable
arc arc
Very good
Very good 2
Excellent
Excellent
Fair
Fair
Fair
Limited
High
Fair
Good
Medium
Vacuum
Induction i
Satisfactory
Excellent
Excellent 3
Excellent
Excellent
Lowest
i Employing a high purity graphite crucible and proper melt sequencing.
2Homogeneity limited to very small melts.
3Empirical charge factors must be determined in advance.
15

16 THE ALLOY WITH A MEMORY
pouring lip were mechanically joined in such a way
that the molten alloy never contacted any other
material than graphite during melting and pouring.
The major disadvantage of the graphite crucible is
that it will react with either molten nickel or
titanium. Carbon is highly soluble in molten nickel,
and has a well-known affinity for titanium. On the
other hand, NiTi does not have any appreciable
solubility for carbon. Procedures for avoiding contactwith the pure molten ingredients are described below.
Because of this disadvantage of graphite, other
crucible materials have been explored, though in each
case the results were not satisfactory. Buehler, for
example, prepared some Nitinol in a 99 percent-MgO
qgucible by melting the nickel first and then charging
the titanium (ref. 54). He found that the oxygen levelin the Nitinol had increased to about 0.08 to 0.18
percent, whereas only 0.05 percent would be
expected from the analysis of the sponge titaniumused as a charge material. As a result of this work it
was indicated that the method might be used satisfac-
torily, but would require rapid melt sequencing.
Wasilewski et al. reported that melting in alumina
crucibles resulted in appreciable oxygen contamination
(ref. 21). Drennen et al. (ref. 56) experimented with a
thoria crucible, since thermodynamic considerations
and experimental data (ref. 8) indicated that ThO 2would not be reduced by molten NiTi. Because thoria
is very sensitive to thermal shock, however, its use as
a crucible (or even as a thermocouple protectiontube) led to procedural difficulties.
Melting Procedures
The best way to vacuum-melt Nitinol appears tobe to start the melt with a piece of Nitinol of known
composition, and then add nickel and titanium mixed
together in the proper proportion (refs. 56 and 57).In cases when the Nitinol starter material was not
available however, an alternate procedure was used to
limit contact between molten nickel or titanium and
the graphite crucible. Specifically, thin nickel sheet,
formed into a closed-end tube, was set vertically
(with the closed end down) in the crucible, and a
mixture of nickel and titanium was placed in the tube
as the initial charge material (ref. 56).
High-quality ingots weighing 65 Ib were preparedby the following procedure (ref. 56):
(1) Place a 5 to 10 lb "starter" piece of Nitinol ofknown composition in the bottom of the crucible.
(2) Place a mixture of titanium and nickel in the
tower of the vacuum furnace. (EL-90 grade electro-
lytic titanium crystal, commonly called "sponge,"
and electrolytic nickel were used as the chargematerials by Drennen et al. (ref. 56).)
(3) Pump furnace down to a pressure of 1 to I0
microns (1 to 10X10 -3 torr).
(4) When the Nitinol starter piece has melted, the
chamber is blanked off from the vacuum pumps and
back filled with high-purity argon to a pressure of 1/6atmosphere.
(5) Add the nickel and titanium mixture from the
charging tower at a rate about equal to the dissolu-tion rate.
(6) After the melting is complete, gradually lower
the chamber pressureto about 1 to 12 microns, and
allow the melt to outgas gently.
(7) Measure the temperature with a Pt-Pt/10Rh
thermocouple sheathed in an ATJ graphite protection
tube. Maintain the melt temperature at 1400 ° to1470 ° C.
(8) Blank off the furnace and pour the metal into
a graphite mold. Leave 5 to I0 lb of material in thefurnace.
(9) If another heat is to be made immediately,
start with step 2. If not, pour the remaining material
into a graphite mold for use as the starting charge in asubsequent heat.
Drennen reported that if the melt-down of the
titanium and nickel was conducted under a full
vacuum in the order of 10 microns, the evolution of
gas, especially from the nickel, was extremely violentand tended to blow the molten nickel out of the melt
and onto the upper part of the crucible (ref. 56).
Because this part of the crucible was relatively cool,
the metal tended to solidify and build up around this
area. Vacuum degassing of the nickel-melting stock
reduced the gas evolution somewhat; backfilling with
argon reduced the gas evolution and splattering to
practically nil. The removal of the gas that is
absorbed in the melt during melting under argon is
carried out in vacuum (step 6, above).
Ingot Quality
Four aspects of ingot quality are important,especially if Nitinol is considered for commercial
production. These are:
Surface quality and internal soundness.-Drennen,
Jackson, and Wagner found that casting of Nitinol

PROCESSINGPROCEDURES 17
into taperedgraphitemoldswithhot topsproducedsound65-1bingots,freeof secondarypipeandwithan excellentsurface(fig. 56). Oneof the ingotsobtainedisshownin figure10.Thisingotis 14.25in.longwitha 5.5-in.hot top.Theingotdiamis5 in.atthe top and 3.5 in. at the bottom. This taperproducedproperlycontrolleddirectionalsolidifica-tion, andno secondarypipe.Earlierinvestigators,usinga differentingotdesign,producedingotsof asimilarsizebutwith a veryconsiderableamountofsecondarypipe.
Composition control.-Composition control is im-
portant whenever Nitinol is being used in applicationswhich make use of the sharp changes in properties
with temperature. For example, Nitinol which has
been memory-heat treated will return to its memory
shape after being heated through a certain tempera-
ture range, called the transition temperature range.For convenience, the end of this range (when no
further shape change occurs) is known as the "transi-
tion temperature." It is very sensitive to the chemical
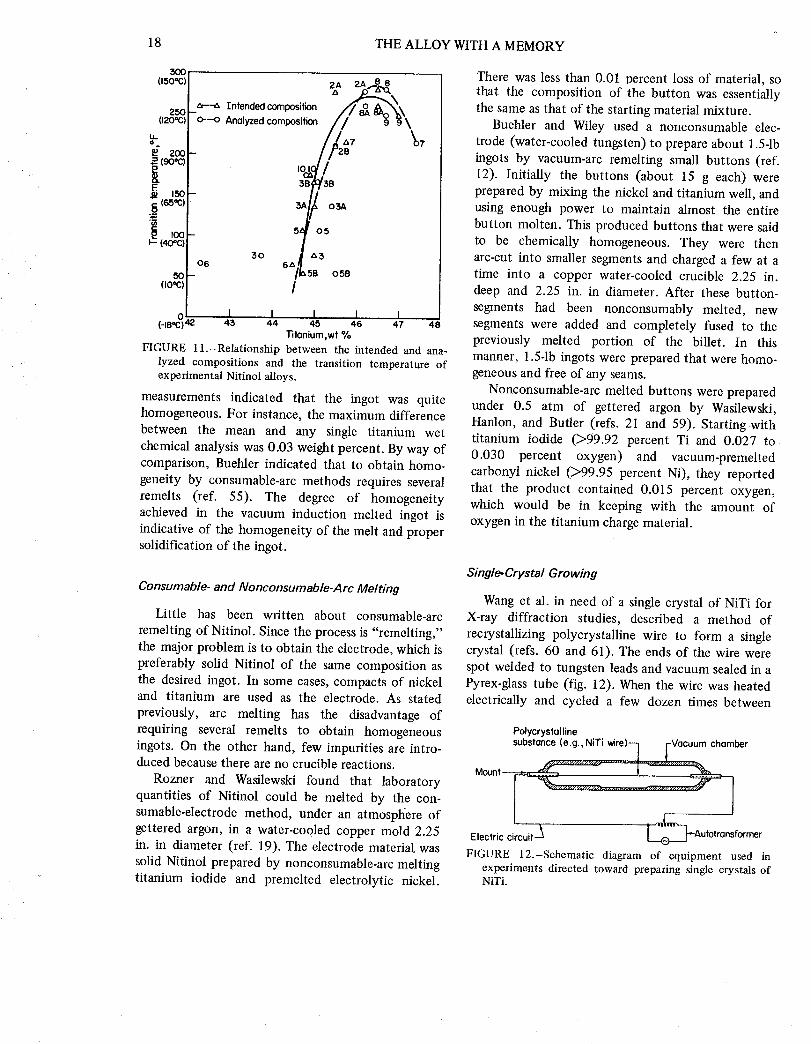
composition of the Nitinol.In Battelle's development of melting and casting
procedures it was found that the transition tempera-
ture was perhaps a more sensitive measure of the
composition of the alloy than was the chemical
analysis (ref. 56). This point is illustrated in figure 11,which shows the relationship of transition tempera-
ture to both the analyzed and the intended (i.e.,
charge) compositions. Considerable scatter may beseen in the data that relate to analyzed compositions.
This is not too surprising, inasmuch as the accuracy
of the titanium analysis is estimated to be about
+0.23 percent for material with these contents of
titanium. Since a 0.3 percent variation in titanium
content might be responsible for a change of 30 ° to
55 ° C in transition temperature, it would be difficult,
if not impossible, to use chemical analysis in quality
control procedures for the transition temperature.
Homogeneity.-In later work, the Battelle-
Columbus investigators determined that a 65-1b as-
cast ingot was very homogeneous (ref 58). Spe-
cifically, an ingot (analyzed titanium content: 45.1
weight percent) similar to that shown in figure 10 was
sectioned longitudinally and examined in ten loca-
tions for evidence of micro- and macrosegregation.
Five experimental techniques were used in the exami-
nation: (1) X-ray spectrography, (2) "wet" chemical
analysis, (3) electron-microprobe analysis, (4) metal-
lography, and (5) microhardness measurements. All
FIGURE 10.-Photograph of 65-1b ingot of Nitinol nickel-base alloy.
18 THEALLOYWITHAMEMORY
3O0(150*C)
25O(120°C
(so.c)
E._ 150
8 (65_c)
(40%
5( -(lO°C
ZA 2A..-La
Intendedcomposition A\_
-0----o Analyzedcomposition/_/2_7 §§9\
-3B_/3B
3A;_ 03A
O63O
5'_ 05
t,36&
*SB 05B
I I I I I(-le*C) 4,?. 43 44 45 46 47 48
Titonium,wt %
FIGURE 11.-Relationship between the intended and ana-
lyzed compositions and the transition temperature of
experimental Nitinol alloys.
measurements indicated that the ingot was quitehomogeneous. For instance, the maximum difference
between the mean and any single titanium wet
chemical analysis was 0.03 weight percent. By way of
comparison, Buehler indicated that to obtain homo-
geneity by consumable-arc methods requires several
remelts (ref. 55). The degree of homogeneity
achieved in the vacuum induction melted ingot is
indicative of the homogeneity of the melt and propersolidification of the ingot.
Consumable- and Nonconsumable-Arc Melting
Little has been written about consumable-arc
remelting of Nitinol. Since the process is "remelting,"
the major problem is to obtain the electrode, which is
preferably solid Nitinol of the same composition as
the desired ingot. In some cases, compacts of nickeland titanium are used as the electrode. As stated
previously, arc melting has the disadvantage of
requiring several remelts to obtain homogeneous
ingots. On the other hand, few impurities are intro-duced because there are no crucible reactions.
Rozner and Wasilewski found that laboratory
quantities of Nitinol could be melted by the con-
sumable-electrode method, under an atmospt/ere of
gettered argon, in a water-cooled copper mold 2.25
in. in diameter (ref. 19). The electrode material was
solid Nitinol prepared by nonconsumable-arc melting
titanium iodide and premelted electrolytic nickel.
There was less than 0.01 percent loss of material, so
that the composition of the button was essentially
the same as that of the starting material mixture.
Buehler and Wiley used a nonconsumable elec-
trode (water-cooled tungsten) to prepare about 1.5-1b
ingots by vacuum-arc remelting small buttons (ref.
12). Initially the buttons (about 15 g each) were
prepared by mixing the nickel and titanium well, and
using enough power to maintain almost the entire
button molten. This produced buttons that were said
to be chemically homogeneous. They were then
arc-cut into smaller segments and charged a few at a
time into a copper water-cooled crucible 2.25 in.
deep and 2.25 in. in diameter. After these button-
segments had been nonconsumably melted, new
segments were added and completely fused to the
previously melted portion of the billet. In this
manner, 1.5-1b ingots were prepared that were homo-
geneous and free of any seams.
Nonconsumable-arc melted buttons were prepared
under 0.5 atm of gettered argon by Wasilewski,
Hanlon, and Butler (refs. 21 and 59). Starting with
titanium iodide (>99.92 percent Ti and 0.027 to
0.030 percent oxygen) and vacuum-premelted
carbonyl nickel (>99.95 percent Ni), they reported
that the product contained 0.015 percent oxygen,
which would be in keeping with the amount of
oxygen in the titanium charge material.
Single.Crystal Growing
Wang et al. in need of a single crystal of NiTi for
X-ray diffraction studies, described a method of
recrystallizing polycrystalline wire to form a singlecrystal (refs. 60 and 61). The ends of the wire were
spot welded to tungsten leads and vacuum sealed in a
Pyrex-glass tube (fig. 12). When the wire was heated
electrically and cycled a few dozen times between
Polycrystolline
substo;e (e.g.,NiTi wire) Vacuum chamber
Electric circuit --_ L__ Aut°transf°rmer
FIGURE 12.-Schematic diagram of equipment used in
experiments directed toward preparing single crystals ofNiTi.

PROCESSING PROCEDURES 19
500 ° and 900 ° C, single crystal growth was observed.
The cycling, about 8 times a minute, introducedsufficient fast stress-strain alternation (caused by
expansion and contraction) to allow a single grain to
nucleate and grow.
MECHANICAL WORKING
Hot Working
Generally speaking, 55-Nitinol alloys are readily
hot worked, and various methods are mentioned in
the literature. The main precautions to be observed
are (1) to carry out the hot working at temperatures
below which incipient melting of secondary phases
can occur, and (for certain alloys)(2)to homogenize
the alloy by holding at elevated temperature for an
extended period in order to put certain nonequi-
librium phases into solution.Buehler and Wang indicated that the Nitinol alloys
can be hot worked by rolling, forging, extrusion, or
swaging at 700 ° to 900 ° C, with 800 ° C being the
preferred temperature (ref. 54). They stated thatabove 900 ° C the alloy may be hot short because of
the low melting point and reduced strength of the
NiTi + Ti4Ni20 eutectic; furthermore, there may beinterstitial oxygen contamination when the alloy is
heated about 900 ° C (ref. 26). In earlier work these
same investigators reported working the alloy in air at
temperatures of 650 ° to 1000 ° C, with 700 ° C
preferred (ref. 62). Bars were swaged at 850 ° C to 0.3
or 0.2-in. diameter for a program sponsored (ref. 63);
from these sizes down to 0.140 in., the rods were
swaged at 800 ° C, using 10 percent reduction per
swaging die (ref. 73).
To prevent oxygen contamination, some invest-
igators have canned the Nitinol billets in mild steel
for hot working, later removing the can by pickling in
an HNO3/HCL solution. Wasilewski et al. used this
technique for swaging (ref. 21), forging (ref. 59),
Dynapak extrusion at 120 in./sec (ref. 19), andconventional extrusion at 6 in./sec (ref. 19). Ex-
trusion was carried out at 900 ° C using extrusion
ratios of 4:1 to 16:1. Wasilewski found that the
canned billets could be extruded or swaged at 800 ° to
950 ° C, and warm worked at 600 ° to 300 ° C, with
no oxygen pickup or iron contamination (ref. 21).
Beuhring, Jackson, and Wagner press forged 65-1b
ingots at 850 ° C in air after a homogenizing treat-ment of 24 hours at 800 ° C (ref. 64). Drennen and
Jackson also observed that the 65-1b workpieces were
somewhat difficult to work and handle under a
forging hammer, and that press forging at 850 ° C was
preferred (ref. 65).Buehler and his associates at the U.S. Naval
Ordnance Laboratory, in rolling strip reported that
for initial passes the rolling temperature was 850 ° C,
but that the temperature was gradually lowered to
700 ° C as the strip became thinner (refs. 63 and 66).
Hot rolling was halted at 0.040-in. thickness. Warm
rolling to foil gages was conducted by heating the
strip to 650 ° C in a tube furnace mounted ahead of
the rolls; the strip was reheated after each pass. Up to5 mils of "screw down" was used for each pass on
approximately 0.040-in. strip; as the 0.006-in. thick-
ness was approached, as many as 4 or 5 passes were
made at a given mill setting to achieve the desired
reduction.
Schuerch reported hot rolling of thin strip in a
special rolling mill with copper rolls through which
electrical current passed to keep the strip at a dull red
heat during rolling (ref. 67).
In rolling plate, Drennen and Jackson started with
a forged slab 1.3×4X33 in. (ref. 65). The slab washeld at 850 ° C for 45 rain and then rolled to 0.58-in.
thickness, taking about a 10 percent reduction in
thickness per pass. After the last reduction the
material was annealed at 850 ° C for 30 min in
preparation for cold rolling.
Conditioning A fter Hot Working
Before proceeding with cold working, the hot-worked material should be cleaned of all oxide, and
any small surface checks shouldbe ground out. The
oxide, said to be mostly an adherent TiO 2, is best
removed mechanically by grinding or grit blasting.
Acid pickling is quite slow, and may attack the
material unevenly if care is not taken to stir the
solution. Oxide removal can be carried out satis-
factorily in a room-temperature solution of 1
HNO3:2 H2 O: 1/8HF.
Before proceeding with cold drawing, the alloyshould be annealed at 700 ° to 800 ° C for 6 to 10 rain
in order to soften the alloy and preoxidize it so that
it will hold the lubricant. The 700 ° C treatment will
result in a thinner oxide than will treatment at a
higher temperature, and is therefore preferable. If thematerial is to be cold rolled, it should be annealed
before (rather than after, as in the case of cold
469-815 0 - 72 - 4

20 THE ALLOY WITH A MEMORY
drawing) being cleaned of oxide according to the
procedures discussed in the previous paragraph.
Cold Working and Annealing
Cold working of Nitinol alloys is relatively
straightforward, provided that the alloy is worked
considerably below its transition temperature Ms, andthat proper lubricants are used. A unique explosive
behavior has been reported when Nitinol is cold
worked under certain conditions, and more will be
said about this later (ref. 68).
Wire drawing.-Typically, the maximum reduction
in area between anneals when drawing is about 30
percent. Considerable latitude is allowed, however,
and reductions up to 60 percent have been reported
(refs. 4 and 55). Annealing to soften the drawn wire
should be carried out at temperatures between 600 °
and 800 ° C, for short times (refs. 54 and 69). Only a
short time is necessary because instead of recovery
and recrystallization, the annealing depends primarilyon transformation of the martensitic structure to the
high-temperature structure, in which case the atoms
must move through relatively small distances. Some
change in dimensions occurs during annealing, how-
ever, because of the shape memory effect; for
example, drawn wire will shorten 3 to 5 percent and
increase in diameter correspondingly as the wire is
heated through its transition-temperature range (ref.55).
Recrystallization and grain growth can be broughtabout by heating for 1 hr at 600 ° to 1000 ° C. Grain
growth depends on the amount of prior cold work.Details are presented in the section entitled "HeatTreatment."
The drawing schedule used by Battelle-Columbus
for producing wire can be taken as typical (refs. 55,
63, and 70). Since the end of the transition tempera-
ture range of one of the alloys was below room
temperature, however, a special procedure was devel-
oped for drawing this composition. For the wire with
a transition temperature above room temperature, the
following procedure was recommended (ref. 71):
(1) Draw alloys with 10 percent reduction per diedown to a diameter of 0.032 in. Process anneal at
700 ° C and air cool after each draw. Some alloys may
be capable of being drawn 2 dies (10 percent each)between anneals. Carbide dies may be used.
(2) Starting at a diameter of 0.032 in., draw the
alloys with a 20 percent reduction per die, using
diamond dies. Process anneal at 700 ° C and air coolafter each draw.
While many lubricants work well, and lanolin has
been recommended in particular (ref. 55), Battelle-
Columbus has preferred a water-soluble lubricant
such as Syntergent "A," which can be washed off
easily before the process anneals. Preoxidation at
700 ° to 800 ° C is important, if the lubricant is to
adhere well; otherwise, die chatter may occur.
Pointing the wires can be done by (1) cold swaging
after annealing (preferably, the swaged point is
annealed again to minimize breakage during draw-
ing), (2) grinding before annealing, or (3) dipping theend of the wire in a 50HNOa-50HF solution with an
applied dc potential of 2 volts (ref. 71). Roll pointinghas not been very successful (ref. 55).
For the alloy with a transition-temperature range
from -23 ° to -7 ° C, Battelle-Columbus developed aspecial procedure that allowed the wire to be drawn
at temperatures in the neighborhood of-29 ° C (ref.
71). Cooling could, of course, be accomplished easily
by passing the wire through a dry ice-acetone
mixture. In this case, however, the problem oflubricating the wire would have necessitated a second
bath with consequent .heating effects. Furthermore,
the lanolin would be very viscous at these low
temperatures. Battelle found that a mixture of Dow
Polyglycol P-400 and dry ice served as a cooling bath
for the wire. At the same time the polyglycol adhered
to the wire and had sufficient viscosity and lubricity
to serve as the lubricant. Thus, in a single pass
through a tank of the polyglycol-dry ice mixture the
wire was cooled and lubricated just prior to entering
the drawing die (ref. 71).
In pointing the wire with the low transition
temperature, it was found that hot swaging was
preferred over cold swaging. Grinding or chemical
action could also be used, as with other Nitinol
alloys.
Drawing rate is determined by the extent to which
the wire can be kept cool during drawing; that is, it
should be kept from heating above its transition
temperature during drawing. The maximum drawing
rate in production, accordingly, will depend on the
type of lubrication, auxiliary die cooling, wire-transi-
tion temperature range, die design (conventional or
roller dies), and the amount of area reduction in
going through the die. Hot drawing, at temperatures
considerably above the transition temperature range,could probably also be used.
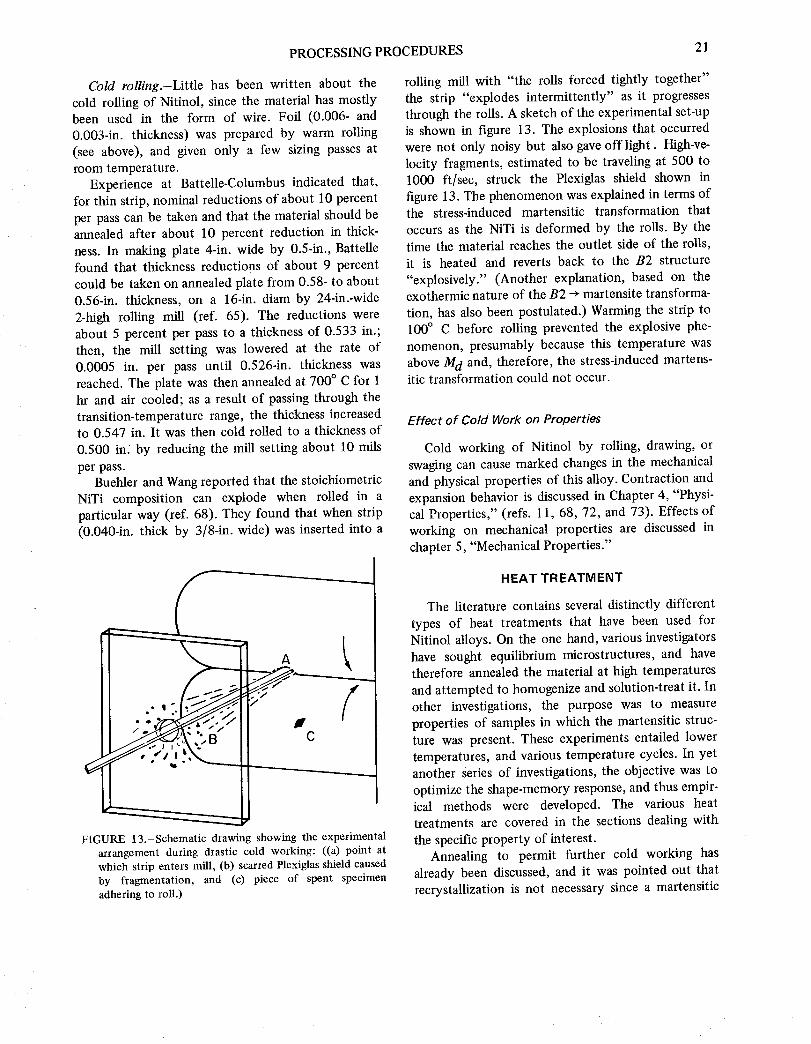
PROCESSING PROCEDURES21
CoM rolling.-Little has been written about the
cold rolling of Nitinol, since the material has mostlybeen used in the form of wire. Foil (0.006- and
0.003-in. thickness) was prepared by warm rolling
(see above), and given only a few sizing passes at
room temperature.
Experience at Battelle-Columbus indicated that,
for thin strip, nominal reductions of about 10 percent
per pass can be taken and that the material should be
annealed after about 10 percent reduction in thick-
ness. In making plate 4-in. wide by 0.5-in., Battelle
found that thickness reductions of about 9 percent
could be taken on annealed plate from 0.58- to about
0.56-in. thickness, on a 16-in. diam by 24-in.-wide
2-high rolling mill (ref. 65). The reductions were
about 5 percent per pass to a thickness of 0.533 in.;
then, the mill setting was lowered at the rate of
0.0005 in. per pass until 0.526-in. thickness was
reached. The plate was then annealed at 700 ° C for 1
hr and air cooled; as a result of passing through the
transition-temperature range, the thickness increasedto 0.547 in. It was then cold rolled to a thickness of
0.500 in. by reducing the mill setting about 10 mils
per pass.Buehler and Wang reported that the stoichiometric
NiTi composition can explode when rolled in a
particular way (ref. 68). They found that when strip
(0.040-in. thick by 3/8-in. wide) was inserted into a
rolling mill with "the rolls forced tightly together"
the strip "explodes intermittently" as it progresses
through the rolls. A sketch of the experimental set-up
is shown in figure 13. The explosions that occurred
were not only noisy but also gave off light. High-ve-
locity fragments, estimated to be traveling at 500 to
1000 ft/sec, struck the Plexiglas shield shown in
figure 13. The phenomenon was explained in terms ofthe stress-induced martensitic transformation that
occurs as the NiTi is deformed by the rolls. By the
time the material reaches the outlet side of the rolls,
it is heated and reverts back to the B2 structure
"explosively." (Another explanation, based on theexothermic nature of the B2 _ martensite transforma-
tion, has also been postulated.) Warming the strip to
100 ° C before rolling prevented the explosive phe-
nomenon, presumably because this temperature was
above M d and, therefore, the stress-induced martens-itic transformation could not occur.
Effect of Cold Work on Properties
Cold working of Nitinol by rolling, drawing, or
swaging can cause marked changes in the mechanical
and physical properties of this alloy. Contraction and
expansion behavior is discussed in Chapter 4, "Physi-
cal Properties," (refs. 11, 68, 72, and 73). Effects of
working on mechanical properties are discussed in
chapter 5, "Mechanical Properties."
FIGURE 13.-Schematic drawing showing the experimentalarrangement during drastic cold working: ((a) point atwhich strip enters mill, (b) scarred Plexiglas shield causedby fragmentation, and (c) piece of spent specimenadhering to roll.)
HEAT TREATMENT
The literature contains several distinctly different
types of heat treatments that have been used for
Nitinol alloys. On the one hand, various investigators
have sought equilibrium microstructures, and havetherefore annealed the material at high temperatures
and attempted to homogenize and solution-treat it. In
other investigations, the purpose was to measure
properties of samples in which the martensitic struc-
ture was present. These experiments entailed lower
temperatures, and various temperature cycles. In yet
another series of investigations, the objective was to
optimize the shape-memory response, and thus empir-ical methods were developed. The various heat
treatments are covered in the sections dealing with
the specific property of interest.
Annealing to permit further cold working has
already been discussed, and it was pointed out that
recrystallization is not necessary since a martensitic

22 THEALLOYWITHA MEMORY
shearmovementwasinvolved.Nevertheless,investiga-tors havereportedthat recrystallizationandgraingrowthdo occurasin othermetallicmaterials,buttherecrystallizationtemperaturewaspracticallyinde-pendentof theamountof priorcoldwork(ref.12).In theseinvestigations,thespecimenswerecoldrolledat variousdegreesfromabout5 to 22 percentandthenannealedfor 1 hrat varioustemperatures.Thehardnesscurvesin figure14showthatallspecimens,regardlessof the amountof deformation,showedasharpdrop in hardnessafterannealingfor 1 hr at600° C. Metallographicexaminationconfirmedthatrecrystallizationhadoccurred.
Normalgraingrowthbehaviorwasobserved,asshownin figure15(ref. 12).Thespecimensthathadreceivedtheleastamountof coldworkgrewlargergrainsat 800° and 1000° C than did the more
severely worked specimens.
44
cold reduction
42 //_16.7%
//
// f----o
,/ // 'el/
36-<(1/'/I/
34-/
3z° I I i t200 400 600 800 I000
Heot treotment ternperoture,°C
FIGURE 14.-Hardness of NiTi specimens after heat treat-ment for 1 hr at selected temperatures.
IO00*C forlhour
800=C for I hour
I I I8.9 13.4 16.7
Cold work, percent
FIGURE 15.-Effect of 1-hr heat treatment at 800 ° and
1000 ° C on the grain size of NiTi, as a function of the
degree of prior cold working.
JOINING
Not a great deal has been reported on the welding
or brazing of Nitinol, but preliminary experiments
indicate that the alloy can be readily fusion welded
and spot or seam welded.
Buehler and Wiley reported on the gas-tungsten-arc
(GTA) butt welding of 1/8-in.-thick hot-rolled plate
using Nitinol as the filler rod (ref. 74). They reportedthat little'difficulty was encountered in making the
joint, and that it was free of cracks and porosity. The
microstructure of the fusion zone was that of a
typical cast structure consisting of fine dendrites.
Some extraneous phases (angular or star shaped) were
detected, however, these phases were probably caused
by some contamination during welding.Drennen and Jackson also found that 55-Nitinol
can be welded using GTA techniques (ref. 4). They
were also successful in resistance-spot welding 55-Nitinol, using an argon cover.

CHAPTER4
Physical Properties
MELTING POINT
The melting temperature of the 55.1 weight
percent Ni alloy has been observed as 1240 ° to 1310 °
C (ref. 74). This is not a temperature range, butrather reflects the uncertainties in establishing the
phase diagram. NiTi, being a congruent melting
compound, should show a clear melting point.
DENSITY
The density of the 55.1 weight percent Ni alloy at
25 ° C was found by Buehler and Wiley to be 6.45
g/cm 3 (ref. 74). Dautovich reported 6.55 g/cm 3 for a
51 atomic percent Ni alloy (ref. 18).
ELECTRICAL RESISTIVITY
Hanlon et al. measured the electrical resistivity of
NiTi over the composition range from 48 to 52
atomic percent Ti at temperatures from -268 ° C to
+900 ° C (ref. 59). The change in electrical resistivity
with temperature in the 15 ° to 110 ° C range on
heating and cooling for a 50 atomic percent Ti sample
is shown in figure 16. Above 75 ° C, this sample was
stated to have essentially the B2 structure, while
below 0 ° C it was completely in the low-temperature
phase. The change in resistivity of a 50.7 atomic
percent Ti sample that has the low temperaturestructure at room temperature is illustrated in figure
17. The resistivity decreases normally with decreasing
temperature. The residual resistance at 4.2 ° K
(-268.8 ° C), 19 microhm-cm, is said to be relatively
high and indicative of the persistence of a consider-able amount of lattice distortion well below the
martensitic-transformation-temperature range. Also,
the low-temperature behavior for a sample containing
48.8 atomic percent Ti is shown in figure 17. In the
figure the characteristic heating/cooling hysteresisseen in the 50 atomic percent Ti sample has not only
shifted to lower temperatures in the 48.8 atomic
percent Ti sample, but also has broadened its temper-
ature range. The extensive hysteresis was said to be• characteristic of the low-temperature transformations
in nickel-rich samples, but samples containing less
than 48 or 49 atomic percent Ti showed no clear-cut
transformation.
The electrical resistivity of the high-and
low-temperature forms of NiTi (50.0 atomic percent
Ti) extrapolated to _70 ° C are (ref. 59):
CsCI(B2) Low-temperature
structure structure
82 microhm-cm 76 microhm-cm
These data apply only to samples annealed 1 hr at
900 ° C and water quenched.
50
82
80
E
"_ 76
"/4
7
I I I I I
78--
o 20 40 60 80 100
Temperoture, °C
FIGURE 16.-Electrical resistivity of NiTi (50 atomic % Ti)
over the temperature range of the martensitic phase
transformation.
23

24 THEALLOYWITHA MEMORY
90-- •
88 -- N_TJ (48 8_
86--
84--
82-
80-
Eo78 -
:L60 _
•= 55- NiTi(50.7ot.%Ti)._>
n_ 4,5 --
40--
35--
50--
25--
15--
I I I I I I I0 20 6o Ioo i40 _BO 22O 260 30O
('253°C)(-213*C)(-173_C) (-133*C)(-97*C)(-53°C) (-13°C) (27"C)
Temperature, OK
FIGURE 17.-Low-temperature resistivity of NiTi (48.8 and
50.7 atomic % Ti).
Wang carried out experiments on specimens with
51 atomic percent Ni that were free of deformation
and of sustained tensile and compressive stresses (ref.
44). Because of the diffusion-type transformation
from NiTi I to NiTi II, postulated by Wang to occur
in the 600 ° to 700 ° C range as discussed in the
section titled "Crystal Structure," prolonged anneal-
ing at 600 ° C was believed to be essential if pure NiTi
II is desired. The electrical resistivity curve of an alloy
annealed at 610 ° C for 4 days followed by furnace
cooling to room temperature is shown in figure 18(a).
Annealing above 700 ° C was said to result in a
structure consisting of both NiTi I and NiTi II, with
the fraction of NiTi I increasing as the annealing
temperature is raised. The electrical resistivity curves
for the alloy annealed at 700 °, 800 °, and 900 ° C,
respectively, (oil quenched) are also given in figure18.
The triangular shape of the resistivity vs tempera-
ture curve is not a hysteresis effect, according to
Wang (ref. 44). (A hysteresis involves a lag behind the
equilibrium state due to a time of relaxation when
the temperature is changing.) Rather, the shape of thecurve is said to be indicative of a martensitic
transition between NiTi II and NiTi III. (NiTi I is
57
56
_54
._ 53
52
G)
(d) (c)
- _1_:_j__(b )
(a):annealat 610"Cfor 7days_._..*'___enneal at 700*Clot 7days2 =E'_'r_ (c)'.annealGtBO0*_Cfor 4 cloys
o-;°-- (d):aryeal _ 900"C for 4 days- Blank symbols-heating
.Solid svmb(W.s-coolioq i i i i i i-30-20-10 0 I0 20 30 40 50 60 70 80 90 I00
Temperature, C
FIGURE 18.-Effect of annealing temperature on the electri-cal resistivity of NiTi (51 atomic % Ni) at and around themartensitic transition temperature.
believed to be unable to transform directly to NiTi
III.) Thus, the decrease in the triangular areas with
increasing annealing temperature, as shown in curves
b, c, and d of figure 18, was presumed to be a
manifestation of the decreasing amount of NiTi II
that was thought to be available to undergo themartensitic transformation to NiTi III.
The effect of various types of thermal cycling on
electrical resistivity is shown in figure 19. The cooling
path M ' .M ' and the heating path M '-As ,, s s are irrevers-ible,* That is, if the direction of temperature change
were to be reversed while traversing these paths, the
resistivity curve would not retrace its original path. In
contrast to this behavior, the cooling path As-M isreversible. The triangular form and the irreversible
nature of the cycle are said to be totally independent
of the rate of heating or cooling.
In Wang's work, thermal cycles carried beyond the
range M' to A without any reversals in the rangeS $
'-A on heating or M-M' on cooling are calledMs s s s
"complete" cycles (ref. 44). The triangular portion of
the curve will remain unaltered through an indefinite
number of complete cycles, according to Wang. On
the other hand, when thermal cycling was carried out
within the irreversible ranges Ms'-As or Ms-Ms', thetriangular form of the resistivity curve was altered.
*The terms A s and M s appear to have been used by
analogy to the nomenclature used in steel technology for
martensitic reactions. It should be noted, however, that
microstructural examinations at various temperatures would
be required before the exact significance of the A s and M s
temperatures identified in reference 45 could be proven.

PHYSICAL PROPERTIES 25
60
!
s7
/>" 56
"__
_ 53
s/I _ I III I I I I I != I /-40 -20 0 20 40 60 80
Temperature, °C
FIGURE 19.-Effect of "incomplete" cycles on the electrical
resistivity of NiTi (51 atomic % Ni) at and around the
martensitic transition temperature (cycling direction is
indicated by arrows: (a) without incomplete cycling, (b)
after six incomplete cycles, and (c) after several hundred
incomplete cycles) (ref. 44).
After six such incomplete cycles, the resistivity curve
(b) shown in figure 19 was obtained. After a few
hundred such cycles, the curve (c) was obtained.
Thus, as the number of incomplete cycles was
increased, a progressive overall increase in resistivity
was observed, along with an increase in the area of
the triangular portion of the curve and a shift (to
lower temperatures) of the maximum resistivity on
cooling. The curve (c) in figure 19 could be restored
to curve (a) only after prolonged reannealing of the
alloy at 600 ° C or above.
Buehler and Wiley measured the electrical resistiv-
ity of Nitinol alloys containing 54.5 and 55.1 weight
percent Ni (ref. 12). The materials had been arc
melted by the nonconsumable method, hot rolledbetween 700 ° and 1050 ° C, and slit so that the
specimen was a strip, measuring about 0.125 to0.186-in. wide by 0.010-in. thick and 5.5 in. long. In
figure 20 are plotted the electrical resistivity data for
a 54.5 weight percent Ni alloy, hot rolled and
annealed (at 1050 ° C) between -57 ° and +99 ° C.
Data for the resistivity change of the 55.1 weight
percent Ni alloy at temperatures to 900 ° C were "too
scattered to be capable of interpretation," but the
resistivity showed a sharp increase (on heating) at
93
x _
-_ e_ x._'_ #6_-.,--- Startt /
_ x - Coolin 9
77 • -Heating
73 i_'- I I I I I I-70 -30 IO ,50 90 150 170 210
(-60C) (-35C) (-12C) (lOt) (30C) (55C) (75C) (IOOC)
Test temperature, °F
FIGURE 20.-Electrical resistivity as a function of tempera-
ture for a 54.5 weight % NiTi alloy.
about 700 ° C. At 900 ° C, it reached 132 microhm-
cm.
The room-temperature resistivity of the 55.1
weight percent Ni composition was measured in orderto obtain some indication of the structure (order-
disorder, in particular) of variously quenched speci-
mens. Two specimens were furnace cooled from 593 °
C, then heated to various temperatures and quenched.Their electrical resistivities are shown in figure 21.
Similarly, two specimens were air cooled after hot
rolling to 0.020 in. at 700 ° C, and then reheated to
various temperatures and quenched. Their resistivities
are shown in figure 22.
In each case, it was found that the resistivity
95
91 --X__x_'X'_)<"'X\
t
"_ 87 -
"6._ 85 -
m
ILl
83-
81 I0 I00
(-18"C)(_8"C)
-- Specimen A
------ Specimen B
I I I I I5OO 50O 7OO 9OO IlO0 13uO
(150o(]) (260oC) (5,'TOaC) (480°C) (595"C)(705=C)
Quenching temperature,OF
FIGURE 21.-Room-temperature electrical resistivity of NiTi
(55.1 weight % Ni) strip heated to various temperatures
and quenched.

26 THE ALLOY WITH A MEMORY
93
91
• 87o
[]
85
X
/\
? _x//'
200 40O 6OO 80O 10oO 1200(-18"C) (95"C) (Z05°C) (515°C} (4250C) (540°C) (65(Y'C)
Quenching tempera ture, ° F
FIGURE 22.-Room-temperature electrical resistivity of NiTi
(55.1 weight % Ni) strip heated to various temperatures
and quenched• (Initial condition of specimen; hot rolled
to 0•020 in. at 700 ° C.)
reached a maximum at about 427 ° C, droppingsharply to a minimum at about 480 ° to 540 ° C. A
relationship of these data to an order-disorder trans-
formation was discussed, but no conclusions were
reached. The electrical resistivity of stoichiometric
NiTi and its alloys containing copper or excess nickel
was investigated by Goff in the temperature range
from -270 ° to +27 ° C (ref. 75). The composition and
grain size of the samples are given in table 2.
TABLE 2.-Composition and Grain Size of Samples
Sample Solute
Solute Grain
concentration, size,
atomic % /_
TiNi - -- 42
TiNi-2 Cu Cu 1.7 46
TiNi-8 Cu Cu 8.1 54
TiNi-18 Ni Ni 18.3 --
The electrical resistivity of each alloy is shown as a
function of temperature in figure 23. Goff inter-
preted the curves of figure 23 in terms of Matthie-ssen's rule,
P = Po + Pi'
where Po and Pi are the residual and ideal resistivities,
respectively (ref. 75); Pi is an intrinsic property of the
iO-3
oi
10-4
U.I
10-5
Ti Ni-SCu
TiNd-18Ni= --_ --_ = ----._ __-.__==--_-. -_Ti Ni-O
I I I I IIIII I I I I IIIll I I I I IIII
5 IO 50 IOO 500(-272 °C ) (-268°C)(-265_C) (- 223°C)(-173"C) (227"C)
l'emperoture, °K
FIGURE 23.-The electrical resistivity of selected NiTi-base
alloys, as a function of temperature•
material and depends directly on some power of T.
At some low temperature it becomes negligible with
respect to the temperature-independent Po" The
concentration dependence of Po is shown in figure
24. From the data, it appears that Po can beexpressed as
Po = Pox + Poo,
where Pox is due to the solute and Poo is an intrinsicproperty of the NiTi matrix.
Because of the large values of Po, it was not
possible to separate Pi from p at temperatures above
-243 ° C, and not at all for the TiNi-8Cu sample. The
values obtained for Pi are given in figure 25, wherethey show a dependence on T 1 above-153°C and on
T 2 below-173 ° C. The T 1 dependence is usuallyobserved in transition metals and indicates that the
electron-phonon scattering has entered the Debye
E • TiNi-O?r_ TiNi-2 Cu
_- ./ A TiNi-8 Cu
o IO o TiNi-18Ni
(_ o
I I I i0 0.0,5 0.10 0.15 0.20
Atom froction of solute
FIGURE 24.-The effect of the atomic fraction of solute on
the residual resistivity of NiTi-base alloys.

PHYSICAL PROPERTIES 27
_o4.
IO-:
42
7,
-_ iO-_0)
"ID
m
• TiNi-O
• TiNi-2Cu
x Ti Ni-18 Ni
• Cr-57ot. % Fe
m. Cr-77 ot. % Fe
S.S"
ii
o•
,o- i I I I I I i I5 t0 50 I00 ,500
(-272"C) (-263%) (-175"C) (227C)
Temperoture, °K
FIGURE 25.-Ideal electrical resistivity of NiTi and CrFe
alloy specimens.
elastic range. The T z dependence is unusual. Goffrelated these observations to the Fermi energy,
effective mass, and relative valences of the solutes.
Dautovich and Purdy related some of the electrical
resistivity data to the X-ray-diffraction patterns, as
shown in figure 26 (ref. 18). The material used was
50 atomic percent Ni prepared by arc melting byBuehler and co-workers at the U.S. Naval Ordnance
Laboratory. The ingots were hot rolled in air (maxi-
0.70
0.65
C2j 0.6O
Cl
-_ 0.55r'r
0.50
0.45
N
j-60 -40 -20 0
o Cooling
• Heating
I I I20 40 60
Temperature, °C
I I80 I00 IzO
HGURE 26.-Electrical resistance as a function of tempera-
ture for NiTi (50 atomic % Ni), X-ray-diffraction patterns
superimposed.
mum temperature 700 ° C) and electropolished to
remove scale and the oxygen-diffusion zone. Wire
0.020 in. in diameter was used for the resistivity
measurements, and (after electropolishing to a
0.005-in. diameter) for the X-ray powder diffraction
studies. On cooling from 125 ° C, the resistance begins
to rise to 50 ° C, a change that is accompanied by a
change in crystal structure (fig. 26). These results
were interpreted as indicating the existence of a
premartensitic-transition structure, as discussed in the
section, "Crystal Structure."
Cross, et al. found that the shape of the resistivity
vs temperature curve for drawn wire depended
strongly on the heat-treatment temperature used for
giving the wire a straight memory (ref. 63). The
resistivity-temperature curves also varied with the
chemical composition of the alloy, form (wire or
strip), and dimension (diameter or thickness). Threedifferent materials were investigated, the composi-
tions and other characteristics of which are given intable 3. Some of the results obtained are shown in
figures 27 through 31. The electrical-resistivity be-havior is correlated with the bend-recovery behavior
of wire memory, heat treated at various temperatures.
The bend recovery of wire was found to have been
most complete after the 500 ° C anneal.
This same annealing temperature caused the greatest
area enclosed by the resistance vs temperature curve
as it was cycled from about -46 ° to + 121 ° C. The
correlation of bend recovery with the area enclosed
within the resistivity-profile loop applied to all formsand sizes tested.
c4
w,,, b,n_ ,,c*,,,_ u {
b
:46 48 ro _B 66 93 ,2l ,49 ,rT .I
Tlmperoture, "C
l_e_ y mlOt I, nOtO4 ol 752 o F (4OO °C )
/r,,,,t, ,,,d...g-f,,I,,,";_,,,, n, ,,I,,, ,I ....
• .J Taw_p_(OI_, *C
Merely h_o_ t,eot.a ol 932°F(5C_'6)
T.m_p_ r _tu_, eC T_m_r olu_, _C
Merely _ol treole_o11112"F (600_C) M_mory h_ol treoled o11292"F(700_C)
FIGURE 27.-Effect of memory heat-treatment temperature
on electrical resistance and bend-recovery behavior.
469-815 0 - 72 - 5

28 THE ALLOY WITH A MEMORY
_4ArERIAL _rm_O_93S C%O__OGS
COMPOSITION _ A....... -'_ .--,---_.S
HEAT NO NOL IOI5
CROSS SECTION SIZE _O.30S in. dia.b TESTL_NGTH_'°_ _--_ -_-
STARTING RESTS TANCE O 0921_ o_hms
C" _ STARTING TEMP B_AoF _29"C)REMA,,S ............. L_-__-O .................
= .... I,,,d<_ -73-46 -18 IO 38 66 93 121 149 177
Tsmperoture, °CComposition A
_%:_,s__; %.............
_ F'N'L A"NEA_-;2" ..... ......
SAMPLE No_B-4 ......
o crossSECT,O_ i_-._--. ---- TEST LENGTH 25 in.
STARTING RESISTANCE 0.02S8 oh_s --
STARTING TEMP SZ"_
REMARKS
= .= .... I.... I .... I .... I .... I .... I .... I .... I,,id
<;] -73 -46 -18 I0 38 66 93 121 149 177
Temperature, °C
.o_ Composition B
MATERIAL TIN;
COMPOSITION
HEAT NO. _0-4006PROCESSING Hot SwogedolS50oC
FINAL ANNEAL Npne
SAMPLE NO. _-2
0 CROSS SECTION SIZE 0.204 in, rio.
TEST LENGTH Z in.
STARTING RESISTANCESTARTING TEMP.
¢_ REMARKS --
= -
'_ '_,,I .... I.... I.... I .... I .... I .... I .... I,,,fl<:_ -73 -46 -18 I0 38 66 93 121 149 177
Temperoture, oCComposition C
FIGURE 28.-Effect of temperature on the electrical resis-
tance of swaged rods.
The resistance change with temperature for hot-
swaged rod of the three compositions is shown in
figure 28. The curves for memory-heat-treated ma-
terial in various forms and sizes are given in figures 29to 31.
THERMOELECTRIC POWER
The thermoelectric power of NiTi (50.6 atomic
percent Ti and 50.0 atomic percent Ti) was reported
by Wasilewski, Hanlon and Butler (ref. 21), and by
Hanlon, Butler, and Wasilewski (ref. 59), respectively.The change in thermoelectric power with temperature
is shown in figures 32 and 33. In addition, the waythermoelectric power (at room temperature) varies
with the titanium content of the alloy and with the
heat treatment is shown in figure 33. The variation of
thermoelectric power with composition reflects pri-
marily a change in crystal structure. Although the
magnitude of the thermoelectric power varies with
heat treatment, it is always less in the B2 structure.
Metallographic and electron-microprobe studies
showed that a nickel-rich phase precipitated during
the time the sample was held at 600 ° C, thus
decreasing the nickel content of the matrix. When the
sample was stored (at room temperature) for about a
year, an increase in the thermoelectric power re-
suited, but no microstructural changes were observed
as a result of aging which correlate with the change inthermoelectric power.
For a specimen with 50.0 atomic percent Ti,
annealed at 900 ° C for 1 hr and water quenched,
Hanlon et al. reported the following values of thermo-
TABLE 3.-Materials Used in Goodyear Aerospace Corporation Nitmol Study for NASA (Refs.'S " "
63 and 70J.
M temperature, °cb
Swaged 3-mil 6-mil
Chemical composition Heat No. a rod foil foil
A - TiNio.935, C _"°0.065 NOL-1015 -51 --65 --62
B - C 0.07, Ni 55.0,
Ti balance d D-4028
C - C 0.06, Ni 54.6, S 0.006,
Ti balance d D-4006
aAll heats were induction melted in a graphite crucible.
18 24 24
41 41 41
bDetermined from electrical resistance vs temperature measurements made on "as-received"
material in the case of the swaged rod and on final annealed material in the case of foil. The M stemperature is defined in the typical curve shown in figure 19.
CCharge composition as reported by the U.S. NavaJ Ordnance Laboratory.dChemicai analysis.

PHYSICAL PROPERTIES 29
........TN,oss0Coo....COMPOSITION __A
Q._ HEAT NO. NOL t015PROCESSING _ to 0.125 in. dio.
._ Cold Drown ot - 4 to -ZZeF (-20 to -30"C)FINAL ANNEAL _;trqnd onneoled.GO0°C
C_ SAMPLE No.CROSS SECTION SIZE _.0.098 in. d;o.
b _ .................STARTING RESISTANCE 00184 Ohms
STARTING TEMP 89°F_-3_._REMARKS Cooled to-ISO °F (-tOPC)
0
<_ -73 -46 -18 I0 38 66 93 121 149 177Temperoture, °C
lO0-Mil DIo Rod
CI
b
=It-
L MATE RIAL TiNio.935 Coo 065
L COMPOSITION AHEAT NO _OL I015
PROCESSING HOI Rolled o_ 700°C to
" 0 040 _n. Worm Rolled IoO OOG;n.
_ fINAL ANNEAL _5mln, A.C.
SAMPLE NO A-500C
CROSS SECTION SIZE 0.25X0.006 tn_
TEST LENGTH I_dm_.
STARTING RESISTANCE _0_716 ohms
STARTING TEMP 9_F_%J_
REMARKS _
iii .... I .... I I .... I .... I .... I .... I .... I
<:_ -73 -46 -18 I0 38 66 93 121 149 177Temperoture, °C6-MII Thick Foil
MAT E R I AL TIN_0.935 C°0.065
COMPOSITION A
HEAT NO. N OLIOIS
PROCESSING Hot Rolled o1750°C to --
0 0501n.Wor mRolled 1o0 O031n.
FtNAL ANNEAL 600°C, Smin., A'C'
SAMPLE No. A-600C
CROSS SECTqON SIZE 0.123 X 0.005 in.
b TEST LENGTH 175STARTING REStSTANCE O.IBG ohms
STARTING TEMP _9°C_--
REMARKS Cooledt°*154eF (-103°C)
iIz:
<_ -73 -46 -18 I0 38 66 93 12| 149 177
Temperolure, °C
3-MII Thick Foil
FIGURE 29.-Effect of temperature on the electrical resis-
tance of composition-A materials.
electric power for the high-temperature CsCI(B2)
structure and the low-temperature structure, both at
about 70 ° C (ref. 59). To obtain these values, the
temperature dependent properties were extrapolatedto the transition midpoint, "7'0 ° C.
CsCI(B2) Low temperature structure
at ~70 ° C at _70 ° C
Thermoelectric powerpV/° C +6 +t0
Goff investigated the influence of copper additionsto NiTi on the thermoelectric power from -270 ° to
+27 ° C (ref. 75). His results are plotted in figure 34 inwhich the absolute thermoelectric power based on
measurements of NiTi against copper, copper against
lead, and the absolute thermoelectric power of lead
are shown. Goff indicated that the values for
TiNi-2Cu are probably too large because of some
calibration trouble during the measurements.
HALL COEFFICIENT
Hanlon et al. measured the Hall coefficient and ac
resistivity of NiTi at 20 Hz (ref. 59). The temperature
dependence for stoichiometric NiTi is shown in figure35. Above 75 ° C, the structure of this sample was
essentially B2, and below 0 ° C, it was completely in
the low-temperature phase. The Hall coefficient was
positive (p-type) in both crystallographic modifica-
tions, but increased by a factor of about 3.5 in going
from the high-temperature state to the low one. Also
shown in figure 35 is the Hall coefficient (at room
temperature) for a 49 atomic percent titanium NiTi
alloy. This sample is in the B2 structure at room
temperature; its Hall coefficient is about 20 percent
greater than that of the stoichiometric composition inthe B2 structure. For stoichiometric NiTi, Hanlon et
al. found the Hall coefficients to be +0.5X10 --4
cmS/coulomb for the B2 structure and +1.8)<10 -4
for the low temperature structure (ref. 59). This
number is based on extrapolation of temperature-
dependent properties to about 70 ° C (the transition
midpoint) for a sample annealed at 900 ° C for 1 hr
and water quenched.
Wang et al. used a rectangular specimen
0.1)<3.5)<14.8 mm for Hall effect measurements
using standard dc techniques (refs. 44 and 77). In
figure 36 (top) the Hall coefficient (R H) is given as
1.8× 10"4 cmS/coulomb below theM s' and 0.4× 10 --4
cmS/coulomb above the A s temperature both com-
plete and incomplete cycles. (See section on "Elec-
trical Resistivity" for a description of incomplete and
complete cycles.
The Hall mobility, /_H, was calculated from themeasured electrical resistivity, p, and the Hall co-
efficient, /2 = RH/P, and is given in figure 36
(bottom). Because there is a difference in the
resistivity peak between the complete cycles and
incomplete cycles, there is also a difference in Hall
mobility; however, the difference is hardly signifi-
cant. Wang concluded from this that the overall
Hall-mobility change is due primarily to a change in
the effective number of carriers N h rather than from
changes in the effective mass of electrons and holes,
m*, or in T, the mean relaxation time.

30 THEALLOYWITHA MEMORY
HEAr No, 0-402G _ MATERIAl TiNiCOMPOSITION
PROCESSING Co_d Orawn tO% Area ._ HEAT NO. O_402_ReduclionBe_ween7OOOCAnneol: PROCESSING CotdDrow_.. 20% Area
FINAL ANNEAL StrondAnnealedtSO0°C _ FeduclionBetweenTOO°CAnneols
C_ SAMPLE No. B-7 "_. FINAL ANNEAL _500oC
CROSS SECTI_
CROSS SECT IO_SIZ E
STARTING RES_
. STARTING TEMP _o_ % TEST LENGTH 2.75 in._ STARTING RES_
REMARKS "---
._o
'_ ,I ,1.... I .... I .... I .... I .... I .... I _:<_ -73 -/46 -18 I0 :58 66 93 121 149 177 <_ -73 -46 -18 10 38 66 93 ill ill II 11
Temperature, °C 12f 149 177
Temperoture_ °C
IO0-Mil Dia Rod
IO-Mil Die Wire
"_ MATERIAL T iN__ MATERIAL TiNi
"O COMPOSITIO N B COMPOSlTfO N 6
............................ O ;REocENs, "0040 in Worm Roiled toO.O07 in. "E Reduction Between 700% Anneals
FINAL ANNEAL 5OOOCt 5min.i A.C. _ _ FINAL ANNEAL
C] SAMPLE NO. B-SOOt
I¢) CROSS SECTION SIZE O,2SXO.OOSin. C_ SAMPLE No 6-9
CROSS SECTION SIZE
_) _ TEST LENGTH Sin. _1 TEST LENGTH __
-- STARTING RESISTANCE _ O STARTING RESISTANCE LI69 ohm_
STARTING TEMP 97°F{56°C) _ STARTING TEMP_
REMARKS Final reduction Io0.006 in. _ REMARKS _0 occomphshed by cold rollln 9
== ,_....I....I ....I.... I.... I.... [.... I,,,,l E i,,,_...._ ,,I,,,,J.... j.... i.... I.... I,,,,l,_ -73 -46 -18 l0 38 66 93 121 149 177 II
Temperature, eC <j -73 -46 -18 I0 58 66 93 121 149 IT/'
Temperature, *C
MATERIAL T_Ni _ MATERIAL TiNi
COMPOSITION B COMPOSITION B
HEAT NO . O-_-028 HEAT NO. D-4028
0030 in. Worm Rolled Io O OOS in ReductionB_t wean 700oC_ nneols
FINAL ANNEAL 6OO°C.Smin , A C. _ FINA L ANNEAL SOO°C Stain A.C.
SAMPLE NO..B-5OOC SAMPLE NO B-2
rl TEST LENGTH 1.75 ohms TEST LENGTH 1-13/f6 in_
STARTING RESISTANCE 0.2E9 ohms STARTfNG RESISTANCE 0210 ohm_
_-- / _ STARTING TEMP _3 °F (_'6°C} STARTING TEMP
byr:;d 'r71, _)§ in
" ,I,,¢;I,,,,I .... I .... I .... I .... I .... I .... I "_r_'- " r3 /M',,,,t .... I .... I .... I,, ,I .... I,,liJ
o jo o. ,,,. ;7. ,, ,,,Temperoture, °C m ro
3"Mil Thick Foil 2O-Mil Dio Wire
FIGURE 30.-Effect of temperature on the electrical resistance of composition-B materials.
Allgaier compared Hall coefficient data for TiFe, work: 49.9, 50.3, and 50.8 atomic percent Ni,TiCo, and NiTi and rationalized the differences in hereinafter referred to as NiTi 49.9, NiTi 50.3, and
terms of band theory (ref. 78). The results plotted as NiTi 50.8, respectively. Longitudinal sound velocities
a function of the number of valence electrons per were measured over a temperature range of -50 ° to
atom (Nve) are shown in figure 37. For NiTi at +140 ° C, and over a pressure range of atmospheric toNve=7, the transport characteristics resemble those of 40 000 psi. The sound velocity was measured at a
the traditional two-band model of a transition metal: frequency of 5 ME{z, using a pulse technique. The test(1) a broad s-band that carries the current and (2) a specimens, in the form of rods 0.5 in. in diam and 2.5
narrow, low-mobility d-band that provides a high in. long were arc cast, hot swaged, and machined to
; density of scattering sites, size. Then the material was annealed at 400 ° C for 2
hr in an inert atmosphere, and furnace cooled. To
VELOCITY OF SOUND stabilize the specimens, they were cycled over the
temperature range -30 ° to 200 ° C until the soundBradley investigated the velocity of sound in velocity data over the range -10 ° to +140 ° C was
Nitinol as influenced by several variables (ref. 79). repeatable.
Three compositions were used for the experimental The sound velocity of NiTi 49.9 in the stabilized

PHYSICALPROPERTIES 31
._ MATERIAL TiNiCOMPOSITION C
HEAT NO. 0-4006
"_E PROCESSING Cold OrownlIO% AceoReduction Belween 700=C Anneals
"_ l: 'l|| F,NAL "NNEAL S',ood ....... d,_°C
I?0 CROSS SECTION SIZE 0096 in. dio.TEST LENGTH 4,5 i_t.
STARTING RESISTANCE 0.0223 ohms
STARTING TEMP. 79 "F (260C)REMARKS
oe_
<3-_:5-,/-,e ,o 58 6e_:5 12, ,,9 ,77Temperoture,
IOO-Mil Dio Rod
8L MATERIAL riNi
COMPOSITION CHEAT NO 0-4006
PROCESSING Hot Roiled at 700°C to
0040 in Warm Rolled to 0007 in.
FINAL ANNEAL BOO'C, Smin. tA.C:
SAMPLE NO C-500C
CROSS SECTION SIZE 0 25X0.006 in.
TEST LENGTH - Sin.
STARTING RESISTANCE 0 07It ohms
" STARTING TEMP GSOF (29°C)
REMARKS Finalreduclion IoO.OOGin.
accomplished by cold rotli_ 9
= ._,,,I....I....I,,,,I....I....I,,,,I,,,I....I<:_ -7:5 -46 -18 I0 38 66 9:5 121 149 177
Temperature, °C
6-Mil Thick Foil
0
t_
b
<3
COMPOSITION _C
HEAT NO _O-400B
PROCESSING HQf Roiled at 7BOoC 10
O.030in. Worm Rolled Io 0,003 i_
FINAL ANNEAL 400°C,S rain , A.C.
SAMPLE No
CROSS SECTION SIZE 0,128 xo.oOSin.
TEST LENGTH 175
STARTING RESISTANCE 0 225 ohms
STARTING TEMP 80°F (S_ =C)
i REMARK S F Inal te(iuc_ion ToO.OOSin
.I,,,ZF,,,_ ,I ,,I,,,,I .... I .... I .... I .... I
IG I0 58 66 95 121 149 177Temperature, °C
3-Mil Thick Foil
MATERIAL TiNiCOMPOSITION C
HEAT NO. 0+4006
"_E PROCESSING Cold Drawn,20% AreaReductlo_ Between 700°C Anneals
C_ SAMPLE NO. C-14 --
CROSS SECTION SIZE O.Ollin. dio.
I_l0 TEST LENGTH _ 75 in
i STARTING TEMP 90°F (SZ=C) --
I REMARKS
e_ __,llllllllllllll .... Jllll[ .... 1
<3 -7:5 -46 -18 I0 58 66 9:3 121 149 177
Tempereture_ °C
I0- Mil Dio Wire
COMPOSITION _C
_ HEAT NO. D-4006
0
PROCESSING Cold Drown I SO% Area._ Reduction Between 7OO°C Anneals
FINAL ANNEAL SlcandAnneoledl sO0°C
C_ SAMPLE NO C-lll
CROSS SECTION SLZE 00$45 in. dim
TEST LENGTH S. BB in. .-- STARTING RESISTANCE 1.126 ohms
. STARTING TEMP B9°F (32°C)
_¢_ REMARKS
0
= ,J, ,I.... I .... I,,,J,,,,I .... I .... I .... 1<3 -75 -46 -18 IO 38 66 93 121 149 177
Tempereture, °C
15-Mil Dio Wire
i MATERIAL TiN i
COMPOSITION C
HEAT NO. D-400_6. 6
PROCESSING C°ld Dr°wn120°/° AreaReOuction Between 700 °C Anneals
J i FINAL ANNEAL SIrand Anne01_ C
S_MPLE NO C-IO
CROSS SECTION SlZE O.020in. dlq
_) TEST LENGTH I- 13/i6 in.STARTING RESISTANCE 0 220 ohms
STARTING TEMP 78°FI _6=C1 -
p,,j....... I....I
<3 -73 -46_18 I0 38 66 93, 121 149 177
j' Tempe roture, *C20-Mil Dio Wire
FIGURE 31.-Effect of temperature on the electrical resistance of composition-C materials.
condition is shown in figure 38 for one complete
warming and cooling cycle. As the nickel content was
increased, the temperature at which the sound-
velocity minimum occurred was shifted to lower
temperatures. The effect for the cooling half of the
temperature cycle is shown in figure 39, but the samebehavior was seen in the warming half. It was also
observed that the minimum point shifts to higher
temperature if the minimum exposure temperature is
lowered. For example, the NiTi 50.8 sample showed a
velocity minimum point of 56 ° C when the lowest
exposure temperature was +10 ° C before proceeding
with the warming cycle. When the lowest exposure
temperature was -50 ° C, however, the velocity
minimum point had been raised to +63 ° C.
The effect of annealing and stabilizing treatments
on the sound velocity vs temperature is shown in
figure 40 for the NiTi 49.9 alloy. The effect of
pressure on the cooling half of the cycle is illustrated
in figure 41. The change due to pressure is actuallyless than shown because no correction was made for
dimensional changes in the specimen resulting from
the compression, which would in itself cause a 10
m/sec increase.
Wang showed that the velocity vs temperature
behavior changes, depending on whether the speci-
men undergoes complete or incomplete cycles (refs.
44 and 77). (See section on "Electrical Resistivity"
for a description of incomplete and complete cycles.)
The data shown in figure 42 (ref. 44) are for a

32 THEALLOYWITHA MEMORY
12--
c.)o lO--
_k
o_Q.o 8--
E
I-
//
/
//
//
//
//
/ p !
(d)
I I I I- 100 0 100 200
Temperoture ,°C
FIGURE 32.-Effect of temperature on the thermoelectric
power of NiTi (50.6 atomic % Ti).
,d
t..)
g$ocko
T_ lOI
E
.E
.Q
• TiNi-O
_ • TiNi-2Cu
i TiNi-8 Cu
x TiNi-18Ni
,o' I I I I Iio 50 100 500 I000
(-263°c) (-223%) (-17_'c) (z27°c) (7270c)
Temperature, °K
FIGURE 34.-The absolute thermoelectric power of selected
NiTi-base alloys. (Q is positive.)
50 at.% Ti
• 900 °C, I hr
z_ 650 °C, 2 wk
o 650 °C, 2wk, R.T., ~ I yr
I I I ,_ I I I Io 50 ioo 150
Temperature,°C
20O
FIGURE 33.-(a) Thermoelectric power of NiTi alloys,
measured at room temperature, as a function of chemical
composition. (b) Effect of temperature on the thermo-
electric power of NiTi (50 atomic % Ti).
x
o#o
o-r
2.0
1,5 -
1.0
0.5--
49 at % Ti "50 at % Ti
U I I I20 40 60 80
TemperQture, °C
o Io too
FIGURE 35.-Effect of temperature on the Hall coefficient
of stoichiometric NiTi; Hall coefficient, at room tempera-
ture, of NiTi containing 49 atomic % Ti.

PHYSICAL PROPERTIES 33
x
"1-
==E_o
-5E 8
I to
I I 1 I20 40 60 80-20 0 20 40 60 80
Temperoture, °C
FIGURE 36.-The effect of temperature on the Hall coeffi-
cient and Hall mobility of stoichiometric NiTi containing
51 atomic % Ni. (The curves on the left are for a sample
that had undergone complete cycles, while those on the
right are for a sample that had undergone incomplete
cycles.)
0
295°K (22°C)
(-196°C) ._'._
.2°K (-268°C)
I6.0 6.5 7.0
(TiFe) (TiCo) (TiNi)
Number of volence electrons (Nve)
FIGURE 37.-The effect of the number of valence electrons,
Nve on Hall coefficient.
550O
t.)
t/)
03
>q
O
"(3
CO
5450
54O0
5350
5300
5250
5200
5150
5100
5050
5000
X'-xX_ x Warming .- ._
/
I I I I I I I I I-40 -20 0 20 40 60 80 I00 120
Temperolure,°C
FIGURE 38.-The effect of temperature on the velocity of
sound in NiTi containing 49.9 atomic % Ni. (The material
was "stabilized"by temperature cycling between -30 ° and
+200 ° C until repeatable results were obtained. The
frequency of the sound was 5 MHz.)

34 THE ALLOY WITH A MEMORY
t.0
tD
E
O
>_
c
O
550O
5450
5400
5350
5500
5250
5200
5150
5100
5050
5000
B
.,I I- 40 - 20
x-50.8 at. % Nio-50.5 at. % Niz_-49.9 at. % Ni
X
\
IX
I I I I I I0 20 40 60 80 I00 120
Tempera|ure, °C
FIGURE 39.-The effect of chemical composition on the
velocity of sound in NiTi. (Chemical compositions of
specimens: x 50.8 atomic % Ni; o 50.3 atomic % Ni;
zx49.9 atomic % Ni.) The measurements were made on the
cooling half of the temperature cycle. The frequency ofthe sound was 5MHz.
E
O
OU3
5500
5450
54OO
5350
53OO
5250
52OO
5150
5100
5050
5OOO I I40 -20
I I I I I I I0 20 40 60 80 I00 120
Temper(sture, °C
FIGURE 40.-The effect of heat treatment and stabilization
on the velocity of sound in NiTi containing 49.9 atomic %
Ni. (Specimen identification: x as-hot-swagged arc-cast
material; • material was "stabilized" by temperature
cycling between -300 and +2000 C until repeatable
results were; - material was heat treated at 4000 C for 2 hr
in an inert atmosphere and furnace cooled; _ material was
heat treated at 3000 C (time, atmosphere, and cooling
rate were not given.) All tests were carried out on the
heating half of the temperature cycle. The frequency of
the sound was 5 MHz.)

PHYSICAL PROPERTIES 35
5500
t9
E
O
-oc
U3
545O
54OO
5550
5500
5250
52OO
5150
5100
5050
5OOO I I I I I I I [ I-40 -20 0 20 40 60 80 I00 120
Temperoture, °C
FIGURE 41.-The effect of pressure on the velocity of sound
in NiTi containing 49.9 atomic % Ni. (Measurements were
made on the cooling half of the temperature cycle at
pressures of 14.7 psi (x data points) and 40 000 psi (e
data points). In both cases, the frequency of the sound
was 5 MHz.)
composition about 51 atomic percent Ni and a
"transition temperature" (A s) near 60 ° C. Since themethods and procedures were the same as in Brad-
ley's paper and, in fact, the experiments were carried
out by Bradley, the results are comparable to the
9.30
O_ 9.26
:_ -_ 9.22
_ _ 9.,_9.14
gO3
9.tO-20
!. iiI I I I0 20 40 60 80 -20 0 20 40 60 80
Temperoture, °C
FIGURE 42.-The effect of temperature on the sound
velocity in NiTi containing 51 atomic % Ni. (The curves
on the left are for a sample that had undergone complete
cycles, while those on the right are for a sample that had
undergone incomplete cycles. The frequency of the sound
was 5 MHz.)
earlier work (ref. 79). Particularly in the cooling half
of the cycle, a great difference was noted between the
complete and incomplete cycles.
DAMPING, INTERNAL FRICTION, DYNAMIC
MODULUS, AND POISSON's RATIO
Buehler and Wiley first noticed the unique
mechanical-vibration-damping property of Nitinol by
striking a bar* of the material at room and elevated
temperatures (refs. 11 and 12). At room temperature,a dead sound was produced by the blow, whereas at
about 57 ° C the bar exhibited a metallic ring, which
became more brilliant about 77 ° C. It was also
observed that the phenomenon was dependent on
composition. They investigated alloy compositionsfrom 52.5 to 58 weight percent Ni, and found that
arc-melted bars containing more or less nickel than
54.5 weight percent were unable to produce the
high-damping-to-low-damping transition over such a
narrow temperature range and at temperatures so
close to room temperature. The results obtained are
shown in figure 43 (ref. 12).
6O0,a Dull noise(no tone)
® Slight ring (detectoble tone)
5oo o Cleor ringe Sharp high frequency ringe Transition from "Sharp" to "Clear" ring
4OO?
- 0 0 ._ e e e e/
_500
E_.2oc o o ,_ ee e e
#. - ,_/
Ioc- o o ,,/e e e e e
/////////Is1_lIfX..&._, .... _. i////
o ";
l/llll//I//llllll////I//////i I
i I i _ "* " ®L "l® _ I , I t _ ,-I°°z 5s 54 55 56 s7 58 6_
Alloy Composition, w/o Ni
FIGURE 43.-The effect of temperature on the sound
produced by striking suspended arc-cast bars (approxi-
mately 9/16 in. in diam by 4 in. long) of NiTi alloys.
(Note sudden sound transition with temperature for
alloys containing about 54.5 weight % Ni.)
*Arc melted, containing about 54.5 weight percent Ni and
0.09 weight percent Fe.
469-815 0 - 72 - 6

36 THE ALLOY WITH A MEMORY
Some of the same alloys-54, 54.5, and 55.1
weight percent Ni-were hot swaged at 900 ° C intouniform smaller diameter bars. When these were
struck, the transition-temperature range from high- to
low-damping was found to have widened, perhaps
because of additional secondary phase(s) seen in the
matrix of these worked bars (fig. 44) (ref. 12).
The purity of the titanium melting stock was
important in determining the transition temperature.
Thus, for 54.5 weight percent Ni, if the iron content
was around 0.09 percent, the high-damping-to-low-
damping transition was maintained around room
temperature, as in figure 43. If higher-purity melts
were made (without iron) the same behavior was
shown by alloys containing 55.1 and 55.5 weight
percent Ni (ref. 11).
Some hysteresis was noted qualitatively by
Buehler and Wiley in arc-cast alloys with 54.7 and
54.8 weight percent Ni (ref. 12). They noted that the
brilliant ring at room temperature could be com-pletely eliminated by cooling to -15 ° C, but that
when the bar was reheated to 25 ° C the brilliance was
considerably lower than before. When the specimen
was heated to 45 ° C, the brilliant ring was restored
and persisted at room temperature. The time-
dependent nature of the phenomenon was demon-
strated by cooling a bar to -76 ° C and then warming
it to room temperature; 92 hr later the "equilibrium-sound" behavior had been restored.
Buehler and Wiley made quantitative measure-
ments of damping by the low-frequency (0.4 Hz)
torsion-_endulum method, using 0.0206-in. and5OO
"-Dull noise
® ®._ ®®-Slight ring¢
400 f, o- Cleor ring
_¢ e-Shorp high frequency® ® <,.,e ring0
o. 300 /%,
:3 /
_, 200 ® ® _oQ.
IO0 ® ® 5o
/ //////.1 _"
_. 6", ,0%
%
-,ooi , 5' " (' I I ,52 55 54 55 56 57 58 59
Alloy composition, w/o Ni
FIGURE 44.-The effect of temperature on the sound
produced by striking suspended hot-swaged (900 ° C) bars
(0.5 in. in diam by 5.5 in. long) of NiTi alloys.
2.3
_ 1.9I- R.T_"--._
1.7
"_ 1.5
d
1.3
I i I0 i0 20 50 40
Number of cycles
FIGURE 45.-The decay in torsional vibration as a function
of number of cycles and temperature for 0.0206-in.-diam
NiTi wire containing 55.1 weight % Ni. (Average fre-quency = 0.408 Hz.)
0.0360-in.-diameter drawn wire as the specimens (ref.
12). Results for the 55.1 weight percent Ni alloy
(with 0.09 percent Fe) are given in figure 45. This
alloy showed little temperature sensitivity. On the
other hand, the two wires of 54.5 weight percent Ni
(fig. 46) showed a pronounced decrease in internal
friction as the temperature was raised to 93 ° C. The
change in damping as a function of temperature is
shown in figure 47; it agrees with the acoustic data.
Time at temperature was also important, as shown in
figure 48. The damping transition seemed to require
about 1 to 5 rain to occur, and then stabilized after10 min.
2.3 \_ _ "& _ "" z_" "----4._ 200°F
_. 1.9- _'\N _ (95°C)
J L o---o .036-inch dia ._ '15/ _----_ .0206-inchdk_
/
u [ I I I "\_ ,o Io 20 5o 40
Number of cycles
FIGURE 46.-The decay in torsional vibration as a function
of number of cycles and temperature for NiTi containing
54.5 weight % Ni. (Average torsional frequency was 0.400
Hz for the 0.036-in.-diam wire and 0.440 Hz for the
0.0206-in.-diam wire.)
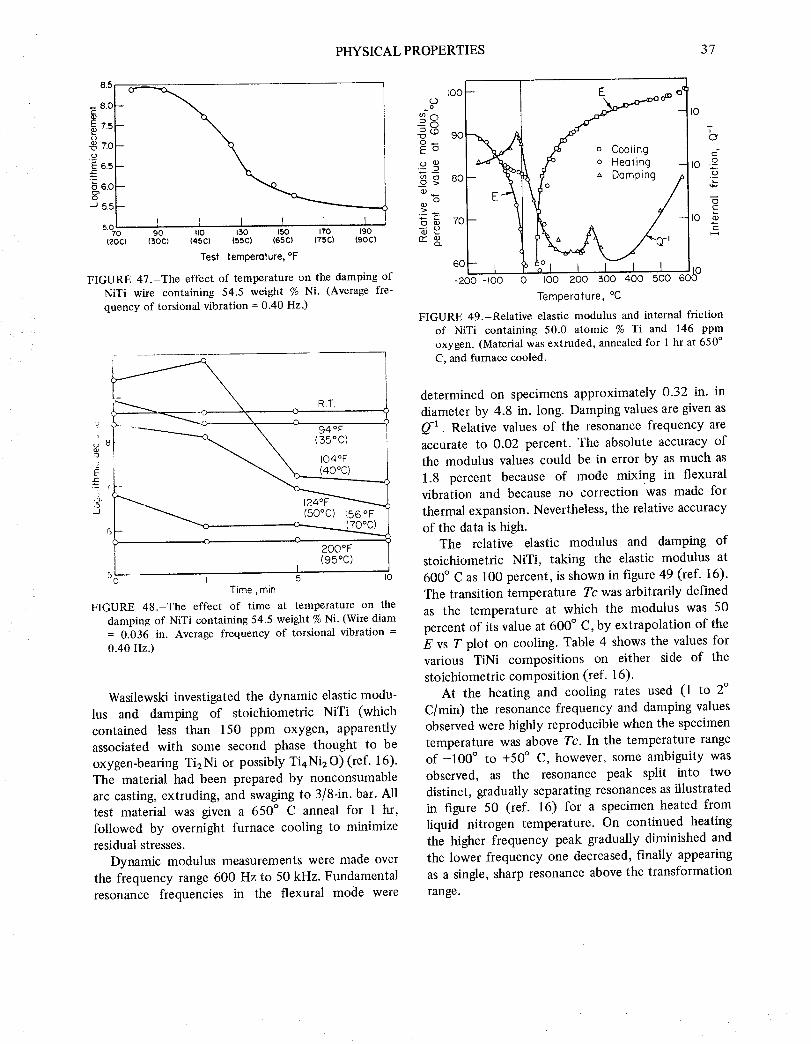
PHYSICAL PROPERTIES 37
8.5
8.0
-J 5.5
5.0I I I I I I
70 90 uo t30 150 170 190{20c) (30c) {45c) (55c) (65c} (75c) (90c)
Test tempercllure,°F
FIGURE 47.-The effect of temperature on the damping of
NiTi wire containing 54.5 weight % Ni. (Average fre-
quency of torsional vibration = 0.40 Hz.)
_\ 0 IR.T.
it.... !
O 0
200°F(95°C)
I 5 10
Time, min
FIGURE 48.-The effect of time at temperature on the
damping of NiTi containing 54.5 weight % Ni. (Wire diam
= 0.036 in. Average frequency of torsional vibration =
0.40 Hz.)
Wasilewsld investigated the dynamic elastic modu-
lus and damping of stoichiometric NiTi (which
contained less than 150 ppm oxygen, apparently
associated with some second phase thought to be
oxygen-bearing Ti2 Ni or possibly Ti4Ni2 O) (ref. 16).
The material had been prepared by nonconsumable
arc casting, extruding, and swaging to 3/8-in. bar. All
test material was given a 650 ° C anneal for 1 hr,
followed by overnight furnace cooling to minimizeresidual stresses.
Dynamic modulus measurements were made over
the frequency range 600 Hz to 50 kHz. Fundamental
resonance frequencies in the flexural mode were
.?
O_
Ea
0
".=E
a:g
ioo- E d_ed
y --I0
/ ocoo,, 0s_ /_ o Heating - I0 .=_c_:_:_"
80_ E_Q_o _ Domping/ _
i;! --'10 _
,o'ooTemperature, °C
FIGURE 49.-Relative elastic modulus and internal friction
of NiTi containing 50.0 atomic % Ti and 146 ppm
oxygen. (Material was extruded, annealed for 1 hr at 650 °
C, and furnace cooled.
determined on specimens approximately 0.32 in. in
diameter by 4.8 in. long. Damping values are given as
Q-1. Relative values of the resonance frequency are
accurate to 0.02 percent. The absolute accuracy of
the modulus values could be in error by as much as
1.8 percent because of mode mixing in flexuralvibration and because no correction was made for
thermal expansion. Nevertheless, the relative accuracy
of the data is high.The relative elastic modulus and damping of
stoichiometric NiTi, taking the elastic modulus at
600 ° C as 100 percent, is shown in figure 49 (ref. 16).
The transition temperature Tc was arbitrarily defined
as the temperature at which the modulus was 50
percent of its value at 600 ° C, by extrapolation of the
E vs T plot on cooling. Table 4 shows the values for
various TiNi compositions on either side of the
stoichiometric composition (ref. 16).
At the heating and cooling rates used (1 to 2°
C/min) the resonance frequency and damping values
observed were highly reproducible when the specimen
temperature was above Tc. In the temperature rangeof-100 ° to +50 ° C, however, some ambiguity was
observed, as the resonance peak split into two
distinct, gradually separating resonances as illustrated
in figure 50 (ref. 16) for a specimen heated from
liquid nitrogen temperature. On continued heating
the higher frequency peak gradually diminished and
the lower frequency one decreased, finally appearing
as a single, sharp resonance above the transformation
range.
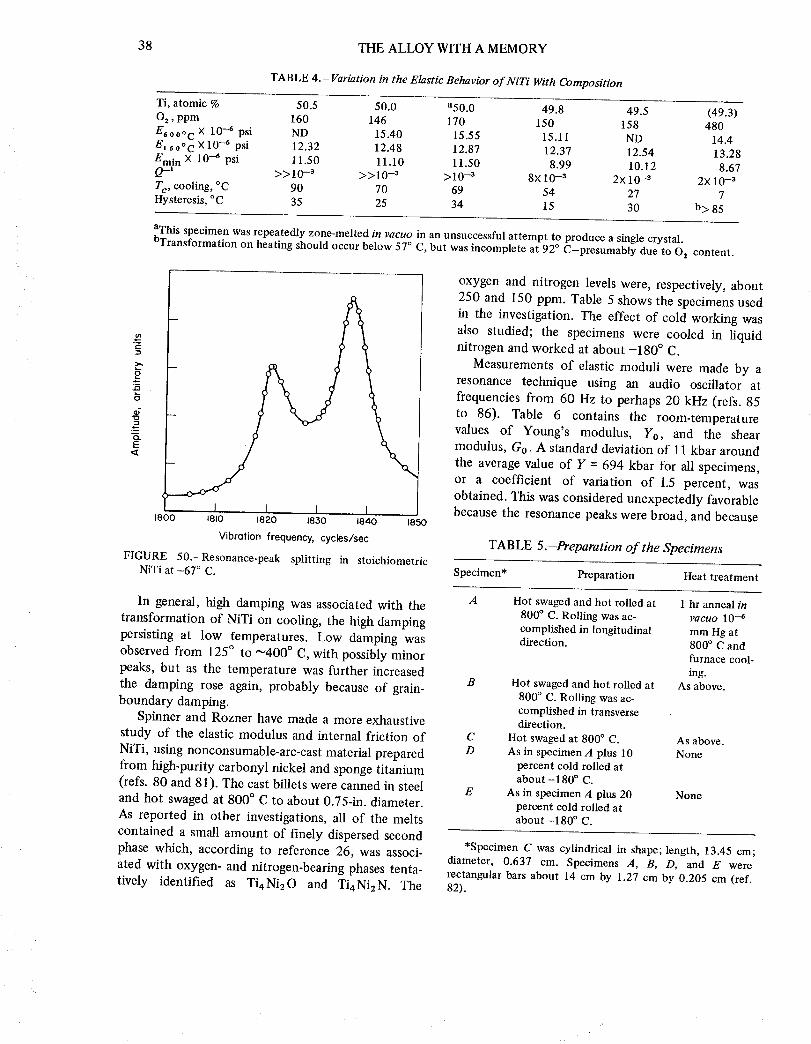
38 THE ALLOY WITH A MEMORY
TABLE 4.- Variation in the Elastic Behavior of NiTi With Composition
Ti, atomic % 50.5 50.0 a50.0 49.8 49.5 (49.3)02 , ppm 160 146 170 150 158 480
E6 o 0 oC × 10--6 psi ND 15.40 15.55 15.11 ND 14.4
El 5 o°C × 10-6 psi 12.32 12.48 12.87 12.37 12.54 13.28
Emi n × 10 -6 psi 11.50 11.10 11.50 8.99 10.12 8.67
Q-I >>10-3 >>10-a >10 -a 8× 10 -a 2x 10 -a 2× 10 -a
T c, cooling, °C 90 70 69 54 27 7
Hysteresis, oC 35 25 34 15 30 b> 85
aThis specimen was repeatedly zone-melted in vacuo in an unsuccessful attempt to produce a single crystal.
bTransformation on heating should occur below 57 ° C, but was incomplete at 92 ° C-presumably due to 02 content.
g==
g
o"
E
1800I I I I
1810 1820 1830 1840
Vibrotion frequency, cycles/sec
1850
FIGURE 50.-Resonance-peak splitting in stoichiometricNiTi at -67 ° C.
In general, high damping was associated with the
transformation of NiTi on cooling, the high damping
persisting at low femperatures. Low damping was
observed from 125 ° to "400 ° C, with possibly minor
peaks, but as the temperature was further increased
the damping rose again, probably because of grain-
boundary damping.
Spinner and Rozner have made a more exhaustive
study of the elastic modulus and internal friction of
NiTi, using nonconsumable-arc-cast material prepared
from high-purity carbonyl nickel and sponge titanium
(refs. 80 and 81). The cast billets were canned in steel
and hot swaged at 800 ° C to about 0.75-in. diameter.
As reported in other investigations, all of the melts
contained a small amount of finely dispersed second
phase which, according to reference 26, was associ-
ated with oxygen- and nitrogen-bearing phases tenta-
tively identified as Ti4 Ni20 and Ti 4 Ni2 N. The
oxygen and nitrogen levels were, respectively, about
250 and 150 ppm. Table 5 shows the specimens used
in the investigation. The effect of cold working was
also studied; the specimens were cooled in liquid
nitrogen and worked at about -180 ° C.
Measurements of elastic moduli were made by a
resonance technique using an audio oscillator at
frequencies from 60 Hz to perhaps 20 kHz (refs. 85
to 86). Table 6 contains the room-temperature
values of Young's modulus, Y0, and the shear
modulus, Go. A standard deviation of 11 kbar around
the average value of Y = 694 kbar for all specimens,
or a coefficient of variation of 1.5 percent, was
obtained. This was considered unexpectedly favorable
because the resonance peaks were broad, and because
TABLE 5.-Preparation of the Specimens
Specimen* Preparation Heat treatment
A Hot swaged and hot rolled at 1 hr anneal in
800 ° C. Rolling was ae- vacuo 10 -6
complished in longitudinal mm Hg atdirection. 800 ° C and
furnace cool-
ing.B Hot swaged and hot rolled at As above.
800 ° C. Rolling was ac-
complished in transverse
direction.
C Hot swaged at 800 ° C. As above.
D As in specimen A plus 10 None
percent cold rolled atabout -180 ° C.
As in specimen A plus 20percent cold rolled at
about -180 ° C.
E None
*Specimen C was cylindrical in shape; length, 13.45 cm;
diameter, 0.637 cm. Specimens A, B, D, and E were
rectangular bars about 14 cm by 1.27 cm by 0.205 cm (ref.82).
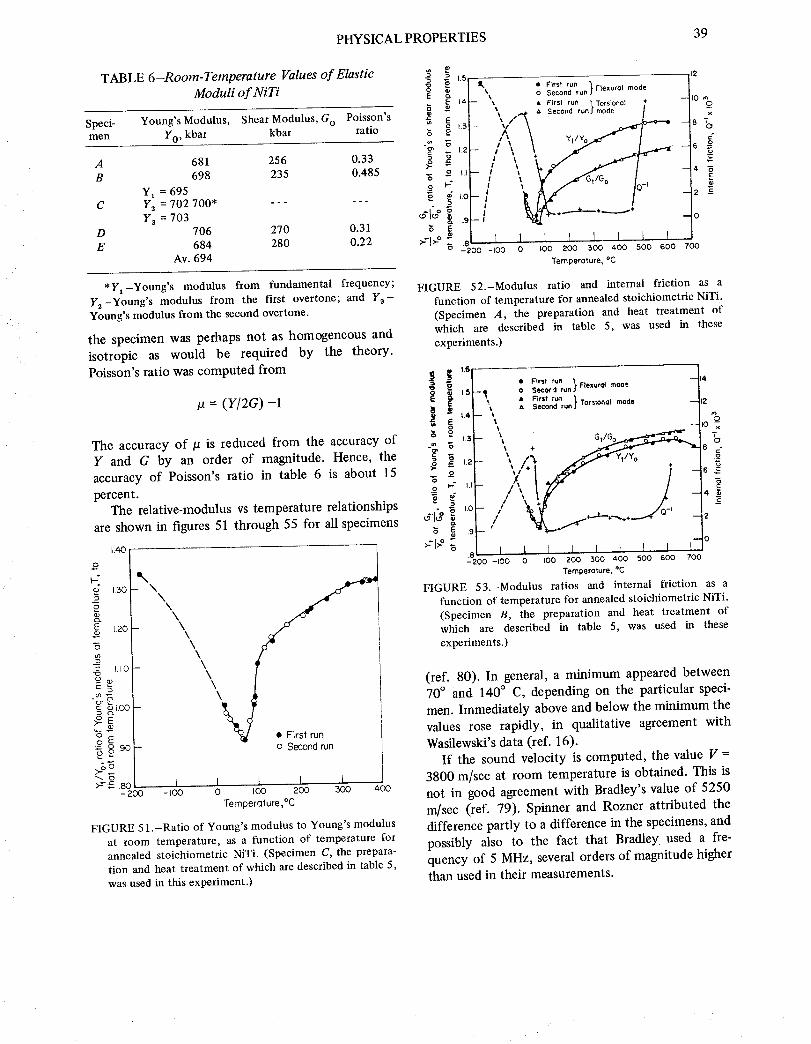
PHYSICAL PROPERTIES 39
TABLE 6-Room-Temperature Values of Elastic
Moduli of NiTi
Speci- Young's Modulus, Shear Modulus, G O Poisson's
men YO' kbar kbar ratio
A 681 256 0.33B 698 235 0.485
Y1 = 695C Y_ = 702 700* ......
Y3 = 703D 706 270 0.31E 684 280 0.22
Av. 694
E
== E°o
go
.o _:
g
12
t.5j t,. • First run _ Ftexuro] modei • o Second runJ
1.4['-- _t • First run "[Torsionol + -- I0
l ', /_ _ socood,on_mode/ %x
,.31- ',/\ _ - 8 vo
_ "_ ¥t/¥o
t:el I I [ I I ] I I
-"200 -I00 0 I00 200 500 400 .500 600 700
Temperature, °C
*Yt-Young's modulus from fundamental frequency;y2-Young's modulus from the first overtone; and Y3-Young's modulus from the second overtone.
the specimen was perhaps not as homogeneous and
isotropic as would be required by the theory.
Poisson's ratio was computed from
la = (Y/2G)-1
The accuracy of _ is reduced from the accuracy of
Y and G by an order of magnitude. Hence, the
accuracy of Poisson's ratio in table 6 is about 15
percent.The relative-modulus vs temperature relationships
are shown in figures 51 through 55 for all specimens
1.40
o
_ N
E L20- \
"6 \
c _100D (3.'
0
.o _o9.9o-
>--=-.8c I- _.oo -Ioo
\\\\
o Second run
I I I I0 I00 200 300 4_30
Temperature,°C
FIGURE 51.-Ratio of Young's modulus to Young's modulus
at room temperature, as a function of temperature for
annealed stoichiometric NiTi. (Specimen C, the prepara-
tion and heat treatment of which are described in table 5,
was used in this experiment.)
FIGURE 52.-Modulus ratio and internal friction as a
function of temperature for annealed stoichiometric NiTi.
(Specimen A, the preparation and heat treatment of
which are described in table 5, was used in these
experiments.)
=_ Eo
e- g
0 I--
g"o "_
' t,01_ : ,,,,,,on, "Secord run- _ Flexural moo =,
Second run._ Torsional mode I
1.4 _
_t
,._- \ %
1.2 _/: _" YI/Y° + -- 6_=
//c
1.0
i,9--
.a [ I I [ 1 ! I ] I-200 -IOO 0 I00 200 300 400 500 600 700
Temperature, °C
FIGURE 53.-Modulus ratios and internal friction as a
function of temperature for annealed stoichiometric NiTi.
(Specimen B, the preparation and heat treatment of
which are described in table 5, was used in these
experiments.)
(ref. 80). In general, a minimum appeared between70 ° and 140 ° C, depending on the particular speci-
men. Immediately above and below the minimum the
values rose rapidly, in qualitative agreement with
Wasilewski's data (ref. 16).
If the sound velocity is computed, the value V =
3800 m/sec at room temperature is obtained. This is
not in good agreement with Bradley's value of 5250
rn/sec (ref. 79). Spinner and Rozner attributed the
difference partly to a difference in the specimens, and
possibly also to the fact that Bradley used a fre-
quency of 5 MHz, several orders of magnitude higher
than used in their measurements.

40 THEALLOYWITHA MEMORY
1.50 30
s Y,/Yo .
S/_o 1.30
"5 _ 120 \\_ "ca. _ 1.10
?/ //_ "6 _.oo
O_ _
-- _ .90>-o_
>-_E _.80 i I ! + I l I I I 0-200-I00 0 I00 200 300 400 500 600 ZOO
Temperoture ,°C
FIGURE 54.-Modulus ratios and internal friction as a
function of temperature for cold-rolled stoichiometric
NiTi. (Specimen D, the preparation and cold rolling of
which are described in table 5, was used in these
experiments.)
1.50
-_ y,/yo_ '21.40 --I0
a2
_o _R 1.30 - 8
eo
-_,_o ,_ / / / 1o.5-4O I. I0 - \\\ .,_,,,,+.+\ /0
.o _ \_._r- k /
•" / ,/Go(_9--_ /
.90_ /
80 I I I I I I200 I00 0 I00 200 :300 400 500
Temperature,°C
FIGURE 55.-Modulus ratios and internal friction as a
function of temperature for cold-rolled stoichiometric
NiTi. (Specimen E, the preparation and cold rolling of
which are described in table 5, was used in theseexperiments.)
ro
X
24g
"6O E
o)
Y.
Note that the maximum of Q-1 occurs about 50 °
C lower than the minimum for the elastic moduli. No
explanation was offered, but apparently this is notunusual materials behavior.
Hasiguti and Iwasaki measured internal friction
with a torsion pendulum (ref. 82). The wire speci-
mens were prepared by Wang, and were 51 atomic
percent nickel and 49 atomic percent Ti (ref. 17).The titanium sponge used for alloying contained about
0.07 weight percent iron and 0.15 weight percent
(max.) of other impurities. The M s of the alloy was
o Heating
• Cooling
_×
E,
g
200 0 200 400 6010 [800
Temperature, oC
FIGURE 56.-Internal friction and period of vibration of
NiTi containing 51 atomic % Ni, as a function of
temperature (ref. 82). (The specimen was annealed at
800 ° C for 2 hr and furnace cooled prior to testing. Shear
modulus is inversely proportional to the square of the
period of vibration.)
about 40 ° C. Typical curves of internal friction and
period of vibration (times 4) over the range -170 ° to
+800 ° C are shown in figure 56. (The shear modulus
G is proportional to 1/T 2, where T is the period of
vibration.) Two well deffmed peaks occurred in the
internal friction curves, one at about -70 ° C and the
other at about +600 ° C. In addition, a small peak was
observed at 350 ° C and a group of several sharppeaks, or an irregular serration, was noticed in the
temperature range from the Ms temperature (+40 ° C)to about -50 ° C. These irregular serrations are
referred to as "fine structure" by the authors. Above
40 ° C, which is said to correspond to the M s
temperature, the internal friction drops abruptly; thisis said to reflect a structural change from NiTi III to
NiTi II on heating. Corresponding but less abruptchanges in the shear modulus were noted. The
positive-temperature coefficient of modulus in the40° to 520 ° C region is quite unusual.
The temperature intervals between measurements
by Hasiguti and Iwasaki were much smaller than in
the experiments reported by Wasilewski (ref. 16),
Bradley (ref. 79), or Spinner and Rozner (ref. 81).Accordingly, the fine structure reported here was not
resolved by the other investigators and was reportedby them as single peaks.
When the specimen was annealed for 2 hr at 600 °
C and furnace cooled, the peak previously seen at
-70 ° C disappeared, along with the fine structure.
This is illustrated in figure 57. Nevertheless, the -70 °
30]Z _t"
3. g
3.6 __
3.8 o
4o o_
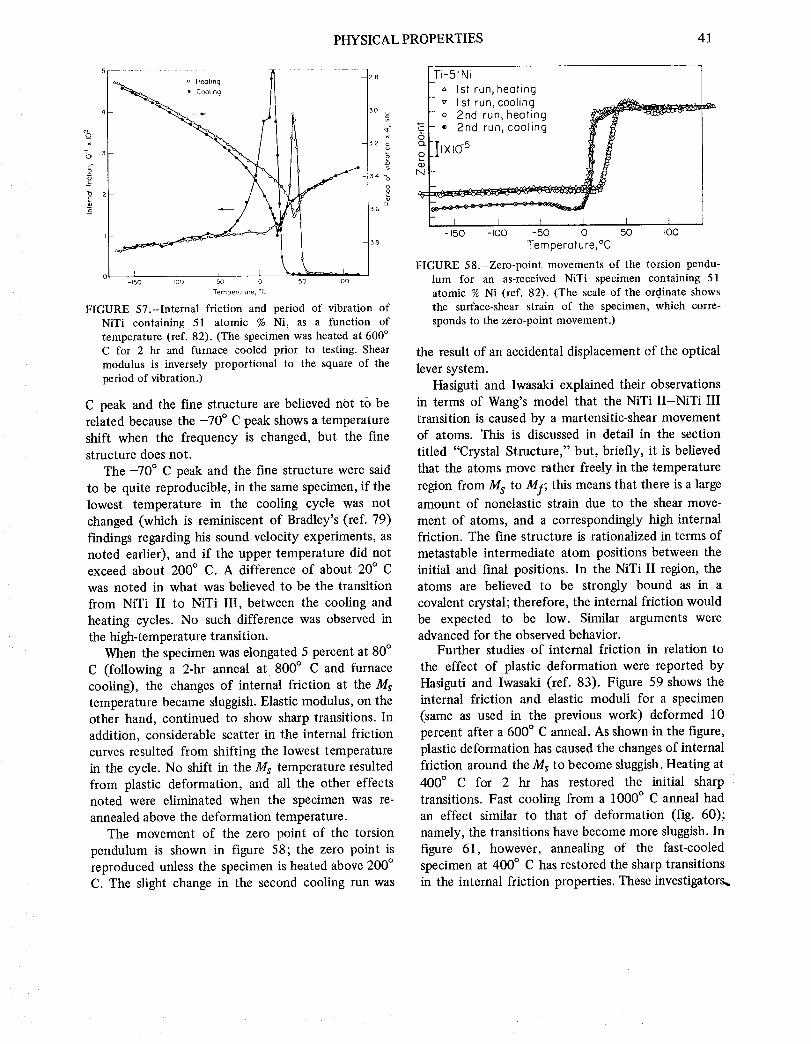
PHYSICAL PROPERTIES 41
E
o
150 IOO - 40 O 50 _OO
Temperature, °C
FIGURE 57.-Internal friction and period of vibration ofNiTi containing 51 atomic % Ni, as a function oftemperature (ref. 82). (The specimen was heated at 600 °C for 2 hr and furnace cooled prior to testing. Shearmodulus is inversely proportional to the square of theperiod of vibration.)
C peak and the fine structure are believed not to berelated because the -70 ° C peak shows a temperature
shift when the frequency is changed, but the fine
structure does not.
The -70 ° C peak and the fine structure were said
to be quite reproducible, in the same specimen, if the
lowest temperature in the cooling cycle was not
changed (which is reminiscent of Bradley's (ref. 79)
findings regarding his sound velocity experiments, as
noted earlier), and if the upper temperature did notexceed about 200 ° C. A difference of about 20 ° C
was noted in what was believed to be the transition
from NiTi II to NiTi III, between the cooling and
heating cycles. No such difference was observed in
the high-temperature transition.
When the specimen was elongated 5 percent at 80 °
C (following a 2-hr anneal at 800 ° C and furnace
cooling), the changes of internal friction at the Ms
temperature became sluggish. Elastic modulus, on theother hand, continued to show sharp transitions. In
addition, considerable scatter in the internal friction
curves resulted from shifting the lowest temperature
in the cycle. No shift in the Ms temperature resulted
from plastic deformation, and all the other effects
noted were eliminated when the specimen was re-
annealed above the deformation temperature.
The movement of the zero point of the torsion
pendulum is shown in figure 58; the zero point is
reproduced unless the specimen is heated above 200 °
C. The slight change in the second cooling run was
__8 Ti-51Ni
" '_ Ist run, heating" v Ist run, cooling _" o 2nd run, heating _ --_30 _ - • 2nd run, cooling
32g
"6 0
34 '_
g_36
I I I I i I- 150 -I00 -50 0 50 I00
3_ Temperature oc
FIGURE 58.-Zero-point movements of the torsion pendu-lum for an as-received NiTi specimen containing 51atomic % Ni (ref. 82). (The scale of the ord.inate showsthe surface-shear strain of the specimen, which corre-sponds to the zero-point movement.)
the result of an accidental displacement of the optical
lever system.
Hasiguti and Iwasaki explained their observations
in terms of Wang's model that the NiTi II-NiTi III
transition is caused by a martensitic-shear movementof atoms. This is discussed in detail in the section
titled "Crystal Structure," but, briefly, it is believed
that the atoms move rather freely in the temperature
region from M s to Mr; this means that there is a largeamount of nonelastic strain due to the shear move-
ment of atoms, and a correspondingly high internalfriction. The fine structure is rationalized in terms of
metastable intermediate atom positions between the
initial and final positions. In the NiTi II region, the
atoms are believed to be strongly bound as in a
covalent crystal; therefore, the internal friction would
be expected to be low. Similar arguments wereadvanced for the observed behavior.
Further studies of internal friction in relation to
the effect of plastic deformation were reported by
Hasiguti and Iwasaki (ref. 83). Figure 59 shows the
internal friction and elastic moduli for a specimen
(same as used in the previous work) deformed 10
percent after a 600 ° C anneal. As shown in the figure,
plastic deformation has caused the changes of internal
friction around the Ms to become sluggish. Heating at
400 ° C for 2 hr has restored the initial sharp
transitions. Fast cooling from a 1000 ° C anneal had
an effect similar to that of deformation (fig. 60);
namely, the transitions have become more sluggish. In
figure 61, however, annealing of the fast-cooled
specimen at 400 ° C has restored the sharp transitions
in the internal friction properties. These investigators_

42 THEALLOYWITHAMEMORY
_o
Ti-51Ni I0% elongotion oi 50°C
o o As deformed
24_3 _hr
I I f f-150 -I00 -50 0
Temperature, °C
50
-- 55
--50
I3.
5O
X
FIGURE 59.-The effect of deformation on the internal
friction and period of vibration of NiTi containing 51
atomic % Ni, as a function of temperature. (The specimen
was first annealed at 600 ° C. It was then deformed 10
percent at 50 ° C and tested. After testing, it was heated at
400 ° C for 2 hr and retested. Shear modulus is inversely
proportional to the square of the period of vibration.)
Ti-51Ni IO00°C x 7' hrs --3.5
x
4.0 .__
N
-},__3 -_.5 "5
'_ 2 5.0 _.
t
-20( -150 -I00 -50 0 50 I00
Temperature, °C
FIGURE 60.-The effect of cooling rate from 1000 ° C on the
internal friction and period of vibration of NiTi contain-
ing 51 atomic % Ni. (The specimens were heated at 1000 °
C for 2 hr prior to cooling. Shear modulus is inversely
proportional to the square of the period of vibration.)
proposed that the behavior could be explained by
assuming that deformation in the NiTi II phase
occurred,_ by means of 1/2 [711] dislocations in (_1_),(121), and (211) planes. Then, the NiTi II phase
partially transforms to NiTi I by the passage ofdislocations.
Ti-51Ni IO00°Cx2 hrs Fost cooling _1:55/
o • As-fos! cooled /
._o" 3 4,5
-- "6__Jo
-150 -I00 -50 0 50
Temperolure, °C
FIGURE 61.-The effect of annealing on the internal friction
and period of vibration of NiTi containing 51 atomic %
Ni. (Specimen had been heated at 1000 ° C for 2 hr and
fast cooled prior to being annealed at 400 ° C for 2 hr.
Shear modulus is inversely proportional to the square of
the period of vibration.)
HEAT CAPACITY AND LATENT
HEAT OF TRANSFORMATION
The diffusionless transition of the B2 structure to
the martensitic structure,* and the reverse transition,
have attracted considerable attention, especially since
they are connected with the shape-memory phenom-
enon and the attendant high forces in the return to
the memory shape.
Wang, Beuhler, and Pickart carried out differential
thermal analysis (DTA) experiments on NiTi contain-
ing 51 atomic percent Ni, which had a damping
transition at a temperature of about 40 ° C (ref. 17).They found that the 40 ° C transition is endothermic
in a heating cycle and exothermic in a cooling cycle.
From the heat capacity of the alloy (0.077 cal deg -1g-l), Wang et al. estimated the latent heat of the 40 °
C transition to be 5.78 cal/g, or about 307 cal/gramatom.
Wasilewski, Butler, and Hanlon made a calori-
metric study of a 50.2 atomic percent Ti alloy
containing <150 ppm oxygen (wt)(ref. 21). Selected
heat content values are given in table 7 and the
corresponding specific heat variation with tempera-
ture is shown graphically in figure 62. A sharp peak in
*NiTi II to NiTi III, using the nomenclature of Wang andBuehler.

PHYSICAL PROPERTIES 43
TABLE 7.-Heat-Content Values, [_Jt T -Z]kl-12s° c (callg-mole), of NiTi Containing 50.2 Atomic
Percent Ti (150 ppm oxygen)
Temperature, °C /XH Temperature, °C AH
-196 -1120 100 822.6
-79 --610 122.5 978.7
0 -160 226 1626
50 153 327 2310
70 267.1 427 2990
82.5 571.2 527 3665
93 774.8
3C
o 20--i
Eo
o
die-
c I I, I0 200 400 600 800
(-273C) _-73C) (I 27C) (327C) (527C)
Temperature, °K
FIGURE 62.-Specific heat of NiTi containing 50.2 atomic %
Ti. (Transformation temperature (heating): 90 o C Mar=
370±20 cal/g-mole.)
Cp is seen to occur at 90 ° C (363 ° K). The enthalpyAH was calculated to be about 370+20 cal/g-mole,
and the best estimate of the entropy AS = 1.01+-0.05
cal/deg K at 90 ° C.Wasilewski further studied the transformations by
DTA against an annealed-copper standard. The results
are presented in figure 63; the 92 ° C endothermic
peak on heating and a double exothermic peak on
cooling, the larger being at 55 ° C, are shown in the
figure.Another calorimetric study of the phase transition
was made by Dautovich et al (ref. 40). Their sample
was prepared by arc-melting spectroscopic-standard
nickel and iodide titanium in a gettered argon
atmosphere; the alloy contained 51 atomic percent
Exo,herm, I
' \ !I AT=I°C E!dotherrnic 1
i
I I I I I I i ,0 20 40 60 80 I00 120 140
Temperature, "C
FIGURE 63.-Differential thermal analysis results for NiTi
containing 50.2 atomic % Ti vs annealed nickel standard.
(Transformation temperature: heating, 92 ° C; cooling,
55 ° C. Note apparent two-step transformation on cooling.)
Ni. After being hot forged and machined to 0.5-in.
diameter by 1 in. long, the specimen was sealed in an
evacuated silica capsule, and annealed for 2 days at
700 ° C, followed by 6 days at 400 ° C, and then
quenched to room temperature. Typically, material
prepared this way contained less than 200 ppm
oxygen, and this particular sample contained 112
ppm oxygen after the heat treatment. This heattreatment was said to have suppressed the martensitic
transformation in the temperature range studied, and
thereby allowed the heat effects accompanying rever-
sion of an "intermediate" transition phase between
the transformation of the parent phase to martensite
to be examined. Longer treatments at 400 ° C were
found to limit the temperature range of existence of
the transition phase, which transformed completely
to martensite at or near room temperature. The
sample was placed in the heating coil of an evacuable
adiabatic calorimeter and cycled to increasingly lower
temperatures (to -196 ° C). The specific heat of a
sample heated from 43 ° C, 0 ° C and -196 ° C is
shown in figure 64. Also shown in the figure are
resistivity data for the same sample.Dautovich stated that the calorimetric data can
only give a lower limit for the heat of transformationof the martensite, since the transformation of these
samples was not complete even at the lowest temper-
atures used in the experiments. The heat of transfor-

44 THEALLOYWITHA MEMORY
12°/
,ool--
" 60 f
t-
_ 40
0
.,_......------Mar tens i t ic phase,
heated from -196°C
._Martensitic phase, ]
eared from O°C
Transition phase I
h_ted from_
iI5
I
E B_ IO5
I
::L
._> 95
-_ es
-_,.- J Heating
uJ _'5 I I I I I (B)0 2o 40 60 80 tO0 120
Temperature, *C
FIGURE 64.-Calorimetric and electrical resistivity data for
NiTi containing 51 atomic % Ni. ((a) Calorimetric data
obtained upon heating a single sample from-196 °, 0 °,
and 43 ° C, in three separate runs. (b) Electrical resistivity
vs temperature for the same sample cycled between 0 °
and 100 ° C.)
mation was more than 310 cal/g-mole, which is
consistent with the work of Wang, Pickert, and
Buehler (ref. 17) and Wasilewski (ref. 21).
Other calorimetric data obtained by Dautovich
(ref. 40) are presented in figure 65. This shows the
results of heating from progressively lower tempera-
tures, and shows more detail than figure 64. Thespecific heat increase at 70 ° C was said to be
associated with the reversion of martensite, rather
than the transition phase. While not well understood,
it was speculated that the reversion of martensite
formed first on cooling.
Specific heat measurements in the 25 ° to 218 ° C
range were made by Berman, West, and Rozner on an
arc-cast 50 atomic percent Ni specimen that had been
hot swaged and vacuum(10-6torr) annealed for 2 hr
at 800 ° C (ref. 84). The sample contained fine
precipitates thought to be Ti4 Ni20 and Ti4Ni2 N; the
oxygen content was 250 ppm and the nitrogencontent 80 ppm. The method consisted of determin-
ing the amount of energy required to raise the
o Heating from 55 °C__ _, • Heating from 49 °C
--.°_ eu- _ • Heating from 42.8 °C
_ _,i_ A Heating from 25 °C
\-_ 15--
70 78
Temperature,°C
FIGURE 65.-Calorimetric data obtained during heating
from the temperatures indicated. (Each heating run was
preceded by heating the sample to 95 ° C or above. The
broken line indicates the base values used in the graphical
integration.)
temperature by a small amount, usually less than 10 °
C, but as little as 0.8 ° C in the transition region. The
difference between the heat capacity of the calori-
meter itself and that obtained during runs with the
specimen is the heat capacity of the sample. Three
series of experiments and a single run were made asfollows:
First series-128 ° C to 218 ° C; cooled to room
temperature.
Second series-25 ° C to 82 ° C; cooled to room
temperature, then 80 ° C to 154 ° C; cooled to room
temperature.Single run-35 ° C to 151 ° C to obtain overall heat
of transition; cooled to room temperature.Third series-40 ° C to 179 ° C without intermedi-
ate cooling to room temperature.
In figure 66, the data obtained are shown for the
second and third series. Noticeably different results
were obtained in each of these runs. The heat of
transition was taken as the area under the heat
capacity curve (fig. 66); the area used was that which
lies above the extrapolation of the heat capacitycurves from 50 ° C and 113 ° C to the temperature of
the peak. The results were
Heat of transition Uncertainty
J/g mole cal/g-atom J/mole
Second series 4150 496 _10
Single experiment 3831 458 7
Third series 3375 403 _10
Berman et al. expressed their results as follows (ref.84):

PHYSICAL PROPERTIES 45
_ Sec_d series
...... Third series
oU
,3oQ.
8"6
T
60 70 BO 90 I00 I I0 I_'0
Temperolure, °C
FIGURE 66.-The effect of temperature on the heat capacity
of stoichiometric NiTi (ref. 80). (Curves constructed on
the basis of two series of measurements are shown.)
(1) From 24 ° to 61 ° C,
Cp = 48.211 + 0.075797 t,
where Cp is in J/deg mole NiTi and t is in °C. In this
temperature range no structural changes occurred,
and the results adhered well to the Kopp-Neuman
rule; i.e., the molar heat capacity of the compound is
the sum of the molar heat capacities of nickel and
titanium.
(2) From 61 ° to 113 ° C there is said to be a
higher order transition,* with a maximum heat
capacity at about 87 ° C.
(3) From 113 ° to 145 ° C,
Cp = 47.406 + 0.019667 t
(4) From 145 ° to 218 ° C,
Cp = 64.437 -0.168509 t + 0.00048679 t 2 .
In the 113 ° to 218 ° C range the specific heat is nearly
a linear function of temperature, but slightly below
the sum of the molar heat capacities of nickel and
titanium. Thus, at 127 ° C the calculated value
(Kopp-Neuman rule) is 54.8 J/deg mole, while 49.90was observed.
*Wasilewski calls it a first-order transition (ref. 21).
These investigators confirmed that the thermal
history of the sample has an important influence on
the thermal properties. Their values for heat of
transition were appreciably higher than found by
Wang (ref. 17), Dautovich (ref. 40), or Wasilewski
(ref. 21). The gradual reduction in the three series run
by Berman indicates, perhaps, that equilibrium was
being approached, and that the values reported by the
other investigators are perhaps more nearly equilib-
rium values. No two-step transitions of the type
reported by Dautovich (ref. 40) were observed byBerman.
In a subsequent paper, Wang et al. showed that the
DTA results were identical for the incomplete cycles
and complete cycles (ref. 44). The anomalous heat-
capacity change that is associated with the two
irreversible paths M s - M s on cooling, and Ms' - A s on
heating, and that m, such change occurs within the
reversible As - Ms range is shown in figure 67. Wang
interpreted the results to mean that electrons are the
major cause for the heat capacity changes observed.
He considered changes from covalent transformationto conduction-electronic transformation, and calcu-
lated the energy involved in the transformation, based
on the theory of Bragg and Williams on cooperative
phenomena in which an order-disorder parameter is
involved (refs. 85 and 86). Wang's calculated value of
the energy of transition was 4161 J/mole (498
cal/g-atom), which is in surprisingly good agreementwith the maximum value observed by Berman (ref.
84).To characterize Nitinol for the purpose of develop-
ing structural-mechanical applications, Schuerch per-formed DTA of Nitinol wire (ref. 67). For one of the
tests he used a specimen of 0.026-in.-diameter wire
containing 44.6 weight percent Ti, 0.07 weight
percent C, balance Ni that had been vacuum-heat
treated, reaching 522 ° C in 29 sec, held for 7 sec, andcooled. DTA results from -48 ° to 437 ° C were as
follows:
Temperature, Specific Heat,
o C cal/g deg
-48 0.110
-23 0.109
+77 0.109
+97 0.111
+437 0.113
These values, when converted to cal/g-mole-deg,
range from 5.86 to 6.03, which are in agreement with

46 THE ALLOY WITH A MEMORY
o
I I I I I I I I
I I I I / I I
I I I I L I I I I
-20 -I0 O I0 20 30 40 50 60 70 80 -2O-lO O I0 20 30 40 50 60 70 80
Temperature, °C
FIGURE 67.-Differential thermal analysis results obtained
after complete and incomplete cycles. (Complete cycles
are on the left and incomplete cycles are on the right.)
TABLE 8.-Differential Thermal Data on 55-Nitinol Wire
the results of other investigators, except that the
anomalous change associated with the transition was
missed. Additional thermal cycling within the range
-80 ° to +500 ° C showed that latent heat peaks
occurred between -40 ° and +54 ° C. Two endother-
mic peaks, one at 47 ° C and one at 54 ° C were
observed on heating, and up to three exothermic
peaks were observed on cooling. All of these values
were sensitive to the thermal history of the specimen,
as shown in table 8 (ref. 67).
Heat Peak Temperature,
effect shape o C
AH
cal/g cal/g-atom
NiTi containing 44.6 weight percent Ti and 0.07 weight percent C
Heat treat in vacuum at 522 ° C for 7.3 sec
Store 4 months at room temperature
Cool from +25 to-80 ° exo
Heat from -80 ° to +140 ° C endo
broad --40
sharp +47
very sharp +54
Niti containing about 45.4 weight percent Ti and 0.06 weight percent C
Heat treat in vacuum at 522 ° C for 7.3 sec
Store 4 months at room temperature
Heat from 20 ° to 161 ° C
Cool from 161 ° to 15 ° C
Heat from 15 ° to 80 ° C
Cool from +95 ° to -80 ° C
1.26 68
Heat from -80 ° to +160 ° C
Heat to 300 ° C
Cool from +100 ° to -80 ° C
Heat from -80 ° to +100 ° C
Heat from 100 ° to 500 ° C
Cool from +100 ° to -60 ° C
Heat from -60 ° to +100 ° C
endo sharp _+54 ......
exo sharp +45 ......
endo sharp +54 1.53 82
exo sharp +44 2.08 112
exo broad -40 2.14 115
endo sharp +47
very sharp +54 4.74 254
exo sharp +47exo broad --40
endo sharp +47
very sharp +54
>2.08 >112
_2.14 Nl15
>4.74 >254
none
exo sharp +39 2.21 119
exo medium - 23.29 117
exo medium - 8
endo sharp +54 5.56 299

PHYSICAL PROPERTIES 47
MAGNETIC SUSCEPTIBI LITY
Cloud, as reported by Wasilewski et al. found amarked increase in the magnetic susceptibility of
Nitinol (50.6 atomic percent Ti) at about 100 ° C (fig.
68), which was associated with the martensitic
transformation (ref. 21).
Hanlon et al. measured the magnetic susceptibility
of two compositions from -190 ° to +150 ° C and
found that the 50.7 atomic percent titanium alloy
showed a sharp increase in magnetic susceptibility
(from about 2.5 to 3.8X10 -6 emu/g) at about 75 ° C.
The 48.8 atomic p_ercent titanium alloy however, did
not show any sharp change (fig. 69). The behavior of
the 50.7 titanium alloy was also characterized by
differences in values taken during the heating and
cooling cycles. (See ref. 59.)
5B
_4Ii1
xA
>,
= 3J5
g
c 2g
- ff ,/
-_-f-f-H -f - +-f-+ - _'_- +"_
I I I 1- ioo o ioo 200
Temperature, *C
FIGURE 68.-Magneti c susceptibility of NiTi (50.6 atomic %
Ti), as a function of temperature (after W. H. Cloud).
x
u
g
5
4--
NJTi, 48.8 or.% Ti--_ _J-..-........... _ .... l
- NiTi, 50.7 at. % Ti _
i _ 1 i I I-200 -150 -I00 -50 0 50 I00 150
Temperoture, °C
FIGURE 69.-Magnetic susceptibility of NiTi (48.8 and 50.7
atomic % Ti).
Wang et al. studied the magnetic susceptibility of
NiTi (51 atomic percent nickel) over the temperature
range from -20 ° to +75 ° C (ref. 44). The behavior of
material that had been given complete cycles was
compared with that which had been given incompletecycles. As shown in figure 70, no difference (within
2.6
ox
_ 2.3
2ol *"T I I I-20 0 20 40 60 80 -20 0 20 40 60 80
Temperature, °C
FIGURE 70.-Magnetic susceptibility obtained after com-
plete and incomplete cycles: complete cycles on the left
and incomplete cycles on the right (ref. 44).
the limits of experimental error) was found in the
magnetic susceptibility of material given the two
types of treatments. The curves have the same general
shape as those reported by Wasilewski et al. (ref. 21)
and Hanlon et al. (ref. 59).
THERMAL CONDUCTIVITY
The thermal conductivity of NiTi and alloys of NiTi
with copper or nickel was measured by Gaff (ref. 75).
The chemical compositions of Golf's alloys were
given in table 2. Plots of the measured thermal
conductivities as a function of temperature are shown
in figure 71. In general, the thermal conductivity K is
the sum of a lattice component Kg and an electronic
component, Ke. Thus,
K = Kg + Ke.
Ke is related to the electrical resistivity p by the
Lorenz number L: L=Ke/pT, where T is the absolute
temperature. When only elastic scattering processes
are present, L has the Sommerfeld value of2.44X 10 -8 W-ohms/(°K) 2. Inelastic processes cause
the heat flux to diminish more than the charge flux,
and as a consequence L is decreased. On the other
hand, when Kg, the lattice component, is not negligi-
ble, the measured L values will exceed the Sommer-
feld value.
The Lorenz number vs temperature for the various
NiTi alloys is given in figure 72. Since L exceeds the
Sommerfeld value, Kg is not negligible at any

48 THEALLOYWITHAMEMORY
i0 C
?I
E
..¢ i0-IhEv
"o
0o
"6 _0-2
I--
10-3
• TiNi-O
• TINi-2Cu
o TiNi-8Cu
o " -- "
= t I I f I I i5 I0 50 I00 500 ICX)O
(-272°C) (-268°C)(-263oC) (-223*C)(-173°C) (227°C)C727"C)
Temperoture°K
FIGURE 7 l.-The thermal conductivity of selected NiTi-base
alloys.
id_
E
.J
id 6
(-z72 c)
FIGURE
• TiNi -0,', TiNi--2 Cu
i T!N!-_ 8 Cu
_.x,'nmerfeld volue.........................................
t I I i, illl I I I I I IIII I I I
5 IO 50 I00 500
(-268 C) (-263C) (-223 C) (-173C) (PPTC)
Temperolure,°K
72.-The .Lorenz number vs temperature for
selected NiTi-base alloys (ref. 75).
temperature. Calculated values for Kg are shown in
figure 73. The sharp difference between the TiNi-8Cu
sample and the others was attributed -to changes in
structure that take place between 10 ° and 100 ° K.
Also, Kg values of the alloyed samples seemed to
increase more rapidly above 100 ° K than did that of
the unalloyed sample. For an overview of the
transport properties of NiTi in comparison with those
of other TiX compounds, see reference 87.
THERMAL EXPANSION EFFECTS
AND SHAPE MEMORY
The shape-memory characteristic of Nitinol is so
interwoven with ordinary the.rmal-expansion effects
o,_ I0°
I
IO -
§/11_1-18 Ni-"l / //I//
- /._ TiNi-8Cu
iO-Z i
8
,//c.- TiNi-2Cu
163 , I , I , , I i t5 10 50 I00 500
(-272"C) (-2680CX-263°C) (- 223°C )(-173°C) (227_C)
Temperoture, °K
FIGURE 73.-The lattice component of the thermal conduc-
tivity of selected NiTi-base alloys (ref. 75). (The dashed
lines indicate temperature ranges where the separation is
only approximate.)
that it is difficult to discuss them separately. Shape
memory is, after all, a thermal expansion or contrac-
tion of a special sort. Perhaps, in order to make the
discussion easier to follow, these points should be
kept in mind:
(1) Thermal expansion usually means linear ex-
pansion and contraction.
(2) Thermal expansion is usually reversible, al-
though the heating path and cooling path might not
coincide over the entire temperature range.
(3) Shape-memory effects are usually irreversible,
but some part of the change might be reversible. For
some applications complete reversibility is desired;for others none is wanted.
The unusual thermal expansion and contraction
behavior of Nitinol was not recognized at first. In
fact, Buehler and Wiley reported in 1961, that the
linear thermal-expansion coefficient is 10.4× 10⁻⁶/°C
between 24 ° and 900 ° C (ref. 12).
Other data presented by Spinner and Rozner, and
attributed to Wiley and Heintzelman of the Naval
Ordnance Laboratory, are shown in figure 74 (ref.
81). The relationship of A_2/£ vs temperature is almost
linear from 100 ° to 300 ° C, with a slope of about
10X10--6/°C. Between about 25 ° and 100 ° C,
however, there is a hint of a slight hysteresis, but
because the observations were taken at relatively large
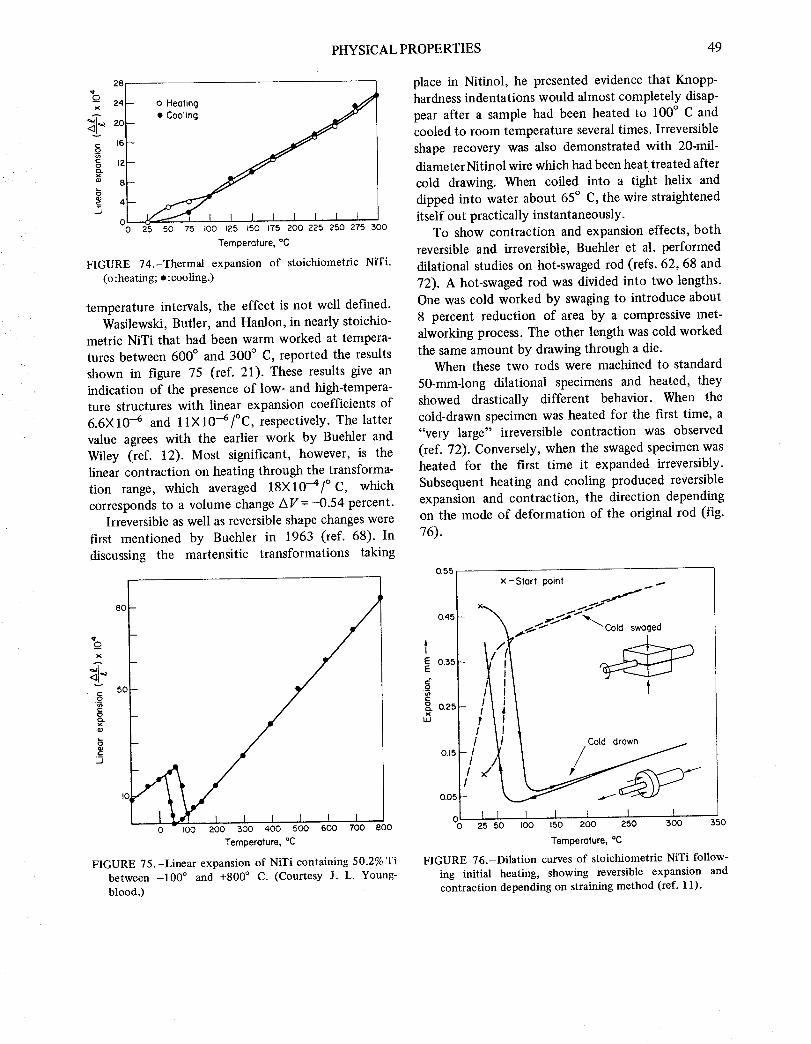
PHYSICALPROPERTIES 49
2_
_ox 24 - o Heating
16
_ 8
0 25 50 75 I00 125 150 175 200 225 250 275 500
Temperature, *C
FIGURE 74.-Thermal expansion of stoichiometric NiTi.
(o :heating; • :cooling.)
temperature intervals, the effect is not well defined.
Wasilewski, Butler, and Hanlon, in nearly stoichio-
metric NiTi that had been warm worked at tempera-
tures between 600 ° and 300 ° C, reported the results
shown in figure 75 (ref. 21). These results give an
indication of the presence of low- and high-tempera-
ture structures with linear expansion coefficients of
6.6X10 -6 and 11X10--6/°C, respectively. The latter
value agrees with the earlier work by Buehler and
Wiley (ref. 12). Most significant, however, is thelinear contraction on heating through the transforma-
tion range, which averaged 18X10-4/°C, which
corresponds to a volume change AV = -0.54 percent.Irreversible as well as reversible shape changes were
first mentioned by Buehler in 1963 (ref. 68). In
discussing the martensitic transformations taking
o
..J
80-
5O
0 IOO ZOO 300 400 5O0 600 "tOO 800
Temperature, °C
FIGURE 75.-Linear expansion of NiTi containing 50.2% Ti
between -100 ° and +800 ° C. (Courtesy J. L. Young-
blood.)
place in Nitinol, he presented evidence that Knopp-hardness indentations would almost completely disap-
pear after a sample had been heated to 100 ° C and
cooled to room temperature several times. Irreversible
shape recovery was also demonstrated with 20-mil-
diameter Nitinol wire which had been heat treated after
cold drawing. When coiled into a tight helix and
dipped into water about 65 ° C, the wire straightened
itself out practically instantaneously.
To show contraction and expansion effects, both
reversible and irreversible, Buehler et al. performed
dilational studies on hot-swaged rod (refs. 62, 68 and
72). A hot-swaged rod was divided into two lengths.One was cold worked by swaging to introduce about
8 percent reduction of area by a compressive met-
alworking process. The other length was cold worked
the same amount by drawing through a die.When these two rods were machined to standard
50-mm-long dilational specimens and heated, they
showed drastically different behavior. When the
cold-drawn specimen was heated for the first time, a
"very large" irreversible contraction was observed
(ref. 72). Conversely, when the swaged specimen washeated for the first time it expanded irreversibly.
Subsequent heating and cooling pioduced reversible
expansion and contraction, the direction dependingon the mode of deformation of the original rod (fig.
76).
0.55x-Start point
/P' /} Cold drown
0.05
I I I I I IO 25 50 IOO t50 ZOO Z50 300 350
Temperature, *C
FIGURE 76.-Dilation curves of stoichiometric NiTi follow-
ing initial heating, showing reversible expansion and
contraction depending on straining method (ref. 11).
tE 0.35E
0.25LU

50 THE ALLOY WITH A MEMORY
Some expansion and contraction characteristics of
Nitinol wire under load were proposed by Schuerch,
who was obtaining design information to develop
various devices (ref. 67). The Nitinol wire was heated
and cooled while under a constant preload. In a
typical test the procedure was to preload the sampleand set the axial strain scale to about zero at ambient
temperature (20 ° C). The sample was then cooled to
-50 ° C, recording the axial strain at intervals of 5 to
10 degrees. The sample was then heated to 150 ° C, or
higher if necessary, to reach the transition tempera-
ture range. The sample was then cooled to ambient
temperature. Preloads of 1, 5, 10, 20, 30, and 40 lb
were used. Some of the results obtained are shown in
figure 77 (ref. 67). The heating and cooling transition
temperatures increased as the constant load was
increased. The approximate transition temperatures
as functions of the constant load are given in figure
78 (ref. 67).
NASA-Langley sponsored a comprehensive invest-
igation of the shape-memory characteristics of Nitinol
(refs. 55, 63, and 70). In this work, a great deal of
data were obtained on the factors influencing the
shape-recovery vs temperature characteristics: chemi-
cal composition, processing, wire size, amount of
1 I I I I I I I' J '_J.... 51b
.... 401b
qf
._5- Ib load
---
5 --
4 --
3 --
= 2 -- _-+-Cooling _.IHeat,ng '-1, transition Jtransition I
=" -- _""_------- ', Heotinn__.,_ 40-1b_ _ -___.j. ----- _ ---- load
_:_ -2- I II I i
-5 I I --t
i
!
-6 1-! I I I I I -_,-60 -40 -20 I00 120 140 160
I I I I I0 20 40 60 80
Temperature, C
FIGURE 77.-Strain-temperature curves for 0.026-in.-diame-
ter 55-Nitinol wire containing 44.6 weight % Ti and 0.07
weight % C while under two constant applied loads. (The
wire was preloaded with the indicated load, which caused
the wire to extend. The zero point for the axial strain
measurements was the extended length, at about 20 ° C.)
18o
16o --
14o -- .Transition temperature _ /
120 -- on heating _"
_,oo- / /
/ /,_ Transition
80- / / temperature
/ / on cooling
//
_ 20
/
[ , I , I , I ,"400 I0 20 30 40 50
Pretoad, Ib
FIGURE 78.-The effect of preload weight on the transition
temperature observed for 0.026-in.-diameter 55-Nitinol
wire containing 44.6 weight % Ti and 0.07 weight % C.
strain, and other factors. Three alloys with different
compositions and different transition temperatures
were investigated. The compositions and transition
temperatures are given in table 3; in this table the Msis defined as the temperature at which the electrical
resistance curve reaches a maximum on cooling. The
implication is that it represents the temperature atwhich the martensitic transformation starts.
The detailed processing procedures are discussed in
chapter 3. For the purposes of the present discussion
it is important to note that foil and wire do not
behave the same way, and that the foil thickness and
wire diameter have an important effect on theshape-recovery characteristics.
Drennen, Jackson, and Wagner showed that tem-
perature of the final heat treatment-the so-called
"memory heat treatment"-was extremely influential
in determining the efficiency of shape recovery (ref.
71). The shape of the electrical resistivity vs tempera-
ture curves (given in the "Electrical Resistivity"
section) was shown by Cross, Kariotis, and Stimler to
correlate well with the efficiency of shape recovery(ref. 63).
The influence of the final heat-treatment temper-
ature on the reversible-thermal-expansion character-
istics of the annealed material is shown in figures 79
and 80. In compositions B and C annealing at 700 ° C
resulted in no hysteresis over the temperature range

PHYSICAL PROPERTIES 51
.8
O. .4 -"
5._.-_ .... --_-.2 4_ I
Composition B
8_ .6--I _""_.,_ ,,_ _'._'"
.2
LLI
-.2 ""_I
-4 Fo po ,tioo',c-,oo- oo 50 200 300 350(-73C)(-46C)(-18C) (lOC) (40C) (65C) (95C) (120C) (15OC) (175(])
Temperolure, o F
FIGURE 79.-The effect of temperature on the longitudinal
dimension of 0.100-in.-diameter composition-B and-C
rods (ref. 63).
Sp e_:in_en_ Pf'e.__porot io_ '
I O. I- inch-die wire cold-drown
from 0 2-inch die hot-swagedrod.Final die reduction 10%
(area). Final anneal 752 e F
(4OO°C), 5 rain, air-coated.
2 Same as No.I except annealed
-- at 932°F (500°C)3 Same as No.l exceptannealed
at 1112°F (600°C)
4 Same as No.I except annealed
at 1292°F (700°C)
c
2.m>
,2:+.
<1
Curve no Final onneol,OF Test length,in.
I 752 (400 C) 1.0012 932 (500C) 0.994
3 I I I 2 (600C) 1.001
4 1292 (700C) 1.0015
5 Referencecurve,Nifinolcoefficenfoffhermolexpansion
T_ I I I
I-15O -I00 -50 0 50 IOO 1SO 200
(-IOIC) (-73C) (-46C) (-18C) (IOC) (38C) (66C) (93C)
Temperature, F
FIGURE 80.-The effect of temperature on the longitudinal
dimension of 0.100-in.-diameter composition-A rods (ref.
63).
in which the various metallurgical transitions occur,
whereas with lower annealing temperatures large
hysteresis loops could be observed. Composition A,
which was said to have an M temperature of-51 o C,
failed to show any hysteresis. No interpretation of
this behavior was given.
Tensile recovery tests on the A, B, and C composi-
tions consisted in uniaxially elongating the specimen
to a predetermined strain, removing the load and
recording the elastic spring-back, and then applyingheat to restore the wire to its original length (ref. 63).
Deformation was carried out near what was said to be
the M temperature of the materials, i.e., at 24 ° C for8
compositions B and C, and at -54 ° C for composition'A. The results are summarized in figures 81, 82, and
83. For most of the compositions and zizes, 100
percent recovery could be obtained if the strain did
not exceed 6 to 8 percent. Variations did occur,
however, particularly between the 6-mil foil and the
various wire specimens. Compressive loading of com-
positions B and C rods indicated that perhaps therecovery limit is about 4 percent, though only a few
tests were run in this deformation mode (ref. 63).
Bend-recovery tests were performed by bending
the specimens around mandrels of various sizes to
give different amounts of outer fiber strain. All
,_--[ ]:'::3-"
ff .sot]'I__ a.
L:--_- ____:: :-----'D,
Initial strain (,)=-_" x I00
Spring-back recovery (Rs)= _-- x IOO
" _l+gm XTotal recovery (Rtl= T leo
IOO
9o
808 "_ _o
o
g_ 6oo 50
._ _ ,oe_ 3o
2O
D
m
m
A 100-mil-dia rod
O 6-rail-thick foil
_Thermol and elastic recovery
.... Elastic recovery
•.O-* ,-O-"
Note: Strain temperature=-65°F (-500C)
I I I I I I I2 4 6 8 I0 12 14 16
Initial stroin_ ,, percent
FIGURE 8l.-The effect of initial strain on the tensile-shape
recovery of composition-A materials.

52 THE ALLOY WITH A MEMORY
specimens had been given a "straight" memory anneal
at the temperature considered to be optimum for
shape recovery efficiency. As before, composition Awas bent at -54 ° C, and compositions B and C at 24 °
'*'--t .............. T2-21--*.
[- .............. 2T-_
V .............. l,
Initial strain (.)=_ x I00
SprinQ-back recovery (Rt)= _ x I00
Total recovery (Rt)=.- _ • I00
I00
90
>_ .c. 80
8"7 6o=o_ _o
_ _ 40
20
I0
00
,o0-_,-diorodm-S)"q _ "%• lO0-mil-dio rod (e-6) _ \
%_ 0 lO-mil-dia wire _ _
' on, e,os,oreoo.,I
[ iO Note:l Strainl temperature =75"FI I (25"C)1 I
2 4 6 8 I0 12 14 16
Initial strain,., percent
FIGURE 82.-The effect of initial strain on the tensile-shape
recovery of composition-B materials.
Initial strain(_r)= -_- x 100
..... L-- --_._ ' t"_ Spring-boekrecovery(Rs)='_ -X'O0p _" J p 8s+Bm
,_._,.___-- ........... =_.---j,.._ Total recovery(Rt)= _ x I00i
-_"1 _-Bs _* IO0-mil-dio rod
[ ................ _--_ • lO0-rnil-alo rodi 20-mil-dJa wire
I 0 15-mil-dio wire
__] i o ,o_,-diowi,e0 6-rnil- thick toil
F=-............ ..-__, ------Elastic recovery
I00
90
_ 80
8 _ 7o
_r- 60o _ 50_o
w ,_, 4C
_ 3c2C
"0" Note: Strain temperature = 75°F (250C)I I t I I I I2 4 6 8 IO 12 14 16
Initial strain, _, percent
FIGURE 83.-The effect of initial strain on the tensile-shape
recovery of composition-C materials.
C. The results obtained are shown in figures 84, 85,and 86. Important features of these curves are:
(1) The complete recovery limit was between 6
and 10 percent. Summary curves showing the com-
pleteness of recovery are shown in figures 87, 88, and89.
"Straight
onneeled" R T Bend Sl:x,ng-bock Heat R 1
<_1° _o- I I11 / or:O.aO0"(_)>_- _d_l v/ o r =0.575"(8.00)
6o- /11W o,:o o"i,ooolo _o- /?/_Y -r:O_S"(_ZO0/
40/_i "r=O _05"(,4 00)E
30 /_ " _' Note," Numbers shown in parentheses
_ ' _ designale percent strain in_. 2oouter fibers
io_o I I I I I I I-80 -40 0 40 80 120 160 200 240
('62°C) ('40°C) (-18°c) (5°0) (25°C) (50%) (70°(]) (95°C) (115°C.)
Temperature ,°F
FIGURE 84.-The effect of temperature on the bend-shape
recovery of 0.100-in.-diameter composition-A rods (ref.
63).
>.
o
80
70
60
50
40
50
20
I0
o
100
90
80
70
60
50
40
30
20
I0
0
- 7 3.9>
1/f T# or: o_oo"(5.9)#ddl or=O._"(O.OI
/x / 0 r = 0.450"(10.0)
'/ *r: _L_7>7>"iizo_v r = 0.305"(14.0)
r= 0.260"(160)
I00-mil-dio rod
--ISpringib_ck I I I
i _r 0240 (40)
2 "' i:; <(,?>-- Spring-iI_¢k 120" mill-dio wtire
"Straight
annealed"
R T Bend
Spring- book
Heat
RT
Note:Numbers
shown In
iXlrentheses
designate
percent stroin
in outer fibers
60 I00 140 180 ;20 260 300
(16°C) (38_C) (60°C) (800C) (I05°C)(IZ_O°C) (150°C)
Temperature o F
FIGURE 85.-The effect of temperature on the bend-shape
recovery of composition-B materials (ref. 63).

PHYSICAL PROPERTIES 53
90 _ ......80 "(29)
7oi- "tl_,III $ [ Or=0.,58"(44) on_,ed"I Ill _ I P mr=0.115"(5.9)
801- eft/# 21 / o,o6090':(_.5> (_5o I- 1 Ir f._l,/ L *r= 0.073'(9.0)/./a d_ ll¢'/ / vr=O061"(lO.O)
_°l--r S/N//'_ .;oo:o;3"(,zo). Bend8 SOl-_,,C,a"" .,=o.o,_",3.6)
_o_ "';°-0_"('_) 0__(_61° I0 rin k 15-rail-die wire- liP ock
Spring-beckO_
(I)8
"E 90 Heat8
80 ,_ r: 0.245"(2D)o r= 0.120"(4.0)
60 0 r = 0.036" (11.9)
50 x r= 0025"060)
4O
30
20
100 ISpringibeck 1 lO-mil-diowirel 1
60 1(30 140 180 220 260 50006"C) (38"C) (80*0 (50"C) (105"C)030"C)050"¢)
Ternperoture, °F
FIGURE 85.-The effect of temperature on the bend-shape
recovery of composition-B materials-Continued.
Note:Numbersshown In
parenthesesdes,:jnatepercentslroin
in ouler fibers
100
9O
80
80
8_
big zo- I0
_oo
9O
n 70
60
5O
4o
3o
20
IO
lO0-mil-dio rod
;___- -?__2--_ _- /f/ 5._I _,: i.zBo'.:(s.9)-- IIJ r/ o r = 0.800"(5.9)
_ _ ' / or:o.575"i5o)o r= 0.575" (8.0)
-- _' x r= 0.450" (10.0)
-,__...__(_/ - r: o.s65"02.0)• r = 0.305" (14.0)
• r = 0260" (16.0)
__Spling-b(_ck I I
20-mil-die wire
-_-=
- 11II #" // oroO.,_7"lO01II _dJ.Jl o,:0 _;5"(8.0)
- II El�" or=O090"O0.OI-- /I ,/]'_ x r= 0.073"(12D)
/ ';1/ , r: ooe"(14.ol-- z/,,_ • r= 0.053" (16D)
-- _ • r= 0.046"(180)
._"- Spring- backI I I I I
"Straightannealed"
R T 5end
Spring-back
RT
Note: NumbersI showt_ in
porenli_esesdes}gnQtepercent stroinin ouler fibers
60 iO0 140 180 220 260 300(t6°C) (38°C) (60%) (80°C) (105°C)(130°C)(150°C)
Temperature, ° F
FIGURE 86.-The effect of temperature on the bend-shaperecovery of composition-C materials (ref. 63).
,ooP9ol-
/ I _Ji I [4 t, r=0.157"(19)
_°h t _1!II o;:S.o_z'(4.o)601"-- ,{ I[_ _ o r= 0,047"(6.0)
I [ lli 11 t0r=0.o35"(80)5°I- ! _#t7/*;:ao_?('ool
o _ol- ./ YE II / _r=oo22"(_2.o)
>_ "uL_lSpringl-bock I I I_> 0 _--6 _ ,o
go
"Slraightannealed"
R T Bend
Spring- bock
Heat100--
80
_ _" I// z r=OO43"(SD) RT70
7 RP o r: 0.02.3,"(6.0)
80 - l _ o r: o.ol5'(9o).
50 /zf_ / 0 r= 0"0H"('2'0)40
5020_-- _' 5-rail-thick foil
10o_Springb_ck , I
60 I00 180 220 260 300(16%) (38"C) (c_Oc) (105°C) (iBOoC)(150*C)(80_C)
Temperolure, ° F
FIGURE 85.-The effect of temperature on the bend-shape
recovery of composition-B materials-Concluded.
Note :Numbersshown inparenthesesdesignatepercent strainin o_ter fibers
I00 -,----- _ 15-mil-di° wire
80 - / _. r: 0.240" (2.9) "Stroight70 _ annealed"
80 / _I_ / I o,:o!.___;'!_'_'!t _# _ 1 Or:0..5"i5.9)50 // _]L_" 0 r:OO90"CZ5)
40 /# _ - x r= 0.07_."(9.0) R T 5end0 y _ _/ : r:O.061".!lO.O)
_o _o f,,__ .,:o.o5s"02o)¢bjg 20 _ , r = 0.046"(1&6)
-- I0 _--Spring-bock • r:0.055"(17.4)
_" _, I -I I I I Spring-Uock_> o°° I _ IO-m -dowre _xS_,
90 .4_..f..%---- _....
_- 70 5"(20) R T
60 _ t ,u _F/ . o r= 0 i20"(4.0)F ? fl f/t o r: 8:0%"(60)
501-- / II _'/ 0 r : 0.046"(96)401-- ,X ]1 _ _ I x r:O.O_6"(ll.9) Note:NumberSshownin
/ / Ig / '_ r=0.029"[14.5) parentheser
50b /f/ 2 • r = 0.025" (16.0) des,gnote
I0 pring-[Dock in outer fibers
o I__'-f _ I I I I60 I00 140 180 220 260 30(3
(160C) (38_C) (600C) (80"C) (105°C) 0 7,0°C) 050_C)
Tempero!ure , °F
FIGURE 86.-The effect of temperature on the bend-shape
recovery of composition-C materials-Continued.

54 THE ALLOY WITH A MEMORY
6-mil-thick foilI00-
t'::ZZ:Z:ED
"Straight
annealed"
Rio
Spring- back
Heal
5-mil- thick foil
- ._._-Z=_--=]---
o_ 8070 RT
6050-. #/tW/ / o,= oo23"(6o)
4o - .,/;U o ,=o.ot5"(9o)
3Ozo--_ o,:o.otl"(mo)
I0 - I_.__.:-,>_ Spring - bockO_ I I I I60 I00 140 180 220 260 500
(16°C) (38°C) (60°C) (80°0) (105°0)(1_0°C)(150°C)
Temperature ,°F
FIGURE 86.-The effect of temperature on the bend-shape
recovery of composition-C materials-Concluded.
Note: Numbers
shown in
parentheses
desH:Jnote
percent strain
in o_Jter fibers
"Straight
annealed" R.I Bend Spring-beck Heat R.T.
c
-_ ioo"_90
-58O
E 70
760
8. 4o
8 2o-I0-
"o
_, %t,n
Thermal and elastic
recover),
A IO0-mil-dio rod- " 6-mil-thick foil
'_ 5-mil-thick foil
I I I I I I I I2 4 6 8 I0 12 14 16 18
Strain in outside fibers, percent
FIGURE 87.-The effect of initial strain on the bend-shape
recovery of composition-A materials (ref. 63.).
"StraightOnneoled" R.T Bend Spring-book Heat R.'[
-=- I o 20-mil-d!a w!re _ I"8 70 I-- o _'e .-._ Thermal and elostic I
60;- o IO-mil-dio wire recovery Ix 6-mil-thick foil .... "
_. 50- _, 5-mil-thickfoil ------ I-laSTIC recovery
o
O; 2 4 6 8 '0 12 '4 16 '8
Straininoutsidefibers,percent
FIGURE 88.-The effect of initial strain on the bend-shape
recovery of composition-B materials (ref. 63).
"Straightannealed" R T Bend Spring-beck Heat R.T.
o I00
-69o
•_ 80
"_ 70
_6o-_.5o-
>7"40 I
_o2o
iooo
_ = IO0-mil-dia rod ×,o 20-mil-dia wire
a 15-mil-diawire -- Thermal and elastico IO-mil-dia wirex 6-mil-thick foil recovery
\_" 3-mil-thick foil ------ Elastic recovery\\
t , F'---]--h--_'--7°" i I2 4 6 8 I0 12 14. 16 18
Strain in outside fibers,percent
FIGURE 89.-The effect of initial strain on the bend-shape
recovery of composition-C materials (ref. 63).
- IO0
.595
._ 90$o 85
800 I0 20 30 40 50 60 70 80 90 I00
4-
Number of cycles
FIGURE 90.-The effect of successive strain-heat-cool cycles
on the tensile-shape recovery of 0.020-in.-diameter com-
position-B wire (ref. 63).
_ 6_ercent constant strain
__8 percent constant strain

PHYSICAL PROPERTIES 55
(2) The temperature at which the rate of recoveryis a maximum (the nearly vertical part of the curve)
increased with increasing amounts of prior strain.
(3) A slight amount of "reversion", i.e., return to
the bent shape, occurred in all specimens.
Shape Recovery Fatigue
Cross et al. also studied the extent to which the
shape recovery phenomenon was repeatable (ref. 63).
In these experiments, they subjected 0.020-in.-diam-
eter composition B* wire to 100 strain-heat-cool
(SHC) cycles. Each SHC cycle consisted of straining
the wire in tension by 6 percent of the original gage
length, heating the wire to effect shape recovery, and
Cooling it to room temperature. As may be seen in
figure 90, the first time the wire was heated it
recovered about 96 percent of the 6 percent strain.
During subsequent SHC cycles, the recovery upon
heating decreased slightly. It reached about 94
percent after about 40 cycles and remained essen-
tially constant during the remaining 60 SHC cycles.
A companion specimen was also given 100 SHC
cycles, but this time the strain each cycle was 8
percent of the original gage length. The results of
these tests, also shown in figure 90, indicate that the
use of this higher amount of strain resulted in a much
greater decrease in degree of recovery. After 40
cycles, the recovery was down to 83 percent; after
100 cycles, it was 82 percent.
*The chemical composition is given in table 3.


CHAPTER5
Mechanical Properties
Because of the transformations that occur in them,
Nitinol alloys undergo unique changes in mechanical
properties with temperature. Furthermore, the
properties of the alloys are very sensitive to prior
processing.
STRESS-STRAIN CHARACTERISTICS
Tensile Properties
While in the early work at NOL (ref. 12) some
unusual aspects of Nitinol were noted, the tensile
properties were found to be more or less conventionalin value. Ultimate tensile strength was between
110 000 and 140 000 psi, yield strength varied with
heat treatment and composition between 33 000 and
81 400 psi, and elongation had values of up to 15.5
percent. Somewhat later, it was reported thatannealed cold-drawn wire had a tensile strength of
177 000 psi and 25-percent elongation, whilecold-drawn wire had a tensile strength of 271 000 psi
and an elongation of 6 percent (ref. 68). Considerably
later, more attention was paid to the tensile
properties and their variation with temperature. A
related property, "recovery force," was investigated
in 1967 through 1969 (refs. 63 and 67)in projects
supported by NASA. Also related to recovery force isthe work that Nitinol can do while recovering its
prior shape. These topics are covered in a later
discussion in this report.
The early interest in NiTi was as an intermetallic
compound, although the transformations thatoccurred in it and caused unusual behavior aroused
some interest. Rozner and Waselewski (ref. 19), in a
paper submitted for publication in 1965, indicatedthat the tensile properties were of interest in
developing methods for hot working intermetallic
compounds. Arc-cast and hot-extruded rods wereannealed for 1 hr at 600 ° C and furnace cooled.
Load-elongation plots were obtained at
temperatures from -196 ° to 700 ° C on
polycrystalline samples at a strain rate of about 10 -3
in./in./sec. Three distinct temperature ranges withinwhich the behavior was different could be distin-
guished:(1) At -196 ° to + 70 ° C: the stress-strain plots
shown in figure 91 are characterized by a well-
defined, though rounded, yield point and a small
• ,oc%
IO0*C
E=I0%I ,!
FIGURE 91.-Stress-strain curves for polycrystalline "nor-realized" NiTi from -196 ° to +100 ° C. (Discontinuous
yield and large Luders strains are present below thetransformation temperature (75 ° C).
yield drop. Luders strains of 4 to 7 percent took
place before strain hardening began, but then the
work-hardening rate was exceptionally high. Elonga-
tions between 15 and 40 percent were reported. As
shown in figure 91, (ref. 19) an abrupt change in
yielding behavior occurred between 70 ° and 100 ° C.
This change was observed in repeated tests. Themartensitic transformation in this alloy occurred at
75 ° C.
(2) At 100 ° to 400 ° C: smooth yielding occurred,
with a decreasing work-hardening rate with increasing
temperature, as shown in figure 92 (ref. 19).
57

58 THEALLOYWITHA MEMORY
IOO
Q.
5o
FIGURE 92.-Stress-strain curves for polycrystalline "nor-
realized" NiTi above the transformation temperature.
(3) Above 400 ° C: the yielding was continuous,
with large uniform elongation before fracture.
Figure 93 (ref. 19) shows the yield strength,
ultimate tensile stress, and elongation as functions of
temperature. Perhaps the most striking characteristic
is the temperature-independent behavior of the yield
strength between 100 ° and 400 ° C, where the yield
strength remains at about 35 000 psi.
The upper- and lower-yield stress between -196 °
and 70 ° C could be expressed by the exponential
relationship
Oy = A exp (-o_T) ,
where
A = 92, a = 4.35X10 -3 for the upper-yield stress
A = 84, o_= 4.78× 10 -3 for the lower-yield stress
ay = the yield stress, psi X 103T = absolute temperature, °K.
The true-stress true-strain relationship is plotted in
figure 94 (ref. 19), with the strain-hardening ex-
ponent n corresponding to
o = o (T) an,
where o (7") is the flow stress at unit strain at a given
temperature T; 6 = £n (1 + A£/£) is the natural strain;o is the flow stress at strain 6.
Rozner and Buehler (refs. 73 and 88) reported on
the effect of cold working on the tensile properties of
NiTi. Arc-cast and hot-swaged (at 800 ° C) specimenswere annealed at 800 ° C for 1 hr and furnace cooled.
The cold working was done by swaging, wire drawing,
and rolling. The Ms temperature of this alloy speci-
men was 70 ° C; consequently, for ease of cold
working, the specimen was soaked in liquid nitrogen
prior to deformation, and in the case of wire drawing,
/
160K & Fracture stress
_ o 0.2% yield stress
_40r _ zx o Elongation %
, op ..,,,_ _ AO .O
;- r
_ 6o_
40
20
0-200 -I00 0 I00 200 500 400 500 600 700
Temperature, °C
FIGURE 93.-Temperature-dependence of the mechanical
properties of polycrystalline "normalized" NiTi between
-196 ° and +700 ° C.
ea
%
IOO
._..._.._....-.------
IC I I I.01
_ 200%] n-O 28
- •
i:_i_i___________400 C, n:0.185
_,_¢_,,.-_-_--- 5000C, n=0.098
_ :_600"C, n=O.05
Illlil.I
True strain
I I I I I
FIGURE 94.-True-stress-natural-strain plots for polycrystal-
line NiTi.
the dies were chilled in a mixture of dry ice andacetone.
Samples deformed an equivalent amount by swag-
ing, rolling, and wire drawing produced essentially the
same results. Load-elongation plots were obtained at
room temperature at strain rates of about 10-3
in./in./sec. Typical curves of engineering stress vs
strain are shown in figure 95 (ref. 73). The annealed
specimen had a well-defined yield point and Ludersstrain of about "7 percent before the onset of strain
hardening; the cold-worked material exhibited contin-
uous yielding and nonlinear strain hardening. Elonga-
tion was more than 60 percent in the annealed
material, 25 percent at 8 percent reduction of area,
and 14 to 15 percent for the other specimens.
In figure 96, the tensile properties as a function of
the degree of deformation by rolling, drawing, or
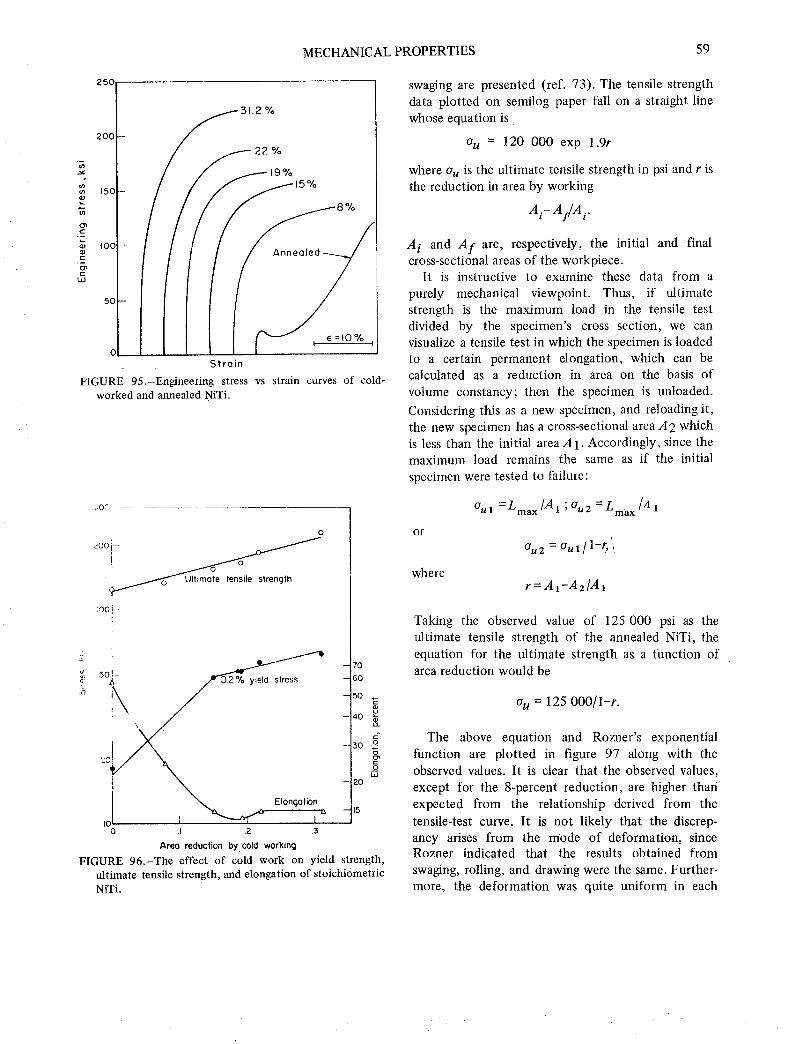
MECHANICALPROPERTIES 59
25O
t_
LO
31,2%
200-- / S 22°/°
/ / /19%
,,o / /
log eoled
50
;train
FIGURE 95.-Engineering stress vs strain curves of cold-
worked and annealed .NiTi.
_,O 7 ......
0
_m toe tensile strength
t
- 70_: 50 - 60c:
.h, -50
__N_ --40 _o.
--30 .9.
_9.ota3
-- 20
, _ Elongation , - 1.5to 1 -..-._af i _
o .I .2 .3
Areo reduction by cold working
FIGURE 96.-The effect of cold work on yield strength,
ultimate tensile strength, and elongation of stoichiometric
NiTi.
swaging are presented (ref. 73). The tensile strength
data plotted on semilog paper fall on a straight line
whose equation is
ou = 120 000 exp 1.9r
where ou is the ultimate tensile strength in psi and r is
the reduction in area by working
Ai-A/A i.
A i and Af are, respectively, the initial and finalcross-sectional areas of the workpiece.
It is instructive to examine these data from a
purely mechanical viewpoint. Thus, if ultimate
strength is the maximum load in the tensile test
divided by the specimen's cross section, we can
visualize a tensile test in which the specimen is loaded
to a certain permanent elongation, which can becalculated as a reduction in area on the basis of
volume constancy; then the specimen is unloaded.
Considering this as a new specimen, and reloading it,
the new specimen has a cross-sectional area A2 which
is less than the initial area A 1. Accordingly, since themaximum load remains the same as if the initial
specimen were tested to failure:
• /A 1Oul =Lmax/A1 ; °u2 =Lma x
or
where
au2 = Oul/1-r,l
r=A1-A2/A1
Taking the observed value of 125 000 psi as the
ultimate tensile strength of the annealed NiTi, the
equation for the ultimate strength as a function ofarea reduction would be
ou = 125 O00/1-r.
The above equation and Rozner's exponential
function are plotted in figure 97 along with the
observed values. It is clear that the observed values,
except for the 8-percent reduction, are higher than
expected from the relationship derived from the
tensile-test curve. It is not likely that the discrep-
ancy arises from the mode of deformation, sinceRozner indicated that the results obtained from
swaging, rolling, and drawing were the same. Further-
more, the deformation was quite uniform in each

60 THEALLOYWITHAMEMORY
"_ 240
0_ 220
..-C
2oo
c_c 180o)y.u_
---_ 160
140OE
120'
IOO0
o- = 120,000 exp 1.9r /
(Rozner and Buehler)(7_ /
o/-
I I II0 20 .30
Reductior' i:_ area, r
FIGURE 97.-Ultimate tensile strength of 55-Nitinol as a
function of degree of deformation, showing theoretical
and observed dependency.
275
25O
E
Q)
225
2
11}
2O0
0 O 0 " 0 C
15°/o
w
0 ,5 o o o o o oo o o 8%
D
o o f_ o o o O ou u o o o o
Anneoled
I0.5
175 I I0 0.5 1.0 0
D-2d
D
FIGURE 98.-Distribution of microhardness across the sec-
tion of annealed and cold-worked stoichiometric NiTi
rods. (D = diam of the specimen; d = distance of the
hardness indentation from the center of the specimen.)
case, as illustrated by the microhardness traverses (fig.
98) (ref. 73). It must be concluded, therefore, that
the higher ultimate strength was the result of the
deformation at cryogenic temperatures, whereas theannealed value and the tensile tests run on all
specimens were at room temperature. It is likely that
more martensite formed during the low-temperaturedeformation. This agrees with Rozner and Buehler's
conclusion that stress applied at temperatures below
the transition temperature helps to complete the
transformation in NiTi alloys (ref. 73).
The yield strength in the Rozner and Buehler
papers (refs. 73 and 88) is shown in two distinct
ranges, one below 15-percent reduction of area, and
one from 15 to 31 percent. The flow stress was
determined and expressed in terms of a true-stress
true-strain relationship
O=170 e n ,
where o = flow stress at a given strain, psi; uo = flow
stress at unit strain, psi, e = natural strain, £n (1 +
A£/£); n = strain-hardening exponent. These plots are
shown in figure 99 (ref. 73). They indicate that the
strain-hardening exponent is essentially constant for a
given amount of cold work.
Tensile tests were run by Schuerch (ref. 67) on
0.026-in.-diam wire (55.4Ni-44.6Ti-0.07C by weight)that had been vacuum heat treated at 522 ° C. In
these tests, the results of which are shown in figure
I00, the specimen was loaded to a certain level,
unloaded, and then reloaded. After six such cycles,
the material had about 5 percent residual strain. It
I250 r
t--
o 31.2 % area reduction
o 220 %
z_ 15.0 %
• 8.0%
2OO
15C
IOO
o I I I I.01 .02 .03 .05
True strain
I I I I
FIGURE 99.-True-stress vs true-strain curves for cold-
worked stoichiometric NiTi.

MECHANICAL PROPERTIES 61
75{_. A _ Izo,-- 1
70 --Original stress cycles (I. through 6)A/ . II°F| Note:0.05in./minStrainrole= //
f 6A_/// I00 300*F
65 660 5 / 90 zoo*r
55 I _ eo O*r
5°1- 4.. if// I _ '°!-/.,,,o., /,,5_- _../ .. _ ,o1_/_,,o.'I1 ", t
• / i ,,,..-.o.. j-,oo-. ,251-- _ qll II / "= 30l-_r""lOO*F -30"F i
24- z /5.// ¢1ii / _ ,on-i,_>.,--,,,,_._i',sF , .Z_/IIjI II I ;, ,o__:z l,ol- _ lll/J II ,' or i-,o:, i i l0 I 2 3 4 5
5_ i/ /// I ' Elongation, percent
o
"_ 300*F I
/f--" 200°F [
_--L'_liiilF (B) Heating I
%, IP"'_60*F /
!,oj,,o°,Le!,'I 2 3 4 5 6 7 8 FIGURE 102.-Stress-vs-elongation curves for 0.100-in.-diam
Percent strain, (AL/L) x I0-z
FIGURE 100.-Tensile stress-strain curves for 55-Nitinolcontaining 44.6 weight % Ti and 0.07 weight % C.
75
70 - __ Original stress cycle65 Second cycle60-
55- A%# i
-: 5o- //1_45- ,'/t.o 40 - _ .
_3o /_.......... i /7_
i o Heated to IOO°C after one cycle5 - - 7
o I 2 5 4 5 6 7 8Strain, in./in, x 10 -2
FIGURE 101.-Tensile stress-strain curve for 55-Nitinol
containing 44.6 weight % Ti and 0.07 weight % C. (Wirewas tested after storage for 1 year.)
was then heated to recover almost all of this strain
and retested to the same stress level. As indicated in
the figure, the stress-strain curve of the recoveredmaterial was almost the same as that of the material
loaded and unloaded through six cycles, although it
composition-B rods during cooling and heating cycles.
was displaced slightly on the strain axis. The samewire was stored for about 12 months under normal
laboratory conditions. When retested it was found
that the yield strength had increased sharply. This is
illustrated in figure 101. It was believed that this
increase was caused by small temperature variations
of room temperature.
Goodyear's research provided a _reat deal more
information about the tensile properties of Nitinol
(refs. 55, 63, and 70). Stress versus-elongation curves
were obtained at various temperatures above and
below the transformation range. Two typical sets of
stress-strain curves are given in figure 102 (ref. 63) for
100-mil-diam wire of composition-B material
(55.0Ni, 0.07C, balance Ti; Ms temperature around
18 ° C). The "cooling" notation means that the
measurements were made when cooling from 149 ° C;
"heating" is the reverse direction. These are not
complete curves. They merely show the behavior in
the vicinity of the elastic region and yield point.
Graphs of the elastic modulus and yield stress from
these curves are presented in figure 103 (ref. 63).
In figure 104, the stress-strain behavior of 20-mil
wire of composition B is shown, with the same test
temperature approached during heating and during
cooling as that used for the 100-mil wire. It is clear
that the yield behavior changes drastically when the
transition temperature is reached. This behavior was
found to be typical of all the compositions and forms
tested. (See ref. 63.)

62 THEALLOYWITHA MEMORY
13r-- 130.
t2 - 1201-: A
if- ttOI-
to- fool- Modulus
ot- o2oercentyield80t- s,ress I
7-_, 70I- 1 2'S,,;=6-_6ol- I _r
'_ -_ zot- I --_ d' I2,_?, ,o_--":_:_.__1...o' I {A)Coo_iog
Ms MdO OO. 13 - 13O
ol
"_ 12- _ 12CE
ll- o tip.9 <
_7_6o5
4
3
2
I
0
Modulus- _1oo
0.2 percent yield- _ 9C stress- _80
- _ 7O
-_ 60
- _ 501- .A"'--_ . . l-._ 40_
->- 3d- •
- 0 t I I I 1 t-
-tOO -60 -20 20 60 tO0
Md
I (B) Heating
I I I140 180 220 260
Tempelrature,°FI. I I 1 I I I I-73 -51 -29 -6 15 40 60 80 105 125 150
Temperoture,°C
FIGURE 103.-The effect of temperature on the yield stress
and modulus of elasticity of 0.100-in.-diam composition-
B rods during cooling and heating cycles.
24
x._E
.a
I1-.
I1)
e
Star1
20-
16-
12-
8-
4--Heated to IO0°C
o- _
-4
-8
-12
-16
-20
-24 I I I I I I I i I.10 -.08 -.06 -.04 -.02 0 .02 .04 06 .08 .10
Sheering strain, radions
FIGURE 105.-Torsional stress-strain curves for 55-Nitinolcontaining 44.6 weight % Ti and 0.07 weight % C. (Strainwas recovered after each stress cycle.
Torsion Properties
20O
-- :49160 -- 9._
eo _/;,-_j
160
120
•80 .__-----'__e gage length=6.65 in.(,9
40 __d rate=0.5 in./min.
, , , , , , ,,0 Z 4 6 8 I0 1'2 14 IG 18 20
Elongation, percent of corrected gage length
FIGURE ]04.-Stress-vs-elongation curves for 0.020-in.-diamcomposition-B wire during cooling and heating cycles.
Figures 105 and 106 give the torsional stress-straincurves for 55.4Ni-44.6Ti-0.07C wire obtained in the
NASA-Astro research program (ref. 67). In these
curves.the effective average shear stress was defined as
where
7" = 12MT/d a 7r
M T = applied torque, in.-lb.
d = wire diameter,
Tllis equation assumes a fully plastic distribution of
uniform circumferential shearing stress throughout
the wire cross section. The shearing strain, 7max, at
the surface of the wire is defined by
7max =0 d_where 2£
0 = relative angle of rotation at bench-marked sec-
tions, rad
= length of the test specimen between benchmarks, in.
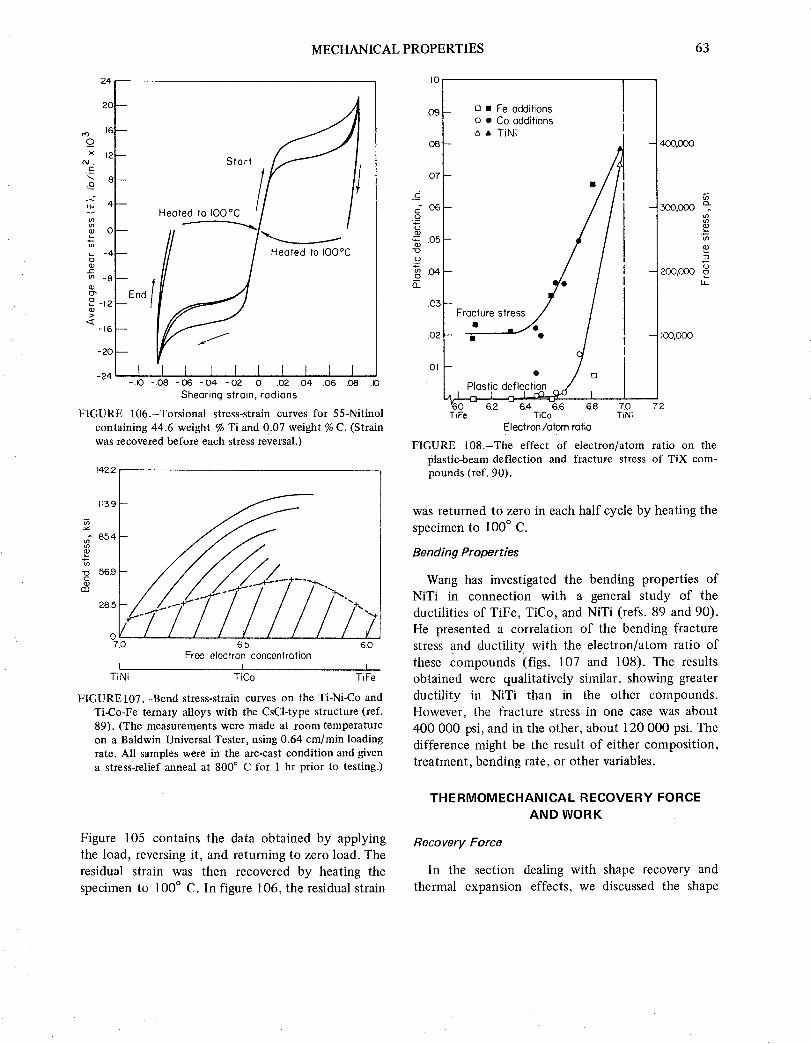
MECHANICALPROPERTIES 63
24
2C--
16--
O
x 12--Od.
E
JE)
i_- 4 --
"_ -4!
_ _ai_g
-12 --End
-16--
-20 --
I
Start
Heated to IO0°C J !
-24 I I I I I I I I I-Jo -08 -06 -o4 -.02 0 .02 .04 .06 08 .K)
Shearing strain, rodions
FIGURE 106.-Torsional stress-strain curves for 55-Nitinol
containing 44.6 weight % Ti and 0.07 weight % C. (Strain
was recovered before each stress reversal.)
142.2
113.9
" 85.4
u_
_ 56.9
28.5
o/ /7.0
__. "'i+-....,+.."+:6.5 6.0
Free electron concentration
I I
TiNi TiCo TiFe
FIGURE107.-Bend stress-strain curves on the Ti-Ni-Co and
Ti-Co-Fe ternary alloys with the CsCl-type structure (ref.
89). (The measurements were made at room temperature
on a Baldwin Universal Tester, using 0.64 cm/min loading
rate. All samples were in the arc-cast condition and given
a stress-relief anneal at 800 ° C for 1- hr prior to testing.)
.IO
.09 t
.08 --
.07 --
C
c-06--.Q
_ .05 --
.o
_ .04-
.03 -
.02
.01
t3 • Fe additions
o • Co additions
zx • TiNi
Fracture stre ess _
• m_•
III
400,000
(n
_00,0o0
:3
- 200,000LL
--_i• •• [3 - I00,000Plastic deflection
..... 8 7.0 7. 2TiFe TiCo TiNi
Electron/atom ratio
FIGURE i08.-The effect of electron/atom ratio on the
plastic-beam deflection and fracture stress of TiX com-pounds (ref. 90).
was returned to zero in each half cycle by heating the
specimen to 100 ° C.
Bending Properties
Wang has investigated the bending properties of
NiTi in connection with a general study of the
ductilities of TiFe, TiCo, and NiTi (refs. 89 and 90).
He presented a correlation of the bending fracture
stress and ductility with the electron/atom ratio of
these compounds (figs. 107 and 108). The results
obtained were qualitatively similar, showing greater
ductility in NiTi than in the other compounds.
However, the fracture stress in one case was about
400 000 psi, and in the other, about 120 000 psi. The
difference might be the result of either composition,
treatment, bending rate, or other variables.
Figure 105 contains the data obtained by applying
the load, reversing it, and returning to zero load. The
residual strain was then recovered by heating the
specimen to 100 ° C. In figure 106, the residual strain
THERMOMECHANICAL RECOVERY FORCE
AND WORK
Recovery Force
In the section dealing with shape recovery and
thermal expansion effects, we discussed the shape
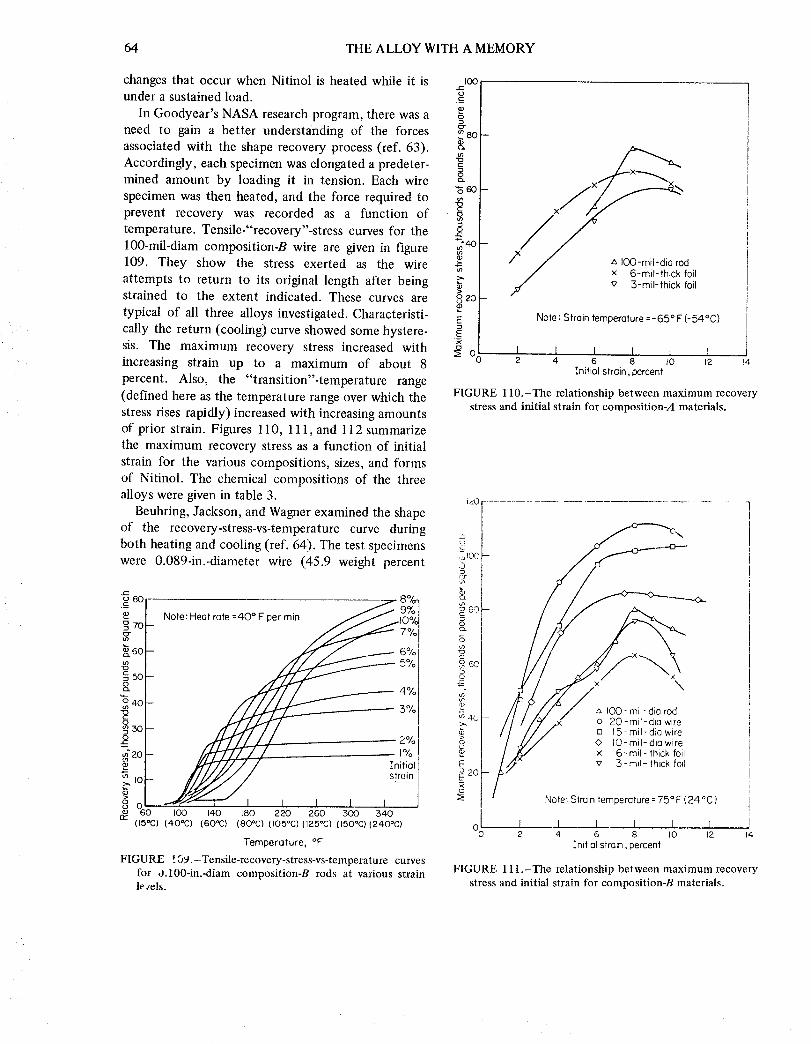
64 THE ALLOY WITH A MEMORY
changes that occur when Nitinol is heated while it is _oounder a sustained load.
In Goodyear's NASA research program, there was aneed to gain a better understanding of the forces g 80
associated with the shape recovery process (ref. 63).
Accordingly, each specimen was elongated a predeter-
mined amount by loading it in tension. Each wire o
specimen was then heated, and the force required toprevent recovery was recorded as a function of
temperature. Tensile-"recovery"-stress curves for the "_'°4°100-mil-diam composition-B wire are given in figure
109. They show the stress exerted as the wire -_
attempts to return to its original length after being _"
strained to the extent indicated. These curves are ozotypical of all three alloys investigated. Characteristi- E
cally the return (cooling) curve showed some hystere- 2
sis. The maximum recovery stress increased with z_ ,increasing strain up to a maximum of about 8 °°
percent. Also, the "transition"-temperature range
(defined here as the temperature range over which the
stress rises rapidly) increased with increasing amounts
of prior strain. Figures 110, 111, and 112 summarize
the maximum recovery stress as a function of initial
strain for the various compositions, sizes, and forms
of Nitinol. The chemical compositions of the three
alloys were given in table 3. __o
Beuhring, Jackson, and Wagner examined the shape
of the recovery-stress-vs-temperature curve during
both heating and cooling (ref. 64). The test specimens
were 0.089-in.-diameter wire (45.9 weight percent
§ 8°I 7 8%$ o 99'0
| Note:Heat rote =40 Fpermin //10%
_.60 I- 6Yo
_4
"_'zol- /#7"ZZL,Z--,L-- .... r yoe l F/_7//// Initial
: 'or /SffJ/ol -J/"-----r-" i J_60 I00 140 180 220 260 500 540n,"(15"C) (40%) (60"0) (80°C) (105°C) (125%) (150"0) (240°0)
Temperature, °F
FIGURE t09.-Tensile-recovery-stress-vs-temperature curves
for d.100-in.-diam composition-B rods at various strainle tels.
_ x X_x_
/x / _ ' CX_--mm[_-"d_ia_°d/ x 6-mil-thick foil
v 5-mil-thick foil
Note: Strain temperature =-65 ° F (-54°C)
I I I I I I2 4 6 8 I0 12
Initial strain, percent
FIGURE 110.-The relationship between maximum recovery
stress and initial strain for composition-A materials.
f,
,_ !OC'._3
_ogO.
>.
0
E
3 2_
\
f/z_ I00 - mil- dio rod
__x o 20-mil-dla wire/ o 15-rail- dio wire
0 !O-mil- dia wirex 6- mil- thick foilv 3-rail- thick foil')
I2
Note: Strain temperature = 75°F (24°C)
I I I I Ioo 4 6 8 IO 12 I_,
Initial straLn, percent
FIGURE 1 ll.-The relationship between maximum recovery
stress and initial strain for composition-B materials.

MECHANICAL PROPERTIES 65
i20
c_
tD
_>,40
X
/Yd/ /'/ _ iO0-m!i-dtor°pi
II/liII I/1 o iO-mil-diowi.re.// ._ × 6-mil- lhick foil
//,_ _' 5 -mil- thick foil
Note: Strain temperature =75OF (24°C)
I I I I I 12 4 6 8 I0 12
Initial strain, percent
FIGURE ll2.-The relationship between maximum recovery
stress and initial strain for composition-C materials.
Ti), which had been heat treated for memory at 930 °F for 20 min while under a tension of 5 lb. The
specimens were then given "stabilization" treatments
consisting of SHC cycles. These SHC cycles were
carried out according to the following schedule:
(1) Strain in tension an amount equal to 6 percent
of the original gage length, release the load, and
remove the specimen.
(2) Heat above the transition-temperature range of
the alloy, i.e., to about 205 ° C.
(3) Cool to room temperature.
Recovery-stress-vs-temperature curves were deter-
mined for specimens of the material that had been
given selected numbers of SHC cycles. The experi-
mental procedure consisted of straining a wire speci-
men by 6 percent in tension and then heating it while
constraining it to prevent shape recovery. The force
required to prevent recovery was recorded as a
function of temperature. It was found that material
given 5 SHC cycles had reproducible recovery-stress-
vs-temperature curves. A typical curve is given in
figure 113 (ref. 64).
Early exploratory work at NOL on the phenome-
non of recovery stress revealed that significant
stresses could be generated even when the
8O
60
8_ 2o
o I I I I _38 66 95 121 149 :77 204
Temperofure,°C
FIGURE 113.-Typical recovery-force curve of"stabilized"
and strained 55-Nitinol (45.9 weight % Ti).
memory-annealing temperature was not optimum
(ref. 69). In this work, wire was drawn to 0.020-in.diameter and annealed at 800 ° C, which is now
considered to be about 300 ° C higher than optimum.
After the annealing, the wire was reduced various
amounts by drawing to diameters as small as 0.012 in.
The wire was gripped in a tensile machine, and the
load recorded as separate wire samples were heated
electrically to different temperatures. After the test
temperature was reached, the current was turned off,
and the wire specimen returned to room temperature
quickly. The maximum stress increased with test
temperature up to about 220 ° C where it reached
values in the neighborhood of 50 000 psi; between
220 ° and 320 ° C (the highest temperature examined)
the maximum stress increased only slightly.
A residual stress was exerted by the wire after
cooling to room temperature. An important observa-
tion is that, for severely drawn wire, the stress
reached by heating was maintained to a much higher
degree at room temperature than it was for lightly
drawn wire.
Work
The ability of Nitinol to do work while being
restored to its memory shape is of great practical
significance. Essentially, Nitinol acts as a transducer,
converting thermal energy or electrical energy to
mechanical energy. For example, Nitinol is the basis
of a method patented by Buehler and Goldstein for
converting heat energy to mechanical energy (ref.
91). Figure 114, taken from the patent, illustrates the
principle. A strip of Nitinol is deflected at room
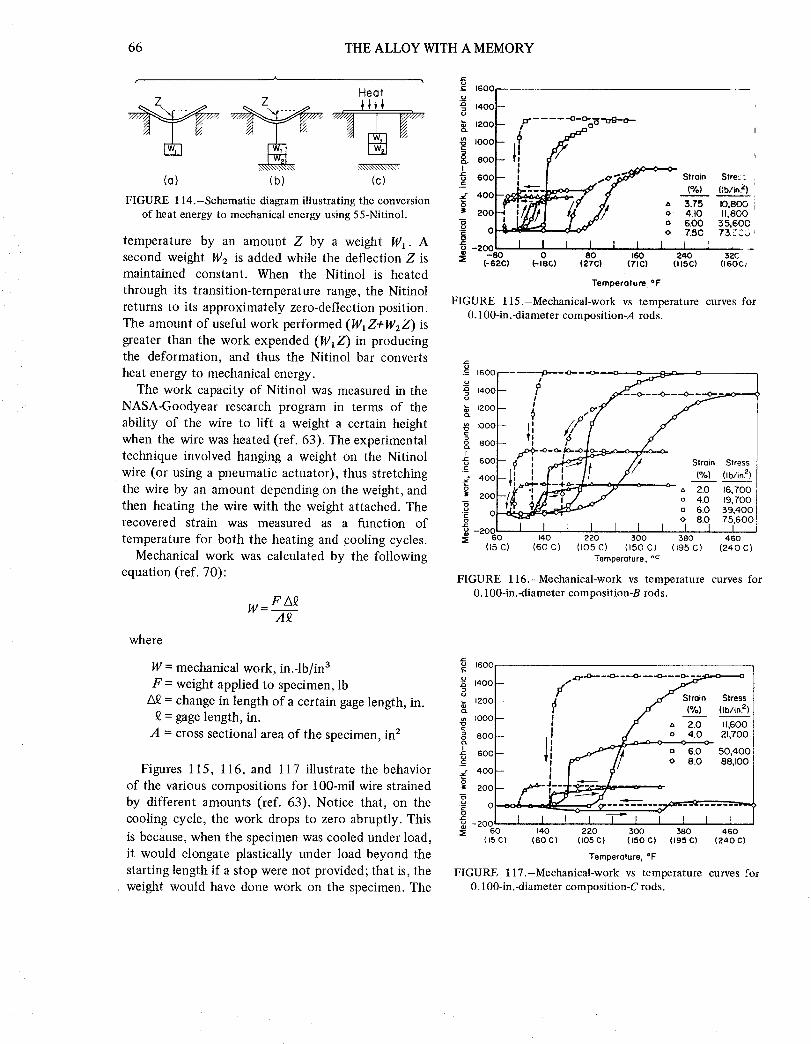
66 THEALLOYWITHAMEMORY
Heat
(a) (b) (c)
FIGURE 114.-Schematic diagram illustrating the conversion
of heat energy to mechanical energy using 55-Nitinol.
temperature by an amount Z by a weight Wx. A
second weight W2 is added while the deflection Z is
maintained constant. When the Nitinol is heated
through its transition-temperature range, the Nitinol
returns to its approximately zero-deflection position.
The amount of useful work performed (W1Z+W2Z) is
greater than the work expended (WIZ) in producingthe deformation, and thus the Nitinol bar converts
heat energy to mechanical energy.
The work capacity of Nitinol was measured in the
NASA-Goodyear research program in terms of the
ability of the wire to lift a weight a certain height
when the wire was heated (ref. 63). The experimental
technique involved hanging a weight on the Nitinol
wire (or using a pneumatic actuator), thus stretching
the wire by an amount depending on the weight, and
then heating the wire with the weight attached. Therecovered strain was measured as a function of
temperature for both the heating and cooling cycles.
Mechanical work was calculated by the following
equation (ref. 70):
where
FA_
A_
W = mechanical work, in.-lb/in 3
F = weight applied to specimen, lb
= change in length of a certain gage length, in.
= gage length, in.
A = cross sectional area of the specimen, in 2
Figures 115, 116, and 117 illustrate the behavior
of the various compositions for 100-mfl wire strained
by different amounts (ref. 63). Notice that, on the
cooling cycle, the work drops to zero abruptly. This
is because, when the specimen was cooled under load,
it would elongate plastically under load beyond the
starting length if a stop were not provided; that is, the
weight would have done work on the specimen. The
._- 1600
u
1400 --u
12oo- f .... "_-%'_-_'_"
°°°,I :800
._" 400 1%1 (_b/In. 21
i 3.75 Io, eoQ
zoo 4Jo JLSOO6.00 35,600
8 O 0 7.50 7 3ll:_ C _1 :
C=-20%0 I I I I I I I i I , _0 80 160 240 32C
(-62C) (-18C) (27C) (71C) (115C} (16OCt
Temperoture. *F
FIGURE l l5.-Mechanical-work vs temperature curves for
0.100-in.-diameter composition-A rods.
.S 1600
.u
"_ 1400
_o. 1200
._ tO00
800I
600
__" 400
noo
200
0
-2006O
(15 c)
_-o-o- to--o4o-_b' i t
:k_'-":;- -_'- _ 2.o _6,7oo'--/_ / _ _J. J o4.0 '9:700
o 6.0 39,400" <> 8.0 75,600
I I [ I I I I J I I140 220 300 380 460
(60C) (105 C) (150 C) (195 C) (240 C)
Temperoture, °F
FIGURE l l6.-Mechanical-work vs temperature curves for
0.100-in.-diameter composition-B rods.
160C
1400u
120C
lOOO
8 8oc
x=l 60C
40(3
20(3
o(J
-200
_ p,..-o"°-- -'°-- -_" --'°-_s
- , / o- I J' o 4_) 2C7oo
.J .....
_i.__*_-_ s -- - _____o_________I , I i I I I I I
60 140 220 300 380 460
(15C) (60C) (105 C) (150 C) (195 C) (240 C}
Temperature, °F
FIGURE l lT.-Mechanical-work vs temperature curves for
0.100-in.-diameter composition-C rods.
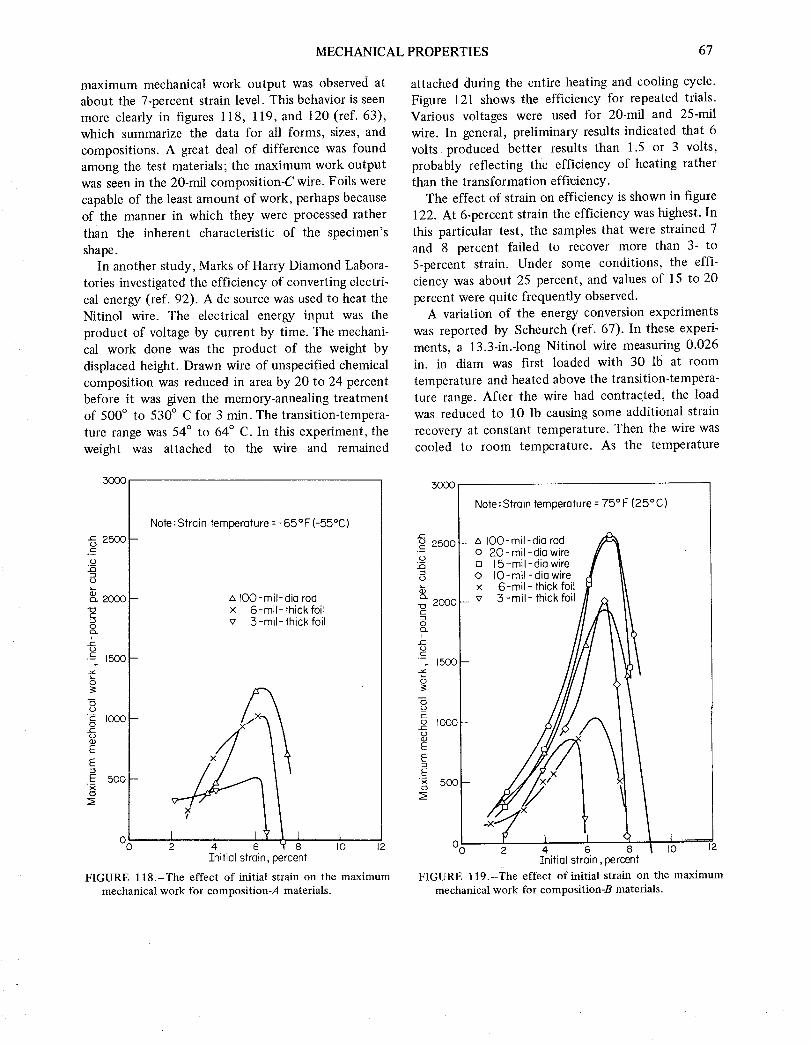
MECHANICAL PROPERTIES 67
maximum mechanical work output was observed at
about the 7-percent strain level. This behavior is seen
more clearly in figures 118, 119, and 120 (ref. 63),which summarize the data for all forms, sizes, and
compositions. A great deal of difference was found
among the test materials; the maximum work output
was seen in the 20-rail composition-C wire. Foils were
capable of the least amount of work, perhaps because
of the manner in which they were processed rather
than the inherent characteristic of the specimen's
shape.
In another study, Marks of Harry Diamond Labora-
tories investigated the efficiency of converting electri-
cal energy (ref. 92). Adc source was used to heat the
Nitinol wire. The electrical energy input was the
product of voltage by current by time. The mechani-
cal work done was the product of the weight by
displaced height. Drawn wire of unspecified chemical
composition was reduced in area by 20 to 24 percent
before it was given the memory-annealing treatment
of 500 ° to 530 ° C for 3 min. The transition-tempera-
ture range was 54 ° to 64 ° C. In this experiment, the
weight was attached to the wire and remained
attached during the entire heating and cooling cycle.
Figure 121 shows the efficiency for repeated trials.
Various voltages were used for 20-rail and 25-mil
wire. In general, preliminary results indicated that 6
volts produced better results than 1.5 or 3 volts,
probably reflecting the efficiency of heating ratherthan the transformation efficiency.
The effect of strain on efficiency is shown in figure
122. At 6-percent strain the efficiency was highest. In
this particular test, the samples that were strained 7
and 8 percent failed to recover more than 3- to
5-percent strain. Under some conditions, the effi-
ciency was about 25 percent, and values of 15 to 20
percent were quite frequently observed.
A variation of the energy conversion experiments
was reported by Scheurch (ref. 67). In these experi-
ments, a 13.3-in.-long Nitinol wire measuring 0.026in. in diam was first loaded with 30 lb at room
temperature and heated above the transition-tempera-
ture range. After the wire had contrac.ted, the load
was reduced to 10 lb causing some additional strain
recovery at constant temperature. Then the wire was
cooled to room temperature. As the temperature
300O
a= 2500
.o
2000 --
t2)
i
.c_ 1500--
0
c IO00--0
E
E
E 5OO -
0
Note:Strain temperature = -65°F (-55°C)
A 100-mil-dia rod
x 6-mil- thick foilv 3-mil-thick foil
, IO0 I0 12
X
,x
I2 4 6 W 8
Initial strain, percent
FIGURE 118.-The effect of initial strain on the maximum
mechanical work for composition-A materials.
3000
"_ 2500c
._(2LI
c_
2ooo
Q_i
-g. 1500
0
c
_ 10o0oQ_
EE
_ 5O0cl
Note: Strain temperature = 75° F (25°C)
- ,', IO0-mil-dia rod
o 20-mil-dia wire
a 15-mil-dia wire
O IO-mil-dia wirex 6-rail- thick foil
_ v 5-mil-thickfoil
O0 2 4 6 8 I0 "_12
Initial strain, percentFIGURE 119.-The effect of initial strain on the maximum
mechanical work for composition-B materials.

68 THE ALLOY WITH A MEMORY
5OOO
"_ 2500
X3
c_ 2000
0
i..c
- 1500
O
c
N 10ooc.)
EE2
'_ 500o
Note: Strain temperature=75°F(25°C)
A 100-mil-dia rodo 20-mil-dia wire[] 15-mil-dia wireO 10-mil-dia wirex 6-mil-thick foil,7 3-rail- thick foil
00 2 4 6 8 I0 12
Initial strain, percent
FIGURE 120.-The effect of initial strain on the maximummechanical work for composition-C materials.
18
s4
_ fz"G
_ io
_t strain,5 volts
o - 0020-inch-diameter wire,5 percent slrain,5 volts
I I I I I I I I I2 4 6 8 I0 12 14 16 18 20
Trial
FIGURE 121.-The variation of the efficiency of 55-Nitinol
during repeated trials. (The chemical composition of the
alloy was not given. Efficiency was defined as the ratio of
the mechanical energy expended by a Nitinol wire in
lifting a weight half the distance that the wire was
originally strained to the electrical energy put into the
wire while the weight was lifted this distance.)
passed through the 40 ° C region, elongation at
constant stress occurred. Finally, the 30-1b preload
was restored, and the wire was brought back to its
original condition of load and elongation. Figure 123
(ref. 67) shows the load-elongation-temperature be-
havior for two duplicate runs. Because of the lower
18
16
14
12c
o_._o>:uca, 8
G
I.iJ6
(a) (_)
Ol l l l I I l2 3 4 5 6 7 8
Initiol stroin, percent
FIGURE 122.-The effect of initial strain on the efficiency
of 55-Nitinol. (The chemical composition of the alloy was
not given. Efficiency was defined as the ratio of the
mechanical energy expended by a Nitinol wire in lifting a
weight half the distance that the wire was originally
strained to the electrical energy put into the wire while
the weight was lifted this distance.)
load during cooling, the wire did not stretch beyond
the zero point; that is, no negative work, such as that
occurring in the Goodyear experiments, was done.
For the two runs, the work done was reported to be
11.0 and 10.8 in.-lb. By converting these results to
the same units as those used by Goodyear, the
following expression can be derived:
11.0 in.-lb= 1560 in.-Ib/in 3
13.3 in. X rr (0.026) 2 in 24
Considering the differences in the experiment, andthe differences in the wire used, the work done is
remarkably close to that found in the Goodyear
experiments for 0.020-in. wire strained 6 percent,
which was a maximum of about 2000 in.-lb/in3 for
the composition-B and -C materials.
HARDNESS
A test for hardness has always been one of the first

MECHANICALPROPERTIES 69
-2
E
E
to -4
o
i
-I --
Cyc,'e_tart dd--"_ r r-----.-c--c_-d.... I30-1b preload I ""_NX Cycle
/ V ue° e-20-1b prelood_i, \1_
added i_ lI __
i
20- Ib
preloodremoved
, \N
-6
_. I I [ I I-40 0 40 80 120 160
Temperature, C
FIGURE 123.-Temperature-elongation relationship for dis-
continuously loaded 55-Nitinol containing 44.6 weight %
Ti and 0.07 weight % C.
tests made on new materials. Such tests provide a
simple way of assessing the strength of a material.The hardness of Nitinol was covered in detail in the
early reports on NiTi (refs. 11 and 74). Hardness
measurements in Buehler and Wiley's first report for
NOL were made at temperatures ranging from -75 °
to +982 ° C for various compositions. At room
temperature the following hardnesses were obtained
for an arc-cast 55.1 weight percent Ni composition:
Condition Hardness, R C
Arc-cast 30-31
Hot-rolled from 600 ° C, rapidly cooled 38
Hot-rolled from 700 ° C, rapidly cooled 38
Hot-rolled from 950 ° C, rapidly cooled 32-34
Hot-rolled from 1000 ° C, rapidly cooled 39
Hot-rolled from 1100 ° C, rapidly cooled 3941
The hardness as a function of composition and
cooling rate from high temperature is shown in figure124. These variations in hardness were attributed to
the presence of varying amounts of Ni3Ti in the NiTimatrix. Additional data for the 54.5 weight percent
Ni composition are given in figures 125 and 126. The
graph of figure 125 shows how hardness is affected
6_ T NiTi _ ,_.6c- J ---i--i
i _ Water quenc eAfter hot rol ling_
5c -- ot 900°C "_' (1000-1050°C)
n.-C
=_ 30_ _lFurnoce cooled
o_ _" _, }(from 950-1050°C-r , I
20 -- ""x
Io-- i
I! I|ll /F.C. cu,rve-down to 65 R 8
I i I
Weight percent nickel
_ChemicolI composition !
j Range of ---d
55-Nitinol
FIGURE 124.-The effect of chemical composition and heat
treatment on the hardness of NiTi alloys (ref. 74).
65
6(O
55
5O
65
_Furnace cooled from 8000C
1 I I I I I I I I I I IR.T,
_6oo
.1-
55
50
45
-- >_X" "" _" _, r." I
Water quenched from 800°C
I I I I I I I-25 25_-32C) (-4C)
40 I I l I [-,zs -_s RT tZS ,Ts zoo(--8ro (-soo (50c) (80c) (93c)
Test temperature,OF
FIGURE 125.-The effect of temperature on the hardness of
NiTi (54.5 weight % Ni) cooled from 800 ° C at two
different rates (ref. 74).
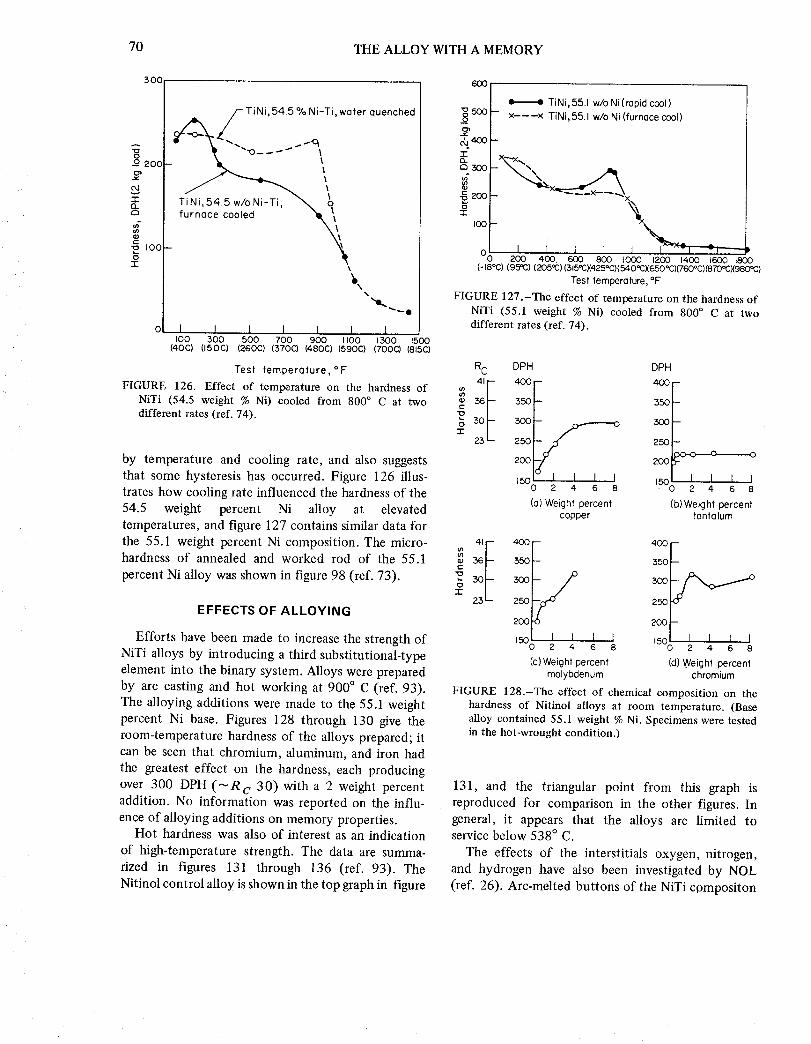
70 THE ALLOY WITH A MEMORY
300[
TiNi,54.5 % Ni-Ti, water quenched
_oaooF _D,," _
T_Ni,54.5 w/o Ni-Ti, _ 0
furnace cooled "_ \
3 _
k%
o, 1 I I I 1 I I_00 3oo 5oo 7oo 9oo _too _0 =50o
(40C) (150C) (260C) (370C) (480C) (590C) (700C) (815C)
Test temperature,°F
FIGURE 126.-Effect of temperature on the hardness of
NiTi (54.5 weight % Ni) cooled from 800 ° C at two
different rates (ref. 74).
by temperature and cooling rate, and also suggests
that some hysteresis has occurred. Figure 126 illus-trates how cooling rate influenced the hardness of the
54.5 weight percent Ni alloy at elevated
temperatures, and figure 127 contains similar data for
the 55.1 weight percent Ni composition. The micro-hardness of annealed and worked rod of the 55.1
percent Ni alloy was shown in figure 98 (ref. 73).
EFFECTS OF ALLOYING
Efforts have been made to increase the strength of
NiTi alloys by introducing a third substitutional-type
element into the binary system. Alloys were prepared
by arc casting and hot working at 900 ° C (ref. 93).
The alloying additions were made to the 55.1 weight
percent Ni base. Figures 128 through 130 give the
room-temperature hardness of the alloys prepared; itcan be seen that chromium, aluminum, and iron had
the greatest effect on the hardness, each producing
over 300 DPH (_R c 30) with a 2 weight percent
addition. No information was reported on the influ-
ence of alloying additions on memory properties.Hot hardness was also of interest as an indication
of high-temperature strength. The data are summa-
rized in figures 131 through 136 (ref. 93). The
Nitinol control alloy is shown in the top graph in figure
&400x"
TiNi, 55.1 w/o Ni(rapid cool)
x-----x TiNi,55.1 w/o Ni (furnace cool)
X-yx_ "c3 300 -
._ 2oo
-1-
I00
o I I I I I x_l sl2C0 400 600 800 I000 1200 1400 1600 1800
(-18°C) (95':'C) (205'_) (315'_C)(425oC)(540,:'CX650*C)(760oC)(870,=CX980,:,C)
Test temperature, °F
FIGURE 127.-The effect of temperature on the hardness of
NiTi (55.1 weight % Ni) cooled from 800 ° C at two
different rates (ref. 74).
RC DPH
_ 350
E25 250
2OO
15o I I I I0 2 4 6 8
(a) Weight percent
copper
DPH
4OO
35O
:5OOD
250--
200
_5o I I I I0 2 4 6 8
(b) Weight percenttantalum
36 350
£250
200
I I I I1500 2 4 6 8
(C)Weight percent
molybdenum
FIGURE 128.-The effect of chemical composition on the
hardness of Nitinol alloys at room temperature. (Base
alloy contained 55.1 weight % Ni. Specimens were tested
in the hot-wrought condition.)
400-
350 -
25O
2OO
I t I I150( 2 4 6 8
(d) Weight percentchromium
131, and the triangular point from this graph is
reproduced for comparison in the other figures. In
general, it appears that the alloys are limited toservice below 538 ° C.
The effects of the interstitials oxygen, nitrogen,
and hydrogen have also been investigated by NOL
(ref. 26). Arc-melted buttons of the NiTi cpmpositon

MECHANICALPROPERTIES 71
RC DPH
60 - 700
58 -- 650
55-- 600
52 -- 550
49 -- 500
_45- 45041 400
36 350
x As cast
o Hot wrought
- d
-/X
DPH
400
350
5OO
250
200
I I I I1500 2 4 6 8
(b) Weight percent
silicon
D
350--
1
x As cost
_ o Hot wrought
41 400 --
36 350
25O
2OO
I I I I1500 2 4 6 8
(a) Weight percentiron
23 -- 250 250
czc-o---._--------o200 200 --
I I I I 15o( 1 I I I1500 2 4 6 8 2 4 6 8
(O) Weight percent (c) Weight percent
otuminum niobium
FIGURE 129.-The effect of chemical composition on the
hardness of Nitinol alloys at room temperature. (Base
alloy contained 55.1 weight % Ni. Data points indicated
by "o" refer to tests on hot wrought alloys. Data points
indicated by "x" refer to tests on as-cast alloys.)
were prepared in an argon atmosphere and then
remelted in the presence of about 0.06 atmosphere of
either 02 N2, or H2. Microhardness measurements
were made on the matrix and on the secondary phase
particles of all samples. The data are given in table 9.
Hot-working trials on these materials indicated that
the nitrogen-containing alloy was ductile even though
the matrix had a relatively high hardness. On the
other hand, the oxygen-containing specimen was
reported to have cracked severely when rolling at900 ° C was attempted.
In a paper by Wang, it was indicated that the
absorption of 150 ppm of hydrogen in NiTi strip
TABLE 9. Microhardness Data on NiTi With Con-
trolled Interstitial Contaminants.
Knopp microhardness, 50-g load*
Matrix Secondary phases
Melting
atmosphere
OPH
400-
350 --
°25O
2OO
t50- .I I I Io 2 4 6 8
(b) Weight percentvanadium
4 f/x(c) Weight percent
cobol t
400 --
350-- X
250--
200 --
me'0 2 4 6 8
(d) Weight percen{
manganese
FIGUI_E 130.-The effect of-chemical composition on the
hardness of Nitinol alloys at room temperature. (Base
alloy contained 55.1 weight % Ni. Except for the two
data points marked with an "x", specimens were tested in
the hot-wrought condition. Specimens designated by x
were tested in the as-cast condition.)
lowered the hardness from 43.5 to 41.0 RA, (ref. 89).
Wang related the drop to an increase in free electron
concentration, and compared the hardness vs electron
concentration of other intermetallic compounds with
titanium. This comparison is shown in figure 137.
IMPACT TOUGHNESS
Table 10 shows the Charpy-unnotched impact
strength for undersized specimens of 54.5 and 55.1
weight percent Ni alloy (ref. 12). The impact strengthof notciaed and unnotched standard-sized bars is
shown in table 11 (ref. 94). It is evident that the alloy
displays some notch sensitivity below the transition-
temperature range. No data were found for impact
properties above the transition-temperature range.
Argon 211 211
Hydrogen 226 226
Nitrogen 351 635
Oxygen 520 790
*Average of S to 10 measurements.
FATIGUE STRENGTH
Very few data are available on the fatigue strength
of 55-Nitinol. Buehler (ref. 68) reported the results of
a standard R. R. Moore rotating-beam fatigue test on

72 THE ALLOY WtTH A MEMORY
4°°1 IFo-- I I I I i:_:'_!i{ii::::i!_i......
55] weight percent
nickel-base al lay
_-400I
_ _ooF__ I00
O-- I I I l I
55.1 weight percentnickel plus 4 weight
percent copper
I 400 /
%
__ 551 weight percent
nickel plus I weight
percent tantalum
I I I I200 400 600 800 1000 1200 1400(90C)(205e)(315c) (4zsc)(540cX650c)(760c)
Test Temperature, °F
FIGURE 131.-The effect of temperature on the hardness of
55-Nitinol (55.1 weight % Ni) containing selected alloyingadditions.
- - -_-_ 55.1 weight percent
._ ZOO1- /" nickel plus I weightI001- percent aluminum
O_ I I I I I I
4OO
551 weight percent200_- nickel plus I weight
-a percent siliconI00
Ot I I I i I 1
4°°l 55.1 weight percent_°°l-__0o_- _ nickelp,us_weighl
.._ I00_ _ [ percent niobiumO! I I l i I t
o zoo 400 600 800 100o _zoo _4oo(90C)(205C)(31_..C)(495CX540CXS_CX760C)
Test Temperature, °F
FIGURE 133.-Hardness at elevated temperatures for ternary
alloys based on 55-Nitinol (55.1 weight % Ni).
55J weight percent
nickel plus 8 weightpercent tantalum
55] weight percent
nickel plus 4 weight
percent molybdenum
=°°0/ I_0ol---_°°_"I- i 551weightpe_enti nickelplus 4weight
IOOFo_) I I I I I 1 L percent chromium200 4OO 60O 800 10oO 1200 I(90C)(205C)(315C) (425C )(S4OCXe CXgC )(760C}
Test Temperature, °F
FIGURE 132.-The effect of temperature on the hardness of
55-Nitinol (55.1 weight % Ni) containing selected alloyingadditions.
=4o0|
,ool--r o/ I [ 1 I I I
55.1 weight percent
nickel plus 2 weight
percent iron
=4°°I
55.1 weight percent
nickel plus 05 weight
percent vanadium
"I-400 I
"_00 F_- 55] weight percent
20O nickel plus 8 weightpercent vanadium
-_'0ol-_-o / I I I I I Io 200 4O0 6OO 800 _000 _200 _4O0
(90C}( 2OSC )(315C)(425CX540C)(650C)(760C)
Test Temperature, °F
FIGURE 134.-Hardness at elevated temperatures for ternary
alloys based on 55-Nitinol (55.1 weight % Ni).

MECHANICAL PROPERTIES 73
500
3= 4OO(3-a
500
_200
-r ioo
55.1 weight percentnickel plus 2 weight
percent cobalt
4oo
.I-
o| I I I I I
4OO
"r"
300
200
_ 100T
55.t weight percent
nickel plus 5 weigh_
percent cobalt
551weight percent
I nickel plus 4 weigh_i percent manganese
90 200 400 600 800 I000 1200 1400
35C)(90C)( 205 C)(315CX425C)(540X 650C).(760C)
Tes_ Temperature, °F
FIGURE 135.-Hardness at elevated temperatures for ternary
alloys based on 55-Nitinol (55.1 weight % Ni).
hot-wrought material containing 56 weight percent Ni
at room temperature (which was below the
transition-temperature range). He found that the
specimen endured 2.5×10⁷ cycles at 70 000 psi. It
should be noted that 70 000 psi is well above the
yield strength of the material.
MACH INABI LITY
The machining characteristics of 55-Nitinol have
been studied by Gould (ref. 95). Tool life tests were
conducted in turning, face milling, drilling and
tapping operations. Grinding tests were also con-ducted. It was found that tool wear is rapid and that
the cutting speed, feed, tool material, tool geometry,
and type of cutting fluid have a great effect on the
results obtained. Specifically, Gould reported that
(1) Nitinol alloys can be turned 10 to 20 timesfaster with carbide tools than with high-speed steel
tools. It is not practical to turn some Nitinol
compositions with high-speed steel tools.
40OF-"_ ..........
,
0_ i i I I I I200 400 600 800 I000 1200 1400
(90C)(205C)(315C) (425C)(540CX650CX760C)
Test Temperature, °F
FIGURE 136.-Hardness at elevated temperatures for
55-Nitinol (55.1 weight % Ni) containing 10 weight % W.
.-..., I welCjnt i.)er _.inickel plus iO weigh!
percent tungsten
80:
7o
,¢
60--
50 -
40I30
6.0
X
X_, x
\
×\×
×
\X
Hydrogen-treated TiNi _
i t i I" 6.5 7.0
Free electron concentrationI i i _
Ti Fe TiCo T iNi
FIGURE 137.-The effect of chemical composition and free
electron concentration on the hardness of the ternary
phases Ti (NixCol. x) and Ti (Co x, Fe l-x)-
(2) Feeds of 0.003 to 0.005 in./rev, should be
used in turning.
(3) The optimum tool geometry for face milling
these alloys is 0 ° axial rake and 0° radial rake.
(4) A feed of 0.005 in./tooth should be used in
face milling. At higher and lower feeds, tool life
decreases very rapidly.
(5) Maximum tool life in face milling a 55 weight
percent Ni alloy (in the "as-received" condition;
hardness 217 BHN) was attained at a cutting speed of

74 THE ALLOY WITH A MEMORY
Nominal Nickel
TABLE lO.-Impact Data for NiTi
Content, Specimen section
weight % Size, a in.Test conditions
Charpy
impact,
ft-lb
54.5 b0.296X0.296 Test temperature: 24 ° C (room temperature)
54.5 b0.296X0.296 Test temperature: 52 ° C
54.5 b0.296X0.296 Test temperature: 93 ° C
54.5 b0.296×0.296 Test temperature: -80 ° C
54.5 b0.296X 0.296 Cooled to -80 ° C, warmed in room-temperature water,
held 15 mins. in room-temperature air. Test tempera-
ture not given.
54.5 b0.296× 0.296 Cooled to -112 ° F, warmed in room-temperature water,
held 15 mins. in room-temperature air. Test tempera-ture: 71 ° C
55.1 c0.297X0.297 Test temperature: 24 ° C (room temperature)
55.1 c0-297×0.297 Test temperature: 93 ° C
55.1 c0.297X 0.297 Test temperature: -80 ° C
28
32
29.5
40
23
25
24
28
43
aUnnotched bars of square cross section were employed.bSpecimens prepared from hot-swaged (900 ° C) bars.
CSpecimens prepared from hot-rolled (900 ° C) plate.
TABLE 11 .-Impact Properties of 55 Weight PercentNickel Nitinol
Composition Test temperature, ° C Impact strength, ft-lbUnnotched Notched
"55-Nitinol" Room 117 24
-80 70 17
55.1 Ni-0.08 Fe Room 155
-80 160
220 ft/min, while for a 56 weight percent Ni altoy
(furnace cooled, 321 BHN, or quenched, 363 BHN)
the optimum cutting speed was 125 ft/min.
(6) The drilling speed of Nitinol alloys was found
to be 5 to 10 times greater when a carbide drill was
used than when the drill was made of M-33
high-speed steel.
(7) Drilling speed is very critical. A deviation in
cutting speed of only 5 ft/min from the optimum will
result in a decrease in tool life of over 50 percent.
(8) Light feeds must be used in drilling Nitinol
alloys. Feeds greater than 0.002 in./rev, will result in
very short tool life.
(9) An active cutting oil is required in order to
obtain a reasonable drill life. Drill life is extremely
short with a soluble oil cutting fluid.
(10) Silicon carbide wheels should be used in
surface grinding Nitinol alloys.
(11) A highly chlorinated oil is far more effective
than soluble oil in surface grinding.
(12) With most compositions tested, the grinding
ratio* was found not to change significantly with
changes in wheel speed over a range of 2000 to 5000-
ft./rain.
(13) In surface grinding, a down feed of 0.002
in./pass provided the best grinding ratio on all of the
alloys tested, except the 55 weight percent Ni alloy.
The maximum grinding ratio on a 55 weight percent
Ni alloy occurred at a down feed of 0.001 in./pass.
(14) In most cases, a cross feed of 0.050 in./pass
produced the best grinding ratio.
(15) Abrasive sawing appears to be the only
satisfactory method of cutting off.
(16) Tapping these alloys is very difficult. At best,
one or two holes can be obtained before the tapbreaks.
Drennen and Jackson found that the 54 weight
percent Ni alloy can be machined readily by electrical
discharge machining (ref. 65).
*Grinding ratio - Volume of metal removedVolume of wheel removed

CHAPTER 6
Chemical Properties
RESISTANCE TO CORROSION
Early tests by Buehler (ref. 68) showed that55-Nitinol was not corroded during a 96-hr salt spray
test (35 ° C, 20 percent salt solution). Neither was it
attacked by sea water, a normal air atmosphere, or
during normal handling; details of these three tests
were not given. In a later paper, Buehler and Wang
reported the results of additional experiments toevaluate the resistance of Nitinol alloys to a sea water
environment (ref. 5). These tests were carried out by
the Naval Ship Research and Development Center,
Annapolis, Maryland; the U.S. Naval Applied Science
Laboratory, Brooklyn, New York: and the Naval Ship
Research and Development Center, Caderock,
Maryland. The research involved studies of theresistance of Nitinol alloys to (1) impingement by
high-velocity sea water, (2) cavitation erosion, (3)
stress corrosion, and (4) crevice corrosion.
In the high-velocity impingement tests, commer-
cial-purity specimens of 55-Nitinol (55 and 56 weight
percent Ni nickel) were subjected to impingement bysea water at 15 to 26 ft/sec for a period of 60 days.
The weight loss varied from nil to a few mg; the size
of the specimens was not given. After testing, all
specimens retained the appearance that they had
prior to testing.
Rectangular radius-nosed bars with transverse holesdownstream were used for the cavitation-erosion
tests; once again, commercial-purity alloys containing
about 55 and 56 weight percent Ni were used. The
specimens were subjected to sea water at 117 ft/sec
for a period of 30 days. At the end of this period, the
55 weight percent Ni alloy had lost about 0.092 g and
the 56 weight percent Ni alloy had lost 0.050 g. Theformer value is about the same as found for MST 821
titanium alloy under similar test conditions.
The susceptibility of Nitinol (55 weight percent
Ni) to stress corrosion in sea water was measured on
bar specimens containing a fatigue crack at the root
of a V-notch. Such specimens, stressed at up to 100
percent of their yield stress while immersed in sea
water, showed no tendency toward the propagationof the crack. The duration of the test was not noted.
Both commercial and laboratory-prepared speci-
mens of 55-Nitinol (containing 55 weight percent Ni),
as well as a commercial-purity specimen containing
56 weight percent Ni, were exposed to stagnant sea
water. The commercial-purity material of both com-
positions became pitted during a one-year exposureto this environment; however, the pitting may have
been related to inhomogeneities and segregation
which were found in the specimens near the pitted
areas. No pitting was found on the laboratory-pre-
pared samples in a similar environment, but a
comparison cannot be made here because the expo-sure time was not given in the reference. As noted by
Buehier and Wang, additional tests in stagnant sea
water will be necessary before a definite conclusion
can be reached regarding the resistance of 55-Nitinolto this environment.
RESISTANCE TO OXIDATION
Buehler (ref. 68) studied the resistance of
55-Nitinol (nominal composition, 55 weight percent
Ni) to oxidation at 600 °, 800 °, and 1000 ° C. The
results of his experiments are given in figure 138. It
may be seen that the rate of oxidation of 55-Nitinol
increases rapidly with increasing temperature between
600 ° and 1000 ° C. Buehler noted spalling of the
oxide coating at 800 ° and 1000 ° C.Buehler found that the resistance of 55-Nitinol to
oxidation at 1000 ° C can be improved substantially
by electroplating the alloy with chromium (outer
layer) and nickel (inner layer) (ref. 69).
75

76 THEALLOYWITHA MEMORY
.11
I0--
09
.08
cm .07
="
06
-- .05o
O4
.Og
.02 8_3 °C
.01
600°C
00_ _ _ T r "r2 4 6 8 I0 12 14
Time at temperature, hr
FIGURE 138.-The effect of temperature and time on the
oxidation of 55-Nitinol (55.1 weight % Ni). (The initial
weight of each specimen was approximately 6.5g. The
surface area of the specimens was not given.)
EFFECT OF HYDROGEN ABSORPTION
Buehler and Wang conducted an experiment to
study the absorption of hydrogen by 55-Nitinol and
the effect of this absorption on the properties of the
alloy (refs. 54 and 89). A 0.020-in.-thick strip of55-Nitinol was outgassed at 10-7 tort for 24 hr at
900 ° C and then cooled to room temperature.
Hydrogen was then introduced to a pressure of8X 10-2 torr, after which the specimen was heated to
800 ° C. It was found that no hydrogen was absorbed
at temperatures up to about 500 ° C. Between 500 °
and 625 ° C, hydrogen was absorbed. After the
specimen was cooled to room temperature, it was
found that the pressure had decreased to 4X 10⁻²
tort. It was concluded that the specimen had ab-
sorbed enough hydrogen to correspond to a concen-
tration of about 150 ppm in the strip.
Furthermore, it was found that the hardness
decreased from RA 43.5 to RA 41 and the
transition-temperature range increased somewhat as a
result of the treatment. What portion of this change
might have been caused by the heating cycle and
possible vaporization of nickel or titanium during the
long holding period at 900 ° C, and how much of the
effect was actually caused by hydrogen absorption
cannot be ascertained from the published informa-tion.
Beuhring, Jackson and Wagner (ref. 64) studied the
effect of absorbed hydrogen on the tensile properties,
shape recovery, recovery force, electrical resistance,
and internal friction of 55-Nitinol (chemical analysis:
45.9 weight percent Ti). Specimens of 0.089-in.-dia-
meter wire were cathodically charged with hydrogen
in an electrolytic cell having a platinum anode. The
electrolyte was an aqueous solution of 0.02 wt
percent sulfuric acid containing 5 drops of poison per
liter of solution. The poison consisted of 2 g of
phosphorus dissolved in 40 ml of carbon disulfide.
Experiments indicated that charging the specimensfor 1 hr at a current density of 200 mA/in 2 resulted in
the desired hydrogen content of about 100 ppm.
The results of tests conducted immediately afterhydrogen charging indicated that the ultimate tensile
strength and the curves of shape recovery vs tempera-
ture, recovery force vs temperature, and electrical
resistance vs temperature were essentially the same
before and after hydrogen absorption. On the other
hand, hydrogen charging did reduce the tensile
elongation from 10 to 5.8 percent, reduce the
reduction of area from 10.9 to 4.0 percent, and
increase the yield strength from 12 500 to 15 000 psi.There was some indication that internal friction
was affected by hydrogen absorption. A characteristic
maximum, which occurred at the same temperature
as did the rapid shape recovery in uncharged
55-Nitinol, seemed to have been shifted to a slightly
lower temperature in hydrogen-charged specimens.
Scatter in the data prohibited a definite conclusion,
but, if the phenomenon is real, it could indicate that
hydrogen exerts an effect at the atomic level that is
not detectable by the other measurements.
Beuhring et al. on the same program also carried
out experiments which suggest that 55-Nitinol is not
subject to delayed brittle failure (hydrogen-stress
cracking) as a result of the absorption of over 2000
ppm of hydrogen (ref. 64).

CHAPTER7
Applications for 55-Nitinol
Many and varied applications have been envisioned
for alloys based on the NiTi intermetallic compound.Most of these applications are based on the mechani-
cal (shape) memory properties of such alloys, which
are unique in engineering alloy systems.* The mem-
ory properties that are of most interest are the ability
of the alloys to return to a present shape upon
heating, the force that is generated, and the mechani-
cal work that can be done by the alloy as it attempts
to regain its preset shape. Some applications are based
on other properties of the alloy; for instance, its
excellent damping characteristics at temperatures
below the transition-temperature range, its corrosion
resistance, its nonmagnetic nature, its low density and
its high fatigue strength.
Repeatability is required in some applications. In
these cases, it is desirable that the Nitinol part return
to its deformed shape upon cooling (after heating to
effect a change from the deformed shape to the
memory shape), so that it can revert to its memory
shape again in successive heating cycles. As usuallyheat treated, 55-Nitinol is not reversible; the memory
shape is retained upon cooling through the
transition-temperature range. However, because the
yield strength of Nitinol is low at temperatures below
the transition-temperature range, reversibility can be
effected by biasing the Nitinol element with a
common spring. When the Nitinol is heated, it exerts
sufficient force to overcome the spring completely
and perform the desired operation. On the other
hand, as soon as the Nitinol part cools through its
transition-temperature range, the spring is strong
enough to form the Nitinol into the deformed shape.
*Although, as mentioned in the section on "PhysicalMetallurgy," certain compositions in the gold-cadmium andindium-thallium systems also show a memory effect, thesealloy systems cannot be considered to be engineering alloysystems. Furthermore, it is understood that the force exertedand work done as the memory shape is recovered on heatingis very much less than with NiTi-base alloys.
In this way, the Nitinol is ready to operate on the
next heating cycle.Research at Battelle-Columbus has indicated that
reversibility can also be "built into" the alloy so that
the use of a biasing spring or similar device is not
necessary.
It should be pointed out that Nitinol is superior to
thermostatic bimetals for three reasons:
(1) The force exerted by Nitinol is much greater
than that exerted by bimetals.
(2) To obtain the same planar movement withbimetals as that obtained with Nitinol, the bimetals
would have to be heated over a very much greater
temperature range. In fact, in many cases it would be
impossible to obtain the same shape change with
bimetals as that possible with Nitinol.
(3) With Nitinol, the force and shape changes
occur over a selected and relatively narrow tempera-
ture range; above and below this range the force and
shape remain constant. With bimetals, the force and
shape changes occur gradually over the entire temper-
ature range of operation.
Many possible applications for Nitinol alloys havebeen disclosed in the literature. Others, still undis-
closed, are being examined at this time in industrial
and Government research laboratories. The primary
applications that have been made public are listed in
table 12. Space does not permit describing in detail
the manner in which Nitinol might be used in all the
applications listed in table 12. Two representative
applications will, however, be described.The first commercial application of 55-Nitinol is in
the area of self-actuating fasteners; the application is
a heat-shrinkable hydraulic coupling (trade-marked
Cryofit). In this application, a tube of a Nitinol alloy
with a transition-temperature range between liquid-ni-
trogen temperature and -54 ° C is given a memory
shape and then expanded to a larger diameter. In use,
the expanded coupling is removed from a bath of
77

78 THE ALLOY WITH A MEMORY
TABLE 12.-Suggested Applications for 55-Nitinol
Self-actuating fastenersConnector
Blind rivet (refs. 2, 55)
Self-spreading cotter pin (ref. 2)
Self-locking nut (ref. 2)
Self-erectable structures for aerospace hardware (refs. 2, 54,
55, 67, 96, 97)
Antenna (refs. 2, 54, 98)
Gravity gradient boom (ref. 54)
Passive satellite (refs. 54, 96)
Aerial (ref. 97)
Carrier of solar battery (ref. 97)
Reflector or carrier of reflector (ref. 97)
Stabilizing element (ref. 97)
Rotation-reducing element (ref. 97)
Tubes, hinged or not hinged (ref. 67)
Multistage column (ref. 67)
Compression-resistant strut (ref. 67)
Other aerospace hardware
Shutter to control temperature of satellite (ref. 67)
Sun follower, including a continuous rotary drive (ref.67)
Sun seeker (ref. 67)
Hydrospace hardware
Magnetometer boom (ref. 54)
Undersea structure (ref. 54)
Replacement for a solenoid (ref. 2)
Thermally actuated switch
Force element in a circuit breaker (ref. 2)
Current-actuated relay with a minimum of mechanical linkage(ref. 2)
Valve (refs. 91, 99)
Thermal- or electrical-to-mechanical energy transducer (refs.
55,91)
Safety devices (ref. 100)
Actuator of fire sprinkler system (refs. 54, 55, 91)Fire alarm (ref. 54)
Temperature throttle (ref. 54)
Stored-energy devices
Jack (ref. 54)
Tool for forming metals and plastics (ref. 54)
Temperature-sensing devices (refs. 11, 12, 54, 68, 91)
Toys
Military applications
Ordnance fuze (refs. 2, 92, 101)
Nonmagnetic parts for mine craft (sweeping and servicing)
(refs. 11, 12)Armor
Bioengineering devices
Device to restrain inaccessible body parts during surgery(ref. 2)
Recorder of temperature change during shipment of blood(ref. 99)
Small motor to power artificial heart (ref. 99)
Device to ease intermittant occlusion (ref. 99)
Self-tightening wire for jaw fixation following fracture of
mandible (ref. 99)
Device to aid reduction and assure approximation of long
bone fractures (ref. 99)
Vibration-damping structures
Machine mounting (ref. 54)
Towing cable (ref. 54)
Hydrofoil (ref. 68)
Advertising novelties (ref. 2)
Accumulator bottle used to maintain fluid pressure (ref. 2)
Binding to compressively stress massive glass and concrete
(ref. 54)
Clock mechanism (ref. 54)
Timer (ref. 54)
Cryogenic components (ref. 54)
liquid nitrogen and the hydraulic lines are inserted in
both ends. As the coupling warms through its
transition-temperature range, it contracts to its mem-
ory shape and firmly joins the two hydraulic lines
with very significant force. The joint is completed at
a temperature below -54 ° C.
The coupling may be removed from the hydraulic
lines, if necessary, by cooling it in liquid nitrogen. It
is understood that these couplings have successfully
passed the test procedure specified in MIL-F-18280
and are being evaluated for use in the F-14 aircraft.
The advantages of Cryofit couplings are
(1) Nondependence on operator skill for proper
installation
(2) Smaller and lighter than threaded couplings
(3) Elimination of costly, complicated tooling and
set-up time
(4) Ease of replacement of coupling or hydraulic
line

APPLICATIONS FOR 55-NITINOL79
(5) Elimination of necessity to clean surface and
purge line, as when brazing or welding is used
(6) Elimination of possibility of annealing hydrau-
lic line, as when brazing or welding is used.
Another type of application of 55-Nitinol is in
self-erectable structures for aerospace applications.
While in the previous application both the shape
recovery and the force aspects of the memory
phenomenon are used, this class of applicationexemplifies primarily the shape recovery effect. A
typical example is an antenna for use in space
satellites; this application was first examined by
Goodyear Aerospace Corporation, Akron, Ohio, un-der Air Force Contract F33615-67-C-1132 (ref. 98).
In their research, Cross et al. constructed a large
antenna that could be folded into a compact space.
When heated by radiant energy, the antenna unfolded
and became erect. Although the Nitinol material that
was used in this research had not been refined in
accordance with the more recent advances in the state
of the art of memory-heat treatment, the antenna
nevertheless was an important proof-of-principle de-
vice. Antennas, or other hardware listed in table 12,
could be compacted effectively in a satellite during
launch and later expanded to full size by solar energy
when in orbit.
These two applications, and those suggested in
table 12, are only the beginning for 55-Nitinol.
Creative design engineers are learning more and more
about the unique properties of 55-Nitinol every day.
They are finding that this alloy provides a new
dimension for them, and they are endeavoring to
learn more about its unusual properties. Accordingly,
55-Nitinol appears to have a very bright future in
both industrial and Government applications.

Conclusions
CHAPTER 8
and Recommendations
From the preceding discussions and data, it is clear
that the potential for 55-Nitinol in industrial and
Government applications is great. Nevertheless, in the
time since the early 1960's when Buehler and Wiley
at NOL discovered the unique "memory" of this
series of alloys 55-Nitinol has not come into wide use.
Two reasons are apparent: lack of commercial suppli-
ers and lack of understanding of Nitinol's properties
by design engineers.Within the past year, steps have been taken to
overcome both difficulties, and 55-Nitinol is now
available from two sources:
(1) Titanium Metals Corporation of AmericaP.O. Box 309
Toronto, Ohio 43964
Cognizant Individual:
Mr. Joseph PatrickToronto Technical Laboratory
(2) Battelle Memorial InstituteColumbus Laboratories
505 King AvenueColumbus, Ohio 43201
Cognizant Individual:Dr. Curtis M. Jackson
Associate Chief
Nonferrous Metallurgy Division
Titanium Metals Corporation of America is marketing
the material on a developmental basis, and Battelle-
Columbus, not being a manufacturer, has prepared
well-characterized research samples on a special-order
basis.
The major step forward in making data on the
alloy available to potential users has been the researchcarried out by Goodyear Aerospace Corporation and
Battelle-Columbus (ref. 63). A significant number of
industrial organizations and Government agencies are
also now investigating the properties of 55-Nitinol in
their own laboratories or having such work performed
by others. Nevertheless, additional research is re-
quired to characterize 55-Nitinol more completely
before the alloy can be used extensively in industrial
and Government applications. Moreover, it is impor-
tant that those who perform this research be cogni-
zant of the sensitivity of the alloy to chemical
composition and processing, and design their experi-ments accordingly. The authors know of quite a few
industrial organizations that, because they overlooked
this important fact, were unable to reproduce their
original results. Later research, carried out after the
processing and composition sensitivity of the alloy
was brought to their attention, yielded reproducible
results.
The specific properties and characteristics thatmust be known to make 55-Nitinol effective in
engineering applications vary, of course, with the
application. Many of these properties have been
investigated in the NASA-Langley program and havebeen summarized in this report. However, it should
be understood that these properties were found for
three particular alloy compositions that were pro-
cessed in a particular manner; because of the compo-
sition processing sensitivity of 55-Nitinol, these prop-
erties should be regarded as "ball-park" figures, which
indicate what 55-Nitinol can do, and not necessarily
the properties that one will obtain from any batch of
55-Nitinol regardless of chemical composition and the
procedures'used to process it.There are several important properties of
55-Nitinol that apparently have not been investigated
to date. It is recommended that research be con-
ducted on these properties:
(1) Fatigue strength above the transition-tempera-
ture range.
(2) Impact strength above the transition-tempera-
ture range.(3) Shelf life after memory heat treatment, while
in (a) the "memory configuration" and (b) the
81
82 THEALLOYWITHA MEMORY
"intermediateshape"(fig. 1).A varietyof otherpropertiesshouldalsobeexam-ined,dependingon theparticularapplicationthatisenvisioned.
Becauseof thestrongdependenceof thepropertiesof 55-Nitinolon the effectsof processing,theoptimizationof the propertiesof the alloyshouldincludestudiesof the effectof processingvariablessuchasthestateof stressimposedduringdeforma-tionof thememoryconfiguration to the intermediate
shape (fig. 1), the time and temperature of the
memory heat treatment, and the applied stress during
the memory heat treatment. These and other process-
ing variables can strongly affect the properties of55-Nitinol.
The aforementioned recommendations have con-
cerned the empirical characterization of 55-Nitinol.
However, as noted in the section entitled "Physical
Metallurgy," neither the atom movements responsible
for the "memory" in 55-Nitinol nor the equilibrium
structures in Nitinol alloys have yet been proven
conclusively. Until these problems are solved, the
optimization of the properties of the alloy must, of
necessity, be carried out in a strictly empiricalmanner. To obtain basic information that is needed as
a guideline for applied research, basic research must
be conducted to identify the equilibrium phases in
55-Nitinol and the atomic mechanism responsible for
the memory properties. It is important that this
research be carried out over a range of chemical
composition on alloys which are melted, cast, and
processed under very carefully selected and well
documented procedures, and that at least two (more
than two would be preferable) properties be mea-
sured. The research should include not only macro-scopic property measurements but also examinations
by means of light and electron microscopy and X-ray
and/or electron diffraction. Although much of the
research can be carried out by using polycrystalline
specimens, additional single-crystal research on veryrigorously characterized material seems essential for
the firm determination of equilibrium structures.

References
1. Buehler, W. J.; and Wiley, R. C.: Nickel-Base Alloys. U. S.
Patent 3,174,851, Mar. 23, 1965.
2. Wagner, H. J.; and Jackson, C. M.: What You Can Do WithThat "Memory" Alloy .... Materials Engineering, Vol.
70, No. 4, Oct. 1969, pp. 28-31.
3. Drennen, D. C.; Jackson, C. M.; and Wagner, H. J.:
Metallurgical Services in Connection With Nitinol Wire.
Summary Rept., Contract NAS 1-7522, Battelle Memorial
Institute, June 14, 1968.
4. Cross, W. B.; Kariotis, A. H.; and Stimler, F. J.: Nitinol
Characterization Study. NASA CR-1433, Sept. 1969.
5. Buehler, W. J.; and Wang, F. E.: A Summary of Recent
Research on the Nitinol Alloys and Their Potential
Application in Ocean Engineering. Ocean Engineering,
Vol. 1, 1968, pp. 105-120.
6. Laves, F.; and Wallbaum, H. J.: Zur Kristallchemie Von
Titan-Legierungen. Naturwissenschaften, Vol. 27, 1939,
pp. 674-675.7. Margolin, H.; Ence, E.; and Nielsen, J. P.: Titanium-Nickel
Phase Diagram. Transactions of AIME, Vol. 197, 1953,
pp. 243-247.8. Poole, D. M.; and Hume-Rothery, W.; The Equilibrium
Diagram of the System Nickel-Titanium. J. Inst. Metals,
Vol. 83, 1954, pp. 473-480.
9. Duwez, P.; and Taylor, J. L.: Structure of IntermediatePhases in Alloys of Titanium With Iron, Cobalt, and
Nickel. Transactions of AIME, Vol. 188, 1950, pp.
1173-1176.
10. Purdy, G. R.; and Parr, J. G.: Study of Titanium-Nickel
System Between Ti 2 Ni and TiNi. Transactions of AIME,
Vol. 221, 1961, pp. 636-639.
11. Buehler, W. J.; and Wiley, R. C.: TiNi - Ductile
Intermetallic Compound. Transactions of ASM, Vol. 55,
1962, pp. 269-276.
12. Buehler, W. J.; and Wiley, R. C.: The Properites of TiNiand Associated Phases. Rept. NOLTR 61-75 (AD
266607), U.S. Naval Ordnance Laboratory, Aug. 3,
1961.
13. Buehler, W. J.; Gilfrich, J. V.; and Wiley, R. C.: Effect of
Low-Temperature Phase Changes on the Mechanical
Properties of Alloys Near Composition TiNi. J. Appl.
Phys., Vol. 34, 1963, pp. 1475-1477.14. Gilfrich, J. V.: X-ray Diffraction Studies on the Ti-
tanium-Nickel System., Vol. 6. Advances in X-ray
Analysis. Proceedings of the Eleventh Annual Confer-
ence on Application of X-ray Analysis, Plenum Press
(New York), 1963, pp. 74-84.15. Koskimaki, D.; Marcinkowski, M. J.; and Sastri, A. S.:
Solid State Diffusional Transformations in the Near-
Equiatomic Ni-Ti Alloys. Transactions of the Metallurgi-
cal Society of AIME, Vol. 245; 1969, pp. 1883-1890.
16. Wasilewski, R. J.: Elastic-Modulus Anomaly in TiNi.
Transactions of AIME, Vol. 233, 1965, pp. 1691-.1693.
17. Wang, F. E.; Buehler, W. T.; and Pickart, S. J.: Crystal
Structure and a Unique "Martensitic" Transition of TiNi.
J. Appl. Phys., Vol. 36, 1965, pp. 3232-3239.
18. Dautovich, D. P.; and Purdy, G. R.: Phase Trans-formations in TiNi. Canadian Metallurgical Quarterly,
Vol. 4, 1965, pp. 129-143.
19. Rozner, A. G.; and Wasilewski, R. J.: Tensile Propertiesof NiAI and NiTi. J. Inst. Metals, Vol. 94, 1966, pp.
169-175.
20. Zijderveld, J. A.; deLange, R. G.; and Verbraak, C. A.:La Transformation Martensitique des Alliages Titane-
Nickel Au Voisinage de La Composition Equiatomique.
Memoires Scientifiques Revue de MetaUurgie, Vol. 63,
1966, pp. 885-888.21. Wasilewski, R. J.; Butler, S. R., and Hanlon, J. E.: On
the Martensitic Transformation in TiNi. Metal Sci. J.,
Vol. 1, 1967, pp. 104-110.
22. Hanlon, J. E.; Butler, S. R., and Wasilewski, R. J.: Effect
of Martensitic Transformation on the Electrical and
Magnetic Properties of NiTi. Transactions of the Metal-
lurgical Society of AIME, Vol. 239, 1967, pp.
1323-1327.
23. Wasilewski, R. J.; Butler, S. R.; Hanlon, J.; and Worden,
D.: Discussion of "Solid State Diffusional Transforma-
tions in the Near-Equiatomic NiTi Alloys. Metallurgical
Transactions, Vol. 1, 1970, pp. 1459-1460.
24. Wasilewski, R. J.; Butler, S. R.; Hanlon, J. E.; and
Worden, D.: The Structure Homogeneity Range in TiNi.
J. Metals, Vol. 21, No. 3, 1969, pp. 41A-42A. Submitted
to Metallurgical Transactions, 1970.
25. Mueller, M. H.; and Knott, H. W.: "The Crystal
Structures of Ti_Cu, Ti2Ni, Ti4Ni_O, and Ti4Cu20.
Transactions of the Metallurgical Society of AIME, Vol.
227, 1963, pp. 674-678.
26. Rozner, A. G., Heintzelman, E. F.; Buehler, W. J.; and
Gilfrich, J. V.: Effect of Addition of Oxygen, Nitrogen
and Hydrogen on Microstructure and Hardness of Cast
TiNi Intermetallic Compound. Transactions of ASM,
Vol. 58, 1965, pp. 415-418.
27. Taylor, A.; and Floyd, R. W.: Precision Measurements of
Lattice Parameters of Non-Cubic Crystals. Acta Crystal-
lographica, Vol. 3, 1950, pp. 285-289.
28. Laves, F.; and Watlbaum, H. J.: The Crystal Structure of
Ni3Ti and Ni_Ti. Zeitschrift fur KristaUographie, Vol.
A101, 1939, pp. 78-93.
29. Taylor, A.; and Floyd, R. W.: The Constitution of
Nickel-Rich Alloys of the Nickel-Chrominm-Titanium
System. J. Inst. Metals, Vol. 80, 1952, pp. 577-587.
30. Stuwe, H. P.; and Shimomura, Y.: Gitterkonstanten der
83
84 THEALLOYWITHA MEMORY
Kubisch Raumzentrierten Phasen FeTi, CoTi, NiTi.
Zeitschrift fur Metallkunde, Vol. 51, 1960, pp. 180-181.
31. Pietrokowsky, P.; and Youngkin, F. G.: Ordering in the
Intermediate Phases TiFe, TiCo, and TiNi. J. Appl. Phys.Vol. 31, 1960, pp. 1763-1766.
32. Wang, F. E.; Syeles, A. M.; Clark, W. L.; and Buehler, W.J.: Growth of TiNi Single Crystals by a Modified
"Strain-Anneal" Technique. J. Appl. Phys., Vol. 35,1964, p. 3620.
33. Buehler, W. J.; and Wang, F. E.: Martensitic Trans-
formations in the TiNi Compound. Reactivity in Solids.
Proceedings of the 5th International Symposium
(Munich), 1964, Elsevier Publishing Company (Amster-dam), 1965, pp. 79-89.
34. Kubaschewski, O.: The Heats of Formation in the
System Aluminum + Nickel + Titanium. Transactions of
the Faraday Society, Vol. 54, 1958, pp. 814-820.35. Chang, L. C.; and Read, T. A.: Plastic Deformation and
Diffusionless Phase Changes in Metals-The Gold-
Cadmium Beta Phase. Transactions of AIME, Vol. 191,1951, pp. 47-52.
36. Sastri, A. S.; Marcinkowski, M. J.; and Koskimaki, D.:
Nature of the NiTi Martensite Transformation. PhysicaStatus Solidi, Vol. 25, 1968, pp. K67-K69.
37. Marcinkowski, M. J.; Sastri, A. S.; and Koskimaki, K.:
Martensitic Behaviour in the Equi-Atomic NiTi Alloy.Phil. Mag., Vol. 18, 1968, pp. 945-958.
38. Sastri, A. S.; and Marcinkowski, M. J.: Deformation
Behavior in the Near-Equiatomic NiTi Alloys. Trans-
actions of the Metallurgical Society of AIME, Vol. 242,1968, pp. 2393-2398.
39. Pfeifer, H-U.; Bhan, S.; and Schubert, K: Zum Aufbau
Des Systems Ti-Ni-Cu Und Einiger Quasihomologer
Legierungen. J. Less Common Metals, Vol. 14, 1968, pp.291-302.
40. Dautovich, D. P.; Melkvi, Z.; Purdy, G. R.; and Stager, C.V.: Calorimetric Study of a Diffusionless Phase Trans-
formation in TiNi. J. Appl. Phys., Vol. 37, 1966, pp.2513-2514.
41. Wasilewski, R. J.: Personal communication to G. R.Purdy, 1965.
42. Freise, E.: Personal communication to R. J. Wasilewski,Northwestern University, 1967.
43. Starke, E. A.; and Lee, E. U.: Observations of "Side-
Bands" on X-ray Patterns of the Intermetallic Com-
pound TiNi. Materials Res. Bull., Vol. 2, 1967, pp.231-239.
44. Wang, F. E.; DeSavage, B. F.; Buehler, W. J.; and Hosler,
W. R.: The Irreversible Critical Range in the TiNi
Transition. J. Appl. Phys., Vol. 39, 1968, pp.2166-2175.
45. Lieberman, D. S.; Wechsler, M. S.; and Read, T. A.:
Cubic to Orthorhombic Diffusionless Phase Change-
Experimental and Theoretical Studies of AuCd. J. Appl.Phys., Vol. 26, 1955, pp. 473-484.
46. Burkart, M. W.; and Read, T. A.: Diffusionless Phase
Change in the Indium-Thallium System. Transactions ofAIME, Vol. 197, 1953, pp. 1516-1524.
47. Chang, L. C.: On Diffusionless Transformation in Au-Cd
Single Crystals Containing 47.5 Atomic Percent Cad-
mium: Characteristics of Single-Interface Transforma-
tions. J. Appl. Phys., Vol. 23, 1952, pp. 725-728.48. Lieberman, D. S.: Phase Transformations. ASM Seminar
(Detroit), 1968.
49. Ball, A.; Bergersen, S. G.; and Hutchison, M. M.: Effect
of Room-Temperature Prestrain on the Tensile Prop-erties of the Intermetallic Compound NiTi in the
Temperature Range 150 ° to 370 ° C. Proceedings of the
International Conference on the Strength of Metals and
Alloys, transactions of the Japan Institute of Metals,
Vol. 9 (supplement), 1968, pp. 291-295.
50. DeLange, R. G., and Zijderveld, J. A.: Shape-Memory
Effect and the Martensitic Transformation of TiNi. J.
Appl. Phys., Vol. 39, 1968, pp. 2195-2200.
51. Chandra, K.; and Purdy, G. R.: Observations of Th_n
Crystals of TiNi in Premartensitic States. J. Appl. Phys.,Vol. 39, 1969, pp. 2176-2181.
52. Iwasaki, K.; and Hasiguti, R. R.: Antiphase Boundaries
in Ti50-Ni50 Alloys. Paper presented at the 3rd Bolton
Landing Conference on Ordered Alloys (Lake George, N.Y.) 1969.
53. Otsuka, K.; and Shimizu, K.: Precipitation Process in
Ti-50Ni. Paper presented at the 62nd Annual Meeting ofthe Japan Institute of Metals, 1968.
54. Buehler, W. J.; and Wang, F. E.: Study of Transition
Element Intermetallic Compounds. Paper presented at
the Ninth Navy Science Symposium (Washington, D.C.)1966.
55. Buehler, W. J.; and Cross, W. B.: 55-Nitinol, Unique Wire
Alloy with a Memory. Wire J., Vol. 2, June 1969, pp.41-49.
56. Drennen, D. C.; Jackson, C. M.; and Wagner, H. J.: The
Development of Melting and Casting Procedures for
Nitinol Nickel-Base Alloys. Rept. SC-CR-69-3070, Con-
tract 16-7540, Battelle Memorial Institute, Dec. 1968.
57. Buehler, W. J.; and Cross, W. B.: 55-Nitinol, Unique Wire
Alloy with a Memory. Wire J., Vol. 2, June, 1969, pp.41-49.
58. Drennen, D. C.; Jackson, C. M.; and Wagner, H. J.:
A Study of the Homogeneity of a Large Ingot of a
Nitinol Alloy. Final Rept., Contract FAO-16-8835,Battelle Memorial Institute, Nov. 21, 1969.
59. Hanlon, J. E.; Butler, S. R.,and Wasilewski, R. J.: Effect
of Martensitic Transformation on the Electrical and
Magnetic Properties of NiTi. Transactions of the Metal-
lurgical Society of AIME, Vol. 239, 1967, pp.1323-1327.
60. Wang, F. E.; Syeles, A. M.; Clark, W. L., and Buehler, W.
J.: Growth of TiNi Single Crystals by a Modified
"Strain-Anneal" Technique. J. Appl. Phys., Vol. 35,1964, p. 3620.
61. Wang, F. E.; Syeles, A. M.; Clark, W. L.; and Buehler, W.
J.: Method for Growing Single Crystals. U.S. Patent3,352,722, Nov. 14, 1967.
62. Buehler, W. J.; and Wang, F. E.: Martensitic Trans-
formations in the TiNi Compound. Reactivity in Solids,
Proceedings of the 5th International Symposium
(Munich), 1964, Elsevier Publishing Company (Amster-dam), 1965, pp. 79-89.
63. Cross, W. B.; Kariotis, A. H., and Stimler, F. J.: Nitinol

REFERENCES 85
Characterization Study. NASA CR-1433, Sept. 1969.
64. Beuhring, V. F.; Jackson, C. M.; and Wagner, H. J.: The
Effect of Thermal Cycling and Hydrogen Absorption on
Selected Properties of 55-Nitinol. Final Rept. BMI-X-
579, Contract SANL 613/040 on AEC Contract
W-7405-eng-92, Battelle Memorial Institute, Sept. 15,
1969.
65. Drennen, D. C.; and Jackson, C. M.: The Preparation of
Research Samples of 55-Nitinol. Final Rept., Contract
SANL 613/066 on AEC Contract W-7405-eng-92,
Battelle Memorial Institute, Oct. 18, 1969.
66. Cooper, J. E.; Bowker, D. E.; and Cross, W. B.:
Investigation of the Unique Memory Properties of
55-Nitinol Alloy. Materials and Processes for the 1970's.
Proceedings of the 15th Annual Symposium of the
Society of Aerospace Material and Process Engineers,
1969.
67. Schuerch, H. U.: Certain Physical Properties and Appli-
cations of Nitinol. NASA CR-1232, Nov. 1968.
68. Buehler, W. J.: "lntermetallic Compound Based Ma-
terials for Structural Applications." Proceedings of the
Seventh Navy Science Symposium, Rept. ONR-16, vol. 1
(AD 421708), 1963, pp. 1-30.
69. Buehler, W. J.: Personal communication to D. C.
Drennen and C. M. Jackson. U. S. Naval Ordnance
Laboratory, 1968.
70. Cooper, J. E.; Bowker, D. E.; and Cross, W. B.:
Investigation of the Unique Memory Properties of
55-Nitinol Alloy. Materials and Processes for the 1970's.
Proceedings of the 15th Annual Symposium of the
Society of Aerospace Material and Process Engineers,
1969.
71. Drennen, D. C.; Jackson, C. M.; and Wagner, H. J.:
Metallurgical Services in Connection With Nitinol Wire.
Summary Rept., Contract NAS 1-7522, Battelle Me-
morial Institute, June 14, 1968.
72. Buehler, W. J.; Gilfrich, J. V.; and Wiley, R. C.: Effect of
Low-Temperature Phase Changes on the Mechanical
Properties of Alloys Near Composition of TiNi. J. Appl.
Phys., Vol. 34, 1963, pp. 1475-1477.
73. Rozner, A. G., and Buehler, W. J.: Low Temperature
Deformation of the TiNi Intermetallic Compound. Rept.
NOLTR 66-38, U.S. Naval Ordnance Laboratory, Mar. 1,
1966.
74. Buehler, W. J.; and Wiley, R. C.: The Properties of TiNi
and Associated Phases. Rept. NOLTR 61-75 (AD
266607), U.S. Naval Ordnance Laboratory, Aug. 3,
1961.
75. Goff, J. F.: Thermal Conductivity, Thermoelectric
Power, and the Electrical Resistivity of StoichiometricTiNi in the 3° to 300 ° K Temperature Range, J. Appl.
Phys., V01. 35, 1964, pp. 2929-2927.
76. Gilfrich, J. V.: X-ray Diffraction Studies on the Ti-
tanium-Nickel System. Vol. 6: Advances in X-ray Analy-
sis. Proceedings of the Eleventh Annual Conference on
Application of X-ray Analysis, Plenum Press (New
York), 1963, pp. 74-84.
77. Wang, F. E.; DeSavage, B. F.; Buehler, W. J.; and Hosler,W. R.: The Irreversible Critical Range in the TiNi
Transition. Symposium on TiNi and Associated Com-
pounds, NOLTR 68-16, U.S. Naval Ordnance Labora-
tory, Feb. 20, 1968, pp. 8-1-8-24.
78. Allgaier, R. S.: Analysis of the Hall Coefficient Behavior
in TiFe, TiCo, TiNi, and Their Alloys. Symposium on
TiNi and Associated Compounds, NOLTR 68-16, U.S.
Naval Ordnance Laboratory, Feb. 20, 1968, pp.
121-126.
79. Bradley, D.: Sound Propagation in Near-Stoichiometric
TiNi Alloys. J. Acoust. Soc. Am., Vol. 37, no. 4, 1965,
pp. 700-702.80. Rozner, A. G.; and Spinner, S.: Some Consideration of
the Elastic Properties of TiNi in the Vicinity of
Transformation Temperature. Symposium on TiNi and
Associated Compounds, NOLTR 68-16, U.S. Naval
Ordnance Laboratory, Feb. 20, 1968, pp. 6-1 - 6-19.
81. Spinner, S.; and Rozner, A. G.: Elastic Properties of NiTi
as a Function of Temperature. J. Acoust. Soc. Am., Vol.
40, No. 5, 1966, pp. 1009-1015.
82. Hasiguti, R. R.; and Iwasaki, K.: Internal Friction and
Related Properties of TiNi lntermetallic Compound.
Symposium on TiNi and Associated Compounds,
NOLTR 68-16, U.S. Naval Ordnance Laboratory, Feb.
20, 1968, pp. 4-1 -4-12.
83. Hasiguti, R. R.; and lwasaki, K.: Correlations BetweenPlastic Deformation and Phase Change in the Compound
TiNi with Special Reference to Internal Friction. Pro-
ceedings of the International Conference on the Strength
of Metals and Alloys, transactions of the Japan
Institute of Metals (supplement), Vol. 9, 1968,
pp. 288-291.84. Berman, H. A.; West, E. F.; and Rozner, A. G.:
Anomolous Heat Capacity of TiNi. J. Appl. Phys., Vol.
38, 1967, 4473-4476.
85. Bragg, W. L.; and Williams, E. J.: The Effect of Thermal
Agitation on Atomic Arrangement in Alloys. Proceedings
of the Royal Society, Vol. A145, 1934, pp. 699-730.
86. Bragg, W. L.; and Williams, E. J.: The Effect of Thermal
Agitation on Atomic Arrangement in Alloys -II.
Proceedings of the Royal Society, Vol. A 151, 1935, pp.
540-566.
87. Goff, J. F.: Dependence of the Transport Properties of
Transition Metal Alloys and Compounds on the Electron
Number. Symposium on TiNi and Associated Com-
pounds, NOLTR 68-16, U.S. Naval Ordnance Labora-
tory, Feb. 20, 1968, pp. 9-1 - 9-7.88. Rozner, A. G.; and Buehler, W. J.: Effect of Cold Work
on Room Temperature Tensile Properties of TiNi Inter-
metallic Compound. Transactions of ASM, Vol. 59,
1966, pp. 350-352.89. Wang, F. E.: The Mechanical Properties as a Function of
Temperature and Free Electron Concentration in Stoi-
chiometric TiNi, TiCo and TiFe Alloys. Proceedings of
the International Conference on Fracture (Sendai,
Japan), 1965, pp. 899-908.90. Scholl, R.; Larson, D. J., Jr.; and Freise, E. J.: A Study
of the Relative Ductilities of TiFe, TiCo and TiNi.
Symposium on TiNi and Associated Compounds,
NOLTR 68-16, U.S. Naval Ordnance Laboratory, Feb.
20, 1968, pp. 18-1 - 18-14.
91. Buehler, W. J.; and Goldstein, D. M.: Conversion of Heat

86 THE ALLOY WITH A MEMORY
Energy to Mechanical Energy, U.S. Patent 3,403,238,Sept. 24, 1968.
92. Marks, R.: Personal communication to C. M. Jackson
and H. J. Wagner. U.S. Army, Harry Diamond Laborato-ries, Sept. 1968.
93. Goldstein, D. M.; Buehler, W. J.; and Wiley, R. C.:
Effects of Alloying Upon Certain Properties of 55.1
Nitinol. Rept. NOLTR 64-235, U.S. Naval OrdnanceLaboratory, May 28, 1965.
94. Anon.: 55 Nitinol Alloys. U.S. Naval Ordnance Labora-tory, Apr. 1967.
95. Gould, J. V.: Machinability of Nickel-Titanium Alloys.Contract N60921-6814 (AD 419009), Metcut ResearchAssociates, Inc., June 24, 1963.
96. Johnson, J. F., Reiser, D., and Ovrevik, G. S.: Erectable
Structure for a Space Environment. U.S. Patent3,391,882, July 9, 1968.
97. Anon.: Improvements in or Relating to Space Vehicles.
Nederlandse Organisatie voor Toegepastnatuurwetensch-appelijk Onderzoek ten Behoeve van Nijverheid, Handel
en Verkeer. British Patent 1,116,158, June 6, 1968.
98. Cross, W. B.: Personal communication to C. M. Jackson.Jan. 25, 1968.
99. Heisterkamp, C. A., III; Buehler, W. J.; and Wang, F. E.:
55-Nitinol-A New Biomaterial. Paper presented at the
8th International Conference on Medical and BiomedicalEngineering (Chicago), 1969.
100. Frei, E. H.; Leibinzohn, S.; and Shtrikman: Thermally
Actuated Devices. U.S. Patent 3,285,470, Nov. 15,1966.
101. Rothwarf, F.; Auerbach, A.; and Ford, D. R.: Feasibilityof Using Memory Metal Effects for Fuze Applications:
A. The Use of Martensite Materials in the Design of
Thermally Activated Springs. Memorandum Rept.M68-38-1, Department of the Army, Frankford Arse-nal, Nov. 1968.
U. S_ GOVERNMENT PRINTING OFFICE : 1972 O - 469-815