case filings - courtswv.gov
TRANSCRIPT
1999 STATISTICAL REPORT
CASE FILINGS
Record Number of Petitions Filed in 1999
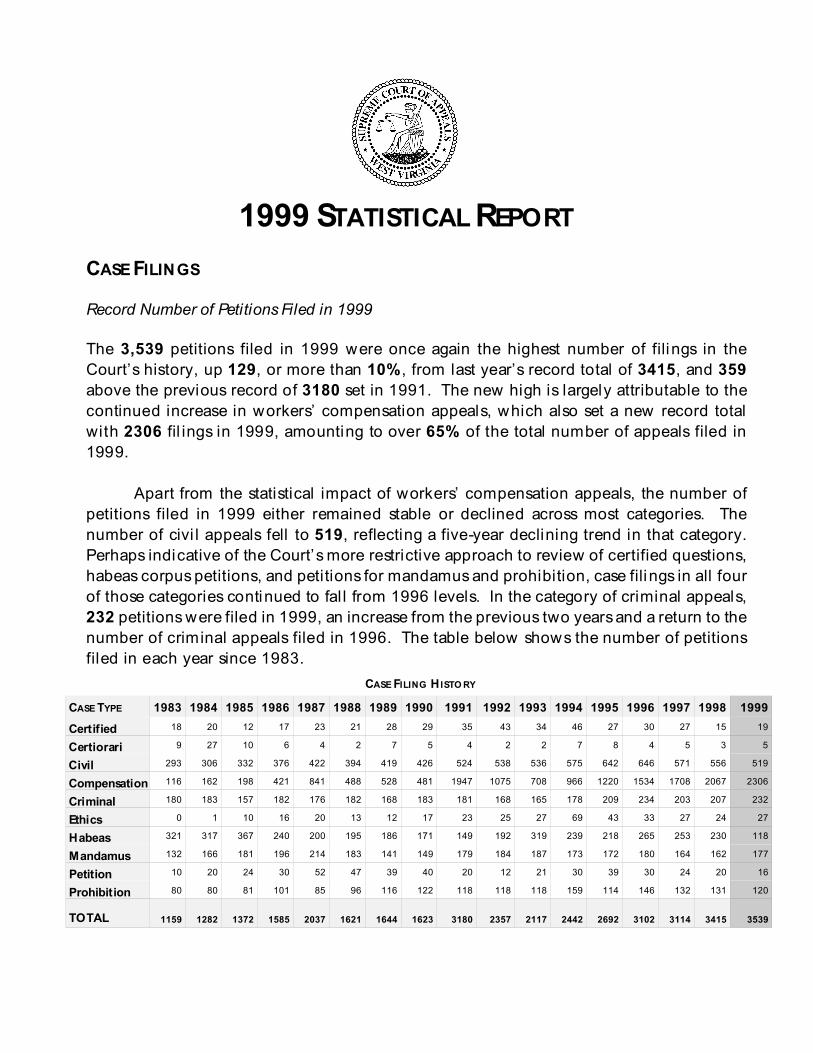
The 3,539 petitions filed in 1999 were once again the highest number of filings in the
Court’s history, up 129, or more than 10%, from last year’s record total of 3415, and 359
above the previous record of 3180 set in 1991. The new high is largely attributable to the
continued increase in workers’ compensation appeals, which also set a new record total
with 2306 fil ings in 1999, amounting to over 65% of the total number of appeals filed in
1999.
Apart from the statistical impact of workers’ compensation appeals, the number of
petitions filed in 1999 either remained stable or declined across most categories. The
number of civi l appeals fell to 519, reflecting a five-year declining trend in that category.
Perhaps indicative of the Court’s more restrictive approach to review of certified questions,
habeas corpus petitions, and petitions for mandamus and prohibition, case filings in all four
of those categories continued to fal l from 1996 levels. In the category of criminal appeals,
232 petitions were filed in 1999, an increase from the previous two years and a return to the
number of criminal appeals filed in 1996. The table below shows the number of petitions
filed in each year since 1983.
CASE FILING H ISTO RY
CASE TYPE 1983 1984 1985 1986 1987 1988 1989 1990 1991 1992 1993 1994 1995 1996 1997 1998 1999
Certified 18 20 12 17 23 21 28 29 35 43 34 46 27 30 27 15 19
Certiorari 9 27 10 6 4 2 7 5 4 2 2 7 8 4 5 3 5
Civil 293 306 332 376 422 394 419 426 524 538 536 575 642 646 571 556 519
Compensation 116 162 198 421 841 488 528 481 1947 1075 708 966 1220 1534 1708 2067 2306
Criminal 180 183 157 182 176 182 168 183 181 168 165 178 209 234 203 207 232
Ethics 0 1 10 16 20 13 12 17 23 25 27 69 43 33 27 24 27
Habeas 321 317 367 240 200 195 186 171 149 192 319 239 218 265 253 230 118
Mandamus 132 166 181 196 214 183 141 149 179 184 187 173 172 180 164 162 177
Petition 10 20 24 30 52 47 39 40 20 12 21 30 39 30 24 20 16
Prohibition 80 80 81 101 85 96 116 122 118 118 118 159 114 146 132 131 120
TOTAL 1159 1282 1372 1585 2037 1621 1644 1623 3180 2357 2117 2442 2692 3102 3114 3415 3539

Supreme Court of Appeals 1999 Statist ical Report Page 2
In the past sixteen years, the
Court has experienced steady and
significant growth in the number of
workers’ compensation fi l ings. In
1983, workers’ compensation
fi l ings comprised only one out of
every ten cases fi led in the Supreme
Court. In 1999, by contrast,
workers’ compensation appeals
comprised fully two-thirds of all
appeals filed. This year, the number
of workers’ compensation fil ings
alone exceeds the total for all
appeals filed as recently as 1993.
The chart pictured below
reflects that overall, the trend has
been toward a steady increase in
the percentage of w orkers’
compensation cases relative to the total number of cases filed. The high number of fil ings
in 1991 and 1992 resulted from the effort to clear a backlog of cases at the administrative
level. What was seen then as an unusually large number of fi l ings has become routine in
the past two years. The trend is projected to continue, requiring the Court to devote
increased resources and innovative structures to address the continually burgeoning
caseload in this category.

Supreme Court of Appeals 1999 Statist ical Report Page 3
Total 1999
Petitions
Considered
1999
Percentage
Granted
Certified 17 35%
Certiorari 6 67%
Civi l 456 30%
Civil - Administrative 11 36%
Civil - Abuse & Neglect 96 11%
Compensation 1874 51%
Criminal 234 18%
Ethics 27 100%
Habeas Corpus 108 .05%
M andamus 132 30%
Peti ti on for Bail 16 0%
Prohibition 113 27%
WORKLOAD AND OUTCOMES
Petitions
In 1999, the Court considered a
total of 3090 petitions for appeal, or
87% of the total fi l ings for the year.
Previous years’ statistical reports have
calculated the percentage of cases
granted relative to the total number of
fi l ings; this year the percentage of cases
granted is shown relative to the number
of petitions actually considered by the
Court. This method should more
accurately reflect the workload of the
Court and actual outcomes at the
petition stage. Review in Ethics cases is
non-discretionary. On average, all
state courts of last resort granted only
10 percent of discretionary petitions
considered in 1997.
Excluding compensation fi l ings, the Court considered a total of 1189 substantive
petitions in 1999. Of the cases presented at petition conference, 25% were granted, 58%
refused, and 15% w ere accepted for presentation on the motion docket. Nearly half, or
47%, of the cases accepted for presentation on the motion docket were ultimately granted.
It is significant to note that, of the large number of workers’ compensation petitions
considered by the Court, 18% were dismissed or withdrawn, in large part reflective of the
work of the Workers’ Compensation Mediation Project, which resulted in 410 settlements
through mediation in 1999.
Granted Cases & O ther Matters
The Court’s workload does not conclude upon the consideration of petitions. Once
a case is granted, the Court must review the record, receive briefs from the parties, hear oral
argument in selected cases, and ultimately issue an opinion or order disposing of the case.
In addition to considering 3090 petitions for appeal last year, the Court also issued final
substantive decisions in 1,154 cases. The Court disposed of 324 cases by written opinion,
and disposed of 830 workers’ compensation cases by memorandum order. Other cases

Supreme Court of Appeals 1999 Statist ical Report Page 4
were dismissed or withdrawn and were disposed of by order. After opinions are issued,
parties have the opportuni ty to file petitions for rehearing. During 1999, the Court
considered 47 Petitions for Rehearing, only 3 of which were granted.
In addi tion to issuing decisions that dispose of a given case, in many instances the
Court considers and rules upon miscellaneous motions filed by parties while a petition or
a granted case is pending. In 1999 the Court decided approximately 2,000 of these
miscellaneous motions.
As the ultimate authority for regulation of the practice of law in W est Virginia, the
Court also reviews numerous disciplinary and bar admission matters throughout the year.
In 1999, the Court considered approximately 50 bar admission and disciplinary matters.
The Court also admitted 277 prospective attorneys to the practice of law in W est Virginia
through formal courtroom ceremonies.
An additional function of the Court is the consideration and adoption of new and
revised court rules governing various aspects of pleading, practice and procedure in West
Virginia. Consideration of rules matters often requires careful review of existing rules, public
comment, and desired objectives. In 1999 the Court considered and adopted: significant
revisions to the Rules of Lawyer Discipl inary Procedure; new Rules Governing Post-
Conviction H abeas Corpus Proceedings; and new West Virginia Trial Court Rules.
SUMMARY: SELECTED 1999 SUPREME COURT WORKLOAD MEASURES
324 Majority Opinions Issued 3 Sets of New or Revised Rules Issued
67 Separate Opinions Issued 50 Discipl inary/Admission Matters
843 Comp. Cases Decided by Memo Order 2,000+ Miscellaneous Motions Decided
Important aspects of the Court’s workload are not reflected in the foregoing statistical
summary. For example, in each case considered by the Court, staff members in the Clerk’s
Office prepare and mail multiple orders to the parties concerning the Court’s action on a
case. The Clerk’s Office produces approximately 20,000 orders per year. Since the Court’s
inception in 1863, each order has been recorded in bound 11 x 17 inch Order Books
maintained in the Clerk’s Office. A review of the capacity of these standard Order Books
gives a good indication of the expansion of the amount of the Court’s paperwork over the
years. Order Book #1 contained handwritten notations of the Court’s work spanning nearly
six years. Order Book #50, by this time containing typewritten orders, contains material
beginning June 1938 and ending October 1939. By the mid-1970's, Order Book #75
contained one year of material. By contrast, today’s Order Books routinely number over 500
pages each and contain only eight weeks of material.

Supreme Court of Appeals 1999 Statist ical Report Page 5
CASELOAD COMPARISON WITH COMPARABLE COURTS
Along with California, West Virginia is described by the National Center for StateCourts as being “beset by [an] incredibly high caseload” in 1998.
West Virginia is one of only ten states without an intermediate appellate court (“ IAC”). In the
past decade, Mississippi, Nebraska, North Dakota, and Utah have all created intermediate appellatecourts, despite having caseloads smaller than ours. No other comparable appellate court in the countryhandles as many cases as this Court. The most recent (1998) data from the National Center for StateCourts confirms this Court’s continued position as the busiest appellate court of its type in the country.In 1998, our Court’s caseload was more than 1.5 times that of the next busiest state, Nevada, and morethan the states of Delaware, Montana, Rhode Island, South Dakota, Vermont, and Wyoming,combined. The chart below illustrates the comparable caseload figures for the past fifteen years.
CASELO AD CO M PARI SO N W I TH CO M PARABLE CO U RTS
1984 1985 1986 1987 1988 1989 1990 1991 1992 1993 1994 1995 1996 1997 1998
DELAW ARE 331 409 420 401 410 485 484 473 530 542 488 530 532 551 554
MAI N E NA 602 579 631 507 452 622 646 569 NA 1038 988 841 724 778
M ISSISSIPPI 840 819 1013 893 793 872 1025 992 1025 1182 1073 IAC IAC IAC IAC
MO N TAN A NA 639 602 571 655 618 633 636 533 659 744 599 832 872 731
NEBRASKA 1002 997 1014 1196 1094 1277 1270 834 IAC IAC IAC IAC IAC IAC IAC
NEVAD A 799 777 853 856 922 1047 1089 1080 1129 1138 1256 1350 1911 1835 1943
NEW HAMPSHIRE 603 574 534 516 543 532 627 597 774 864 880 892 850 915 839
NO RTH DAKOTA 370 338 377 382 IAC IAC IAC IAC IAC IAC IAC IAC IAC IAC IAC
RH O D E ISLAN D 611 691 557 542 581 565 624 646 681 737 760 762 674 686 623
SO U TH DAKOTA 370 375 395 449 463 484 452 397 382 426 408 425 465 423 457
UTAH 712 670 674 IAC IAC IAC IAC IAC IAC IAC IAC IAC IAC IAC IAC
VERM O N T 648 594 574 569 625 659 622 578 636 649 657 675 653 582 582
WEST VIRGINIA 1282 1372 1585 2037 1621 1644 1623 3180 2357 2113 2442 2962 3102 3114 3415
WYO M I N G 331 306 342 320 334 363 314 301 302 306 335 345 357 380 381
This high comparable caseload is not solely attributable to workers’ compensation appeals. ThisCourt considers more than twice the number of original jurisdiction proceedings (523 in 1998) thanthe next busiest state, Nevada (248 in 1998). In fact, of the states without an IAC, four states had fewerthan 80 original jurisdiction proceedings filed in 1998: Delaware (33); Wyoming (60); South Dakota(76); and Vermont (9).
With 189 discretionary appeals per 100,000 in population, West Virginia’s appeal rate is“relatively high” for its population. In fact, West Virginia ranks second only to California among allCourts of Last Resort in the number of appeals filed per appellate court judge. With discretionaryappeals per judge in California at 1,232 and West Virginia at 683, the National Center for State Courtsdescribed the states as being “beset by incredibly high caseloads.” See B. Ostrum & N. Kauder, eds.,Examining the Work of State Courts, 1998: A National Perspective from the Court Statistics Project at87-88 (National Center for State Courts 1999).