case network studies and analyses 463 - costs and benefits of labour mobility between the eu and the...
TRANSCRIPT
Costs and Benefits of LabourMobility Between the EUand the Eastern PartnershipPartner Countries.Country Report: Georgia
CASE Network Studies & Analyses No. 463 – Costs and Benefits of Labour Mobility Between …
2
Materials published here have a working paper character. They can be subject to further
publication. The views and opinions expressed here reflect the author(s) point of view and not
necessarily those of CASE Network.
This country study was conducted under the project entitled “Costs and Benefits of Labour
Mobility between the EU and the Eastern Partner Partnership Countries” for the European
Commission (Contract No. 2011/270-312, tender procedure EuropeAid/130215/C/SER/Multi).
The study was conducted under the direction of Luca Barbone, CASE project director. The
views expressed in this paper are those of the authors, and should not be interpreted as
representing the official position of the European Commission and its institutions. The
European Commission retains ownership of the materials contained herein.
Keywords: Labour Economics, Labour Markets, Labour Mobility, Georgia
JEL Codes: D78, F22, F24, I25, J01, J15, J40, J61, J83
© CASE – Center for Social and Economic Research, Warsaw, 2013 Graphic Design: Agnieszka Natalia Bury
EAN 9788371785924
Publisher:
CASE-Center for Social and Economic Research on behalf of CASE Network
al. Jana Pawla II 61, office 212, 01-031 Warsaw, Poland
tel.: (48 22) 206 29 00, 828 61 33, fax: (48 22) 206 29 01
e-mail: [email protected]
http://www.case-research.eu
CASE Network Studies & Analyses No. 463 – Costs and Benefits of Labour Mobility Between …
3
Contents
Abstract ................................................................................................................................ 7
1. Introduction .................................................................................................................... 11
2. Macroeconomic developments: 1991–2011 ................................................................. 13
3. Labour markets in post-Soviet Georgia ....................................................................... 17
4. Labour migration and its impacts on socio-economic development in Georgia ....... 26
4.1. Main Features of Georgian Migration ................................................................ 26
4.2. Labour migration and its main determinants ..................................................... 27
4.3. Countries of destination ...................................................................................... 29
4.4. Demographic structure of migrants .................................................................... 31
4.5. Impact of migration on labour market................................................................. 32
4.6. Employment conditions in the countries of destination .................................... 36
4.7. Social and living adaptation ................................................................................ 37
4.8. Incomes of migrants and remittances ................................................................ 40
4.9. Impact of remittances on the economic and social conditions of Georgian
households ..................................................................................................................... 45
4.10. Macroeconomic determinants and effects of remittances .............................. 46
5. Migration Policies and Institutions ............................................................................... 48
5.1. Relationships with EU .......................................................................................... 49
Conclusions ....................................................................................................................... 51
References ......................................................................................................................... 53
Appendix ............................................................................................................................ 56
CASE Network Studies & Analyses No. 463 – Costs and Benefits of Labour Mobility Between …
4
Abbreviations and Acronyms
CIS Commonwealth of Independent States
EU European Union
EaP Eastern Partnership
EBRD European Bank for Reconstruction and Development
ENP European Neighbourhood Policy
FDI Foreign Direct Investments
FSU Former Soviet Union
GDP Gross Domestic Product
GeoStat National Statistics Office of Georgia
GOTM Georgia on the Move
IOM International Organization for Migration
IT Informational Technologies
MIA Ministry of Internal Affairs
NBG National Bank of Georgia
NDI National Democratic Institute
NGO Nongovernmental organization
PPP Purchasing Power Parity
TIG Targeted Initiative for Georgia
UN United Nations
VET Vocational education and training
CASE Network Studies & Analyses No. 463 – Costs and Benefits of Labour Mobility Between …
5
List of Figures and Tables
Figure 1: Contraction of GDP, 1989–2009 ........................................................................... 15
Figure 2: GDP per capita (PPP) and Real GDP growth of Georgia, 1995–2011 ................... 16
Figure 3: Pyramid population for 2011 (thousands) .............................................................. 17
Figure 4: Population projections for Georgia ........................................................................ 18
Figure 5: Georgian employment at a glance ......................................................................... 20
Figure 6: Unemployment by age, 2010 ................................................................................ 23
Figure 7: Emigrant distribution by age and gender ............................................................... 32
Figure 8: Emigrant distribution by education and gender ...................................................... 32
Figure 9: Migrant distribution by field of study and gender ................................................... 34
Figure 10: Remittances and FDI as a percentage of GDP .................................................... 41
Figure 11: Remittances by country and year, Top 10 countries of 2011 (thousands of USD) 42
Figure 12: Remittances by country and year, Top 10 of 2011 without Russia (thousands of
USD) .................................................................................................................................... 43
Figure 13: Remittances by country as percentage of total remittances, 2000 vs. 2011 ......... 44
Figure 14: Spending distribution of remittances.................................................................... 46
Table 1: Structural change in the Georgian economy: 1990–2011 (gross output by sector) . 14
Table 2: Manufacturing and agriculture sector developments, 1988–2000 ........................... 19
Table 3: Distribution of population aged 15 and older by economic status, 1998–2010
(thousand persons) .............................................................................................................. 20
Table 4: Unemployment rate (%) in Georgia and by rural-urban area .................................. 20
Table 5: Unemployment rate by regions ............................................................................... 21
Table 6: Wages by sector of economic activity, 2007–2010 (monthly gross wages, in USD) 24
Table 7: Net border crossings by Georgian citizens 2000–11 (thousands) ........................... 27
Table 8: Destination countries of Georgian emigrants (%) ................................................... 30
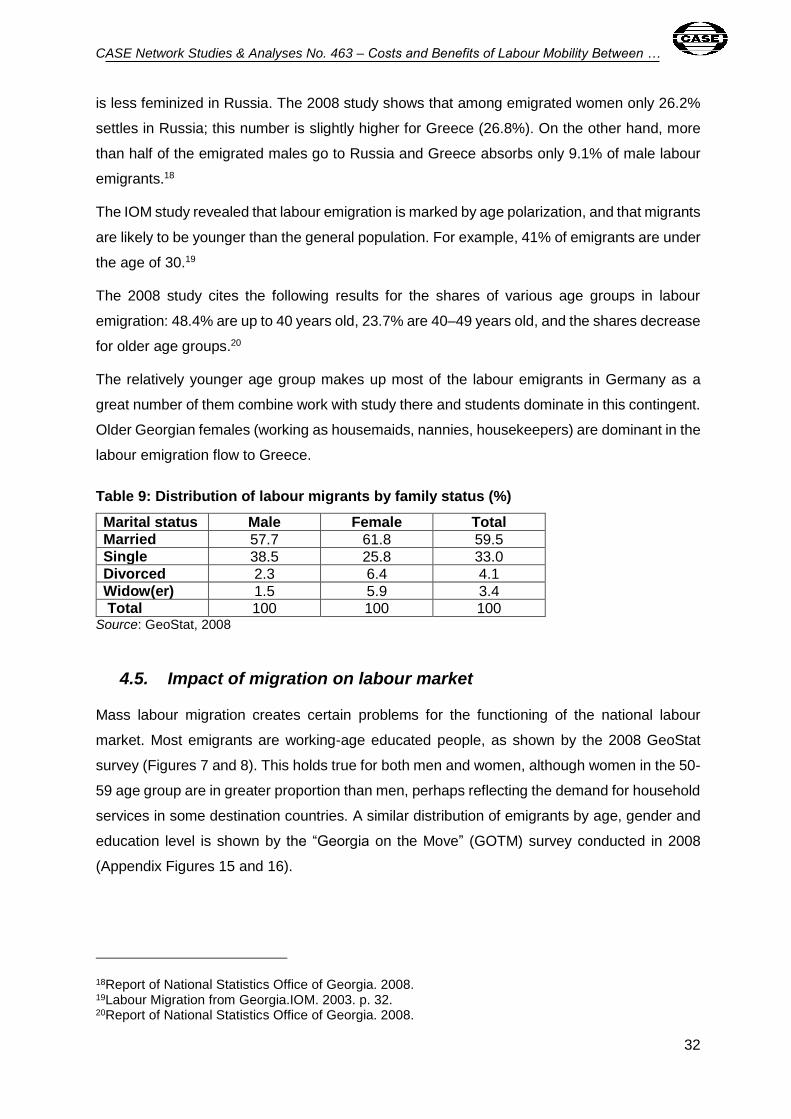
Table 9: Distribution of labour migrants by family status (%) ................................................ 32
Table 10: Distribution of labour migrants by occupation in destination countries (%) ............ 36
Table 11: Distribution of returned migrants according to their legal status abroad (%) ......... 38
Table 12: Distribution of labour migrants by level of adaptation to the social environment
according to recipient countries (%) ..................................................................................... 39
Table 13: Ranking of 2011’s top 10 remitting countries over time ........................................ 45
Table 14: Determinants of remittances (regression on quarterly data, 2000–11) .................. 47

CASE Network Studies & Analyses No. 463 – Costs and Benefits of Labour Mobility Between …
6
Lasha Labadze was born in Tbilisi, Georgia on January 3, 1985. During the years 2002-2006
he studied at Tbilisi State University’s (TSU) Department of Mathematics. Graduating with an
undergraduate degree in mathematics, he chose a career of an economist. To switch his field
of study and gain expertise in economics, Lasha applied to the International School of
Economics at TSU (ISET) in 2006. During the years at ISET he found economics research
appealing and captivating. After graduating ISET in 2008, Lasha accepted the positions of
research associate at ISET and teaching assistant at TSU, where he was teaching economic
principles and microeconomics. In parallel, during the 2008-2010 years he was also conducting
classes in statistics and data analysis at Caucasus School of Business. In 2008 and 2010 he
attended trainings at CERGE-EI University, Prague, to improve teaching skills. In 2011 he
became a director of newly based think tank CASE-Georgia, a daughter organization of CASE
Warsaw. At the same time he started working as an senior research fellow at ISET Policy
Institute. In 2013, Lasha became deputy director of ISET Policy Institute. Recently he studies
at PhD program at TSU and keeps doing both conduct research, data analysis and trainings
and teach the future generations of economists at Tbilisi State University.
Mirian Tukhashvili - Full Professor of the Department of Macroeconomics, Ivane Javakhishvili
Tbilisi State University, scientific supervisor of the Center for Migration Studies. Editor-in-chief
of the scholarly journal Migration. He has published scientific works on Georgia’s labour
market, population economy, urbanization, migration, issues of demographic development. At
the University he teaches the course “labour economics.” He was awarded the Order of Honour
for the contribution made in the development of science.

CASE Network Studies & Analyses No. 463 – Costs and Benefits of Labour Mobility Between …
7
Abstract
This study provides an analysis of the costs and benefits of emigration for Georgia, with an
emphasis on emigration to the EU. In the concluding section we dwell on the consequences
of a possible liberalization of EU migration policies with regard to Eastern Partnership (EaP)
countries, and how such a policy change would affect the flow and composition of migration
from Georgia to the EU.
The most recent population census in Georgia was conducted in 2002, and therefore, our
analysis had to rely on a wide range of survey data which differ in quality and
comprehensiveness of coverage, often leading to inconsistent estimates and contradictory
conclusions. Data limitations notwithstanding, we do our best to analyse past and current
trends in migrations; the push and pull factors affecting migration decisions, including the
general macroeconomic environment and labour markets; migrant characteristics and how
these have evolved over time.
We look at the costs and benefits of migration through the prism of recent economics
developments in Georgia and in particular the sweeping liberalization reforms of recent years.
While Georgia remains a poor country, its geopolitical position as a Western outpost in the
Caucasus and Central Asian region, its role as a key trade and transportation hub, the superior
quality of its bureaucracy, lack of corruption, etc., provide a very different context for migration
processes, turning migration into a circular phenomenon, a major factor in modernizing the
Georgian economy, society, and politics. The EU should give due consideration to this
phenomenon as it (re)considers its policy on migration with regard to Georgia and, potentially,
other EaP countries.
Migration was key to Georgia’s survival after the collapse of the Soviet Union. Due to internal
wars, secession and ensuing economic and political chaos, by 2002 Georgia had lost about a
million of its citizens, including whole families and individual labour migrants. Emigration
continued in later years, mainly to Russia (until 2003) but also increasingly to other
destinations, including Western Europe (particularly Greece) and North America. While
Georgia’s economy grew from 1995 on, productivity remained very low, pushing people into
emigration to look for work opportunities. Russia’s very fast economic recovery after the 1998
financial crisis (mainly driven by the price rise of oil and other commodities) provided a powerful
pull during this period of relative calm and reconstruction in Georgia.
CASE Network Studies & Analyses No. 463 – Costs and Benefits of Labour Mobility Between …
8
The liberalization reforms implemented after the Rose Revolution (end of 2003) contributed to
the creation of new economic opportunities in Georgia. The much-improved business
environment encouraged many Georgian migrants to return home and repatriate part of their
capital. While precise data on emigration flows are not available, the predominant view among
migration experts is that although significant, labour migration is currently much more circular
in nature. Georgian migrants are now primarily targeting the US and EU member states such
as France, Spain, Germany, Turkey, and Austria. While Russia still has by far the largest stock
of Georgian migrants, the flow of new migrants to Russia has slowed down following the
imposition of economic sanctions on Georgia in 2006 and, in particular, after the 2008 military
confrontation between the two countries. There are many reasons to believe that Russia will
become less and less popular as a destination for younger-generation Georgians, looking for
better study and employment opportunities abroad. These reasons include the political stand-
off between Russia and Georgia (which however might evolve in view of the recent presidential
elections in Georgia), the country’s political proximity to the EU, the gradual building up of a
Georgian diaspora in some of the EU member states, and the improved foreign language
proficiency of Georgian youth. We consider this to be a win-win outcome for the EU and
Georgia.
As long as labour productivity in Georgia remains significantly lower than in the EU member
states, Georgians will continue to be pushed and pulled into migration. Georgia’s per capita
income – a proxy for labour productivity – is currently a fraction of what it is in the leading EU
countries (USD 5,400 PPP). It is important to understand that labour productivity is not low
because of a lack of skills. Georgia has a fairly well-educated labour force, and thus the issue
is not lack of skills per se, but rather the lack of jobs that can make effective use of skilled
labour. Georgian businesses report difficulties in hiring and retaining skilled workers precisely
because they use outdated technology or do not have the necessary scale to provide
remuneration that would be competitive by international standards.
As a consequence, Georgia suffers from high and persistent unemployment, particularly
among youth with a general university education. The high unemployment figures are the result
of a considerable skills mismatch: the country produces far too many university graduates and
too few technically skilled workers. Thus, to remedy this situation, the country needs to invest
considerably in high-quality vocational training while at the same time upgrading its
technological base (leading to the creation of more high-skilled jobs). Until this happens, the
labour market will continue to push young Georgians into migration.
Migration from Georgia is presently also dominated by the younger age cohorts because they
are affected by the pull factor of Europe, in particular its education system. Younger Georgians
CASE Network Studies & Analyses No. 463 – Costs and Benefits of Labour Mobility Between …
9
know foreign languages and face lower migration costs, psychologically and otherwise. They
are also better able to leverage the experience and education acquired abroad in order to either
stay in the EU and legally enter the EU labour market or return to Georgia and enjoy easier
entry into leading positions in government, the private sector, international organizations and
NGOs.
Despite recent economic woes, Europe, with the possible exception of Greece, will continue to
be an attractive destination for Georgian migrants in the years to come. Per capita GDP (based
on Purchasing Power Parity or PPP) in the main destination EU countries is 5-7 times higher
than in Georgia. Thus, while most current emigrants probably lack proper documentation (no
precise data are available), the discriminatory wages they earn in the secondary labour market
are sufficiently high to serve as a powerful pull factor. Many migrants are able at some point to
acquire residency rights, creating a bridgehead for relatives and extended family members.
Increasing numbers of skilled Georgian workers, especially in the IT sector, are able to apply
for jobs and receive work permits prior to their arrival in the EU. Despite the crisis, Greece still
has by far the largest stock of Georgian migrants (mostly female domestic workers), though
Italy may be catching up, as reflected in recent remittances data. Germany also attracts scores
of students and labour migrants. However, the volume of remittances from Germany is not very
high, suggesting that the majority of Georgian migrants to Germany are in fact students.
The main channels through which migration directly affects the Georgian economy and society
are remittances, brain drain and gain, and demographic changes.
The flow of remittances to Georgia has steadily been growing at least since 2000 (the earliest
year for which data is available), both in absolute terms and as a percentage of GDP. The
volume of remittances peaked in 2007, just prior to the eruption of the global financial crisis,
reflecting a more favourable investment climate at home and economic prosperity abroad. After
a temporary setback in 2009, remittances grew by 25% and 21% in 2010 and 2011,
respectively, reaching 8.8% of 2011 GDP (1.27 bln USD). Survey evidence shows that
remittances in Georgia reduce poverty, increase household expenditure on consumer goods,
health and education, increase savings and foster social capital formation. There is also some
evidence that remittances may decrease incentives to work, mostly in rural areas. A relatively
small share of remitted capital is used for productive investment, as most of it finances current
consumption. Most importantly, remittances are a key source of foreign earnings for Georgia,
supporting the local currency and financing a significant part (25% in 2011) of the current
account deficit.
CASE Network Studies & Analyses No. 463 – Costs and Benefits of Labour Mobility Between …
10
Despite the increasing attractiveness of Europe as a migration destination, Russia remains the
number one remitting country (more than 50% of the total). Among the top five remitting
countries only two are EU nations: Greece and Italy (12% and 9%, respectively). Spain and
the UK appear only in the top ten. Thus, at least as far as remittances are concerned, Georgia
does not depend on the EU, but rather on the Former Soviet Union (FSU) countries and
especially on Russia.
A simplistic “brain drain” argument has it that emigration of skilled workers robs a country of its
most valuable resource. What this argument ignores is the fact that emigration can also be a
powerful source of brain gain for a country. Of course, for this to happen the country in question
has to create the conditions and the business environment for those who left it (in pursuit of
better education or work experience) to come back. Georgia is a good case in point. Georgia’s
reforms and reconstruction since 2004 have been led by the young, Western-educated elite.
While precise data are not available, the vast majority of senior and mid-level leadership
employees in the Georgian government, businesses and the NGO community have gone
through spells of emigration or study in the EU and US. The experience of living and working
in the West has become a powerful source of cultural and social change, helping eradicate
corruption, creating a culture of transparency and effective public service delivery.
Throughout the independence period, Georgian labour migration has undoubtedly served as
an escape valve, helping absorb unemployed resources, providing financial resources and
facilitating a cultural change. At the same time, labour migration has also had negative impacts
on families. Fertility among labour migrants is lower than for the corresponding age cohorts;
female labour emigrants have basically no part in reproduction processes. These factors will
eventually lead to population ageing and an increasing dependency ratio (ratio of retired to
workers) in Georgian society. While difficult to accurately assess, both quantitatively and
qualitatively, labour migration of parents carries negative implications for the ability of families
to perform the basic parental functions, affecting the upbringing and education of children.
Though the prevailing view holds that migration is a positive force in both the country of origin
and destination, unregulated migration can entail social, financial and political costs for the
individuals, society and governments. It is thus essential to regulate labour emigration flows in
Georgia, despite the fact that it would require a great effort and quite some time. We came to
this conclusion based on a comparative analysis of sending and receiving countries’ economic
development, witnessing a huge contrast in the incomes of employed people as well as high
demand for cheap labour on secondary labour markets of European countries. According to
this study, steps taken towards readmission lack the efficiency needed to achieve substantial
results in terms of the optimization of labour emigration shifts.
CASE Network Studies & Analyses No. 463 – Costs and Benefits of Labour Mobility Between …
11
1. Introduction
After the break-up of the Soviet Union, Georgia went through a process of civil war and
economic collapse. Official estimates suggest that Georgia’s GDP shrunk by more than 70%
between 1990 and 1994.Internal displacement and migration, primarily to Russia, were
essential to the nation’s physical survival during this period. Three distinct phases of Georgia’s
external migration may be distinguished.
Based on data from the last two censuses held in Georgia, between 1989 and 2002, about 1
million emigrants permanently left Georgia (roughly 20–25% of the total population). This figure
includes a very large number of non-Georgian ethnic minorities, including Jews, Russians,
Armenians and Greeks. Mansoor and Quillin (2007, p.33) suggest that Georgia holds third
place (after Albania and Kazakhstan) among the 25 East European and FSU nations in the
share of population lost to emigration.
While the first phase of migration involved a very large ethnic component, the second wave,
between 1995 and 2003, was mainly motivated by the search for better economic opportunities
abroad. Outflows remained substantial, if somewhat smaller than in the initial phase. The
United Nations’ (2009, p.183) global migration assessment for 2006 put net emigration from
Georgia between 1995 and 2005 at 598,000 people. Georgia’s economy was growing at about
5% per year during this period. However, productivity remained very low, pushing people into
emigration to Russia and other destinations, including Western Europe (particularly Greece)
and North America.
Emigration slowed down in the third phase, which started with Georgia’s Rose Revolution (end
of 2003). The liberalization reforms launched in early 2004 contributed to a substantial
improvement in indicators of the business environment, and supported a strong economic
turnaround. During 2003–11, Georgia’s gross national disposable income increased almost
threefold, and so did its GDP per capita. The new business opportunities and increase in
productivity encouraged many Georgian migrants to return home and slowed the outflow of
labour migrants. Migration during this period became circular in nature, with many young
Georgians going abroad to get a better education and coming back to take up leading positions
in government, the private sector, international organizations and NGOs. The volume of
remittances during this period also increased dramatically, peaking in 2007, just before the

CASE Network Studies & Analyses No. 463 – Costs and Benefits of Labour Mobility Between …
12
global financial crisis erupted, reflecting a more favourable investment climate at home and
economic prosperity abroad. Still, a relatively small share of remitted capital was used for
productive investment. Most of it financed current consumption.
While precise data on emigration flows are not available given the collapse of the residential
registration system, the predominant view among migration experts is that labour migration is
still high, though nowadays much more circular in nature. Georgian migrants are now primarily
targeting the US and EU member states such as France, Spain, Germany, Turkey, and Austria.
Russia still has by far the largest stock of Georgian migrants. However, due to the 2008 military
confrontation and the complete breakdown in political and economic relations between Russian
and Georgia, the flow of new Georgian migrants to Russia has been slowing down since 2006.
This study is structured as follows. We begin by providing an overview of the general
macroeconomic developments in Georgia since its independence in 1991, with an emphasis
on the post-Rose Revolution period (Section 1). In Section 2, we outline the major labour
market trends during the 20 years of independence, focusing on the later period. Next, in
Section 3, we take stock of the Georgian migration phenomenon: the typical profile of migrants,
destination countries, employment abroad, and remittance flows, including their micro and
macroeconomic effects. Section 4 reviews Georgia’s current migration polices and relations
with EU member states, including existing agreements on visa facilitation and readmission
policies, as well as the ongoing policy debate.
This paper is based on all available statistical evidence (census, surveys) on migration and
labour markets. In addition, as part of this study, we have organized two focus groups, one
with migration and labour market experts and the other with returned migrants. Through the
study we will use those focus groups findings, views of leading Georgian experts and concrete
examples of returned migrants, to make our arguments stronger.
The costs and benefits of migration for Georgia are discussed throughout the report. In
particular, we consider the benefits of remittances, investment in human capital and brain gain
from circular migration, the role of Georgian diasporas in the facilitation of foreign direct
investment, trade linkages, cultural cooperation, improvements in education, business climate
and the quality of government institutions. On the cost side, we consider the negative impact
of migration on demographic trends, brain drain, the family institution and the negative impact
of remittances on labour supply.
CASE Network Studies & Analyses No. 463 – Costs and Benefits of Labour Mobility Between …
13
2. Macroeconomic developments: 1991–2011
Economic and political breakdown: 1991–95. As indicated in the introduction, after the
collapse of the Soviet Union, Georgia experienced several civil wars and territorial conflicts
that extended and intensified the economic crisis. In 1993, inflation reached 2,000%, reflecting
the almost complete breakdown of the economy, caused by military conflicts within Georgia’s
borders. Despite the ambiguities in official statistics, all available evidence suggests that after
1989 Georgia experienced a catastrophic decline in industrial output, real income,
consumption, capital investment, and virtually every other economic indicator.
Indirectly, one can quantitatively derive the depth of the crisis from the collapse of the energy
supply – at once a cause and a symptom of a deep economic recession. In 1990, over 95% of
Georgia's fuel was imported. After the collapse of the Soviet Union in 1991, Georgia was able
to receive only about one-third of the energy needed for full-scale operation, and thus most
plants had to operate far below capacity. Georgia has a substantial hydroelectric generation
potential, but only 14% of it was in use during this period. The crisis also had a strong impact
on the structure of the economy. Between 1990 and 1995, the share of manufacturing fell from
23% to a meagre 10% of total (by now much smaller) output. Construction and transport
essentially came to a standstill during this phase of destruction, shrinking to 2% of total output.
The only two sectors that gained in relative terms during this period were small trade and
agriculture (Table 2 below).
During this initial phase of economic and political collapse, Georgia saw a significant wave of
ethnic emigration involving, for example, almost the entire Jewish and Greek communities. The
result was a dramatic change in the ethnic composition of the Georgian population (discussed
below). The protracted economic crisis – with GDP shrinking by more than 70% between 1990
and1994 – has continued to push people into migration. While slowing down with the
resumption of growth after 1995, migration has remained the main survival tactic for many
Georgian households, irrespective of ethnicity, age and other demographic characteristics.
People migrated not so much because of a lack of employment, but mainly because of the
terrible security situation. The breakdown in law and order made it likewise impossible to
engage in productive economic activities, maintain a family, raise children, etc.
CASE Network Studies & Analyses No. 463 – Costs and Benefits of Labour Mobility Between …
14
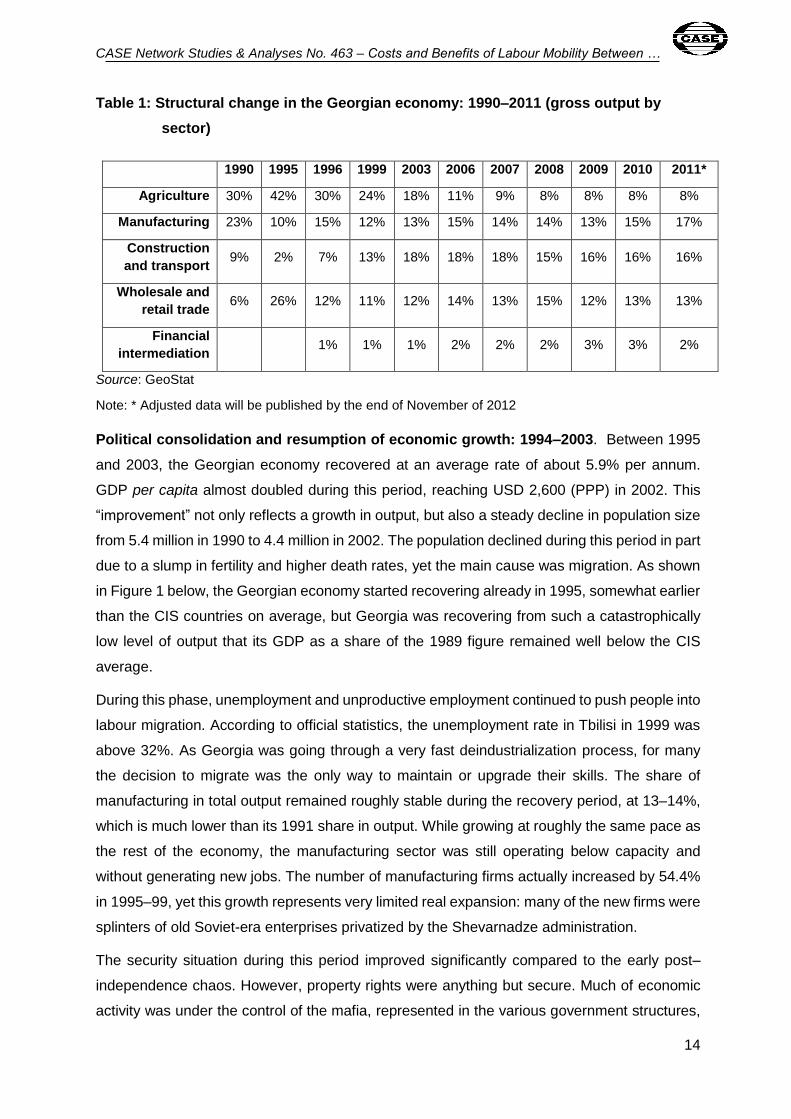
Table 1: Structural change in the Georgian economy: 1990–2011 (gross output by
sector)
1990 1995 1996 1999 2003 2006 2007 2008 2009 2010 2011*
Agriculture 30% 42% 30% 24% 18% 11% 9% 8% 8% 8% 8%
Manufacturing 23% 10% 15% 12% 13% 15% 14% 14% 13% 15% 17%
Construction
and transport 9% 2% 7% 13% 18% 18% 18% 15% 16% 16% 16%
Wholesale and
retail trade 6% 26% 12% 11% 12% 14% 13% 15% 12% 13% 13%
Financial
intermediation 1% 1% 1% 2% 2% 2% 3% 3% 2%
Source: GeoStat
Note: * Adjusted data will be published by the end of November of 2012
Political consolidation and resumption of economic growth: 1994–2003. Between 1995
and 2003, the Georgian economy recovered at an average rate of about 5.9% per annum.
GDP per capita almost doubled during this period, reaching USD 2,600 (PPP) in 2002. This
“improvement” not only reflects a growth in output, but also a steady decline in population size
from 5.4 million in 1990 to 4.4 million in 2002. The population declined during this period in part
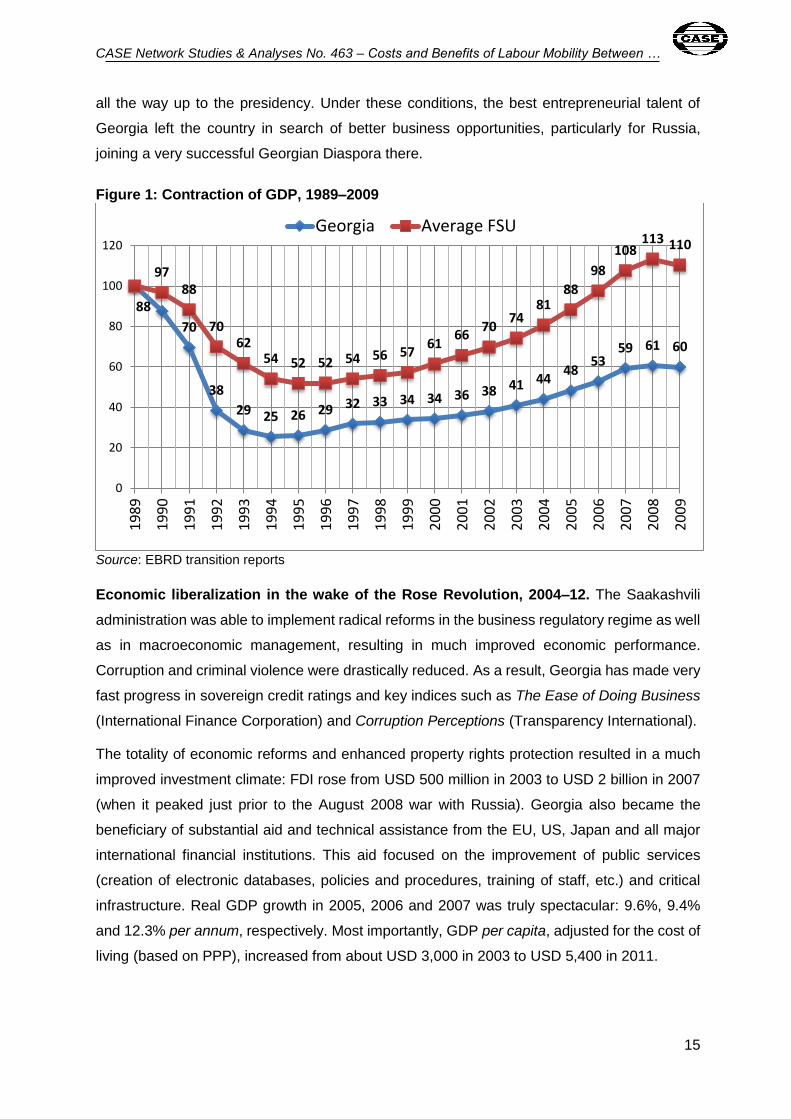
due to a slump in fertility and higher death rates, yet the main cause was migration. As shown
in Figure 1 below, the Georgian economy started recovering already in 1995, somewhat earlier
than the CIS countries on average, but Georgia was recovering from such a catastrophically
low level of output that its GDP as a share of the 1989 figure remained well below the CIS
average.
During this phase, unemployment and unproductive employment continued to push people into
labour migration. According to official statistics, the unemployment rate in Tbilisi in 1999 was
above 32%. As Georgia was going through a very fast deindustrialization process, for many
the decision to migrate was the only way to maintain or upgrade their skills. The share of
manufacturing in total output remained roughly stable during the recovery period, at 13–14%,
which is much lower than its 1991 share in output. While growing at roughly the same pace as
the rest of the economy, the manufacturing sector was still operating below capacity and
without generating new jobs. The number of manufacturing firms actually increased by 54.4%
in 1995–99, yet this growth represents very limited real expansion: many of the new firms were
splinters of old Soviet-era enterprises privatized by the Shevarnadze administration.
The security situation during this period improved significantly compared to the early post–
independence chaos. However, property rights were anything but secure. Much of economic
activity was under the control of the mafia, represented in the various government structures,
CASE Network Studies & Analyses No. 463 – Costs and Benefits of Labour Mobility Between …
15
all the way up to the presidency. Under these conditions, the best entrepreneurial talent of
Georgia left the country in search of better business opportunities, particularly for Russia,
joining a very successful Georgian Diaspora there.
Figure 1: Contraction of GDP, 1989–2009
Source: EBRD transition reports
Economic liberalization in the wake of the Rose Revolution, 2004–12. The Saakashvili
administration was able to implement radical reforms in the business regulatory regime as well
as in macroeconomic management, resulting in much improved economic performance.
Corruption and criminal violence were drastically reduced. As a result, Georgia has made very
fast progress in sovereign credit ratings and key indices such as The Ease of Doing Business
(International Finance Corporation) and Corruption Perceptions (Transparency International).
The totality of economic reforms and enhanced property rights protection resulted in a much
improved investment climate: FDI rose from USD 500 million in 2003 to USD 2 billion in 2007
(when it peaked just prior to the August 2008 war with Russia). Georgia also became the
beneficiary of substantial aid and technical assistance from the EU, US, Japan and all major
international financial institutions. This aid focused on the improvement of public services
(creation of electronic databases, policies and procedures, training of staff, etc.) and critical
infrastructure. Real GDP growth in 2005, 2006 and 2007 was truly spectacular: 9.6%, 9.4%
and 12.3% per annum, respectively. Most importantly, GDP per capita, adjusted for the cost of
living (based on PPP), increased from about USD 3,000 in 2003 to USD 5,400 in 2011.
88
70
38
29 25 26 29 32 33 34 34 36 38 41 4448
5359 61 60
9788
7062
54 52 52 54 56 5761
6670
7481
88
98
108113 110
0
20
40
60
80
100
120
19
89
19
90
19
91
19
92
19
93
19
94
19
95
19
96
19
97
19
98
19
99
20
00
20
01
20
02
20
03
20
04
20
05
20
06
20
07
20
08
20
09
Georgia Average FSU
CASE Network Studies & Analyses No. 463 – Costs and Benefits of Labour Mobility Between …
16
The global financial crisis and the August 2008 war with Russia punctured the real estate
bubble that had been quickly building up until then, ending a wave of FDI into the real estate
sector, and unleashing a series of political protests during the first half of 2009. While in 2008
Georgia was still able to post growth of 2.4%, 2009 was a year in which output shrank by 3.8%.
Unemployment, which had been very moderately declining in the first three years of
Saakashvili rule (from 13.8% in 2005 to 13.3% in 2007), jumped to above 16% in 2009.
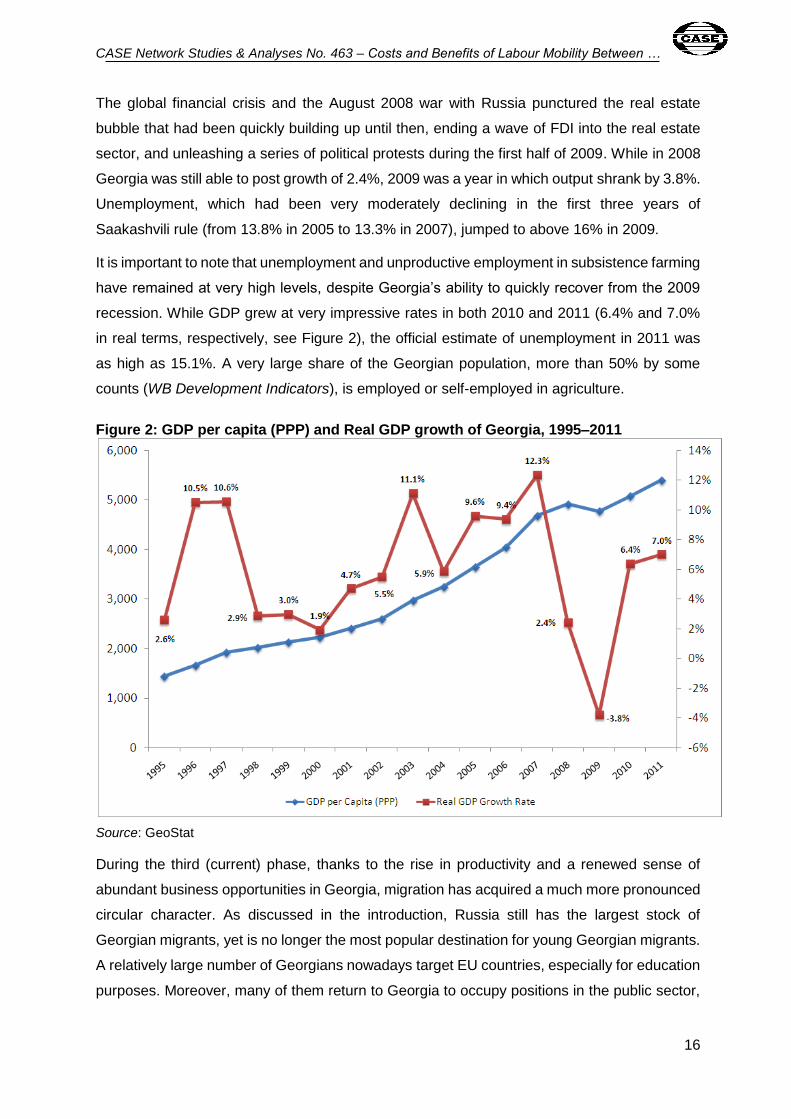
It is important to note that unemployment and unproductive employment in subsistence farming
have remained at very high levels, despite Georgia’s ability to quickly recover from the 2009
recession. While GDP grew at very impressive rates in both 2010 and 2011 (6.4% and 7.0%
in real terms, respectively, see Figure 2), the official estimate of unemployment in 2011 was
as high as 15.1%. A very large share of the Georgian population, more than 50% by some
counts (WB Development Indicators), is employed or self-employed in agriculture.
Figure 2: GDP per capita (PPP) and Real GDP growth of Georgia, 1995–2011
Source: GeoStat
During the third (current) phase, thanks to the rise in productivity and a renewed sense of
abundant business opportunities in Georgia, migration has acquired a much more pronounced
circular character. As discussed in the introduction, Russia still has the largest stock of
Georgian migrants, yet is no longer the most popular destination for young Georgian migrants.
A relatively large number of Georgians nowadays target EU countries, especially for education
purposes. Moreover, many of them return to Georgia to occupy positions in the public sector,

CASE Network Studies & Analyses No. 463 – Costs and Benefits of Labour Mobility Between …
17
private businesses, international organizations and NGOs. Remittances during this phase also
increased quite substantially, exceeding FDI from 2009 onwards. Remittances are a major
source of hard currency earnings for Georgia, financing 25% of its current account deficit in
2011. Together with earnings from tourism, remittances allow Georgia to import more than it
exports, financing both current consumption and investment.
3. Labour markets in post-Soviet Georgia
In this chapter, we review some of the structural features and developments of the Georgian
labour market, emphasizing its current performance, with a view to putting labour migration,
present and future, in context.
Labour market functioning depends on demographic, economic, social, legislative and
institutional factors. We first review demographic determinants. Next, we devote attention to
the two main reasons for emigration: unemployment and low wages. Finally, we discuss the
professional education system, which plays an important role in addressing the unemployment
problem in the country.
The Georgian population is ageing (Figure 3). As of 2011, 13.8% of the population was over
65 years of age (16.4% female, 10.9% male) compared to 12.7% for 2001. By 2050 almost
one in four residents is projected to be aged over 65.
Figure 3: Pyramid population for 2011 (thousands)
Females Males
Source: National Statistics Office of Georgia, 2012
0 50 100 150 200
-1
5 - 9
15 - 19
25 - 29
35 - 39
45 - 49
55 - 59
65 - 69
75 - 79
85 +
050100150200
-1
5 - 9
15 - 19
25 - 29
35 - 39
45 - 49
55 - 59
65 - 69
75 - 79
85 +
CASE Network Studies & Analyses No. 463 – Costs and Benefits of Labour Mobility Between …
18
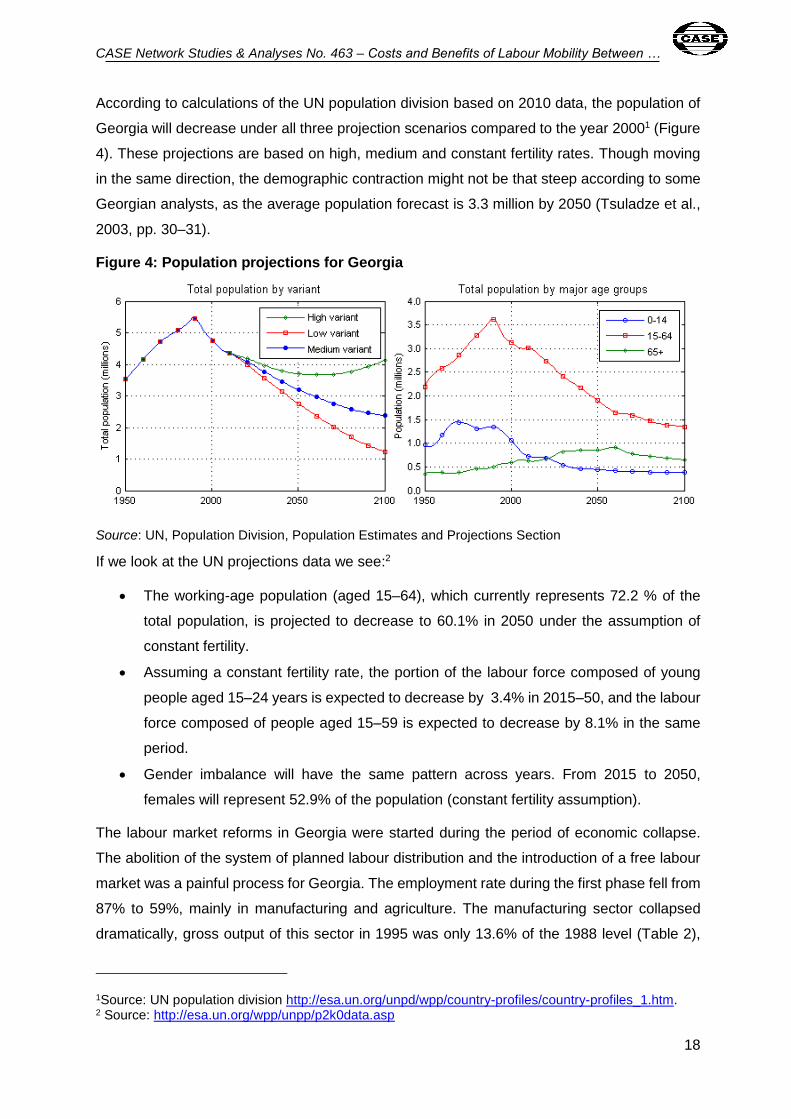
According to calculations of the UN population division based on 2010 data, the population of
Georgia will decrease under all three projection scenarios compared to the year 20001 (Figure
4). These projections are based on high, medium and constant fertility rates. Though moving
in the same direction, the demographic contraction might not be that steep according to some
Georgian analysts, as the average population forecast is 3.3 million by 2050 (Tsuladze et al.,
2003, pp. 30–31).
Figure 4: Population projections for Georgia
Source: UN, Population Division, Population Estimates and Projections Section
If we look at the UN projections data we see:2
The working-age population (aged 15–64), which currently represents 72.2 % of the
total population, is projected to decrease to 60.1% in 2050 under the assumption of
constant fertility.
Assuming a constant fertility rate, the portion of the labour force composed of young
people aged 15–24 years is expected to decrease by 3.4% in 2015–50, and the labour
force composed of people aged 15–59 is expected to decrease by 8.1% in the same
period.
Gender imbalance will have the same pattern across years. From 2015 to 2050,
females will represent 52.9% of the population (constant fertility assumption).
The labour market reforms in Georgia were started during the period of economic collapse.
The abolition of the system of planned labour distribution and the introduction of a free labour
market was a painful process for Georgia. The employment rate during the first phase fell from
87% to 59%, mainly in manufacturing and agriculture. The manufacturing sector collapsed
dramatically, gross output of this sector in 1995 was only 13.6% of the 1988 level (Table 2),
1Source: UN population division http://esa.un.org/unpd/wpp/country-profiles/country-profiles_1.htm. 2 Source: http://esa.un.org/wpp/unpp/p2k0data.asp
CASE Network Studies & Analyses No. 463 – Costs and Benefits of Labour Mobility Between …
19
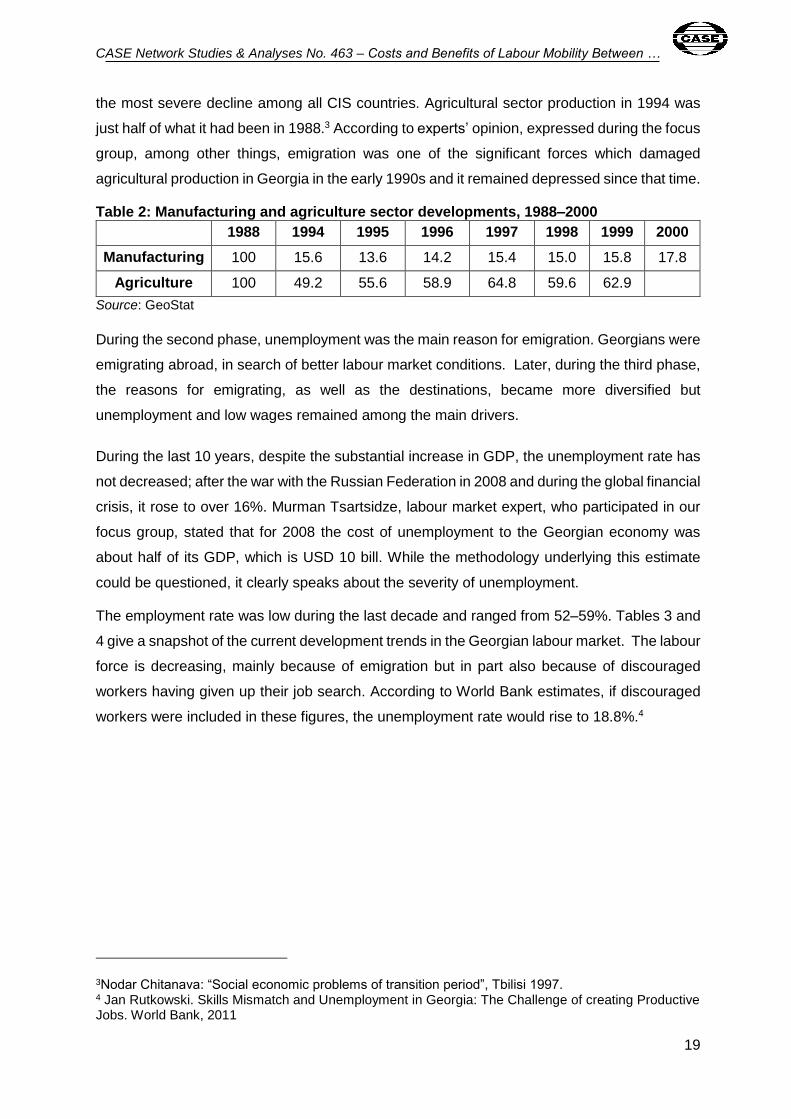
the most severe decline among all CIS countries. Agricultural sector production in 1994 was
just half of what it had been in 1988.3 According to experts’ opinion, expressed during the focus
group, among other things, emigration was one of the significant forces which damaged
agricultural production in Georgia in the early 1990s and it remained depressed since that time.
Table 2: Manufacturing and agriculture sector developments, 1988–2000
1988 1994 1995 1996 1997 1998 1999 2000
Manufacturing 100 15.6 13.6 14.2 15.4 15.0 15.8 17.8
Agriculture 100 49.2 55.6 58.9 64.8 59.6 62.9
Source: GeoStat
During the second phase, unemployment was the main reason for emigration. Georgians were
emigrating abroad, in search of better labour market conditions. Later, during the third phase,
the reasons for emigrating, as well as the destinations, became more diversified but
unemployment and low wages remained among the main drivers.
During the last 10 years, despite the substantial increase in GDP, the unemployment rate has
not decreased; after the war with the Russian Federation in 2008 and during the global financial
crisis, it rose to over 16%. Murman Tsartsidze, labour market expert, who participated in our
focus group, stated that for 2008 the cost of unemployment to the Georgian economy was
about half of its GDP, which is USD 10 bill. While the methodology underlying this estimate
could be questioned, it clearly speaks about the severity of unemployment.
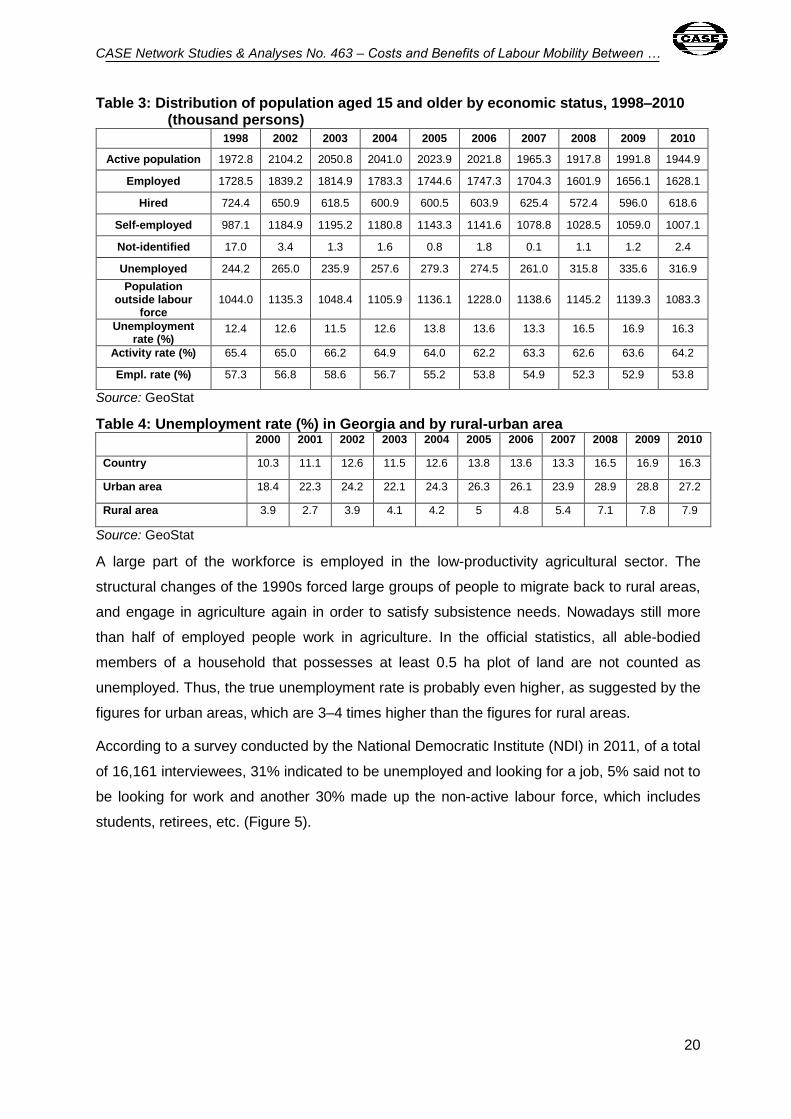
The employment rate was low during the last decade and ranged from 52–59%. Tables 3 and
4 give a snapshot of the current development trends in the Georgian labour market. The labour
force is decreasing, mainly because of emigration but in part also because of discouraged
workers having given up their job search. According to World Bank estimates, if discouraged
workers were included in these figures, the unemployment rate would rise to 18.8%.4
3Nodar Chitanava: “Social economic problems of transition period”, Tbilisi 1997. 4 Jan Rutkowski. Skills Mismatch and Unemployment in Georgia: The Challenge of creating Productive Jobs. World Bank, 2011
CASE Network Studies & Analyses No. 463 – Costs and Benefits of Labour Mobility Between …
20
Table 3: Distribution of population aged 15 and older by economic status, 1998–2010 (thousand persons)
1998 2002 2003 2004 2005 2006 2007 2008 2009 2010
Active population 1972.8 2104.2 2050.8 2041.0 2023.9 2021.8 1965.3 1917.8 1991.8 1944.9
Employed 1728.5 1839.2 1814.9 1783.3 1744.6 1747.3 1704.3 1601.9 1656.1 1628.1
Hired 724.4 650.9 618.5 600.9 600.5 603.9 625.4 572.4 596.0 618.6
Self-employed 987.1 1184.9 1195.2 1180.8 1143.3 1141.6 1078.8 1028.5 1059.0 1007.1
Not-identified 17.0 3.4 1.3 1.6 0.8 1.8 0.1 1.1 1.2 2.4
Unemployed 244.2 265.0 235.9 257.6 279.3 274.5 261.0 315.8 335.6 316.9
Population outside labour
force 1044.0 1135.3 1048.4 1105.9 1136.1 1228.0 1138.6 1145.2 1139.3 1083.3
Unemployment rate (%)
12.4 12.6 11.5 12.6 13.8 13.6 13.3 16.5 16.9 16.3
Activity rate (%) 65.4 65.0 66.2 64.9 64.0 62.2 63.3 62.6 63.6 64.2
Empl. rate (%) 57.3 56.8 58.6 56.7 55.2 53.8 54.9 52.3 52.9 53.8
Source: GeoStat
Table 4: Unemployment rate (%) in Georgia and by rural-urban area 2000 2001 2002 2003 2004 2005 2006 2007 2008 2009 2010
Country 10.3 11.1 12.6 11.5 12.6 13.8 13.6 13.3 16.5 16.9 16.3
Urban area 18.4 22.3 24.2 22.1 24.3 26.3 26.1 23.9 28.9 28.8 27.2
Rural area 3.9 2.7 3.9 4.1 4.2 5 4.8 5.4 7.1 7.8 7.9
Source: GeoStat
A large part of the workforce is employed in the low-productivity agricultural sector. The
structural changes of the 1990s forced large groups of people to migrate back to rural areas,
and engage in agriculture again in order to satisfy subsistence needs. Nowadays still more
than half of employed people work in agriculture. In the official statistics, all able-bodied
members of a household that possesses at least 0.5 ha plot of land are not counted as
unemployed. Thus, the true unemployment rate is probably even higher, as suggested by the
figures for urban areas, which are 3–4 times higher than the figures for rural areas.
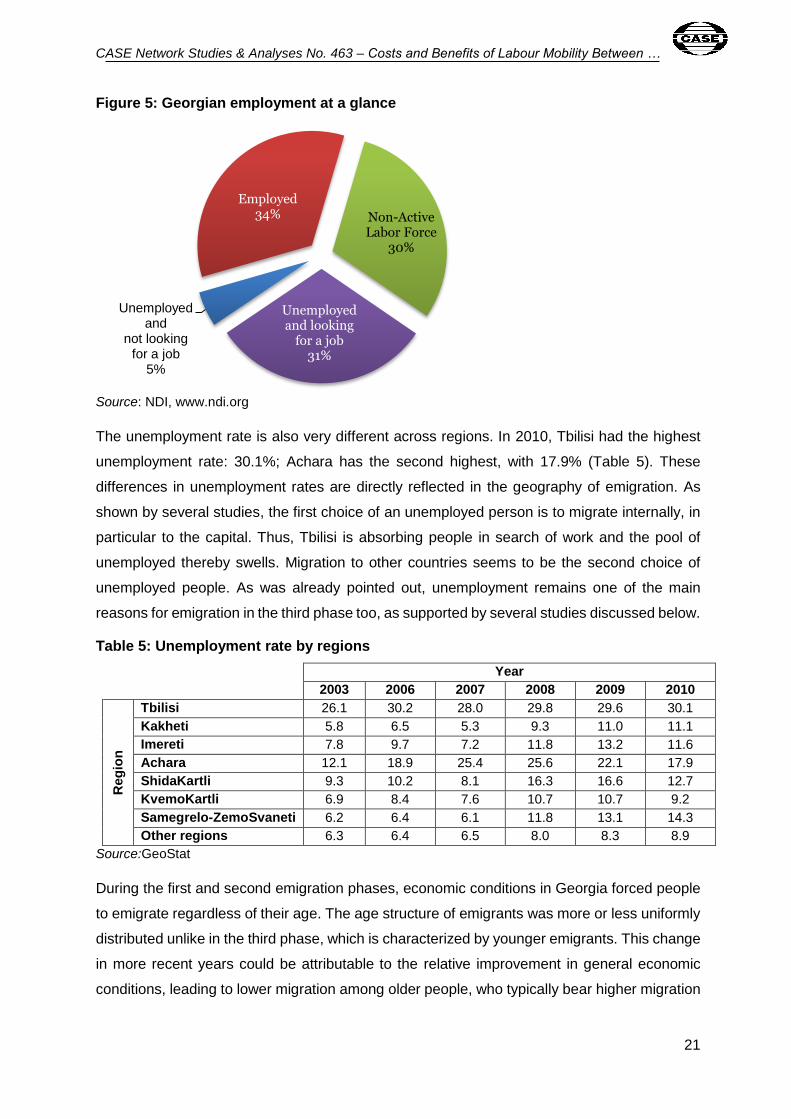
According to a survey conducted by the National Democratic Institute (NDI) in 2011, of a total
of 16,161 interviewees, 31% indicated to be unemployed and looking for a job, 5% said not to
be looking for work and another 30% made up the non-active labour force, which includes
students, retirees, etc. (Figure 5).
CASE Network Studies & Analyses No. 463 – Costs and Benefits of Labour Mobility Between …
21
Figure 5: Georgian employment at a glance
Source: NDI, www.ndi.org
The unemployment rate is also very different across regions. In 2010, Tbilisi had the highest
unemployment rate: 30.1%; Achara has the second highest, with 17.9% (Table 5). These
differences in unemployment rates are directly reflected in the geography of emigration. As
shown by several studies, the first choice of an unemployed person is to migrate internally, in
particular to the capital. Thus, Tbilisi is absorbing people in search of work and the pool of
unemployed thereby swells. Migration to other countries seems to be the second choice of
unemployed people. As was already pointed out, unemployment remains one of the main
reasons for emigration in the third phase too, as supported by several studies discussed below.
Table 5: Unemployment rate by regions
Year
2003 2006 2007 2008 2009 2010
Reg
ion
Tbilisi 26.1 30.2 28.0 29.8 29.6 30.1
Kakheti 5.8 6.5 5.3 9.3 11.0 11.1
Imereti 7.8 9.7 7.2 11.8 13.2 11.6
Achara 12.1 18.9 25.4 25.6 22.1 17.9
ShidaKartli 9.3 10.2 8.1 16.3 16.6 12.7
KvemoKartli 6.9 8.4 7.6 10.7 10.7 9.2
Samegrelo-ZemoSvaneti 6.2 6.4 6.1 11.8 13.1 14.3
Other regions 6.3 6.4 6.5 8.0 8.3 8.9
Source:GeoStat
During the first and second emigration phases, economic conditions in Georgia forced people
to emigrate regardless of their age. The age structure of emigrants was more or less uniformly
distributed unlike in the third phase, which is characterized by younger emigrants. This change
in more recent years could be attributable to the relative improvement in general economic
conditions, leading to lower migration among older people, who typically bear higher migration
Unemployed and
not looking for a job
5%
Employed34% Non-Active
Labor Force30%
Unemployed and looking
for a job31%
CASE Network Studies & Analyses No. 463 – Costs and Benefits of Labour Mobility Between …
22
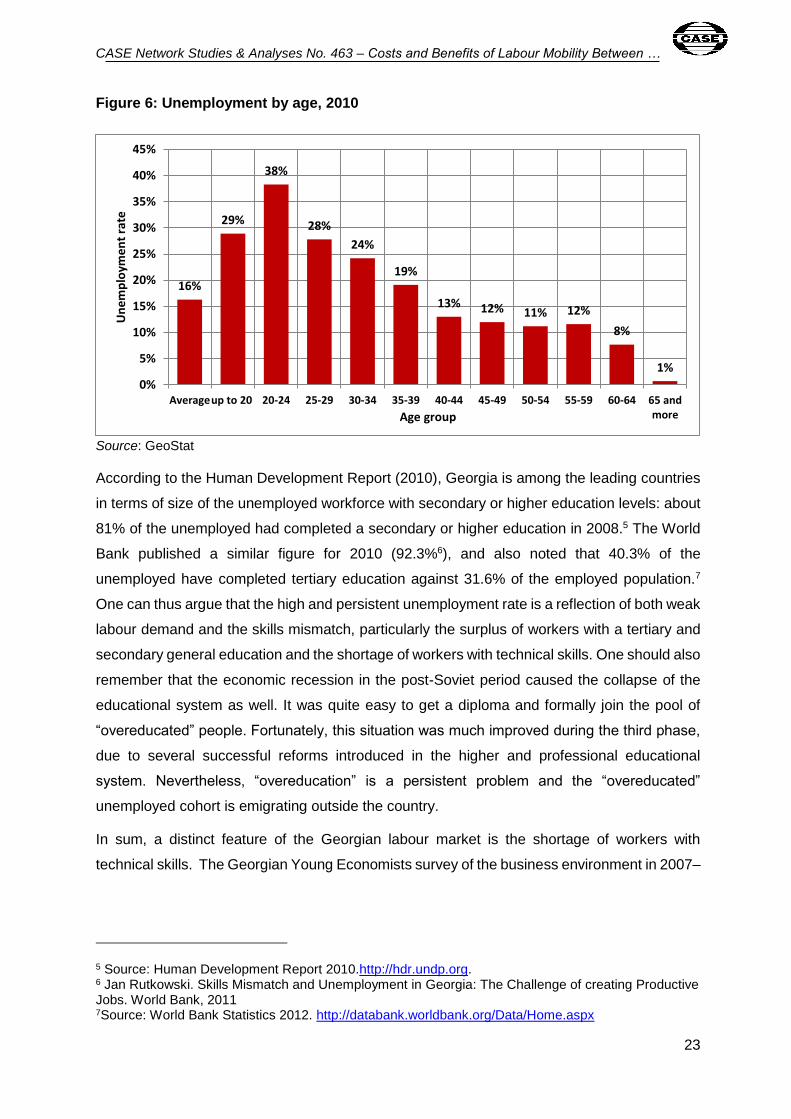
costs. The young have better opportunities to acquire a better education abroad, are more
enthusiastic and more demanding. This explains the relatively high unemployment rate for
people up to 24 years, who appear to be searching for “good jobs” and not accepting existing
ones. According to 2010 data, the unemployment rate was the highest for this age group
(38.3%), followed by the 25–29 and 30–34 years of age groups, with 27.8% and 24.2%
respectively. The 20–34age group is the one with the highest probability of migrating for two
reasons: most people in this category do not have language barriers and the psychological
losses of migration associated with this age group are less.
Employment age characteristics changed after the Rose Revolution with the implementation
of a number of crucial structural reforms. Particularly, people over 40 with no relevant job skills
were fired and replaced by younger individuals. Most fired persons exited the labour force and
are now counted as “discouraged workers”. This movement is partly captured in Table 3 above,
which shows a growing number of people outside the labour force during 2003–2008 (together
with an ageing population). This “generation replacement” is one outstanding characteristic of
the Georgian labour market during the third phase. These numbers are not captured in
aggregate statistics but, in everyday life we notice that young, returned migrants with a Western
education and/or work experience hold almost all “elite” jobs. For example, ministers, deputy
ministers, and the heads of the leading businesses and NGOs all are persons mostly with a
Western education. This serves as an incentive for young people to go abroad to study, and
thereby ensure a high return on education. This idea is supported by data from the third phase,
showing that educational reasons for emigration are emerging (as discussed below). At the
same time, some of the experts negatively assess the effectiveness of those reforms of
Saakashvili administration directed to unemployment problem, to quote from our focus group:
“Unemployment is the primary reason for poverty, which remained as the most important
problem even after the Rose Revolution. The administration has said that poverty is its number
one enemy, but in reality poverty remains quite high in Georgia.”
CASE Network Studies & Analyses No. 463 – Costs and Benefits of Labour Mobility Between …
23
Figure 6: Unemployment by age, 2010
Source: GeoStat
According to the Human Development Report (2010), Georgia is among the leading countries
in terms of size of the unemployed workforce with secondary or higher education levels: about
81% of the unemployed had completed a secondary or higher education in 2008.5 The World
Bank published a similar figure for 2010 (92.3%6), and also noted that 40.3% of the
unemployed have completed tertiary education against 31.6% of the employed population.7
One can thus argue that the high and persistent unemployment rate is a reflection of both weak
labour demand and the skills mismatch, particularly the surplus of workers with a tertiary and
secondary general education and the shortage of workers with technical skills. One should also
remember that the economic recession in the post-Soviet period caused the collapse of the
educational system as well. It was quite easy to get a diploma and formally join the pool of
“overeducated” people. Fortunately, this situation was much improved during the third phase,
due to several successful reforms introduced in the higher and professional educational
system. Nevertheless, “overeducation” is a persistent problem and the “overeducated”
unemployed cohort is emigrating outside the country.
In sum, a distinct feature of the Georgian labour market is the shortage of workers with
technical skills. The Georgian Young Economists survey of the business environment in 2007–
5 Source: Human Development Report 2010.http://hdr.undp.org. 6 Jan Rutkowski. Skills Mismatch and Unemployment in Georgia: The Challenge of creating Productive Jobs. World Bank, 2011 7Source: World Bank Statistics 2012. http://databank.worldbank.org/Data/Home.aspx
16%
29%
38%
28%
24%
19%
13% 12% 11% 12%
8%
1%
0%
5%
10%
15%
20%
25%
30%
35%
40%
45%
Averageup to 20 20-24 25-29 30-34 35-39 40-44 45-49 50-54 55-59 60-64 65 andmore
Un
em
plo
yme
nt
rate
Age group

CASE Network Studies & Analyses No. 463 – Costs and Benefits of Labour Mobility Between …
24
088 revealed that there is a high demand for medium and top professional managers, with
technical and skilled qualifications. The construction business lacks qualified skilled labour. A
lot of people are represented on the supply side with the above mentioned qualifications.
Georgian businesses report difficulties in hiring and retaining skilled workers precisely because
they use outdated technology or do not have the necessary scale to provide remuneration that
would be competitive by international standards. In addition, workers probably do not possess
the modern skills required for some specific positions. Official statistics show that the country
has quite a large number of VETs, but their quality is still subpar. The World Competitiveness
Report (2011–12) concludes that Georgia’s inadequately educated workforce represents a
major obstacle for doing business in the country.9 This suggests that the VETs are ineffective
at preparing professionals with the skills that meet current market needs. Our focus group
findings are in line with the World Competitiveness Report. All experts agree that there are
huge gaps between educational programs at VETs and labour market demands, largely
because a comprehensive labour market analysis does not exist.
Low wages are another problematic feature of the Georgian labour market. The average wage
in 2010 was USD 335.30.
Table 6: Wages by sector of economic activity, 2007–2010 (monthly gross wages, in USD)
Source: GeoStat
The ratio of the sector wage to national average wage shows a large sector differentiation,
which is partly connected with sector productivity. In agriculture workers earn only 46.7% of
the country’s average monthly wage. Sectors with relatively high wages are mining and
8 Source: www.economists.ge. (The sample size was about 1,000 and covered small, medium and large businesses’ representatives.) 9 www.weforum.org.
Year
2007 2008 2009 2010
Secto
r
Agriculture, forestry 110.7 200.8 158.0 156.7
Fishing 101.0 141.6 154.0 191.6
Mining, quarrying 393.7 542.8 405.7 455.8
Manufacturing 214.1 342.5 268.1 286.5
Electricity, gas & water 319.5 495.4 459.0 461.7
Construction 296.0 400.8 374.8 376.5
Trade; repair 212.8 342.6 309.9 327.4
Hotels & restaurants 142.7 223.8 218.3 211.8
Transport & conmmunication 294.7 448.0 436.6 441.9
Financial intermediation 607.3 901.5 789.6 716.3
Real estate, renting 242.9 362.4 383.3 334.7
Public administration 350.4 583.4 532.1 545.9
Education 91.6 163.5 161.2 171.2
Health & social work 123.5 205.2 219.5 250.7
Average 250.1 382.5 347.9 352.1

CASE Network Studies & Analyses No. 463 – Costs and Benefits of Labour Mobility Between …
25
quarrying, production and distribution of electricity, gas and water, construction, transport and
communication, financial intermediation, real estate, and public administration.
To conclude, the functioning of the labour market in Georgia is still producing undesirable
outcomes, despite the systemic reforms introduced in the past few years. Georgia remains
characterized by a distorted labour market that lacks dynamism, and the projected changes in
the labour supply point to an increasing role of labour migration in the future, unless the current
mismatches and lack of opportunities are addressed.
The Vocational Education System in Georgia
The problems highlighted in the text with regard to the mismatch between the qualifications of
Georgians and available jobs point to substantial problems with the vocational education system.
Attempts have been made to increase the competitiveness of the labour force through the availability
of different qualification courses. However, this is complicated by the lack of any comprehensive study
and forecast of the structural changes of the national economy, identifying trends in demand changes
and employment dynamics, as well as analysing the structure of existing jobs and their qualitative
characteristics.
The reform in the sphere of vocational education began in 2007. Two types of professional education
institutions are currently being set up in the country, namely colleges and professional education
centres. Colleges are institutions of higher education that carry out higher professional education
programs. Vocational education centres are legal entities of public law that carry out vocational
programs. Vocational education prepares certified specialists and enrolling in a vocational education
program is possible only after graduating from a basic level of general education (which is lower
secondary education, according to ISCED standards, namely 9 years). A supervisory board, consisting
of employers, representatives of social organizations, parents of the students and representatives of
vocational education teachers, represents the highest body of professional education administration
in these institutions.
The VET system is still in transition. The question “how accurately does the VET system meet the
labour market demands?” is still a concern. Some larger enterprises have developed in-house VET
programs for their staff. They do this for two reasons: the existing training centres do not offer the
required training programs and/or the quality of the labour force they employ does not meet the specific
expectations of the enterprises.
The Government of Georgia is currently developing a new strategy for vocational education and
training (VET). The financing model of VET centres has recently changed in order to increase
motivation. The main problems of the current VET system are the following:1 (1) Many VET offerings
provide no further educational options for learners. (2) The VET infrastructure is somewhat outdated,
and the system suffers from under-financing from public sources. (3) There is no evaluation and
monitoring information system, which would allow more effective steering of the system. (4) The social
partners are not involved in the process of policy development and implementation, nor in the
evaluation of VET outcomes at the institutional or national level.

CASE Network Studies & Analyses No. 463 – Costs and Benefits of Labour Mobility Between …
26
4. Labour migration and its impacts on socio-economic
development in Georgia
4.1. Main Features of Georgian Migration
In the late Soviet era, organized migration played a major part in resettling population from
labour-intensive territories to regions lacking such resources. In the case of Georgia, labourers
drifted mainly to Russia through southern Georgia’s border and the majority of migrants were
Armenians who lived in this region. After the collapse of the Soviet Union, Russia remained
the most popular destination for quite a while. Still, post-Soviet labour migration differs from
prior migrations in terms of its scale, causes, social, demographic and economic outcomes, all
of which are discussed in detail below.
The political and economic difficulties of the post-Soviet period were reflected in substantial
changes in the migration processes of Georgia. With economic activity decreasing dramatically
and unemployment skyrocketing, and with political and military strife reaching dangerous
levels, many Georgians sought relief from destitution through emigration in the early years of
Georgia’s independence. By comparing the population censuses of 1989 and 2002, one can
gauge that no less than 1 million people (about a quarter of the population) permanently left
Georgia and settled in foreign countries. In addition, during the same time period, 400,000
people were internally displaced by force from the territories annexed by Russia and continue
living in dire conditions.
According to 2002 census data, most of the permanently resettled population were not ethnic
Georgians. There is no definitive statistical data but all experts agree that ethnic emigration
mainly took place during 1990–1995, the first emigration phase. People who migrated from
Georgia during the first two phases left for the following destinations: Russia (64.5%), Greece
(16.4%), Western Europe (5.6%), US and Canada (3.9%), CIS, except Russia (3.5%), northern
Europe (0.4%), southern Europe (1.2%), Turkey (1.3%), and to Israel (1.7%).10 This historically
brief time period marks a major change in the Georgian population’s ethnic structure. The share
of ethnic Georgians in the total population increased from 70% in 1989 to 82% in 2002.
Since the Rose Revolution, the rate of permanent emigration of the Georgian population has
decreased significantly, although the process is still ongoing due to the country’s lower ranking
in terms of living standards compared to other immigration countries.
10 G. Tsuladze. Emigration from Georgia Based on 2002 Population Census Records. Tbilisi 2005,p. 44.
CASE Network Studies & Analyses No. 463 – Costs and Benefits of Labour Mobility Between …
27
Migration into Georgia, on the other hand, is quite low. According to the UN Population Division,
about 163,000 foreigners had Georgian residence in 2010.
4.2. Labour migration and its main determinants
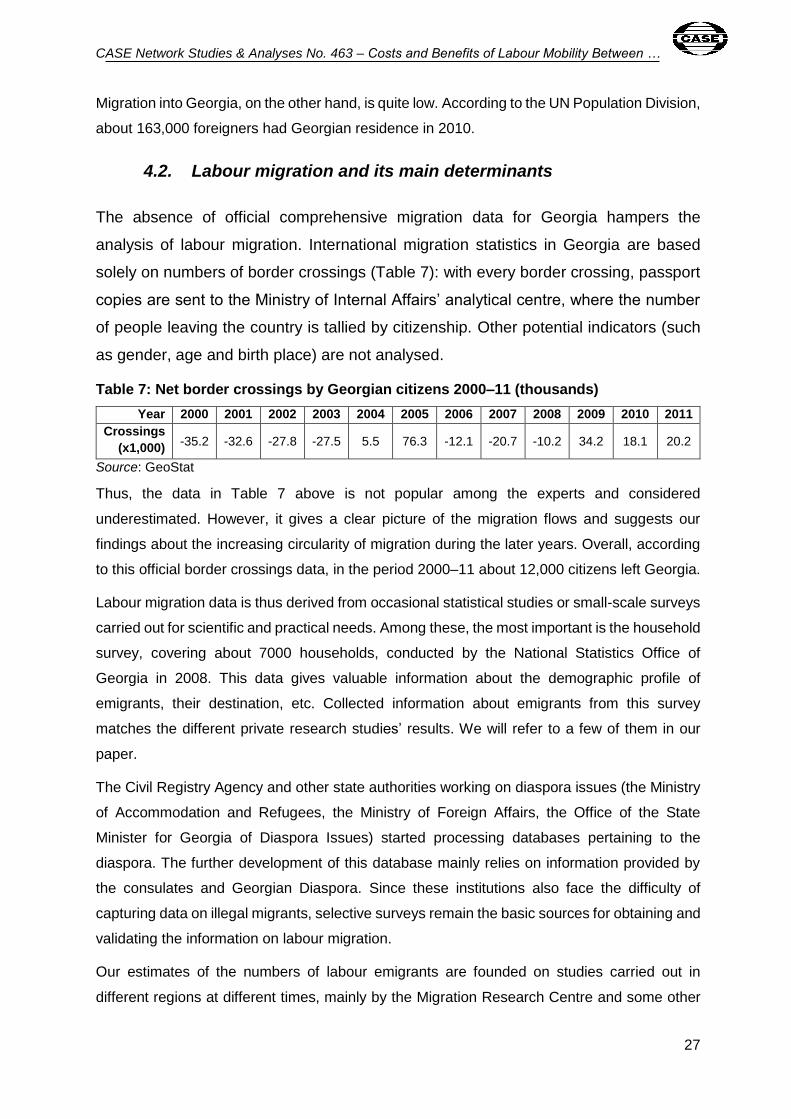
The absence of official comprehensive migration data for Georgia hampers the
analysis of labour migration. International migration statistics in Georgia are based
solely on numbers of border crossings (Table 7): with every border crossing, passport
copies are sent to the Ministry of Internal Affairs’ analytical centre, where the number
of people leaving the country is tallied by citizenship. Other potential indicators (such
as gender, age and birth place) are not analysed.
Table 7: Net border crossings by Georgian citizens 2000–11 (thousands)
Year 2000 2001 2002 2003 2004 2005 2006 2007 2008 2009 2010 2011
Crossings
(x1,000) -35.2 -32.6 -27.8 -27.5 5.5 76.3 -12.1 -20.7 -10.2 34.2 18.1 20.2
Source: GeoStat
Thus, the data in Table 7 above is not popular among the experts and considered
underestimated. However, it gives a clear picture of the migration flows and suggests our
findings about the increasing circularity of migration during the later years. Overall, according
to this official border crossings data, in the period 2000–11 about 12,000 citizens left Georgia.
Labour migration data is thus derived from occasional statistical studies or small-scale surveys
carried out for scientific and practical needs. Among these, the most important is the household
survey, covering about 7000 households, conducted by the National Statistics Office of
Georgia in 2008. This data gives valuable information about the demographic profile of
emigrants, their destination, etc. Collected information about emigrants from this survey
matches the different private research studies’ results. We will refer to a few of them in our
paper.
The Civil Registry Agency and other state authorities working on diaspora issues (the Ministry
of Accommodation and Refugees, the Ministry of Foreign Affairs, the Office of the State
Minister for Georgia of Diaspora Issues) started processing databases pertaining to the
diaspora. The further development of this database mainly relies on information provided by
the consulates and Georgian Diaspora. Since these institutions also face the difficulty of
capturing data on illegal migrants, selective surveys remain the basic sources for obtaining and
validating the information on labour migration.
Our estimates of the numbers of labour emigrants are founded on studies carried out in
different regions at different times, mainly by the Migration Research Centre and some other
CASE Network Studies & Analyses No. 463 – Costs and Benefits of Labour Mobility Between …
28
organizations. These research studies aim to gather information on the share of labour
emigrants in a given population at several micro settlements. We concluded that the labour
emigration ratio varies from one region to another. However, its relatively high value can be
observed everywhere, and the existing number of labour emigrants is estimated to lie between
350,000 and 500,000 people originally from Georgia. Thus, our best estimate is that in the year
2011, 8–11% of the Georgian population had to be considered labour migrants.
According to studies conducted by the International Organization for Migration (IOM), at the
end of the second emigration phase (2003) primarily economic factors accounted for the labour
emigration. Among the factors contributing to labour emigration, 50% of the so-called substitute
respondents (family members of a labour migrant who possess detailed information on working
and living conditions of an emigrated member) emphasize the need for improvement of the
emigrant’s material conditions, 11% forcefully cite the wish to save their family from starvation,
9% highlight several failed attempts to find suitable jobs, 5% point to the impossibility of finding
any kind of job, 4% refer to invitations from foreign employers, 5% benefits from close relatives
living abroad, 12% was simply interested in living and working abroad, 1% married a foreigner,
2% quotes political reasons and 1% other reasons.11
During the third phase of emigration, the survey carried out in 2008 by GeoStat12 shows that
labour emigration is attributable to the following factors: unemployment (66.2%), low wages
(7.9%), forced displacement (0.8%), family conflict (2.2%), and other reasons (19.2%). As we
can see, economic factors dominate in this phase as well.
Our own focus group, which included a number of returned migrants and one family member
of current emigrant, confirmed the findings of the survey. As we found, the focus group
members emigrated at different times but the main reason for all of them was insufficient
income of their families.
Finally, it should be mentioned that labour emigration and remittances became major sources
of subsistence income for large segments of the population in the aftermath of the post-Soviet
period, which brought along a deep economic crisis and the rapid shrinking of the labour market
capacity.
11Labour Migration from Georgia.IOM.2003, p. 21. 12Report of Research conducted by National Statistics Office of Georgia in 2008.
CASE Network Studies & Analyses No. 463 – Costs and Benefits of Labour Mobility Between …
29
4.3. Countries of destination
During the post-Soviet period labour emigration from Georgia was initially directed towards
Russia and Turkey and later spread to other countries.
Currently the labour migrant flow to Turkey is relatively small for several reasons, such as
Turkey’s high unemployment rate, its low wages compared to EU countries or North America,
as well as language and social environment adaptation barriers.
In 2002, with the support of the IOM,13 the Migration Research Center conducted research that
covered the capital of Georgia (Tbilisi), the big industrial city of Rustavi, the single-branch
mining centre of Tkhibuli and the Akhalkalaki region, densely populated with ethnic minorities
(Armenians). The distribution of labour migrant flows across these areas was the following: the
main destination by far was Russia (39%), followed by Greece and USA (14%), Germany
(about 13%), and the other European countries combined (only 11%). The results drawn from
all the research and censuses conducted to date show that the main destination country for
labour emigration is Russia. The National Statistics Office of Georgia derived a similar figure
(about 40%) through a study it conducted in 2008.14 A. Takidze came up with the same figure
(40.4%) while studying the Adjara population emigration in 2006.
It is worth mentioning that, according to the above-mentioned study, a major share of the labour
force that resettled in Russia originates from regional municipalities of Georgia. For example,
Tbilisi accounts for only 15% while Akhalkalaki municipality makes up 95% of the local labour
emigrants gone to Russia. In conclusion, the bigger is an urbanized Georgian settlement the
less it contributes to labour emigration to Russia (Appendix Table 1.3). All other studies support
this finding, which applies not only to the first two emigration phases but also to recent years.
For example, in a study about labour emigration geography conducted by N. Chelidze in 2006,
the author found that in Ambrolauri and Zugdidi municipalities 74% and 75%15 of labour
migrants left for Russia respectively. According to the IOM 2008 publication “Migration in
Georgia: a country profile”, during the third emigration phase (after 2003), the major destination
countries for labour emigration have been: Russia (48%), Greece (13%), Germany (12%), the
United States (10%) and Ukraine (5%).16 Other countries have far smaller shares. Even
Turkey, which neighbours the Autonomous Republic of Adjara and grants visa-free entry into
13Labour Migration from Georgia.IOM.2003, p.24. 14National Statistics Office of Georgia Report. 2008. 15 N. Chelidze. Labour Emigration from Post-Soviet Georgia. Tbilisi, 2006, p. 56. 16Labour Migration from Georgia. IOM. 2008.

CASE Network Studies & Analyses No. 463 – Costs and Benefits of Labour Mobility Between …
30
the country, attracts fewer labour migrants compared to the Russian Federation (41,4%),17
according to the study carried out in this region.
The findings of this 2008 IOM study are similar to the official data available only for 2002 and
2008.
Table 8: Destination countries of Georgian emigrants (%)
2002 2008
Russia 64.4 40.0
Other FSU states 3.6 20.0
European Union 23.0 35.0
Greece 16.3 16.8
Germany 4.3 4.7
Poland 0.1 -
Italy 0.1 4.3
Spain 0.7 3.6
UK 0.4 3.0
Source: GeoStat
It is worth to mention that Italy is becoming a favourable destination for emigrants, especially
for caregivers and household workers. During the focus group discussions it was mentioned
that the compensation for such type of work is almost twice higher compared to Turkey for
example, although it is more difficult to get there.
As we can see, a sharp fall in the number of Georgian labour migrants in Russia can be
observed in recent years and especially after the Russia-Georgia War of 2008. The causes
underlying this fall are the following:
Georgia’s breaking of diplomatic relations with Russia, which led to the deportation of
illegal Georgians in 2006.
The Georgian diaspora’s gaining ground in European countries. More labour emigrants
are acquiring a legal status, contributing to a stronger foothold for migrant workers in
Europe. Labour emigrants are becoming more competitive as well.
English having become the main foreign language being taught across Georgia,
displacing Russians the primary second language, especially among the young.
It is still worth mentioning that the relatively small differences in culture and similar religious
beliefs facilitate the integration process of Georgian emigrants in the Russian society. The
Russian labour market is convenient for Georgia in this sense. As a result, as we highlighted
17A. Takidze. Forming and Use of Labour Resources of Autonomous Republic of Adjara. Tbilisi. 2006, p.63.
CASE Network Studies & Analyses No. 463 – Costs and Benefits of Labour Mobility Between …
31
above, large numbers of Georgia’s labour emigrants still reside there. More than half of the
electronic money transfers to Georgia originate in Russia; undoubtedly, labour emigration
sustained at a normal rate is beneficial for Georgia.
Turkey constituted another important destination country for Georgian emigrants during the
first emigration phase, following Georgia’s independence from the Soviet Union and the
subsequent economic crisis, mainly due to the ease of access and travel arrangements to
Turkey. In later phases Turkey lost its prominence as a destination country for Georgians and
became a principal transit route instead.
Another country hosting large numbers of labour emigrants is Greece, where female migrants
are in high demand (as housemaids, caregivers, janitors, servers) in the secondary labour
market. Germany also attracts scores of labour emigrants, by giving them opportunities to work
and study simultaneously.
Lately, migration flows have taken an apparent turn to diversification among European
countries as well as within these countries. Italy, Spain and Britain’s shares have risen
significantly. In addition, some temporary labour emigrants who had originally settled in Turkey
have subsequently moved to EU countries.
Georgia is not a key country for irregular transit migration as its transport system remains
underdeveloped and the country is not located on the most direct route between destination
and origin countries. However, there is some evidence of transit migration from Armenia, Iran,
as well as from Russia and Ukraine, towards Turkey and the EU member states.
On the other hand, it is necessary to consider the labour emigration perspectives of Georgia’s
population as a whole. Demographic depression in Russia, future demands on the labour force
and the success of Georgian emigrants in business make us think that once the political
situation has settled, it is in the interest of both countries that the effective employment of
Georgia’s population be maintained in the Russian labour market. Moreover, in such a situation
it would be possible to strike a balance and arrive at suitable shares of Georgian labour
migrants for the EU, the US and the CIS countries.
4.4. Demographic structure of migrants
According to the IOM paper of 2003 (the study conducted by the Migration Research Center
with support of the IOM), women accounted for 40% of all labour emigrants from Georgia.
Similarly, women make up 43.4% of labour emigrants according to the study conducted by
GeoStat in 2008. Thus, we can conclude that there was no significant change of gender
composition in emigration flows during the last emigration phase. However, the main
destinations of Georgian male and female migrants are different. Georgian labour emigration
CASE Network Studies & Analyses No. 463 – Costs and Benefits of Labour Mobility Between …
32
is less feminized in Russia. The 2008 study shows that among emigrated women only 26.2%
settles in Russia; this number is slightly higher for Greece (26.8%). On the other hand, more
than half of the emigrated males go to Russia and Greece absorbs only 9.1% of male labour
emigrants.18
The IOM study revealed that labour emigration is marked by age polarization, and that migrants
are likely to be younger than the general population. For example, 41% of emigrants are under
the age of 30.19
The 2008 study cites the following results for the shares of various age groups in labour
emigration: 48.4% are up to 40 years old, 23.7% are 40–49 years old, and the shares decrease
for older age groups.20
The relatively younger age group makes up most of the labour emigrants in Germany as a
great number of them combine work with study there and students dominate in this contingent.
Older Georgian females (working as housemaids, nannies, housekeepers) are dominant in the
labour emigration flow to Greece.
Table 9: Distribution of labour migrants by family status (%)
Marital status Male Female Total
Married 57.7 61.8 59.5 Single 38.5 25.8 33.0 Divorced 2.3 6.4 4.1 Widow(er) 1.5 5.9 3.4 Total 100 100 100
Source: GeoStat, 2008
4.5. Impact of migration on labour market
Mass labour migration creates certain problems for the functioning of the national labour
market. Most emigrants are working-age educated people, as shown by the 2008 GeoStat
survey (Figures 7 and 8). This holds true for both men and women, although women in the 50-
59 age group are in greater proportion than men, perhaps reflecting the demand for household
services in some destination countries. A similar distribution of emigrants by age, gender and
education level is shown by the “Georgia on the Move” (GOTM) survey conducted in 2008
(Appendix Figures 15 and 16).
18Report of National Statistics Office of Georgia. 2008. 19Labour Migration from Georgia.IOM. 2003. p. 32. 20Report of National Statistics Office of Georgia. 2008.

CASE Network Studies & Analyses No. 463 – Costs and Benefits of Labour Mobility Between …
33
Figure 7: Emigrant distribution by age and gender
Source: GeoStat, 2008
Figure 8: Emigrant distribution by education and gender
Source: GeoStat, 2008
Labour migration has undoubtedly served as an escape valve for unemployed resources.
However, over the long run migration may actually exacerbate the demographic problem
mentioned above, which will reduce the labour force in the future. When most emigrants fall in
the reproductive age category, emigration can aggravate the problem of the ageing of the
population.
Looking at the educational distribution, another possible negative effect to be considered is the
“brain drain”. Both the GeoStat (2008) and the GOTM (2008) survey show that the three main
groups of emigrants are people with a secondary, secondary technical or higher education.
0
2
4
6
8
10
12
14
16
18P
erc
en
tage
of
em
igra
nts
(%
)
Age group
Man
Woman
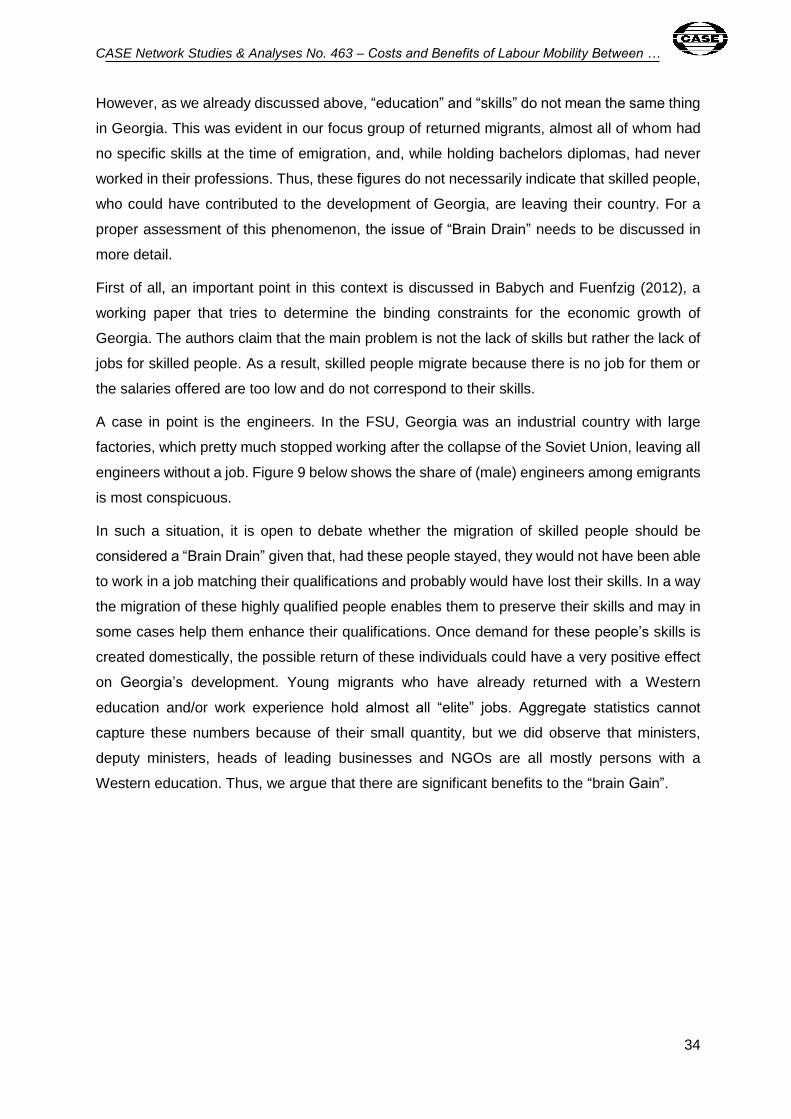
CASE Network Studies & Analyses No. 463 – Costs and Benefits of Labour Mobility Between …
34
However, as we already discussed above, “education” and “skills” do not mean the same thing
in Georgia. This was evident in our focus group of returned migrants, almost all of whom had
no specific skills at the time of emigration, and, while holding bachelors diplomas, had never
worked in their professions. Thus, these figures do not necessarily indicate that skilled people,
who could have contributed to the development of Georgia, are leaving their country. For a
proper assessment of this phenomenon, the issue of “Brain Drain” needs to be discussed in
more detail.
First of all, an important point in this context is discussed in Babych and Fuenfzig (2012), a
working paper that tries to determine the binding constraints for the economic growth of
Georgia. The authors claim that the main problem is not the lack of skills but rather the lack of
jobs for skilled people. As a result, skilled people migrate because there is no job for them or
the salaries offered are too low and do not correspond to their skills.
A case in point is the engineers. In the FSU, Georgia was an industrial country with large
factories, which pretty much stopped working after the collapse of the Soviet Union, leaving all
engineers without a job. Figure 9 below shows the share of (male) engineers among emigrants
is most conspicuous.
In such a situation, it is open to debate whether the migration of skilled people should be
considered a “Brain Drain” given that, had these people stayed, they would not have been able
to work in a job matching their qualifications and probably would have lost their skills. In a way
the migration of these highly qualified people enables them to preserve their skills and may in
some cases help them enhance their qualifications. Once demand for these people’s skills is
created domestically, the possible return of these individuals could have a very positive effect
on Georgia’s development. Young migrants who have already returned with a Western
education and/or work experience hold almost all “elite” jobs. Aggregate statistics cannot
capture these numbers because of their small quantity, but we did observe that ministers,
deputy ministers, heads of leading businesses and NGOs are all mostly persons with a
Western education. Thus, we argue that there are significant benefits to the “brain Gain”.
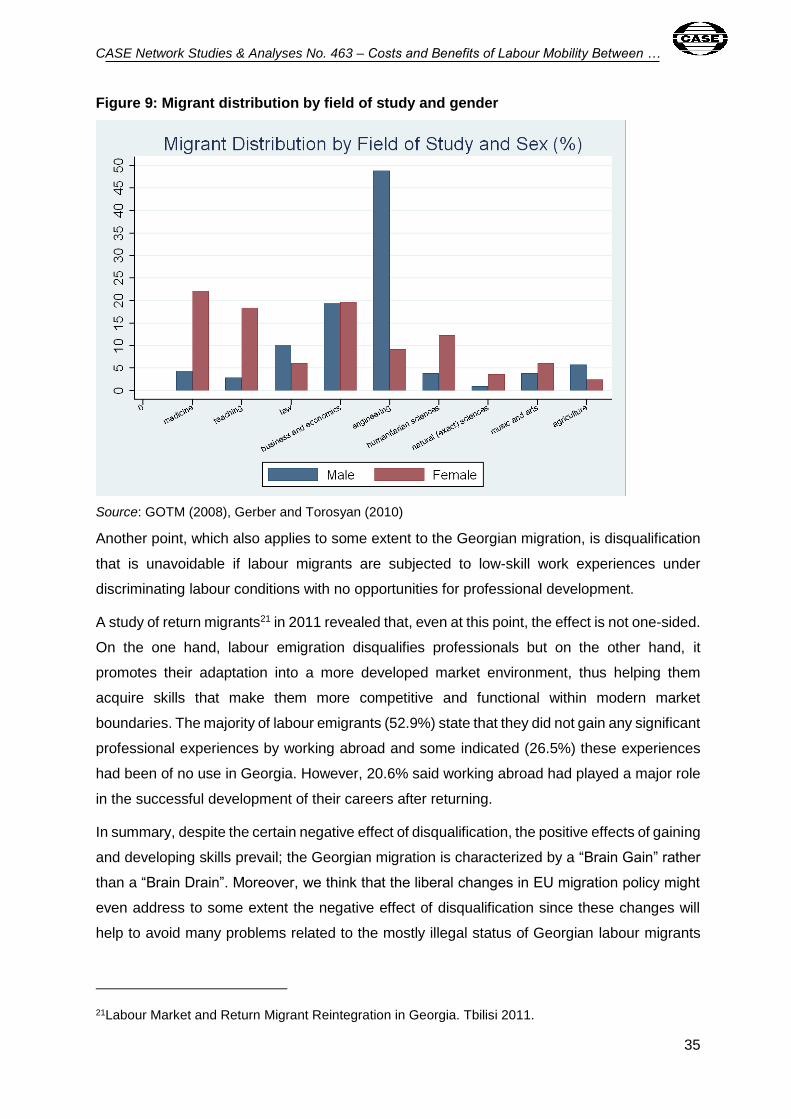
CASE Network Studies & Analyses No. 463 – Costs and Benefits of Labour Mobility Between …
35
Figure 9: Migrant distribution by field of study and gender
Source: GOTM (2008), Gerber and Torosyan (2010)
Another point, which also applies to some extent to the Georgian migration, is disqualification
that is unavoidable if labour migrants are subjected to low-skill work experiences under
discriminating labour conditions with no opportunities for professional development.
A study of return migrants21 in 2011 revealed that, even at this point, the effect is not one-sided.
On the one hand, labour emigration disqualifies professionals but on the other hand, it
promotes their adaptation into a more developed market environment, thus helping them
acquire skills that make them more competitive and functional within modern market
boundaries. The majority of labour emigrants (52.9%) state that they did not gain any significant
professional experiences by working abroad and some indicated (26.5%) these experiences
had been of no use in Georgia. However, 20.6% said working abroad had played a major role
in the successful development of their careers after returning.
In summary, despite the certain negative effect of disqualification, the positive effects of gaining
and developing skills prevail; the Georgian migration is characterized by a “Brain Gain” rather
than a “Brain Drain”. Moreover, we think that the liberal changes in EU migration policy might
even address to some extent the negative effect of disqualification since these changes will
help to avoid many problems related to the mostly illegal status of Georgian labour migrants
21Labour Market and Return Migrant Reintegration in Georgia. Tbilisi 2011.
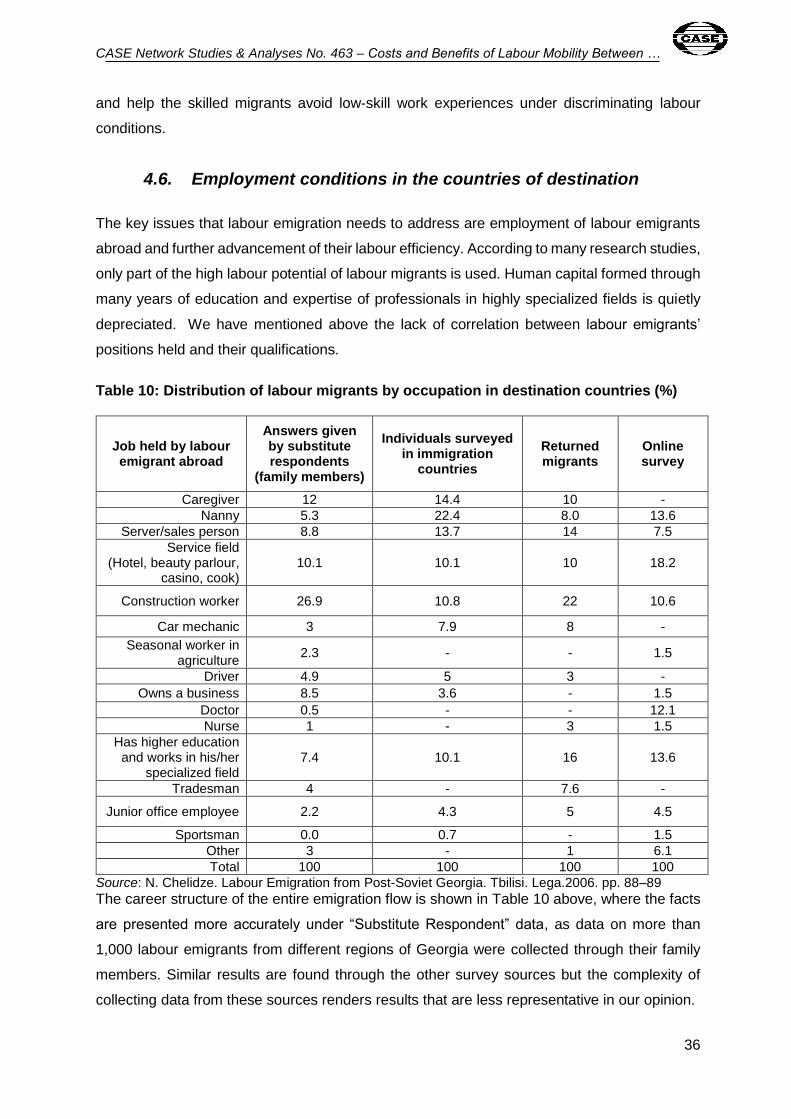
CASE Network Studies & Analyses No. 463 – Costs and Benefits of Labour Mobility Between …
36
and help the skilled migrants avoid low-skill work experiences under discriminating labour
conditions.
4.6. Employment conditions in the countries of destination
The key issues that labour emigration needs to address are employment of labour emigrants
abroad and further advancement of their labour efficiency. According to many research studies,
only part of the high labour potential of labour migrants is used. Human capital formed through
many years of education and expertise of professionals in highly specialized fields is quietly
depreciated. We have mentioned above the lack of correlation between labour emigrants’
positions held and their qualifications.
Table 10: Distribution of labour migrants by occupation in destination countries (%)
Job held by labour emigrant abroad
Answers given by substitute respondents
(family members)
Individuals surveyed in immigration
countries
Returned migrants
Online survey
Caregiver 12 14.4 10 -
Nanny 5.3 22.4 8.0 13.6
Server/sales person 8.8 13.7 14 7.5
Service field (Hotel, beauty parlour,
casino, cook) 10.1 10.1 10 18.2
Construction worker 26.9 10.8 22 10.6
Car mechanic 3 7.9 8 -
Seasonal worker in agriculture
2.3 - - 1.5
Driver 4.9 5 3 -
Owns a business 8.5 3.6 - 1.5
Doctor 0.5 - - 12.1
Nurse 1 - 3 1.5
Has higher education and works in his/her
specialized field 7.4 10.1 16 13.6
Tradesman 4 - 7.6 -
Junior office employee 2.2 4.3 5 4.5
Sportsman 0.0 0.7 - 1.5
Other 3 - 1 6.1
Total 100 100 100 100
Source: N. Chelidze. Labour Emigration from Post-Soviet Georgia. Tbilisi. Lega.2006. pp. 88–89
The career structure of the entire emigration flow is shown in Table 10 above, where the facts
are presented more accurately under “Substitute Respondent” data, as data on more than
1,000 labour emigrants from different regions of Georgia were collected through their family
members. Similar results are found through the other survey sources but the complexity of
collecting data from these sources renders results that are less representative in our opinion.

CASE Network Studies & Analyses No. 463 – Costs and Benefits of Labour Mobility Between …
37
The above-mentioned analysis of the employed contingent in immigration countries (Russia,
Germany, Greece, USA) shows that the majority of emigrants in Greece (80.0%) work as
caregivers, nannies and housekeepers/cleaners, while only 3.2% of individuals hold similar
positions in Russia. Moreover, 12.9% of labour emigrants in Russia run their own businesses,
which is less frequently the case in other countries. Also, Russia hosts the largest number of
labour emigrants working in their specialized field (13%). In our opinion, two contributing factors
here are market demand and better language proficiency.
Russia has particular pull factors for teachers (29%), engineers (32.3%), and economists
(23.8%). Germany attracts foreign language specialists (28.6%). Greece draws teachers,
economists and engineers. The USA receives economists, engineers, etc.
A recently returned migrants’ study22 revealed every fifth respondent had found a job prior to
arriving in their destination country; 44.1% had found employment immediately upon arrival;
21.6% had had to wait around for 3 months and 14.7% had needed longer to find a position.
It is worth mentioning that 52.8% of labour emigrants had found a job through relatives or
friends; 11.3% had managed to get employed independently; 12.3% had received help from
agencies and “black brokers”. Information bureaus, street and office announcements had
hardly assisted anyone in finding a position.
Only 36.6% of individuals had signed an official employment contract. Most emigrants (64%)
had made an oral agreement with their employer. The terms and conditions of most
employment contracts for labour migrants mainly define salary, working hours, number of days
off, food and board issues, etc. Adherence to international labour standards in contracts is rare,
especially in reference to working hours. The study revealed that every third respondent’s
working day had lasted more than 10 hours. Only every third person had worked 8 hours a
day. Other working terms had not been appealing either.
4.7. Social and living adaptation
All studies of Georgian labour migration bear evidence of labour emigrants’ social hardship in
the receiving countries. An analysis of their legal and social status proves the point. However,
it should be noted that a comprehensive analysis is not feasible since most labourers residing
abroad illegally, or former illegals as well as their relatives prefer not to participate in surveys;
consequently, it is difficult to record the precise number of illegals. In this respect, the data
22Labour Market and Returned Migrant Reintegration in Georgia. Tbilisi. 2012. pp.95-96.

CASE Network Studies & Analyses No. 463 – Costs and Benefits of Labour Mobility Between …
38
provided by different studies may not be entirely accurate as they run into the same kind
problems while collecting the information. One of our focus groups, a member who returned
after nine years in the US said “I can only be grateful to my employers as they really made my
life easier there. I never lacked food and board and had no problems commuting once under
employment.” Another participant, who was temporary visiting Georgia also said that she fills
comfortable in the family she lives in Turkey. By some estimates, about 75% of the Georgian
emigrants are illegal residents. Table 11 shows official statistics about the distribution of
returned migrants by their legal status abroad.
Table 11: Distribution of returned migrants according to their legal status abroad (%)
Status %
Has (had) citizenship 5.6
Has (had) work authorization and permanent resident card 28.3
Has (had ) permanent resident card 6.6
Has (had) only temporary registration card 30.1
Did not have official status 25.5
Other 3.9
Total 100
Source: GeoStat, 2008
Besides having to adapt to new labour conditions abroad, emigrants also go through a social
adjustment period or even experience a culture shock. Even 20 years of work experience did
not really facilitate for the process of adaptation to a new social environment; the need to fit in
still leaves its marks on many emigrants. According to the 2003 IOM study, only 48% of
interviewees had managed to easily adapt to their new social and living conditions.

CASE Network Studies & Analyses No. 463 – Costs and Benefits of Labour Mobility Between …
39
Table 12: Distribution of labour migrants by level of adaptation to the social
environment according to recipient countries (%)
Country of
immigration
Adaptation Ru
ssia
Gre
ec
e
Germ
an
y
US
A
Isra
el
Belg
ium
Oth
er
EU
Co
un
trie
s
Azerb
aij
an
Arm
en
ia
Oth
er
co
un
trie
s
To
tal
Adapted easily
(to the way and
conditions of life)
48.8 32.2 47.3 52.2 50.0 30.0 48.7 44.4 47.3 70.4 48.0
Could not adapt
to living
conditions
2.4 16.7 2.2 2.2 - - 2.7 - - 3.7 2.0
Adapted with
difficulty 26.2 51.1 13.2 9.8 37.5 - 12.2 22.2 13.2 11.1 18.0
Adapted, but
found it difficult
to be away from
home & relatives
21.4 - 37.4 35.9 12.5 70.0 36.5 33.3 37.4 14.8 32.0
Other 1.2 - - - - - - - - - 0.0
Total 100 100 100 100 100 100 100 100 100 100 100
Source: Labour Migration from Georgia.IOM.2003.p.44.
As demonstrated above, Georgian labour migrants to Greece exhibit the least adaptability. To
some extent, belonging to a higher age group with a relatively low education level and having
jobs far beyond their qualifications could account for their lack of adjustment capabilities.
Some adaptation problems were also observed in Russia. The language barrier definitely is to
be blamed there as most labour migrants in this sample came from the provinces; as a result,
their lack of proficiency significantly reduced their chances of employment in their specialized
fields (engineers, teachers, lawyers). In addition, the exaggerated fear of migrants (migrant
phobia) felt by local residents, especially of people of Georgian origin, and special hostility
towards them make it hard for this category of emigrants to feel comfortable socially.
The poor living conditions often experienced by labour emigrants abroad do not make the local
environment appealing to them either. Most studies show that the living conditions of labour
migrants are hardly ever acceptable and often much worse overseas (often abnormally so)
than in their home country.
The returned migrants’ survey of 201123 shows that a quarter of migrants (nannies, caregivers,
housemaids) had lived in their employer’s home; 27.1% had lived in rented places with friends
23Labour Market and Returned Migrant Reintegration in Georgia. Tbilisi. 2012.

CASE Network Studies & Analyses No. 463 – Costs and Benefits of Labour Mobility Between …
40
and 36.6% had stayed with a spouse, brother/sister, daughter/son, relative, or parent. Only
one out of ten individuals had resided alone.24
One of the key concerns of labour emigration is health safety in the destination country. Since
most immigrants are illegal or not quite legal residents, they basically do not qualify for health
care programs or social security. This lack of protection further complicates the health issues
of migrants. A recent study of the Migration Research Center25 shows that 82% of the
emigrated population had felt healthy at the time of departure but only 52% reported being fit
upon their return. Two-thirds of the interviewees had needed medical treatment abroad. Only
one out of 10 individuals had managed to get hospital treatment and 23.9% had received
ambulatory care; 42% had resorted to their own remedies and 19.4% had not been able to
afford any kind of treatment at all.
The main causes of health problems given were working under too much pressure (41.8%),
the stress of living in an unhealthy social environment (21.3%) and unfavourable working
conditions. Therefore, the health care system should be improved, both for returned migrants
and for those still working abroad. Moreover, their further rehabilitation should be facilitated
through the implementation of special programs by state organizations and NGOs working in
this sphere. It is vital to get health care providers abroad more involved in order to better protect
their immigrant population.
4.8. Incomes of migrants and remittances
Remittances have become one of the major external income sources in Georgia, not
surprisingly given the large share of the migrated population. According to the National Bank
of Georgia, the remittances in Georgia have even exceeded total FDI since 2009 (Figure 10).
The share of remittances in GDP picked up in 2011, when it constituted slightly more than 10%.
It should be noted that due to the use of different approaches and the difficulty of tracking
remittances, several sources come up with different data. We will introduce primarily data from
the National Bank of Georgia (NBG) as it is the most comprehensive and complete data.
24Labour Market and Returned Migrant Reintegration in Georgia. Tbilisi. 2012. p.94 25Labour Market and Returned Migrant Reintegration in Georgia. Tbilisi. 2012, pp. 96-97.
CASE Network Studies & Analyses No. 463 – Costs and Benefits of Labour Mobility Between …
41
Figure 10: Remittances and FDI as a percentage of GDP
Source: NBG
It should also be noted that the NBG only records money flows through official channels. It is
therefore likely that the NBG data slightly underestimates the remittances. For example, in
2008 remittances exceeded USD 1 billion, that is, 7.6% of Georgia’s GDP, taking into account
only remittances sent through official channels. Adding data on remittances sent home in 2008
through unofficial channels, provided by other sources,26 raises the figure to 10.6% of GDP.
The data on total remittances (as a percentage of GDP) already gives an idea of the importance
of remittances for Georgia. But disaggregating this data by country may give some valuable
additional insights.
First, it is evident that the Russian Federation is the major source of remittances for Georgia.
The amount of remittances from Russia has drastically increased over the last decade. While
Russia displaced the USA from first place back in 2002, its remittances continued to increase
(aside from the fall during the 2008 crisis) and today the flow of remittances from Russia is
much higher than from any other source (Figure 11).
26Aslamazisvili N. Datashvili V. Labour Migration and Remittances in Georgia: Advantages and Disadvantages. Jr. Social Economics. 2009. #2.
0%
5%
10%
15%
20%
25%
2000 2001 2002 2003 2004 2005 2006 2007 2008 2009 2010 2011
Remittances, % of GDP FDI, % of GDP Export, % of GDP
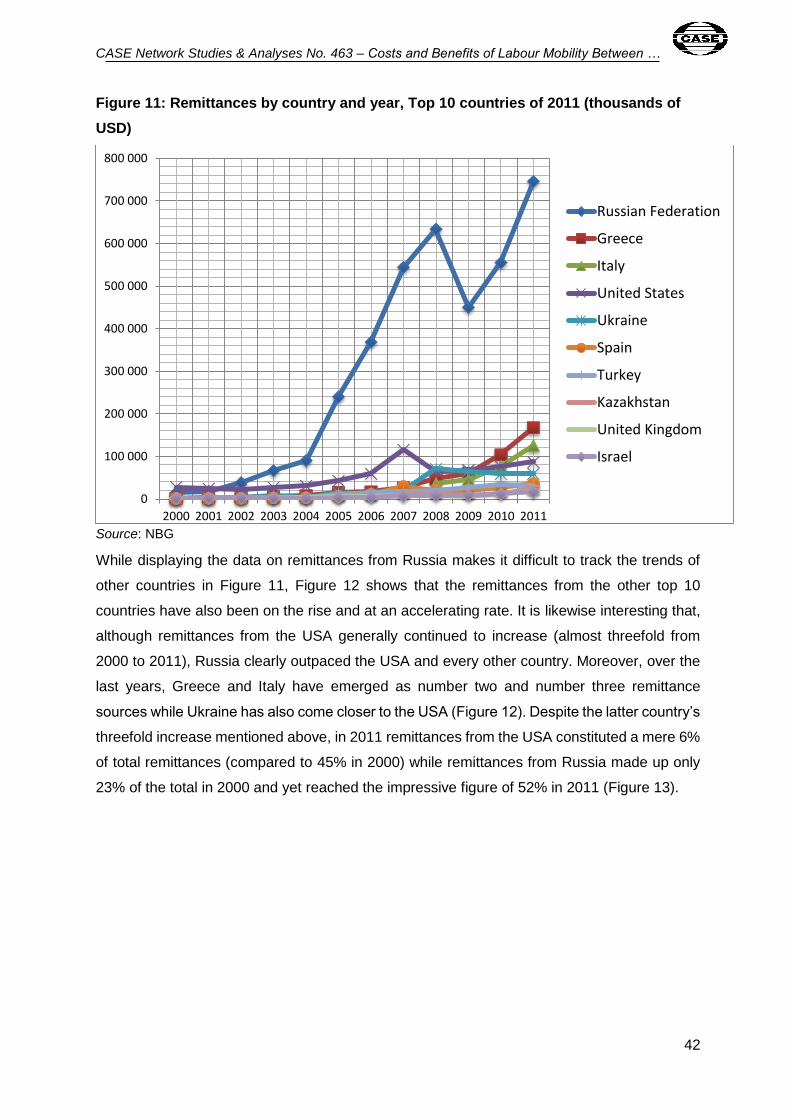
CASE Network Studies & Analyses No. 463 – Costs and Benefits of Labour Mobility Between …
42
Figure 11: Remittances by country and year, Top 10 countries of 2011 (thousands of
USD)
Source: NBG
While displaying the data on remittances from Russia makes it difficult to track the trends of
other countries in Figure 11, Figure 12 shows that the remittances from the other top 10
countries have also been on the rise and at an accelerating rate. It is likewise interesting that,
although remittances from the USA generally continued to increase (almost threefold from
2000 to 2011), Russia clearly outpaced the USA and every other country. Moreover, over the
last years, Greece and Italy have emerged as number two and number three remittance
sources while Ukraine has also come closer to the USA (Figure 12). Despite the latter country’s
threefold increase mentioned above, in 2011 remittances from the USA constituted a mere 6%
of total remittances (compared to 45% in 2000) while remittances from Russia made up only
23% of the total in 2000 and yet reached the impressive figure of 52% in 2011 (Figure 13).
0
100 000
200 000
300 000
400 000
500 000
600 000
700 000
800 000
2000 2001 2002 2003 2004 2005 2006 2007 2008 2009 2010 2011
Russian Federation
Greece
Italy
United States
Ukraine
Spain
Turkey
Kazakhstan
United Kingdom
Israel

CASE Network Studies & Analyses No. 463 – Costs and Benefits of Labour Mobility Between …
43
Figure 12: Remittances by country and year, Top 10 of 2011 without Russia (thousands of USD)
Source: NBG
In order to explain the rapid growth of remittances from Russia since 2004, it is important to
bear in mind that the NBG only records the remittances sent through official channels. Prior to
the current administration, the borders with Russia were open and quite a large share of
remittances was sent through unofficial channels (people used to carry cash in their pockets).
The worsening political relationship of Georgia and Russia made border crossings more
difficult, leading to a shift in the flow of remittances towards official sources.
0
20 000
40 000
60 000
80 000
100 000
120 000
140 000
160 000
180 000
2000 2001 2002 2003 2004 2005 2006 2007 2008 2009 2010 2011
Greece
Italy
United States
Ukraine
Spain
Turkey
Kazakhstan
United Kingdom
Israel
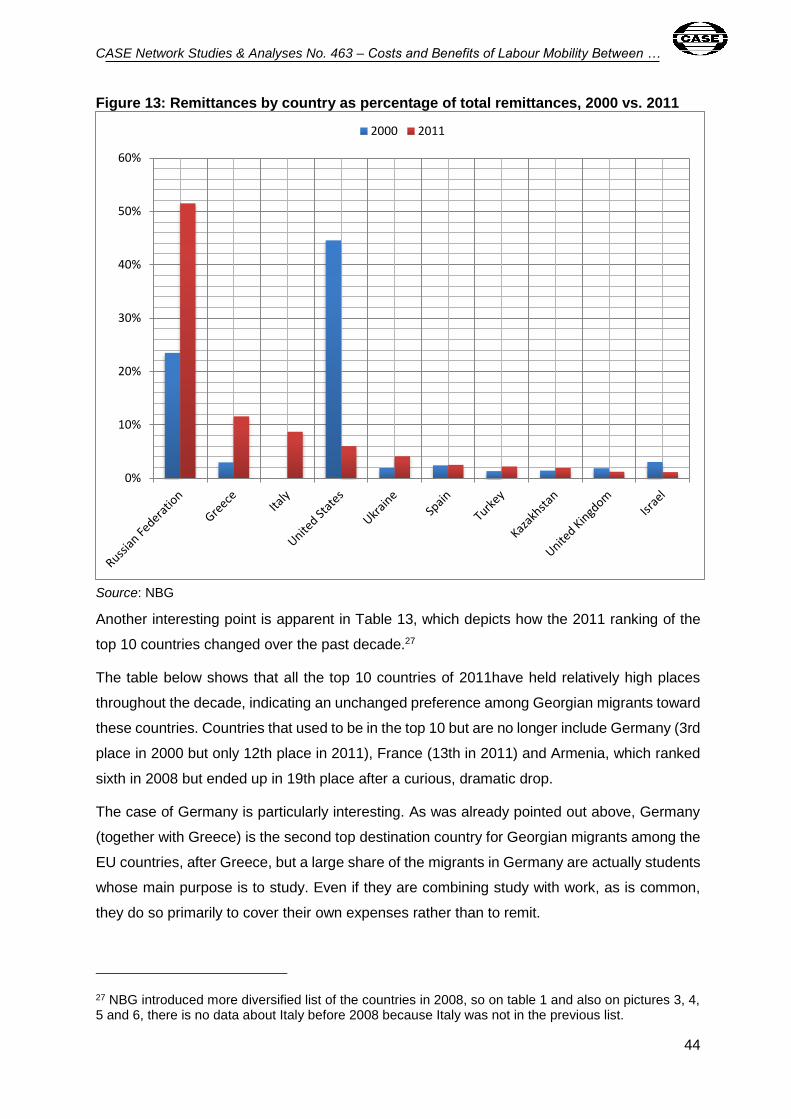
CASE Network Studies & Analyses No. 463 – Costs and Benefits of Labour Mobility Between …
44
Figure 13: Remittances by country as percentage of total remittances, 2000 vs. 2011
Source: NBG
Another interesting point is apparent in Table 13, which depicts how the 2011 ranking of the
top 10 countries changed over the past decade.27
The table below shows that all the top 10 countries of 2011have held relatively high places
throughout the decade, indicating an unchanged preference among Georgian migrants toward
these countries. Countries that used to be in the top 10 but are no longer include Germany (3rd
place in 2000 but only 12th place in 2011), France (13th in 2011) and Armenia, which ranked
sixth in 2008 but ended up in 19th place after a curious, dramatic drop.
The case of Germany is particularly interesting. As was already pointed out above, Germany
(together with Greece) is the second top destination country for Georgian migrants among the
EU countries, after Greece, but a large share of the migrants in Germany are actually students
whose main purpose is to study. Even if they are combining study with work, as is common,
they do so primarily to cover their own expenses rather than to remit.
27 NBG introduced more diversified list of the countries in 2008, so on table 1 and also on pictures 3, 4, 5 and 6, there is no data about Italy before 2008 because Italy was not in the previous list.
0%
10%
20%
30%
40%
50%
60%
2000 2011

CASE Network Studies & Analyses No. 463 – Costs and Benefits of Labour Mobility Between …
45
Table 13: Ranking of 2011’s top 10 remitting countries over time
Year
20
00
20
01
20
02
20
03
20
04
20
05
20
06
20
07
20
08
20
09
20
10
20
11
Re
mit
tin
g C
ou
ntr
ies
Russia 2 2 1 1 1 1 1 1 1 1 1 1
Greece 5 4 3 4 3 3 3 4 4 4 2 2
Italy 5 5 3 3
USA 1 1 2 2 2 2 2 2 3 2 4 4
Ukraine 7 9 5 3 7 4 5 5 2 3 5 5
Spain 6 6 8 10 8 6 6 3 8 7 7 6
Turkey 11 10 10 9 5 5 4 6 7 6 6 7
Kazakhstan 10 11 12 13 12 12 10 7 9 12 11 8
UK 9 8 7 6 6 8 7 8 12 13 9 9
Israel 4 5 6 8 10 9 9 9 11 11 10 10
Source: NBG
Considering the analysis above, the following conclusions may be drawn. Remittances play an
important role in the Georgian economy and the group of countries that Georgians prefer to
migrate to is more or less stable. However, even though the share of remittances from Greece
and Italy is quite significant (12% and 9% respectively), only these two EU countries appear in
the top 5 while the other two EU members, Spain and the UK, are listed in the top 10. Clearly,
in terms of remittances Georgia does not rely heavily on EU countries but first and foremost on
the FSU countries, especially the Russian Federation, from where Georgia is receiving more
than half of its total remittances.
4.9. Impact of remittances on the economic and social conditions
of Georgian households
There is quite a large amount of literature in Georgia on migration and its effects, be it very few
studies that specifically address the effects of remittances. This topic is generally controversial
since remittances themselves, like migration in general, may have both positive and negative
effects. Yet most of these effects heavily depend on the specificities of each country and the
remittance structure. Clearly, not all possible repercussions may apply to Georgia and,
conversely, some may be specific to Georgia.
Quite optimistic are the results of a study entitled “Remittances in Georgia: Correlates,
Economic Impact and Social Capital Formation”, by Gerber and Torosyan (2010). According
to the authors, in the case of Georgia remittances improve the welfare of the households mostly
without producing the adverse effects often suggested in the worldwide literature on the
subject. In Georgia remittances are used to buy consumer goods, increase savings and
spending on education (at least in urban areas) and improve health care (particularly in rural
areas).

CASE Network Studies & Analyses No. 463 – Costs and Benefits of Labour Mobility Between …
46
Figure 14: Spending distribution of remittances
Source: GOTM (2008), Gerber and Torosyan
Very little evidence was found for the premise that remittances create disincentives to work in
urban areas and that they put a downward pressure on the earnings of those who are left
behind in rural areas. Moreover, the study detected one effect that had never been discussed
previously in the literature. It appears that remittances in Georgia foster social capital formation
by increasing the volume of gifts that households give to other households.
This effect is very typical for Georgia (clearly, not only Georgia) given the cultural habits of the
Georgian people. Large families, for instance, are very common in Georgia and the Georgians
highly value their relationships with friends and relatives. A numbers of families often support
each other to deal with problems and very frequently one migrant tries to feed not just one but
several families.
However, this study failed to find some of the positive effects sometimes associated with
migration. For example, there was little to suggest remittances actually stimulated small
business investment.
4.10. Macroeconomic determinants and effects of remittances
On a macro level, considering the share of remittances in GDP shown in the previous chapter,
the clearest effect is the improvement of the export-import balance. Table 14 shows the results
of an analysis of determinants of remittances conducted by Givi Melkadze,28 using quarterly
28Macroeconomic Determinants of Remittances in Georgia.2012.GiviMelkadze, ISET, working paper.
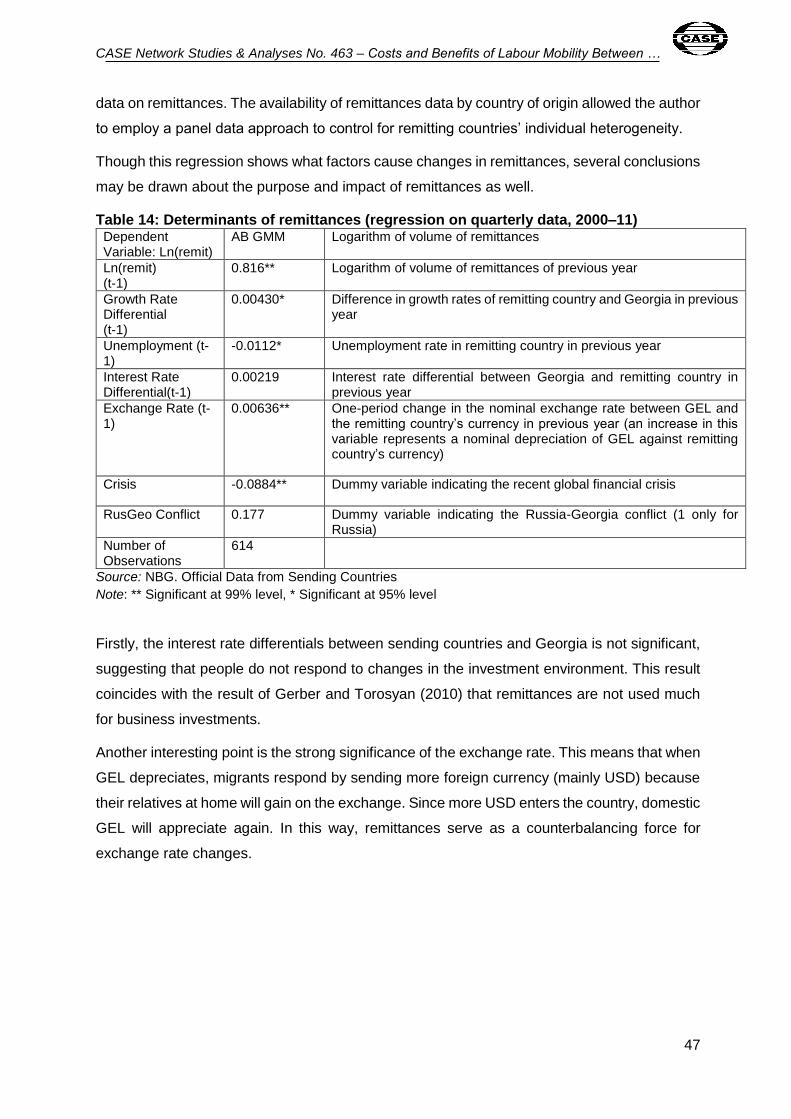
CASE Network Studies & Analyses No. 463 – Costs and Benefits of Labour Mobility Between …
47
data on remittances. The availability of remittances data by country of origin allowed the author
to employ a panel data approach to control for remitting countries’ individual heterogeneity.
Though this regression shows what factors cause changes in remittances, several conclusions
may be drawn about the purpose and impact of remittances as well.
Table 14: Determinants of remittances (regression on quarterly data, 2000–11) Dependent Variable: Ln(remit)
AB GMM Logarithm of volume of remittances
Ln(remit) (t-1)
0.816** Logarithm of volume of remittances of previous year
Growth Rate Differential (t-1)
0.00430* Difference in growth rates of remitting country and Georgia in previous year
Unemployment (t-1)
-0.0112* Unemployment rate in remitting country in previous year
Interest Rate Differential(t-1)
0.00219 Interest rate differential between Georgia and remitting country in previous year
Exchange Rate (t-1)
0.00636** One-period change in the nominal exchange rate between GEL and the remitting country’s currency in previous year (an increase in this variable represents a nominal depreciation of GEL against remitting country’s currency)
Crisis -0.0884** Dummy variable indicating the recent global financial crisis
RusGeo Conflict 0.177 Dummy variable indicating the Russia-Georgia conflict (1 only for Russia)
Number of Observations
614
Source: NBG. Official Data from Sending Countries
Note: ** Significant at 99% level, * Significant at 95% level
Firstly, the interest rate differentials between sending countries and Georgia is not significant,
suggesting that people do not respond to changes in the investment environment. This result
coincides with the result of Gerber and Torosyan (2010) that remittances are not used much
for business investments.
Another interesting point is the strong significance of the exchange rate. This means that when
GEL depreciates, migrants respond by sending more foreign currency (mainly USD) because
their relatives at home will gain on the exchange. Since more USD enters the country, domestic
GEL will appreciate again. In this way, remittances serve as a counterbalancing force for
exchange rate changes.
CASE Network Studies & Analyses No. 463 – Costs and Benefits of Labour Mobility Between …
48
5. Migration Policies and Institutions
Georgia borders four countries – Armenia, Azerbaijan, Russia and Turkey. With 1,461 km total
length of state border (including 310 km of sea border), the country operates 19 official border
crossings, 16 of which have international and 3 of which have interstate status.
Russia and Georgia have agreed to delimit 80 per cent of their common border, leaving certain
small, strategic segments and the maritime boundary not yet demarcated. Since mid-2006, all
land and sea borders between Georgia and Russia have been closed, following a unilateral
decision by Russia prompted by strained diplomatic relations between the two countries.
Relations further worsened in 2008, when this tense situation culminated and Russia occupied
20% of Georgian territories (Abkhazia and South Ossetia). Because of this situation, there are
currently no direct transport links between Georgia and Russia. Nevertheless, in 2012 the
Georgian government unilaterally decided to introduce a visa-free regime with Russia.
The Georgian government does not currently exert control over the two conflict areas
mentioned above, including control over movements in those regions, especially regarding
border crossings from and into Russia. The Georgian government applies a strict policy against
foreigners who enter Georgia illegally, in particular when this concerns entry through the
conflict zones of Abkhazia and South Ossetia. This mainly affects aliens who, knowingly or
unknowingly, enter Georgia without officially registering their entry into the country.
Generally, Georgia has an extremely liberal and open policy on migration in line with its free
market policies: it has a very liberal visa regime, in terms of visa categories as well as in relation
to visa issuance at its borders.
Until 2011, the coordination mechanism between government entities and ministries with
regard to migration issues was very weak, or even non-existent. But in 2011, the State
Commission on Migration Issues was set up, whose main goal was to strengthen the
coordination between agencies working on migration issues.
A number of ministries and other government entities are represented in the Migration
Commission: the Ministry of Foreign Affairs, the Ministry of Internally Displaced Persons from
the Occupied Territories, Accommodation and Refugees of Georgia, the Ministry of Finance,
the Civil Registry and Migration Department under the Ministry of Justice, the Ministry of
Education and Science (it is actively involved, takes care of returning migrants' professional
development and facilitates their integration), the Ministry of Economy and Sustainable

CASE Network Studies & Analyses No. 463 – Costs and Benefits of Labour Mobility Between …
49
Development, the National Statistics Office of Georgia, the Georgian Parliament, the European
Integration Ministry and the Ministry of Diaspora (all actively involved as well). Meetings are
held at least once a month.
The Commission is working on a migration strategy, and an action plan should be ready by the
end of 2012. The Commission also intends to improve the legal framework for migration issues.
The main points discussed in the draft migration strategy document are the promotion of legal
emigration, the fight against and prevention of illegal migration, asylum system development
and the promotion of dignified return and reintegration. The draft migration strategy document
clearly defines the responsibilities of the different entities involved (e.g., MIA, the Ministry of
Internal Affairs, is responsible for border protection, the Ministry of Diaspora is in charge of
cooperation and relations with diasporas, the Ministry of Education and Science will take care
of returned migrants’ professional development).
5.1. Relationships with EU
In 2004 Georgia was invited to intensify political, security, economic and cultural relations with
the EU, based on the so-called EU/Georgia Action Plan29, the political document laying out the
strategic objectives of the cooperation between Georgia and the EU. The EU/Georgia Action
Plan was developed in the framework of the European Neighbourhood Policy (ENP) and
covered a timeframe of 5 years; it was signed in November 2006. Implementation of the Action
Plan was expected to bring Georgian legislation, norms and standards closer to those of the
EU. One of the Action Plan’s priorities was to “Enhance cooperation in the field of justice,
freedom and security, including in the field of border management”. Specific planned actions
included migration management (readmission, visas and asylum); enhanced dialogue on
migration issues, including prevention and control of illegal migration and readmission of own
nationals, stateless persons and third-country nationals.
On May 7, 2009, The Heads of Governments and representatives of different Republics,
including Georgia, and representatives of the EU as well as its Member States met in Prague
to bring their relationship to a new level by establishing the Eastern Partnership and adopted
the “Joint Declaration of the Prague Eastern Partnership Summit”. The declaration addressed,
among other things, “a more ambitious partnership between the European Union and the
partner countries” and “deeper bilateral engagement”. On the latter point it stated: “Supporting
mobility of citizens and visa liberalization in a secure environment is another important aspect
of the Eastern Partnership. It will promote mobility of citizens of the partner countries through
29EU/Georgia Action Plan http://ec.europa.eu/environment/enlarg/pdf/enp_action_plan_georgia.pdf.

CASE Network Studies & Analyses No. 463 – Costs and Benefits of Labour Mobility Between …
50
visa facilitation and readmission agreements; the EU, in line with its Global Approach to
Migration, will also take gradual steps towards full visa liberalization as a long term goal for
individual partner countries on a case-by-case basis provided that conditions for well-managed
and secure mobility are in place”30.
Acting within the existing framework for cooperation, in particular the EU-Georgia European
Neighbourhood Policy Action Plan, and taking account of the Joint Declaration mentioned
above, the Council of the European Union confirmed its commitment to “improving facilitation
of movement of persons between Georgia and the European Union, whilst working to ensure
better management of migration flows, including preventing and reducing illegal migration
flows”31. The EU has opted for a Mobility Partnership based on reciprocity: “The Mobility
Partnership will have the purpose of better managing legal migration including circular and
temporary migration, in particular for development purposes, within the limits of the respective
competences of the Signatories and taking into account their labour market and socio-
economic situation, establishing cooperation on migration and development, and preventing
and combating illegal immigration and trafficking in and smuggling of human beings, as well
as promoting an effective readmission and return policy, while respecting human rights and
the relevant international instruments for the protection of refugees and taking into account the
situation of individual migrants and the socioeconomic development of the Signatorie”.
As a result, in 2011, the Council of the EU concluded two agreements with Georgia: one on
visa facilitation and one on readmission. Both agreements entered into force on March 1,
201132. The visa facilitation agreement makes it easier and cheaper for Georgian citizens, in
particular those who travel a lot, to acquire short-stay visas for travels to and throughout the
EU. The readmission agreements between the EU and third countries set out clear obligations
and procedures for the authorities of EU member states and the third countries concerned as
to when and how to take back people who are illegally residing in the territories of the parties.
A Presidential Decree dated April 26, 2011, appointed the MIA as the state structure
responsible for implementing the readmission agreement signed by Georgia with the EU that
came into force on March 1, 201133. In this context, it is worthwhile noting that the Ministry of
30Joint Declaration of the Prague Eastern Partnership Summit 2009 http://www.consilium.europa.eu/uedocs/cms_data/docs/pressdata/en/er/107589.pdf. 31Joint Declaration on a Mobility Partnership between the European Union and Georgia http://www.consilium.europa.eu/uedocs/cms_data/docs/pressdata/en/jha/111580.pdf. 32Conclusion of two EU agreements with Georgia on visa facilitation and readmission 2011. http://www.consilium.europa.eu/uedocs/cms_data/docs/pressdata/en/jha/118885.pdf. 33 A dedicated e-mail address was created within the MIA for receipt of all requests related to readmission. The International Relations Division in the Patrol Police Department has been tasked with the coordinating function in terms of receipt of these requests and its subsequent processing in close coordination with the Ministry of Foreign Affairs and the Civil Registry Agency, among other government agencies.
CASE Network Studies & Analyses No. 463 – Costs and Benefits of Labour Mobility Between …
51
Internally Displaced Persons from Occupied Territories, Accommodation and Refugees of
Georgia cooperates with the EU-funded project “Targeted Initiative for Georgia (TIG)” in
reaching out to Georgian returnees and offer reintegration assistance. All readmitted nationals
are met at the airport by the Ministry and TIG staff and receive on the spot information on
available reintegration opportunities.
It still early to gauge what effects the implementation of the agreements have had with respect
to both the facilitation of entry into the EU and the repatriation of undocumented migrants. The
analysis of the previous chapter shows however that more far-reaching initiatives with regard
to possibilities of legal and perhaps temporary labour migration might be desirable to address
the de facto undocumented situation in which the majority of labour migrants appear to be. It
is to be hoped that progress under the Mobility Partnership will lead to such agreements.
6. Conclusions
Despite a number of successful reforms in Georgia, the labour market is still depressed. Quite
a large number of people decide to emigrate because of the unemployment situation and low
wages. The current high unemployment rate is a reflection of both weak labour demand and a
skills mismatch. The problem of the Georgian labour market is not so much the lack of skills
but the lack of jobs with an adequate salary for skilled people. This means that skilled workers
from Georgia emigrate because there is no work for them at home or the salaries offered are
too low and do not correspond to their skills. Most emigrants are illegal residents and employed
on a secondary labour market abroad, earning discriminatory wages, be it higher than in
Georgia. Russia, Greece and Germany have the largest stocks of Georgian migrants. In recent
years, the destination palette has become more diverse and the shares of Italy, Spain, Great
Britain and other European countries, as destination countries of Georgian labour emigrants,
continues to increase. The lower chance of finding a job abroad is partly due to the language
barrier. In fact, foreign language study (mainly English) has recently become a priority in
Georgia but, as results in this field take time to materialize, the problem won’t be solved
overnight. Migration has in recent years acquired a “circular” nature, with many young
Georgians going abroad to get a better education and coming home to take up leading
positions in the public and private sectors. Thus, Georgia may be experiencing a so-called
brain gain.
The volume of remittances has also increased dramatically, peaking in 2007, just before the
global financial crisis erupted, reflecting a more favourable investment climate at home and

CASE Network Studies & Analyses No. 463 – Costs and Benefits of Labour Mobility Between …
52
economic prosperity abroad. Still, a relatively small share of remitted capital is used for
productive investment. Most of it finances current consumption and helps reduce poverty, by
raising expenditures on health and education, increasing savings and fostering social capital
formation. Only little evidence was found to support the premise that remittances decrease the
incentive to work, mostly in rural areas. Despite the fact that Russia is no longer a popular
holiday destination for Georgians, more than half of total remittances come from Russia, as
this country still has by far the largest stock of Georgian migrants. In the top 5 of remitting
countries, only two are EU members, namely Greece and Italy, with shares of 12% and 9%
respectively. Two other EU countries, Spain and the UK, only show up in the top 10. Thus,
Georgia is not most heavily dependent on remittances from EU countries but from FSU
countries, especially Russia, be it that current trends will change that picture in the future.
One of the major problems of migration is that married labour emigrants are separated from
their loved ones. This split often takes a tragic turn, as being illegal migrants, they can’t go
back home temporarily to visit their families. Liberalizing the migration policy will alleviate this
situation, without producing any negative effects for the host country.
One of the key concerns of labour emigration is health safety in the destination country. Since
the majority of immigrants are undocumented, they in most cases cannot apply to health care
programs or enjoy social security. This lack of protection further complicates the health issues
of migrants. Thus, implementing a sound migration policy is important, and the negotiations
under way in the context of the Mobility Partnership talks will hopefully lead in that direction.
CASE Network Studies & Analyses No. 463 – Costs and Benefits of Labour Mobility Between …
53
References
Aslamazisvili, N.,Datashvili, V. 2009. Labour Migration and Remittances in Georgia:
Advantages and Disadvantages. Social Economics (2).
Babych Y., Fuenfzig,M. 2012. An Application of the Growth Diagnostics Framework: The
Case of Georgia. ISET.
Antadze, T. 2009. Characteristics of the Present LabourMarketin Georgia. Migration (3).
Tbilisi, p.16–29. (In Georgian)
Takidze, A. 2006. „Forming and Use of Labour Resources of Autonomous Republic of
Adjara”. Tbilisi. p.63
Antadze, T. 2006. Informal employment in Georgia.Collection of works: “Informal
Employment and Labour Rights in Caucasus”. (In Georgian)
Chelidze, N.2006. Labour Migration from Post-Soviet Georgia.Tbilisi. “Lega” (In
Georgian)
Chitanava N. 1997. Social economic problems of transition period. Tbilisi.
Employer Workforce Demand. 2008. IOM
Gachechiladze, R. 1997. Population Migration in Georgia and its Social-Economic
Results. Tbilisi.
Gachechiladze, R. 1997. Population migration in Georgia and Its Socio-Economic
Consequences. UNDP Discussion Paper Series. Tbilisi. Georgia.
IOM. 2000. “Irregular Migration and Trafficking in Migrants— The Case of Georgia”, a
report by the International Organization for Migration(IOM). Regional Office for the Caucasus
and Mission to Georgia, September.
IOM and Association for economic Education. 2003. Labour Migration from Georgia.
IOM. 2002. Return and Reintegration of Migrants to South Caucasus.
IOM. 2008. Regional Labour Market Survey in Adjara.
IOM. USAID. 2008. Survey on Employer Demand For Workforce in Georgia.
IOM. 2009. Potential Labour Migration from Georgia: Analysis of statistics collected from
July 2006 to June 2008.
Javakhishvili, I. 2010. The Georgian Labour Market.Center for Migration Studies.Tbilisi
State University. Tbilisi.

CASE Network Studies & Analyses No. 463 – Costs and Benefits of Labour Mobility Between …
54
Labour Migration from Georgia and Bilateral Agreements: Needs and Prospects. 2009.
Caucasus Institute for Peace, Democracy and Development.
Landru, N. 2006. Georgia TheTkibuli Region and Rural Migration. Caucasus Europe
News. November 30. http://www.caucaz.com/home_eng/breve_contenu.php?id=281
Migration 1. 2007. Tbilisi State University, Migration Research Center.
Migration 2. 2008. Tbilisi State University, Migration Research Center.
Migration 3. 2009. Tbilisi State University, Migration Research Center.
Migration 4. 2010. Tbilisi State University, Migration Research Center.
Migration Processes in Globalized World. 2005. Tbilisi University Press. Tbilisi.
Migration Processes in Post-Soviet Georgia. 2003. Tbilisi University Press. Tbilisi.
Mikadze, T. 2002. Crisis in Higher Education and Educational Migration from Georgia.
In: Central Asia and TheCaucasus. Journal of Social and Political Studies.
Research on Returned Migrant (Brief Report of the Research). 2009. Center for Migration
Studies. Ivane Javakhishvili Tbilisi State University. Tbilisi.
Rutkowski, J. 2011. Skills Mismatch and Unemployment in Georgia: The Challenge of
Creating Productive Jobs. World Bank.
Sakevarishvili,M. 2005. Research of Social Status/Welfare Standards of Migration
Workers, Comparative Study Before, During and After Migration.Report for Caucasus
Research Resource Centre.
Shelia, M. 2004. “Alteration of the labour age population in the 1990s”. Journal “Social
Economics (4). Tbilisi.
Shelia, M. 2007. Impact of Migration on Population Reproduction in Georgia. Migration
1. Tbilisi,Universali, c.116–122.
Svanidze, G. and Kokoev K. 2002. “Emigration from Georgia and Its Reasons: Results
of a sociological survey”. Central Asia and the Caucasus. July1 p.110–115.
Tukhashvili M., Macharashvili G. 2000. “Labour Emigration of KvemoKartli Population”.
Social Economy (4).
Tukhashvili, M. 1996. Population Migration in Georgia. Tbilisi.
Tukhashvili, M. 1998. Labour Potential of Georgia: Formation and Distribution. TSU,
Tbilisi.

CASE Network Studies & Analyses No. 463 – Costs and Benefits of Labour Mobility Between …
55
Tukhashvili, M. 2008. “It is Necessary Conduct a Complex Study of Georgia’s Labour
Market and Migration”. Migration 2. Tbilisi, Universali. c.5–15.
Tukhashvili, M. ,Toria, M. 2009. “Labour Emigration of the IDPs from Abkhazia”.
Migration 3. Tbilisi, Universali. c.86–97.
Tukhashvili M. 2009. The End of Migratory Expansion and Russian. New Migration
Policy. Tbilisi. (In Georgian)
Vadachkoria A. 2004. External Migration Processes in Georgia. (1989–2002). Report
from the Dissertation Theme. Tbilisi.
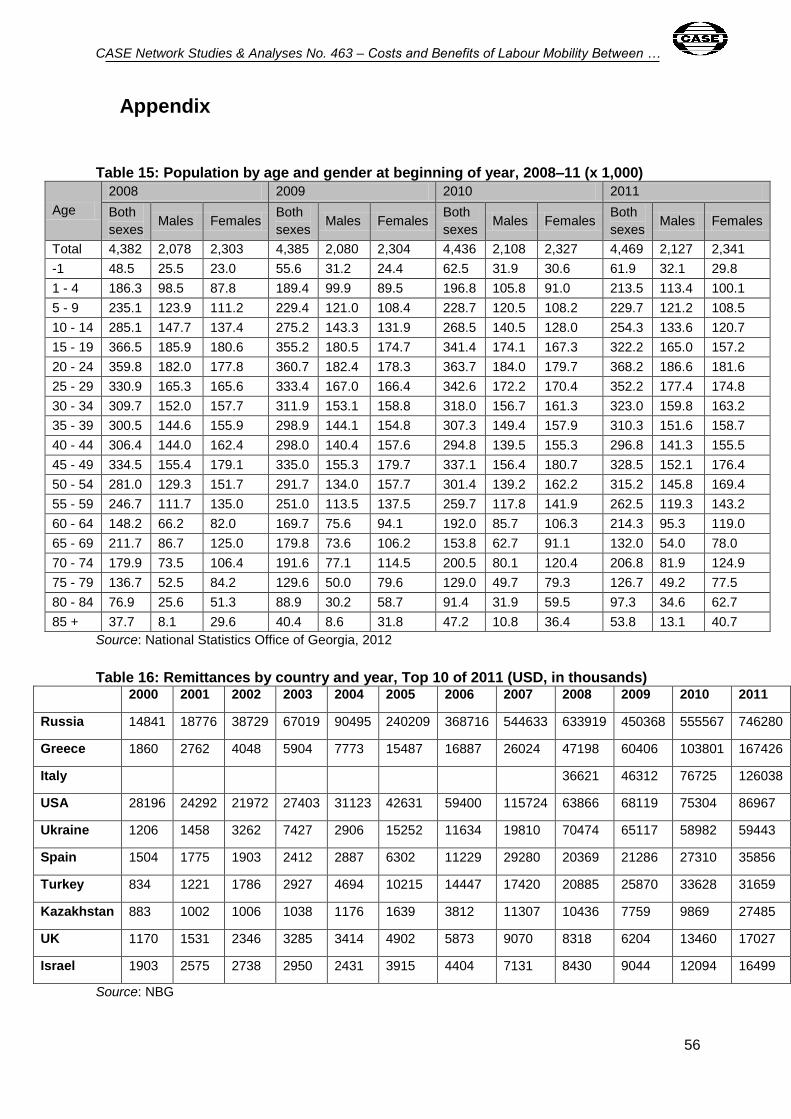
CASE Network Studies & Analyses No. 463 – Costs and Benefits of Labour Mobility Between …
56
Appendix
Table 15: Population by age and gender at beginning of year, 2008–11 (x 1,000)
Age
2008 2009 2010 2011
Both
sexes Males Females
Both
sexes Males Females
Both
sexes Males Females
Both
sexes Males Females
Total 4,382 2,078 2,303 4,385 2,080 2,304 4,436 2,108 2,327 4,469 2,127 2,341
-1 48.5 25.5 23.0 55.6 31.2 24.4 62.5 31.9 30.6 61.9 32.1 29.8
1 - 4 186.3 98.5 87.8 189.4 99.9 89.5 196.8 105.8 91.0 213.5 113.4 100.1
5 - 9 235.1 123.9 111.2 229.4 121.0 108.4 228.7 120.5 108.2 229.7 121.2 108.5
10 - 14 285.1 147.7 137.4 275.2 143.3 131.9 268.5 140.5 128.0 254.3 133.6 120.7
15 - 19 366.5 185.9 180.6 355.2 180.5 174.7 341.4 174.1 167.3 322.2 165.0 157.2
20 - 24 359.8 182.0 177.8 360.7 182.4 178.3 363.7 184.0 179.7 368.2 186.6 181.6
25 - 29 330.9 165.3 165.6 333.4 167.0 166.4 342.6 172.2 170.4 352.2 177.4 174.8
30 - 34 309.7 152.0 157.7 311.9 153.1 158.8 318.0 156.7 161.3 323.0 159.8 163.2
35 - 39 300.5 144.6 155.9 298.9 144.1 154.8 307.3 149.4 157.9 310.3 151.6 158.7
40 - 44 306.4 144.0 162.4 298.0 140.4 157.6 294.8 139.5 155.3 296.8 141.3 155.5
45 - 49 334.5 155.4 179.1 335.0 155.3 179.7 337.1 156.4 180.7 328.5 152.1 176.4
50 - 54 281.0 129.3 151.7 291.7 134.0 157.7 301.4 139.2 162.2 315.2 145.8 169.4
55 - 59 246.7 111.7 135.0 251.0 113.5 137.5 259.7 117.8 141.9 262.5 119.3 143.2
60 - 64 148.2 66.2 82.0 169.7 75.6 94.1 192.0 85.7 106.3 214.3 95.3 119.0
65 - 69 211.7 86.7 125.0 179.8 73.6 106.2 153.8 62.7 91.1 132.0 54.0 78.0
70 - 74 179.9 73.5 106.4 191.6 77.1 114.5 200.5 80.1 120.4 206.8 81.9 124.9
75 - 79 136.7 52.5 84.2 129.6 50.0 79.6 129.0 49.7 79.3 126.7 49.2 77.5
80 - 84 76.9 25.6 51.3 88.9 30.2 58.7 91.4 31.9 59.5 97.3 34.6 62.7
85 + 37.7 8.1 29.6 40.4 8.6 31.8 47.2 10.8 36.4 53.8 13.1 40.7
Source: National Statistics Office of Georgia, 2012
Table 16: Remittances by country and year, Top 10 of 2011 (USD, in thousands) 2000 2001 2002 2003 2004 2005 2006 2007 2008 2009 2010 2011
Russia 14841 18776 38729 67019 90495 240209 368716 544633 633919 450368 555567 746280
Greece 1860 2762 4048 5904 7773 15487 16887 26024 47198 60406 103801 167426
Italy 36621 46312 76725 126038
USA 28196 24292 21972 27403 31123 42631 59400 115724 63866 68119 75304 86967
Ukraine 1206 1458 3262 7427 2906 15252 11634 19810 70474 65117 58982 59443
Spain 1504 1775 1903 2412 2887 6302 11229 29280 20369 21286 27310 35856
Turkey 834 1221 1786 2927 4694 10215 14447 17420 20885 25870 33628 31659
Kazakhstan 883 1002 1006 1038 1176 1639 3812 11307 10436 7759 9869 27485
UK 1170 1531 2346 3285 3414 4902 5873 9070 8318 6204 13460 17027
Israel 1903 2575 2738 2950 2431 3915 4404 7131 8430 9044 12094 16499
Source: NBG
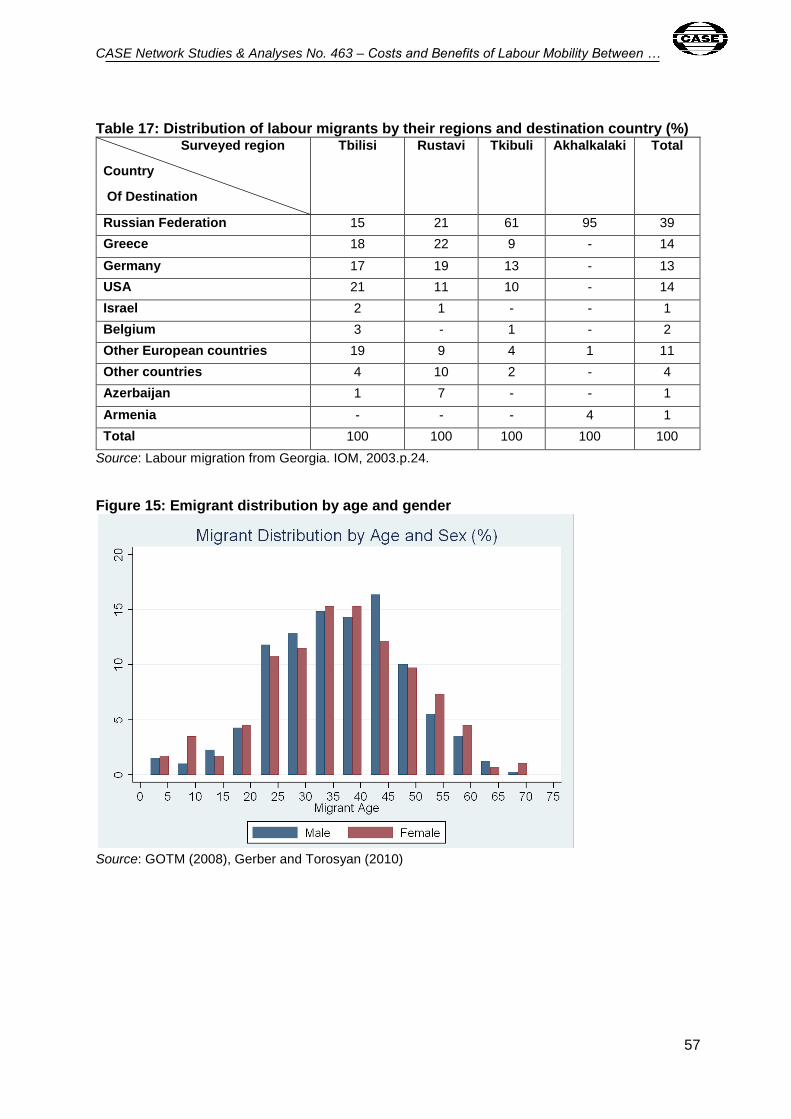
CASE Network Studies & Analyses No. 463 – Costs and Benefits of Labour Mobility Between …
57
Table 17: Distribution of labour migrants by their regions and destination country (%) Surveyed region
Country
Of Destination
Tbilisi
Rustavi Tkibuli Akhalkalaki Total
Russian Federation 15 21 61 95 39
Greece 18 22 9 - 14
Germany 17 19 13 - 13
USA 21 11 10 - 14
Israel 2 1 - - 1
Belgium 3 - 1 - 2
Other European countries 19 9 4 1 11
Other countries 4 10 2 - 4
Azerbaijan 1 7 - - 1
Armenia - - - 4 1
Total 100 100 100 100 100
Source: Labour migration from Georgia. IOM, 2003.p.24.
Figure 15: Emigrant distribution by age and gender
Source: GOTM (2008), Gerber and Torosyan (2010)
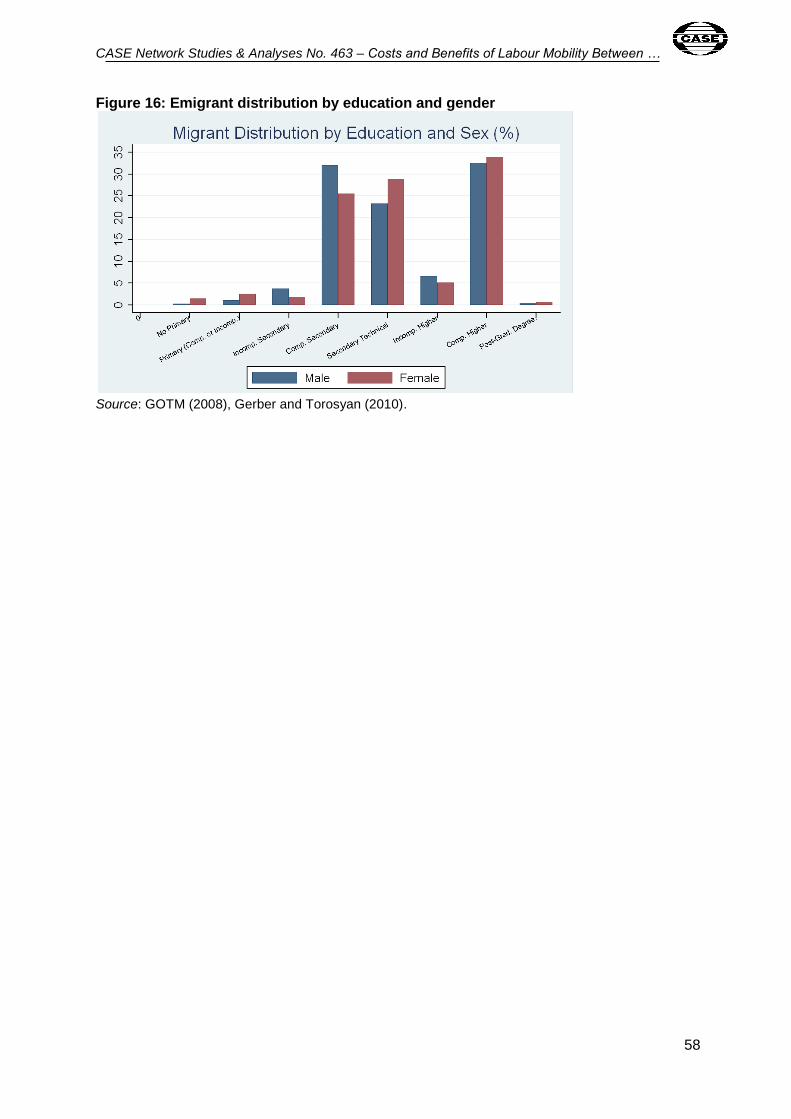
CASE Network Studies & Analyses No. 463 – Costs and Benefits of Labour Mobility Between …
58
Figure 16: Emigrant distribution by education and gender
Source: GOTM (2008), Gerber and Torosyan (2010).