case rate toolkit - national council · case rate toolkit based on “creeping and leaping from...
TRANSCRIPT

Case Rate Toolkit
Payment Models
Measuring Value
Health Home Rates
Bundled Payment
Treat to
Target
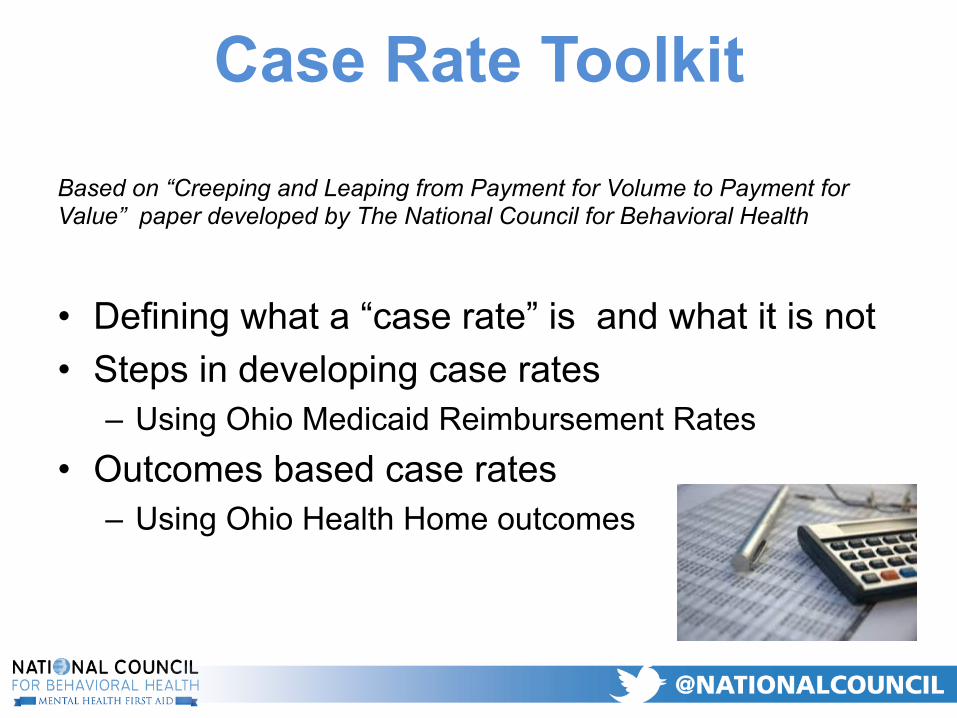
Case Rate Toolkit
Based on “Creeping and Leaping from Payment for Volume to Payment for Value” paper developed by The National Council for Behavioral Health
• Defining what a “case rate” is and what it is not • Steps in developing case rates
– Using Ohio Medicaid Reimbursement Rates • Outcomes based case rates
– Using Ohio Health Home outcomes
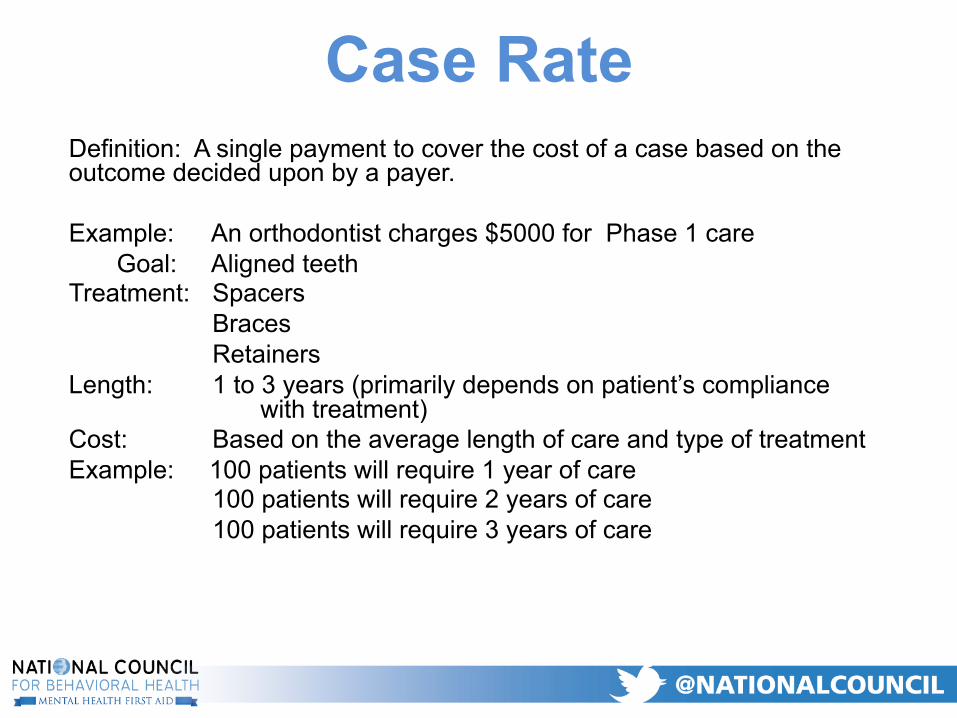
Definition: A single payment to cover the cost of a case based on the outcome decided upon by a payer. Example: An orthodontist charges $5000 for Phase 1 care
Goal: Aligned teeth Treatment: Spacers
Braces Retainers
Length: 1 to 3 years (primarily depends on patient’s compliance with treatment)
Cost: Based on the average length of care and type of treatment Example: 100 patients will require 1 year of care
100 patients will require 2 years of care 100 patients will require 3 years of care
Case Rate
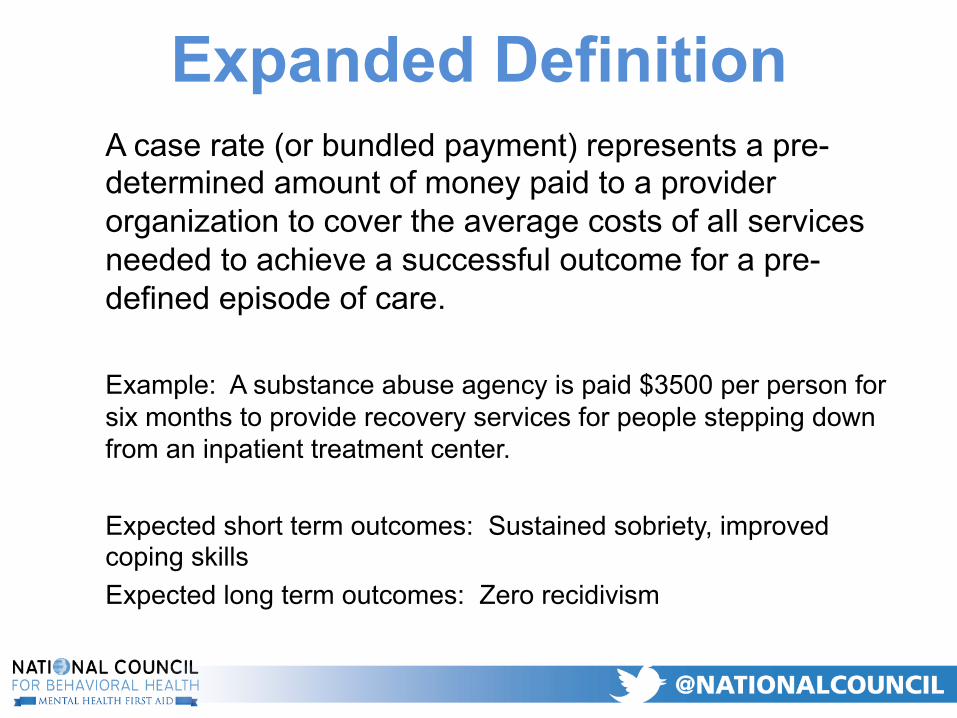
Expanded Definition A case rate (or bundled payment) represents a pre-determined amount of money paid to a provider organization to cover the average costs of all services needed to achieve a successful outcome for a pre-defined episode of care. Example: A substance abuse agency is paid $3500 per person for six months to provide recovery services for people stepping down from an inpatient treatment center. Expected short term outcomes: Sustained sobriety, improved coping skills Expected long term outcomes: Zero recidivism
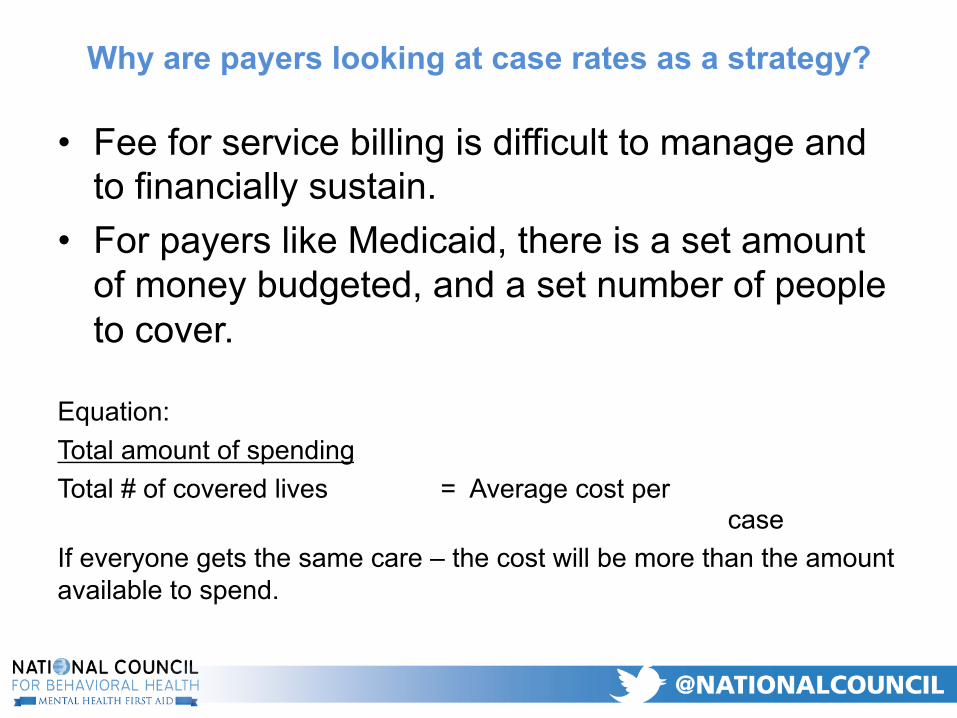
Why are payers looking at case rates as a strategy?
• Fee for service billing is difficult to manage and to financially sustain.
• For payers like Medicaid, there is a set amount of money budgeted, and a set number of people to cover.
Equation: Total amount of spending Total # of covered lives = Average cost per
case If everyone gets the same care – the cost will be more than the amount available to spend.
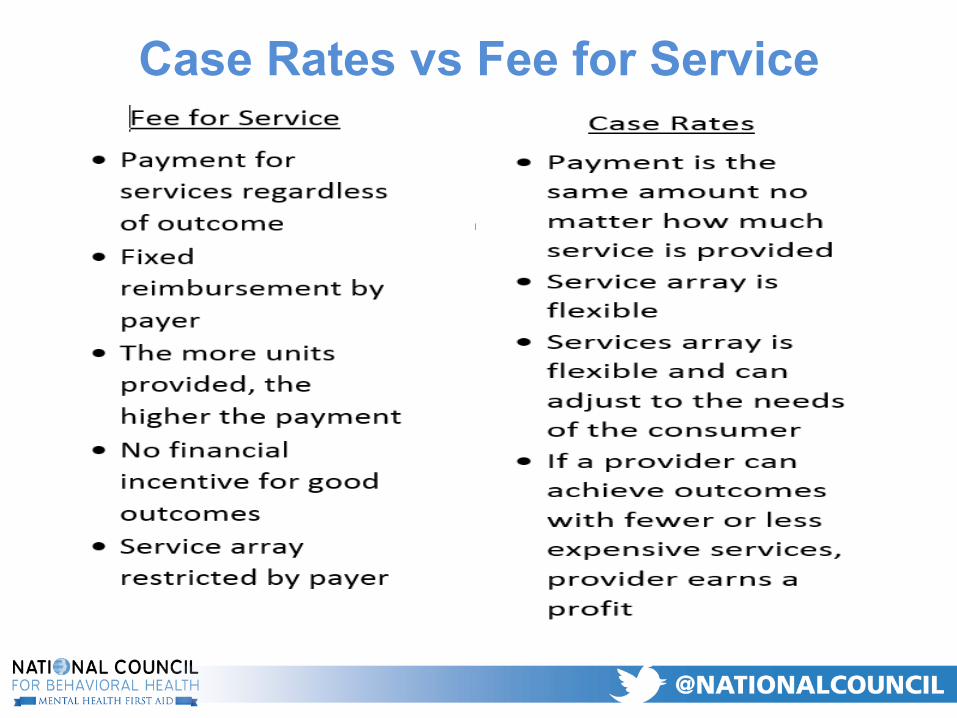
Case Rates vs Fee for Service

Examples of Health Home Case Rates • Case rates by expected outcome:
– Example: Employment pilot • Case rates by Engagement Level
– Example: New Jersey Health Home • Case rates by Level of care determination
– Example: CMS bundled rate pilot for post hospitalization services
• Case rates by population – Example: Michigan Medicaid Capitated Payment
• PMPM for SMI • PMPM for SED • PMPM for I/DD
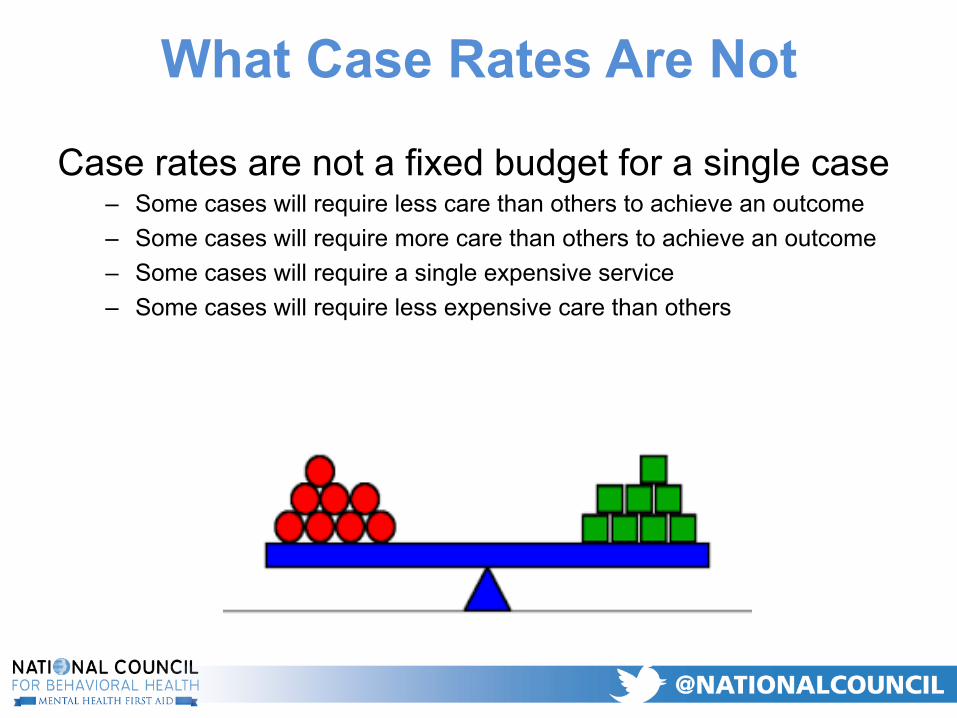
What Case Rates Are Not
Case rates are not a fixed budget for a single case – Some cases will require less care than others to achieve an outcome – Some cases will require more care than others to achieve an outcome – Some cases will require a single expensive service – Some cases will require less expensive care than others

Data Requirements for Setting Case Rates
Start with questions, not answers………
• What is the defined population you are serving? • How much of the population do you plan to
serve? • How much are reimbursement are you receiving
by client? • What outcomes are you measuring? • What service array is leading to good outcomes?

Creating Case Rates for Ohio Health Homes
Purpose: Using data from state and agency reporting, this exercise will compare the average cost of providing care under the fee for service payment model vs. using the Ohio Health Home rate

Ohio Reimbursement Data
State Benefit Limits CPT Codes Benefit Limit Health Home Services Reimbursement Unit per hr. Unit per month
BH Services
Individual Therapy H0004 52 hrs. per year $90 per hr. $90.00
Group Therapy H0004 HQ $21.33 per 15 min $85.32
CPST H0036 104 hrs. per year
S0281 $83.32 per hr. $83.32
Health Home $188 per month $188.00
MH Assessment H0031 4 hrs. per year $129.99 per hr. $129.99
Pharm Mgt 90863 24 hrs. per year
$210.87 per hr. $210.87
Psychiatric Eval 90792 2 hrs. per year
AOD Services
AOD Assessment H0001
30 hrs. per week
$96.24 per hr. $96.24
AOD Ind Therapy H0004 87.27 per hr. $87.27
AOD Group Therapy H0005 $9.52 per 15 min $38.08
AOD CSM H0007 $78.17 per hr. $78.17
AOD Med Som H0016

Range of Reimbursement Rate
Example: If a consumer received the maximum amount of services allowable under the Ohio Medicaid Benefit package, what would the cost of care be? Therapy: $4680 CPST: $8665* MH Assessment: $ 519 Pharm Mgt: $5060 AOD Services: $2600 Minimum : $21.33 per year cost Maximum: $21,524 per year cost* *Additional units of CPST can be provided if approved by Health Plan

Questions
• Are the service provided leading to good outcomes? – How do you know this?
• How much service is being provided to people? • How do clinicians know how much service to
provide? • How are services being provided?
– Example: Groups are more cost-effective than individual services.
– Example: Therapy provided by master’s level clinicians cost less than therapy provided by a doctor

Agency Specific Data Using the requested data elements, provide total reimbursement for services:
# Level 1 Low U\liza\on: # low cost consumers that will be eligible for Health Homes (may be low cost in terms of MH TX, but may have high medical care costs)
# Level 2 Medium U\liza\on: # medium range u\liza\on consumers that will probably be in the health home
# Level 3 High U\liza\on: # highest u\liza\on consumers that will be eligible for Health Homes
Direc\ons: Take a look at your reimbursement data and sort clients into 3 categories:
Consumers with low u\liza\on of CPST Consumers with medium u\liza\on of CPST Consumers with high u\liza\on of CPST Data can be sorted into even-‐numbered categories, or in predefined categories like “Meds Only”, “Designated CSM” and “Specialized CSM”
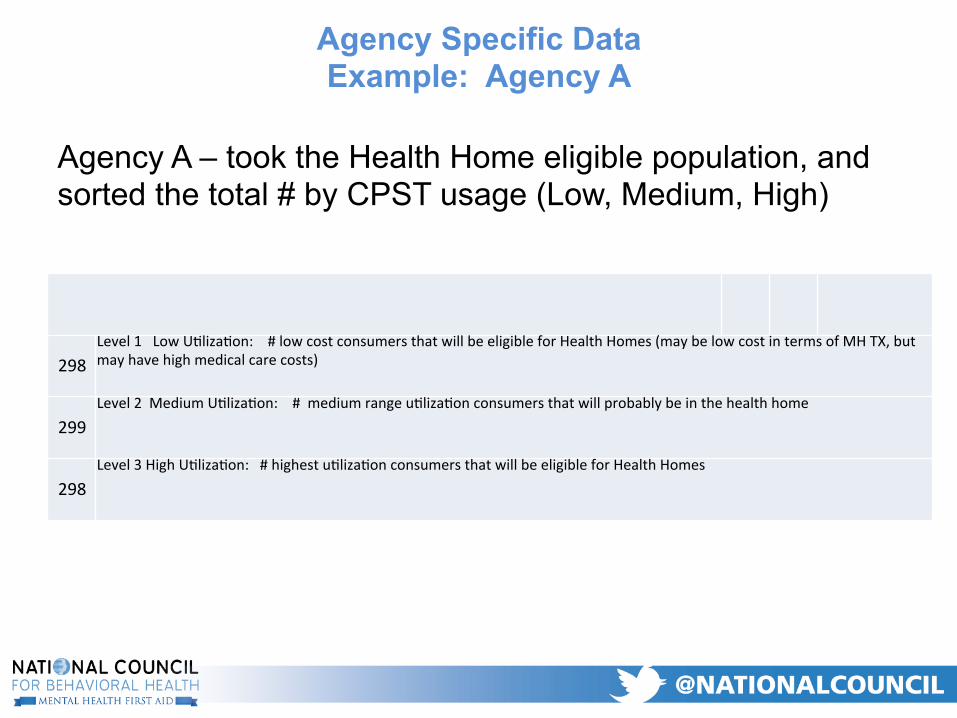
Agency Specific Data Example: Agency A
Agency A – took the Health Home eligible population, and sorted the total # by CPST usage (Low, Medium, High)
298 Level 1 Low U\liza\on: # low cost consumers that will be eligible for Health Homes (may be low cost in terms of MH TX, but may have high medical care costs)
299 Level 2 Medium U\liza\on: # medium range u\liza\on consumers that will probably be in the health home
298 Level 3 High U\liza\on: # highest u\liza\on consumers that will be eligible for Health Homes
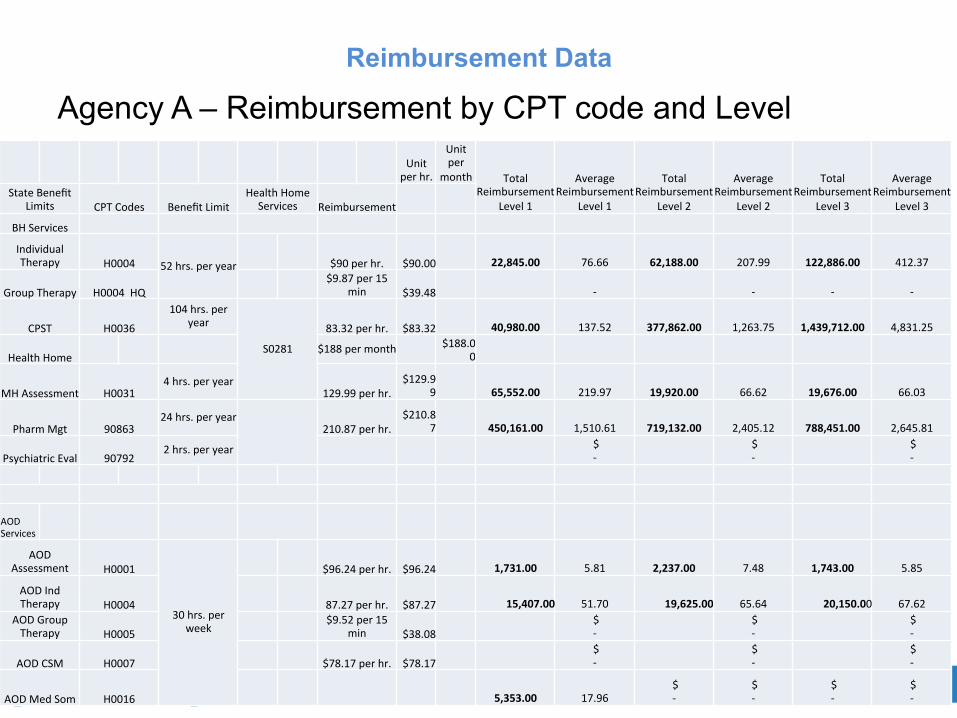
Reimbursement Data
Agency A – Reimbursement by CPT code and Level Unit
per hr.
Unit per
month Total Reimbursement
Level 1
Average Reimbursement
Level 1
Total Reimbursement
Level 2
Average Reimbursement
Level 2
Total Reimbursement
Level 3
Average Reimbursement
Level 3 State Benefit
Limits CPT Codes Benefit Limit Health Home
Services Reimbursement
BH Services
Individual Therapy H0004 52 hrs. per year $90 per hr. $90.00
22,845.00
76.66
62,188.00
207.99
122,886.00
412.37
Group Therapy H0004 HQ $9.87 per 15
min $39.48
-‐
-‐
-‐
-‐
CPST H0036
104 hrs. per year
S0281
83.32 per hr. $83.32 40,980.00
137.52
377,862.00
1,263.75
1,439,712.00
4,831.25
Health Home $188 per month $188.0
0
MH Assessment H0031 4 hrs. per year
129.99 per hr. $129.9
9 65,552.00
219.97
19,920.00
66.62
19,676.00
66.03
Pharm Mgt 90863 24 hrs. per year
210.87 per hr. $210.8
7 450,161.00
1,510.61
719,132.00
2,405.12
788,451.00
2,645.81
Psychiatric Eval 90792 2 hrs. per year
$ -‐
$ -‐
$ -‐
AOD Services
AOD Assessment H0001
30 hrs. per week
$96.24 per hr. $96.24 1,731.00
5.81
2,237.00
7.48
1,743.00
5.85
AOD Ind Therapy H0004 87.27 per hr. $87.27
15,407.00
51.70
19,625.00
65.64
20,150.00
67.62
AOD Group Therapy H0005
$9.52 per 15 min $38.08
$ -‐
$ -‐
$ -‐
AOD CSM H0007 $78.17 per hr. $78.17 $ -‐
$ -‐
$ -‐
AOD Med Som H0016 5,353.00
17.96
$ -‐
$ -‐
$ -‐
$ -‐
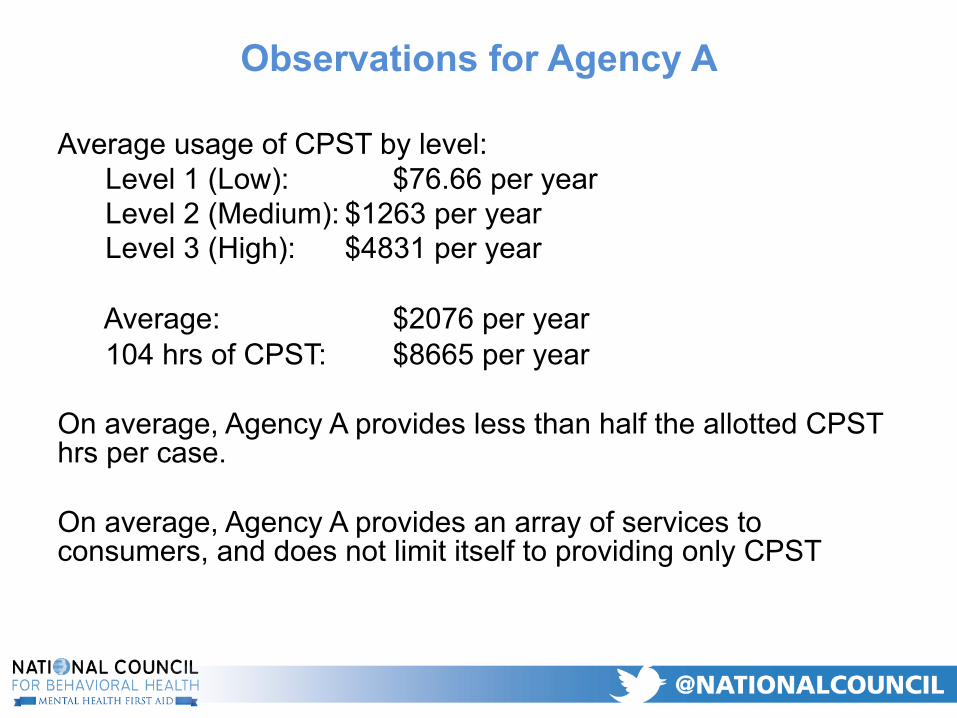
Observations for Agency A
Average usage of CPST by level: Level 1 (Low): $76.66 per year Level 2 (Medium): $1263 per year Level 3 (High): $4831 per year Average: $2076 per year 104 hrs of CPST: $8665 per year
On average, Agency A provides less than half the allotted CPST hrs per case. On average, Agency A provides an array of services to consumers, and does not limit itself to providing only CPST
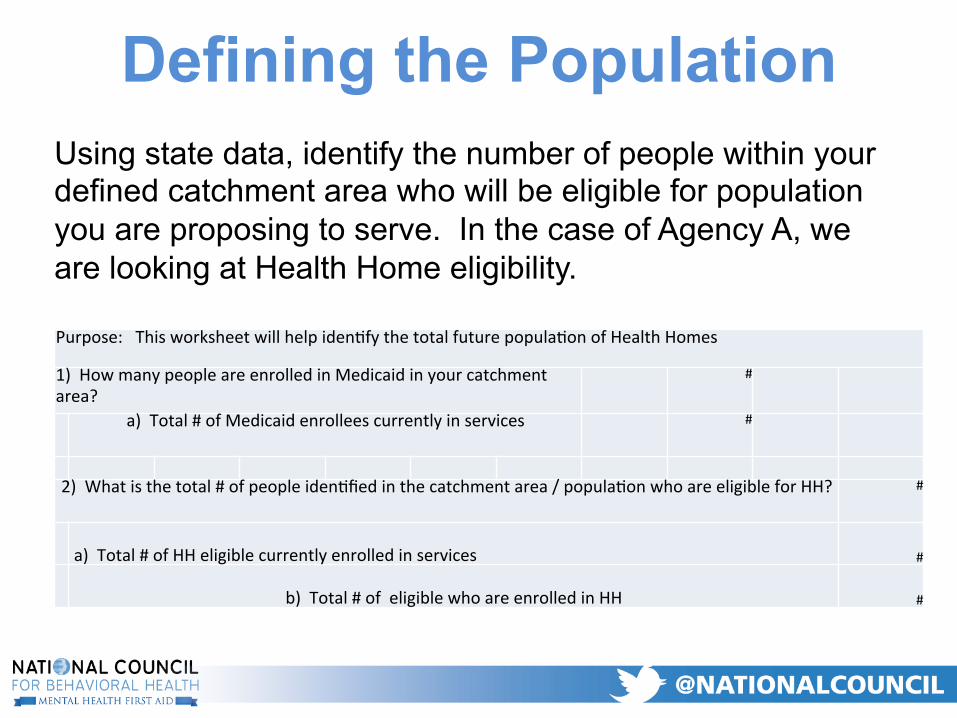
Defining the Population Using state data, identify the number of people within your defined catchment area who will be eligible for population you are proposing to serve. In the case of Agency A, we are looking at Health Home eligibility.
Purpose: This worksheet will help iden\fy the total future popula\on of Health Homes
1) How many people are enrolled in Medicaid in your catchment area?
#
a) Total # of Medicaid enrollees currently in services #
2) What is the total # of people iden\fied in the catchment area / popula\on who are eligible for HH? #
a) Total # of HH eligible currently enrolled in services #
b) Total # of eligible who are enrolled in HH #
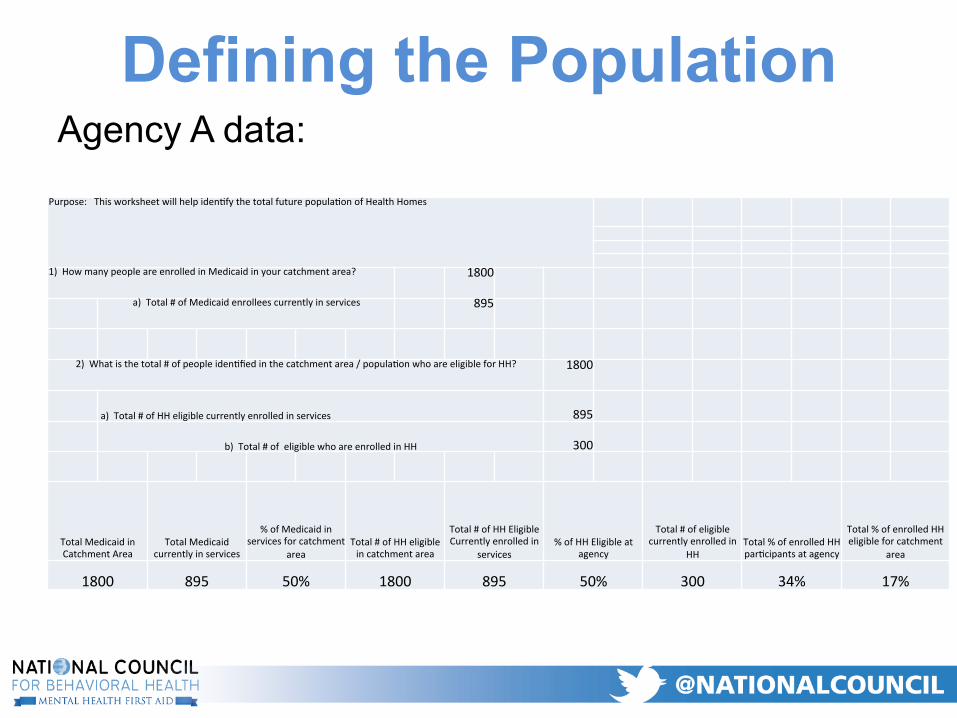
Defining the Population Agency A data:
Purpose: This worksheet will help iden\fy the total future popula\on of Health Homes
1) How many people are enrolled in Medicaid in your catchment area? 1800
a) Total # of Medicaid enrollees currently in services 895
2) What is the total # of people iden\fied in the catchment area / popula\on who are eligible for HH? 1800
a) Total # of HH eligible currently enrolled in services 895
b) Total # of eligible who are enrolled in HH 300
Total Medicaid in Catchment Area
Total Medicaid currently in services
% of Medicaid in services for catchment
area Total # of HH eligible in catchment area
Total # of HH Eligible Currently enrolled in
services % of HH Eligible at
agency
Total # of eligible currently enrolled in
HH Total % of enrolled HH par\cipants at agency
Total % of enrolled HH eligible for catchment
area
1800 895 50% 1800 895 50% 300 34% 17%

Estimating the Penetration Rate
Purpose: Agencies may be iden\fying specific targets for enrollment of Health Home par\cipants, which will created an expected penetra\on rate. This worksheet will provide the expecta\on of reimbursement based on enrollment. Enter in your expected enrollment percentage
1) # of people who are in catchment area who are eligible for health homes #
a) # of people if target % of eligible are enrolled % Target #%
i) Monthly revenue = a) X rate
Total # Eligible for HH
Percentage target Enrollment # target Monthly Case Rate Monthly Revenue with enrollment
target Annual Case Rate
Annual Revenue
$ 188 $ $ 2,256 $
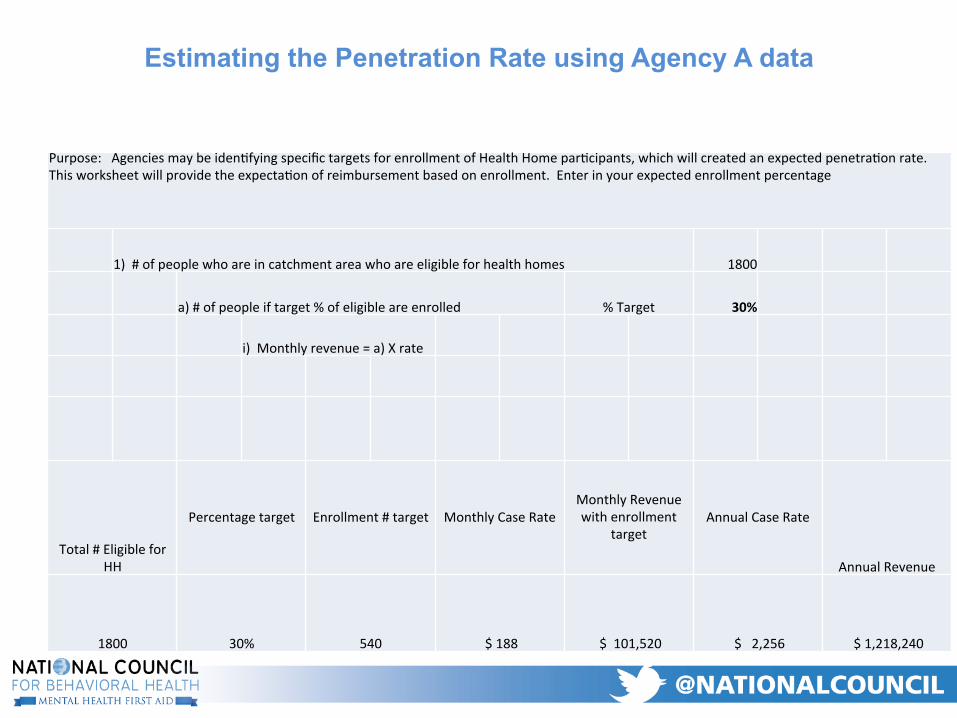
Estimating the Penetration Rate using Agency A data
Purpose: Agencies may be iden\fying specific targets for enrollment of Health Home par\cipants, which will created an expected penetra\on rate. This worksheet will provide the expecta\on of reimbursement based on enrollment. Enter in your expected enrollment percentage
1) # of people who are in catchment area who are eligible for health homes 1800
a) # of people if target % of eligible are enrolled % Target 30%
i) Monthly revenue = a) X rate
Total # Eligible for HH
Percentage target Enrollment # target Monthly Case Rate Monthly Revenue with enrollment
target Annual Case Rate
Annual Revenue
1800 30% 540 $ 188 $ 101,520 $ 2,256 $ 1,218,240

Determining Actual Utilization
The purpose of this step is to look at what actual services are being provided to consumers by intensity level. • Health Home consumers receive other services
that contribute to positive health outcomes beyond CPST.
• What is the total cost of care for a consumer? – Health Home eligible service + other BH services – What is the range of Health Home eligible service
provided by level of intensity
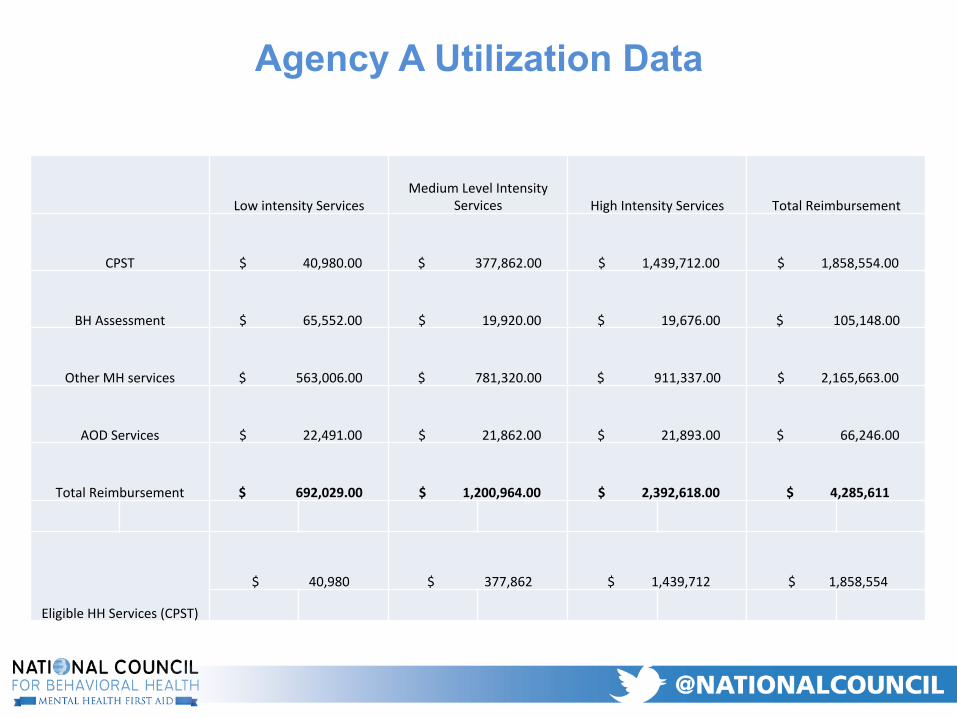
Agency A Utilization Data
Low intensity Services Medium Level Intensity
Services High Intensity Services Total Reimbursement
CPST $ 40,980.00 $ 377,862.00 $ 1,439,712.00 $ 1,858,554.00
BH Assessment $ 65,552.00 $ 19,920.00 $ 19,676.00 $ 105,148.00
Other MH services $ 563,006.00 $ 781,320.00 $ 911,337.00 $ 2,165,663.00
AOD Services $ 22,491.00 $ 21,862.00 $ 21,893.00 $ 66,246.00
Total Reimbursement $ 692,029.00 $ 1,200,964.00 $ 2,392,618.00 $ 4,285,611
Eligible HH Services (CPST)
$ 40,980 $ 377,862 $ 1,439,712 $ 1,858,554

Utilization Data
Low intensity Services Medium Level Intensity
Services High Intensity Services Total Reimbursement
CPST $ # $ # $ # $
BH Assessment $ # $ # $ # $
Other MH services $ # $ # $ # $
AOD Services $ # $ # $ # $
Total Reimbursement $ $ $ $
Eligible HH Services (CPST)
$ $ $ $

Range of CPST Provided
With comparing HH potential revenue with actual fee for service reimbursement, we need to look at actual range of use, rather than anticipating that all cases will need and are currently receiving the maximum amount of CPST ($8665)
Eligible HH Services (CPST)
$ $ $ $
CPST Cost Range
$# $# $# #
Low intensity Services Medium Level Intensity
Services High Intensity Services Total Reimbursement
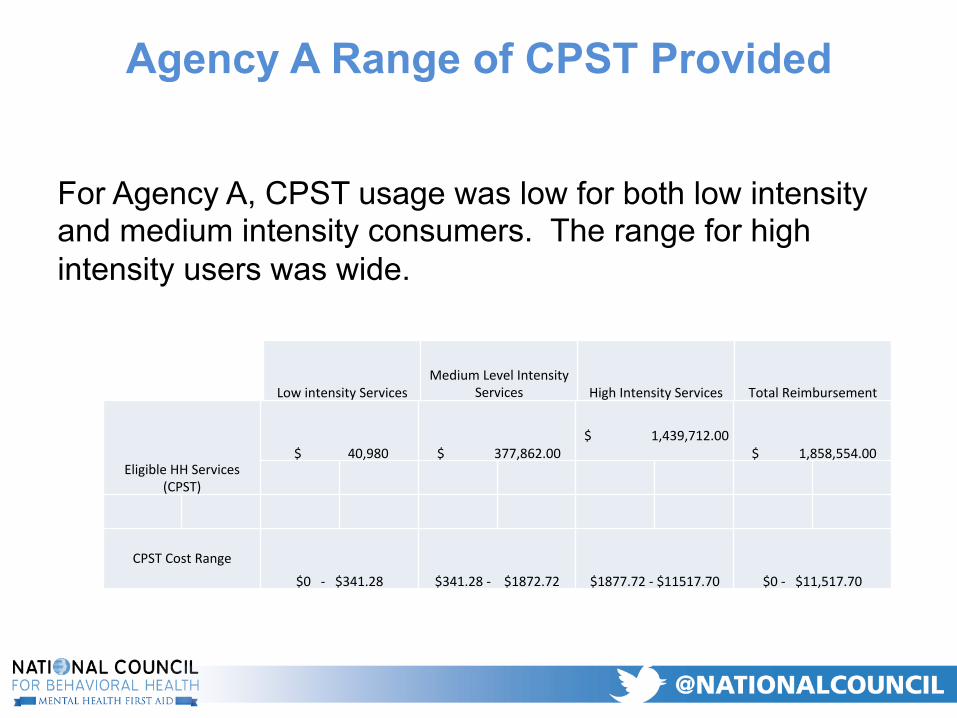
Agency A Range of CPST Provided
For Agency A, CPST usage was low for both low intensity and medium intensity consumers. The range for high intensity users was wide.
Eligible HH Services (CPST)
$ 40,980 $ 377,862.00
$ 1,439,712.00
$ 1,858,554.00
CPST Cost Range
$0 -‐ $341.28 $341.28 -‐ $1872.72 $1877.72 -‐ $11517.70 $0 -‐ $11,517.70
Low intensity Services Medium Level Intensity
Services High Intensity Services Total Reimbursement

Replacing Fee for Service Reimbursement with Case Rates
Using data from Agency A, this worksheet replaces the reimbursement from CPST and MH Assessment with the monthly case rate:
Low Intensity Services Medium Intensity Services High Intensity Services Total Reimbursement
Health Home $ 672,288.00 $ 674,544.00 $ 672,288.00 $ 2,019,120.00
Other MH services $ 628,558.00 $ 801,240.00 $ 931,013.00 $ 2,360,811
AOD Services $ 22,491.00 $ 21,862.00 $ 21,893.00 $ 66,246.00
Total Annual Reimbursement $ 1,323,337.00 $ 1,497,646.00 $ 1,605,518.00 $ 4,446,177.00

Digging Deeper into the Data
For Agency A, looking at the range of case specific data, only 36 of the Health Home eligible consumers received services reimbursed at more than the Health Home Rate. The primary difference in reimbursement is with the high intensity utilizers of CPST.
Low Intensity Services Medium Intensity Services High Intensity Services All Services
0 28 298 326
0% 0% 100% 32%

Comparing Fee for Service Reimbursement to Health Home Reimbursement
Using Agency A’s data, we will compare reimbursement for Health Home eligible services:
Health Home Only Services Low Intensity Services Medium Intensity Services High Intensity Services Total Reimbursement
Health Home $ 672,288.00 $ 674,544.00 $ 672,288.00 $ 2,019,120.00
CPST $ 40,980.00 $ 377,862.00 $ 1,439,712.00 $ 1,858,554.00
Difference $ 631,308 .00 $ 296.682.00 $ (767,424.00) $ 160,566.00
For Agency A, moving to Health Home case rates for 100% of consumers will result in a $55,418 surplus. Other conclusions: -‐ Enrolling an even mix of Low / Medium / High intensity services will yield possible
savings. -‐ Enrolling only High intensity services consumers will result in a loss of revenue

Comparing Fee for Service Reimbursement to Health Home Reimbursement
Using Agency A’s data, we will compare reimbursement for all behavioral health services: All Behavioral Health
Services Low Intensity Services Medium Intensity Services High Intensity Services Total Reimbursement
Health Home $ 1,323,337.00 $1,497,646 $ 1,625,194.00 $ 4,446,177.00
Fee for service $ 692.029.00 $ 1,200,964.00 $ 2,392,618.00 $ 4,285,611.00
Difference $ 631,308.00 $ 296,682.00 $ (767,424.00) $ 160,566.00

Looking at Outcomes We know that reimbursement is only one part of case rate. We have to compare the services that are provided to the outcomes that we want to achieve
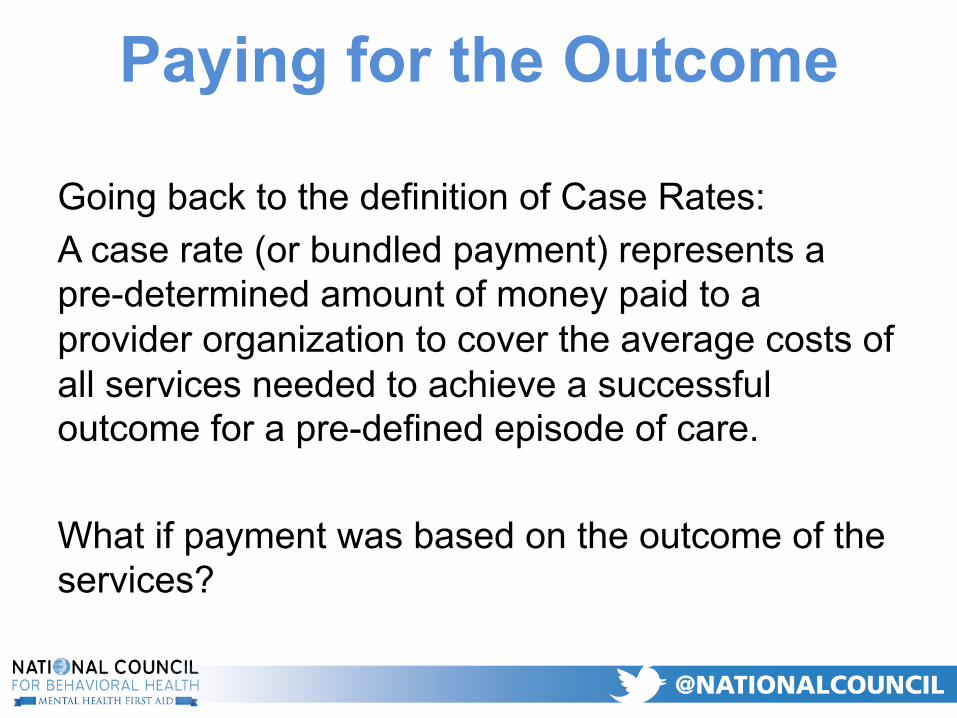
Paying for the Outcome
Going back to the definition of Case Rates: A case rate (or bundled payment) represents a pre-determined amount of money paid to a provider organization to cover the average costs of all services needed to achieve a successful outcome for a pre-defined episode of care. What if payment was based on the outcome of the services?

Pre-Health Home Data
Using data from Agency A, we look at three outcomes: • Inpatient admission rates • Emergency Department admission rates • 12 or more pharmaceuticals rates

Pre-Health Home Data
Inpatient Admission Data
Low Intensity Services Medium Intensity Services High Intensity Services Total Popula\on
Total Number # # #
Average
Range # # #
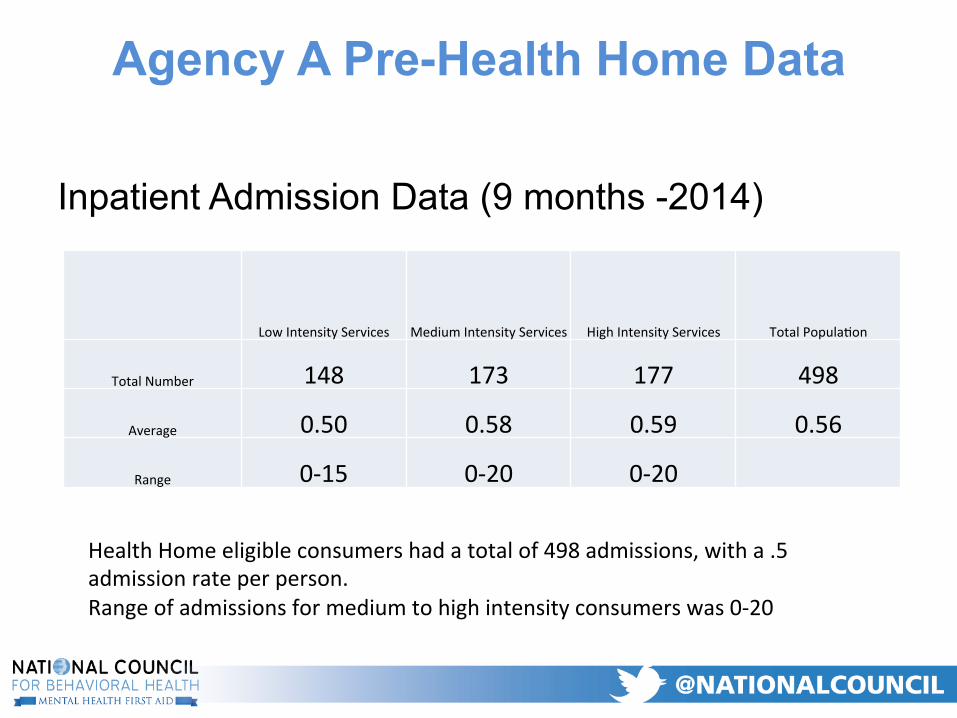
Agency A Pre-Health Home Data
Inpatient Admission Data (9 months -2014)
Low Intensity Services Medium Intensity Services High Intensity Services Total Popula\on
Total Number 148 173 177 498
Average 0.50 0.58 0.59 0.56
Range 0-‐15 0-‐20 0-‐20
Health Home eligible consumers had a total of 498 admissions, with a .5 admission rate per person. Range of admissions for medium to high intensity consumers was 0-‐20

Pre-Health Home Data Emergency Department Admission Data
Low Intensity Services Medium Intensity Services High Intensity Services Total Popula\on
Total Number # # # #
Average
Range # # # #
20 plus (ave 2X per month)
# # #
ED admission rate was HIGHER with the low intensity service populaKon The range of admissions was 0-‐49 admissions A small porKon of the low intensity and high intensity consumers had 20 plus admissions in a 9 month period
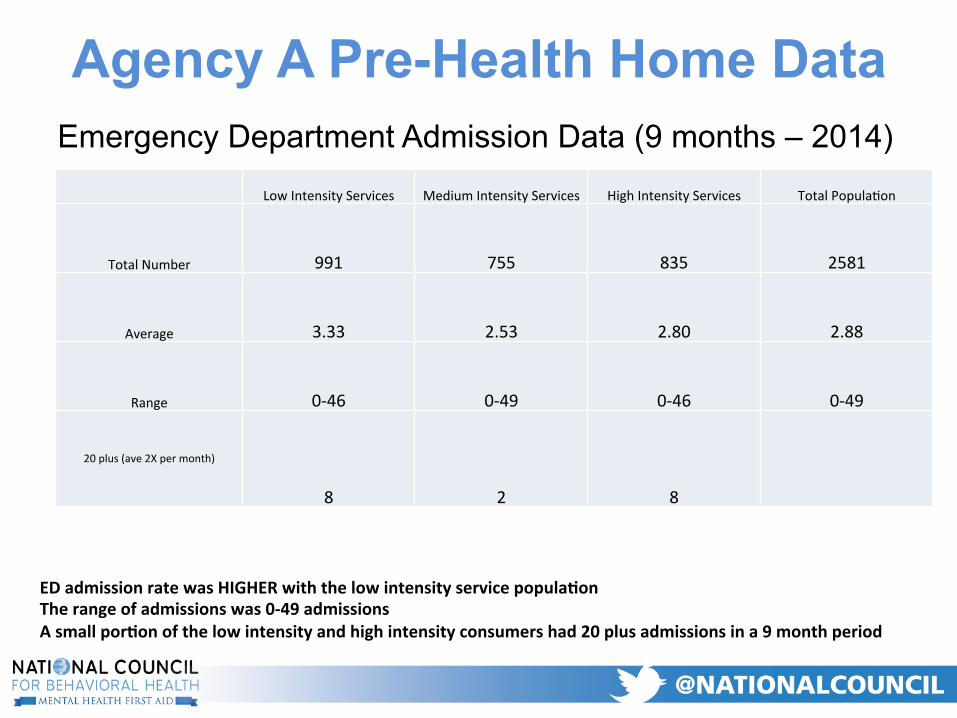
Agency A Pre-Health Home Data Emergency Department Admission Data (9 months – 2014)
Low Intensity Services Medium Intensity Services High Intensity Services Total Popula\on
Total Number 991 755 835 2581
Average 3.33 2.53 2.80 2.88
Range 0-‐46 0-‐49 0-‐46 0-‐49
20 plus (ave 2X per month)
8 2 8
ED admission rate was HIGHER with the low intensity service populaKon The range of admissions was 0-‐49 admissions A small porKon of the low intensity and high intensity consumers had 20 plus admissions in a 9 month period

Pre-Health Home Data
12 or more pharmaceuticals
Low Intensity Services Medium Intensity
Services High Intensity Services Total Popula\on
Total Number # # #
Average
Consumer with low intensity services were more likely to be prescribed 12 or more pharmaceu\cals than consumers high intensity services

Agency A Pre-Health Home Data
12 or more pharmaceuticals – 9 month data 2014
Low Intensity Services Medium Intensity
Services High Intensity Services Total Popula\on
Total Number 161 157 115 433
Average 54% 53% 39% 48%
Consumer with low intensity services were more likely to be prescribed 12 or more pharmaceu\cals than consumers high intensity services

Data Collection Needs • Agencies need to have someone who can work
w/ spreadsheets – Having raw data makes it easy to sort – The data should not come w/ conclusions
• Don’t make it complicated – If there are other factors / sources of income –remove
them out of the equation • Be open about looking at the data
– Don’t use the data to prove a decision you have already made

Data Collection Elements • Agencies need to have access to the following data:
– Current Medicaid eligibility & enrollment by catchment area – Current agency reimbursement by client
• Works best if the data spans 1 year – IF the only available data is for less than a year, formulas in the
worksheet need to be adjusted • By CPT code
– Separate out CPST – Can add BH services together
» Therapy codes, group codes, pharmacy mgt, psych eval, assessment
– Current range of reimbursement • Necessary in order to start drilling down the data
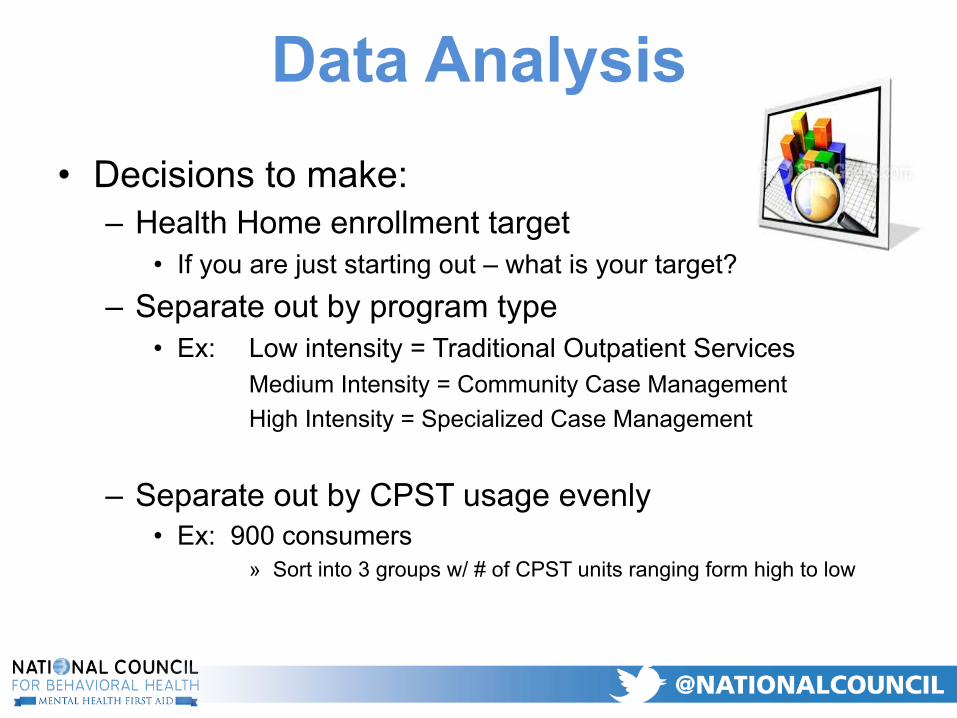
Data Analysis • Decisions to make:
– Health Home enrollment target • If you are just starting out – what is your target?
– Separate out by program type • Ex: Low intensity = Traditional Outpatient Services
Medium Intensity = Community Case Management High Intensity = Specialized Case Management
– Separate out by CPST usage evenly • Ex: 900 consumers
» Sort into 3 groups w/ # of CPST units ranging form high to low

Drilling it Down • Drill data down by program • Add in other reimbursement data
– Health Homes are not stand alone programs • Agencies need to look at outcome data
– Are the services provided making a difference? • By Program?
– Which services?
• Agencies need to look identify their target populations – High intensity consumers – Mix of intensity of consumers – Varying % of intensity of consumers
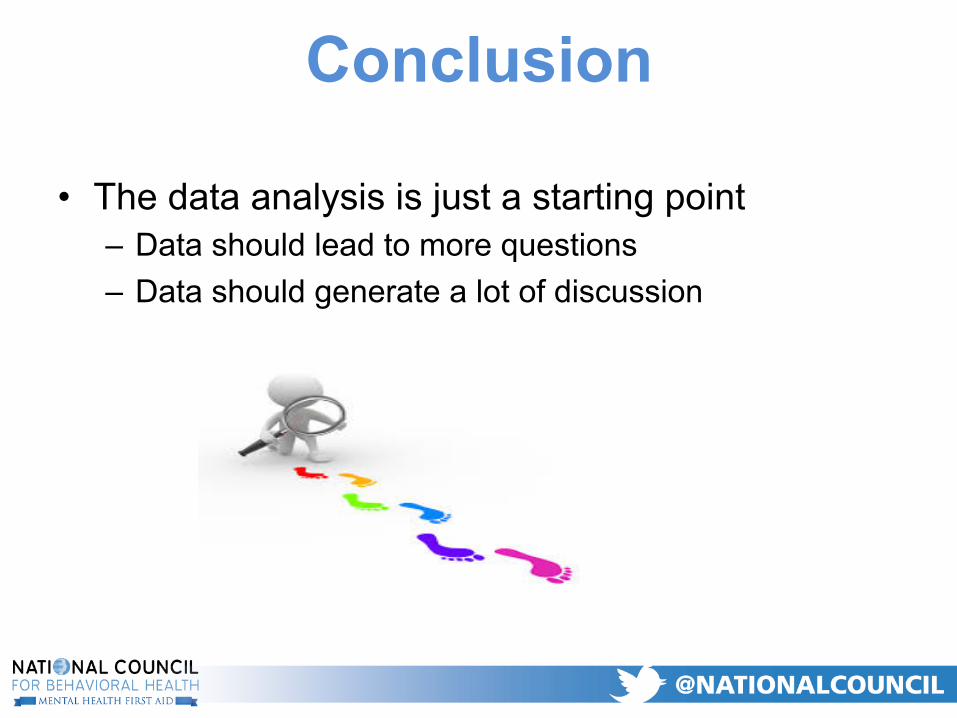
Conclusion
• The data analysis is just a starting point – Data should lead to more questions – Data should generate a lot of discussion