case studies of nine jurisdictions that reduced
TRANSCRIPT

The author(s) shown below used Federal funds provided by the U.S.Department of Justice and prepared the following final report:
Document Title: Case Studies of Nine Jurisdictions that ReducedDisproportionate Minority Contact in theirJuvenile Justice Systems
Author(s): Elizabeth Spinney, Marcia Cohen, WilliamFeyerherm, Rachel Stephenson, Martha Yeide,Michael Hopps
Document No.: 250301
Date Received: October 2016
Award Number: 2009-JF-FX-0103
This report has not been published by the U.S. Department of Justice.To provide better customer service, NCJRS has made this federallyfunded grant report available electronically.
Opinions or points of view expressed are thoseof the author(s) and do not necessarily reflect
the official position or policies of the U.S.Department of Justice.

NOTE: The jurisdictions identified in this study reduced Disproportionate Minority Contact (DMC) over a three-year period. As with data, trends may have changed since this Report was completed. Though some trends may have changed, these jurisdictions were able to demonstrate reduction of DMC throughout their juvenile justice systems during the research time frame.


Case Studies of Nine Jurisdictions That Reduced DMC in Their Juvenile Justice Systems
Case Studies of Nine Jurisdictions ThatReduced Disproportionate Minority Contact
in Their Juvenile Justice Systems
March2014
byElizabethSpinney,MarciaCohen,WilliamFeyerherm,RachelStephenson,MarthaYeide,andMichaelHopps
Development Services Group, Inc.7315 Wisconsin Avenue, Suite 800e
Bethesda, MD 20814Phone: 301.951.0056
Fax: 301.951.3324www.dsgonline.com
Prepared Under Cooperative Agreement No. 2009–JF–FX–0103
This document is a research report submitted to the U.S. Department of Justice. This report has not been published by the Department. Opinions or points of view expressed are those of the author(s)
and do not necessarily reflect the official position or policies of the U.S. Department of Justice.

Case Studies of Nine Jurisdictions That Reduced DMC in Their Juvenile Justice Systems
ii
ACKNOWLEDGMENTS
The project staff at Development Services Group, Inc., extend thanks to the many dedicatedjuvenile justice professionals who assisted with this disproportionate minority contact (DMC)case study report. We are most grateful for the guidance and assistance from the experts onour advisory group, who include Lindsey Draper, DMC Coordinator at the WisconsinDepartment of Justice; Tom Harig, national juvenile justice consultant and former DMCCoordinator for the state of New York; Darnell Hawkins, professor emeritus of African Americanstudies, sociology, and criminal justice at the University of Illinois at Chicago; and KimberlyKempf–Leonard, dean of the College of Liberal Arts at Southern Illinois University atCarbondale. Mr. Draper and Dr. Harig were able to share their firsthand knowledge of DMCwork at the state level. Dr. Hawkins and Dr. Kempf–Leonard were able to share their knowledgeof DMC from the research perspective, having published many pieces on DMC, including OurChildren, Their Children: Confronting Racial and Ethnic Differences in American Juvenile Justice(2005), which they coedited.
In addition to our advisory group, many individuals helped us complete this final report. As wegathered information, we enjoyed the privilege of speaking with and interviewing numerousmembers of state and local juvenile justice communities across the country. Cited in ourreference section, we interviewed 23 individuals who provided key, detailed information, whichformed the base of each of the case studies. Interviews lasted up to 2 hours, and weinterviewed some individuals more than once. These interviewees also reviewed case studydrafts and provided input and clarification when needed. We are truly grateful for theexperiences and knowledge they shared with us. All of the interview sessions were engaging,and we found an exceptionally high level of interest in DMC. We also found that mostinterviewees had hope that, by devoting enough attention to the issue, we can improve thestark racial disparities that exist today. We hope we have adequately conveyed the experiencesand information shared from these dedicated professionals.
Additionally, we spoke with many others who took the time to provide us with the contactinformation for our key-informant interviews, to schedule interviews, to give us updated dataor unpublished information about programming and who answered the many, specificquestions we had. This was invaluable, as we gathered accurate and useful information on eachof the sites. Still there were other interviewees who provided important information on theirjurisdictions, but theirs were not included in the final report for one reason or another (e.g., insome sites, we discovered that the reason for the relative rate index improvement was thatthere was a change in data-collection methods and thus not a true reduction in DMC). Althoughtheir stories are not presented here, we appreciate the time they took to help us in thisimportant project.
Finally, we make special mention of our program manager at OJJDP, Andrea Coleman, whoseexperience, expertise, and advice helped shape this final report.
This document is a research report submitted to the U.S. Department of Justice. This report has not been published by the Department. Opinions or points of view expressed are those of the author(s)
and do not necessarily reflect the official position or policies of the U.S. Department of Justice.

Case Studies of Nine Jurisdictions That Reduced DMC in Their Juvenile Justice Systems
iii
CONTENTS
Executive Summary......................................................................................................................... 11. Introduction ................................................................................................................................ 62. OJJDP, DMC, and the RRI: Background Information................................................................... 73. Methodology............................................................................................................................. 104. Overview of Selected Site Characteristics ................................................................................ 135. Common Strategies Across Case Study Sites ............................................................................ 166. Case Studies .............................................................................................................................. 24
Bernalillo, New Mexico ............................................................................................................. 24Clark County, Nevada................................................................................................................ 34Connecticut ............................................................................................................................... 41Essex County, New Jersey ......................................................................................................... 47Hillsborough County, New Hampshire ..................................................................................... 55Montgomery County, Alabama ................................................................................................ 59Philadelphia, Pennsylvania ....................................................................................................... 63Tulsa County, Oklahoma ........................................................................................................... 68Utah County, Utah .................................................................................................................... 75
7. Conclusion................................................................................................................................. 84References .................................................................................................................................... 85
This document is a research report submitted to the U.S. Department of Justice. This report has not been published by the Department. Opinions or points of view expressed are those of the author(s)
and do not necessarily reflect the official position or policies of the U.S. Department of Justice.

Case Studies of Nine Jurisdictions That Reduced DMC in Their Juvenile Justice Systems
1
EXECUTIVESUMMARY
CROSS THE UNITED STATES, youths of color are more likely than their white peers to bearrested and referred to juvenile court. After becoming involved in the juvenile justicesystem, they are also more likely to go deeper into the system, resulting in a higher
likelihood of secure detainment, confinement, and transfer to adult court. Minority youths arealso less likely to be diverted from court. This phenomenon, known as disproportionateminority contact (DMC), has been recognized for decades as a deep-rooted problem in thejuvenile justice system. All states are required to address DMC to stay in compliance with thefederal Juvenile Justice and Delinquency Prevention Act (JJDPA). The Office of Juvenile Justiceand Delinquency Prevention (OJJDP) tracks compliance with this JJDPA requirement. In 2005,OJJDP began requiring states to input data on the flow of youths at nine points in their juvenilejustice systems into a Web-based data entry system. Until now, there has been no methodicalnational analysis of these data. This study is the first to systematically review the data inOJJDP’s database, to identify sites that have been able to reduce DMC over an extended periodof time, and to gather information on the strategies used in those successful sites.
At the start of this study, OJJDP’s Web-based data entry system had reports from nearly 1,500jurisdictions across the United States. The top 20 jurisdictions with reductions in racialdisparities for five of OJJDP’s nine juvenile justice stages (referral, diversion, detention,confinement, and transfer) were selected for further study. After analyzing data trends,gathering information from state Juvenile Justice Specialists and DMC Coordinators,interviewing stakeholders and decision-makers in jurisdictions of interest, presenting findingsduring meetings and conferences, receiving input from OJJDP, and meeting with our AdvisoryCommittee, nine jurisdictions were selected for case studies. Five of the nine jurisdictionsreduced DMC at arrest or referral to court, three jurisdictions reduced DMC at diversion, fourjurisdictions reduced DMC at detention, and two jurisdictions reduced DMC at secureconfinement. Eight of the jurisdictions reduced DMC for African American youth, eightjurisdictions reduced DMC for Hispanic youth, and two jurisdictions reduced DMC for NativeAmerican youth.
The nine jurisdictions selected as case study sites were 1) Bernalillo County, N.M., 2) ClarkCounty, Nev., 3) the state of Connecticut, 4) Essex County, N.J., 5) Hillsborough County, N.H., 6)Montgomery County, Ala., 7) Philadelphia, Pa., 8) Tulsa County, Okla., and 9) Utah County,Utah.
These nine case study sites represent a diverse group of jurisdictions both geographically anddemographically. The smallest jurisdiction by population was Montgomery County, Ala., whichhad fewer than 250,000 residents, and the largest jurisdiction was the state of Connecticut,which had more than 3.5 million residents. Some of the sites, such as Utah County, Utah, andBernalillo County, N.M., were gaining youth population while others, such as Philadelphia, Pa.,were losing youth population. The portion of youth population ages 10–17 that was minorityranged from 15 percent in Hillsborough County, N.H., to 78 percent in Philadelphia. The povertyrates for children and youth also varied significantly among the nine sites.
A
This document is a research report submitted to the U.S. Department of Justice. This report has not been published by the Department. Opinions or points of view expressed are those of the author(s)
and do not necessarily reflect the official position or policies of the U.S. Department of Justice.

Case Studies of Nine Jurisdictions That Reduced DMC in Their Juvenile Justice Systems
2
Although the selected sites had numerous differences, interviewees often pointed to similarstrategies that they felt were responsible for reducing racial disparities in their systems. Theeight most-noted strategies were
1. Focusing on data collection and utilization2. Increasing collaboration with other state and local agencies, police, judges, and the
community3. Changing the institutional culture away from a punitive or procedural focus toward a
focus on what was best for the youth and the community4. Affiliating with national juvenile justice reform initiatives5. Creating alternatives to secure detention, secure confinement, and formal system
involvement6. Focusing intentionally on DMC reduction (and not just on general system improvement)
while using a nonaccusatory tone7. Leadership at the local level, the state level, or both8. Making DMC reduction a long-term priority
While these eight strategies were the most common, each site approached its unique DMCproblems in its own way. Following is a brief summary of strategies utilized and achievementsgained in each of the nine sites.
Bernalillo County, N.M.
Bernalillo County is the largest county in New Mexico and home to Albuquerque, the largestcity in the state. In the past 10 years, the youth population has grown by 11 percent, andapproximately 71 percent of youths ages 10–17 today are minorities. During 2004–10,Bernalillo County was able to reduce racial disparities for African American, Hispanic, andNative American youth among law enforcement referrals to probation and among diversionsfrom court. There were also positive trends among referrals to the Children’s Court Attorney.During these years, Bernalillo County focused on multiple strategies designed primarily aroundsystems reform, attention to data, and increasing community-based services for court-involvedyouth. Bernalillo County became a Juvenile Detention Alternatives Initiative (JDAI) site in the1990s and has used the JDAI framework for many years to improve its system. Much of theemphasis has been on reducing the number of youths in secure detention and serving detainedyouths after they return to the community. Notably, Bernalillo County established a licensedfreestanding mental health clinic adjacent to its detention facility to serve court-involvedyouths in the community. Bernalillo County also focused directly on increasing access todiversion by establishing the Prevention Unit. It has been able to involve multiple partners overlong periods of time in their efforts, even when individuals move to new positions.
Clark County, Nev.
Clark County is a large jurisdiction with a majority minority youth population. During 2007–11,racial disparities for African American youth decreased at secure detention and secure
This document is a research report submitted to the U.S. Department of Justice. This report has not been published by the Department. Opinions or points of view expressed are those of the author(s)
and do not necessarily reflect the official position or policies of the U.S. Department of Justice.

Case Studies of Nine Jurisdictions That Reduced DMC in Their Juvenile Justice Systems
3
confinement. The relative rate index (RRI) value decreased from 1.7 to 1.4 at secure detentionand from 2.4 to 1.7 at secure confinement, while overall numbers also decreased. For Hispanicyouth, the RRI value at secure detention was 1.0 for 4 of the 5 years from 2007 through 2011,indicating no racial disparities at this point in the system for Hispanic youth. During this time,Clark County used numerous systemwide strategies, including better incorporation oftechnology and data analysis into decision-making, adherence to a risk-assessment instrumentto determine placement in secure detention, increasing access to alternatives to securedetention and confinement, building relationships with the community, and changing theculture of the system toward one that concentrates on addressing the needs of the youth(rather than concentrating on law enforcement). Throughout all of this, Clark County also madesure that there was an intentional focus on DMC by having a Racial Disparities Workgroup,making DMC reduction a public issue, and working with a national DMC technical assistanceprovider.
The State of Connecticut
The state of Connecticut, the largest jurisdiction in this report, has published threecomprehensive DMC assessment studies since the early 1990s, which have informed decision-makers on where to allocate DMC–reduction resources. During 2006–12, the years highlightedin this report, Connecticut concentrated its DMC strategy primarily on training and awarenessof DMC across the state. Connecticut developed the Effective Police Interactions With Youthtraining curriculum between 2004 and 2006 to reduce DMC at the arrest stage. This curriculumhas been used to train more than 1,500 Connecticut police officers as well as officers in otherstates. Other strategies in Connecticut included the development of a model memorandum ofunderstanding for police officers and schools to use to reduce school-based arrests andreferrals to court, funding for projects to build relationships between youth and police in localjurisdictions, and establishing two informational campaigns: JUST.Start, which focused on DMCin the juvenile justice system, and Right.ResponseCT, which focused on schools and policeknowing the “right response” to youth misbehavior. Steady leadership from the Juvenile JusticeSpecialist and the State Advisory Group has contributed to the development and execution ofthese strategies, which appear to have reduced DMC in Connecticut. During 2006–12, the RRIvalues at referral declined from 2.9 to 1.6 for Hispanic youth and from 6.3 to 4.7 for AfricanAmerican youth.
Essex County, N.J.
Essex County, N.J., is the third-most populous county in New Jersey and part of New York City’sgreater metropolitan area. Approximately 71 percent of youths ages 10–17 in Essex County areminority, and the largest minority group is African American. During 2004–11, Essex County wasable to reduce racial disparities among the youths who were both referred to court anddiverted from court. The RRI value at referral declined from 4.9 to 3.5 for African Americanyouths and from 2.2 to 1.1 for Hispanic youths. The RRI value at diversion improved from 0.59to 0.87 for African American youths and from 0.71 to 0.93 for Hispanic youths. Additionally, thenumber of African American youths being securely detained and confined decreased 39 percentand 73 percent, respectively. During these years, there were systemwide reform efforts
This document is a research report submitted to the U.S. Department of Justice. This report has not been published by the Department. Opinions or points of view expressed are those of the author(s)
and do not necessarily reflect the official position or policies of the U.S. Department of Justice.

Case Studies of Nine Jurisdictions That Reduced DMC in Their Juvenile Justice Systems
4
involving multiple system stakeholders and decision-makers, which resulted in a positivechange in organizational culture. Essex County was one of the five original sites to participate inJDAI in New Jersey (which was named the first-ever statewide model JDAI site) and was veryactive in implementing JDAI principles. Essex County increased its use of data to makedecisions, created and improved alternatives to secure detention, and utilized its numerousdiversion options to reduce DMC.
Hillsborough County, N.H.
Hillsborough, N.H., has a small but growing minority population. Many decision-makers felt thatthe number of minority youth was too small to warrant much attention. However, the stateDMC Coordinator, key police chiefs, and other juvenile justice stakeholders decided it wasimportant to concentrate on reducing racial disparities in the juvenile justice system before theproblem got out of control. Strategies such as improving data accuracy, engaging police chiefsin DMC work, and providing training to police officers in diversity and police–youth interactionsseem to have made a positive impact. There has been a decrease in arrest rates for both whiteand Hispanic youth as well as a decrease in racial disparities. During 2007–11, the overall arrestrate decreased from 5.7 arrests per 100 youths to 4.2 arrests per 100 youths. Arrest rates forHispanic youths also declined steadily from 8.8 per 100 in 2008 to 5.2 per 100 in 2011, resultingin a decrease in the relative rate index from 1.8 to 1.3.
Montgomery County, Ala.
Montgomery County, the smallest jurisdiction in this report, was identified as a DMC–reductionsuccess story for its reductions in racial disparities for African American youth at both securedetention and secure confinement. The number of youths being detained and confined alsodecreased, as did the confinement and detention rates. Key stakeholders credit the reduction innumbers as well as the decreases in rates and racial disparities to the JDAI. In MontgomeryCounty, the JDAI led to a strong collaboration of juvenile justice partners in both the executiveand judicial branches. Through this collaboration, Montgomery County has been able toconcentrate more on data and to develop a risk assessment instrument that has helpedminimize the number of youths who qualify for secure detention. During 2009–11, the numberof African American youths being sent to secure detention decreased by more than half, andthe RRI improved from 1.6 to 1.3. At secure confinement, the number of African Americanyouths declined by 26 percent, and the RRI improved from 1.3 to 1.1.
Philadelphia, Pa.
Philadelphia is a large city with many initiatives aimed at systems-involved and at-risk youth.During 2006–10, DMC decreased for African American and Hispanic youth at the detentionstage. During this time, the RRI for African American youth declined from 1.6 to 1.3, and the RRIfor Hispanic youth declined from 2.3 to 1.3. Four particular initiatives—an active working groupof the DMC committee, opportunities to build relationships between youth and police, aGraduated Response Court, and global positioning satellite monitoring as an alternative todetention—were credited as contributing to the reduction in DMC at secure detention.
This document is a research report submitted to the U.S. Department of Justice. This report has not been published by the Department. Opinions or points of view expressed are those of the author(s)
and do not necessarily reflect the official position or policies of the U.S. Department of Justice.

Case Studies of Nine Jurisdictions That Reduced DMC in Their Juvenile Justice Systems
5
Tulsa County, Okla.
Tulsa County’s DMC–reduction strategy was initiated at the state level with direction from thestate Juvenile Justice Specialist and the state DMC Coordinator, and was implemented incollaboration with county stakeholders. Tulsa County’s DMC–reduction strategies includedhiring a local DMC Coordinator, forming a local DMC Steering Committee, conducting strategicplanning, implementing trainings for police, and establishing a crisis intervention center toprovide law enforcement with an alternative to detention for youths who commit low-leveloffenses. Between 2005 and 2011, diversion rates improved for white, African American,Hispanic, and Native American youth in Tulsa County, leading to an improvement in RRI valuesfor the largest minority group, African American youth. At detention, the RRI improved forAfrican American youth from 1.4 to 1.1. Additionally, the RRI value at secure detention forHispanic and Native American youth was 1.0 for the last years this indicator was measured.Finally, there is a promising trend at the arrest stage in Tulsa. During 2005–11, the total numberof juvenile arrests decreased by 33 percent, while arrest rates decreased for each of theprimary racial/ethnic groups.
Utah County, Utah
Utah County’s DMC–reduction efforts were initiated at the state level and designed with localleaders to best address DMC in Utah County. The state of Utah was interested in addressingDMC and started the process by bringing in a technical assistance provider to review the state’sdata and assist in developing a DMC–reduction strategy. Given what the data showed, state-level decision-makers decided to focus on reducing DMC at the diversion stage with anemphasis on three counties, including Utah County. Utah also hired a DMC Coordinator,concentrated on improving data collection, developed a training curriculum for police cadets towork better with diverse communities, and increased awareness of DMC statewide. In UtahCounty, a local DMC Working Group was formed, changes were made to certain diversioneligibility requirements, and there was an increased use of receiving centers. Between 2007 and2010, Utah County’s data have shown improvements at four contact points: arrest, referral tocourt, diversion, and secure detention. The African American RRI at arrest declined from 5.7 in2007 to 3.6 in 2010, and the Hispanic RRI at arrest declined from 2.8 to 2.2 in the same timeperiod. The RRI for Hispanic youth at referral to court improved from 3.2 to 2.3, at diversionimproved from 0.59 to 0.91, and at detention improved from 1.4 to 1.1.
This document is a research report submitted to the U.S. Department of Justice. This report has not been published by the Department. Opinions or points of view expressed are those of the author(s)
and do not necessarily reflect the official position or policies of the U.S. Department of Justice.

Case Studies of Nine Jurisdictions That Reduced DMC in Their Juvenile Justice Systems
6
1.INTRODUCTION
ISPROPORTIONATE MINORITY CONTACT (DMC) has been recognized for decades as a deep-rooted problem in the juvenile justice system, and states are required to address it tostay in compliance with the federal Juvenile Justice and Delinquency Prevention Act
(JJDPA). For more than a decade the Office of Juvenile Justice and Delinquency Prevention(OJJDP) has led efforts to address DMC through conferences, training and technical assistance,publications, and enforcing requirements in the JJDPA to address DMC. For DMC monitoringpurposes, OJJDP requires states to collect raw juvenile justice data on the volume of activitiesby race and ethnicity at nine different juvenile justice contact points—arrest, referral, diversion,detention, petitioned/charges filed, delinquent findings, probation, confinement in securecorrectional facilities, and transfer to adult court—for targeted DMC–reduction sites withintheir boundaries. This is a rich source of DMC data over time and across jurisdictions.
Despite years of data submission, there had been no systematic national analysis of these dataand no longitudinal portrait of the changing (or static) nature of the experiences of minorityyouths with the justice system. To assist states and localities in achieving and maintainingcompliance with the DMC requirements in the JJDPA and in reducing racial disparities in theirsystems, Development Services Group, Inc., conducted a national analysis of the DMC data toidentify promising and best practices in reducing DMC. The analysis was funded by OJJDP’s FieldInitiated Research and Evaluation program and began in 2009. This analysis included identifyingthe jurisdictions that showed a consistent positive movement in their DMC data over 3consecutive years and then obtaining detailed information on the approaches used by thesesuccessful jurisdictions. This study was guided by a four-member Advisory Committee of DMCexperts and is the first to systematically examine all of the collected data at each contact pointto identify data-driven best practices in reducing DMC.
This report presents nine case studies of jurisdictions that have successfully reduced DMC atone or more juvenile justice contact points, which can be replicated by other jurisdictions. Thenine selected jurisdictions represent a diverse group of sites in terms of geography, populationsize, racial composition, income level, and strategies used, reflecting the diverse nature ofcommunities across the nation.
D
This document is a research report submitted to the U.S. Department of Justice. This report has not been published by the Department. Opinions or points of view expressed are those of the author(s)
and do not necessarily reflect the official position or policies of the U.S. Department of Justice.

Case Studies of Nine Jurisdictions That Reduced DMC in Their Juvenile Justice Systems
7
2.OJJDP,DMC,ANDTHERRI:BACKGROUNDINFORMATION
What Is DMC?
ISPROPORTIONATE MINORITY CONTACT (DMC) refers to rates of contact with the juvenilejustice system among juveniles of a specific minority group that are significantlydifferent from rates of contact for white non-Hispanic juveniles. DMC is a problem in
jurisdictions across the United States. For example, a national single-day count of juveniles heldin secure residential facilities in 2010 found that 41 percent of the population were AfricanAmerican and 22 percent were Hispanic (Sickmund et al. 2011), even though only 13 percent ofteens in the general population are African American and 16 percent are Hispanic (Puzzanchera,Sladky, and Kang 2011). These racial disparities are called disproportionate minority contact.
What Is the DMC Core Requirement?
Criminology researchers and theorists have long understood that there are racial and ethnicdisparities in the degree of contact that juveniles have with the juvenile justice system and inthe operation of the multiple parts of that system as they apply to juveniles. In 1988, thoseconcerns were given statutory voice in an amendment to the Juvenile Justice and DelinquencyPrevention Act (JJDPA), which required states participating in the Formula Grants Program toexamine disproportionate minority confinement. In 2002, through reauthorization of the JJDPA,the U.S. Congress modified the language related to DMC to include all system contact, whetherit related directly to confinement or to other forms of justice system contact. In addition, thelanguage in 2002 created a directive to reduce such disproportionate minority contact (Hsia2009). The language of “reduction” in turn means that it is necessary to measure change indisparities as well as to create strategies to accomplish those reductions.
Who Coordinates DMC–Reduction Work at the State Level?
Much of the DMC–reduction work in the states is coordinated by State Advisory Groups (SAGs),state Juvenile Justice Specialists, and state DMC Coordinators. SAGs are appointed by the chiefexecutive officer of a state (usually a governor) to maintain state compliance with the JJDPA.The SAG consists of 15 to 33 members who have training, experience, or special knowledgeconcerning the prevention and treatment of juvenile delinquency or the administration ofjuvenile justice [JJDPA § 223(a)(3)]. SAGs often use other names within their own states. Forexample, the Connecticut SAG is called the Juvenile Justice Advisory Committee, and theAlabama SAG is called the Alabama Advisory Council on Juvenile Justice and DelinquencyPrevention. State Juvenile Justice Specialists and state DMC Coordinators are usually employeesof a state and can be funded with federal Formula Grants. In partnership with the SAG, theJuvenile Justice Specialist is responsible for developing a comprehensive 3-year plan, which issubmitted to the Office of Juvenile Justice and Delinquency Prevention (OJJDP) and updatedeach year. This 3-year plan is also the application for federal Formula Grants funding, whichprovides grants to state agencies, local units of government, and private nonprofitorganizations to prevent and control delinquency and to address DMC. The state DMC
D
This document is a research report submitted to the U.S. Department of Justice. This report has not been published by the Department. Opinions or points of view expressed are those of the author(s)
and do not necessarily reflect the official position or policies of the U.S. Department of Justice.

Case Studies of Nine Jurisdictions That Reduced DMC in Their Juvenile Justice Systems
8
Coordinator is responsible for providing leadership so states can address DMC and forfacilitating compliance with the DMC core requirement (Coleman 2009). In the states, the DMCCoordinator is a fulltime position, a parttime position, or part of the job responsibilities of theJuvenile Justice Specialist. Some states also have local DMC Coordinators who work in targetedDMC–reduction jurisdictions.
What Are the Five Contact Points Examined in This Report?
In this report, we chose jurisdictions that were able to reduce racial disparities at arrest,referral to court, diversion, secure detention, and secure confinement. The definitions beloware from OJJDP’s DMC Web-based data entry system, where the data from this reportoriginated. At times, jurisdictions used a slightly different definition of these stages.*
ArrestYouths are considered to be arrested when they are apprehended, stopped, or otherwisecontacted by law enforcement agencies and suspected of having committed a delinquent act.Delinquent acts are those that, if committed by an adult, would be criminal, including crimesagainst persons, crimes against property, drug offenses, and crimes against the public order.
ReferralReferral occurs when a potentially delinquent youth is sent forward for legal processing andreceived by a juvenile or family court, or juvenile intake agency, either as a result of lawenforcement action or upon a complaint by a citizen or school.
DiversionYouths referred to juvenile court for delinquent acts are often screened by an intakedepartment (either within or outside the court). The intake department may decide to dismissthe case for lack of legal sufficiency, to resolve the matter informally (without the filing ofcharges), or formally (with the filing of charges). The diversion population includes all youthsreferred for legal processing but handled without the filing of formal charges.
DetentionDetention refers to youths held in secure detention facilities at some point during courtprocessing of delinquency cases (i.e., before disposition). In some jurisdictions, the detentionpopulation may also include youths held in secure detention to await placement following acourt disposition. For the purposes of DMC, detention may also include youths held in jails andlockups. Detention should not include youths held in shelters, group homes, or other nonsecurefacilities.
Secure ConfinementConfined cases are those in which youths are placed in secure residential or correctionalfacilities for delinquent offenders following a court disposition. The confinement population
*Also, at times, jurisdictions use different terms for these stages. For example, Bernalillo County, N.M., uses theterm “law enforcement referral to probation” instead of “arrest” and uses the term “referral to the Children’sCourt Attorney” instead of “referral to court.”
This document is a research report submitted to the U.S. Department of Justice. This report has not been published by the Department. Opinions or points of view expressed are those of the author(s)
and do not necessarily reflect the official position or policies of the U.S. Department of Justice.
Case Studies of Nine Jurisdictions That Reduced DMC in Their Juvenile Justice Systems
9
should not include all youths placed in any form of out-of-home placement. Group homes,shelter homes, and mental health treatment facilities, for example, would usually not beconsidered confinement. Every jurisdiction collecting DMC data must specify which forms ofplacement do and do not qualify as confinement.
What Is the Relative Rate Index?
The primary tool developed for OJJDP to identify DMC was the relative rate index (RRI), which issimply the ratio of rates of contact at several decision points for minority youth compared withthe rates for white youth at the same contact points. The RRI identifies disparities in the volumeof activity from one contact point to the next and how it differs for white and minority youths.The RRI is calculated by dividing the rate of activity involving minority youths divided by therate of activity involving white youths. For example, to find the RRI for African American youthat the arrest stage, first we would calculate the arrest rate for African American youth, and thenthe arrest rates for white youth. The arrest rate is the number of arrests per youth in thegeneral population. Then, the African American rate is divided by the minority rates to get theRRI. An RRI of 1.0 would show no disparity. In this report, we look at RRI values at arrest,referral to court, diversion, secure detention, and secure confinement. We hope to seedecreases in RRI values at arrest, referral to court, secure detention, and secure confinement,while we hope to see increases in RRI values at diversion.
This document is a research report submitted to the U.S. Department of Justice. This report has not been published by the Department. Opinions or points of view expressed are those of the author(s)
and do not necessarily reflect the official position or policies of the U.S. Department of Justice.

Case Studies of Nine Jurisdictions That Reduced DMC in Their Juvenile Justice Systems
10
3.METHODOLOGY
HE DATA USED TO IDENTIFY case study sites came from the Office of Juvenile Justice andDelinquency Prevention’s (OJJDP’s) Disproportionate Minority Contact (DMC) Web-BasedData Entry System. OJJDP developed this Web-based data entry system in 2005 and
requires states to enter raw juvenile justice data on the volume of activities by race andethnicity at nine different juvenile justice contact points—arrest, referral, diversion, detention,petitioned/charges filed, delinquent findings, probation, confinement in secure correctionalfacilities, and transfer to adult court—for targeted DMC–reduction sites within their boundaries(usually at least three counties in each state) into this system at least once every 3 years.
In 2009, at the start of this project, this database had reports from nearly 1,500 jurisdictions, insome instances ranging back to 2003 and 2004. To examine trends, multiple years of data werenecessary. A limit was imposed of having at least 3 years of data. This prerequisite reduced thenumber of jurisdictions being considered to 717 jurisdictions (37 states and 680 counties).
After the data were extracted from the system, some changes were made to the traditional RRIformat to make the data more usable. First, the general youth population was used as the basefor calculating the referral rate (instead of using the number of arrests) because arrest numbersare frequently unavailable for Hispanic youth.* Second, diversion rates, detention rates, secureconfinement rates, and transfer rates were calculated using referral numbers as the base.†
After extracting the data, three stages were intentionally excluded from the analysis. Issuanceof a petition and the finding of delinquency were both excluded on the basis of small variation.In most jurisdictions these stages show an RRI value near 1.0 and are not a major contributor tooverall disparities in the extent of contact with the justice system. The probation decision pointwas excluded in part based on lower variation, as with petition and delinquency, and in partbecause the probation decision is often viewed as the “flip side” of theincarceration/confinement decision, which does, however, show greater variability acrossjurisdictions and is more closely related conceptually to the origins of the DMC mandate.
At that point, the top 20 jurisdictions with RRI improvements for each of the five juvenile justicestages (referral, diversion, detention, confinement, and transfer) were selected for furtherstudy, resulting in 78 jurisdictions under consideration (some jurisdictions were identified atmore than one contact point). Change in RRI scores was calculated by taking a logtransformation of the RRI scores and calculating the mathematical difference in scores from thefirst year reported to the last (most recent). Jurisdictions were ranked on that change measure.
*As a result, the rate of referral for Hispanic youth (expressed as a rate per 100 arrests) cannot be calculated, andsignificant missing information results. However, by basing the referral rate on the population, it essentiallybecomes an entry rate for juvenile justice and is available for Hispanic youth as well as for others.†Diversion and detention rates are traditionally calculated using “refer to adult court” data. But the base forcalculating secure confinement rates is usually the “adjudication delinquent” data, and the base for calculatingtransfer rates was “petitioned/charges filed” data. However, data are not always available for each juvenile justicestage. When this happens, the rate is treated as missing. When secure confinement and transfer to adult court areboth expressed as rates per 100 cases referred to court, we do not lose as many cases.
T
This document is a research report submitted to the U.S. Department of Justice. This report has not been published by the Department. Opinions or points of view expressed are those of the author(s)
and do not necessarily reflect the official position or policies of the U.S. Department of Justice.

Case Studies of Nine Jurisdictions That Reduced DMC in Their Juvenile Justice Systems
11
RRI data (rates of processing and the calculated RRI values) for the 78 jurisdictions was thengraphed across time for each jurisdiction. In that process, a standard presentation wasdeveloped in which the rates of processing for a minority group and for white youth weregraphed against the left-hand axis of the chart and the RRI value was graphed against the right-hand axis, with the available years of data shown on the horizontal axis. Based on visualanalysis of each graph, jurisdictions were classified into several qualitative categories ofimprovement (very good, good, fair). While creating the graphs, sometimes additional races ordecision points were identified where DMC was declining.
The charts appear like the one shown below. On the x-axis, the year is presented. Under theyears, the white rate, the minority rate, and the RRI are presented in a table for each of theyears. In the chart, the rates and the RRI are presented. The blue line represents the white rate.In the example below, it represents the white detention rate. Other charts will show arrestrates, referral rates, diversion rates, or secure confinement rates. The pink line represents theminority rate. In the example below, the pink line represents the African American detentionrate. In other examples, the pink line will represent Hispanic or Native American youth. Theright-hand y-axis is for the RRI. As the rates and the RRI are different measures, the scale is alsodifferent. However, we wanted to present the information in one chart to make it easier to see.Because of this, the left-hand y-axis (and the blue and pink lines) represents the rates while theright side (and the green line) represents the RRI.
Figure 3.1. Sample Chart: Detention Rates and RRI—African American
During the analysis, new data became available for many of the jurisdictions. If a jurisdictionhad at least one promising graph, the new data were entered and the graph was updated toreflect the new data. Additionally, jurisdictions came to our attention in publications or duringconferences. When this happened, we also analyzed the data from those specific jurisdictions.Finally, for identified jurisdictions with reliable data, we examined the RRI at arrest.
2005 2006 2007 2008 2009 2010Rate - White 35.1 34.0 28.4 22.4 21.8 18.2Rate- Black 72.8 68.5 50.0 31.5 22.7 18.2RRI Detention 2.1 2.0 1.8 1.4 1.0 1.0
0.0
0.5
1.0
1.5
2.0
2.5
0.0
10.0
20.0
30.0
40.0
50.0
60.0
70.0
80.0
Rel
ativ
e R
ate
Inde
x (R
RI)
Det
entio
n ra
te (p
er 1
00 r
efer
rals
)
Detention Rates and RRI: African American
This document is a research report submitted to the U.S. Department of Justice. This report has not been published by the Department. Opinions or points of view expressed are those of the author(s)
and do not necessarily reflect the official position or policies of the U.S. Department of Justice.

Case Studies of Nine Jurisdictions That Reduced DMC in Their Juvenile Justice Systems
12
Over the course of 2 years, we analyzed and updated data, gathered information from stateJuvenile Justice Specialists and DMC Coordinators, interviewed stakeholders and decision-makers in jurisdictions of interest, presented findings during meetings and conferences,received input from OJJDP, and met with the Advisory Committee. For the interviews, aninterview protocol was developed and used for each of the nine sites. The names of theinterviewees are listed in the references that appear at the end of this document.
By the end of the project, nine sites were selected as case studies to be included in this report.Most sites were chosen for their reductions in racial disparities at one or two contact points.This is important to note since at other decision points the racial disparities may have stagnatedor even gotten worse. Transfer to adult court was eventually excluded as a contact point ofinterest because the lack of large numbers over an extended amount of time made clear datatrends difficult to find. Information presented in the case studies comes from OJJDP’s DMCWeb-based data entry system, other cited documentation, interviews with stakeholders anddecision-makers, and from other sources obtained during the interviews.
This document is a research report submitted to the U.S. Department of Justice. This report has not been published by the Department. Opinions or points of view expressed are those of the author(s)
and do not necessarily reflect the official position or policies of the U.S. Department of Justice.

Case Studies of Nine Jurisdictions That Reduced DMC in Their Juvenile Justice Systems
13
4.OVERVIEWOFSELECTEDSITECHARACTERISTICS
HE NINE SELECTED SITES are located across the nation and include four jurisdictions in theNortheast, one in the Midwest, two in the West, one in the South, and one in theSouthwest. Eight of the jurisdictions reduced disproportionate minority contact (DMC) for
African American youth, eight jurisdictions reduced DMC for Hispanic youth, and twojurisdictions reduced DMC for Native American youth. Five jurisdictions reduced DMC at arrestor referral, three jurisdictions reduced DMC at diversion, four jurisdictions reduced DMC atdetention, and two jurisdictions reduced DMC at secure confinement. Similar to nationalstatistics, DMC for African American youth appeared to be greater than DMC for Hispanicyouth. The small numbers of Native American youths make comparisons difficult, but it ispossible.
Nine Sites
Bernalillo County, N.M.Clark County, Nev.Connecticut (statewide)Essex County, N.J.Hillsborough County, N.H.Montgomery County, Ala.Philadelphia, Pa.Tulsa County, Okla.Utah County, Utah
The sites share numerous similarities as well as many differences. The smallest jurisdiction wasMontgomery County, Ala., which has fewer than 235,000 residents, and the largest jurisdictionwas the state of Connecticut, which had more than 3.5 million residents (see Figure 4.1). Thepercent of youth population that was minority also varied considerably among the sites,ranging from 15 percent minority in Hillsborough County, N.H., to 78 percent minority inPhiladelphia, Pa. (see Figure 4.2).
Sites also varied greatly in whether they were gaining or losing population. For example, thepopulation under age 18 increased by 25 percent in Clark County, Nev., and by 39 percent inUtah County, Utah, over the past 10 years,* while it declined slightly in Philadelphia andConnecticut. These changes in population also varied by race. For example, in Connecticut thewhite population under 18 decreased 15 percent over the past 10 years while the Hispanicpopulation increased 31 percent and the Asian American youth population increased 43percent. Bernalillo County, N.M., showed similar trends with a decrease of 14 percent in thewhite youth population over the past 10 years, while the Asian and Hispanic populationsincreased by more than 25 percent. In Clark County, Nev., the white youth population declined4 percent over the past 10 years, while the African American youth population increased 29percent, the Hispanic youth population increased 56 percent, and the Asian youth population
*During 2002–12.
T
This document is a research report submitted to the U.S. Department of Justice. This report has not been published by the Department. Opinions or points of view expressed are those of the author(s)
and do not necessarily reflect the official position or policies of the U.S. Department of Justice.

Case Studies of Nine Jurisdictions That Reduced DMC in Their Juvenile Justice Systems
14
increased 75 percent. In Philadelphia, the white youth population decreased 19 percent and theAfrican American youth population decreased 12 percent, while the Hispanic youth populationincreased 31 percent and the Asian youth population increased 149 percent.
Figure 4.1. Jurisdictions by Total Populationa
a2012 data. Source: Puzzanchera, Sladky, and Kang 2013.
Figure 4.2. Portion of Youth Population (Ages 10–17) That IsAfrican American, Hispanic, Native American, or Asian Americana
a2011 data. Source: Puzzanchera, Sladky, and Kang 2012.
Among the nine sites, the poverty rates for children and youth also vary significantly. Forexample, while fewer than 15 percent of children and youths under age 18 in HillsboroughCounty, N.H., and Utah County, Utah, live in poverty, more than one third of children andyouths under 18 in Montgomery County, Ala., and Philadelphia, Pa., live in poverty. The povertyrates in these jurisdictions were strongly related to the percentage of youths that were
0
500,000
1,000,000
1,500,000
2,000,000
2,500,000
3,000,000
3,500,000
4,000,000
15% 17%
35%42%
64%69% 71% 71%
78%
0%10%20%30%40%50%60%70%80%90%
This document is a research report submitted to the U.S. Department of Justice. This report has not been published by the Department. Opinions or points of view expressed are those of the author(s)
and do not necessarily reflect the official position or policies of the U.S. Department of Justice.

Case Studies of Nine Jurisdictions That Reduced DMC in Their Juvenile Justice Systems
15
minority. The diverse jurisdictions chosen for this report also varied considerably in overall childwell-being indicators. For example, the states of Connecticut, New Hampshire, and New Jerseywere all found to be in the top 10 states for child well-being in 2013, while the states ofAlabama, Nevada, and New Mexico were found to be in the bottom 10 (Annie E. CaseyFoundation 2013b).
Figure 4.3. Percent of Individual Under Age 18 Living In Povertya
aSource: U.S. Census Bureau 2012.
Jurisdictions by Race/Ethnicity
African AmericanBernalillo County, N.M.
Clark County, Nev.Connecticut
Essex County, N.J.Montgomery County, Ala.
Philadelphia, Pa.Tulsa County, Okla.Utah County, Utah
HispanicBernalillo County, N.M.
Clark County, Nev.Connecticut
Essex County, N.J.Hillsborough County, N.H.
Philadelphia, Pa.Tulsa County, Okla.Utah County, Utah
Native AmericanBernalillo County, N.M.
Tulsa County, Okla.
Jurisdictions by Decision Point
Arrest/ReferralBernalillo County, N.M.
ConnecticutEssex County, N.J.*
Hillsborough County, N.H.Utah County, Utah
DiversionBernalillo County, N.M.
Essex County, N.J.Utah County, Utah
DetentionClark County, Nev.
Montgomery County, Ala.Philadelphia, Pa.
Tulsa County, Okla.
ConfinementClark County, Nev.
Montgomery County, Ala.
*RRI for the largest minority group is still high at referral for Essex County, N.J. Also, we have not yet been able toget much information on strategies that have succeeded in reducing DMC at referral.
12% 13% 15%
21%23% 23%
27%
34%39%
0%
5%
10%
15%
20%
25%
30%
35%
40%
45%
This document is a research report submitted to the U.S. Department of Justice. This report has not been published by the Department. Opinions or points of view expressed are those of the author(s)
and do not necessarily reflect the official position or policies of the U.S. Department of Justice.

Case Studies of Nine Jurisdictions That Reduced DMC in Their Juvenile Justice Systems
16
5.COMMONSTRATEGIESACROSSCASESTUDYSITES
URING INTERVIEWS WITH KEY STAKEHOLDERS and juvenile justice system decision-makers,some common themes emerged. Many interviewees pointed to similar strategies thatthey felt were responsible for reducing racial disparities in their systems. Many of these
are also mentioned in other published literature. The most-often mentioned strategies arepresented here.
Examining the Data
“Advocates, public officials, and funders often talk about “data driven” reforms, and nowhere isthis more important than in addressing [disproportionate minority contact (DMC)]. In an areawhere stereotypes are at the center of the problem, advocates must have solid data to supporttheir claims of unfairness and ineffectiveness of existing policies.”
[Building Blocks for Youth Initiative 2005]
All major national efforts toward DMC reduction as well as publications documenting effectivestrategies mention the importance of accurate data collection and utilization (Building Blocksfor Youth 2005; Cabaniss et al. 2007; Hoytt et al. 2005; Nellis 2005). The nine sites highlighted inthis report were no different. Most all of the sites felt that concentrating on the data was a vitalstrategy in identifying and reducing DMC. Sites spent significant time ensuring that the datawere accurate, presenting data to decision-makers and stakeholders, and making sure thatinterventions were based on current data. Most sites used the relative rate index (RRI) tomeasure disparity, and at least one DMC Coordinator commented that the RRI is “critical toguiding the direction of both a state and local strategy” (OJJDP 2013). Being able to rely on dataimproved the ability of sites to address DMC, which is often difficult given the potential forstrong emotions when discussing race and ethnicity. Presenting the data took some of thesubjectivity and emotion out of a difficult topic and helped everyone involved share a similarstarting point.
At times, a lack of trust in existing data stunted progress toward addressing DMC. Addressingthe accuracy of the data directly and getting others involved in ensuring its accuracy wereimportant strategies for some of the sites. For example, in New Hampshire, the state DMCCoordinator had worked previously for the New Hampshire Census Bureau and supervised thecount for the 2010 Census. His background in data collection, specifically as it related to race,helped bring much-needed attention to the importance of accurate data collection and analysisin Hillsborough County, N.H., where decision-makers tended to avoid addressing DMC becausethey did not trust the data. In Tulsa County, Okla., many of the meetings got stuck becausemembers complained that the data being presented were not accurate. To respond to this, thestate DMC Coordinator decided to take the IT representative to the meetings to explain exactlythe way the data were inputted. It took years of education, but eventually the individualsattending these meetings all agreed on the reliability of the data.
D
This document is a research report submitted to the U.S. Department of Justice. This report has not been published by the Department. Opinions or points of view expressed are those of the author(s)
and do not necessarily reflect the official position or policies of the U.S. Department of Justice.

Case Studies of Nine Jurisdictions That Reduced DMC in Their Juvenile Justice Systems
17
Understanding the data also helped in targeting DMC–reduction interventions. According toOJJDP’s DMC Technical Assistance Manual, jurisdictions that wish to reduce DMC should basetheir interventions on data and research that shows where racial disparities exist in theirsystem as well as the potential contributing mechanisms to DMC (Gies, Cohen, and Villarruel2009). Most of the case study sites in this report also point to the importance of basinginterventions on data. For example, since the early 1990s, Connecticut has published threecomprehensive DMC assessment studies, which have informed decision-makers where toallocate DMC–reduction resources. In Utah, a thorough review of data helped decision-makerschoose diversion as their target DMC–reduction point and make positive change. At times, dataawareness alone can help create change. For example, in Montgomery County, Ala., a closelook at the data revealed that, at one point, two thirds of the youths being detained in securedetention facilities were originally referred to court from the public schools for minor disorderlyconduct offenses. Building awareness of this trend in the school system eventually contributedto a reduction in these referrals.
Incorporating appropriate technology for entering and sharing data also appears to be animportant strategy. For example, in Clark County, Nev., when a youth is arrested on theweekend, the booking center can find out in real time about his previous record and whetherthere is a warrant. Other information is entered into the booking system, which indicateswhether the youth should be released to a parent or held until the next court day. This reducesthe number of youths who would be locked up on weekends.
“We have such an amazing data system. I can’t imagine doing my job without the data we haveand what we have access to.”
—Oklahoma DMC Coordinator
Increasing Collaboration
“When you win over your biggest critic, you are on your way.”—State DMC Coordinator
All of the sites mentioned the importance of increasing collaboration with other agencies orwith the community as vital to addressing DMC. This is not a surprise given that the OJJDPTechnical Assistance Manual states that DMC reduction requires strong partnerships (Hsia2009). All of the nine sites had some sort of committee, task force, or group that made DMCreduction a priority. For example, in Philadelphia, Pa., the Philadelphia Working Group focusedon addressing the problem of DMC at the local level and involved the District Attorney’s Office,the Department of Human Services, public defenders, law enforcement, public schools, theJuvenile Court, the mayor’s office, a local university, a behavioral health consultant, faith-basedand community organizations, and youth members. Some of the nine case study sites—including Bernalillo County, N.M., and Montgomery County, Ala.—credited their improvementsin collaboration to nationwide juvenile justice system improvement efforts such as the JuvenileDetention Alternatives Initiative (JDAI).
This document is a research report submitted to the U.S. Department of Justice. This report has not been published by the Department. Opinions or points of view expressed are those of the author(s)
and do not necessarily reflect the official position or policies of the U.S. Department of Justice.
Case Studies of Nine Jurisdictions That Reduced DMC in Their Juvenile Justice Systems
18
In interviews, many of the sites mentioned strategies to engage partners into DMC–reductionefforts. Since most of the leaders of these efforts worked in departments of youth services orprobation departments, strategies to engage these agencies were not often mentioned.However, many sites mentioned strategies to engage police or judges as being important,depending on the juvenile justice stages with which they were concerned.
Engaging PoliceMany of the sites included police officers in their DMC–reduction strategies and on their DMCcommittees. For example, Utah County, Utah, focused on raising awareness of DMC with lawenforcement and presented DMC data to them. New Jersey’s State Advisory Group (SAG)prioritized increasing the use of stationhouse adjustments in police departments to reduceDMC. While most of the sites included law enforcement in their strategies, some of the casestudy sites employed a large portion of their energies on engaging police. For example, ClarkCounty, Nev., engaged law enforcement, the juvenile justice system, and the communitythrough the Safe Village Initiative, which began in response to a sharp increase in violent crimein one West Las Vegas community with a large minority community. Additionally, HillsboroughCounty, N.H.; Tulsa County, Okla.; and the state of Connecticut used the Effective InteractionsWith Youth curriculum with police officers.* This curriculum was developed in Connecticut toreduce DMC at the arrest stages. The curriculum targets patrol officers and their knowledge ofDMC, youth behavior, and effective strategies for interacting with young people, as well as theirgeneral attitudes toward young people. Hillsborough County, N.H., and Tulsa County, Okla.,were both able to adapt the curriculum to their individual needs. In addition to using theEffective Interactions With Youth curriculum, New Hampshire developed and implementeddiversity training at the state police academy for police recruits.
Involving police on DMC committees is also an important approach. Most of the nine case studysites have at least one member of the law enforcement community on their statewide DMCcommittee. Police participate in local DMC committees as well. For example, in HillsboroughCounty, N.H., the police chiefs have taken a lead on their local DMC committees, and one of thepolice chiefs is the chair of the statewide DMC committee. In Philadelphia, there isrepresentation from the Housing Authority Police, the Mass Transit Police, the School DistrictPolice, the Philadelphia Police, and the sheriff. Finally, the DMC–Reduction Steering Committeein Tulsa County, Okla., consists of representatives from several law enforcement agencies.
Engaging JudgesGiven the influence they have, engaging judges is important to DMC–reduction efforts,especially when trying to reduce DMC at diversion, detention, and contact points deeper in thesystem. Each of the case study sites involved judges on its SAG, as part of their DMCcommittees, or in other systems-reform initiatives. Getting the buy-in of judges was not alwayseasy. Because there tends to be a smaller number of judges compared with other juvenilejustice players, one or two judges being against the effort can derail the entire strategy. Toavoid this, jurisdictions had to be creative. For example, for Utah County, the Utah state DMCCoordinator and the state Juvenile Justice Specialist decided to go to small, regional meetings
*Essex County, N.J., also used the Effective Interactions With Youth curriculum—but after the years of dataanalyzed for this report.
This document is a research report submitted to the U.S. Department of Justice. This report has not been published by the Department. Opinions or points of view expressed are those of the author(s)
and do not necessarily reflect the official position or policies of the U.S. Department of Justice.

Case Studies of Nine Jurisdictions That Reduced DMC in Their Juvenile Justice Systems
19
with judges rather than to large, statewide meetings. In this way, they were able to build alliesone at a time and limit the power of the judges who were not as supportive. It also showed thatthe state cared about the courts at a local level.
Engaging the CommunityThough many of the sites concentrated primarily on engaging state and local juvenile justiceagencies, some of the sites mentioned the importance of engaging the community. Forexample, in Clark County, Nev., strategies to engage the community include the Latin Chamberof Commerce working with court-involved youth, juvenile justice leadership visiting a strugglinghousing authority complex weekly, and weekly dinners at the detention center where mentorsin the community come to talk to the youth and share their own experiences.
Changing the Culture
“It can’t just be lip service. It can’t just be a program. It needs to be the philosophy of the policedepartment.”
—New Hampshire Police Chief
Most of the sites talked about an organizational culture change that was necessary forsystemwide improvements. Organizational culture in these organizations normally changedfrom one where staff felt their roles were merely procedural or that their collective purposewas more to punish the youths to a culture geared toward rehabilitation where staff caredmore and concentrated on addressing the youths’ needs so that they could avoid recidivatingand succeed in life. For example, a recent report about Bernalillo County, N.M., noted thatBernalillo’s juvenile court “underwent a noteworthy culture change” and quoted the presidingjuvenile judge at the time as saying: “We used to think that everybody is better off if this kid islocked in detention. But I think we’ve made a philosophical shift that, in general, we nowrecognize that detention is not healthy or rehabilitative for kids, even if it is necessary in somecases [to protect public safety]” (Mendel 2013).
Another example is Essex County, N.J., which mentioned promoting a new “mindset” withregard to the juvenile justice system (a system now primarily seen as a court of rehabilitation).Still another is Utah County, Utah, which talked about the importance of changing howdiversion officers viewed their positions. Interviewees also noted the importance of culturechanges to ensure that staff turnover did not derail the overall effort, saying things such as,“Even when leadership changes, we stay focused on it.”
Affiliation With National Juvenile Justice Reform Initiatives:Models for Change, Burns Institute, CASP, and JDAI
Many of the case study sites participated in juvenile justice reform efforts with the help ofnational organizations. These initiatives include the MacArthur Foundation’s Models for ChangeDMC Action Network, the W. Haywood Burns Institute (BI), OJJDP’s Community and StrategicPlanning (CASP) Initiative, and the Annie E. Casey Foundation’s JDAI.
This document is a research report submitted to the U.S. Department of Justice. This report has not been published by the Department. Opinions or points of view expressed are those of the author(s)
and do not necessarily reflect the official position or policies of the U.S. Department of Justice.

Case Studies of Nine Jurisdictions That Reduced DMC in Their Juvenile Justice Systems
20
The Models for Change DMC Action Network was launched in 2007 by the MacArthurFoundation to bring together teams from select local jurisdictions, expose them to the latestthinking of national experts, and give them an opportunity to learn from one another abouteffective ways to reduce DMC (Models for Change N.d.a). Philadelphia, Pa., became a DMCAction Network member in 2008. As part of the DMC Action Network, Philadelphiaimplemented a Graduated Sanctions Court and expanded its Youth–Law Enforcementcurriculum at the police academy.
The BI is a national organization working to reduce overrepresentation of youth of color in thejuvenile justice system. The BI works at reducing racial disparities in the juvenile justice systemby promoting and ensuring fairness and equity in youth-serving systems across the nation(Burns Institute N.d.). Clark County, Nev., is a BI site. Clark County stakeholders noted that theBI taught them how to analyze and look more deeply at their data and to identify needs interms of policy and programming.
The CASP curriculum is part of OJJDP’s overall DMC initiative. Sites are selected through acompetitive process. Through CASP, OJJDP provides funding to the selected states to developeffective strategies to facilitate state and local initiatives to reduce DMC throughout thejuvenile justice system. The CASP curriculum contains a 12-month implementation timeline toassist with implementing training modules, which include the history of DMC as a corerequirement, OJJDP’s enhanced DMC–Reduction Model, community engagement, and how toconduct a DMC assessment study. Philadelphia, Pa.;* Tulsa County, Okla.; and Utah County,Utah, have all participated in CASP.
Table 5.1. Affiliation With National Juvenile Justice Reform Initiatives
Site JDAI Burns Institute OJJDP CASP
Models forChange DMC
Action NetworkBernalillo County, N.M. X
Clark County, Nev. X XConnecticut (statewide)
Essex County, N.J. XHillsborough County, N.H. XMontgomery County, Ala. X
Philadelphia, Pa. Xa XTulsa County, Okla. XUtah County, Utah X
aPennsylvania was a demonstration site when CASP was implemented in 2010 but is not a current site.
The JDAI is a juvenile justice reform and improvement initiative devoted to reducingoverreliance on detention. One of JDAI’s core strategies is to reduce racial disparities (Annie E.Casey Foundation N.d.a). JDAI has been working in sites across the United States for more than20 years. Today, JDAI is one of the nation’s most widespread juvenile justice system reforminitiatives. Five of the nine case study sites are also JDAI sites. Bernalillo County, N.M.; EssexCounty, N.J.; and Montgomery County, Ala.; all name JDAI as a key strategy in reducing their
*Pennsylvania was a demonstration site when CASP was implemented in 2010 but is not a current site.
This document is a research report submitted to the U.S. Department of Justice. This report has not been published by the Department. Opinions or points of view expressed are those of the author(s)
and do not necessarily reflect the official position or policies of the U.S. Department of Justice.

Case Studies of Nine Jurisdictions That Reduced DMC in Their Juvenile Justice Systems
21
DMC, especially in changing the culture of their juvenile justice systems. Clark County, Nev., hasbeen a JDAI site for almost 10 years, and interviewees felt that JDAI certainly helped to “get theball rolling” on juvenile justice reform. New Hampshire is a statewide JDAI site, and althoughinterviewees felt that JDAI was important in their juvenile justice system they did not feel that ithad much influence on reducing racial disparities at arrest (the focus of their case study).
Increased Access to Community-Based Alternatives to Formal CourtInvolvement, Secure Detention, and Confinement
Most of the sites mentioned the importance of having community-based alternatives availablefor judges, police officers, and other juvenile justice decision-makers when presented with ajuvenile who had allegedly committed a crime or other delinquent act. For example, TulsaCounty, Okla., mentioned the importance of having a crisis intervention center (CIC) wherepolice can bring youths who are arrested or picked up for delinquent and misdemeanoroffenses instead of keeping them in a police lockup or secure detention center. In addition tokeeping youths out of secure environments, the CIC can deliver immediate consequences fordelinquent behavior, detect and address the underlying causes of problem behavior on thefront end as a preventive measure, intervene before problems escalate, and create a moreeffective and efficient alliance among police, parents, and juvenile justice and treatmentproviders (Youth Services of Tulsa N.d.). Similarly, Utah mentioned the importance of havingreceiving centers where youth can go after being arrested. Finally, Philadelphia, Pa.; EssexCounty, N.J.; and Clark County, Nev.; all mentioned the importance of global positioning systemor home-based electronic monitoring as alternatives to secure detention or confinement.Tweaking the monitoring systems to work better for youth was also important. For example, inboth Essex County, N.J., and Philadelphia, Pa., electronic monitoring had some drawbacks,including the prerequisite of having a functioning telephone landline with certain requirements.Both sites made changes to the system to reduce processing time and reduce the number ofyouths in secure detention.
Being Intentional About Addressing RacialDisparities While Using a Nonaccusatory Tone
“My initial approach was not to blame or target or accuse people. It was to have aconversation.”
—New Hampshire Police Chief
Many people in the United States are hesitant to discuss race. It makes many quiteuncomfortable. Police and other juvenile justice decision-makers often have a hard timediscussing race issues openly, may fear “looking racist,” and thus avoid discussions of this topic.Because of this, many of the interviewees stressed the importance of addressing DMC in anopen, nonthreatening way. Some interviewees mentioned starting conversations focused on“fairness” and “systems reforms” in general rather than jumping right into race.
At the same time, race needs to be addressed explicitly. In most of the sites we interviewed,decision-makers agreed that racial disparities will not disappear with overall systems reform.
This document is a research report submitted to the U.S. Department of Justice. This report has not been published by the Department. Opinions or points of view expressed are those of the author(s)
and do not necessarily reflect the official position or policies of the U.S. Department of Justice.

Case Studies of Nine Jurisdictions That Reduced DMC in Their Juvenile Justice Systems
22
For example, the DMC Coordinator from Connecticut said, “Nationally, we have done a lot ofsystems improvement; sometimes that benefits the white kids more and might increase theDMC intentionally.” Additionally, a recent report by the Annie E. Casey Foundation presentingJDAI’s annual results found that, while most JDAI sites reduced their average daily detentionpopulation for both white and minority youth, for most sites the reductions for white youthwere greater than the reductions for minority youth; thus, as a result, there was more DMC(Annie E. Casey Foundation 2013a). Given these realities, most interviewees agreed that thereneeds to be an intentional focus on reducing disparities. The Juvenile Justice Specialist fromOklahoma stated: “We go right into bias. It’s really amazing once you’re done with thatconversation; it’s like a weight off their shoulders.” Most of the other interviewees agreed thatthis “weight” needs to be addressed and explicit strategies to reduce DMC must be developed.
DMC Leadership: Statewide Driven or Locally Driven?
OJJDP’s DMC Technical Assistance Manual, published in 2009, lists eight lessons learned in theDMC field. Two of these are “DMC reduction needs to occur at the local level” and “DMCreduction requires support from the top.” Both of these were mentioned by interviewees, whoidentified the importance of leadership at both levels. Interviewees also pointed out theimportance of having a DMC Coordinator as a source of leadership, continuity, andcoordination.
According to OJJDP’s Disproportionate Minority Contact Technical Assistance Manual,
Although the state and/or OJJDP often support [the identification] phase through financial andtechnical assistance, the jurisdiction carries out the majority of the activities in targeted localcommunities because the factors or combinations of factors that emerge as important are mostlikely to be jurisdiction specific or community specific. [2009, 4–1]
The efforts of Clark County, Nev., appear to be driven primarily at the county level. Its systems-reform initiatives and its work to reduce DMC are driven primarily at the county level.Hillsborough County, N.H., noted the importance of having separate DMC committees andevents for the different cities given unique local issues and realities. The efforts of BernalilloCounty, N.M., at reducing the overreliance on secure detention and reducing DMC were alsoinitiated at the county level.
Alternatively, Connecticut and Utah both pointed to the benefits of having leadership at thestate level. Both states have statewide juvenile courts and statewide data collection systems. Inmany of the identified sites, addressing DMC was a priority first of the state and then in theidentified county. For example, both in Utah County, Utah, and in Tulsa County, Okla., theDMC–reduction work was initiated at the state level with direction from the state JuvenileJustice Specialists and the state DMC Coordinators. Additionally, Bernalillo County, N.M.,pointed to the benefits of having a statewide risk assessments instrument that wasimplemented more quickly than if the state had to develop them individually for each county.And New Hampshire noted the importance of incorporating diversity training for all newrecruits at the state-run police academy rather than developing training for each county.
This document is a research report submitted to the U.S. Department of Justice. This report has not been published by the Department. Opinions or points of view expressed are those of the author(s)
and do not necessarily reflect the official position or policies of the U.S. Department of Justice.

Case Studies of Nine Jurisdictions That Reduced DMC in Their Juvenile Justice Systems
23
Many of the selected sites pointed to the importance of having a DMC Coordinator withexperience in the field, the ability to bring people together to discuss DMC, and the power tomake change. Because DMC Coordinators attend national conferences about DMC andparticipate in regular conference calls with OJJDP staff and other DMC Coordinators, they are ina unique position to understand what is going on nationally with DMC, including funding andtraining opportunities, as well as what is working in other sites. Sometimes the DMCCoordinator is a unique fulltime or parttime position; at other times, the Juvenile JusticeSpecialist also acts as the DMC Coordinator.
In Bernalillo County, N.M., interviewees spoke about making the state DMC Coordinatorposition “important.” In Utah County, Utah, one interviewee remarked: “We wouldn’t bepaying attention to [DMC] at all if it weren’t for [the state DMC Coordinator]. He is veryproactive in reaching out and keeping things going at a county and district level.” Tulsa County,Okla., is an example of a jurisdiction that had a local DMC Coordinator who coordinated localDMC–reduction efforts exclusively in the county.
During the interviews for this report, experience in the DMC Coordinator role was mentionedvarious times as an important asset in many of the sites. For example, in Oklahoma, the stateDMC Coordinator had 11 years of experience in her position; in Connecticut, the DMCCoordinator has been in that position for more than 20 years. Experience in similar positionswas also noted as important to the DMC Coordinator role. In Hillsborough County, N.H., forexample, the state DMC Coordinator was relatively new but had experience and a backgroundin both data collection and diversity training. This background was an advantage in addressingDMC in the state.
“To give it the life and attention DMC deserves, we got a DMC Coordinator. He has made greatheadway, and we have advanced on our goals.”
—Sheriff from New Hampshire
Working Long Term
Finally, DMC reduction takes a long-term commitment. Many of the individuals interviewed forthis report had years and even decades of experience working on DMC reduction and juvenilejustice reform. Of the eight lessons learned and identified in OJJDP’s DMC Technical AssistanceManual, one was that DMC reduction requires sustained efforts.
“People think we can change attitudes and beliefs with a conversation. It takes more than that.You need to get over a lot of hurdles. It takes time. At the end of the day, it’s about leadership.You may be long gone before the attitudes shift.
—New Hampshire Police Chief
This document is a research report submitted to the U.S. Department of Justice. This report has not been published by the Department. Opinions or points of view expressed are those of the author(s)
and do not necessarily reflect the official position or policies of the U.S. Department of Justice.

Case Studies of Nine Jurisdictions That Reduced DMC in Their Juvenile Justice Systems
24
6.CASESTUDIES
Bernalillo, N.M.Disproportionate Minority Contact–Reduction Case Study
The ProblemN THE LATE 1990S, Bernalillo County, N.M., began concentrating on detention reform and DMCreduction in partnership with state partners and the Annie E. Casey Foundation’s JuvenileDetention Alternative Initiative (JDAI). Much progress was made, and Bernalillo County was
subsequently named a model JDAI site. The county was also highlighted on OJJDP’s DMC–Reduction Best Practices Database. Nevertheless, there were still racial disparities at certainpoints in Bernalillo County’s juvenile justice system. In 2004 the relative rate index (RRI) forHispanic youths being referred to probation from law enforcement was 1.9, the RRI for Hispanicyouths being referred to the Children’s Court Attorney (CCA) was 1.3,* and the RRI for Hispanicyouths being diverted from the system was only 0.61. Racial disparities existed at these pointsfor African American and Native American youths as well.
Juvenile Justice Strategies“Bernalillo is making headway. There can be multiple reasons for this because there are multiplestrategies being used.”
—DMC Coordinator, New Mexico
Since the late 1990s, Bernalillo County, N.M., hasbeen focused on making systems reforms to reduceoverreliance on secure detention and reduce DMC.Partners in this effort have included local agenciessuch as the Bernalillo County Youth Services Center;the Children’s Court Division of the Second JudicialDistrict Court; the Children, Youth and FamiliesJuvenile Probation Office; the District Attorney’sOffice; and the Public Defender Office. BernalilloCounty also worked closely with the Annie E. CaseyFoundation’s JDAI as well as with the New MexicoJuvenile Justice Specialist and DMC Coordinator. Inthe past few years, many of the successfulstrategies have continued and some new ones, including the creation of a Prevention Unit afterreferral to court, have emerged.
A History of Success. Bernalillo County is a JDAI model site (Annie E. Casey Foundation N.d.b),and its work has already been highlighted in the DMC–Reduction Best Practices Database.
*The referral rate for Bernalillo County was based on arrest.†2002 and 2012 data.‡2011 data.
I
Bernalillo County, N.M., is home to some 670,000residents, including 158,995 youths under age 18.Bernalillo is the largest county in New Mexico andhome to the largest city in the state, Albuquerque,where most Bernalillo County residents live. In thepast 10 years, the youth population grew 11percent. By 2012, the youths between the ages of10 and 17 are 29 percent white, 3 percent AfricanAmerican, 5 percent Native American, 2 percentAsian American, and 61 percent Hispanic(Puzzanchera, Sladky, and Kang 2013).† About 27percent of the children under 18 living in BernalilloCounty live in poverty (U.S. Census Bureau2012).‡
This document is a research report submitted to the U.S. Department of Justice. This report has not been published by the Department. Opinions or points of view expressed are those of the author(s)
and do not necessarily reflect the official position or policies of the U.S. Department of Justice.

Case Studies of Nine Jurisdictions That Reduced DMC in Their Juvenile Justice Systems
25
Bernalillo has been recognized as a successful jurisdiction because of its decreasing reliance onsecure detention and its DMC reduction, which resulted from numerous systemwide reforms.The county methodically reorganized its resources, budget, and staff to concentrate oncommunity-based treatment and innovative policies. The Bernalillo County Juvenile DetentionCenter then reassigned staff to frontend services and closed secure units, saving the countyhundreds of thousands of dollars. After closing its maximum-security facility in 2003, the countydirected some of the cost savings into acquiring portable buildings outside the detentioncenter’s razor-wire fence to house an alternative public school, a community-custody program,a day treatment program, and a mental health clinic (Annie E. Casey Foundation N.d.b). Theresults have been considerable:
By improving system operations and offering a greater array of programmatic choices, BernalilloCounty has made great strides in reducing the number of youth overall—including minorityyouth—who come into contact with the juvenile justice system. Much of this success has comefrom decreasing the reliance on locked detention. The population of the Juvenile DetentionCenter has declined from an average daily population of 113 in 1999 to 47 in 2004. Over a 6-year period (from 1999 to 2005), the number of youth booked declined from 4,726 to 3,892, andthe number of youth booked and held in confinement dropped from 2,494 to 1,549. Feweryouth are going to detention and those who are placed in detention stay fewer days. Theaverage length of stay fell from 15 days to 13 days. [Gies, Cohen, and Villarruel 2009]
During this time, racial disparities in detention also decreased. The proportion of detainedyouths who were minority decreased from 72 percent in 1999 to 62 percent in 2005, even asthe general proportion of minority youths in the general youth population was increasing.
Since then, state, county, and community partners have continued to work on systems reformsin Bernalillo County to reduce contact with the juvenile justice system for all youth and toreduce racial disparities. Among other things, they sustained their status as a JDAI site,established a community mental health clinic to serve court-involved youth, created aprevention unit for youths with second or third referrals to court, continued to make datacollection a priority both statewide and in the county, created additional alternatives todetention and maintained existing ones, strengthened the positive juvenile justice culturechange galvanized by their JDAI involvement, and continued to receive support from the StateAdvisory Group (SAG).
Created a Culture Where System Reform Was a Priority. With the implementation of JDAI,there was a clear culture change in Bernalillo County’s juvenile justice system. According toTommy Jewell, Bernalillo County’s then-presiding juvenile judge: “We used to think thateverybody is better off if this kid is locked in detention. But I think we’ve made a philosophicalshift that, in general, we now recognize that detention is not healthy or rehabilitative for kids,even if it’s necessary in some cases [to protect public safety]” (Mendel 2013). This culture isalso evident in major system changes such as the closing of the county’s maximum-securityfacility in 2003 and the opening of the community mental health center in 2002, which hasbeen called “a project that is like no other in the entire nation” (Bernalillo County, N.M., N.d.a).According to the Juvenile Justice Specialist at the time, Richard Lindahl, the continuity ofleadership in Bernalillo County has been good for several years, and although people may
This document is a research report submitted to the U.S. Department of Justice. This report has not been published by the Department. Opinions or points of view expressed are those of the author(s)
and do not necessarily reflect the official position or policies of the U.S. Department of Justice.

Case Studies of Nine Jurisdictions That Reduced DMC in Their Juvenile Justice Systems
26
change positions there have been smooth transitions. For example, some of the juvenile courtjudges who were involved when JDAI was beginning to move to different courts, but theirsuccessors have been just as involved in JDAI and DMC reduction. Mr. Lindahl noted that“although there have been changes, there has been total continuity in efforts among thejudges, probation, and detention.” When individuals leave their positions, they train theirsuccessors. This is not always the case in other jurisdictions.
Made Data Collection and Analysis a Priority Statewide. One of JDAI’s eight core strategies isto use accurate data to diagnose system problems and assess the impact of reforms. At thestate level, New Mexico has concentrated on establishing an accurate data collection system toidentify areas to fix and implement changes. For example, New Mexico developed a riskassessment instrument to determine detention eligibility in 2003, which continues to be usedstatewide. Additionally, in 2008, New Mexico was the first state to develop an Internet-based,real-time information system called SARA (Screening, Admissions, and Release Application),which is a secure Web site that is available to all juvenile justice offices, detention center, andcourts. SARA consistently screens children eligible for detention while also accurately trackingadmissions into and releases out of detention and movements from one detention center toanother. The system is designed to reduce the risk to public safety through unified tracking ofclient history and outcomes regarding detention and nonsecure alternatives. In 2010, theJuvenile Justice Advisory Committee (JJAC) funded the development of an enhancement to theSARA system that interfaced the juvenile self-reported and often inaccurate demographicrace/ethnicity data with juvenile probation data from FACTS* to ensure that New Mexico hasthe highest quality race and ethnicity data for the purpose of assessing disproportionatetreatment of minorities in the juvenile justice system (New Mexico Juvenile Justice AdvisoryCommittee 2013).
Made Data Collection and Analysis a Priority in Bernalillo County. Bernalillo County has alsodedicated significant resources to developing a strong capacity for data collection and analysis.In 2006 the JJAC helped Bernalillo County fund a position to analyze its juvenile detention data.A couple of years later, the county picked up the position and added an additional parttimeposition as well. Bernalillo County has a separate data system and is supported in part underJDAI. The county also has extensive DMC and RRI data. The former Juvenile Justice Specialistrecently said: “They have developed the ability to have good data analysis. They collect it welland analyze it. That is amazing.”
Established a Community Mental Health Clinic to Serve Detained Youth. In 1999, BernalilloCounty Detention Director Thomas E. Swisstack directed his staff to study the mental healthstatus of the youths held in secure detention. The study uncovered striking mental healthneeds. It also revealed that youths with a mental health diagnosis were more likely to return todetention than other youths and that most of the youths being served in detention were eitheron Medicaid or eligible for Medicaid. In response, Mr. Swisstack expanded the scope andquality of mental health treatment services for youths inside the secure detention facility,which improved the county’s ability to stabilize mental health conditions and improve behavior.Unfortunately, these improvements were often temporary, and once many of the youths left
*FACTS, for Family Automated Client Tracking System, is a statewide data management system in New Mexico.
This document is a research report submitted to the U.S. Department of Justice. This report has not been published by the Department. Opinions or points of view expressed are those of the author(s)
and do not necessarily reflect the official position or policies of the U.S. Department of Justice.

Case Studies of Nine Jurisdictions That Reduced DMC in Their Juvenile Justice Systems
27
the detention center the problems resurfaced; many of the youths subsequently returned todetention. To address the mental health needs of youth after leaving detention, BernalilloCounty took “extraordinary steps” and established a licensed freestanding community mentalhealth clinic adjacent to its detention facility in 2002. The clinic is required to serve children ofall ages, referred from anywhere in the county, but the vast majority of clients have been courtinvolved, and most of them were referred through the probation department. During 2003–11,between 462 and 601 youths participated each year. According to a 2013 report published bythe Annie E. Casey Foundation, the clinic has proven a useful component in Bernalillo County’snotable successes in reducing detention population and promoting success for court-involvedyouth (Mendel 2013).
Used a Prevention Unit to Divert Youths From Formal Court Involvement. Youths who arereferred from law enforcement on a first, second, or third misdemeanor charge are eligible togo to the Prevention Unit. The Prevention Unit’s focus is on diverting youths from the formaljuvenile justice system and preventing their return to court. There are various diversionprograms available, which are organized using a graduated sanctions framework and haveshifted over the years given the changing needs of youths. For example, youths who arereferred from law enforcement on a first misdemeanor charge can participate in the Girls Circleor Boys Circle. The circle programs are immediate sanctions that use restorative justiceprinciples, which are recommended by OJJDP’s Model Programs Guide. On the second offense,youths can participate in the Alternatives to Violence program or the Scouts program,depending on the charge. By the third charge, youths meet with probation officers to developindividualized plans.* Bernalillo County diverts about 50 percent of the youths referred toprobation by law enforcement through the Prevention Unit.
Created Alternatives to Detention. Alternatives to secure detention were created, enhanced,and sustained to initiate and maintain the decrease in secure detention use. In 1998, BernalilloCounty was already operating a home detention and electronic monitoring program, but it wasused infrequently. On any given day, just four or five youths were enrolled in the alternative,and no staff had been solely dedicated to the alternative programs. Today, alternatives todetention are used much more frequently. Staff members have been reassigned to work onthese alternative programs, and during just one quarter, in 2011, 90 youths were served by theCommunity Custody Program (CCP) and 130 youths were served by the Youth Reporting Center(YRC). The CCP employs a flexible system of six levels of supervision that are graduated andrange from minimal supervision to intensive supervision (intensive supervision includeselectronic enhancements and increased face-to-face contacts with random field checks atschool, work, or home). The CCP uses a treatment/rehabilitation philosophy and providesindividual assessments to determine the services each child should receive. This alternative todetention offers counseling, recreation, group therapy, and community service. The programprovides outreach by sending officers into the community to facilitate services and providesupervision (Bernalillo County, N.M., N.d.b). Some of the youths in CCP also participate in theYRC program. The YRC is dedicated to offering continuing services and programming with awide variety of structured programs that are geared toward skill-based instruction thatpromote, encourage, and reinforce proactive and acceptable social behaviors (Bernalillo
*The fourth referral is an automatic referral to the district attorney.
This document is a research report submitted to the U.S. Department of Justice. This report has not been published by the Department. Opinions or points of view expressed are those of the author(s)
and do not necessarily reflect the official position or policies of the U.S. Department of Justice.

Case Studies of Nine Jurisdictions That Reduced DMC in Their Juvenile Justice Systems
28
County, N.M., N.d.c). These alternatives cost significantly less than secure detention. In fiscalyear 2010, these alternatives cost $30 per day, compared with $280 per day for detention(Swisstack 2010).
Received Support at the State Level. The SAG in New Mexico (the JJAC, or Juvenile JusticeAdvisory Committee) is very active and focused on prevention, diversion, and intervention. TheJJAC has awarded about $200,000 in federal Formula Grants a year to Bernalillo County formany years to help with its systems-reform work. State funds have also supported the globalpositioning satellite (GPS) monitoring program used as an alternative to detention. In 2007 and2008, New Mexico issued 170 GPS monitors to all 23 jurisdictions in the state as an alternativeto detention. Policy and procedures were put into place to ensure that only those eligiblewould be placed on GPS monitors. Finally, support at the state level has also come from theDMC Coordinator and the former Juvenile Justice Specialist, who both had years of experienceworking on DMC and system reform. Their expertise has been recognized nationally and hasbeen an asset to Bernalillo County. For example, in 2008, New Mexico’s Juvenile JusticeSpecialist, Richard Lindahl, won the Tony Gobar Outstanding Juvenile Justice Specialist Award,which recognizes one state Juvenile Justice Specialist who has exemplified excellence in serviceto others, has been dedicated and committed to improving the juvenile justice system, and hasdemonstrated compassion and concern for juveniles and advocates. At the award ceremony,the presenter said, “In his own quiet and steady manner, he has contributed substantial andlong-lasting improvements to our juvenile justice system” (Annie E. Casey Foundation 2008).
Data ImprovementsDuring 2004–10, the minority youth population in Bernalillo County grew, while the whiteyouth population shrunk. During this time, the white youth population decreased by 20percent, the African American youth population increased by 29 percent, the Hispanic youthpopulation increased 7 percent, and the Native American youth population increased 6 percent.Even with these demographic changes, racial disparities decreased. Bernalillo County was ableto reduce racial disparities for African American youths, Hispanic youths, and Native Americanyouths who were referred by law enforcement to probation; for African American youths andHispanic youths who were referred from probation to the CCA; and for African Americanyouths, Hispanic youths, and Native American youths who were diverted from the juvenilejustice system.
Law Enforcement Referrals to Probation. During 2004–10, there was a decrease in the overallnumber of law enforcement referrals to probation, a decrease in law enforcement referral-to-probation rates, and a decrease in racial disparities at the law enforcement referral-to-probation stage. In 2010, there were 36 percent fewer total law enforcement referrals than in2004 (see Table 6.1). Referral rates decreased for white, African American, and Hispanic youth.For white youths, the referral rate decreased from 9 referrals per 100 youths to 7 referrals per100 youths; the African American referral rate decreased from 16 to 7; the Hispanic referralrate declined from 16 to 10; and the Native American referral rate decreased from 11 to 6 (seeFigures 6.1, 6.2, and 6.3). The RRI improved from 1.9 to 1.1 for African American youths,improved from 1.9 to 1.5 for Hispanic youths, and improved from 1.3 to 0.9 for NativeAmerican youths.
This document is a research report submitted to the U.S. Department of Justice. This report has not been published by the Department. Opinions or points of view expressed are those of the author(s)
and do not necessarily reflect the official position or policies of the U.S. Department of Justice.

Case Studies of Nine Jurisdictions That Reduced DMC in Their Juvenile Justice Systems
29
Figure 6.1. Law Enforcement Referrals to Probation Rates and RRI: African Americana
a“Law enforcement referrals to probation” are similar to “arrests” in other jurisdictions.
Figure 6.2. Law Enforcement Referrals to Probation Rates and RRI: Hispanica
a“Law enforcement referrals to probation” are similar to “arrests” in other jurisdictions.
Figure 6.3. Law Enforcement Referrals to Probation Rates and RRI: Native Americana
a“Law enforcement referrals to probation” are similar to “arrests” in other jurisdictions.
2004 2005 2006 2007 2008 2009 2010Rate - White 8.8 8.0 7.3 7.3 6.6 7.1 6.6Rate- African American 16.4 14.2 13.5 11.6 10.4 7.7 7.1RRI Arrest 1.9 1.8 1.8 1.6 1.6 1.1 1.1
0.00.20.40.60.81.01.21.41.61.82.0
0.02.04.06.08.0
10.012.014.016.018.0
Rel
ativ
e R
ate
Inde
x (R
RI)
Ref
erra
l Rat
es (p
er 1
00 y
outh
)
2004 2005 2006 2007 2008 2009 2010Rate - White 8.8 8.0 7.3 7.3 6.6 7.1 6.6Rate- Hispanic 16.3 13.4 13.0 13.0 12.2 11.8 10.1RRI Arrest 1.9 1.7 1.8 1.8 1.9 1.7 1.5
0.00.20.40.60.81.01.21.41.61.82.0
0.02.04.06.08.0
10.012.014.016.018.0
Rel
ativ
e R
ate
Inde
x (R
RI)
Arre
st R
ates
(per
100
you
th)
2004 2005 2006 2007 2008 2009 2010Rate - White 8.8 8.0 7.3 7.3 6.6 7.1 6.6Rate- Native American 11.4 10.7 10.4 9.0 8.4 8.3 6.3RRI Arrest 1.3 1.3 1.4 1.2 1.3 1.2 0.9
0.0
0.2
0.4
0.6
0.8
1.0
1.2
1.4
1.6
0.0
2.0
4.0
6.0
8.0
10.0
12.0R
elat
ive
Rat
e In
dex (
RR
I)
Ref
erra
l Rat
e (p
er 1
00 y
outh
)
This document is a research report submitted to the U.S. Department of Justice. This report has not been published by the Department. Opinions or points of view expressed are those of the author(s)
and do not necessarily reflect the official position or policies of the U.S. Department of Justice.

Case Studies of Nine Jurisdictions That Reduced DMC in Their Juvenile Justice Systems
30
Table 6.1. Bernalillo County Law Enforcement Referrals to Probation Numbers, 2004–10
Year
Total LawEnforcementReferrals toProbation
White LawEnforcementReferrals toProbation
AfricanAmerican LawEnforcementReferrals toProbation
Hispanic LawEnforcementReferrals toProbation
AsianAmerican LawEnforcementReferrals toProbation
NativeAmerican LawEnforcementReferrals toProbation
2004 8,670 2,173 366 5,475 57 3372005 7,467 1,931 325 4,598 48 3292006 7,199 1,742 316 4,543 29 3252007 7,205 1,704 278 4,661 31 2882008 6,662 1,548 248 4,379 21 2702009 6,570 1,490 228 4,314 35 2672010 5,585 1,313 204 3,639 33 196
Referral to the Children’s Court Attorney. After a youth is referred to probation by lawenforcement, a decision must be made about whether to refer the youth to the Children’sCourt Attorney. Referrals to the CCA for all youths decreased from 4,315 in 2004 to 2,607 in2010, a decrease of 40 percent (see Table 6.2). African American referral rates decreased from66 referrals per 100 arrests to 46 referrals per 100 arrests, and Hispanic referrals decreasedfrom 52 to 48 referrals per 100 arrests (see Figures 6.4 and 6.5). During this time, white referralrates stayed between 39 and 47 referrals per 100 arrests.
Figure 6.4. Referral-to-CCA Rates and RRI: African Americana
aRate per 100 law enforcement referrals to probation. “Referrals” refer to Preliminary Inquiry Decisions (refer to CCA).
2004 2005 2006 2007 2008 2009 2010Rate - White 39.7 46.5 40.5 38.9 38.8 43.2 43.2Rate- Black 66.4 64.6 62.7 68.3 64.1 56.1 46.1RRI Referral 1.7 1.4 1.5 1.8 1.7 1.3 1.1
0.00.20.40.60.81.01.21.41.61.82.0
0.0
10.0
20.0
30.0
40.0
50.0
60.0
70.0
80.0
Rel
ativ
e R
ate
Inde
x (R
RI)
Ref
erra
l Rat
es*
This document is a research report submitted to the U.S. Department of Justice. This report has not been published by the Department. Opinions or points of view expressed are those of the author(s)
and do not necessarily reflect the official position or policies of the U.S. Department of Justice.

Case Studies of Nine Jurisdictions That Reduced DMC in Their Juvenile Justice Systems
31
Figure 6.5. Referral-to-CCA Rates and RRI: Hispanica
aRate per 100 law enforcement referrals to probation. “Referrals” refer to Preliminary Inquiry Decisions (refer to CCA).
Table 6.2. Bernalillo County Referral to Children’s Court Attorney Numbers, 2004–10
YearTotal
ReferralsWhite
Referrals
AfricanAmericanReferrals
HispanicReferrals
AsianAmericanReferrals
NativeAmericanReferrals
2004 4,315 862 243 2,873 29 1572005 4,023 898 210 2,554 27 1812006 3,586 706 198 2,367 15 1832007 3,413 663 190 2,275 8 1612008 3,058 600 159 2,080 10 1182009 3,004 643 128 1,993 20 1122010 2,607 567 94 1,737 7 100
Diversion. Diversion rates have also improved for Hispanic, African American, and NativeAmerican youth, which has resulted in a decrease in the RRI. The Hispanic RRI value at diversionhas steadily increased from 0.80 in 2004 to 0.95 in 2010 (see Figure 6.7). Though thepopulations are much smaller, the diversion RRI values have also improved for AfricanAmerican youth and Native American youth (from 0.65 to 0.98 and from 0.84 to 0.96,respectively).
2004 2005 2006 2007 2008 2009 2010Rate - White 39.7 46.5 40.5 38.9 38.8 43.2 43.2Rate- Hispanic 52.5 55.5 52.1 48.8 47.5 46.2 47.7RRI Referral 1.3 1.2 1.3 1.3 1.2 1.1 1.1
0.0
0.2
0.4
0.6
0.8
1.0
1.2
1.4
0.0
10.0
20.0
30.0
40.0
50.0
60.0
Rel
ativ
e R
ate
Inde
x (R
RI)
Ref
erra
l Rat
es*
This document is a research report submitted to the U.S. Department of Justice. This report has not been published by the Department. Opinions or points of view expressed are those of the author(s)
and do not necessarily reflect the official position or policies of the U.S. Department of Justice.
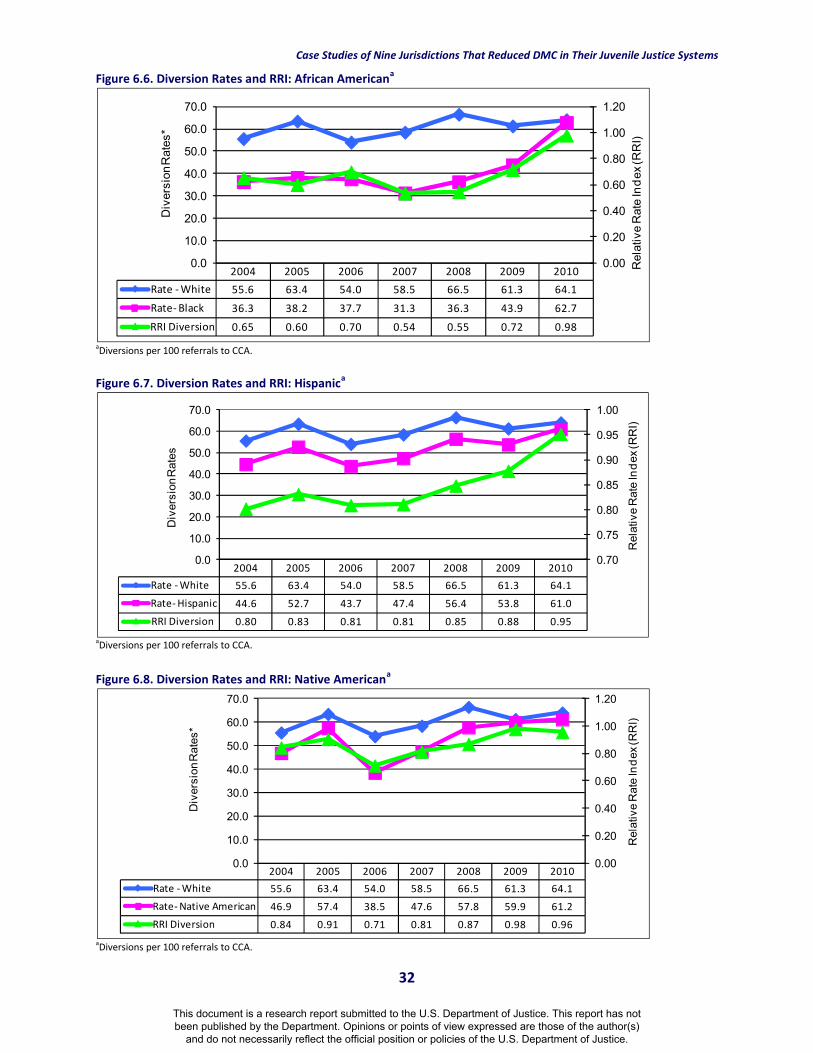
Case Studies of Nine Jurisdictions That Reduced DMC in Their Juvenile Justice Systems
32
Figure 6.6. Diversion Rates and RRI: African Americana
aDiversions per 100 referrals to CCA.
Figure 6.7. Diversion Rates and RRI: Hispanica
aDiversions per 100 referrals to CCA.
Figure 6.8. Diversion Rates and RRI: Native Americana
aDiversions per 100 referrals to CCA.
2004 2005 2006 2007 2008 2009 2010Rate - White 55.6 63.4 54.0 58.5 66.5 61.3 64.1Rate- Black 36.3 38.2 37.7 31.3 36.3 43.9 62.7RRI Diversion 0.65 0.60 0.70 0.54 0.55 0.72 0.98
0.00
0.20
0.40
0.60
0.80
1.00
1.20
0.0
10.0
20.0
30.0
40.0
50.0
60.0
70.0
Rel
ativ
e R
ate
Inde
x (R
RI)
Div
ersi
on R
ates
*
2004 2005 2006 2007 2008 2009 2010Rate - White 55.6 63.4 54.0 58.5 66.5 61.3 64.1Rate- Hispanic 44.6 52.7 43.7 47.4 56.4 53.8 61.0RRI Diversion 0.80 0.83 0.81 0.81 0.85 0.88 0.95
0.70
0.75
0.80
0.85
0.90
0.95
1.00
0.0
10.0
20.0
30.0
40.0
50.0
60.0
70.0
Rel
ativ
e R
ate
Inde
x (R
RI)
Div
ersi
on R
ates
2004 2005 2006 2007 2008 2009 2010Rate - White 55.6 63.4 54.0 58.5 66.5 61.3 64.1Rate- Native American 46.9 57.4 38.5 47.6 57.8 59.9 61.2RRI Diversion 0.84 0.91 0.71 0.81 0.87 0.98 0.96
0.00
0.20
0.40
0.60
0.80
1.00
1.20
0.0
10.0
20.0
30.0
40.0
50.0
60.0
70.0
Rel
ativ
e R
ate
Inde
x (R
RI)
Div
ersi
on R
ates
*
This document is a research report submitted to the U.S. Department of Justice. This report has not been published by the Department. Opinions or points of view expressed are those of the author(s)
and do not necessarily reflect the official position or policies of the U.S. Department of Justice.

Case Studies of Nine Jurisdictions That Reduced DMC in Their Juvenile Justice Systems
33
Table 6.3. Bernalillo County Diversion Numbers, 2004–10
YearTotal
DiversionsWhite
Diversions
AfricanAmericanDiversions
HispanicDiversions
AsianAmericanDiversions
NativeAmericanDiversions
2004 4,064 1,208 133 2,441 21 1582005 4,078 1,225 124 2,424 30 1892006 3,254 941 119 1,985 10 1252007 3,547 996 87 2,209 21 1372008 3,855 1,029 90 2,469 16 1562009 3,609 913 100 2,320 14 1602010 3,441 841 128 2,218 24 120
ConclusionBernalillo County, N.M., was able to decrease racial disparities among law enforcementreferrals to probation, referrals to the CCA, and diversions from the juvenile justice system forAfrican American, Hispanic, and Native American youth over an extended number of years. ThisDMC reduction was most likely a result of multiple strategies designed primarily aroundsystems reform, attention to data, and increasing community-based services for court-involvedyouth. Bernalillo County became a JDAI site in the 1990s and has dedicated many years utilizingthe JDAI framework to improve its system. Much of their effort has been aimed at reducing thenumber of youths in secure detention and serving detained youths after they return to thecommunity. Research has shown that placement in secure detention can increase reoffendingand that alternatives to detention can curb crime and recidivism better than secure detention(Holman and Ziedenberg 2006). As a result, it makes sense that the declines in the total numberof youths being detained and the decreases in racial disparities at secure detention couldpositively affect the future juvenile referrals to probation and to the CCA. Increased access tomental health and diversion services for minority youth can also contribute to reductions inracial disparities at the front end of the juvenile justice system, for untreated mental healthdisorders are often the underlying reasons for some youths’ delinquency (Center for Childrenand Youth Justice). State juvenile probation partners in Bernalillo County also concentrateddirectly on increasing access to diversion by establishing the Prevention Unit. BernalilloCounty’s efforts have received national attention, and county officials continue to work onimproving their system. Their ability to involve multiple partners over long periods of time,even when individuals move to new positions, is notable and an important factor in theirsuccess—as is the expertise and the commitment of many of these partners.
This document is a research report submitted to the U.S. Department of Justice. This report has not been published by the Department. Opinions or points of view expressed are those of the author(s)
and do not necessarily reflect the official position or policies of the U.S. Department of Justice.

Case Studies of Nine Jurisdictions That Reduced DMC in Their Juvenile Justice Systems
34
Clark County, Nev.Disproportionate Minority Contact–Reduction Case Study
The ProblemIn 2007, there were significant racial disparities for African American youth in Clark County,Nev., both in detention and in the state secure confinement facility. The relative rate index(RRI) for African American youth at secure confinement was 2.4. The RRI at secure detentionwas 1.7.
Juvenile Justice StrategiesIn Clark County, numerous juvenile justice strategies were implemented after 2007. Most ofthese were designed to improve the system overall, while others were focused specifically onreducing racial disparities. Given the large size of Clark County, numerous activities, events,strategies, collaborations, and committees occurred simultaneously. Some of the key ones arepresented here.
Changing the Culture—Developing a Staff Focused on theWell-Being of the Youth and Reducing Recidivism“Our first commitment is to keep the kids from recidivating. Law enforcement [is] secondary.”
—Director of Clark County Juvenile Justice Services
In 2004, Clark County became a Juvenile Detention Alternative Initiative (JDAI) site. JDAI was animportant tool in getting collaborative juvenilejustice reform work started in Clark County, andjuvenile justice leadership took the lead in makingpositive changes in the system. According to theJDAI Web site, there were reductions in the averagedaily detention population after the JDAI frameworkwas used, primarily because of daily monitoring ofthe population, better training of supervisors,closing of the largest detention unit, and a hands-onJDAI coordinator.
JDAI was the first step in changing the culture of theClark County Department of Juvenile Services (DJJS).Today, at all levels of the DJJS, the culture reflectsthat of a youth-serving agency, which concentrateson what a youth needs to improve his or her lifeoutcomes (and less of a law enforcement culture).This culture is clear at the top management level.DJJS Director John Martin refers to his organization as “law enforcement that does socialservices” and recently said, “If you can’t get passionate about these kids, who can you getpassionate about?” Mr. Martin has direct experience rebuilding troubled systems. Significantly,
*2012 data.†2011 data.
Clark County, Nev., is the nation’s 12th-largestcounty and receives over 40 million visitors peryear. More than two thirds of all Nevada residentslive in Clark County, and the largest city is LasVegas. During 1990–2010, the total population inClark County more than doubled (Puzzanchera,Sladky, and Kang 2013).* Today, Clark County ishome to some 2 million residents, including487,250 children and youths under age 18. TheClark County School District is the fifth-largestschool system in the nation (Clark County, Nev.,N.d.c). The youths between the ages of 10 and 17are 36 percent white, 13 percent African American,41 percent Hispanic, 9 percent Asian American,and 1 percent Native American. About 23 percentof the children under 18 living in Clark County livein poverty (U.S. Census Bureau 2012).† Nevadawas recently ranked no. 48 out of the 50 states inoverall child well-being (Annie E. CaseyFoundation 2013b).
This document is a research report submitted to the U.S. Department of Justice. This report has not been published by the Department. Opinions or points of view expressed are those of the author(s)
and do not necessarily reflect the official position or policies of the U.S. Department of Justice.

Case Studies of Nine Jurisdictions That Reduced DMC in Their Juvenile Justice Systems
35
he is a “believer in second chances for children and has dedicated his professional life toimproving systems to serve children and families” (Clark County, Nev., N.d.b). Other decision-makers, such as previous directors and JDAI coordinators, have also contributed to this positiveculture change.
There has been a culture change within the frontline staff as well, which was a result of changesin training, organizational, and hiring practices. For example, the Juvenile Probation Officer(JPO) hiring process was changed. Previously, the JPO test was based mostly on law-relatedquestions. But now, to ensure that the individuals who are hired are committed to the processand want to work with people, 40 human-relations questions are incorporated. Additionally,there are now numerous committees consisting of individuals from diverse levels of the systemwho all have an equal voice. This helps ensure buy-in from staff. Three examples of committeesare the training committee, the policy committee, and the ropes course committee. Staffmembers recently put together a mentoring program—called Brother to Brother or Sister toSister—which connected system-involved youths to mentors in the community.
As a result of these training, hiring, and staff engagement strategies, staff now spend more timeengaging in conversations with youths and teaching them the social skills they need to besuccessful. There has been a more humanistic approach in how the youths are treated, andconditions of confinement have improved. For example, in 2003 there were more than 1,500episodes of 24-hour room confinement, compared with today, when there are 6 to 12 a year.
Increased Adherence to a Risk Assessment Instrument. Since 2005, Clark County has used arisk assessment instrument (RAI) to determine whether a youth is placed into secure detention.The RAI uses a scoring system that weighs specified risk factors associated with public safety. Itwas developed with the intent of finding an objective means of deciding which youths would bedetained (Clark County Department of Juvenile Justice Services 2013). New leadership in 2008led to increased enforcement of the RAI. Discretionary overrides, which occur when a youth isdetained because of a special circumstance that is not listed as a category in the RAI, are nowrare (fewer than 5 percent each year since 2008). To receive an override, approval must begranted by the detention manager and the assistant director of the DJJS. Before approval for anoverride is granted, the management staff walks through all of the steps to make sure that allresources have been utilized and all alternatives considered. The goal is to avoid the harshestoptions whenever possible. Significantly, the discretionary overrides do not show bias towardminority youth.
Engaging Law Enforcement and the Minority Community. There are many activities and groupsaimed at building relationships between the juvenile justice system and the community. Forexample, the Latin Chamber of Commerce works with court-involved youth twice per week,juvenile justice leadership visits a struggling housing authority complex weekly and participatesin numerous school and community activities, and there are weekly dinners at the detentioncenter where mentors in the community come to speak with youth and share their experiences.Juvenile justice leaders have also been building relationships with numerous community groupssuch as the local mosque and the local chapter of the NAACP.
This document is a research report submitted to the U.S. Department of Justice. This report has not been published by the Department. Opinions or points of view expressed are those of the author(s)
and do not necessarily reflect the official position or policies of the U.S. Department of Justice.

Case Studies of Nine Jurisdictions That Reduced DMC in Their Juvenile Justice Systems
36
There are also many noteworthy initiatives aimed at building relationships between the policeand the juvenile justice system. The director of DJJS recently stated that the law enforcementpiece was very important and that having law enforcement officials at the table at communitymeetings with minority leaders has been “pivotal to moving the community forward.” He alsoadded, “It’s magical to see that happen.” One example of these initiatives is the Safe VillageInitiative, one of the largest engagement strategies, which engages numerous individuals ingovernment, law enforcement, and the community. The Safe Village Initiative began its work in2007 in response to a sharp increase in violent crime in the West Las Vegas community knownas William 5/6 (Gillespie 2008). Safe Village is a multifaceted partnership among lawenforcement, government agencies, the community, and faith-based organizations to reduceviolence and its impact in selected neighborhoods. The steering committee produced a simpleplan based on best practices that would run smoothly as different personnel would be assigned.
Home Management and Global Positioning Satellite Monitoring as Alternatives to SecureDetention. The Clark County Detention Review and Release Program (DRRP) provides judgeswith alternatives to secure detention for youth, when appropriate. Through the DRRP, judgescan order home management or global positioning satellite (GPS) monitoring instead of sendingyouths to detention. Youths who are released to the community under home managementand/or GPS monitoring agree to be held accountable for abiding by the conditions stipulated inthe behavioral contract, which restricts activities beyond school, work, medical, and religiousreasons to ensure public safety. Probation officers conduct numerous unannounced home,school, employment, and community visits 7 days a week during day and late-evening hours toensure compliance. During 2008–12, while the number of secure detentions decreased over 10percent, the number of youths on home management or GPS more than doubled (Clark CountyDepartment of Juvenile Justice Services 2013).
Notably, 2012 data show that there are no racial disparities disadvantaging minority youth inthe decision to use home management or GPS compared with secure detention. Juvenilesviolating either the home management or the GPS monitoring contract rules face a series ofgraduated sanctions, including detention (Clark County Department of Juvenile Justice Services2013).
Increased Reliance on Data and Technology. Use of accurate data is important in any DMC–reduction initiative. Clark County uses data and technology on a daily basis to improve itsjuvenile justice system. The site compiles systemwide juvenile justice data for distribution on ayearly basis, uses data throughout the year to examine the results of programs and procedures,and strives to implement technological solutions to make the system work better for youthsand families. Clark County’s data collection system is called Family Tracking Reporting andAutomatic Case Reports, or FamilyTRAC.
Each year, the DJJS publishes a statistical report that includes data on court-involved youth. Forexample, the 2012 data book included 88 pages of information on youths in the generalpopulation as well as court-involved youths at referral, intake, diversion, petition, disposition,detention, probation, and confinement and on youths using community-based alternatives.Information for youths referred to court is presented by gender, race, time of offense, referralsources, charges, and other legal and extralegal variables. When available, data trends are
This document is a research report submitted to the U.S. Department of Justice. This report has not been published by the Department. Opinions or points of view expressed are those of the author(s)
and do not necessarily reflect the official position or policies of the U.S. Department of Justice.
Case Studies of Nine Jurisdictions That Reduced DMC in Their Juvenile Justice Systems
37
presented for the past 5 years. This data book is published in a user-friendly format sostakeholders can easily access and use the data.
Additionally, court data are used on an ongoing basis. For example, recently there was aconcern that white youths were more likely to be placed on GPS monitoring as an alternative todetention than minority youths were. As a result, decision-makers came together and analyzedthe existing data. In the end, the data showed that the racial breakdown of youths placed onGPS monitoring was similar to those being sent to detention. By using data in real time, theywere able to show that their GPS monitoring tool was working. Internal data reviews such asthese help improve the likelihood that the system is run without bias.
Clark County also uses technology to accelerate detention decision-making when court isclosed. This reduces the number of youths who would be locked up on weekends. For example,when a youth is arrested on the weekend, the booking center can find out in real time about hisor her previous record and whether there is a warrant. Other information is entered into thebooking system, which indicates whether the youth should be released to a parent or held untilthe next court day.
Programming in Detention. Clark County has improved programming for youths in detentionduring the past few years, and juvenile justice decision-makers believe that, by doing so, feweryouths are sentenced to their staff secure facility at adjudication. Programs offered bydetention staff emphasize building self-esteem, drug awareness, guidelines to positivebehavior, health and hygiene, gang intervention, life skills training, conflict resolution, currentevents, arts and crafts, yoga, and cultural awareness. The Clark County School District provideseducational services that include the standard core subjects, as well as physical education,special education, and adult education. A school counselor and second-language services arealso provided. The Mental Health Treatment Team, which consists of an assistant manager, fivelicensed clinicians, and a parttime contracted, board-certified child and adolescent psychiatrist,provides best practice assessment and treatment of youth in detention (Clark County, Nev.,N.d.a).
One example of a detention center program is the Creating a Successful Environment (CASE)Program, which was developed to provide a safe and secure environment, enhance positive lifeskills, and gain the cooperation and compliance of youth in detention. CASE encourages positiveinteraction with staff and peers. The goal is “prevention and resolution” of problem behavior byensuring that rules and expectations are known, understood, and followed and by providing amechanism to recognize youths for their positive behavior while in detention.
An Emphasis on Reducing DMC. Clark County juvenile justice decision-makers understand that,while excellent programs, community engagement, and fair policies for all youth are vital to theeffectiveness of the juvenile justice system, there must be an intentional emphasis on race toreduce racial disparities. Thus, Clark County has done the following:
Engaged people of color in community-wide efforts (see above).
This document is a research report submitted to the U.S. Department of Justice. This report has not been published by the Department. Opinions or points of view expressed are those of the author(s)
and do not necessarily reflect the official position or policies of the U.S. Department of Justice.

Case Studies of Nine Jurisdictions That Reduced DMC in Their Juvenile Justice Systems
38
Formed the Racial Disparities Workgroup, which is part of a larger group of juvenilejustice system reformers. This larger group consists of numerous individuals, includingjudges, elected officials, juvenile justice system leaders and staff, concerned citizens,and the local JDAI Coordinator. The Racial Disparities Workgroup concentrates on usingdata to ensure fairness in processing. For example, the group has looked closely atjudicial orders and violations of probation to examine trends.
Made DMC reduction a public issue. Clark County juvenile justice leaders have spokenabout racial disparities at numerous meetings, forums, and other public spaces. Forexample, the director of the Clark County DJJS recently spoke on a radio show aboutDMC and the importance of getting people involved in the issue.
Worked with the W. Haywood Burns Institute (BI), which is a national nonprofitorganization dedicated to reducing racial disparities in the juvenile justice system bypromoting and ensuring fairness and equity in youth-serving systems across the nation.Clark County stakeholders noted that BI taught them how to analyze and look moredeeply at their data and to identify needs in terms of policy and programming.
Data ImprovementsFrom 2007 to 2011, there were reductions in racial disparities in Clark County at both thesecure detention stage and the secure confinement stage.
Secure Detention. During 2007–11, the total number of detentions went from 3,800 to 3,362, anearly 12 percent decrease (see Table 6.4). The RRI for African American youth at detentiondecreased from 1.7 to 1.4 during this time (see Figure 6.9). Notably, racial disparities forHispanic youth at detention have been almost nonexistent for the period studied (see Figure6.10).
Figure 6.9. Detention Rates and RRI: African Americana
aData Source: Clark County Department of Juvenile Justice Services. Rates based on referrals to DJJS.
2007 2008 2009 2010 2011Rate - White 12.1 12.1 12.5 13.7 14.3Rate- Black 21.1 19.4 20.1 19.5 19.9RRI-Detention 1.7 1.6 1.6 1.4 1.4
0.00.20.40.60.81.01.21.41.61.82.0
0.0
5.0
10.0
15.0
20.0
25.0R
elat
ive
Rat
e In
dex (
RR
I)
Secu
reD
eten
tion R
ates
(per
100
refe
rral
s)
This document is a research report submitted to the U.S. Department of Justice. This report has not been published by the Department. Opinions or points of view expressed are those of the author(s)
and do not necessarily reflect the official position or policies of the U.S. Department of Justice.

Case Studies of Nine Jurisdictions That Reduced DMC in Their Juvenile Justice Systems
39
Figure 6.10. Detention Rates and RRI: Hispanica
aData Source: Clark County Department of Juvenile Justice Services. Rates based on referrals to DJJS.
Table 6.4. Clark County Detention Numbers, 2007–11a
Year TotalWhite
Detentions
AfricanAmerican
Detentions
AsianAmerican
DetentionsHispanic
DetentionsOther
Detentions2007 3,800 994 1,481 43 1,171 1112008 3,732 913 1,348 39 1,312 1202009 3,702 880 1,333 68 1,308 1132010 3,603 902 1,200 64 1,296 1412011 3,362 797 1,114 70 1,260 121
aData Source: Clark County Department of Juvenile Justice Services. “Asian American” also includes persons of Pacific Islander descent.
Secure Confinement.* Additionally, during 2007–11, three secure confinement indicatorsdeclined: the number of youths with new secure confinements, the secure confinement ratesfor African American youths, and the RRI for African American youths at secure confinement.†
The total number of youths classified as new confinements from Clark County decreased from374 in 2007 to 243 in 2011, a reduction of 35 percent (see Table 6.5). By 2011 the white secureconfinement rate was 8.4 confinements per 1,000 referrals, while the African Americanconfinement rate was 14.5 secure confinements per 1,000 referrals—resulting in a relative rateindex of 1.7. This level of disparity declined steadily from 2007, when the African American ratewas 22.5 compared with the white rate of 9.4—resulting in a 2007 RRI value of 2.4 (see Figure6.11).
*Secure detention differs from secure confinement. For more information, see chapter 2 of this report.†“Secure confinement” refers to Clark County Division of Child and Family Services (DCFS) placements.
2007 2008 2009 2010 2011Rate - White 12.1 12.1 12.5 13.7 14.3Rate- Hispanic 11.5 12.9 12.7 13.2 14.6RRI-Detention 1.0 1.1 1.0 1.0 1.0
0.40.60.81.01.21.41.61.82.0
0.02.04.06.08.0
10.012.014.016.0
Rel
ativ
e R
ate
Inde
x (R
RI)
Secu
re D
eten
tion
Rat
e(p
er 1
00 re
ferr
als)
This document is a research report submitted to the U.S. Department of Justice. This report has not been published by the Department. Opinions or points of view expressed are those of the author(s)
and do not necessarily reflect the official position or policies of the U.S. Department of Justice.

Case Studies of Nine Jurisdictions That Reduced DMC in Their Juvenile Justice Systems
40
Figure 6.11. Secure Confinement Rates and RRI: African Americana
aData Source: Clark County Department of Juvenile Justice Services. DCFS Dispositions.
Table 6.5. Clark County Secure Confinement Numbers, 2007–11a
Year TotalWhite
Confinements
AfricanAmerican
ConfinementsHispanic
ConfinementsOther
Confinements2007 374 77 158 123 162008 309 60 126 112 112009 381 77 167 122 152010 278 49 102 113 142011 243 47 81 105 10
aData Source: Clark County Department of Juvenile Justice Services. DCFS Dispositions.
ConclusionClark County is a large jurisdiction with a majority minority-youth population. To reduce racialdisparities at detention and secure confinement, Clark County used numerous systemwidestrategies, including better incorporation of technology and data analysis, adherence to a riskassessment instrument, increasing access to alternatives to secure detention and confinement,and changing the culture of the system toward one that concentrates on addressing the needsof the youth (rather than focusing on law enforcement). Throughout, Clark County also madesure that there was an intentional concentration on DMC by having a Racial DisparitiesWorkgroup, making DMC reduction a public issue, and working with a national DMC technicalassistance provider. These strategies appear to have made a positive impact on the number ofyouths being sent to detention and secure confinement and on racial disparities. Given themany efforts at engaging the police and the community, it is hoped that there will beimprovements at the arrest and referral-to-court stages very soon.
2007 2008 2009 2010 2011Rate - White 9.4 8.0 10.9 7.5 8.4Rate- Black 22.5 18.1 25.1 16.6 14.5RRI Sec. Conf. 2.4 2.3 2.3 2.2 1.7
0.0
0.5
1.0
1.5
2.0
2.5
3.0
0.0
5.0
10.0
15.0
20.0
25.0
30.0
Rel
ativ
e R
ate
Inde
x (R
RI)
Secu
re C
onfin
emen
t Rat
e(p
er 1
,000
refe
rral
s)
This document is a research report submitted to the U.S. Department of Justice. This report has not been published by the Department. Opinions or points of view expressed are those of the author(s)
and do not necessarily reflect the official position or policies of the U.S. Department of Justice.

Case Studies of Nine Jurisdictions That Reduced DMC in Their Juvenile Justice Systems
41
ConnecticutDisproportionate Minority Contact–Reduction Case Study
The ProblemConnecticut has been intent on reducing disproportionate minority contact (DMC) statewidefor decades. However, although many gains had been made, the latest DMC assessment study(which used 2006 data) showed disparate handling in 9 of the 18 contact points studied, evenwhen controlling for a variety of factors such as demographics, incident characteristics,* andjurisdiction.† One of these contact points showing disparate handling was referral to court,which had not been identified in previous Connecticut DMC assessment studies, indicating thatthis was a new area of concern. In 2006 the relative rate index (RRI) at police referral to courtwas 2.9 for Hispanic youth and 6.3 for African American youth.
Juvenile Justice StrategiesConnecticut has had steady leadership from the DMC Coordinator (who is also the JuvenileJustice Specialist) for decades and a supportive State Advisory Group (SAG), called the JuvenileJustice Advisory Committee (JJAC), with multiple subcommittees that have made data analysisand utilization a priority. After more than20 years of data analysis andimplementation of DMC–reductionstrategies, the JJAC has learned that toreduce DMC, they must concentratespecifically on DMC reduction and not ongeneral juvenile justice systemimprovement alone. Additionally, theremust be an emphasis on changing thebehavior of system practitioners, not thatof youth. Connecticut has worked onbuilding awareness of DMC issues,fostering working relationships betweenschools and police, and creating a trainingcurriculum for police officers that wassubsequently found to be effective inenhancing the officers’ knowledge of DMC and strategies for interacting with youth.
Data and Research. Since the early 1990s, Connecticut has published three comprehensiveDMC assessment studies of its juvenile justice system, the last of which was published in 2009(Richetelli, Hartstone, and Murphy), using 2006 data. The studies looked closely at variousdecision points in the Connecticut juvenile justice system to identify contact points wheredisparate decision-making was occurring. The analysis went beyond Office of Juvenile Justiceand Delinquency Prevention (OJJDP) requirements by examining contact points such as the
*For example, how police became aware of the incident, number of offenders, school versus nonschool incident.†For example, distance from detention center, presence of a juvenile review board, size of city/town.‡2012 data.§2011 data.
Connecticut is home to more than 3.5 million residents,including 805,025 children and youths under 18. The youthsbetween the ages of 10 and 17 are 65 percent white, 18percent Hispanic, 12 percent African American, and 4 percentAsian American. In the past 10 years, the under-18 populationdecreased 5 percent statewide, but this varied greatly by race,with the biggest changes being a decrease of 15 percent forwhite youth and an increase of more than 40 percent for Asianyouth and over 30 percent for Hispanic youth (Puzzanchera,Sladky, and Kang 2013).‡ About 15 percent of the children inthis northeastern state under 18 live in poverty (U.S. CensusBureau 2012).§ Connecticut is 1 of the top 10 states for childwell-being (Annie E. Casey Foundation 2013b), but in many ofthe major metropolitan areas poverty levels are high. Forexample, 53 percent of the youths in Hartford, 40 percent ofthe youths in Waterbury, and 38 percent of the youths in bothNew Haven and Bridgeport live in poverty (Connecticut Voicesfor Children 2013).
This document is a research report submitted to the U.S. Department of Justice. This report has not been published by the Department. Opinions or points of view expressed are those of the author(s)
and do not necessarily reflect the official position or policies of the U.S. Department of Justice.

Case Studies of Nine Jurisdictions That Reduced DMC in Their Juvenile Justice Systems
42
holding of youth in the police station (securely or not) and measuring the amount of time youthspent at residential placements (secure or not) after being adjudicated delinquent. This in-depth analysis informed the JJAC on which decision points to target for DMC action. Theseanalyses were possible because of a statewide court data collection system.
Stability of Leadership and an Active State Advisory Group. Connecticut has had the sameDMC Coordinator, Valerie LaMotte, for more than 20 years. Her experience, commitment, andexpertise have benefited Connecticut. She is well known nationally and has presented atnumerous conferences and published various pieces on DMC. In Connecticut, Ms. LaMotteworks closely with the JJAC, which meets regularly and has nine subcommittees, including threethat directly address DMC (the Subcommittee on DMC, the Police/Juvenile Task Group, and theSchool/Police Task Group). The JJAC’s membership has been consistent over many years, and inaddition to the JJAC members appointed by the governor, the subcommittees include non–JJACmembers related to the particular task. Connecticut’s Subcommittee on DMC developedrecommendations to the JJAC based on the findings of Connecticut’s assessment studies andrecommended action strategies for implementation. In addition, the subcommittee developeda plan to share the study findings and recommendations statewide. The other two relevantsubcommittees are described below.
Police/Juvenile Task Group. As part of the process of implementing DMC assessment studyrecommendations, the JJAC convened a group of police personnel in 2004 to look into policedecision-making when handling juveniles. After considerable deliberation, the Police/JuvenileTask Group focused its efforts on creating a 1-day curriculum titled Effective Police InteractionsWith Youth (see below). It also created two videos to advertise the training.
Training for Police Officers. The Effective Police Interactions With Youth training curriculum wasdeveloped between 2004 and 2006 to reduce DMC at the arrest stage. The curriculum targetspatrol officers and their knowledge of DMC, youth behavior, and effective strategies forinteracting with young people, as well as their general attitudes toward young people (LaMotteet al. 2010). Training of Connecticut police officers started in 2007. Since then, more than 1,500Connecticut police officers have been trained in the curriculum, which has been shared withnumerous other jurisdictions as well.* An evaluation of the training, published in PoliceQuarterly in 2010, found that the training curriculum did indeed enhance police officers’knowledge and improve their attitudes toward youth.
School/Police Task Group. In 2010 the JJAC convened the School/Police Task Group to addressschool-based DMC in disciplinary actions. The group consisted of about 25 members fromschools, police departments, and advocacy agencies. Concentrating on improving schoolresponse to discipline problems was important in Connecticut given the racial disparities thatexisted in the school data. For example, a recent report found that while African Americanyouths accounted for only 14 percent of all youths enrolled in public schools, they accountedfor 30 percent of the disciplinary offenses; while Hispanics youth accounted for 17 percent ofenrolled students, they accounted for 29 percent of the disciplinary offenses (State Education
*Three of the other case study sites in the report—Hillsborough, N.H.; Tulsa, Okla.; and Essex, N.J.—have also usedthis curriculum.
This document is a research report submitted to the U.S. Department of Justice. This report has not been published by the Department. Opinions or points of view expressed are those of the author(s)
and do not necessarily reflect the official position or policies of the U.S. Department of Justice.

Case Studies of Nine Jurisdictions That Reduced DMC in Their Juvenile Justice Systems
43
Resource Center 2011). The School/Police Task Group developed four core assumptions to itswork: 1) graduated response to school-based incidents, 2) collaboration and partnership at thelocal level, 3) utilization of prevention, early identification, and service referrals asinterventions, and 4) defining the extent of the problem with reliable data.
Model Memorandum of Agreement Between Schools and Police Departments. Based on itscore assumptions, the School/Police Task Group developed a six-page model memorandum ofagreement (MOA) and encouraged superintendents of schools together with chiefs of police inlocal communities to formalize their working relationship using the model MOA. The goals ofthe MOA were to reduce school-based arrests and referrals to court and to ensure a consistentresponse to incidents of student misbehavior. The School/Police Task group promoted theMOA, which is also available online. Communities that adopted the MOA could apply for up to$20,000 in funds for preventive and intervention services. In 2011, nine communitiesparticipated in this program. In 2013 the Center for Applied Research in Human Developmentat the University of Connecticut evaluated the effectiveness of using these MOAs to reducearrests. The study found that, after MOAs were implemented, there was a significant reductionin the percentage of incidents that led to arrests. When controlling for a variety of variablesincluding sex, grade, minority status, and school district, serious incidents that occurred afterimplementing an MOA were 3.7 times less likely to end in arrest compared with seriousincidents that occurred before implementation of an MOA. The study also found that ethnicand racial minority youth continued to be disproportionately represented among studentsarrested, even after implementing the MOA. However, further analysis showed that someheadway was being made regarding DMC. For example, the study found that minority statuswas not a significant predictor in number of days sanctioned after an incident.
Awareness of DMC Statewide. Connecticut built awareness of DMC through variousapproaches, including presentations, surveys, and professionally designed Web sites. In 2009the JJAC began implementing a communications plan to build support for DMC reduction byreaching out to policymakers, juvenile justice practitioners, and the public. The plan includedlanguage to convince people that race does affect how youths are treated, to present DMC assomething that should be everyone’s concern, and to encourage individuals to change practicesrather than act defensively. In 2010 the JJAC created an initiative titled JUST.Start, whichincluded a logo, a brochure, informational postcards, promotional stories, display materials,and a professionally designed Web site (www.ctJUSTstart.org). Earlier, it had also created an11-minute video to discuss its DMC activities and showcase the two major products: theEffective Police Interactions With Youth curriculum and a DMC management tool for residentialfacilities. Later, the JJAC created a second Web site (Right.ResponseCT.org) dedicated to helpingschools and police find the “right response” to youth misbehavior in school.
Passed Laws Requiring Attention to DMC. In 2011 the Connecticut legislature passed a lawconcerning detention of children and DMC in the juvenile justice system (Public Act 11–154).Among other things, it required that state juvenile justice agencies submit biennial reports onthe plans of their department to address DMC and the steps taken to implement those plans.These reports were presented in the first biennial report covering fiscal years 2010 and 2011under the following categories: data, policies and practices, shared initiatives, and training andtechnical assistance (Connecticut Office of Policy and Management 2011).
This document is a research report submitted to the U.S. Department of Justice. This report has not been published by the Department. Opinions or points of view expressed are those of the author(s)
and do not necessarily reflect the official position or policies of the U.S. Department of Justice.

Case Studies of Nine Jurisdictions That Reduced DMC in Their Juvenile Justice Systems
44
Police and Youth Program. Connecticut has also provided funding for projects aimed atimproving relationships between police and youth through two initiatives: 1) the Police andYouth Program and 2) the Reaching for Respect Program. Applicant agencies under the Policeand Youth Program apply for funds to increase or enhance opportunities for youth and police towork together to benefit their community. The goals of the program are to promote positiveyouth development and to increase the numbers of police officers who are experienced andcomfortable working and interacting with youth. During 2006–12, the average total yearlyfunding for these projects was over $90,000, usually for 10 or 11 individual projects. The typicalproject has an early team-building component for the officers and youths, a series ofactivities/events enjoyable for both groups that provide opportunities for police and youth tointeract, a joint community service project that benefits the community or individuals in thecommunity other than youths ages 12–18, and a concluding recognition event. Projectsgenerally serve 15 to 30 youths and budget funds for police overtime, contractual services, andsupplies. Additionally, the Reaching for Respect Program provides technical assistance andminigrants for youth-led and youth-designed projects to improve police–youth relations.Between 2010 and 2013, eight rounds of funding were made to 47 projects in 23 urban,suburban, and rural communities.* Finally, the JJAC sponsored annual statewide conferencesfor police, which helped build working relationships. The last of these annual conferences—the17th—was held in 2011.
Improvements in the DataDuring 2006–12 the number of referrals and referral rates improved for white, AfricanAmerican, and Hispanic youth. Referral rates for white youth decreased from 2.6 to 1.9, referralrates for African American youth decreased from 16.0 to 8.9, and referral rates for Hispanicyouth decreased from 7.4 to 3.1 (see Figures 6.12 and 6.13). While juvenile crime declinedduring this period in Connecticut, as it did in many other states, the decrease in referrals tocourt in Connecticut is even more remarkable given the change in juvenile court age eligibility.In 2007, Connecticut was one of only three states to set the age of adulthood at 16 for criminalprosecution. Thus, only youths ages 15 and under were part of the juvenile justice system.However, this eligibility law was changed, and on Jan. 1, 2010, 16-year-olds became a part ofthe juvenile justice system. On July 1, 2012, 17-year-olds also moved to the juvenile justicesystem (Raise the Age CT). Thus, there were more youths eligible for juvenile justice systeminvolvement in 2010, 2011, and 2012 than in the preceding years. The RRI values also improvedsignificantly for both African American youth and Hispanic youth. In 2006 the RRI for Hispanicyouth was 2.9, and by 2012 the RRI was 1.6. For African Americans, the RRI was 6.3 in 2006, andby 2012 the RRI had decreased to 4.7.
*Data are taken from the JJAC’s Annual Reports to the Governor, available online, and from reports posted on theConnecticut’s Office of Policy and Management Web site
This document is a research report submitted to the U.S. Department of Justice. This report has not been published by the Department. Opinions or points of view expressed are those of the author(s)
and do not necessarily reflect the official position or policies of the U.S. Department of Justice.

Case Studies of Nine Jurisdictions That Reduced DMC in Their Juvenile Justice Systems
45
Table 6.6. Connecticut Referral Numbers, 2006–07, 2009–12
Year White ReferralsAfrican American
Referrals Hispanic Referrals2006 5,199 5,665 3,1502007 4,397 4,723 2,9332009 3,443 3,449 1,9162010 4,704 4,275 2,3282011 3,935 3,380 2,0182012 4,455 3,926 2,045
Figure 6.12. Referral Rates and RRI: African American
Figure 6.13. Referral Rates and RRI: Hispanic
2006 2007 2009 2010 2011 2012Rate - White 2.6 2.2 1.8 2.1 1.8 1.9Rate- Black 16.0 13.6 10.3 10.3 8.1 8.9RRI-Referral 6.3 6.2 5.7 4.9 4.6 4.7
0.0
1.0
2.0
3.0
4.0
5.0
6.0
7.0
0.02.04.06.08.0
10.012.014.016.018.0
Rel
ativ
e R
ate
Inde
x (R
RI)
Ref
erra
lRra
tes (
per 1
00 y
outh
)
2006 2007 2009 2010 2011 2012Rate - White 2.6 2.2 1.8 2.1 1.8 1.9Rate- Hispanic 7.4 6.8 4.3 3.8 3.3 3.1RRI-Referral 2.9 3.1 2.4 1.8 1.9 1.6
0.0
0.5
1.0
1.5
2.0
2.5
3.0
3.5
0.0
1.0
2.0
3.0
4.0
5.0
6.0
7.0
8.0
Rel
ativ
e R
ate
Inde
x (R
RI)
Ref
erra
l Rat
es (p
er 1
00 y
outh
)
This document is a research report submitted to the U.S. Department of Justice. This report has not been published by the Department. Opinions or points of view expressed are those of the author(s)
and do not necessarily reflect the official position or policies of the U.S. Department of Justice.
Case Studies of Nine Jurisdictions That Reduced DMC in Their Juvenile Justice Systems
46
ConclusionThe state of Connecticut concentrated primarily on training and awareness of DMC to reduceits racial disparities. It developed a strong capacity to design and implement its DMC–reductionapproach by having an experienced DMC Coordinator and an active SAG with numeroussubcommittees focused on clear goals and objectives. One of the most significant strategieswas a police training, which was developed by Connecticut and is now used in variousjurisdictions nationwide. Connecticut also provided funding for short-term programs to buildrelationships between police and youth as well as incentives for police and schoolsuperintendents to develop MOAs primarily to decrease referrals to court. The emphasis onthese targeted strategies appears to have helped reduce DMC in Connecticut. From 2006 to2012, the RRI values at referral declined from 2.9 to 1.6 for Hispanic youth and from 6.3 to 4.7for African American youth. Obviously, there is much work yet to be done, especially to reducethe RRI for African American youth, but in a state with such stark differences between rich andpoor the progress made is significant.
This document is a research report submitted to the U.S. Department of Justice. This report has not been published by the Department. Opinions or points of view expressed are those of the author(s)
and do not necessarily reflect the official position or policies of the U.S. Department of Justice.
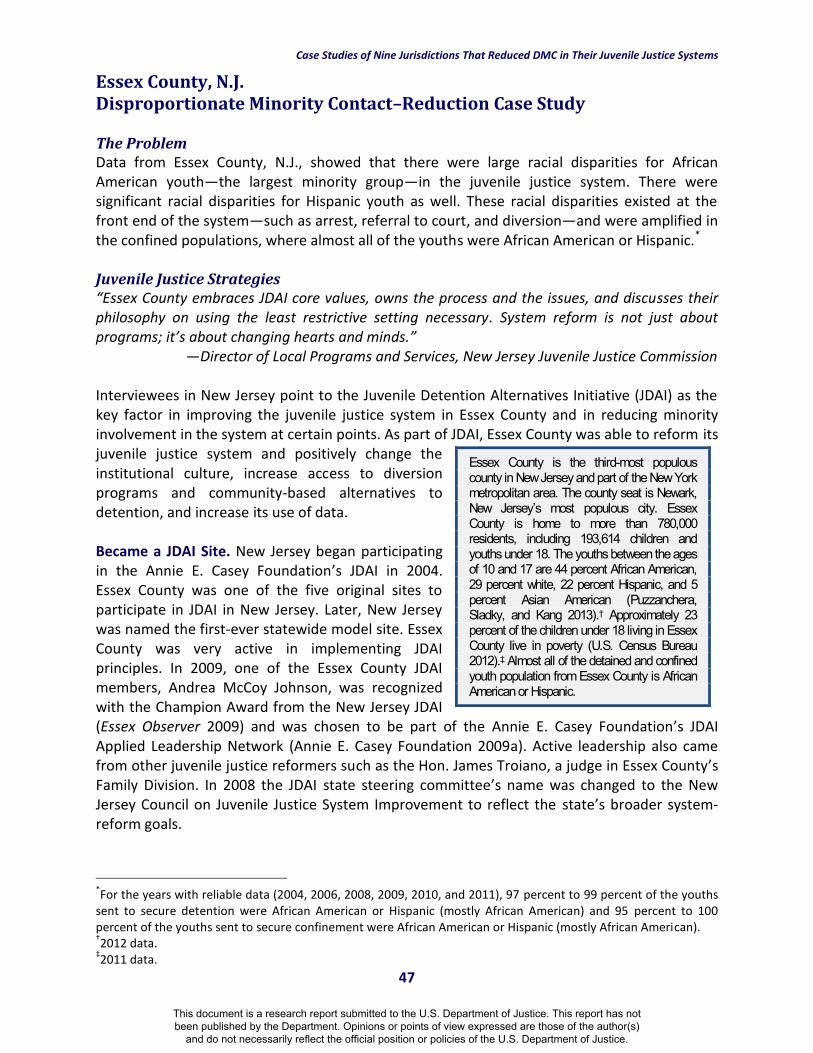
Case Studies of Nine Jurisdictions That Reduced DMC in Their Juvenile Justice Systems
47
Essex County, N.J.Disproportionate Minority Contact–Reduction Case Study
The ProblemData from Essex County, N.J., showed that there were large racial disparities for AfricanAmerican youth—the largest minority group—in the juvenile justice system. There weresignificant racial disparities for Hispanic youth as well. These racial disparities existed at thefront end of the system—such as arrest, referral to court, and diversion—and were amplified inthe confined populations, where almost all of the youths were African American or Hispanic.*
Juvenile Justice Strategies“Essex County embraces JDAI core values, owns the process and the issues, and discusses theirphilosophy on using the least restrictive setting necessary. System reform is not just aboutprograms; it’s about changing hearts and minds.”
—Director of Local Programs and Services, New Jersey Juvenile Justice Commission
Interviewees in New Jersey point to the Juvenile Detention Alternatives Initiative (JDAI) as thekey factor in improving the juvenile justice system in Essex County and in reducing minorityinvolvement in the system at certain points. As part of JDAI, Essex County was able to reform itsjuvenile justice system and positively change theinstitutional culture, increase access to diversionprograms and community-based alternatives todetention, and increase its use of data.
Became a JDAI Site. New Jersey began participatingin the Annie E. Casey Foundation’s JDAI in 2004.Essex County was one of the five original sites toparticipate in JDAI in New Jersey. Later, New Jerseywas named the first-ever statewide model site. EssexCounty was very active in implementing JDAIprinciples. In 2009, one of the Essex County JDAImembers, Andrea McCoy Johnson, was recognizedwith the Champion Award from the New Jersey JDAI(Essex Observer 2009) and was chosen to be part of the Annie E. Casey Foundation’s JDAIApplied Leadership Network (Annie E. Casey Foundation 2009a). Active leadership also camefrom other juvenile justice reformers such as the Hon. James Troiano, a judge in Essex County’sFamily Division. In 2008 the JDAI state steering committee’s name was changed to the NewJersey Council on Juvenile Justice System Improvement to reflect the state’s broader system-reform goals.
*For the years with reliable data (2004, 2006, 2008, 2009, 2010, and 2011), 97 percent to 99 percent of the youthssent to secure detention were African American or Hispanic (mostly African American) and 95 percent to 100percent of the youths sent to secure confinement were African American or Hispanic (mostly African American).†2012 data.‡2011 data.
Essex County is the third-most populouscounty in New Jersey and part of the New Yorkmetropolitan area. The county seat is Newark,New Jersey’s most populous city. EssexCounty is home to more than 780,000residents, including 193,614 children andyouths under 18. The youths between the agesof 10 and 17 are 44 percent African American,29 percent white, 22 percent Hispanic, and 5percent Asian American (Puzzanchera,Sladky, and Kang 2013).† Approximately 23percent of the children under 18 living in EssexCounty live in poverty (U.S. Census Bureau2012).‡ Almost all of the detained and confinedyouth population from Essex County is AfricanAmerican or Hispanic.
This document is a research report submitted to the U.S. Department of Justice. This report has not been published by the Department. Opinions or points of view expressed are those of the author(s)
and do not necessarily reflect the official position or policies of the U.S. Department of Justice.

Case Studies of Nine Jurisdictions That Reduced DMC in Their Juvenile Justice Systems
48
Overall Systems Reform and Culture Change. While nationally the JDAI model hasconcentrated primarily on detention, in New Jersey, and in Essex County specifically, thoseinvolved in JDAI conceptualized it as an overall systems-improvement initiative with the ideathat if you focus on one point in the juvenile justice system and get collaboration and data-driven decision-making in place you can start using these same tools and practices at otherpoints. Involvement in JDAI resulted in a cultural change in Essex County. Those working in thesystem developed a new mindset in regard to the juvenile justice system. According to one ofthe JDAI partners: “There was a philosophy of diverting kids who aren’t supposed to be indetention. It had a profound effect on making sure kids don’t get to detention if they aren’tsupposed to be there.” As a systems-change initiative, Essex County targeted its work on abroad spectrum of areas of the system. From pre–JDAI until 2011, Essex County reduced itsaverage daily population in detention by 130.4 youths, a decrease of 53.5 percent; reducedoverall admissions to detention by 1,166 youths, a 47.4 percent decrease; and reduced averagelength of stay by 6.8 days, a 17.1 percent decrease.*
Alternatives to Detention. One of the main areas of emphasis for Essex County was to createand improve alternatives to detention. Alternatives to detention are short-term placements foryouths who would otherwise remain in detention while their cases are pending in court. Oneexample of an improvement to alternatives to detention was reducing delays in accessingelectronic monitoring. Historically, Essex County relied on electronic monitoring units thatrequired a landline telephone with specific features. At times, youths ordered to electronicmonitoring would have to wait in detention while staff assessed (and in many cases updated)their home telephone situation. Additionally, the staff in charge of the electronic monitoringand other alternatives to detention were based solely out of the detention center, thus youthsordered to be released to electronic monitoring at their court hearing had to go back todetention to be processed. Both of these situations led to delays in release from detention tothe court-ordered alternatives. In 2006 and 2007, Essex County introduced wireless electronicmonitoring systems as an alternative to detention and stationed an alternatives-to-detentionstaff person at the courthouse. Other alternative-to-detention programs also exist in thecounty, including an Evening Reporting Center. In 2011, minority youths comprised 99.2percent of all youths held in the Essex County detention center and 99.0 percent of youthsplaced in Essex County’s community-based detention alternatives (New Jersey Juvenile JusticeCommission N.d.). During 2007–11, between 77.5 percent and 84.0 percent of the youths sentto detention alternatives successfully completed their program.†
Diversion Options. There are numerous diversion options for youth in Essex County, many ofwhich are coordinated statewide. For example, the Juvenile Conference Committees (JCCs),which serve under the authority of the Family Division of the New Jersey Superior Court, aredesigned to divert juveniles charged with first- or second-time minor offenses. The JCC is a six-to nine-member citizen volunteer panel appointed by the family division judge (New JerseyCourts, N.d.b). In a confidential setting, JCC panels hear and decide matters involving the
*Data are taken from New Jersey’s JDAI reports, available online.†Between 3.6 percent and 6.7 percent of the youths in the alternative program picked up a new charge and wereremoved from the program. Between 11.6 percent and 16.7 percent of the youths were removed from thealternative program for a violation (noncompliance).
This document is a research report submitted to the U.S. Department of Justice. This report has not been published by the Department. Opinions or points of view expressed are those of the author(s)
and do not necessarily reflect the official position or policies of the U.S. Department of Justice.

Case Studies of Nine Jurisdictions That Reduced DMC in Their Juvenile Justice Systems
49
referred juveniles. The juvenile, parent (or parents) or guardian (or guardians), and complainant(complainants)/victim(victims) are invited to discuss the offense and related matters. The JCCconsiders the facts, and makes recommendations to the judge for a resolution that would aid inthe juvenile’s rehabilitation. Another example is the Intake Service Conferences (ISCs), whichtarget juveniles with less-serious offenses or for repeat minor offenses. ISCs use communityresources to resolve matters without the need for formal court intervention. Cases are referredto ISCs by a family division intake officer when the complaint is screened or through a referralfrom court by a family division judge. Whereas the JCCs are made up of volunteers who reside,hear, and decide matters in the juvenile’s community, ISCs are scheduled and heard by aprobation officer in the family division. Also available are diversion programs for specificoffenses, such as the Juvenile Auto Theft Prevention Program for juveniles whose primarycharges are auto theft related and the Prevention, Intervention, and Education Program forjuveniles arrested a first time for substance abuse-related offenses.
Increased Use of Data. Involvement in JDAI also resulted in an increase in collecting, sharing,and using data for making decisions. Annual JDAI reports with comprehensive data on securedetention and alternatives to detention are now compiled and available to the public on theNew Jersey attorney general’s Web site. These reports are written by Jennifer LeBaron, a Ph.D.–level criminologist who is currently the director of local programs and services at the NewJersey Juvenile Justice Commission.* According to New Jersey’s 2006 JDAI Annual Report,“[Many of New Jersey’s] JDAI sites have made great progress implementing the core strategy ofrelying on data to advise detention system policy and practice, expanding local capacity forcollecting and regularly reviewing data.” According to the Hon. James Troiano, a family courtjudge who was involved with JDAI in Essex County, JDAI helped with the utilization of data inEssex County.
Stationhouse Adjustments. At the same time that JDAI was being implemented, there was anincreased concentration on stationhouse adjustments at the state level. A stationhouseadjustment is an alternative method that law enforcement agencies in New Jersey may use tohandle first-time juvenile offenders who have committed minor juvenile delinquency offenses.The intent of the stationhouse adjustment program is to provide for immediate consequences,such as community service or restitution and a prompt and convenient resolution for thevictim, while at the same time avoiding the stigma of a formal juvenile delinquency record forthe juvenile offender. According to the New Jersey Office of the Attorney General, in manyinstances, this early intervention will deter a youth from continuing his or her negative behaviorand divert the youth from progressing further into the juvenile justice system (Office of theAttorney General, State of New Jersey, 2005b). However, although the Office of the AttorneyGeneral issued an executive directive in 1990 to encourage the use of curbside warnings orstationhouse adjustments, a 2004 report noted disparities in the availability, implementation,and procedures of these opportunity programs as applied in different municipalities. Thefindings suggested that disparate application of such policies and procedures may make asignificant impact on the unequal treatment of juveniles in the criminal justice system. Inresponse to these findings, the Office of the Attorney General devised variousrecommendations to standardize, improve, and equalize the use of stationhouse adjustments
*Part of the Office of the Attorney General.
This document is a research report submitted to the U.S. Department of Justice. This report has not been published by the Department. Opinions or points of view expressed are those of the author(s)
and do not necessarily reflect the official position or policies of the U.S. Department of Justice.

Case Studies of Nine Jurisdictions That Reduced DMC in Their Juvenile Justice Systems
50
throughout New Jersey. In 2005, standardized guidelines were developed and distributedthrough a statewide directive from the office of the Attorney General to promote a moreuniform method of diverting eligible juveniles that would promote equality within the justicesystem by providing equivalent access to police diversionary programs regardless of domicile.These guidelines were clarified in another statewide directive in 2008. The New Jersey StateAdvisory Group also prioritized increasing the use of stationhouse adjustments in urban areaswhere there tends to be a concentration of minority youth, provided funding for theseprograms, though not in Essex County (New Jersey Juvenile Justice Commission, N.d.), andoffered to monitor the use of these diversions from the formal system.*
Data ImprovementsReferral to Court. In 2004 the rate of African American youths’ being referred to juvenile courtfrom the general population was approximately five times as great as the white rates (4.9), andthe Hispanic rate was over twice as great (2.2). By 2011 the disparity was cut significantly forboth minority groups. The African American referral-to-court rate declined from 5.7 per 100youths in 2004 to 4.3 per 100 youths in 2011, and during the same period the Hispanic referral-to-court rate declined from 2.5 to 1.3 while the white rate remained relatively steady (between1.2 and 1.4). During this time, the relative rates index (RRI) for African American youth declinedto 3.5 while the RRI for Hispanic youth declined to 1.1 (see Figures 6.14 and 6.15). In addition tothese decreases in referral rates and racial disparities, overall number of referrals declined by40 percent (see Table 6.7).
Figure 6.14. Referral Rates and RRI: African American
*State of New Jersey Governor’s Juvenile Justice and Delinquency Prevention Committee.
2004 2006 2008 2009 2010 2011Rate - White 1.2 1.3 1.3 1.4 1.2 1.2Rate- Black 5.7 5.5 5.3 6.0 4.9 4.3RRI-Referral 4.9 4.3 4.1 4.2 4.1 3.5
0.0
1.0
2.0
3.0
4.0
5.0
6.0
0.0
1.0
2.0
3.0
4.0
5.0
6.0
7.0
Rel
ativ
e R
ate
Inde
x (R
RI)
Ref
erra
l Rat
es (p
er 1
00 y
outh
)
This document is a research report submitted to the U.S. Department of Justice. This report has not been published by the Department. Opinions or points of view expressed are those of the author(s)
and do not necessarily reflect the official position or policies of the U.S. Department of Justice.

Case Studies of Nine Jurisdictions That Reduced DMC in Their Juvenile Justice Systems
51
Figure 6.15. Referral Rates and RRI: Hispanic
Table 6.7. Essex County Referral to Court Numbers, 2004–11
Year Total Referralsa White ReferralsAfrican American
Referrals Hispanic Referrals2004 3,637 496 2,661 4282006 3,442 542 2,478 3722008 2,893 357 2,124 3322009 2,851 367 2,166 2852010 2,501 297 1,902 2692011 2,195 302 1,613 255
aReferrals are “New Complaints Docketed,” which were originally obtained from the New Jersey Office of the Attorney General and retrievedfrom OJJDP’s DMC Web-Based Data Entry System.
Diversion“I am not surprised that diversion was identified as an area where Essex has seen positivechanges. Diversion is a function of the courts, and the courts have been an incredible leader inNew Jersey and Essex County in addressing DMC and taking on JDAI.”
—Director of Local Programs and Services
Diversion rates (the number of diversions per 100 youths referred to court) improved for bothAfrican American and Hispanic youth between 2004 and 2011. In 2004, there were 32diversions per 100 referrals for African American youth compared with 54 diversions per 100referrals for white youth, resulting in an RRI of 0.59. By 2011 the African American diversionrate was 41 per 100 referrals and the white rate was 48 per 100 referrals, resulting in an RRI of0.9 (see Figure 6.16). Hispanic diversion rates also improved, resulting in improvements in theminority group’s RRI (see Figure 6.17).
2004 2006 2008 2009 2010 2011Rate - White 1.2 1.3 1.3 1.4 1.2 1.2Rate- Hispanic 2.5 2.2 2.0 1.7 1.4 1.3RRI-Referral 2.2 1.7 1.5 1.2 1.2 1.1
0.0
0.5
1.0
1.5
2.0
2.5
0.0
0.5
1.0
1.5
2.0
2.5
3.0
Rel
ativ
e R
ate
Inde
x (R
RI)
Ref
erra
l Rat
es (p
er 1
00 y
outh
)
This document is a research report submitted to the U.S. Department of Justice. This report has not been published by the Department. Opinions or points of view expressed are those of the author(s)
and do not necessarily reflect the official position or policies of the U.S. Department of Justice.

Case Studies of Nine Jurisdictions That Reduced DMC in Their Juvenile Justice Systems
52
Figure 6.16. Diversion Rates and RRI: African American
Figure 6.17. Diversion Rates and RRI: Hispanic
Table 6.8. Essex Count Diversion Numbers, 2004–11
Year Total Diversions White DiversionsAfrican American
Diversions Hispanic Diversions2004 1,288 266 839 1622006 1,325 268 885 1482008 1,164 158 823 1402009 1,123 146 840 1212010 1,040 147 750 1262011 940 144 667 113
2004 2006 2008 2009 2010 2011Rate - White 53.6 49.4 44.3 39.8 49.5 47.7Rate- Black 31.5 35.7 38.7 38.8 39.4 41.4RRI Diversion 0.59 0.72 0.88 0.97 0.80 0.87
0.00
0.20
0.40
0.60
0.80
1.00
1.20
0.0
10.0
20.0
30.0
40.0
50.0
60.0
Rel
ativ
e R
ate
Inde
x (R
RI)
Div
ersi
on R
ates
(per
100
refe
rral
s)
2004 2006 2008 2009 2010 2011Rate - White 53.6 49.4 44.3 39.8 49.5 47.7Rate- Hispanic 37.9 39.8 42.2 42.5 46.8 44.3RRI Diversion 0.71 0.80 0.95 1.07 0.95 0.93
0.00
0.20
0.40
0.60
0.80
1.00
1.20
0.0
10.0
20.0
30.0
40.0
50.0
60.0
Rel
ativ
e R
ate
Inde
x (R
RI)
Div
ersi
on R
ates
(per
100
refe
rral
s)
This document is a research report submitted to the U.S. Department of Justice. This report has not been published by the Department. Opinions or points of view expressed are those of the author(s)
and do not necessarily reflect the official position or policies of the U.S. Department of Justice.

Case Studies of Nine Jurisdictions That Reduced DMC in Their Juvenile Justice Systems
53
Secure Detention and Secure Confinement.* During 2004–11, the numbers of youths beingsent to secure detention and secure confinement decreased. Given that the vast majority ofthese youths are African American and Hispanic, this decrease primarily affected them. From2004 to 2011, the number of African American youths securely confined after adjudicationdeclined from 91 to 25, a 73 percent decrease (see Figure 6.18). During this same time, thenumber of minority youths securely detained decreased from 1,969 to 1,344, a 32 percentdecrease; the African American youths securely detained decreased from 1,720 to 1,050, a 39percent decrease (see Table 6.9).† Data from JDAI reports show even more improvement sincethe start of JDAI in 2003. Annual JDAI reports show that during 2003–11 the average dailypopulation (ADP) in detention decreased from 243.6 to 79.0, a 68 percent decrease; the ADPfor minority youth decreased from 242.6 to 78.0.‡
Table 6.9. Essex County Secure Detention Numbers, 2004–11
YearTotal
DetentionsWhite
Detentions
AfricanAmerican
DetentionsHispanic
Detentions
ADPMinority
Youth ADP Total2003 n/a n/a n/a n/a 242.6 243.62004 2,013 44 1,720 247 n/a n/a2006 2,144 50 1,858 235 n/a n/a2007 n/a n/a n/a n/a 127.3 128.62008 1,480 34 1,300 146 113.2 114.72009 1,322 19 1,170 128 112.9 113.22010 1,759 46 1,383 321 100.0 100.52011 1,383 39 1,050 290 78.4 79.0
Total detention data unavailable for 2005 and 2007. ADP data from New Jersey’s JDAI Annual Data Reports.
Figure 6.18. Total Detentions and Secure Confinements, 2004–11Total Detentions 2004–11 Total Secure Confinements 2004–11
*Secure detention differs from secure confinement. For more information, see chapter 2.†RRI values do indicate decreasing, though very high, RRI values at detention for African American youth. However,the small number of white youths compared with the large number of African American youths makes these valuesunreliable.‡Data are taken from New Jersey’s JDAI reports, available online.
2,0132,144
1,4801,322
1,759
1,3831,720
1,858
1,3001,170
1,383
1,050
2004 2006 2008 2009 2010 2011
Total Detention Black Detention
97
72
40
56
41
27
91
64
36
55
39
25
2004 2006 2008 2009 2010 2011
Total Confinement Black Confinement
This document is a research report submitted to the U.S. Department of Justice. This report has not been published by the Department. Opinions or points of view expressed are those of the author(s)
and do not necessarily reflect the official position or policies of the U.S. Department of Justice.

Case Studies of Nine Jurisdictions That Reduced DMC in Their Juvenile Justice Systems
54
ConclusionEssex County has a majority minority youth population, and the confined juvenile population isoverwhelmingly minority. Essex County was able to reduce racial disparities among the youthsbeing referred to court and among the youths being diverted from court. Additionally, thenumber of African American youths being securely detained and confined declined.Interviewees point to systemwide reform efforts involving multiple system stakeholders anddecision-makers as the most important factor in reducing disproportionate minority contact(DMC) at the court decision points. Access to diversion and alternatives to detention improved,and there was an increased use of data to make decisions. At the same time, DMC was alsodeclining at referral. This could be due to the increased use of stationhouse adjustments andcurbside diversions by police departments or to some other factor.
This document is a research report submitted to the U.S. Department of Justice. This report has not been published by the Department. Opinions or points of view expressed are those of the author(s)
and do not necessarily reflect the official position or policies of the U.S. Department of Justice.

Case Studies of Nine Jurisdictions That Reduced DMC in Their Juvenile Justice Systems
55
Hillsborough County, N.H.Disproportionate Minority Contact–Reduction Case Study
The ProblemHillsborough, N.H., has a small minority population, but it was overrepresented in juvenilejustice processing. In 2008 the relative rate index (RRI) for Hispanic youth in Hillsborough at thearrest stage was 1.8. Racial disparities existed at other levels of the system as well, though smallnumbers made interpreting the data difficult. During this time, many minority residents feltthey were being unfairly targeted by police, and many police were uncomfortable talking aboutrace issues. Additionally, some juvenile justice stakeholders and community members did nottrust the accuracy of juvenile justice data that were being collected and were distrustful ofcensus data. During this time, many felt that the minority population was too small for thecommunity to use its scarce resources to concentrate on disproportionate minority contact(DMC).
Juvenile Justice Strategies“One of the things that is really working for us is the collaboration from all segments of lawenforcement.”
—Chair of DMC Subcommittee of New Hampshire State Advisory Group
During the past 2 decades, there has been a tremendous increase in the number of minorityresidents, including youth residents, living in Hillsborough County. During 1990–2011, while thewhite youth population increased 14 percent, theAfrican American youth population increased 299percent and the Hispanic youth populationincreased 345 percent (Puzzanchera, Sladky, andKang 2012).† Although some decision-makers feltthe number of minority youths was still too low tofocus much energy on DMC, for others theincreasing number of minority residents created asense of urgency to understand what the data weresaying and also to make sure that the data wereaccurate. A key group of decision-makers felt thatthey needed to concentrate on addressing theconcerns of the growing minority populations beforelarger problems developed. The youth seemed likethe best place to start.
Improving Data Accuracy Statewide. To address this desire to better understand racial andethnic trends, there was an emphasis on improving the accuracy of data statewide, which led toan increase in the understanding and use of data. As noted in the Office of Juvenile Justice andDelinquency Prevention’s DMC Technical Assistance Manual, data can be powerful tools andshould guide every phase of DMC–reduction efforts. However, many in New Hampshire were
*2012 data.†“Youth” refers to individuals ages 10–17.
Hillsborough County, N.H., has a population ofsome 400,000 people, including 92,318 childrenand youths under age 18. The youths between theages of 10 and 17 are approximately 85 percentwhite, 8 percent Hispanic, 3 percent AfricanAmerican, and 3 percent Asian American(Puzzanchera, Sladky, and Kang 2013).*Hillsborough is northern New England‘s mostpopulous county as well as its most denselypopulated. Its largest cities are Nashua andManchester. Approximately 12 percent of thechildren under 18 living in Hillsborough County livein poverty. New Hampshire was recently namedone of the top states for child well-being (Annie E.Casey Foundation 2013).
This document is a research report submitted to the U.S. Department of Justice. This report has not been published by the Department. Opinions or points of view expressed are those of the author(s)
and do not necessarily reflect the official position or policies of the U.S. Department of Justice.

Case Studies of Nine Jurisdictions That Reduced DMC in Their Juvenile Justice Systems
56
mistrustful of the data, which hindered any work on data-driven solutions. When NewHampshire hired Andrew Smith as its new DMC Coordinator in 2010, he wanted to make surethere was accurate information. He stated: “I am relentless in making the point that if your datais not accurate and challengeable you can’t improve” and “Data is the only objective criteria wehave to work with.” Before becoming DMC Coordinator, Mr. Smith worked for the NewHampshire Census Bureau and supervised the count for the 2010 Census. His background indata collection, specifically as it related to race, helped bring much-needed attention to theimportance of accurate data collection and analysis.
Leadership From Law Enforcement. At the same time, there was strong leadership from manyof the key police chiefs in the county, including Chief David J. Mara in Manchester, Chief John J.Seusing in Nashua, Chief Mike Allen in Rochester, and Chief Eddie Edwards, the chief liquorenforcement officer for the state of New Hampshire. These chiefs supported DMC–reductionefforts at the state and local levels and contributed to increasing awareness of DMC and findingsolutions to decrease it. Many of the chiefs participated actively on committees that addressracial disparities, and some even chaired the statewide DMC committee. The police chiefs alsoused their leadership to initiate officer trainings and make changes to programs whennecessary. The New Hampshire DMC Coordinator noted that the police chiefs “could have saidthis wasn’t important. They could have said the population is so small that it didn’t matter, butthey didn’t do that. They put aside limited funding to do these trainings. We have built a lottrust, and they have my support.” Sheriffs have also played an important part in addressingDMC. Donald Vittum became the Director of the Police Standards and Training Council in 2007and required that all new police recruits take a diversity course. This course was designed andrun by Strafford County Sheriff David Dubois and DMC Committee Chair Chief Eddie Edwardsand is presented to other audiences as well (see below).
Police Training in Cultural Competency, Diversity, and Working With Youth. The police chiefsalso led the efforts to train their officers in cultural competency, diversity, and police–youthinteractions. Starting in 2010, police officers from the Hudson, Manchester, and Nashua policedepartments were trained using the Effective Interactions With Youth curriculum, which wasdesigned in Connecticut and customized for New Hampshire. The curriculum is designed toimprove knowledge and skills among officers in how to interact with youth, particularlyminority youth, to reduce negative outcomes and results in police action. Specifically, thecurriculum helps officers distinguish problematic adolescent behavior from typical adolescentbehavior and deescalate situations involving agitated or defiant youth. The goals of the trainingare to increase patrol officer awareness of DMC, increase patrol officer knowledge of youthbehavior and strategies for interacting effectively with youth, improve police attitudes towardyoung people, increase the likelihood that police–youth interactions will have positiveoutcomes for youth, and increase the likelihood that youth will respond positively towardpolice officers (Sanderson et al. 2008). In addition to the curriculum, police were able to benefitfrom the expertise of the DMC Coordinator, who had also been a diversity consultant beforeaccepting his current role. This expertise served to put stakeholders and decision-makers atease and build trust when discussing race, which can be difficult for many in the juvenile justiceand law enforcement fields, as well as for the community.
This document is a research report submitted to the U.S. Department of Justice. This report has not been published by the Department. Opinions or points of view expressed are those of the author(s)
and do not necessarily reflect the official position or policies of the U.S. Department of Justice.

Case Studies of Nine Jurisdictions That Reduced DMC in Their Juvenile Justice Systems
57
Diversity training was also implemented at the New Hampshire Police Academy for policerecruits across the state. This training is a 3-hour course that has grown and matured over time.It was developed internally by police officers and is updated depending on the students in theclass as well as on current events.
Committees Focused on DMC and Other Diversity and Cultural Issues. Finally, there were bothnew and established state and local committees focused on racial issues. For example, thestatewide DMC Subcommittee had been meeting for years, and the cities of Nashua andManchester had groups that addressed racial and ethnic concerns. Nashua has an EthnicAwareness Committee whose mission is to encourage understanding and appreciation of ethnicdiversity in the city and to facilitate communication between the ethnic community and citygovernment (City of Nashua, N.H., 2009). Manchester has a Community Advisory Board thataddresses issues for the growing immigrant refugee population by helping minimize culturaland linguistic conflicts with the police department, among other rapport-building communityevents. Manchester also has an effective Office of Youth Services that has numerous bilingualworkers who provide outreach services that build rapport, communication, and trust in theareas of the city where the potential for conflict exists.
Most important in terms of committees, in 2010 local DMC committees formed in both Nashuaand Manchester. These local committees have strong leadership from police (see above) andmeet monthly. The committees include representatives from the juvenile court, probation,juvenile diversion programs, the superintendent of schools, school resource officers, andjudges. Primary areas of emphasis included data collection and police trainings, but other topicswere also addressed. Each committee has developed its own goals and objectives according tolocal needs and realities. For example, the purpose of the Nashua DMC Committee is to begin adialog among police, educators, parents, youth, and community leaders seeking to identifythings the community can do together to prevent all youth from entering the juvenile justicesystem and reduce the disparity evident among minority youth (City of Nashua, N.H., N.d.a).
Dialog nights were planned at the state level in 2009–10 to provide an opportunity forcommunity members and police officers to speak and share different points of views tounderstand one another better. The specific events were designed locally with the police chiefsbased on each community’s needs. For example, in Nashua many minority communitymembers felt that police were unfairly targeting them, and many of the youths did not knowwhat their rights were. At the same time, many law enforcement officers were afraid to talkabout race issues because they did not want to be labeled as racist. During the dialog nights,many of these issues were addressed and discussed in a welcoming, nonthreatening way.
Improvements in the DataThe overall juvenile arrest rate in Hillsborough decreased from 5.7 arrests per 100 youths in2007 to 4.2 arrests per 100 youths in 2011. In 2007, there were 2,740 juvenile arrests,compared with 2011 when there were 1,892 juvenile arrests (see Table 6.10). Arrest rates forHispanic youths also declined steadily from 8.8 per 100 in 2008 to 5.2 per 100 in 2011.* During
*Population data for Hispanic youth in 2007 were not entered into the RRI database and thus were not used in theanalysis of rates.
This document is a research report submitted to the U.S. Department of Justice. This report has not been published by the Department. Opinions or points of view expressed are those of the author(s)
and do not necessarily reflect the official position or policies of the U.S. Department of Justice.

Case Studies of Nine Jurisdictions That Reduced DMC in Their Juvenile Justice Systems
58
this same time, the white arrest rate increased slightly, then decreased. Finally, the RRI forHispanic youth at arrest also decreased from 1.8 in 2007 to 1.3 in 2011, indicating a reduction inDMC (see Figure 6.19).
Figure 6.19. Arrest Rates and RRI: Hispanic
Table 6.10. Hillsborough County Arrest Numbers, 2007–11
Year Total ArrestsWhiteArrests
AfricanAmerican
ArrestsHispanicArrests
AsianAmerican
Arrests
NativeAmerican
Arrests2007 2,740 2,348 170 187 35 02008 2,269 1,868 113 269 19 02009 2,387 1,971 162 234 17 32010 2,426 1,988 179 242 15 22011 1,892 1,516 159 173 12 0
ConclusionHillsborough, N.H., provides some insight into the DMC problems and responses of ajurisdiction with a small but growing minority population. Small numbers make meaningful dataanalysis difficult at more than just a few juvenile justice stages. However, the trends in arrestrates do indicate a decrease in arrest rates for both white and Hispanic youth as well as adecrease in racial disparities. Strategies such as improving data accuracy, engaging police chiefsin DMC work, and providing training to police officers in diversity and police–youth interactionsseem to have had a positive impact.
2008 2009 2010 2011WhiteArrestRate 4.8 5.2 5.3 4.0HispanicArrestRate 8.8 7.4 7.3 5.2RRIHispanicArrest 1.8 1.4 1.4 1.3
0.00.20.40.60.81.01.21.41.61.82.0
0.01.02.03.04.05.06.07.08.09.0
10.0
Rel
ativ
e R
ate
Inde
x (R
RI)
Arre
st R
ates
(per
100
you
th)
This document is a research report submitted to the U.S. Department of Justice. This report has not been published by the Department. Opinions or points of view expressed are those of the author(s)
and do not necessarily reflect the official position or policies of the U.S. Department of Justice.

Case Studies of Nine Jurisdictions That Reduced DMC in Their Juvenile Justice Systems
59
Montgomery County, Ala.Disproportionate Minority Contact–Reduction Case Study
The ProblemIn 2008 the relative rate index (RRI) for African American youth at detention in MontgomeryCounty, Ala., was 1.6, and the RRI for African American youth at secure confinement was 1.3.Collaboration between the judicial and executive branches of state government neededimprovement, data awareness was lacking, and there was no objective risk assessmentinstrument to determine detention placement. Finally, most of the youths in secure detentionwere originally referred to court for only minor disorderly offenses.
Juvenile Justice StrategiesIn 2007, juvenile justice decision-makers and stakeholders began concentrating on improvingtheir juvenile justice system, primarily through the Juvenile Detention Alternatives Initiative(JDAI). As a result, there were positive outcomesat both the secure detention stage and the secureconfinement stage.
Implementing JDAI Strategies. MontgomeryCounty became a JDAI site in 2007 along withthree other Alabama counties. The Annie E. CaseyFoundation in 2007 awarded Alabama a $150,000grant to begin the JDAI. These funds werematched by the Governor’s Office (AdministrativeOffice of Courts, Alabama Judicial System, Family Court, N.d.). Funds were distributed to thefour selected counties to help offset costs incurred in commencing the reform efforts.According to the Alabama Administrative Office of Courts Web site, “one of the great benefitsof JDAI has been in the interbranch cooperation between the judicial and executive branches ofgovernment in [the] state.”
Alabama built on this cooperation by incorporating the Annie E. Casey Foundation’s visionwith the practical experience of a retired circuit court judge and the dedication of otherjuvenile and family court judges and staff. Under the leadership of the Hon. John Davis, aretired family court judge in Montgomery County, JDAI principles began to take root. JudgeDavis assisted the juvenile/family court judge and JDAI Coordinator at each of the four sites inunderstanding the concepts and rewards of objective admissions, alternatives to detention,accurate and timely data collection, and other core strategies of the JDAI model. Judge Davis isoften cited as the guidepost of this initiative by those involved in this reform effort. “JudgeDavis had the credibility to implement this project and the enthusiasm to keep you believingthat it could be done,” stated current Chief Justice Charles R. Malone. “The work he and ourfour site judges have accomplished is nothing short of phenomenal” (Administrative Office ofCourts, Alabama Judicial System, Family Court, N.d.).
The development of a risk assessment instrument (RAI) was an important step for theMontgomery County JDAI. The RAI was developed and field tested in 2008 through a
Montgomery County, Ala., is home to more than230,000 residents, including 57,530 children andyouths under 18. The youths between the ages of10 and 17 are 63 percent African American, 31percent white, 3 percent Hispanic, and 2 percentAsian American. Most Montgomery Countyresidents live in the city of Montgomery, which isthe second-largest city in Alabama. Approximately34 percent of the children under 18 living inMontgomery County live in poverty (U.S. CensusBureau 2012).
This document is a research report submitted to the U.S. Department of Justice. This report has not been published by the Department. Opinions or points of view expressed are those of the author(s)
and do not necessarily reflect the official position or policies of the U.S. Department of Justice.

Case Studies of Nine Jurisdictions That Reduced DMC in Their Juvenile Justice Systems
60
collaborative process involving various stakeholders and decision-makers such as the DistrictAttorney’s Office, the Sheriff’s office, the police, intake officers, judges, and probation officers.There was also an active subcommittee devoted exclusively to developing the RAI. Afterapproximately 1 year and 22 revisions, the RAI was adopted by the executive committee andimplemented countywide in 2009. Through the RAI, detention eligibility was changed: onlyyouths who were public safety risks would be recommended for detention (although therewas still a place for an override and discretion). Beverly Wise, the senior probation supervisorand JDAI Coordinator for Montgomery County’s Juvenile Court, said that the RAI was thecounty’s “crowning jewel.”
An additional JDAI strategy to decrease the number of youths going to secure detention inMontgomery County was building awareness of the data among those in the juvenile justicesystem and in the community. For example, a close look at the data revealed that, at onepoint, two thirds of the youths being detained in secure detention facilities were originallyreferred to court from the public schools for minor disorderly conduct offenses (e.g.,harassment, trespassing, fistfights in the hallway). The JDAI committee felt that securedetention was not the ideal response for offenses such as these, so it created a pie chartpresenting the detention referral information and presented it to the superintendent ofMontgomery Public Schools. The data surprised the superintendent. Given this awareness, thenumber of referrals for disorderly conduct from the schools has decreased.
Using JDAI Principles to Reduce DMC at Confinement. Although JDAI was originally designedto concentrate on the detention stage, Montgomery County used JDAI principles to improveits juvenile justice system at the secure confinement stage as well. At this stage, there was aconcerted effort to increase data awareness and utilize other core JDAI principles. TheAlabama Administrative Office of the Court Web site notes that “the JDAI experience hasfiltered throughout all levels of juvenile justice in Alabama” and that collaboration andpartnership between the court and the Department of Youth Services (DYS) led to a steepreduction in admissions to DYS (Administrative Office of Courts, Alabama Judicial System,Family Court, N.d.).
Walter Wood, Director of DYS, stated the following about DYS’s involvement in JDAI and theeffect on secure confinements:
By partnering with [the Administrative Office of Courts] to promote discussion aboutappropriate use of detention and services for children, DYS is meeting its obligation to assistlocal courts in developing more effective programming for troubled youth and, in doing so,working to reduce the number of youth who end up in the deep end of the system: a statejuvenile or adult correctional facility. [Administrative Office of Courts, Alabama Judicial System,Family Court, N.d.]
The reduction in the number of youths going to secure confinement after being referred tocourt may also be related directly to the reductions in detentions. Various studies have foundthat youths who are placed in detention are more likely to move deeper into the system. Thesestudies have found statistically significant links between pre-adjudication detention placementand petition, out-of-home placements, and secure confinement after controlling for other
This document is a research report submitted to the U.S. Department of Justice. This report has not been published by the Department. Opinions or points of view expressed are those of the author(s)
and do not necessarily reflect the official position or policies of the U.S. Department of Justice.

Case Studies of Nine Jurisdictions That Reduced DMC in Their Juvenile Justice Systems
61
variables such as offense and prior record (Bray, Sample, and Kempf–Leonard 2005; Guevaraand Spohn 2006; Holman and Ziedenberg 2006). Following this same logic, reducing racialdisparities in detention could also reduce racial disparities in secure confinement.
Data ImprovementsMontgomery County stakeholders credit JDAI with decreasing the detention and confinementnumbers, rates, and RRI values during 2009–11.
Secure Detention. During the first 4 years that the JDAI was implemented, the number ofyouths sent to secure detention fell from 361 to 172, a 52 percent decrease (see Table 6.11).Racial disparities also decreased. Detention rates* for both white and African American youthdecreased from 2009 until 2011. In 2009 the white detention rate was 17 detentions per 100referrals; in 2011 that rate dropped to 9 detentions per 100 referrals. For African Americanyouths, there were 28 detentions per 100 referrals in 2009 compared with 11 detentions per100 referrals in 2011. During 2008–11, the RRI declined from 1.6 to 1.5 to 1.3, indicating asteady decrease in disproportionate minority contact at secure detention (see Figure 6.20).
Figure 6.20. Detention Rates and RRI: African American
Table 6.11. Montgomery County Detention Numbers, 2008–11
Year Total Detentions White DetentionsAfrican American
Detentions2008 361 28 3312009 353 28 3232010 262 19 2412011 172 11 158
Secure Confinement.† Since the start of JDAI, secure confinement numbers have decreased inMontgomery County. During 2008–11, the total number of youths securely confined declined
*Detention rates are based on referrals to court. Referral numbers are available only for 2009, 2010, and 2011when they went from 1,345 to 1,608 to 1,603 (the 2008 data cannot be verified). White referrals went from 166 to171 to 127. African American referrals went from 1,173 to 1,403 to 1,441.†Secure detention differs from secure confinement. For more information, see chapter 2 .
2009 2010 2011Rate - White 16.9 11.1 8.7Rate- Black 27.5 17.2 11.0RRI Detention 1.6 1.5 1.3
0.00.20.40.60.81.01.21.41.61.8
0.0
5.0
10.0
15.0
20.0
25.0
30.0
Rel
ativ
e R
ate
Inde
x (R
RI)
Det
entio
n R
ates
(per
100
refe
rral
s)
This document is a research report submitted to the U.S. Department of Justice. This report has not been published by the Department. Opinions or points of view expressed are those of the author(s)
and do not necessarily reflect the official position or policies of the U.S. Department of Justice.

Case Studies of Nine Jurisdictions That Reduced DMC in Their Juvenile Justice Systems
62
from 204 to 120, a 41 percent decrease (see Table 6.12). Additionally, the secure confinementrates* for both white and African American youth decreased. For white youths, in 2009 therewere 11 secure confinements per 100 referrals compared with 7 secure confinements per 100referrals in 2011. For African American youths, there were 15 secure confinements per 100referrals in 2009 compared with 8 secure confinements per 100 referrals in 2011. Finally, theRRI decreased from 1.3 to 1.1 during this time (see Figure 6.21).
Figure 6.21. Secure Confinement Rates and RRI: African American
Table 6.12. Montgomery County Confinement Numbers, 2008–11
Year Total Confinements White ConfinementsAfrican American
Confinements2008 204 45 1542009 193 19 1742010 167 14 1532011 120 9 111
ConclusionMontgomery County, Ala., was able to reduce racial disparities for Africa American youth atboth secure detention and secure confinement. The number of youths being detained andconfined also decreased, as did the confinement and detention rates. Key stakeholders creditthe reduction in numbers as well as the decreases in rates and racial disparities to the JDAI,which led to a strong collaboration of juvenile justice partners in both the executive and judicialbranches. Through this collaboration, Montgomery County has been able to focus more on dataand develop a RAI that has helped minimize the number of youths who qualify for securedetention.
*Based on the number of youths referred to court.
2009 2010 2011Rate - White 11.4 8.2 7.1Rate- Black 14.8 10.9 7.7RRI Sec. Conf. 1.3 1.3 1.1
0.0
0.2
0.4
0.6
0.8
1.0
1.2
1.4
0.02.04.06.08.0
10.012.014.016.0
Rel
ativ
e R
ate
Inde
x (R
RI)
Con
finem
ent R
ates
(per
100
refe
rral
s)
This document is a research report submitted to the U.S. Department of Justice. This report has not been published by the Department. Opinions or points of view expressed are those of the author(s)
and do not necessarily reflect the official position or policies of the U.S. Department of Justice.

Case Studies of Nine Jurisdictions That Reduced DMC in Their Juvenile Justice Systems
63
Philadelphia, Pa.Disproportionate Minority Contact–Reduction Case Study
The ProblemJuvenile justice stakeholders and decision-makers in the state of Pennsylvania have beenfocusing on disproportionate minority contact (DMC) for years. DMC was identified as an actionissue in Pennsylvania in 1989, and funding for programs that serve minority youth began shortlyafter. In Philadelphia, where approximately three fourths of the youths are minority, there hasbeen much work done to reduce the number of youths with formal contact with the juvenilejustice system. Nevertheless, racial disparities in Philadelphia—the state’s largest city—remained significant. In 2006 the relative rate index (RRI) for African American youth atdetention was 1.6. For Hispanic youth, it was 2.3.
Juvenile Justice StrategiesThere are many initiatives in Philadelphia aimed at preventing and reducing delinquency amongyouth as well as reducing their contact with the juvenile justice system. These include four corestrategies related to potential DMC reduction: 1) the Philadelphia Working Group of the DMCSubcommittee, 2) Graduated Response Court (GRC), 3) utilization of global positioning satellite(GPS) monitoring as an alternative to placementand detention, and 4) activities to buildrelationships between youth and lawenforcement. Additionally, Philadelphia is part ofthe MacArthur Foundation’s Models for ChangeDMC Action Network.
Philadelphia Working Group of the DMCSubcommittee. In 2003 the Philadelphia WorkingGroup was formed to address the problem ofDMC at the local level. The Philadelphia WorkingGroup includes individuals from manyorganizations including the district attorney’soffice, the Department of Human Services, thepublic defender, five branches of lawenforcement, the School District of Philadelphia,the juvenile court, the mayor’s office, the localuniversity, a behavioral health consultant, faith-based and community organizations, and youthmembers. The Philadelphia Working Group is concerned with DMC at all points in the juvenilejustice system, but concentrates primarily at the front end of the system. It has implementedtraining and other activities dedicated to improving police–youth relations and helped create aGRC (see below).
In addition to the diverse representation of the membership, what makes this group unique isits dedication to the work and its capacity to get things done. The group is quite action
*2012 data.†2011 data.
Philadelphia is the largest city in Pennsylvania andthe fifth-largest city in the United States.Philadelphia is home to more than 1.5 millionresidents, including 346,336 children and youthsunder 18. The total number of youths living in thecity has decreased over the past 10 years, withsignificant decreases in the white and AfricanAmerican youth populations (although the Hispanicyouth population is increasing). Today, the youthsbetween the ages of 10 and 17 are approximately53 percent African American, 23 percent white, 18percent Hispanic, and 6 percent Asian American(Puzzanchera, Sladky, and Kang 2013).*Approximately 39 percent of the children under 18in Philadelphia live in poverty (U.S. CensusBureau 2012).† The city’s percentage of adultsneither working nor looking for work is higher thanthat in any large U.S. city other than Cleveland,Ohio, or Detroit, Mich. (The Pew Charitable Trusts’Philadelphia Research Initiative 2011).
This document is a research report submitted to the U.S. Department of Justice. This report has not been published by the Department. Opinions or points of view expressed are those of the author(s)
and do not necessarily reflect the official position or policies of the U.S. Department of Justice.

Case Studies of Nine Jurisdictions That Reduced DMC in Their Juvenile Justice Systems
64
oriented—much more than most community collaborations. According to the coordinator ofthe group, the members are “committed to do anything they can for kids of color inPhiladelphia.” The coordinator also noted that once a plan is made, the group almost neverneeds follow-up from the coordinator because “they just do the work.” The PhiladelphiaWorking Group has been a catalyst for developing strong relationships between members,which has served only to improve the work. The former deputy commissioner for juvenilejustice services at the Philadelphia Department of Human Services, who is also a member of thisgroup, stated that any success Philadelphia has had in reducing racial disparities is due toongoing collaborative efforts, including the efforts undertaken by the Philadelphia WorkingGroup.
Graduated Response Court. The Philadelphia Working Group worked closely with thePhiladelphia Family Court, Philadelphia Juvenile Probation, the Defender Association ofPhiladelphia, and the district attorney’s office to develop a system of graduated sanctions toaddress youths who violate probation.Graduated sanctions broadly refer to thecontinuum of options that juvenile courtjudges have at their disposal for respondingto juvenile offenders. Graduated sanctionsprograms provide swift and appropriateresponses to juvenile offenders based onthe gravity of the specific offense and anassessment of the potential risk forreoffending as well as appropriatetreatment to reduce the risk of recidivism(NCJFCJ N.d.; OJJDP N.d.b).
Reducing the number of youths sent tosecure detention for violating conditions ofprobation is a key area of emphasis for many local, state, and national groups (Steinhart 2001).Nationally, about 16 percent of the youths in juvenile residential facilities were sent there for atechnical violation such as a violation of probation or parole, or a valid court order. InPennsylvania, 22 percent of the youths in residential placement are there for technicalviolations (Sickmund et al. 2011). Most juvenile justice advocates agree that secureconfinement for probation violations should be used sparingly, if at all.
In 2008 the GRC in Philadelphia was opened. A special steering committee oversaw the GRC,which emphasized the principles of balanced and restorative justice by addressing probationviolations with prompt responses. The GRC operated 1 day per week in one courtroom. Bytargeting young people on probation with technical violations (e.g., breaking curfew, notreporting to a probation officer), the GRC could offer alternatives such as weekend respiteinstead of detention placement. The GRC also reduced the number of youths being sent todetention awaiting a long-term placement. The GRC has been able to keep youths—especiallyminority youths, who are already overrepresented among the probation population—out ofdetention. Although a recent study found no overall pattern or discrimination in probationviolations (Models for Change 2011), since a majority of the youths on probation are African
Figure 6.22. Philadelphia Youth on Probation byRace/Ethnicity
This document is a research report submitted to the U.S. Department of Justice. This report has not been published by the Department. Opinions or points of view expressed are those of the author(s)
and do not necessarily reflect the official position or policies of the U.S. Department of Justice.

Case Studies of Nine Jurisdictions That Reduced DMC in Their Juvenile Justice Systems
65
American or Hispanic (over 90 percent; see Figure 6.22), reducing the number of youths withprobation violations being sent to detention is important to reducing DMC.
Global Positioning Satellite Monitoring. Philadelphia currently uses numerous alternatives todetention programs, which are designed to provide services and supervision to youth whowould otherwise be held in secure detention either before or after adjudication. One of thesealternatives is GPS monitoring. GPS monitoring allows probation officers to track the youth’slocation and is especially helpful if the youth is allowed to go to some specific places (e.g., toschool or to a drug counseling program) but not everywhere. In 2011 and 2012, more than 400youths per year were placed on GPS monitoring instead of going to secure detention.
Before the utilization of GPS monitoring, the Philadelphia Court was more likely to use home-based electronic monitoring as an alternative to detention. However, electronic monitoring didnot work as smoothly as it could have, since many of the youths did not have landlines in theirhomes, which was a prerequisite to electronic monitoring utilization. Youths without landlineseither were denied the electronic monitoring alternative or they had to wait in detention until alandline was installed. With the move toward using GPS, these issues were resolved and moreyouths were able to benefit from being able to reside in their homes. Given the overwhelmingnumber of minority youths being referred to court in Philadelphia, the option to stay homeinstead of being locked up disproportionately benefited minority youths.
Activities to Build Relationships Between Youth and Law Enforcement. Statewide,Pennsylvania has also developed, modified, and expanded the Youth–Law Enforcementcurriculum. This curriculum consists of youth and law enforcement coming together to haveopen and honest dialog. The information is presented in a forum format to educate youthsabout their rights and responsibilities when they come into contact with law enforcement andalso to educate the law enforcement officers on the culture of the youths in their respectivejurisdictions. The overall goal is to have fewer arrests, which should result from lawenforcement officers having a better understanding of the youth behavior as well as youthhaving a better idea of the law enforcement culture. It is hoped that the curriculum will lead tomore respect and cooperation from each group so that arrests will not occur. This curriculumhas been implemented in five Pennsylvania jurisdictions, including Philadelphia. In Philadelphia,forums are also held in schools and in the police academy for new recruits (Coleman et al.2011).
MacArthur Foundation’s Models for Change DMC Action Network. Pennsylvania was selectedto participate in the MacArthur Foundation’s Models for Change DMC Action Network in 2008.The DMC Action Network was launched in 2007 to bring together teams from select localjurisdictions, expose them to the latest thinking of national experts, and give them anopportunity to learn from one another about effective ways to reduce the disproportionatecontact of minority and ethnic youth with the juvenile justice system (Models for Change,N.d.b). Pennsylvania works with the MacArthur Foundation to improve its statewide datacollection and to move toward becoming a model state for DMC data collection. PhiladelphiaCounty (conterminous with the city) is one of three Pennsylvania counties to participate inModels for Change. Through Models for Change, Philadelphia concentrates primarily on theGRC and the Youth–Law Enforcement curriculum in the police academy.
This document is a research report submitted to the U.S. Department of Justice. This report has not been published by the Department. Opinions or points of view expressed are those of the author(s)
and do not necessarily reflect the official position or policies of the U.S. Department of Justice.

Case Studies of Nine Jurisdictions That Reduced DMC in Their Juvenile Justice Systems
66
Data ImprovementsDuring 2006–10 the RRI at detention for African American youth declined from 1.6 to 1.3 (seeFigure 6.23). During the same time, the RRI for Hispanic youth declined from 2.3 to 1.3 (seeFigure 6.24).
Figure 6.23. Detention Rates and RRI: African American
Figure 6.24. Detention Rates and RRI: Hispanic
Table 6.13. Philadelphia Detention Numbers, 2006–10
YearTotal
DetentionsWhite
Detentions
AfricanAmerican
DetentionsHispanic
Detentions
AsianAmerican
Detentions2006 5,564 375 4,410 739 372007 5,662 329 4,551 736 412008 6,511 474 5,232 745 432009 6,171 431 4,894 757 662010 5,869 412 4,643 747 49
It is also noteworthy that, although there was no reduction in racial disparities at the arreststage, the number of youths being arrested has decreased for the two major racial groups in
2006 2007 2008 2009 2010Rate - White 0.39 0.40 0.60 0.65 0.77Rate- Black 0.63 0.66 0.78 0.81 1.00RRI Detention 1.6 1.7 1.3 1.2 1.3
0.00.20.40.60.81.01.21.41.61.8
0.00
0.20
0.40
0.60
0.80
1.00
1.20
Rel
ativ
e R
ate
Inde
x (R
RI)
Det
entio
n R
ates
(per
100
refe
rral
s)
2006 2007 2008 2009 2010Rate - White 0.39 0.40 0.60 0.65 0.77Rate- Hispanic 0.89 0.76 0.77 0.82 1.00RRI Detention 2.3 1.9 1.3 1.3 1.3
0.0
0.5
1.0
1.5
2.0
2.5
0.00
0.20
0.40
0.60
0.80
1.00
1.20
Rel
ativ
e R
ate
Inde
x (R
RI)
Det
entio
n R
ates
(per
100
refe
rral
s)
This document is a research report submitted to the U.S. Department of Justice. This report has not been published by the Department. Opinions or points of view expressed are those of the author(s)
and do not necessarily reflect the official position or policies of the U.S. Department of Justice.

Case Studies of Nine Jurisdictions That Reduced DMC in Their Juvenile Justice Systems
67
Philadelphia. The total number of juvenile arrests declined by 34 percent in 4 years, from morethan 40,000 in 2006 to under 27,000 in 2010. The youth population has also decreased duringthis time, but only by 20 percent, which indicates a real decrease in arrests. White arrestsdecreased from 9,538 to 5,718 (a 40 percent decrease) and African American arrests decreasedfrom 27,403 to 18,475 (a 33 percentdecrease). Arrest rates have also declinedfor both white and African American youths(see Figure 6.25), but the decrease forwhite youths (from 20.7 arrests per 100 to15.8 arrests per 100) was greater than thedecrease for Afrian American youths (from30.5 arrests per 100 to 26.8 arrests per100), hence there was no reduction in racialdisparity.
ConclusionPhiladelphia is a large city with manyinitiatives aimed at at-risk and systems-involved youth. In addition to localapproaches to DMC reduction, Philadelphiahas benefited from strong statewide attention on DMC as well as involvement with theMacArthur Foundation’s Models for Change DMC Action Network. Three particular initiatives—an active Philadelphia Working Group of the DMC committee, a GRC, and GPS monitoring as analternative to detention—seem to have had a significant effect in reducing DMC at thedetention stage. During 2006–10 the RRI for African American youth declined from 1.6 to 1.3,and the RRI for Hispanic youth declined from 2.3 to 1.3. In 2011, Philadelphia became a JuvenileDetention Alternatives Initiative site. It is hoped that Philadelphia’s involvement with JDAI canresult in reductions in overall numbers of youths going to secure detention. Additionally, it ishoped that the continued emphasis on improving relationships between police and youth canlead to DMC reduction at the arrest stage.
Figure 6.25. Philadelphia Youth Arrest Rate, 2006–10
This document is a research report submitted to the U.S. Department of Justice. This report has not been published by the Department. Opinions or points of view expressed are those of the author(s)
and do not necessarily reflect the official position or policies of the U.S. Department of Justice.

Case Studies of Nine Jurisdictions That Reduced DMC in Their Juvenile Justice Systems
68
Tulsa County, Okla.Disproportionate Minority Contact–Reduction Case Study
The ProblemIn Oklahoma’s 2009 application for Formula Grant funds submitted to the Office of JuvenileJustice and Delinquency Prevention (OJJDP), disproportionate minority contact was listed as itstop problem area to be addressed. The application states
Disproportionate overrepresentation of minority youth exists in the Oklahoma juvenile justicesystem, specifically in the two major metropolitan areas. This is neither fair nor equal anderodes minority communities’ faith in the justice system. It further sends disproportionatenumbers of minority youth on a path deeper into the justice system. Previous research showedthat this issue specifically affects the African American community. Current data has identified asimilar trend with both Hispanic and Native American youth.
In Tulsa County, Okla., where African Americans are the largest minority group, race hashistorically been a sensitive topic. In 2005 the relative rate index (RRI) at detention for AfricanAmericans was 1.4 and the RRI at diversion was 0.7. Racial disparities also existed at otherpoints in the system and for smaller minority populations such as Native American and Hispanicyouths.
Juvenile Justice StrategiesTulsa County’s DMC–reduction strategy was initiated at the state level with direction from thestate Juvenile Justice Specialist and the state DMC Coordinator. The state provided funding andresources to hire a local coordinator, conduct DMCtraining with strategic planning, and conductevidence-based law enforcement training. Thecommunity also opened a crisis intervention centerto provide law enforcement with an alternative todetention for youths who commit low-leveloffenses.
Received Support at the State Level. Oklahomaconcentrated its DMC efforts on three targetedcounties, including Tulsa County, and starting in2004 the state awarded federal Formula Grants specifically to those communities. The TulsaJuvenile Bureau received these grant awards, and one of the first projects was a street outreachand caseworker program for youths with high-risk backgrounds, which ran from 2005 through2007. Tulsa County also got support from the state DMC Coordinator, who was available toattend all of the Tulsa County DMC meetings and helped with much of the DMC planning andorganization.
*2012 data.†2011 data.
Tulsa County, Okla., is home to more than600,000 residents, including 154,718 childrenand youths under age 18. Tulsa County’slargest city is Tulsa, which is Oklahoma’ssecond-most populous city. The youths ages10–17 are 58 percent white, 16 percent AfricanAmerican, 15 percent Hispanic, 9 percentNative American, and 3 percent AsianAmerican(Puzzanchera, Sladky, and Kang2013).* Approximately 21 percent of children inTulsa County under 18 live in poverty (U.S.Census Bureau 2012).†
This document is a research report submitted to the U.S. Department of Justice. This report has not been published by the Department. Opinions or points of view expressed are those of the author(s)
and do not necessarily reflect the official position or policies of the U.S. Department of Justice.

Case Studies of Nine Jurisdictions That Reduced DMC in Their Juvenile Justice Systems
69
Hired a Local DMC Coordinator and Did Strategic Planning. In 2009, Tulsa County was awardedfunding to do a year of strategic planning to target local DMC issues. Two additional years offunding was added to provide direct services to affect DMC at specific contact points. Thecounty chose to concentrate on arrest, diversion, and detention as the primary contact pointswhere it saw a need to reduce DMC. A local DMC Coordinator was hired to coordinate theprocess, and a DMC–Reduction Steering Committee was formed, which consisted ofrepresentatives from law enforcement, social services, education, and other communityagencies. A local DMC Web site was created, and according to its Web site Tulsa County’smultipronged approach to decrease DMC included both delinquency prevention efforts andsystem improvements “to assure fair and equal treatment for all youth regardless of race andethnicity.”
Established a Crisis Intervention Center. In 2008 the city of Tulsa opened a 24-hour crisisintervention center (CIC) for juveniles who were arrested or picked up by law enforcementofficers for delinquent and misdemeanor offenses. The Tulsa CIC was a one-stop centralizedintake, assessment, and service referral system and could hold juveniles for up to 24 hours. Thiswas the ninth such center in Oklahoma. According to the current CIC provider, Youth Services ofTulsa, CICs throughout the nation have proven to be a tremendous asset to local communitiesby reducing the time that law enforcement officers are engaged with youths, by providingassessments and referrals to families, and by tracking trends in juvenile crime. CICs can alsoreduce recidivism by delivering immediate consequences for delinquent behavior, detect andaddress the underlying causes of delinquent or problem behavior on the front end as apreventive measure, intervene before problems escalate by making family referrals tocommunity services, and create a more effective and efficient alliance among police, parents,juvenile justice, and treatment providers (Youth Services of Tulsa, N.d.). According toOklahoma’s Juvenile Justice Specialist, the CIC caused a massive change in the volume ofactivity and made a huge difference in the number of juveniles receiving diversion services. Forexample, during 2006–09, the total number of youths diverted from the juvenile justice systemmore than doubled and the diversion rate increased from 11 diversions per 100 arrests to 38diversions per 100 arrests. According to Oklahoma’s DMC Coordinator, the CIC made asignificant impact on detention rates as well.
Trained and Involved Police. In 2010–11, Tulsa County used the Effective Police InteractionsWith Youth (EPIY) curriculum, training police officers from the Tulsa Police Department, theTulsa County Sheriff’s Office, Tulsa Public Schools, and the Broken Arrow Police Department.The curriculum, which was developed in Connecticut, was customized slightly to best meet theneeds of Tulsa County. EPIY was used for current police officers and also was incorporated intothe police academies for new recruits. In addition to paying for law enforcement training, fundswere utilized to create and develop a video educating youth on how to interact with lawenforcement. Tulsa County also benefits from the participation of law enforcement on its DMCSteering Committee, including the chief of the Tulsa Police Department. Additionally, in 2009,police from Tulsa attended the OJJDP DMC Conference in Austin, Texas, focusing on effectiveand promising systems-improvement strategies to reduce disproportionality throughout thejuvenile justice system.
This document is a research report submitted to the U.S. Department of Justice. This report has not been published by the Department. Opinions or points of view expressed are those of the author(s)
and do not necessarily reflect the official position or policies of the U.S. Department of Justice.
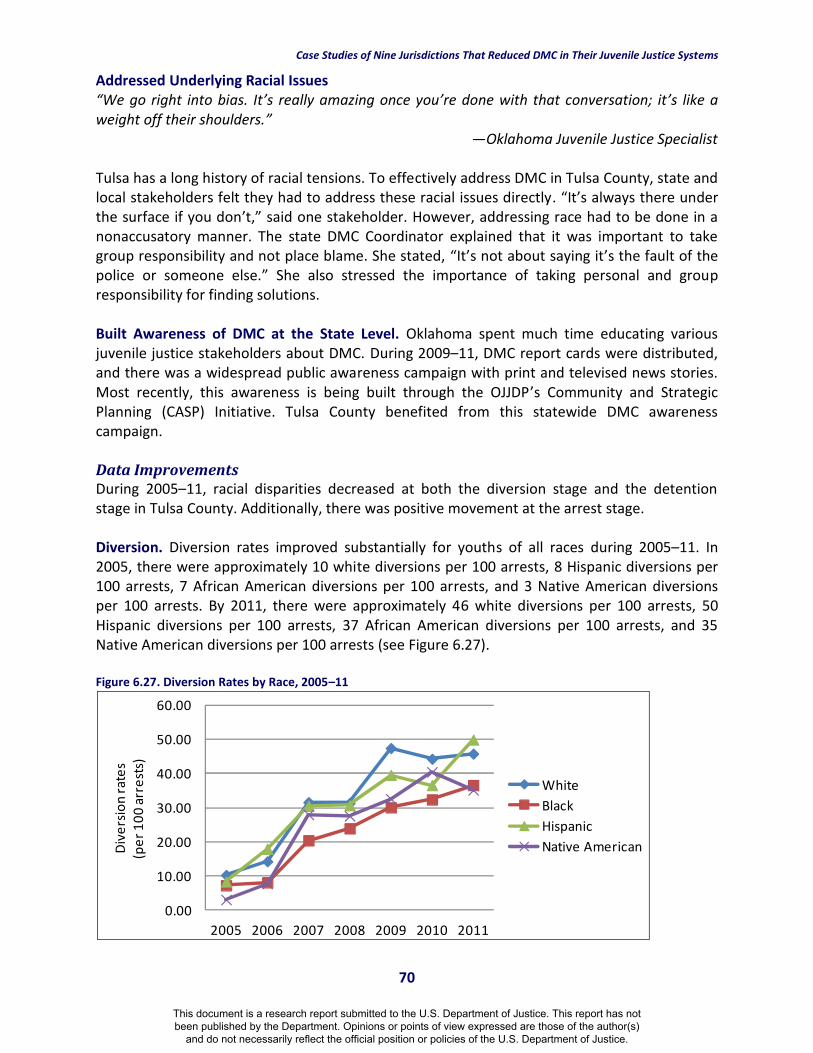
Case Studies of Nine Jurisdictions That Reduced DMC in Their Juvenile Justice Systems
70
Addressed Underlying Racial Issues“We go right into bias. It’s really amazing once you’re done with that conversation; it’s like aweight off their shoulders.”
—Oklahoma Juvenile Justice Specialist
Tulsa has a long history of racial tensions. To effectively address DMC in Tulsa County, state andlocal stakeholders felt they had to address these racial issues directly. “It’s always there underthe surface if you don’t,” said one stakeholder. However, addressing race had to be done in anonaccusatory manner. The state DMC Coordinator explained that it was important to takegroup responsibility and not place blame. She stated, “It’s not about saying it’s the fault of thepolice or someone else.” She also stressed the importance of taking personal and groupresponsibility for finding solutions.
Built Awareness of DMC at the State Level. Oklahoma spent much time educating variousjuvenile justice stakeholders about DMC. During 2009–11, DMC report cards were distributed,and there was a widespread public awareness campaign with print and televised news stories.Most recently, this awareness is being built through the OJJDP’s Community and StrategicPlanning (CASP) Initiative. Tulsa County benefited from this statewide DMC awarenesscampaign.
Data ImprovementsDuring 2005–11, racial disparities decreased at both the diversion stage and the detentionstage in Tulsa County. Additionally, there was positive movement at the arrest stage.
Diversion. Diversion rates improved substantially for youths of all races during 2005–11. In2005, there were approximately 10 white diversions per 100 arrests, 8 Hispanic diversions per100 arrests, 7 African American diversions per 100 arrests, and 3 Native American diversionsper 100 arrests. By 2011, there were approximately 46 white diversions per 100 arrests, 50Hispanic diversions per 100 arrests, 37 African American diversions per 100 arrests, and 35Native American diversions per 100 arrests (see Figure 6.27).
Figure 6.27. Diversion Rates by Race, 2005–11
0.00
10.00
20.00
30.00
40.00
50.00
60.00
2005 2006 2007 2008 2009 2010 2011
Dive
rsio
n ra
tes
(per
100
arre
sts)
WhiteBlackHispanicNative American
This document is a research report submitted to the U.S. Department of Justice. This report has not been published by the Department. Opinions or points of view expressed are those of the author(s)
and do not necessarily reflect the official position or policies of the U.S. Department of Justice.

Case Studies of Nine Jurisdictions That Reduced DMC in Their Juvenile Justice Systems
71
Unfortunately, it is common for the RRI to get worse when rates and numbers improve overall.However, during this time, the RRI at diversion for African American youth also improved alongwith the numbers and rates. By 2011, the RRI for African Americans at diversion was 0.8, whichwas the best RRI value in the past 7 years (see Figure 6.28). Because of smaller numbers ofHispanic and Native American youths, the RRI trends were a bit more unstable, but they areclearly not getting worse.
Figure 6.28. Diversion Rates and RRI: African American
Table 6.15. Tulsa County Diversion Numbers, 2005–11
YearTotal
DiversionsWhite
Diversions
AfricanAmericanDiversions
HispanicDiversions
NativeAmericanDiversions
2005 476 256 167 32 132006 607 301 201 68 312007 1,397 681 479 112 912008 1,463 623 574 142 1042009 1,646 783 543 202 1012010 1,468 622 528 177 1102011 1,562 622 583 223 109
Secure Detention. DMC at secure detention also decreased in addition to the total number ofyouths being sent to secure detention. During 2005–11, the total number of secure detentionsdeclined from 710 to 587, a 17 percent decrease (see Table 6.16). Although the detention rateincreased for white, Hispanic, African American, and Native American youths, this increaseseems to reflect the reduction in referrals to court. Significantly, racial disparities decreased atdetention for African American youths. In 2005 the RRI was 1.4, compared with 1.0 in 2009 (seeFigure 6.29). The RRI increased slightly in 2010 to 1.1. For Native American youth the RRI atdetention was 1.0 in the last 3 years of reliable data (2008, 2009, and 2010) (see Figure 6.31),and for Hispanic youth the RRI at detention was 1.0 in the last 2 years of reliable data (2009 and2010) (see Figure 6.30). According to the DMC Coordinator, the implementation of a CIC for
2005 2006 2007 2008 2009 2010 2011White diversion rate 10.3 14.3 31.6 31.4 47.4 44.3 45.8Black diversion rates 7.3 8.2 20.4 23.9 30.1 32.4 36.6RRI 0.70 0.57 0.65 0.76 0.63 0.73 0.80
0.00
0.10
0.20
0.30
0.40
0.50
0.60
0.70
0.80
0.90
0.05.0
10.015.020.025.030.035.040.045.050.0
Rel
ativ
e R
ate
Inde
x (R
RI)
Div
ersi
on R
ates
(per
100
arr
ests
)
This document is a research report submitted to the U.S. Department of Justice. This report has not been published by the Department. Opinions or points of view expressed are those of the author(s)
and do not necessarily reflect the official position or policies of the U.S. Department of Justice.

Case Studies of Nine Jurisdictions That Reduced DMC in Their Juvenile Justice Systems
72
low-level offenders made a significant impact on the detention rates and largely contributed tothe reductions in DMC at the detention point.
Figure 6.29. Detention Rates and RRI: African Americana
a2011 is not included in this graph because the referral numbers (which are the base for the rates) were collected differently in 2011.
Figure 6.30. Detention Rates and RRI: Hispanica
a2011 is not included in this graph because the referral numbers (which are the base for the rates) were collected differently in 2011.
2005 2006 2007 2008 2009 2010Rate - White 16.5 19.5 20.6 21.2 32.9 34.1Rate- Black 23.5 24.1 24.6 24.9 31.7 37.8RRI Detention 1.4 1.2 1.2 1.2 1.0 1.1
0.0
0.2
0.4
0.6
0.8
1.0
1.2
1.4
1.6
0.0
5.0
10.0
15.0
20.0
25.0
30.0
35.0
40.0
Rel
ativ
e R
ate
Inde
x (R
RI)
Det
entio
n R
ates
(per
100
refe
rral
s)
2005 2006 2007 2008 2009 2010Rate - White 16.5 19.5 20.6 21.2 32.9 34.1Rate- Hispanic 13.1 22.3 24.8 17.8 31.9 34.5RRI Detention 0.8 1.1 1.2 0.8 1.0 1.0
0.0
0.2
0.4
0.6
0.8
1.0
1.2
1.4
0.0
5.0
10.0
15.0
20.0
25.0
30.0
35.0
40.0
Rel
ativ
e R
ate
Inde
x (R
RI)
Det
entio
n R
ates
(per
100
refe
rral
s)
This document is a research report submitted to the U.S. Department of Justice. This report has not been published by the Department. Opinions or points of view expressed are those of the author(s)
and do not necessarily reflect the official position or policies of the U.S. Department of Justice.

Case Studies of Nine Jurisdictions That Reduced DMC in Their Juvenile Justice Systems
73
Figure 6.31. Detention Rates and RRI: Native Americana
a2011 is not included in this graph because the referral numbers (which are the base for the rates) were collected differently in 2011.
Table 6.16. Tulsa County Detention Numbers, 2005–11
YearTotal
DetentionsWhite
Detentions
AfricanAmerican
DetentionsHispanic
Detentions
NativeAmerican
DetentionsOther
Detentions2005 710 252 358 37 58 52006 718 222 403 46 46 12007 724 262 356 51 47 82008 729 236 377 58 50 82009 632 198 298 75 55 62010 615 183 305 79 44 42011 587 179 283 58 59 8
Arrest. Finally, there is a promising trend at the arrest stage in Tulsa County. During 2005–11the total number of juvenile arrests decreased from 5,635 to 3,756, a 33 percent decrease (seeTable 6.17). Additionally, arrest rates decreased for each of the primary racial/ethnic groups.The white arrest rate decreased from 6.1 arrests per 100 youths to 3.5 arrests per 100 youths,the Native American arrest rate decreased from 8.0 to 5.4, the Hispanic arrest rate decreasedfrom 5.8 to 4.8, and the African American arrest rate decreased from 21.9 to 15.1 (see Figure6.32).
2005 2006 2007 2008 2009 2010Rate - White 16.5 19.5 20.6 21.2 32.9 34.1Rate- Native American 18.7 18.5 24.2 20.2 33.3 35.2RRI Detention 1.1 0.9 1.2 1.0 1.0 1.0
0.0
0.2
0.4
0.6
0.8
1.0
1.2
1.4
0.0
5.0
10.0
15.0
20.0
25.0
30.0
35.0
40.0
Rel
ativ
e R
ate
Inde
x (R
RI)
Det
entio
n R
ates
(per
100
refe
rral
s)
This document is a research report submitted to the U.S. Department of Justice. This report has not been published by the Department. Opinions or points of view expressed are those of the author(s)
and do not necessarily reflect the official position or policies of the U.S. Department of Justice.

Case Studies of Nine Jurisdictions That Reduced DMC in Their Juvenile Justice Systems
74
Figure 6.32. Tulsa County Juvenile Arrest Rates, 2005–11
Table 6.17. Tulsa County Arrest Numbers, 2005–11
Year Total Arrests White Arrests
AfricanAmerican
ArrestsHispanicArrests
NativeAmerican
Arrests2005 5,635 2,480 2,296 382 4162006 5,388 2,106 2,461 379 3992007 5,279 2,155 2,346 367 3252008 5,293 1,986 2,400 463 3772009 4,321 1,652 1,806 511 3102010 3,835 1,405 1,631 484 2722011 3,767 1,359 1,594 447 310
ConclusionTulsa County was able to decrease racial disparities at two juvenile justice contact points—diversion and detention—benefiting the county’s largest minority group, African Americanyouth, as well as Hispanic and Native American youth. Tulsa County’s DMC–reduction initiative,which was supported by its state-level DMC Coordinator and Juvenile Justice Specialist,included an emphasis specifically on these two contact points as well as the arrest stage, whichalso shows promise. Tulsa County hired a local DMC Coordinator, formed a local DMC SteeringCommittee, implemented trainings for police, and established a CIC. Each of these keystrategies seems to have contributed to the DMC reductions this county has achieved. Today,Tulsa County is a CASP site and is receiving technical assistance to achieve even more parity.
0.0
5.0
10.0
15.0
20.0
25.0
2005 2006 2007 2008 2009 2010 2011
Arre
st R
ates
(per
100
yout
h) White
African American
American Indian
Hispanic
This document is a research report submitted to the U.S. Department of Justice. This report has not been published by the Department. Opinions or points of view expressed are those of the author(s)
and do not necessarily reflect the official position or policies of the U.S. Department of Justice.

Case Studies of Nine Jurisdictions That Reduced DMC in Their Juvenile Justice Systems
75
Utah County, UtahDisproportionate Minority Contact–Reduction Case Study
The ProblemThe state of Utah knew it wanted to address disproportionate minority contact (DMC) but wasuncertain where to start. Statewide, it was difficult to get buy-in from judges to address thisissue, and at the local level, there was a lack of awareness of what the data were saying. InUtah County, graffiti charges, which disproportionately affected Hispanic youth (the largestminority group), were not eligible for diversion. Diversion officers lacked training, and someofficers perceived their jobs to be more “procedural” than designed to help youth and reducerecidivism. In Utah County in 2007 the arrest relative rate index (RRI) for Hispanic youth was2.8, the referral RRI was 3.2, the diversion RRI value was 0.5, and the detention RRI was 1.4.Racial disparities for African American youths were more pronounced, although smallernumbers made RRI values less reliable.
Juvenile Justice Strategies“We started presenting the RRIs about 8 years ago to the judges. They didn’t like it. Now there isa generalized acceptance of these numbers. Now they will call [the DMC Coordinator] to do apresentation or to get some numbers and background numbers of where we are. [The DMCCoordinator] really became a resource for the courts.”
—Utah Juvenile Justice Specialist
Utah was interested in addressing DMC and started the process by bringing a technicalassistance provider to the state to review all of its data and assist in developing a DMC–reduction strategy. Given what the data showed, state-level decision-makers decided toconcentrate on reducing DMC at the diversion stagewith special attention on three counties, includingUtah County. The state also hired a DMCCoordinator, focused on improving data collection,developed a training curriculum for police cadets towork better with diverse communities, andincreased awareness of DMC statewide. In UtahCounty, a local DMC working group was formed,changes were made to certain diversion eligibilityrequirements and other procedures, diversionofficers began to see their role differently, and therewas an increased use of receiving centers.
State-Level Collaboration and Data-Driven Decisions. In 2008, juvenile justice decision-makersand staff at the state level began to look at their data to see where disparity was the greatestand where they could make a difference. They received technical assistance from BillFeyerherm through the federal Office of Juvenile Justice and Delinquency Prevention to addressDMC in the state. Dr. Feyerherm reviewed all of the available juvenile justice data and helped
*2012 data.†2011 data.
Utah County, Utah, the second-largest county inthe state, is home to more than 530,000 residents,including 185,544 children and youth under age18. The third- and fifth-largest cities in Utah—Provo and Orem—are located in Utah County. Inthe past 10 years, the under-18 population hasincreased by 39 percent. The youths between theages of 10 and 17 are 83 percent white, 13percent Hispanic, 2 percent Asian American, 1percent African American, and 1 percent NativeAmerican (Puzzanchera, Sladky, and Kang 2013).*Approximately 13 percent of the children under 18in Utah County live in poverty (U.S. CensusBureau 2012).†
This document is a research report submitted to the U.S. Department of Justice. This report has not been published by the Department. Opinions or points of view expressed are those of the author(s)
and do not necessarily reflect the official position or policies of the U.S. Department of Justice.

Case Studies of Nine Jurisdictions That Reduced DMC in Their Juvenile Justice Systems
76
state-level decision-makers identify where DMC was evident and decide where to targetinterventions to make positive changes in the RRI. During this time, a working group wasformed from the state DMC Subcommittee to review and revise data definitions to align withthe federal database collection system. For the DMC Subcommittee to address DMC, it realizedthat it had to build political capital by generating collaboration among stakeholders and showchanges through movement of RRI. To do this, the state of Utah decided to concentrateprimarily on diversion and then engaged local decision-makers, such as judges and chiefprobation officers, to design and implement initiatives to reduce racial disparities in their ownjurisdictions. Utah also developed a strategy for increasing awareness of DMC across the stateand hired a state DMC Coordinator. As all this was happening, there were individuals instatewide leadership positions who understood the importance of addressing DMC, whichhelped the effort gain momentum at the state level. For example, the current director of Utah’sDivision of Juvenile Justice Services was the former Juvenile Justice Specialist, and there arenumerous members of the State Advisory Group (SAG) and DMC Subcommittee in leadershippositions.
Built Awareness of the Data and Engaged Decision-Makers at the Local Level“I presented the data to local leaders, and they didn’t buy in to it. They questioned the data. Ihad to go back and redraw the plan. Next time I showed them where the data came from andcame to the meeting with a data analyst from the court. At this second meeting, theyunderstood where the data came from. Rather than focus on data, they started mapping thecourt process to find gaps and areas for improvement.”
—State DMC Coordinator
The DMC Coordinator and the Juvenile Justice Specialist worked strategically to engagestakeholders in DMC–reduction work. In the beginning, they would present data in largestatewide meetings, but unfortunately, if there were one or two judges who were skeptical orwho spoke loudly against addressing racial disparities, the whole presentation was derailed.The Juvenile Justice Specialist and the DMC Coordinator realized they needed to changestrategies. The work had to focus on specific points—things that could be controlled—and ithad to be done at the local level. They began to go to smaller bench meetings and presentedthe RRI data in small, regional groups. This approach also improved relationships between theexecutive branch and the judicial branch and made the focus more local. Allies were developedthis way.
The Juvenile Justice Specialist and the DMC Coordinator spent much time in Utah Countypresenting the data and building an understanding of DMC. The DMC Coordinator workedclosely with court staff members to develop a strategy and begin to get buy-in. An informallocal DMC working group was formed, which was chaired by the chief probation officer in theFourth District Juvenile Court in Utah County, who was also on the statewide DMC Committee.Other members of the informal working group included the trial court executive, the diversionsupervisor, and diversion staff. The working group came together to brainstorm what could becausing the racial disparities at diversion and to develop effective strategies. The group had noclear answers but was able to identify areas it wanted to address that could make a difference.
This document is a research report submitted to the U.S. Department of Justice. This report has not been published by the Department. Opinions or points of view expressed are those of the author(s)
and do not necessarily reflect the official position or policies of the U.S. Department of Justice.
Case Studies of Nine Jurisdictions That Reduced DMC in Their Juvenile Justice Systems
77
Changed Diversion Eligibility. In 2007, graffiti charges did not qualify for diversion in UtahCounty. Given that this charge disproportionately affected Hispanic youth, this eligibilityexclusion was contributing to DMC. In each jurisdiction in Utah, the judges had a certainamount of sway in what qualified for diversion. During 2007–08, Utah County judges expandeddiversion eligibility to include graffiti.* Additionally, at the time, for a property offense to qualifyfor diversion, the damage done had to be less than $100. However, the legislature increasedthat amount to $250 but did not legislate restitution. As a result, there was more flexibility toresolve a graffiti case through a nonjudicial agreement; thus, more youths with graffiti chargesbecame eligible for diversion.
Changed Diversion Officer Philosophy. When diversion officers were made aware of the racialdisparities in diversion, many of them were alarmed, and some took it personally—for theywere working hard to treat all referrals equally and were governed by the diversion criteria.Before this time, officers were more procedural in petitioning noncompliant diversion cases.However, around 2007 or ’08, as DMC awareness was building, the diversion officers were newand they became more engaged in their work to help youths fulfill their diversion obligationsand avoid recidivism. Overall, the officers became more concerned with keeping low-riskoffenders out of the system. According to the chief probation officer at the Fourth DistrictCourt, the diversion officers today are more social-work oriented (and less law-enforcementoriented). When youths miss deadlines the officers actively try to help them meet theirrequirements (instead of initiating a formal response).
Increased Use of Receiving Centers. Across Utah, receiving centers have been established foryouths after an arrest. Instead of going to secure care at arrest, police officers can takejuveniles to receiving centers to be processed and wait for a parent or guardian to pick themup. There, the juveniles speak with a diversion officer. If the youth admits to the allegation, heor she can have a nonjudicial closure. This process keeps many youths out of secure detentionwhile awaiting court decisions. It also increases the number of diversions and reduces referrals(since they will be treated as diversions). During 2007–11 in Utah County, there was an increasein the use of receiving centers as diversions for youth, even as the number of arrests decreased.During this time, the number of youths served in receiving centers increased from 265 to 390, a47 percent increase. The number of white youths served by receiving centers increased by 31percent, while the number of Hispanic youths served by receiving centers increased by 56percent.
Small Changes. While brainstorming how to improve the system to reduce DMC, Utah Countydecision-makers realized that some small changes to procedures could perhaps make adifference. First, they came to the conclusion that the letters sent to parents of youths beingreferred to court could be improved. They had always thought the letters were fine, but atsecond glance it seemed as if the language was difficult to understand, included too much legaljargon, and was heavy handed. During 2008–09, they simplified the letters and used lay terms.Additionally, they made the letter double-sided with English on the front and Spanish on theback; previously, there was a phone number to call to obtain the translated version. They also
*Youths with graffiti charges still had to go through a slightly different court process, but they were eligible to beconsidered for diversion.
This document is a research report submitted to the U.S. Department of Justice. This report has not been published by the Department. Opinions or points of view expressed are those of the author(s)
and do not necessarily reflect the official position or policies of the U.S. Department of Justice.

Case Studies of Nine Jurisdictions That Reduced DMC in Their Juvenile Justice Systems
78
changed the structure of the class offered to youths and their parents after referral to court.Before 2007, youths and their families would listen to a PowerPoint presentation that describeddifferent crimes and their consequences. Juvenile court officials realized that the presentationneeded to be more engaging and shorter. Today the class includes 30–45 minutes of instructionand another 15 minutes for families and youths to meet individually with diversion officers tohave their questions answered and decide on a diversion agreement (e.g., a fine, counseling, areferral to another program). Additionally, they used to offer the class once per month inSpanish for Spanish speakers. Today, they welcome Spanish speakers at any of the offeredsessions and have interpreters available. Finally, the officers giving the class are more social-work oriented, whereas before they were more law-enforcement oriented. This helped makethe class more engaging and a more welcoming experience for the youths and their families.
In addition to focusing on DMC reduction at diversion, there was much work done to buildgeneral awareness of DMC across the state. Further, there was a curriculum developed forpolice officers on working with diverse communities.
Building Awareness of DMC in General at the Statewide Level. Increasing awareness of DMCissues among professional communities, including juvenile court judges, trail court executives,probation chiefs, and law enforcement agencies was an explicit goal of the Utah Board ofJuvenile Justice. Statewide, the Utah Juvenile Justice Specialist and the DMC Coordinator spentmuch time building awareness of DMC. For example, in 2010 they conducted a 2-day DMCtraining to develop a comprehensive DMC assessment plan. Attendees included DMCSubcommittee members, SAG members, University of Utah Criminal Justice Center researchers,representatives from the Administrative Office of the Court, and leaders from juvenile justice inSalt Lake, Utah, and Weber Counties. In 2010, they worked with 14 organizations andstakeholders to build awareness of DMC, reaching 220 community members and professionals(Utah Board of Juvenile Justice 2011).
Implemented Police Officer Training. In 2009 the Utah Board of Juvenile Justice developed andsubmitted a Community Relations Curriculum to train new cadets. The board also developedminority youth scenarios to be part of the training. The curriculum’s goal was to provide officerswith tools to effectively protect, communicate, and partner with the diverse communities theyserve. The Community Relations Curriculum was submitted and approved for permanent useeffective July 1, 2010. By 2011, there were 15 Training of Trainer for Satellite sites, and 84 newlaw enforcement officers, 40 corrections officers, and 114 civilians were trained in thecurriculum (Utah Board of Juvenile Justice 2011).
Improvements in the Data“It all boils downs to relationships and having the data to back up your work.”
—Utah DMC Coordinator
Between 2007 and 2010, Utah County’s data have shown improvements at four contact points:arrest, referral to court, diversion, and secure detention.
Arrest. From 2007 to 2010 the total number of arrests in Utah County decreased by 19 percent,with the decreases for African American and Hispanic youths being greater than for white
This document is a research report submitted to the U.S. Department of Justice. This report has not been published by the Department. Opinions or points of view expressed are those of the author(s)
and do not necessarily reflect the official position or policies of the U.S. Department of Justice.

Case Studies of Nine Jurisdictions That Reduced DMC in Their Juvenile Justice Systems
79
youths (see Table 6.18). This decrease in arrests is even more notable given that during thistime there was a 21 percent increase in total youth population. Arrest rates also declined forwhite, African American, and Hispanic youths. The arrest rate for white youths declined from 7arrests per 100 youths to 5 arrests per 100 youths; the Hispanic arrest rates declined from 19arrests per 100 youths to 11 arrests per 100 youths; and the African American arrest ratedeclined from 39 arrests per 100 youths to 17 arrests per 100 youths (see Figures 6.33 and6.34). Because the arrest rates for African American and Hispanic youths declined more thanthe rates for white youths, the RRI improved for both minority groups. The African AmericanRRI at arrest declined from 5.7 in 2007 to 3.6 in 2010, and the Hispanic RRI at arrest declinedfrom 2.8 to 2.2.
Figure 6.33. Arrest Rates and RRI: Hispanic
Figure 6.34. Arrest Rates and RRI: African American
2007 2008 2009 2010WhiteArrestRate 6.8 6.5 5.2 4.8HispanicArrestRate 19.4 16.6 14.3 10.8RRIHispanicArrest 2.8 2.6 2.8 2.2
0.0
0.5
1.0
1.5
2.0
2.5
3.0
0.0
5.0
10.0
15.0
20.0
25.0
Rel
ativ
e R
ate
Inde
x (R
RI)
Arre
st R
ates
(per
100
you
th)
2007 2008 2009 2010WhiteArrestRate 6.8 6.5 5.2 4.8BlackArrestRate 39.1 35.6 23.4 17.3RRIBlackArrest 5.7 5.5 4.5 3.6
0.0
1.0
2.0
3.0
4.0
5.0
6.0
7.0
0.05.0
10.015.020.025.030.035.040.045.0
Rel
ativ
e R
ate
Inde
x (R
RI)
Arre
st R
ates
(per
100
you
th)
This document is a research report submitted to the U.S. Department of Justice. This report has not been published by the Department. Opinions or points of view expressed are those of the author(s)
and do not necessarily reflect the official position or policies of the U.S. Department of Justice.

Case Studies of Nine Jurisdictions That Reduced DMC in Their Juvenile Justice Systems
80
Table 6.18. Utah County Arrest Numbers, 2007–10
Year Total Arrests White ArrestsAfrican American
Arrests Hispanic Arrests2007 4,958 3,444 171 1,1972008 5,007 3,536 177 1,1492009 4,347 3,011 124 1,0622010 4,005 2,912 97 846
Referral to Court. Referral numbers, referral rates, and racial disparities for Hispanic youthsalso declined during 2007–10. The total number of referrals to court decreased from 5,336 to4,379, which is an 18 percent decrease (see Table 6.19). The white referral rate decreased from7 referrals per 100 youths in the general population in 2007 to 5 referrals per 100 youths in2010. The Hispanic rate decreased from 23 referrals per 100 youths in 2007 to 12 referrals per100 youths in 2010. The RRI for Hispanic youths decreased steadily from 3.2 to 2.6 to 2.3 (seeTable 6.35). Referral rates for African American youths have also decreased, and the RRI hasimproved, although the numbers are small and should be interpreted with caution.
Figure 6.35. Referral Rates and RRI: Hispanic
2007 2008 2009 2010Rate - White 7.3 6.1 5.8 5.2Rate- Hispanic 23.1 16.0 13.5 12.2RRI-Referral 3.2 2.6 2.3 2.3
0.0
0.5
1.0
1.5
2.0
2.5
3.0
3.5
0.0
5.0
10.0
15.0
20.0
25.0
Rel
ativ
e R
ate
Inde
x (R
RI)
Ref
erra
l Rat
es (p
er 1
00 y
outh
)
This document is a research report submitted to the U.S. Department of Justice. This report has not been published by the Department. Opinions or points of view expressed are those of the author(s)
and do not necessarily reflect the official position or policies of the U.S. Department of Justice.

Case Studies of Nine Jurisdictions That Reduced DMC in Their Juvenile Justice Systems
81
Figure 6.36. Referral Rates and RRI: African American
Table 6.19. Utah County Referral Numbers, 2007–10
YearTotal
ReferralsWhite
Referrals
AfricanAmericanReferrals
HispanicReferrals
Native AmericanReferrals
Pacific IslanderReferrals
2007 5,336 3,676 72 1,432 52 702008 4,680 3,327 77 1,107 40 882009 4,610 3,365 65 1,003 42 842010 4,379 3,171 57 957 65 72
Diversion. Decreasing DMC at diversion was an explicit goal statewide in Utah, andimprovements were certainly made in Utah County. During 2007–10, diversion rates improvedfor both Hispanic and white youths. Diversion rates for white youths increased from 34diversions per 100 arrests in 2007 to 38 diversions per 100 arrests in 2010. The diversion ratefor Hispanic youths increased from 20 diversions per 100 arrests in 2007 to 35 diversions per100 arrests in 2010. These diversion rate changes led to improvements in the RRI for Hispanicyouth, which went from 0.59 in 2007 to 0.91 in 2010 (see Figure 6.37).
Figure 6.37. Diversion Rates and RRI: Hispanic
2007 2008 2009 2010Rate - White 7.3 6.1 5.8 5.2Rate- Black 16.5 15.5 12.2 10.1RRI-Referral 2.3 2.5 2.1 1.9
0.0
0.5
1.0
1.5
2.0
2.5
3.0
0.02.04.06.08.0
10.012.014.016.018.0
Rel
ativ
e R
ate
Inde
x (R
RI)
Ref
erra
l Rat
es (p
er 1
00 y
outh
)
2007 2008 2009 2010white 34.3 27.6 37.0 38.2hispanic 20.3 17.9 24.8 34.6RRI 0.59 0.65 0.67 0.91
0.000.100.200.300.400.500.600.700.800.901.00
0.05.0
10.015.020.025.030.035.040.045.0
Rel
ativ
e R
ate
Inde
x (R
RI)
Div
ersi
on R
ates
(per
100
arr
ests
)
This document is a research report submitted to the U.S. Department of Justice. This report has not been published by the Department. Opinions or points of view expressed are those of the author(s)
and do not necessarily reflect the official position or policies of the U.S. Department of Justice.

Case Studies of Nine Jurisdictions That Reduced DMC in Their Juvenile Justice Systems
82
Table 6.20. Utah County Diversion Numbers, 2007–10
YearTotal
DiversionsWhite
Diversions
AfricanAmericanDiversions
HispanicDiversions
Native AmericanDiversions
2007 1,468 1,183 9 243 72008 1,233 976 19 206 n/a2009 1,436 1,113 11 263 132010 1,483 1,111 19 293 13
Secure Detention. Utah County’s detention RRIs also look promising, having declined forHispanic youth from 1.4 in 2007 to 1.1 in 2009 and 2010 (see Figure 6.38).
Figure 6.38. Detention Rates and RRI: Hispanic
Table 6.21. Utah County Detention Numbers, 2007–10
YearTotal
DetentionsWhite
Detentions
AfricanAmerican
DetentionsHispanic
DetentionsNative American
Detentions2007 1,148 701 27 374 152008 1,045 693 17 304 132009 956 668 22 228 82010 985 686 26 228 24
ConclusionUtah County was able to reduce racial disparities at four juvenile justice stages—arrest, referralto court, diversion, and detention—for its largest minority group, Hispanic youth. The local DMCstrategy was to work collaboratively to address the issue, increase access to receiving centersafter arrest, change policies and procedures at diversion, make the juvenile justice system moreunderstandable and welcoming for referred juveniles and their families, and improve thediversion officer’s role. Statewide, the Juvenile Justice Specialist, the DMC Coordinator, and theSAG used data, the help of a technical assistance provider, and persistence to engage juvenilejustice decision-makers in addressing DMC. They also developed a training for police officers.
2007 2008 2009 2010Rate - White 19.1 20.8 19.9 21.6Rate- Hispanic 26.1 27.5 22.7 23.8RRI Detention 1.4 1.3 1.1 1.1
0.0
0.2
0.4
0.6
0.8
1.0
1.2
1.4
1.6
0.0
5.0
10.0
15.0
20.0
25.0
30.0
Rel
ativ
e R
ate
Inde
x (R
RI)
Det
entio
n R
ates
(per
100
refe
rral
s)
This document is a research report submitted to the U.S. Department of Justice. This report has not been published by the Department. Opinions or points of view expressed are those of the author(s)
and do not necessarily reflect the official position or policies of the U.S. Department of Justice.

Case Studies of Nine Jurisdictions That Reduced DMC in Their Juvenile Justice Systems
83
Utah County and the state of Utah continue to invest in DMC reduction. For example, in 2010,Formula Grant funding supported the use of evidence-based prevention programs for high-risk,gang-involved youth in Provo, Utah County’s largest city. These targeted youths participated inthe Strengthening Families program, which in its first year showed reductions in antisocialattitudes and gang activity (Utah Board of Juvenile Justice 2011). In 2011, Utah was selected bythe Office of Juvenile Justice and Delinquency Prevention to become a Community andStrategic Planning Initiative site to strengthen its state and local DMC initiatives. In 2012 aformal DMC working group was formed and it is now chaired by the chief probation officer inthe Fourth District Juvenile Court in Utah County. It includes representatives from the localuniversity, an afterschool specialist, a gang specialist, and local law enforcement. Somemembers of the statewide DMC committee who live in Utah County also attend this group.Finally, in September 2012, the Utah Criminal Justice Center at the University of Utah publisheda DMC assessment study for the state of Utah looking specifically at arrests and referrals tocourt.
This document is a research report submitted to the U.S. Department of Justice. This report has not been published by the Department. Opinions or points of view expressed are those of the author(s)
and do not necessarily reflect the official position or policies of the U.S. Department of Justice.
Case Studies of Nine Jurisdictions That Reduced DMC in Their Juvenile Justice Systems
84
7.CONCLUSION
HE PURPOSE OF THIS REPORT was to identify jurisdictions that have been able to reduce racialdisparities at one or more points in their juvenile justice systems for African American,Hispanic, or Native American youth and to document and share their disproportionate
minority contact (DMC)–reduction strategies. Since 2002, states have been required to addressDMC in their juvenile justice systems to receive awards from certain federal funding sources.The Office of Juvenile Justice and Delinquency Prevention (OJJDP) has targeted much of itsenergy at addressing DMC, providing funding for DMC Coordinators, organizing Webinars andconferences, providing technical assistance and training, and holding regular conference calls. Itappears that in the nine jurisdictions highlighted in this report the effort is paying off. Asmeasured by the relative rate index (RRI), DMC has been reduced significantly at arrest, referralto court, diversion, secure detention, and secure confinement primarily for African Americanand Hispanic youths, but also for Native American youths.
Key stakeholder interviews and a document review provided detailed information on whatstrategies were used by each of the nine sites. Interestingly, many interviewees pointed tosimilar strategies that they felt were responsible for reducing racial disparities in their systems.Eight of the most common strategies were 1) focusing on data, 2) increasing systemiccollaboration, 3) changing institutional culture, 4) affiliating with national juvenile justicereform initiatives, 5) creating alternatives to formal system involvement, 6) concentratingintentionally on DMC reduction, 7) making use of leadership at the local level, the state level, orboth, and 8) making DMC reduction a long-term priority.
At the same time, more research is needed. Many of the strategies used by the nine case studysites have also been used in sites that have not been successful in reducing DMC. For example,in some jurisdictions, introducing alternatives to formal system involvement has positivelyaffected white youth more than minority youth, thus increasing DMC. In other jurisdictions, toomuch emphasis on data analysis leads to “analysis paralysis,” with no realistic interventionsbeing introduced. Still, many systems point to involvement with a national juvenile justicereform organization as their DMC strategy, but often their RRI values do not improve.
Nevertheless, this report provides important information to anyone concerned with DMC injuvenile justice systems across the United States. As noted in OJJDP’s DMC Technical AssistanceManual, DMC reduction demands sustained efforts (Hsia 2009). As jurisdictions across theUnited States concentrate more on the problems of DMC in their juvenile justice systems, wehope that sustained efforts toward identifying DMC, assessing its contributing mechanisms,implementing intervention strategies, evaluating, and monitoring can make a difference.
T
This document is a research report submitted to the U.S. Department of Justice. This report has not been published by the Department. Opinions or points of view expressed are those of the author(s)
and do not necessarily reflect the official position or policies of the U.S. Department of Justice.

Case Studies of Nine Jurisdictions That Reduced DMC in Their Juvenile Justice Systems
85
REFERENCES
Administrative Office of Courts, Alabama Judicial System, Family Court. N.d. “Juvenile DetentionReform: Alabama’s Success Story.” Accessed Dec. 5, 2013.http://www.alacourt.gov/Sections/FamilyCourt/default.aspx.
Annie E. Casey Foundation. N.d.a. “Juvenile Detention Alternatives Initiative: Core Strategies.”Accessed Dec. 5, 2013.http://www.aecf.org/MajorInitiatives/JuvenileDetentionAlternativesInitiative/CoreStrategies.aspx.
———. N.d.b. “Juvenile Detention Alternatives Initiative: Sites and Contacts.” Accessed Dec. 5,2013.http://www.aecf.org/MajorInitiatives/JuvenileDetentionAlternativesInitiative/SitesAndContacts.aspx.
———. 2008. “JDAI Newsmakers.” Accessed Dec. 5, 2013.http://www.aecf.org/MajorInitiatives/JuvenileDetentionAlternativesInitiative/Resources/Aug08newsletter/JDAINewsmakers.aspx.
———. 2009a. “JDAI Newsmakers.” Accessed Dec. 5, 2013.http://www.aecf.org/MajorInitiatives/JuvenileDetentionAlternativesInitiative/Resources/May0
9newsletter/JDAINewsmakers1.aspx.———. 2009b. “JDAI Site Updates: Clark County Delivers Impressive Results.” Accessed Dec. 5,
2013.http://www.aecf.org/MajorInitiatives/JuvenileDetentionAlternativesInitiative/Resources/May09newsletter/JDAISiteUpdates7.aspx.
———. 2013a. Juvenile Detention Alternatives Initiative Draft 2011 Annual Results Report.Baltimore, Md.
———. 2013b. 2013 KIDS COUNT Databook: State Trends in Child Well-Being. Baltimore, Md.Austin, James, Kelly Dedel Johnson, and Ronald Weitzer. 2005. “Alternatives to the Secure
Detention and Confinement of Juveniles Offenders.” OJJDP Juvenile Justice Bulletin.Washington, D.C.: U.S. Department of Justice, Office of Justice Programs, Office of JuvenileJustice and Delinquency Prevention.
Bachicha, Gerri (Dupree), Juvenile Detention Alternatives Administrator, Bernalillo CountyYouth Services Center. 2013. Interviewed by Elizabeth Spinney. April 3. Phone interview.Washington, D.C.
Bernalillo County, New Mexico. N.d.a. “Children’s Community Mental Health Clinic.” AccessedDec. 5, 2013. http://www.bernco.gov/YSC_CCMHC/.
———. N.d.b. “Community Custody Program.” Accessed Dec. 5, 2013.http://www.bernco.gov/YSC_CCP/.
———. N.d.c. “Youth Reporting Center.” Accessed Dec. 5, 2013. http://www.bernco.gov/youth-reporting-center-4479/.
Bray, Timothy M., Lisa L. Sample, and Kimberly Kempf–Leonard. 2005. “‘Justice by Geography’:Racial Disparity and Juvenile Courts.” In Our Children, Their Children: Confronting Racial andEthnic Differences in American Juvenile Justice. Darnell Felix Hawkins and Kimberly Kempf–Leonard (eds.). Chicago, Ill.: University of Chicago Press.
Broyles, Laura, DMC Specialist, Office of Juvenile Affairs, State of Oklahoma. 2013. Interviewedby Elizabeth Spinney. Oct. 8. Phone interview. Washington, D.C.
This document is a research report submitted to the U.S. Department of Justice. This report has not been published by the Department. Opinions or points of view expressed are those of the author(s)
and do not necessarily reflect the official position or policies of the U.S. Department of Justice.

Case Studies of Nine Jurisdictions That Reduced DMC in Their Juvenile Justice Systems
86
Building Blocks for Youth Initiative. 2005. No Turning Back: Promising Approaches to ReducingRacial and Ethnic Disparities Affecting Youth of Color in the Justice System. Baltimore, Md.:Annie E. Casey Foundation.
Cabaniss, Emily R., James M. Frabutt, Mary H. Kendrick, and Margaret B. Arbuckle. 2007.“Reducing Disproportionate Minority Contact in the Juvenile Justice System: PromisingPractices.” Aggression and Violent Behavior 12:393–401.
Center for Applied Research in Human Development. 2013. School/Police Just.Start Program:Evaluating the Effectiveness of Using Memoranda of Agreement Between Schools and Policeto Reduce Arrests. Storrs, Conn.: University of Connecticut Department of HumanDevelopment and Family Studies.
Center for Children and Youth Justice. N.d. “Mental Health/Juvenile Justice.” Accessed Dec. 5,2013. http://www.ccyj.org/initiatives/mental-health-and-juvenile-justice/.
Chappell, Allison T., Scott R. Maggard, and Jennifer L. Higgins. 2013. “Exceptions to the Rule?Exploring the Use of Overrides in Detention Risk Assessment.” Youth Violence and JuvenileJustice 11(2).
City of Las Vegas Economic and Urban Development Department and Redevelopment Agency.2012. Demographics. Las Vegas, Nev.: City of Las Vegas.http://www.nashuanh.gov/LinkClick.aspx?fileticket=eMvOvoOstGw%3d&tabid=931.
City of Nashua, New Hampshire. N.d.a. “Community Forum on Disproportionate MinorityContact and Juvenile Justice.” Accessed Dec. 5, 2013.http://www.nashuanh.gov/LinkClick.aspx?fileticket=7D5ME%2fKSnps%3d&tabid=931.
———. N.d.b. “History of the Nashua Ethnic Awareness Committee.” Accessed Dec. 5, 2013.http://www.nashuanh.gov/LinkClick.aspx?fileticket=%2b%2f0Fnr526Tc%3d&tabid=931.
———. 2009. “Ethnic Awareness Committee Mission Statement.” Accessed Dec. 5, 2013.Clark County Department of Juvenile Justice Services. 2013. Statistical Report: Calendar Year
2012. Las Vegas, Nev.: Applications, Research & Technology (ART) Unit, Clark CountyDepartment of Juvenile Justice Services.
Clark County, Nev.. N.d.a. “Juvenile Justice Services: Detention.” Accessed Dec. 5, 2013.http://www.clarkcountynv.gov/Depts/jjs/Services/Pages/Detention.aspx.
———. N.d.b. “Juvenile Justice Services: Director.” Accessed Dec. 5, 2013.http://www.clarkcountynv.gov/depts/jjs/Pages/Director.aspx.
———. N.d.c. “Living in Clark County.” Accessed Dec. 5, 2013.http://www.clarkcountynv.gov/residents/Pages/default.aspx.
Coleman, Andrea. 2009. “The Role of State DMC Coordinators.” In Disproportionate MinorityContact Technical Assistance Manual, Fourth Edition. Washington, D.C.: Office of JuvenileJustice and Delinquency Prevention.
Coleman, Andrea R., Angelina Ahrens, Lindsey Draper, William Feyerherm, David Kuker, ValerieLaMotte, Michael Leiber, and Melissa Shetrom. Forthcoming. “2011 DisproportionateMinority Contact Update: National Summary and Five States’ Efforts.”
Community Service Council. N.d. “Disproportionate Minority Contact Reduction Initiative.”Accessed Dec. 5, 2013. http://www.csctulsa.org/content.php?p=105.
Connecticut Juvenile Justice Advisory Committee. 2006. Juvenile Justice Advisory CommitteeAnnual Report to the Governor and General Assembly: July 1, 2005, Through June 30, 2006.Hartford, Conn.: Connecticut Juvenile Justice Advisory Committee.
This document is a research report submitted to the U.S. Department of Justice. This report has not been published by the Department. Opinions or points of view expressed are those of the author(s)
and do not necessarily reflect the official position or policies of the U.S. Department of Justice.

Case Studies of Nine Jurisdictions That Reduced DMC in Their Juvenile Justice Systems
87
———. 2007. Juvenile Justice Advisory Committee Annual Report to the Governor and GeneralAssembly: July 1, 2006, Through June 30, 2007. Hartford, Conn.: Connecticut Juvenile JusticeAdvisory Committee.
———. 2008. Juvenile Justice Advisory Committee Annual Report to the Governor and GeneralAssembly: July 1, 2007, through June 30, 2008. Hartford, Conn.: Connecticut Juvenile JusticeAdvisory Committee.
———. 2010. Juvenile Justice Advisory Committee Annual Report to the Governor and GeneralAssembly: July 1, 2009, through June 30, 2010. Hartford, Conn.: Connecticut Juvenile JusticeAdvisory Committee.
———. 2011. Juvenile Justice Advisory Committee Annual Report to the Governor and GeneralAssembly: July 1, 2010, Through June 30, 2011. Hartford, Conn.: Connecticut Juvenile JusticeAdvisory Committee.
Connecticut Juvenile Justice Alliance. N.d. “Raise the Age Connecticut.” Accessed Dec. 5, 2013.http://www.raisetheagect.org.
Connecticut Office of Policy and Management. 2011. Biennial Report on DisproportionateMinority Contact, Fiscal Years 2010–11. Connecticut Office of Policy and Management.http://www.ct.gov/opm/lib/opm/cjppd/cjjjyd/juststart/DMCBiennialReport123111.pdf.
Connecticut Voices for Children. 2013. “Census Data: Poverty Still Worse in Connecticut Than atBeginning of Recession.” News Release. Accessed Dec. 5, 2013.http://www.ctvoices.org/sites/default/files/econ13acscensusrel.pdf.
Conway, Brian, Juvenile Probation Officer 2, Clark County Department of Juvenile JusticeServices. 2013. Interviewed by Elizabeth Spinney. Aug. 6. Phone interview. Washington, D.C.
Darling, Doris, Juvenile Justice Specialist, New Jersey Juvenile Justice Commission. 2012.Interviewed by Elizabeth Spinney. Nov. 29. Phone interview. Washington, D.C.
Edwards, Eddie, Chair of New Hampshire DMC Committee and former Chief of Enforcement forthe New Hampshire State Liquor Commission. 2013. Interviewed by Elizabeth Spinney. July23. Phone interview. Washington, D.C.
Essex County (N.J.) Prosecutor’s Office. N.d. “Juvenile Justice Unit.” Accessed Dec. 5, 2013.http://www.njecpo.org/juv.htm.
Essex Observer. 2009. “Two Awards for DCAP Johnson.” Newark, N.J.: Essex County Prosecutor’sOffice.
Family Court of Philadelphia. N.d. 2012 Year in Review. Philadelphia, Pa.: Family Court ofPhiladelphia.
First Judicial District of Pennsylvania Court of Common Pleas. N.d. Family Court Division: 2011Year in Review. Philadelphia, Pa.: First Judicial District of Pennsylvania Court of CommonPleas.
Garff, Reg, Juvenile Justice Specialist, Utah Commission of Criminal and Juvenile Justice. 2013.Interviewed by Elizabeth Spinney. July 12. Phone interview. Washington, D.C.
Gies, Stephen, Marcia Cohen, and Francisco Villarruel. 2009. “Intervention.” In DisproportionateMinority Contact Technical Assistance Manual, Fourth Edition. Washington, D.C.: Office ofJuvenile Justice and Delinquency Prevention.
Gillespie, Doug C. 2008. The Safe Village Initiative: Reducing Violent Firearms and Gang-RelatedCrime in West Las Vegas. Las Vegas, Nev.: Las Vegas Metropolitan Police Department.
Guevara, Lori, Denise Herz, and Cassia Spohn. 2006. “Gender and Juvenile Justice Decision-Making: What Role Does Race Play?” Feminist Criminology 1(4):258–82.
This document is a research report submitted to the U.S. Department of Justice. This report has not been published by the Department. Opinions or points of view expressed are those of the author(s)
and do not necessarily reflect the official position or policies of the U.S. Department of Justice.

Case Studies of Nine Jurisdictions That Reduced DMC in Their Juvenile Justice Systems
88
Holman, Barry, and Jason Ziedenberg. 2006. The Dangers of Detention: The Impact ofIncarcerating Youth in Detention and Other Secure Facilities. Washington, D.C.: Justice PolicyInstitute.
Hsia, Heidi. 2009. “Introduction.” In Disproportionate Minority Contact Technical AssistanceManual, Fourth Edition. Washington, D.C.: Office of Juvenile Justice and DelinquencyPrevention.
Hoytt, Eleanor Hinton, Vincent Schiraldi, Brenda V. Smith, and Jason Ziedenberg. 2002.“Pathways to Juvenile Detention Reform: Reducing Racial Disparities in Juvenile Detention.”Pathways to Juvenile Detention Reform Series, Vol. 8. Baltimore, Md.: Annie E. CaseyFoundation.
Humphries, Marc, Manager, Juvenile Detention, Clark County Juvenile Justice Center. 2013.Interviewed by Elizabeth Spinney. May 8. Phone interview. Washington, D.C.
(JDAI) Juvenile Detention Alternatives Initiative. N.d. “About JDAI.” Accessed Dec. 5, 2013.http://www.jdaihelpdesk.org/SitePages/about.aspx.
Johnson, Andrea, former Essex County Deputy Chief Assistant Prosecutor. 2013. Interviewed byElizabeth Spinney. Feb. 25. Phone interview. Washington, D.C.
(JJDPA) Juvenile Justice and Delinquency Prevention Act § 223(a)(3).Juvenile Justice Commission. 2006. “Minority Youth Involvement in the Juvenile Justice
System.” Juvenile Justice Matters 4(1).Kelly, Anna, Juvenile Justice Specialist, Office of Juvenile Affairs, State of Oklahoma. 2013.
Interviewed by Elizabeth Spinney. Jan. 15. Phone interview. Washington, D.C.LaMotte, Valerie, Juvenile Justice Specialist, Connecticut Office of Policy and Management,
Policy Development and Planning Division. 2013. Interviewed by Elizabeth Spinney. July 8and Oct. 11. Phone interviews. Washington, D.C.
LaMotte, Valerie, Kelly Ouellette, Jessica Sanderson, Stephen A. Anderson, Iva Kosutic, JulieGriggs, and Marison Garcia. 2010. “Effective Police Interactions With Youth: A ProgramEvaluation.” Police Quarterly, 13:161–79.
Las Vegas Metropolitan Police Department. 2012. “Safe Village—Before and After.” YouTubevideo, 2:29. Aug. 14, 2012. https://www.youtube.com/watch?v=AUQz0oePKnY.
Lebaron, Jennifer, Director of Local Programs and Services, New Jersey Juvenile JusticeCommission. 2012. Interviewed by Elizabeth Spinney. Nov. 29. Phone interview.Washington, D.C.
Lindahl, Dick, Former Juvenile Justice Specialist, New Mexico. 2013. Interviewed by ElizabethSpinney. July 16. Phone interview. Washington, D.C.
MacArthur Foundation. 2005. “MacArthur Selects Pennsylvania as “Model” State for JuvenileJustice Reform.” Press Release. Accessed Dec. 5, 2013.http://www.macfound.org/press/press-releases/macarthur-foundation-selects-pennsylvania-as-model-state-for-national-juvenile-justice-reform-initiative-november-3-2005/.
Martin, John, Director of Clark County Department of Juvenile Justice Services. 2013.Interviewed by Elizabeth Spinney. May 8. Phone interview. Washington, D.C.
McKitten, Rhonda, Director of Training and Senior Trial Attorney of the Juvenile Unit of theDefender Association of Philadelphia. 2013. Interviewed by Elizabeth Spinney. May 10.Phone interview. Washington, D.C.
Mendel, Richard A. 2013. “Bernalillo County Mental Health Clinic Case Study.” A Guide toJuvenile Justice Reform. Baltimore, Md.: Annie E. Casey Foundation.
This document is a research report submitted to the U.S. Department of Justice. This report has not been published by the Department. Opinions or points of view expressed are those of the author(s)
and do not necessarily reflect the official position or policies of the U.S. Department of Justice.

Case Studies of Nine Jurisdictions That Reduced DMC in Their Juvenile Justice Systems
89
Models for Change. N.d.a. “Disproportionate Minority Contact (DMC) Action Network.”Accessed Feb. 21, 2014.http://www.modelsforchange.net/about/Action-networks/Disproportionate-minority-contact.html
———. N.d.b. “Local Sites and Partners: Pennsylvania.” Accessed Dec. 5, 2013.http://www.modelsforchange.net/about/Action-networks/Disproportionate-minority-contact/Local-sites-and-partners.html#pa.
———. N.d.c. “Racial–Ethnic Fairness/DMC.” Accessed Dec. 5, 2013.http://www.modelsforchange.net/reform-areas/racial-ethnic-fairness/index.html
———. 2011. “Knowledge Brief: Are Minority Youths Treated Differently in Probation?”Chicago, Ill.: John D. and Catherine T. MacArthur Foundation.
Morris, Rebecca. Executive Director at Second Chance Alternative Public High School. 2013.Interviewed by Elizabeth Spinney. Feb. 7. Phone interview. Washington, D.C.
(NCJFCJ) National Council of Juvenile and Family Court Judges. N.d. Juvenile GraduatedSanctions E-Tool: Effective Program Services and Models Associated with the Five GraduatedSanction and Intervention Levels for Juvenile Justice. Accessed Dec. 5, 2013.http://www.ncjfcj.org/our-work/juvenile-graduated-sanctions-e-tool.
Nellis, Ashley M. 2005. Seven Steps to Develop and Evaluate Strategies to ReduceDisproportionate Minority Contact. Juvenile Justice Evaluation Center Guidebook Series.Washington, D.C.: Juvenile Justice Evaluation Center.
New Jersey Courts. N.d.a. “Essex Family Division, Juvenile Services Unit.” Accessed Dec. 5, 2013.http://www.judiciary.state.nj.us/essex/family/juvservices.htm#programs.
———. N.d.b. “Juvenile Conference Committees.” Accessed Dec. 5, 2013.http://www.judiciary.state.nj.us/volunteer/vs_jcc.htm.
New Jersey Juvenile Detention Alternatives Initiative. N.d. “Innovation, Improvement, orInstitutionalization of Policy/Practice: Model Activities.” New Jersey Juvenile DetentionAlternatives Initiative.
New Jersey Juvenile Justice Commission. N.d. The New Jersey 2012–14 Comprehensive 3-YearPlan. New Jersey Juvenile Justice Commission.
New Mexico Juvenile Justice Advisory Committee. 2013. Title II Formula Grant ProgramComprehensive 3-Year Plan. Santa Fe, N.M.: New Mexico Juvenile Justice AdvisoryCommittee.
Nguyen, Cuong, DMC Coordinator, Utah Commission of Criminal and Juvenile Justice. 2013.Interviewed by Elizabeth Spinney. July 18. Phone interview. Washington, D.C.
(NTTAC) National Training and Technical Assistance Center. N.d. “Community and StrategicPlanning (CASP) Initiative.” Accessed Dec. 5, 2013.https://www.nttac.org/index.cfm?event=dmc.Overview.
Office of the Attorney General, State of New Jersey. N.d. “Juvenile Detention AlternativesInitiative.” Accessed Dec. 5, 2013.
———. 2005a. Attorney General Guidelines for Stationhouse Adjustment of JuvenileDelinquency Offenses. Trenton, N.J.
———. 2005b. “Attorney General Peter C. Harvey Announces Mandatory StationhouseAdjustment of Juvenile Delinquency Offenses to New Jersey Law Enforcement Agencies.”Press Release. Accessed Dec. 5, 2013.http://www.nj.gov/lps/newsreleases05/pr20051207a.html.http://www.nj.gov/lps/jjc/localized_programs_jdai.html.
This document is a research report submitted to the U.S. Department of Justice. This report has not been published by the Department. Opinions or points of view expressed are those of the author(s)
and do not necessarily reflect the official position or policies of the U.S. Department of Justice.

Case Studies of Nine Jurisdictions That Reduced DMC in Their Juvenile Justice Systems
90
———. 2008. Attorney General Guidelines for Stationhouse Adjustment of Juvenile DelinquencyOffenses. (Law Enforcement Directive No. 2008–2).
(OJJDP) Office of Juvenile Justice and Delinquency Prevention. 2009. Disproportionate MinorityContact Technical Assistance Manual, Fourth Edition. Washington, D.C.: Office of JuvenileJustice and Delinquency Prevention.
———. 2013. Field Innovations: Learning From Local Solutions to Support Prevention andIntervention Strategies. Accessed Dec. 5, 2013. http://www.juvenilejustice-tta.org/field-innovations-OK.
———. N.d.a. “Bernalillo.” DMC–Reduction Best Practices Database. Accessed Dec. 5, 2013.http://www2.dsgonline.com/dmc/dmcCountyDetail.aspx.
———. N.d.b. “The Movement Toward Graduated Sanctions.” In Juvenile Justice ReformInitiatives in the States 1994–96. Washington, D.C.: U.S. Department of Justice, Office ofJustice Programs, Office of Juvenile Justice and Delinquency Prevention.
———. N.d.c. “State Advisory Groups, State Planning Agencies, and Juvenile Justice Specialists.”FY 2003 Drug-Free Communities Support Program. Accessed Dec. 5, 2013.http://www.ojjdp.gov/dfcsgrant/StateAdvisorGrps.pdf.
Oklahoma Department of Juvenile Justice, Office of Juvenile Affairs. 2012. 2012 Three-YearPlan. Oklahoma Department of Juvenile Justice, Office of Juvenile Affairs.
Oler, Jerry, Chief Probation Officer, Fourth District Juvenile Court. 2013. Interviewed byElizabeth Spinney. Aug. 2. Phone interview. Washington, D.C.
Parker, Kelly Jo, Chief Juvenile Probation Officer, Bernalillo County. 2013. Interviewed byElizabeth Spinney. Oct. 18. Phone interview. Washington, D.C.
(PCCD) Pennsylvania Commission on Crime and Delinquency DMC Subcommittee’s PhiladelphiaWorking Group. 2009. “Philadelphia Minority Youth-Law Enforcement Police AcademyCurriculum: Law Enforcement Solutions for Reducing Racial Disparities and DisproportionateMinority Contact in Juvenile Justice.” Presented at Federal Advisory Committee on JuvenileJustice Fall Meeting, Austin, Texas. http://www.facjj.org/docs/October2009/Phili-%20Curriculum.pdf.
Pew Charitable Trusts’ Philadelphia Research Initiative. 2011. Philadelphia 2011: The State ofthe City. Philadelphia, Pa. Pew Charitable Trusts.
Puzzanchera, Charles, Anthony Sladky, and Wei Kang. 2012. Easy Access to Juvenile Populations:1990–2011. Accessed Dec. 5, 2013. http://www.ojjdp.gov/ojstatbb/ezapop/.
———. 2013. Easy Access to Juvenile Populations: 1990–2012. Accessed Dec. 5, 2013.http://www.ojjdp.gov/ojstatbb/ezapop/.
Raise the Age CT. N.d. http://www.raisetheagect.org/Randolph, James, Former Deputy Commissioner for Juvenile Justice Services, Philadelphia
Department of Human Services. 2013. Interviewed by Elizabeth Spinney. Feb. 14. Phoneinterview. Washington, D.C.
Randolph, Susan and William Lott. 2009. “What Drives Income Inequality Among Connecticut’sFamilies?” The Connecticut Economy.
Rasmussen, Kathleen, Alabama Juvenile Justice Specialist and DMC Coordinator. 2013.Interviewed by Elizabeth Spinney. Jan. 22. Phone interview. Washington, D.C.
Richetelli, Dorinda, M., Eliot C. Hartstone, and Kerri L. Murphy. 2009. A Second Reassessment ofDisproportionate Minority Contact in Connecticut’s Juvenile Justice System. Avon, Conn.:Spectrum Associates Market Research.
This document is a research report submitted to the U.S. Department of Justice. This report has not been published by the Department. Opinions or points of view expressed are those of the author(s)
and do not necessarily reflect the official position or policies of the U.S. Department of Justice.

Case Studies of Nine Jurisdictions That Reduced DMC in Their Juvenile Justice Systems
91
Sanderson, Jessica, Iva Kosutic, Julie Griggs, and Stephen A. Anderson. 2008. Effective PoliceInteractions With Youth: Training Evaluation. Storrs, Conn.: University of Connecticut Centerfor Applied Research in Human Development.
Sickmund, Melissa M., Anthony Sladky, Wei Kang, and Charles Puzzanchera. 2011. Easy Accessto the Census of Juveniles in Residential Placement. Pittsburgh, Pa.: National Center forJuvenile Justice. Accessed Dec. 5, 2013. http://www.ojjdp.gov/ojstatbb/ezacjrp/.
Smith, Andrew C., DMC Coordinator, Division of Juvenile Justice Services, Sununu YouthServices Center. 2013. Interviewed by Elizabeth Spinney. June 18. Phone interview.Washington, D.C.
State of Connecticut. N.d. 2009–11 Three-Year Comprehensive Plan. State of Connecticut.———. 2011. “Substitute House Bill No. 6634, Public Act No. 11–154: An Act Concerning
Detention of Children and Disproportionate Minority Contact in the Juvenile JusticeSystem.” State of Connecticut.
State of Connecticut Office of Policy and Management. N.d. “Juvenile Justice and YouthDevelopment.” Accessed Dec. 5, 2013.http://www.ct.gov/opm/cwp/view.asp?a=2974&q=383636.
State Education Resource Center. 2011. Equity in Education: A Transformational Approach.Middletown, Conn.: State Education Resource Center.
State of New Jersey Governor’s Juvenile Justice and Delinquency Prevention Committee. N.d.2007–08 Annual Report. State of New Jersey Governor’s Juvenile Justice and DelinquencyPrevention Committee.
Steinhart, David. 2001. “Special Detention Cases: Strategies for Handling Difficult Populations.”Pathways to Juvenile Detention Reform 9. Baltimore, Md.: Annie E. Casey Foundation.
Swisstack, Thomas E. 2010. Fourth Quarter and Fiscal Year 09/10 Detention Report. BernalilloCounty, N.M.: Bernalillo County Youth Services Center.
Swisstack, Thomas E., Douglas E. Mitchell, and Cynthia Lebya. 2011. Smaller, Smarter and MoreStrategic: Juvenile Justice Reform in Bernalillo County. Bernalillo County, N.M.: BernalilloCounty Youth Services Center.
Troiano, James, Essex County Family Court. 2013. Interviewed by Rachel Stephenson. Feb. 19.Phone interview. Washington, D.C.
U.S. Census Bureau. 2012. “Under Age 18 in Poverty.” Small Area Income and PovertyEstimates. 2011 Data. Accessed Dec. 5, 2013.http://www.census.gov/did/www/saipe/data/interactive/#.
Utah Board of Juvenile Justice. N.d.a. 2012–14 Multiyear Formula Grant Application: 3-YearComprehensive Juvenile Justice and Delinquency Prevention Plan. Salt Lake City, Utah: UtahCommission on Criminal and Juvenile Justice.
———. N.d.b. “DMC Accomplishments.” Accessed Dec. 5, 2013.http://www.juvenile.utah.gov/ubjj_dmc_highlights.html
———. 2011. Utah Board of Juvenile Justice 2011 Annual Report. Salt Lake City, Utah: UtahCommission on Criminal and Juvenile Justice.
W. Haywood Burns Institute for Juvenile Justice Fairness and Equity. N.d. “What Is RED?”Accessed Dec. 5, 2013. http://www.burnsinstitute.org/article.php?id=59.
Wise, Beverly, Senior Probation Supervisor and JDAI Site Coordinator. 2013. Interviewed byElizabeth Spinney. April 4. Phone interview. Washington, D.C.
Youth Services of Tulsa. N.d. “CIC.” Accessed Dec. 5, 2013. http://www.yst.org/yst/CIC2.asp.
This document is a research report submitted to the U.S. Department of Justice. This report has not been published by the Department. Opinions or points of view expressed are those of the author(s)
and do not necessarily reflect the official position or policies of the U.S. Department of Justice.