case studies on implementing low‐cost modifications … · – bnr (biological nutrient removal):...
TRANSCRIPT

1
Case Studies on Implementing Low‐Cost Modifications to Improve Nutrient
Reduction at Wastewater Treatment PlantsWebcast sponsored by EPA’s Watershed Academy
Instructors:
• Dr. Ellen Gilinsky, Senior Policy Advisor, Office of Water, U.S. Environmental Protection Agency
• Victor D’Amato, Senior Engineer, Tetra Tech Inc.
• John Hricko, Superintendent of Water Utilities for the Town of Crewe, Virginia
• Gilbert Perez, Director of Operations for the Victor Valley Wastewater Reclamation Authority (VVWRA) in California
Thursday, October 15, 2015
1:00pm – 3:00pm Eastern
1
Webcast Logistics
• To Ask a Question – Type your question in the “Questions” tool box on the right side of your screen and click “Send.”
• To report any technical issues (such as audio problems) – Type your issue in the “Questions” tool box on the right side of your screen and click “Send” and we will respond by posting an answer in the “Questions” box.
2

2
Overview of Today’s Webcast
• Introduction by Dr. Gilinsky
• Overview of the Report Including Key Findings
• Case Study from Town of Crewe, VA
• Case Study from Victor Valley, CA
3
Dr. Ellen Gilinsky, Senior Advisor
Office of Water
Introductory Remarks
October 15, 2015
Webinar:Case Studies on Implementing Low Cost
Modifications for Improving the Nutrient Reduction Performance of
Wastewater Treatment Plants

3
Nutrient Pollution Is a Serious, Widespread Problem
• Nutrient pollution is one of America’s costliest and most challenging environmental problems
• Impacts to water bodies across the United States from nutrient pollution are well‐documented affecting:
– The environmental and economic viability of our nation’s waters, including tourism, real estate values, and commercial enterprises
– The quality of waters used for fishing, swimming, and other recreational purposes
– Public health and well being
• The challenge before us is how we can most effectively work and collaborate at all levels to address sources of nutrient pollution
• While it is critical to reduce nutrients from all source sectors, this webinar focuses on the point source opportunities
5
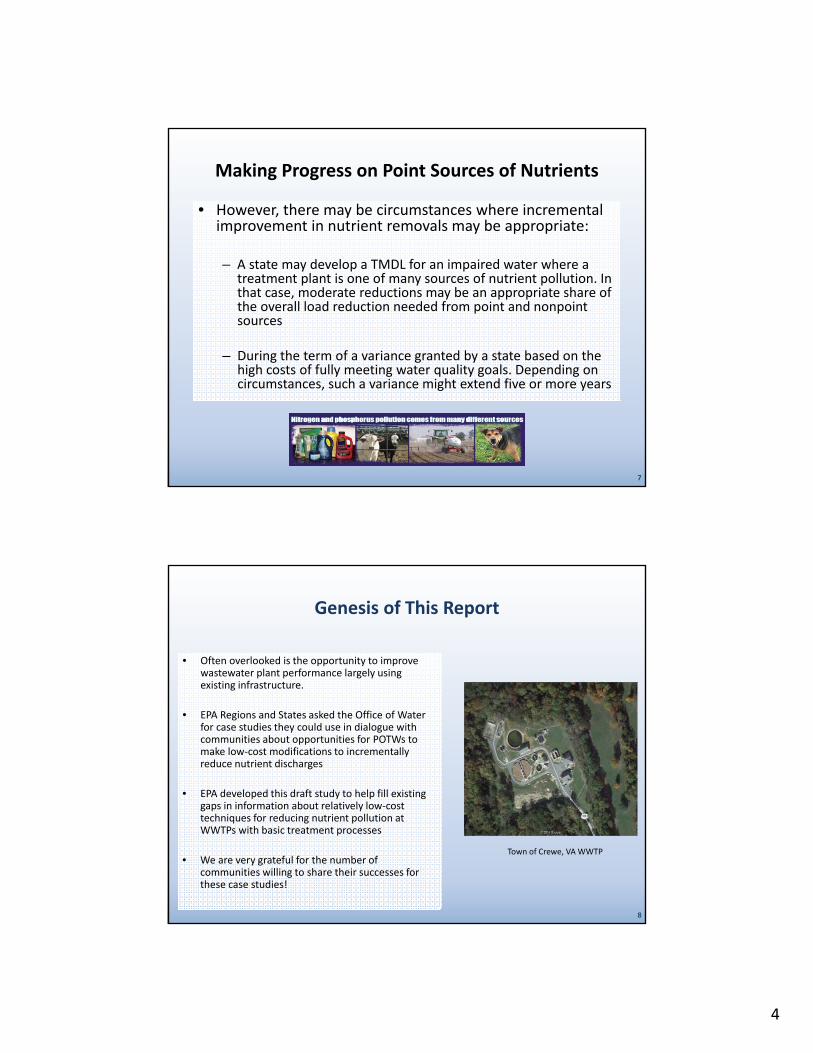
Too much nitrogen and phosphorus in the water can have diverse and far‐reaching impacts on public health, the environment and the economy. Photo credit: Bill Yates.
Making Progress on Point Sources of Nutrients
• Cost is often seen as a barrier to enhancing nutrient removal at community wastewater treatment plants:
– High cost is typically associated with building new infrastructure, or major facility retrofits and operation and maintenance costs to achieve very significant nutrient reductions
– In some cases, the levels of nutrient removal needed to fully achieve water quality goals will require costly investments. For example, if a treatment plant is the primary source of nutrient loads to a waterbody impaired by nutrients
6
4
Making Progress on Point Sources of Nutrients
• However, there may be circumstances where incremental improvement in nutrient removals may be appropriate:
– A state may develop a TMDL for an impaired water where a treatment plant is one of many sources of nutrient pollution. In that case, moderate reductions may be an appropriate share of the overall load reduction needed from point and nonpoint sources
– During the term of a variance granted by a state based on the high costs of fully meeting water quality goals. Depending on circumstances, such a variance might extend five or more years
7
Genesis of This Report
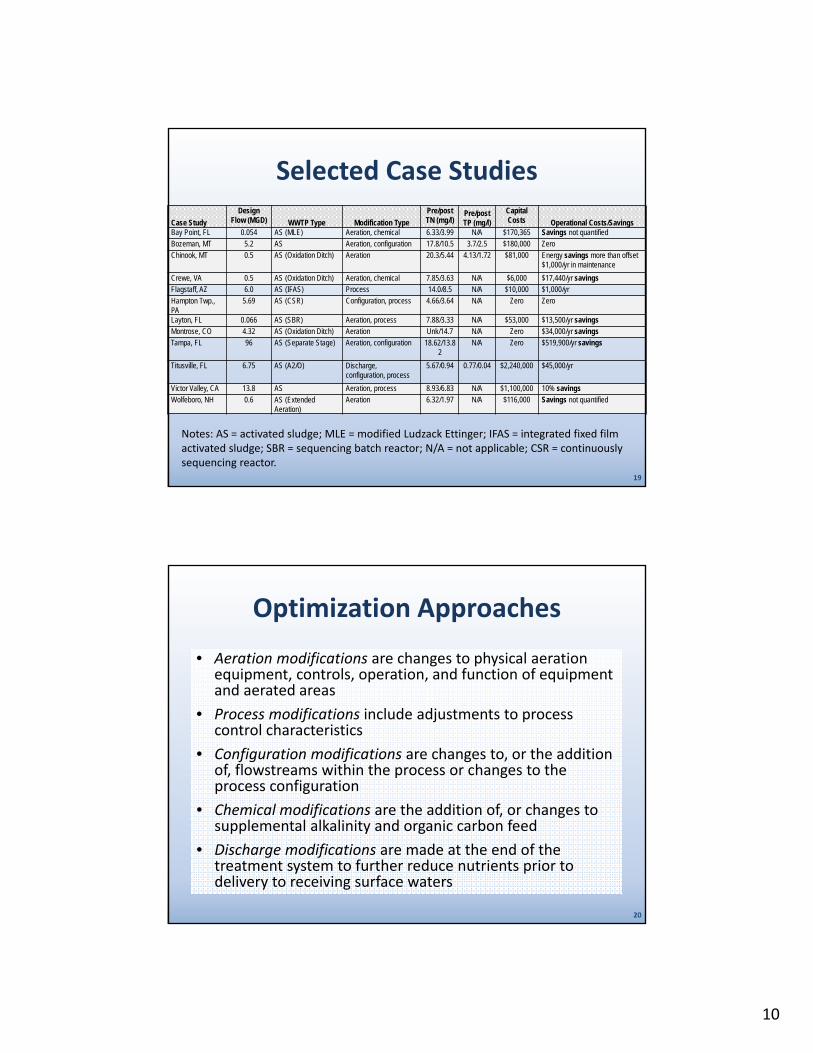
• Often overlooked is the opportunity to improve wastewater plant performance largely using existing infrastructure.
• EPA Regions and States asked the Office of Water for case studies they could use in dialogue with communities about opportunities for POTWs to make low‐cost modifications to incrementally reduce nutrient discharges
• EPA developed this draft study to help fill existing gaps in information about relatively low‐cost techniques for reducing nutrient pollution at WWTPs with basic treatment processes
• We are very grateful for the number of communities willing to share their successes for these case studies!
8
Town of Crewe, VA WWTP

5
What We Found
• Optimization for nutrient reduction is often feasibleand cost‐effective:
– Low‐cost activities can be implemented at existingWWTPs to significantly reduce nutrient discharges
• Thus far, more examples found for nitrogen thanfor phosphorus
– In many cases, energy efficiency increased, operationalcosts were reduced and process stability improved
• Low‐cost nutrient reduction improvements, particularly for relatively basic treatment systems, are underreported in the literature
– EPA seeks additional case studies to update thisdocument
9
Victor Valley Wastewater Reclamation Authority
Next Steps
• We released the draft report in August 2015. See: http://www2.epa.gov/nutrient-policy-data/reports-and-research#reports
• Seeking more data for an updated version, maycollaborate with others who are interested in POTWoptimization– EPA has already received several new case studies– Please submit comments or additional case studies to
[email protected] by December 15, 2015
• Exploring how to better align this work with effortsto improve POTW energy efficiency.– For example, EPA Region 4 now working with its
states and communities to reduce POTW energyconsumption and optimize nitrogen removals
10

6
Questions
11
Victor D’Amato
Senior Engineer, Tetra Tech Inc.

7
• One of the first documented efforts to present empirical data of non‐advanced WWTPs that have been optimized to improve nutrient reduction
• Compendium of case studies
13
Case Studies on Implementing Low‐Cost Modifications to Improve Nutrient Reduction at WWTPs
Identifying Case Studies
14
• Internal EPA query to relevant Regional and state staff
• Broad grey and white literature review
• Review of existing EPA and other guidance documents
• Query of selected industry practitioners
• Supplemental search of Clean Water Needs Survey (CWNS) database

8
Case Study Selection Criteria
• Responsiveness to project objectives
– relatively basic (non‐advanced) treatment plants
– improved nitrogen and/or phosphorus reduction using low‐cost techniques
• Availability of monitoring and cost data
• Representative of a range of scenarios and nutrient optimization approaches
15
Case Study Selection
• From a master list of over 80 case studies, a total of 12 were summarized in report
• Of the 12 selected case studies, seven fully meet the main study criteria
• Other five provide useful information that might help target audiences understand nutrient reduction optimization approaches
16

9
Case Study Selection Findings
• Despite extensive efforts to identify and develop relevant case studies, few met the study criteria
• Most efforts at improving non‐advanced plants appear to be unpublished or under‐documented
• Most published literature focuses instead on optimizing existing enhanced nutrient removal (ENR) systems
17
Wastewater Treatment Primer• Activated sludge: suspended growth in actively mixed/aerated reactors
• Lagoon: passive treatment
• Trickling filter: attached growth
18
10
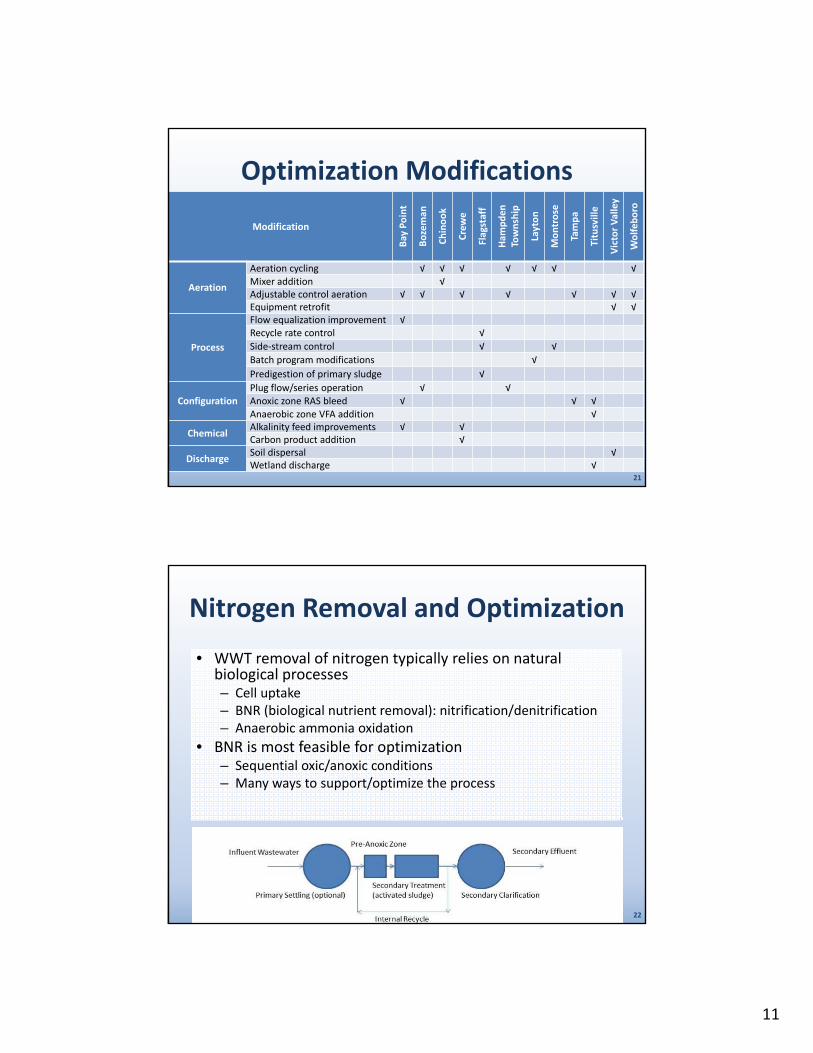
Selected Case Studies
Case StudyBay Point, FL
Design Flow (MGD)
0.054WWTP Type
AS (MLE)Modification Type
Aeration, chemical
Pre/post TN (mg/l)
6.33/3.99
Pre/post TP (mg/l)
N/A
Capital Costs
$170,365Operational Costs/Savings
Savings not quantifiedBozeman, MT 5.2 AS Aeration, configuration 17.8/10.5 3.7/2.5 $180,000 ZeroChinook, MT 0.5 AS (Oxidation Ditch) Aeration 20.3/5.44 4.13/1.72 $81,000 Energy savings more than offset
$1,000/yr in maintenance
Crewe, VA 0.5 AS (Oxidation Ditch) Aeration, chemical 7.85/3.63 N/A $6,000 $17,440/yr savingsFlagstaff, AZ 6.0 AS (IFAS) Process 14.0/8.5 N/A $10,000 $1,000/yr
Hampton Twp., PA
5.69 AS (CSR) Configuration, process 4.66/3.64 N/A Zero Zero
Layton, FL 0.066 AS (SBR) Aeration, process 7.88/3.33 N/A $53,000 $13,500/yr savingsMontrose, CO 4.32 AS (Oxidation Ditch) Aeration Unk/14.7 N/A Zero $34,000/yr savingsTampa, FL 96 AS (Separate Stage) Aeration, configuration 18.62/13.8
2N/A Zero $519,900/yr savings
Titusville, FL 6.75 AS (A2/O) Discharge, configuration, process
5.67/0.94 0.77/0.04 $2,240,000 $45,000/yr
Victor Valley, CA 13.8 AS Aeration, process 8.93/6.83 N/A $1,100,000 10% savingsWolfeboro, NH 0.6 AS (Extended
Aeration)Aeration 6.32/1.97 N/A $116,000 Savings not quantified
Notes: AS = activated sludge; MLE = modified Ludzack Ettinger; IFAS = integrated fixed film activated sludge; SBR = sequencing batch reactor; N/A = not applicable; CSR = continuously sequencing reactor.
19
Optimization Approaches
• Aeration modifications are changes to physical aeration equipment, controls, operation, and function of equipment and aerated areas
• Process modifications include adjustments to process control characteristics
• Configuration modifications are changes to, or the addition of, flowstreams within the process or changes to the process configuration
• Chemical modifications are the addition of, or changes to supplemental alkalinity and organic carbon feed
• Discharge modifications are made at the end of the treatment system to further reduce nutrients prior to delivery to receiving surface waters
20
11
21
Modification
Ba yPoi nt
zBo
man
e no
Chi
ko
Cr
eew
Flagsaff
t
Ha
mpden
Ton
wshi p
yLa
otn
Monrtse
o
Tampa
Titusille
v
or
Vict
a
Vy
lle
Wo
elf
boor
Aeration cycling √ √ √ √ √ √ √
AerationMixer additionAdjustable control aeration √ √
√√ √ √ √ √
Equipment retrofit √ √Flow equalization improvement √Recycle rate control √
Process Side‐stream control √ √
Batch program modifications √
Predigestion of primary sludge √
Plug flow/series operation √ √Configuration Anoxic zone RAS bleed √ √ √
Anaerobic zone VFA addition √
ChemicalAlkalinity feed improvementsCarbon product addition
√ √√
DischargeSoil dispersalWetland discharge √
√
Optimization Modifications
Nitrogen Removal and Optimization
• WWT removal of nitrogen typically relies on natural biological processes – Cell uptake– BNR (biological nutrient removal): nitrification/denitrification– Anaerobic ammonia oxidation
• BNR is most feasible for optimization– Sequential oxic/anoxic conditions– Many ways to support/optimize the process
22

12
Phosphorus Removal and Optimization
• WWT removal of phosphorus is typically by sequestration in solids – Cell uptake– Enhanced Biological Phosphorus Removal (EBPR): increased cell uptake
– Chemical precipitation/immobilization
• Chemical precipitation is most feasible for optimization– EBPR usually requires additional reactor(s)– Chemical treatment is easy, reliable and capable of low levels of effluent TP
– Several drawbacks to chemical treatment
23
Typical WWTP Performance
Treatment System Total Nitrogen Total Phosphorus (mg/l) (mg/l)
Raw Wastewater 40 7.0
Primary Treatment 37 6.2Activated Sludge (no ENR) 25 5.6Facultative Lagoon 16 4.2Trickling Filter 25 5.8
24
Sources: Metcalf and Eddy (1991, 2004); WEF (2003); USEPA (2011)

13
Lagoons• Characteristics
– Algae/wind aerate surface – Anoxic/anaerobic bottom
layers – Relative long retention times
• Nitrogen removal mechanisms– Ammonia stripping to the
atmosphere– Assimilation into biomass– Biological
nitrification/denitrification– Sedimentation of insoluble
organic nitrogen
• Phosphorus removal mechanisms– Physiochemical: adsorption,
coagulation, and precipitation
25
Lagoon Optimization
• Controlled discharge– Coincide with times when effluent nutrient concentrations are lowest and/or when receiving water impacts will be lowest
– Works well for non‐discharge, since water demand is highest and receiving water sensitivity typically higher in summer
• Use non‐discharge options, such as land application/soil treatment system
• Consider adding post‐lagoon treatment– relatively passive constructed wetland systems – post‐denitrification facilities such as biological filters
• Documentation in literature is limited
26

14
Trickling Filters
• Limited optimization options– Increase internal recycle rate– Aeration throttling/cycling for forced draft systems– Post‐treatment or conversion to advanced secondary system
• Documentation in literature is limited
27
Author Year Location TN TP Improvements
Dai et al. 2013 Australia 60%Return nitrate‐rich stream from secondary clarifiers back to primaries
Dorias and Baumann 1994 Germany 15 mg/lDenitrification in trickling filter plants by covering filters for anoxic operation
Kardohely and McClintock
2001 Penn StateAdded BNR plant to blend effluent prior to disposal or land application
Morgan et al. 1999 Australia Conversion to MLE‐type BNR by adding secondary reactors
Activated Sludge
Aeration• Aeration cycling – includes on/off cycling of aeration,
including the creation of dedicated anoxic and oxic zones, and associated controls.
• Adjustable control aeration – use of variable frequency drives to control aerator output and/or use of on‐line monitoring tools to inform aerator operational mode.
• Mixer addition – addition of mixers to facilitate on/off cycling or maintain suspension of solids when aerators are turned down.
• Equipment retrofit – replacement with more efficient aeration equipment.
28

15
Activated Sludge
Process• Flow equalization improvement – improving the influent flow to
biological treatment process to improve performance consistency.
• Recycle rate control – modifying internal mixed‐liquor recycle rate to optimize denitrification in primary anoxic zones.
• Sidestream control – modifying nutrient‐rich internal plant return flows, such as sludge dewatering returns.
• Pre‐digestion of primary sludge – modifying primary sludge wasting rate to facilitate biochemical oxygen demand (BOD) solubilization from settled sludge into secondary process influent.
• Batch program modifications ‐ changes to SBR program settings.
29
Activated Sludge
Process• Flow equalization improvement – improving the influent flow to
biological treatment process to improve performance consistency.
• Recycle rate control – modifying internal mixed‐liquor recycle rate to optimize denitrification in primary anoxic zones.
• Sidestream control – modifying nutrient‐rich internal plant return flows, such as sludge dewatering returns.
• Pre‐digestion of primary sludge – modifying primary sludge wasting rate to facilitate biochemical oxygen demand (BOD) solubilization from settled sludge into secondary process influent.
• Batch program modifications ‐ changes to SBR program settings.
30

16
Activated SludgeConfiguration • Plug flow/series operation – conversion of complete mix reactor to plug
flow to facilitate oxic/anoxic zonation. • Anoxic zone bleed – introduction of influent wastewater or return
activated sludge (RAS) into anoxic reactors to provide carbon for denitrification.
• Anaerobic zone VFA addition – introduction of RAS into anaerobic selector to provide carbon for enhanced biological phosphorus removal (EBPR).
Chemical • Alkalinity feed improvements – modifications to alkalinity control systems
to facilitate effective nitrification. • Carbon product addition – addition of soluble BOD products to enhance
denitrification or EBPR. Discharge • Soil dispersal – conversion of a surface discharging system into a soil
discharging system. • Wetland discharge – discharge into wetlands for further attenuation of
nutrients prior to receiving water delivery.
31
WWTP typeActivated Sludge
Key questions to askIs there excess plant capacity?
Optimization efforts to considerCreate anoxic zone(s)
-
-
-
Is peak daily flow < 75% design capacity?
Are additional tanks/reactors available?
Is flow equalization provided?
-
-
On/off cycling for nitrification/denitrification in single reactor
Feed influent and internal recycle to dedicated tank
- Denitrify in flow equalization with internal recycle
Is there excess aeration capacity? Facilitate anoxic environments
-
-
-
Can aeration be throttled?
Does aeration system have automatic control?
- Maintain lower DO setpoint or dedicated anoxic zone
- Install DO and/or ORP meters for auto control
Can contents be mixed without aerating? - Consider adding mixers
Are process parameters sufficient? Modify process parameters as warranted
-
-
-
Can nitrified liquor be returned to low DO zone?
- Internal recycle to introduce nitrified liquor to anoxic
Is alkalinity sufficient for full nitrification? -
-
Add alkalinity
Is carbon available to drive denitrification?
Consider step‐feed, pre‐fermentation additives
Lagoon Is capacity available to store effluent? Control discharge to take advantage of summer nutrient removal, while maintaining receiving water standards
Trickling Filter Does
Is the lagoon mechanically aerated? If so, can it be controlled (see Activated Sludge rows bove)?a Is a nondischarge alternative available?
trickling filter currently nitrify?
Create anoxic zones for enhanced BNR
Study alternative discharge methods
Add post‐denitrification unit 32

17
Case Study Summaries
33
• System Summary
• Rationale and Decision Process
• System Optimization Description
• Costs and Other Impacts
• Performance Discussion
• Challenges
• Future Improvements
• Contact Information
• Other Resources
Conclusions and Recommendations
• Optimization is often feasible and cost‐effective: need a “champion”
• Some excess treatment capacity is ideal (though we didn’t specifically analyze this)
• Phosphorus removal is often complimentary to nitrogen removal
• Low‐cost nutrient optimization is currently underreported
• Lagoon systems appear to have optimization opportunities
• Other approaches can also be considered on a case‐by‐case basis
34
18
Questions
35
John HrickoSuperintendent of Water
Utilities for the Town of Crewe, Virginia
19
Town of Crewe, VA WWTP
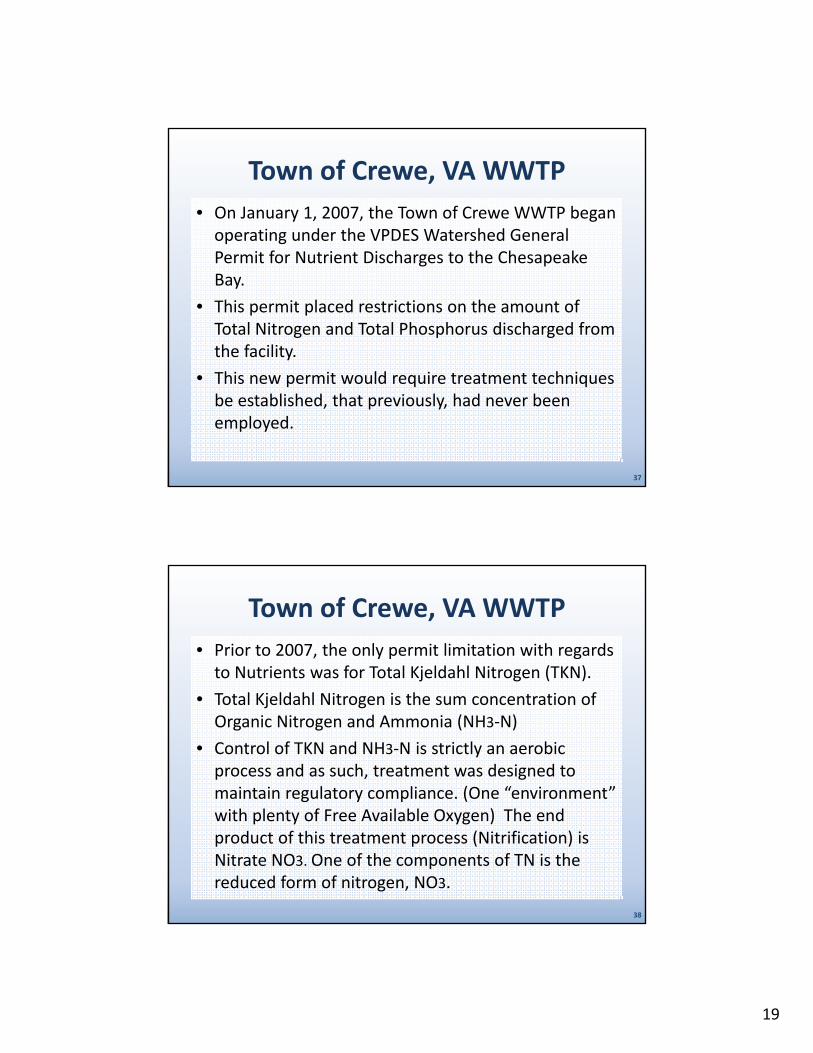
• On January 1, 2007, the Town of Crewe WWTP began operating under the VPDES Watershed General Permit for Nutrient Discharges to the Chesapeake Bay.
• This permit placed restrictions on the amount of Total Nitrogen and Total Phosphorus discharged from the facility.
• This new permit would require treatment techniques be established, that previously, had never been employed.
37
Town of Crewe, VA WWTP
• Prior to 2007, the only permit limitation with regards to Nutrients was for Total Kjeldahl Nitrogen (TKN).
• Total Kjeldahl Nitrogen is the sum concentration of Organic Nitrogen and Ammonia (NH3‐N)
• Control of TKN and NH3‐N is strictly an aerobic process and as such, treatment was designed to maintain regulatory compliance. (One “environment” with plenty of Free Available Oxygen) The end product of this treatment process (Nitrification) is Nitrate NO3. One of the components of TN is the reduced form of nitrogen, NO3.
38
20
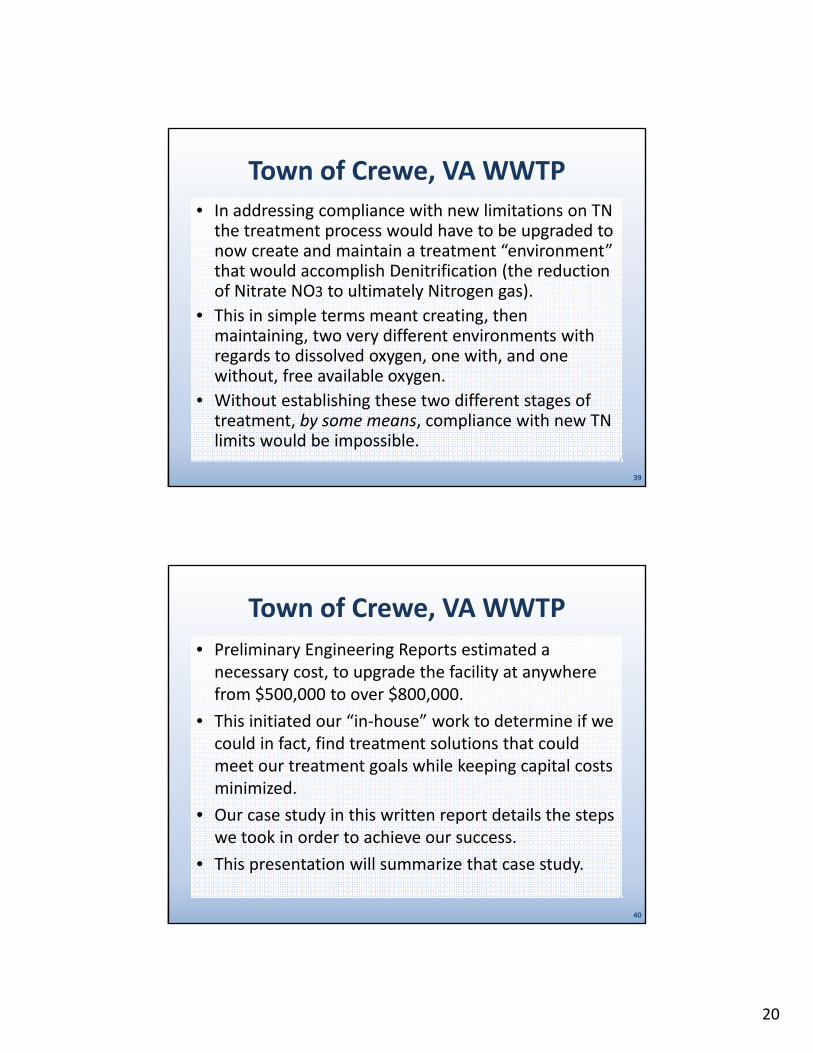
Town of Crewe, VA WWTP• In addressing compliance with new limitations on TN the treatment process would have to be upgraded to now create and maintain a treatment “environment” that would accomplish Denitrification (the reduction of Nitrate NO3 to ultimately Nitrogen gas).
• This in simple terms meant creating, then maintaining, two very different environments with regards to dissolved oxygen, one with, and one without, free available oxygen.
• Without establishing these two different stages of treatment, by some means, compliance with new TN limits would be impossible.
39
Town of Crewe, VA WWTP
• Preliminary Engineering Reports estimated a necessary cost, to upgrade the facility at anywhere from $500,000 to over $800,000.
• This initiated our “in‐house” work to determine if we could in fact, find treatment solutions that could meet our treatment goals while keeping capital costs minimized.
• Our case study in this written report details the steps we took in order to achieve our success.
• This presentation will summarize that case study.
40

21
Town of Crewe, VA WWTP• All biological treatment processes have their success determined by creating and maintaining the proper “environment” or “habitat” for the target biological organism(s).
• This “environmental control” is mandatory in order to achieve treatment goals, whether we treat a flow of 0.5 MGD or 50 MGD. The scale, the equipment, the facility will be different, however, the treatment principles are the same.
41
Town of Crewe, VA WWTP• Required “Environmental” or “Habitat” parameters for
success in reduction of Total Nitrogen:
• Control of Dissolved Oxygen levels in different stages of treatment. Maintaining an aerobic (oxic) environment, sufficient free available oxygen, in one treatment stage, Nitrification. Eliminating free available oxygen (anoxic) in a separate treatment stage, Denitrification. Two distinctly different, yet equally important “environments” mandatory in order to achieve Total Nitrogen reduction.
• Control (maintaining) pH and Alkalinity requirements.
• Control (maintaining) sufficient carbon source availability.
42

22
Town of Crewe, VA WWTP• The BIG question?
• Can WE achieve these controls with our existing facility, structures and equipment?
• If so, HOW?
43
Town of Crewe, VA WWTP
44
• The biggest challenge would be creating and maintaining the two necessary dissolved oxygen “environments” with the existing equipment.
• We visited a number of facilities here in Virginia that were practicing BNR to see what specific treatment techniques they were employing. We may not be able to afford the same equipment, but we could try to mimic the treatment technology.
• Because the treatment is all about “environment”, looking at facilities here in Virginia was paramount.

23
Town of Crewe, VA WWTP
45
Town of Crewe, VA WWTP
• Alter disc configuration.
• Manual On‐Off cycling.
• 24 hour programmable timer (On‐Off Auto Control with NO response to changes in flow and temperature)
• On‐line Dissolved Oxygen probe with Low‐High Auto Control. This system responds to changes in both plant flow and temperature.
• Results were good…yet not good enough!
• Too much free available oxygen in the anoxic zone.
46

24
Town of Crewe, VA WWTP
47
Town of Crewe, VA WWTP
48

25
Town of Crewe, VA WWTP• Once the two opposing dissolved oxygen “environments”
were established, it was determined that a supplemental carbon source would have to provided.
• A series of product trials over the course of two years demonstrated that a molasses product would provide the most “bang for the buck”.
• In 2011 the facility began using a liquid molasses product specially formulated to enhance BPR. This product provided excellent results for both TN and TP removal, and allowed for a reduction in liquid alum usage of 50%. (Liquid alum was the sole method of TP reduction previously used in treatment.)
49
Town of Crewe, VA WWTP
The final piece to the puzzle was management of sidestream contributions to TN in the form
of Nitrates.50

26
Town of Crewe, VA WWTP*2005 *2006 2007 2008 2009 2010 2011 2012 2013 2014
Annual Average Flow, MGD
0.27 0.26 0.23 0.22 0.26 0.27 0.22 0.18 0.27 0.28
TN Annual 7.11 8.59 4.05 3.45 3.91 3.56 3.36 3.83 3.26 3.52Avg. mg/L
TN Annual 6.00 6.00 6.00 6.00 6.00 6.00 6.00 6.00 6.00 6.00Limit mg/L
Annual Average +/‐% change
+18.5% +43.2% (34.2%) (42.5%) (34.8%) (40.7%) (44.0%) (36.2%) (45.7%) (41.3%)
TN Discharged Lbs/Yr
5689 6790 2773 2273 2929 2572 1991 1986 2414 2849
TN Annual Waste Load Allocation, Lbs. 9137 9137 9137 9137 9137 9137 9137 9137 9137 9137
Annual TN Lbs. +/‐
(3448) (2347) (6364) (6864) (6208) (6565) (7146) (7151) (6723) (6288)
Annual TN Lbs. +/‐% change (38%) (26%) (70%) (75%) (68%) (72%) (78%) (78%) (74%) (69%)
51
Town of Crewe, VA WWTP*2005 *2006 2007 2008 2009 2010 2011 2012 2013 2014
Annual Average Flow, MGD
0.23 0.22 0.26 0.27 0.22 0.18 0.27 0.28
TP Annual 0.06 0.07 0.05 0.04 0.04 0.07 0.09 0.06Avg. mg/L
TP Annual 0.5 0.5 0.5 0.5 0.5 0.5 0.5 0.5Limit mg/L
Annual Average +/‐% change
(88%) (86%) (90%) (92%) (92%) (86%) (82%) (88%)
TP Discharged Lbs/Yr
42 51 48 32 22 36 73 48
TP Annual Waste Load Allocation, Lbs. 761 761 761 761 761 761 761 761
Annual TP Lbs. +/‐
(719) (710) (713) (729) (739) (725) (688) (713)
Annual TP Lbs. +/‐% change (94%) (93%) (94%) (72%) (96%) (95%) (91%) (94%)
52

27
Town of Crewe, VA WWTP*2005 *2006 2007 2008 2009 2010 2011 2012 2013 2014
TKN Annual Avg. mg/L < 0.50 < 0.50 0.78 0.88 1.00 0.67 0.82 0.90 0.88 0.71
N + N Annual Avg. mg/L 7.11 8.59 3.27 2.57 2.91 2.89 2.54 2.93 2.38 2.79
TN Annual Avg. mg/L 7.11 8.59 4.05 3.45 3.91 3.56 3.36 3.83 3.26 3.52
53
Town of Crewe, VA WWTPCost Comparison of Crewe VA's Nutrient Control Methods
EnhanceBioP
Cost per ton $425Gal of EHB‐P weights 11.5Gallons Dosed 24.00gpd
Cost per gal $2.44Total cost per day $58.65Total Annual EnhanceBioP Cost $21,407.25Alum Dose, annual average 50ml/min(Summer/Fall/Spring 75/Winter 45)
Alum Dose 0.79252gph
Alum Cost $1.25Cost per gal of AlumAlum Cost per day $23.78
Total Annual Alum Cost $8,678.05Total EnhanceBioP/Alum Cost per Year $30,085.30
Previous Dry Molasses feed rate 300lbs per dayPecent sugar of dry feed 38.0%Lbs sugar per gal used 114lbs per dayCost per 50 lbs dry $16.00
Dry Molasses Cost per day $96.00Total Annual Dry Molasses Cost $35,040.00Alum Dose, annual average ( 105ml/minSummer/Fall/Spring 115/Winter 75)
Alum Dose 1.66428gphAlum Cost $1.25Cost per gal of Alum
Alum Cost per day $49.93
Total Annual Alum Cost $18,223.91Total Dry Molasses/Alum Cost per Year $53,263.91
Saving/year: $23,178.61
NOTE: Plus Increased Sale of Nitrogen Credits $5,000.00
Total Savings $28,178.61 54

28
Town of Crewe, VA WWTP
• In 2012 the Towns membership in the Virginia Nutrient Credit Exchange Association began paying dividends. As a result of the plants success in TN and TP reduction, our surplus treatment credits have become a source of revenue for the Town.
• With the additional savings in liquid alum use, the BNR program put in place not only insures compliance with Nutrient Discharge Limits but allows for positive cost impact as well.
55
Questions
56

29
Converting Conventional Activated Sludge Facility to Biological Nutrient Removal Utilizing In-House Resources (staff) and
Creative Financing
\
Gilbert PerezDirector of OperationsVictor Valley Wastewater Reclamation Authority
Victor Valley Wastewater Reclamation Authority (VVWRA)
• Regional Wastewater Reclamation Authority in the Victor Valley, San Bernardino County.
• Currently treats 12.5 MGD • Population served 112,921• Service Area Includes;
City of Victorville, Spring Valley Lake (San Bernardino County Service area No. 64), Southern Logistics Airport (formerly George Air Force Base), Oro Grande (San Bernardino County Service Area No. 42), City of Hesperia, and Town of Apple Valley.
Converting Conventional Activated Sludge UtilizingIn-House Resources (staff) and Creative Financing
58

30
Converting Conventional Activated Sludge Facility to Biological Nutrient Removal Utilizing In-House Resources (staff) and Creative Financing
• In Feb. 2008 the RWQCB finalized the VVWRA NPDES permit with a total nitrogen limit of 10.3 mg/L and ammonia nitrogen of 0.54 mg/l.
• The VVWRA facility was designed as an 18 MGD conventional activated sludge plant and was faced with making significant modifications to convert to biological nutrient removal (BNR) process for nitrification and denitrification.
• Due to stringent nitrogen limitation the VVWRA facility capacity was reduced to 13.8 MGD. This equates to a loss of $42,000,000.00 in equity!
59
Converting Conventional Activated Sludge Facility to Biological Nutrient Removal Utilizing In-House Resources (staff) and Creative Financing
• Engineer estimates of $13.4M to install a fixed IFAS media system into the existing aeration tanks to comply with nitrogen limitations at 14 MGD without having to build additional new structures for biological treatment was proposed due to time and funding constraints.
60

31
Converting Conventional Activated Sludge Facility to Biological Nutrient Removal Utilizing In‐House Resources
(staff) and Creative Financing
• Staff worked diligently to improve the operational efficiency of the aeration basins to improve their reliability and nitrification/denitrification capabilities. This was a three step process which required:
• Improved instrumentation for monitoring. (D.O., Air Flow, Ammonia and Nitrate concentration).
• Improved aeration diffusion in the water for improved efficiency. (Repaired/Replaced inefficient diffusers, repaired air leaks).
• Structural enhancements to provide system reliability. (Installed Internal Recycle Pumps).
• Once all three project elements were complete staff were able to meet their objective in meeting permit requirements and improving ground water quality.
61
Unreliable plant processes or equipment affect plant performance and increase operations and maintenance cost. The solution is quite simple: Make these components reliable.
$13,400,000.00
IFAS
$10,000,000.00
Renegotiated Renewal of WDR
$2,000,000.00
Staff's Improvements
$21,400,000.00
Savings
$‐
$5,000,000.00
$10,000,000.00
$15,000,000.00
$20,000,000.00
$25,000,000.00
Project Cost and Savings
62

32
Converting Conventional Activated Sludge Facility to Biological Nutrient Removal Utilizing In-House Resources (staff) and Creative Financing
Phase II of Project involved additional challenges.
• Improve treatment efficiency and reliability
• Energy savings• Eliminate expensive
chemicals for alkalinity augmentation.
• Financial Challenges
63
Converting Conventional Activated Sludge Facility to Biological Nutrient Removal Utilizing In-House Resources (staff) and Creative Financing
• Staff were able to overcome these challenges by working with Edison to identify challenges with current equipment.
• Edison educated staff about creative financing options such as On Bill Financing and financial incentives for energy efficient Projects.
• Edison provided:• Engineering calculations
• Equipment / Materials selection
• Funding
64

33
Converting Conventional Activated Sludge Facility to Biological Nutrient Removal Utilizing In-House Resources (staff) and Creative Financing
On-Bill Financing (OBF) • Finance qualifying energy
efficiency projects. • Repay the loan in monthly
installments which would be added as a line item on your bill.
• Fund your qualified energy efficiency project for zero interest and no fees,
• Reduce your monthly electricity usage,
• Receive financial incentives for installing qualifying energy efficient equipment.
65
$228,110.40
1‐8 AerationSavings/Year
$63,072.00
9‐12 AerationSavings/Year
$98,340.00
Turbo Blower ‐vs‐ICE
Blower/Year
$35,397.00
1‐8 Incentive
$14,202.21
9‐12 Incentive
$47,304.00
Turbo BlowerIncentive
$151,935.00
Elimination ofMagnesiumHydroxide
$638,360.61
Total
$‐
$100,000.00
$200,000.00
$300,000.00
$400,000.00
$500,000.00
$600,000.00
$700,000.00
Savings and Incentives
66

34
67
Operational benefits• Simpler plant – reducing operating problems and related costs• Eliminate chemical handling• Improved air transfer efficiency – improved nitrification• Reduces mixed liquor recycle rate – improved denitrification• Increases detention time in BNR system enhancing microbes ability to effectively oxidize
and convert carbon and nutrients • Simpler plant – reducing operating problems and related costs
Economic benefits• Provides an aeration system which is more efficient than current system• Lower overall electricity at the plant ($291,182.40/Year)• Alkalinity recovery eliminating magnesium hydroxide usage ($151,935/Year)• Reduced O&M man hours – shift resources to other areas of the plant to improve efficiency
and economic benefits• Financial Incentives ($96,903.21)• Eliminate installation of fixed media, negotiating WDR no need to construct dewatering
facilities ($21,400,000.00)
Other benefits• Increases plant hydraulic capacity • Value from avoiding fines for non-compliance• Potentially increase organic and nutrient treatment capacity
Converting Conventional Activated Sludge Facility to Biological Nutrient Removal Utilizing In‐House Resources (staff) and Creative Financing
68

35
Converting Conventional Activated Sludge Facility to Biological Nutrient Removal Utilizing In‐House Resources (staff) and Creative Financing
69
Victor D’AmatoSenior Engineer, Tetra Tech Inc.(919) 485‐2070Victor.D'[email protected]
John HrickoSuperintendent of Water Utilities for the Town of Crewe, VA(434) 645‐9436(434) 390‐[email protected]
Speaker Contact Information
70
Gilbert PerezDirector of Operations, Victor Valley Wastewater Reclamation Authority (VVWRA), CA(760) 246‐[email protected]

36
Next Watershed Academy Webcast:Please Visit Our Website
More Details to Come!
www.epa.gov/watershedacademy
71
Participation Certificate
If you would like to obtain participation certificates type the link below into your web browser:
http://www2.epa.gov/sites/production/files/2015‐09/documents/wa_webcast_certificate_10152015‐508.pdf
You can type each of the attendees names into the PDF and print the certificates.
72

37
Questions
73