case study: long-term performance of sma pavements in ... · introduction • sma is widely used in...
TRANSCRIPT
Case Study: Long-term Performance of SMA Pavements in Washington State
Shenghua Wu, Ph.D., LEED APAssistant Professor, University of South Alabama
Kevin Littleton, PEWashington State Department of Transportation
1st International Conference on Stone Matrix Asphalt, Atlanta GANov 6, 2018

• Introduction
• Project Information
• Research Scope
• Results of SMA and HMA Comparison• Field Performance
• Field Cores Mixture Properties
• Extracted Binder Properties
• Conclusions and Future Study
Outline
2
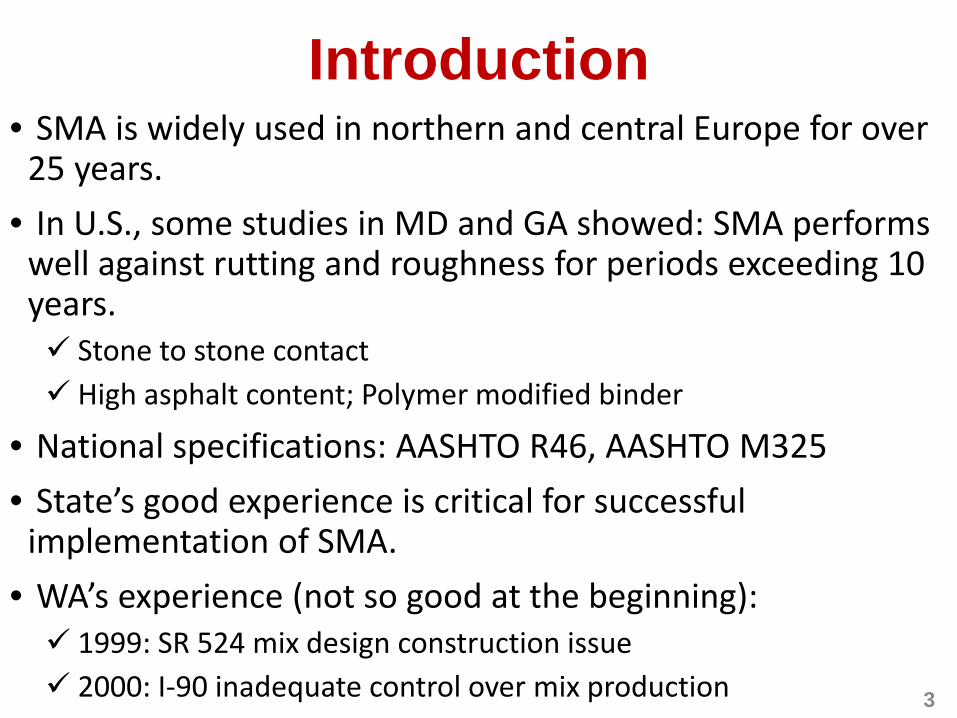
Introduction• SMA is widely used in northern and central Europe for over
25 years.• In U.S., some studies in MD and GA showed: SMA performs
well against rutting and roughness for periods exceeding 10 years. Stone to stone contact High asphalt content; Polymer modified binder
• National specifications: AASHTO R46, AASHTO M325• State’s good experience is critical for successful
implementation of SMA.• WA’s experience (not so good at the beginning): 1999: SR 524 mix design construction issue 2000: I-90 inadequate control over mix production 3
Project Information
4
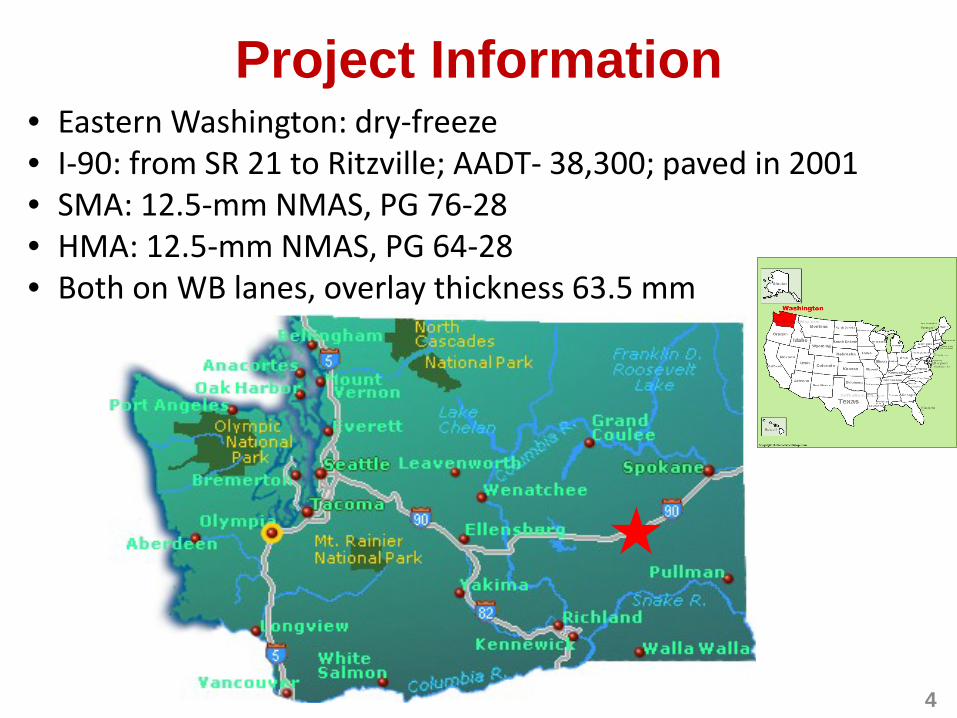
• Eastern Washington: dry-freeze• I-90: from SR 21 to Ritzville; AADT- 38,300; paved in 2001• SMA: 12.5-mm NMAS, PG 76-28 • HMA: 12.5-mm NMAS, PG 64-28 • Both on WB lanes, overlay thickness 63.5 mm

Material PropertyField Performance
Research Objective• Investigate the long-term performance of SMA pavement as compared to control HMA pavement
5
• WSPMS Pavement structural
condition (PSC): cracking Pavement rutting condition
(PRC): rutting Pavement profile condition
(PCC): roughness• Field inspection
• Field cores Mixtures testing
• Binder extraction• Aggregate gradation• Binder Recovery Binder testing

Material Characterization: MixtureMixture Test
IDT Dynamic Modulus/Creep Compliance
Fatigue-IDT Fracture at Room Temp
Thermal Cracking-IDT Fracture at Low Temp
Studded Tire Wear Test
Testing Conditions
Temp.: -20, -10, 0, 10, 20, 30ºC;Frequency: 20, 10, 5, 1, 0.1, 0.01 HzDuration: 100 seconds
Temp.: 20ºCLoading rate: 50.8 mm/min
Temp.: -10ºCLoading rate: 2.54 mm/min
Temp.: roomPressure: 690 kPaSpeed: 140 rpmDuration: 2 min
Material Properties
Dynamic modulus;Creep compliance
IDT strength;Fracture work density;Horizontal failure strain
IDT strength;Fracture work density Mass loss
References/Standards Wen et al. 2002
Shen et al. 2017; AASHTO T322
Shen et al. 2017; AASHTO T322
Wen and Wu 2015
6

Material Characterization: Asphalt BinderBinder Test Performance
Grading (PG) Rutting: MSCRFatigue: Monotonic at Room Temp
Thermal Cracking: Monotonic at Low Temp
Testing Conditions
Different temp depending on the test (DSR, BBR)
Stress: 0.1, 3.2 kPaTemp.:
Temp.: 20ºCShear rate: 0.3 s-1
Temp.: 5ºCShear strain rate: 0.01 s-1
Material Properties
PG;BBR stiffness; m-value
Jnr0.1, Jnr3.2;R0.1, R3.2
Maximum stress;Fracture energy; Failure strain
Maximum stress; Fracture energy; Failure strain
References/Standards
AASHTO MP1/T240/T313
AASHTO T350 Shen et al. 2017Wu 2017; Shen et al. 2017
7

• Introduction
• Project Information
• Research Scope
• Results of SMA and HMA Comparison• Field Performance
• Field Cores Mixture Properties
• Extracted Binder Properties
• Conclusions and Future Study
Outline
8

Field Performance
9
0
20
40
60
80
100
2002 2004 2006 2008 2010 2012 2014 2016 2018 2020
Scor
e
Year
PSC (Structural)
PRC (Rutting)
PPC (Profile)
PerformanceCurve
Threshold
0
20
40
60
80
100
2002 2004 2006 2008 2010 2012 2014 2016 2018 2020
Scor
e
Year
PSC (Structural)
PRC (Rutting)
PPC (Profile)
PerformanceCurve
Threshold
SMA Performance
HMA Performance
Section Cracking Rutting Rut Depth, mmHMA 74 61 7.1SMA 80 88 5.8
Field Inspection
(Note: HMA was patched in 2008)
Dynamic Modulus
10
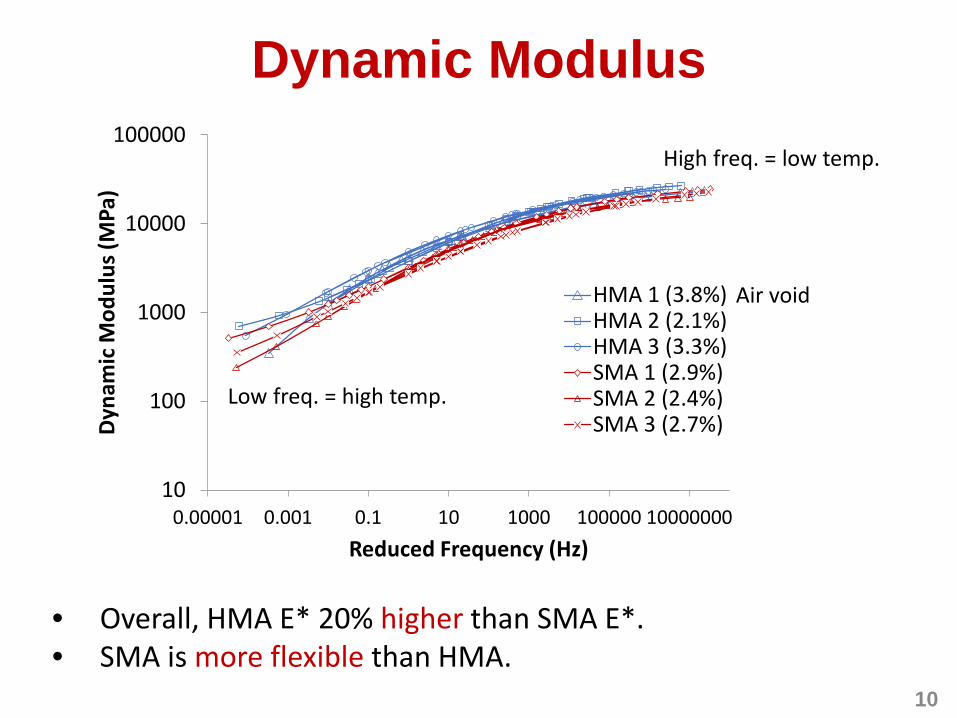
• Overall, HMA E* 20% higher than SMA E*.• SMA is more flexible than HMA.
10
100
1000
10000
100000
0.00001 0.001 0.1 10 1000 100000 10000000
Dyn
amic
Mod
ulus
(MPa
)
Reduced Frequency (Hz)
HMA 1 (3.8%)HMA 2 (2.1%)HMA 3 (3.3%)SMA 1 (2.9%)SMA 2 (2.4%)SMA 3 (2.7%)
Air void
High freq. = low temp.
Low freq. = high temp.

Creep Compliance
11
1.E-11
1.E-10
1.E-09
1.E-08
1.E-07
1E-09 0.000001 0.001 1 1000
Cree
p Co
mpl
ianc
e (1
/Pa)
Reduced Time (s)
HMA 1 (3.8%)HMA 2 (2.1%)HMA 3 (3.3%)SMA 1 (2.9%)SMA 2 (2.4%)SMA 3 (2.7%)
• Overall, HMA shows lower creep compliance than SMA.• SMA gives a better ability to relax stress, and thus better
thermal cracking resistance.
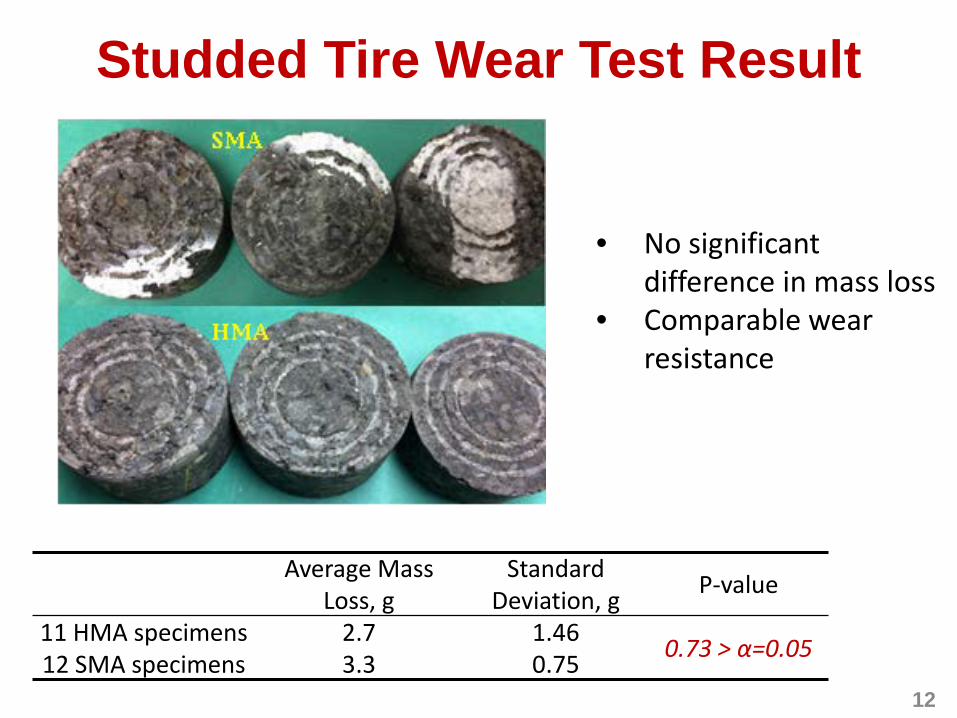
Studded Tire Wear Test Result
12
Average Mass Loss, g
StandardDeviation, g P-value
11 HMA specimens 2.7 1.46 0.73 > α=0.0512 SMA specimens 3.3 0.75
• No significant difference in mass loss
• Comparable wear resistance
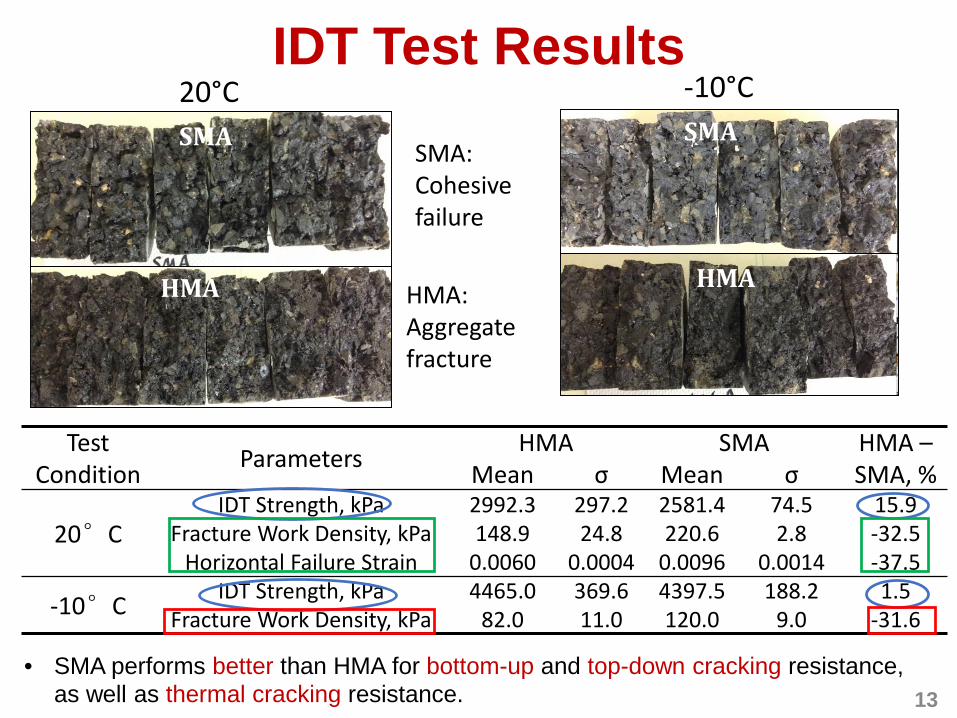
IDT Test Results
13
20°C
HMA
SMA
Test Condition Parameters HMA SMA HMA –
SMA, %Mean σ Mean σ
20°CIDT Strength, kPa 2992.3 297.2 2581.4 74.5 15.9
Fracture Work Density, kPa 148.9 24.8 220.6 2.8 -32.5Horizontal Failure Strain 0.0060 0.0004 0.0096 0.0014 -37.5
-10°C IDT Strength, kPa 4465.0 369.6 4397.5 188.2 1.5Fracture Work Density, kPa 82.0 11.0 120.0 9.0 -31.6
SMA
HMA
-10°C
SMA: Cohesive failure
HMA: Aggregate fracture
• SMA performs better than HMA for bottom-up and top-down cracking resistance, as well as thermal cracking resistance.
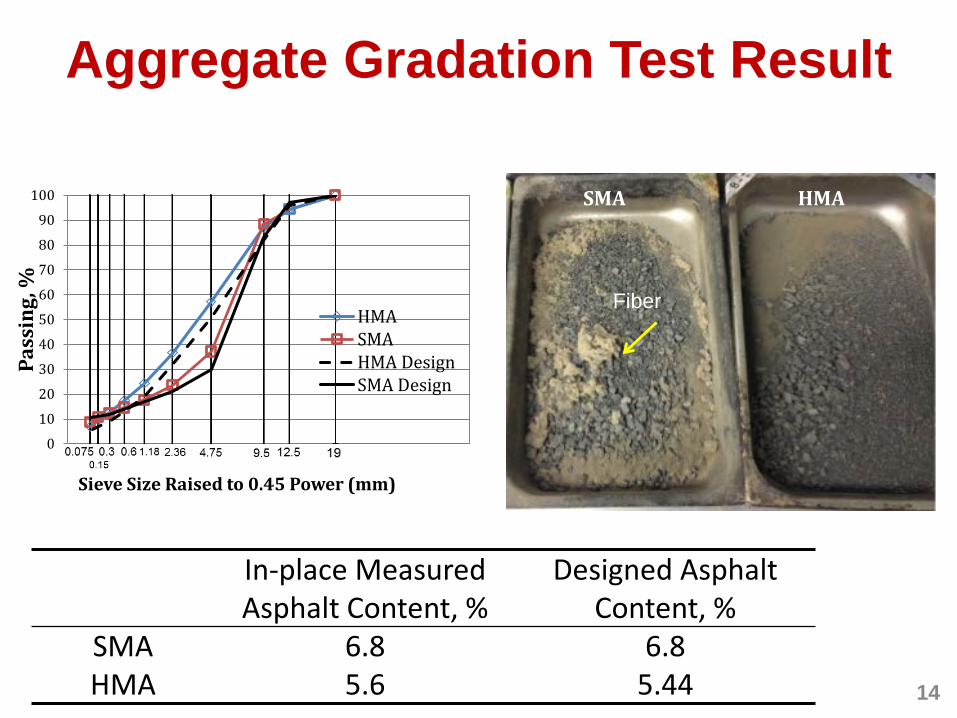
Aggregate Gradation Test Result
14
0
10
20
30
40
50
60
70
80
90
100
Pass
ing,
%
Sieve Size Raised to 0.45 Power (mm)
HMASMAHMA DesignSMA Design
Fiber
SMA HMA
In-place Measured Asphalt Content, %
Designed Asphalt Content, %
SMA 6.8 6.8HMA 5.6 5.44

Binder PG Test Results
15
Original PG Measured True PG PGHMA 64-28 73.3-24.4 70-22SMA 76-28 81.8-29.3 76-28
Binder MSCR Test Results
0
20
40
60
80
100
Perc
ent R
ecov
ery
R0.1 R3.2
SMA
HMA
0
0.1
0.2
0.3
0.4
0.5
Non
-rec
over
able
Cre
ep
Com
plia
nce,
1/k
Pa
Jnr0.1 Jnr3.2
SMA
HMA
• SMA binder shows better resistance to rutting.
• SMA slows down oxidation possibly due to a thicker asphalt film.

DSR Monotonic Fracture Test Result
16
20°C 5°C
0200400600800
1000120014001600
0 5 10 15 20 25 30 35 40
Shea
r St
ress
, kPa
Shear Strain
HMASMA
0
500
1000
1500
2000
2500
3000
3500
4000
0 5 10 15
Shea
r St
ress
, kPa
Shear Strain
HMASMA
Binder SMA HMA SMA –HMA, %
Shear Strength, kPa 1446 1256 15
Fracture Energy, kPa 10495 1930 444
Failure Strain 10 2 443
Binder SMA HMA SMA –HMA, %
Shear Strength, kPa 2410 4144 -42
Fracture Energy, kPa 5275 5082 4
Failure Strain 3 1 85

• Introduction
• Project Information
• Research Scope
• Results of SMA and HMA Comparison• Field Performance
• Field Cores Mixture Properties
• Extracted Binder Properties
• Conclusions and Future Study
Outline
17
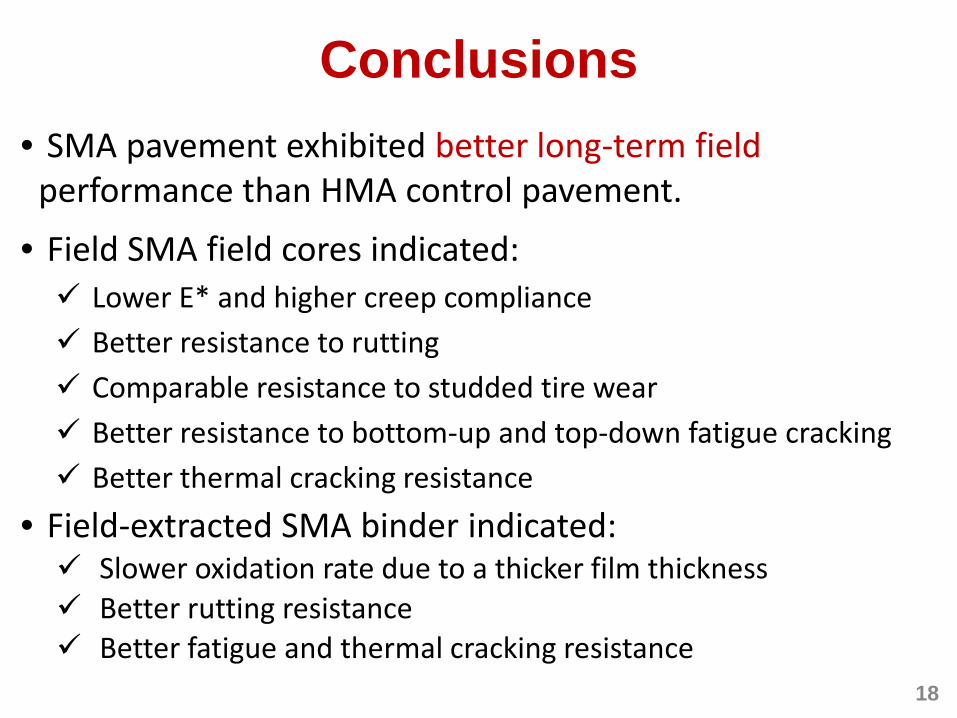
Conclusions
18
• SMA pavement exhibited better long-term field performance than HMA control pavement.
• Field SMA field cores indicated: Lower E* and higher creep compliance Better resistance to rutting Comparable resistance to studded tire wear Better resistance to bottom-up and top-down fatigue cracking Better thermal cracking resistance
• Field-extracted SMA binder indicated: Slower oxidation rate due to a thicker film thickness Better rutting resistance Better fatigue and thermal cracking resistance
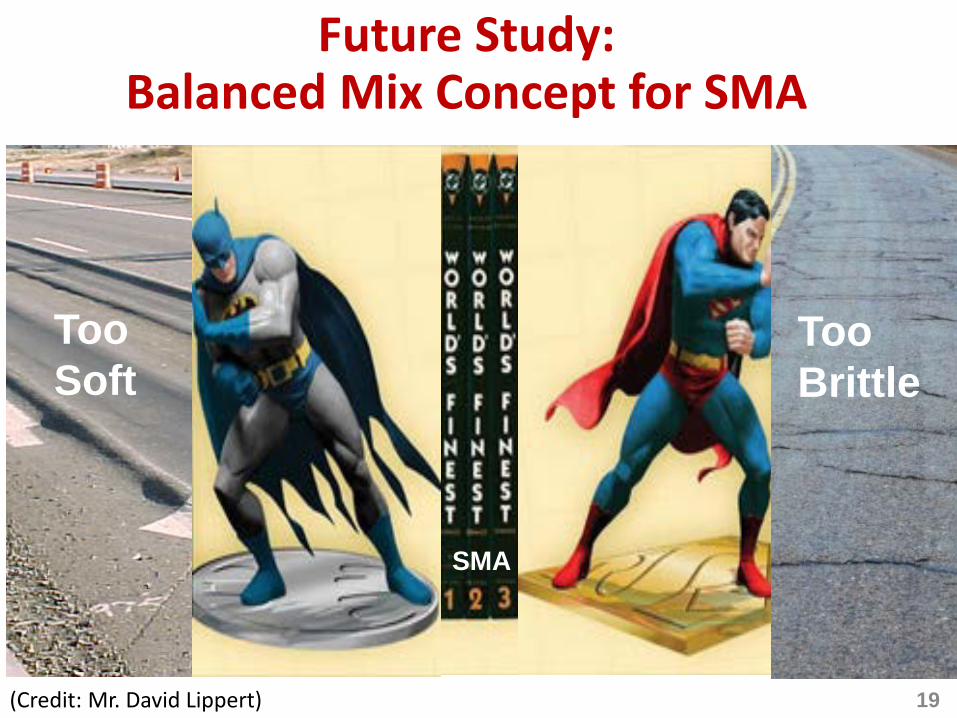
Future Study: Balanced Mix Concept for SMA
SMA
Too Soft
Too Brittle
19(Credit: Mr. David Lippert)
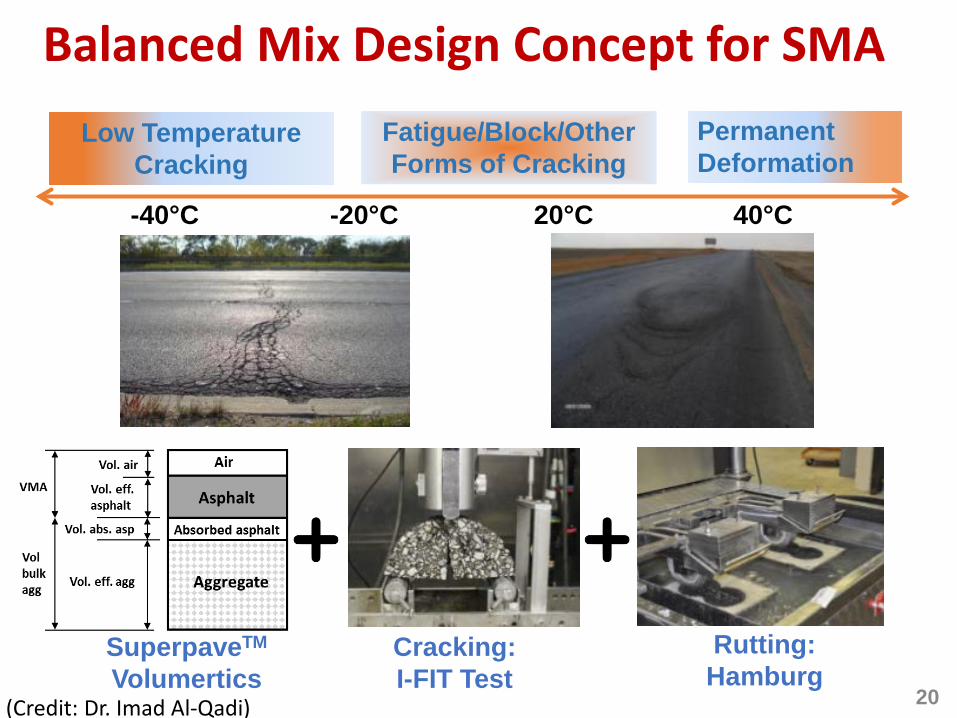
Balanced Mix Design Concept for SMA
Cracking: I-FIT Test
Rutting:Hamburg
SuperpaveTM
Volumertics
Low Temperature Cracking
Fatigue/Block/Other Forms of Cracking
Permanent Deformation
-40°C -20°C 20°C 40°C
20(Credit: Dr. Imad Al-Qadi)

End-of-life
Material Production Design
Construction
UsePreservation,Maintenance, &Rehabilitation
SMA Pavement with Sustainability
Considerations
21

Future Study
22
• Include more case studies with varying traffic, environmental and other factors to draw relatively conclusive decisions.
• Further evaluation on the effects of aggregate gradation and binder PG on the difference performance.

Acknowledgements• Washington State Department of Transportation
(WSDOT)
• Pacific Northwest Transportation Consortium (PacTrans)
• Washington Center for Asphalt Technology (WCAT), WSU
• Dr. Haifang Wen, Mr. Skyler Chaney, Dr. Steve Muench
23
CitationWu, S., H. Wen, S. Chaney, K. Littleton, and S. Muench. Evaluation of Long-Term Performance of Stone Matrix Asphalt in Washington State. Journal of Performance of Constructed Facilities, 2017, Vol. 31, Issue 1. DOI: https://ascelibrary.org/doi/10.1061/%28ASCE%29CF.1943-5509.0000939
