case study of the transportation sector’s response...
TRANSCRIPT
1
Case Study of the Transportation Sector’s Response to and Recovery from Hurricanes Katrina and Rita
LANCE R. GRENZEBACK ANDREW T. LUKMANN
Cambridge Systematics, Inc. 1.0 INTRODUCTION This case study examines the transportation sector’s response to and recovery from Hurricanes Katrina and Rita and the effect these disruptions had on the national-level movement of freight. In August and September of 2005, the U.S. Gulf Coast was struck by two major hurricanes, Katrina and Rita. Although attention has focused primarily on the human tragedy—especially the loss of life and property resulting from flooding and breaches of the New Orleans levees—the two hurricanes did major damage to the road, rail, waterborne, and pipeline networks serving the Gulf Coast and linking the Gulf Coast to the rest of the nation.
Transportation was seriously disrupted. Key railroad bridges were destroyed, requiring the rerouting of traffic and putting increased strain on other rail segments. Barge shipping was halted as was export grain traffic out of the Port of New Orleans, the nation’s largest export grain port. The pipeline network that gathers oil and natural gas from the Gulf was shut down, producing shortages of natural gas and petroleum products. A study of the hurricanes’ effects provides an opportunity to understand better the vulnerability of the national and regional freight transport systems to disruption and destruction.
This case study was commissioned by the Transportation Research Board’s Committee on Climate Change and U.S. Transportation as part of its mandate to focus on and emphasize the consequences of climate change for U.S. transportation and adaptation strategies.
The case study describes the road, rail, waterborne, pipeline, and air transportation systems of the Gulf Coast and the roles they play in the national and regional transportation system. It catalogs the damage to these systems from Hurricanes Katrina and Rita. It identifies the steps that were taken and that remain to be taken to restore the region’s transportation infrastructure, including reported estimates of cost and time. It concludes with observations and lessons learned about the transportation sector’s response to and recovery from the hurricanes.
The scope of the case study is limited. It focus on the national and regional transportation facilities in the central Gulf Coast region, not on city and local transportation systems. It focuses on freight transportation, not on passenger transportation. It recognizes but does not catalog the extensive damage to county and local roads, industrial rail spurs, and the urban street and local transit systems within New Orleans and the other heavily damaged coastal cities and towns. It reports the national and regional impacts of disrupted supply chains, but does not attempt to estimate the economic cost to local businesses, industrial sectors, or the national
2 Case Study of the Transportation Sector’s Response to and Recovery from Hurricanes Katrina and Rita
economy. Finally, it relies on secondary sources, including newspaper articles, industry journals, and government reports.1
The case study provides a reasonably comprehensive overview of the national and regional transportation system response to and recovery from Hurricanes Katrina and Rita, but not a full and detailed accounting. It provides one perspective on the disaster that befell New Orleans and other Gulf Coast communities, but does not tell the whole story. 2.0 HURRICANES KATRINA AND RITA The 2005 Atlantic hurricane season was the most active season in recorded history. New records were set for the number of storms (28), for the most intense storm (Wilma), and for the most damage inflicted in a given year (more than $100 billion).2 Of these, the events most ingrained in the public consciousness are the devastating landfalls of hurricanes Katrina and Rita on the U.S. Gulf Coast.
Hurricane Katrina was the most destructive and costliest natural disaster in the history of the United States, and the deadliest hurricane since the 1928 Okeechobee Hurricane. Along its path, the storm claimed more than 1,836 lives and caused an estimated $75 billion dollars in damage.3 As of July 2006, almost a year after the storm, more than a thousand people remain missing. The hurricane left an estimated three million people without electricity, and more than 90,000 square miles (233,000 km²) were declared disaster areas.
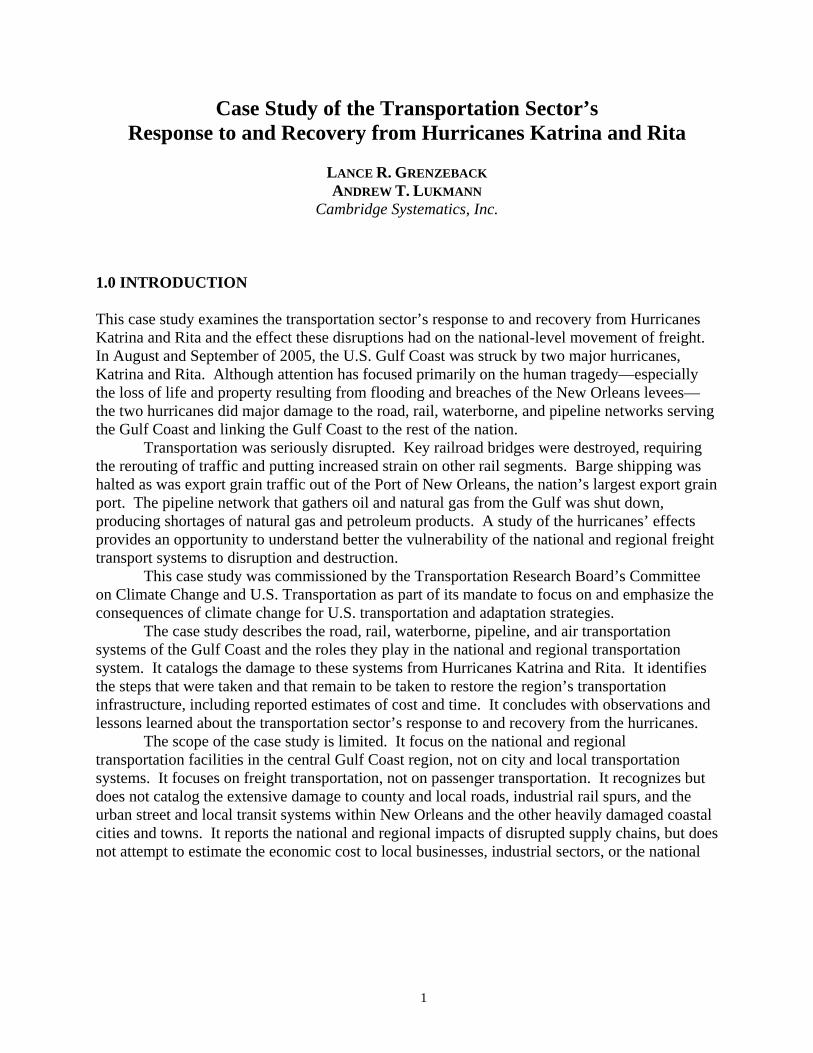
The beginnings of what would become Hurricane Katrina developed on August 23, 2005 over the southeastern Bahamas as Tropical Depression 12 (itself a product of the remnants of Tropical Depression 10 and a distinct tropical wave) (Figure 1). The system quickly grew, becoming Tropical Storm Katrina less than 18 hours after first being classified. As it developed, the storm moved westward, attaining hurricane strength on August 25 less than two hours before making landfall near Aventura, Florida as a Category 1 storm. The interaction with the land weakened the storm slightly; however, upon emerging over the Gulf of Mexico, Katrina quickly regained hurricane force and continued west. Due in part to its path over the warm Loop Current in the Gulf, Katrina underwent steady and rapid intensification, becoming the third major hurricane of the season. An eyewall replacement cycle temporarily disrupted development, but nearly doubled the size of the storm. Katrina again intensified rapidly, attaining Category 5 status by August 28 and reaching its peak strength later that day with maximum sustained winds of 175 mph and a minimum central pressure of 902 mbar. The pressure made Katrina the fourth most intense Atlantic hurricane on record (later surpassed by both Hurricanes Rita and Wilma).4
1 The paper draws on work by Cambridge Systematics in support of research being conducted by the U.S. Department of Transportation and the U.S. Geological Survey on the “Potential Impacts of Climate Variability and Change on Transportation Systems and Infrastructure—Gulf Coast Study.” 2 NOAA (2005). Noteworthy Records of the 2005 Atlantic Hurricane Season. www.noaanews. noaa.gov/stories2005/s2540b.htm. NOAA, U.S. Department of Commerce. 3 Reports of Missing and Deceased. www.dhh.louisiana.gov/offices/page.asp? ID=192&Detail=5248. Louisiana Department of Health and Hospitals. 4 National Hurricane Center (2005). Tropical Cyclone Report: Hurricane Katrina. http://www.nhc.noaa.gov/pdf/TCR-AL122005_Katrina.pdf. NHC, NOAA, U.S. Department of Commerce.
Grenzeback and Lukmann 3
FIGURE 1 Path of Hurricane Katrina (August 23–August 31, 2005).
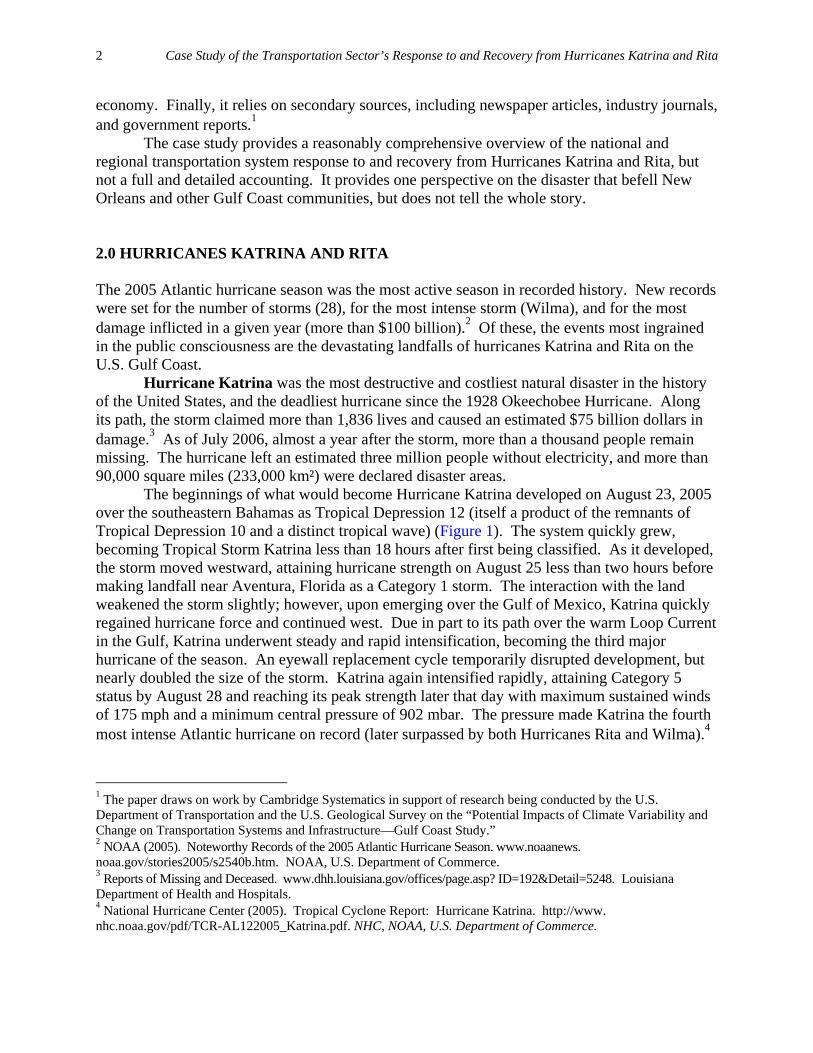
As Hurricane Katrina neared the Gulf Coast, the storm weakened in intensity; however the wind field continued to expand, making Katrina one of the largest major hurricanes ever to strike the United States. Katrina made its second landfall near Buras, Louisiana at 6:10 a.m. CDT on August 29 as a Category 3 Hurricane with sustained winds of 125 mph. At landfall, hurricane-force winds extended outward 120 miles from the center and the storm’s central pressure was 920 mbar. After moving over southeastern Louisiana and Breton Sound, the storm made its third landfall near the Louisiana/Mississippi border with 120 mph winds and a catastrophic 27-foot (estimated) storm surge. The surge appears to have penetrated at least six miles inland in many portions of coastal Mississippi and up to 12 miles inland along bays and rivers. The surge crossed Interstate 10 in many locations. Katrina produced a lesser but still very significant storm surge along the eastern Gulf coast of Mississippi and Alabama. The storm surge was about 10 feet as far east as Mobile, Alabama where Katrina caused flooding several miles inland along Mobile Bay.2
Although the brunt of the initial effects of Hurricane Katrina were felt along the Mississippi Coast to the east of the eye of the storm, a significant storm surge also affected the area to the west of the landfall, including Lake Pontchartrain in Louisiana. The height of the surge there is uncertain because tide gauge observations along the southeastern coast of Louisiana were limited and incomplete. As the level of Lake Pontchartrain rose, several feet of water were pushed into communities along its northeastern shore from Slidell to Mandeville, Louisiana. The surge severely strained the levee system in the New Orleans area, which began to fail as early as the morning of the August 29. Breaches in levees along the Mississippi River-Gulf Outlet (MRGO), the Industrial Canal, the 17th Street Canal, and the London Avenue Canal led to the flooding (up to 20 feet in depth) of about 80 percent of New Orleans proper and all of adjacent St. Bernard Parish. According to the Army Corps of Engineers, it was not until 43 days after Katrina’s landfall that all of the resulting floodwaters were pumped from the city.
Hurricane Rita also earned its spot in the record books, exceeding Katrina in both intensity and maximum wind speed. Rita now ranks as the fourth most intense storm in the Atlantic basin and the strongest storm ever observed in the Gulf of Mexico.
The features that would eventually spawn Hurricane Rita, including multiple tropical waves and a detached surface trough, interacted across the Western Atlantic Ocean from
4 Case Study of the Transportation Sector’s Response to and Recovery from Hurricanes Katrina and Rita
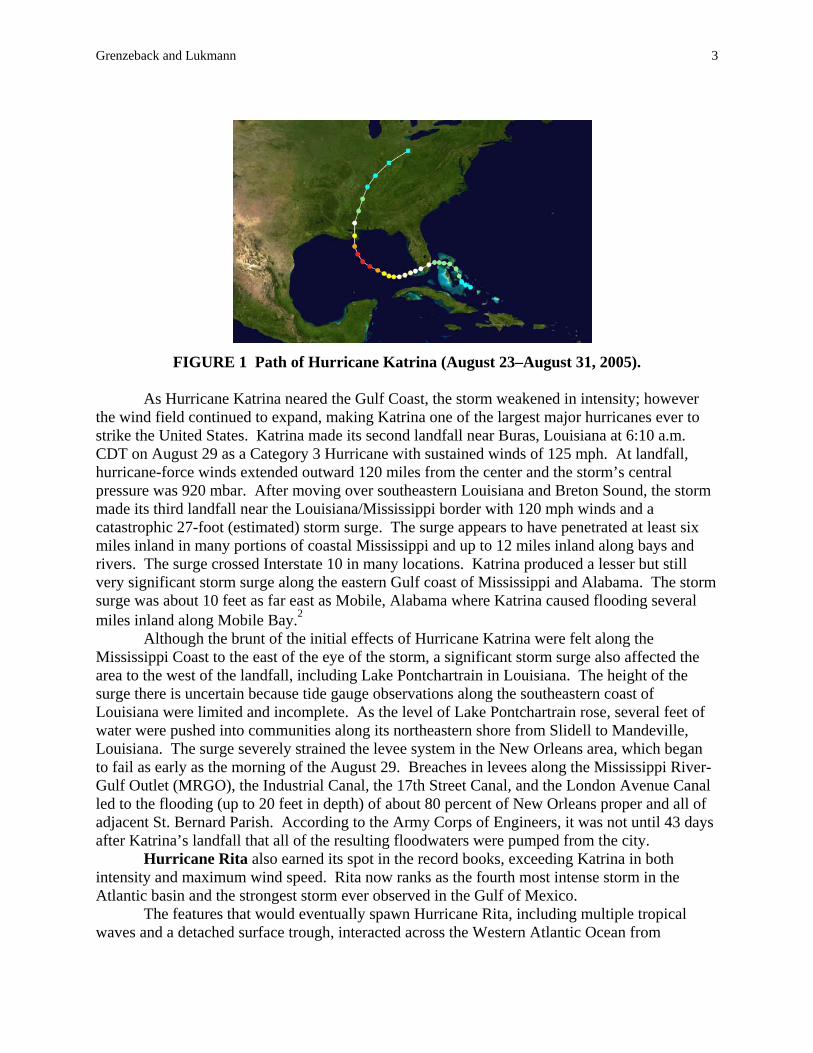
September 12 to 17, 2005 (Figure 2). Thunderstorm activity associated with these features increased, and the storm became better organized in the vicinity of the Leeward Islands. The developing system was classified as a Tropical Depression early on September 18 and was named Tropical Storm Rita later that day. The system remained a developing Tropical Storm until it entering the Straits of Florida on September 20 and began to grow quickly. In a fashion similar to Katrina, Rita underwent extremely rapid intensification as it passed over the warmer Loop Current in the southeastern Gulf of Mexico. In less than 36 hours, Rita had grown from a Tropical Storm to a monstrous Category 5 Hurricane with winds of 180 mph and a central pressure of 895 mbar. Rita traversed the Gulf of Mexico as a major hurricane, slowly but steadily weakening because of changes in the hurricane’s internal structure and its passage over cooler waters. Rita made landfall near the Texas-Louisiana state line as a (still major) Category 3 storm during the early morning hours of September 24.5
Despite having weakened, Rita caused a significant storm surge in southwestern Louisiana, an area particularly vulnerable to coastal flooding. Many communities near the storm’s path received significant damage. Analysis of available data suggests that the surge in areas near and to the west of landfall was in excess of 15 feet. Since so many structures were completely demolished, an accurate measurement of the storm surge is difficult; communities to the east of the landfall, including Holly Beach, Hackberry, Creole, Grand Cheniere, and Cameron were completely destroyed. Inland, the Lake Charles, Louisiana area suffered substantial flooding and wind damage. The surge and heavy rainfall from Rita also led to re-breaching of the levees in New Orleans, which had not yet been repaired from the damage caused only weeks before by Hurricane Katrina. This lead to a re-evacuation of the city and exacerbated the already desperate situation there. Hurricane Rita claimed 120 lives (mostly from indirect causes) and caused approximately $10 billion in damage. Although the storm impact was substantial, a slightly more easterly track spared the Houston metropolitan area from the worst of the storm and likely resulted in significantly less damage and fewer casualties.
FIGURE 2 Path of Hurricane Rita (September 17–September 26, 2005).
5 National Hurricane Center (2005). Tropical Cyclone Report: Hurricane Rita. www.nhc.noaa.gov/pdf/TCR-AL182005_Rita.pdf. NHC, NOAA, US Department of Commerce.
Grenzeback and Lukmann 5
3.0 CENTRAL GULF COAST The Gulf Coast is one of the key economic and population centers of the United States. Home to more than 15 million Americans, the region includes three major metropolitan areas, substantial industrial and commercial activity, and a wealth of mineral, agricultural, and marine resources. Comprised of coastal sections of the states of Texas, Louisiana, Mississippi, Alabama and Florida, the Gulf Coast shares a similar topography, a distinct culture, and unique historical and natural treasures.
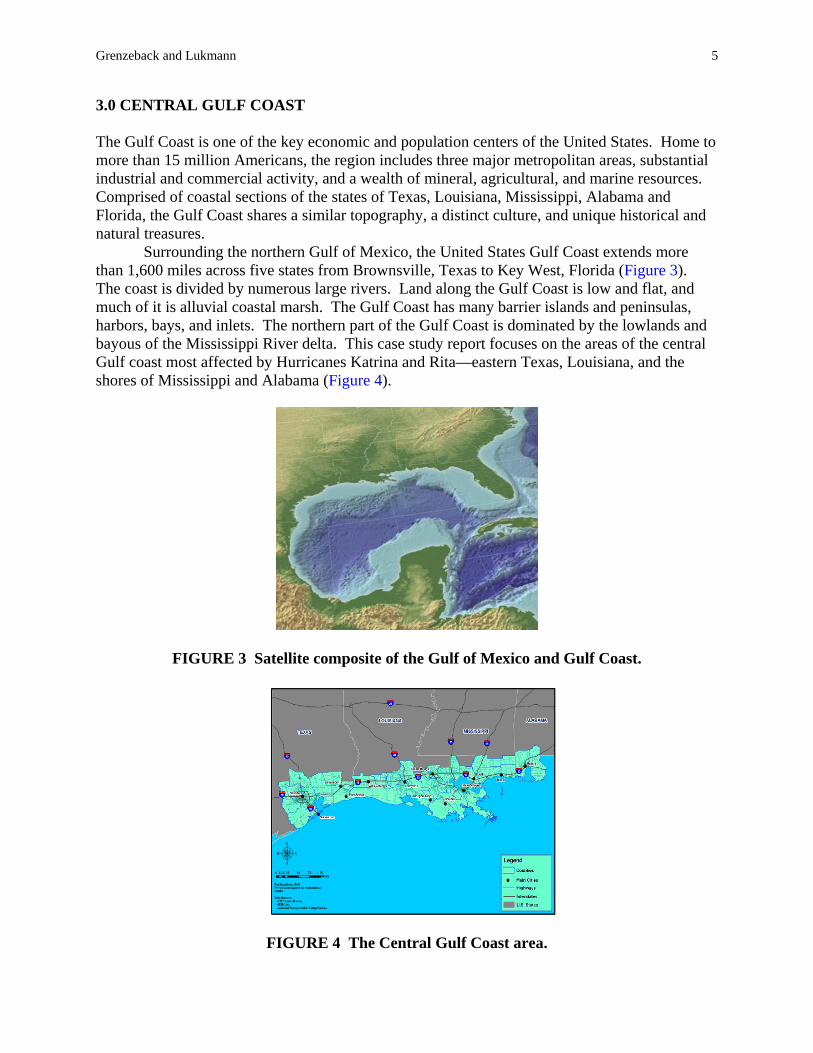
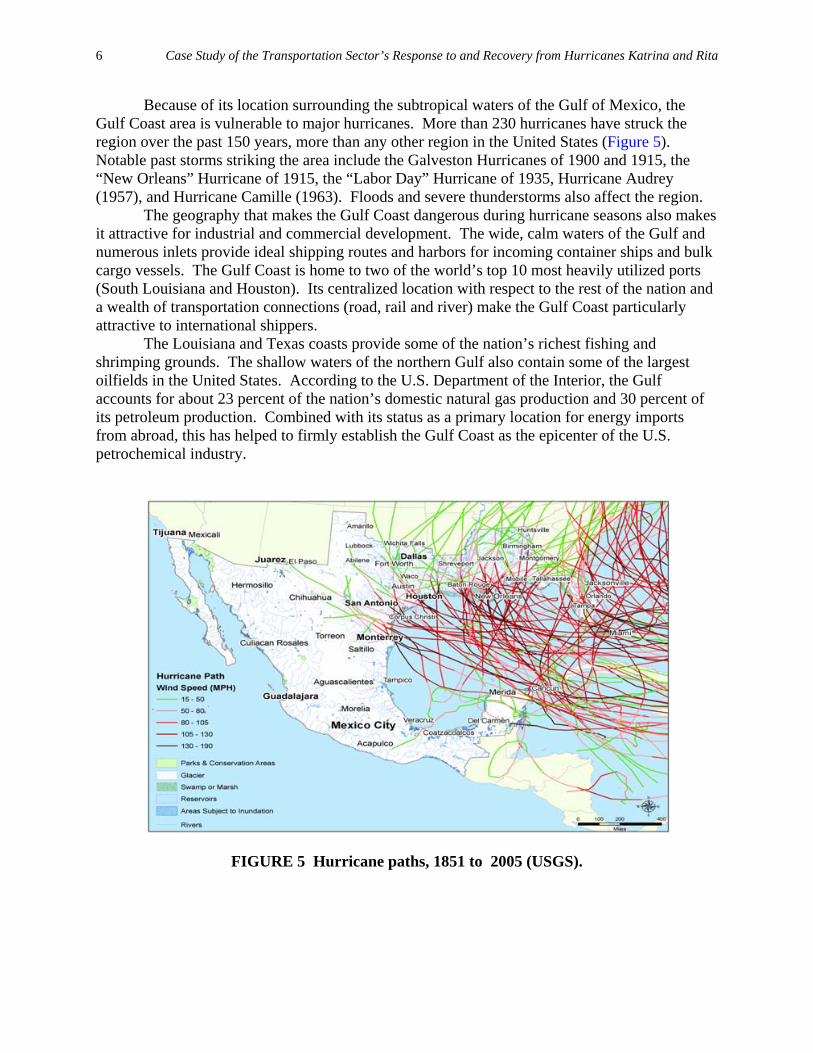
Surrounding the northern Gulf of Mexico, the United States Gulf Coast extends more than 1,600 miles across five states from Brownsville, Texas to Key West, Florida (Figure 3). The coast is divided by numerous large rivers. Land along the Gulf Coast is low and flat, and much of it is alluvial coastal marsh. The Gulf Coast has many barrier islands and peninsulas, harbors, bays, and inlets. The northern part of the Gulf Coast is dominated by the lowlands and bayous of the Mississippi River delta. This case study report focuses on the areas of the central Gulf coast most affected by Hurricanes Katrina and Rita—eastern Texas, Louisiana, and the shores of Mississippi and Alabama (Figure 4).
FIGURE 3 Satellite composite of the Gulf of Mexico and Gulf Coast.
FIGURE 4 The Central Gulf Coast area.
6 Case Study of the Transportation Sector’s Response to and Recovery from Hurricanes Katrina and Rita
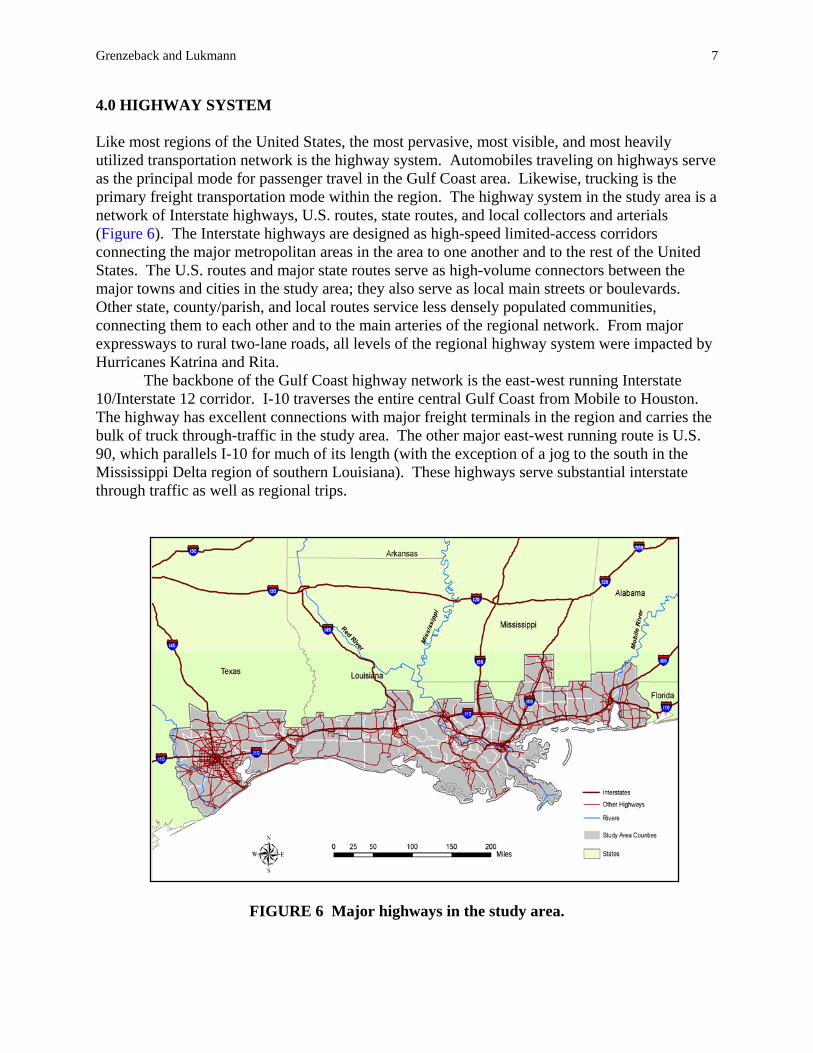
Because of its location surrounding the subtropical waters of the Gulf of Mexico, the Gulf Coast area is vulnerable to major hurricanes. More than 230 hurricanes have struck the region over the past 150 years, more than any other region in the United States (Figure 5). Notable past storms striking the area include the Galveston Hurricanes of 1900 and 1915, the “New Orleans” Hurricane of 1915, the “Labor Day” Hurricane of 1935, Hurricane Audrey (1957), and Hurricane Camille (1963). Floods and severe thunderstorms also affect the region.
The geography that makes the Gulf Coast dangerous during hurricane seasons also makes it attractive for industrial and commercial development. The wide, calm waters of the Gulf and numerous inlets provide ideal shipping routes and harbors for incoming container ships and bulk cargo vessels. The Gulf Coast is home to two of the world’s top 10 most heavily utilized ports (South Louisiana and Houston). Its centralized location with respect to the rest of the nation and a wealth of transportation connections (road, rail and river) make the Gulf Coast particularly attractive to international shippers.
The Louisiana and Texas coasts provide some of the nation’s richest fishing and shrimping grounds. The shallow waters of the northern Gulf also contain some of the largest oilfields in the United States. According to the U.S. Department of the Interior, the Gulf accounts for about 23 percent of the nation’s domestic natural gas production and 30 percent of its petroleum production. Combined with its status as a primary location for energy imports from abroad, this has helped to firmly establish the Gulf Coast as the epicenter of the U.S. petrochemical industry.
FIGURE 5 Hurricane paths, 1851 to 2005 (USGS).
Grenzeback and Lukmann 7
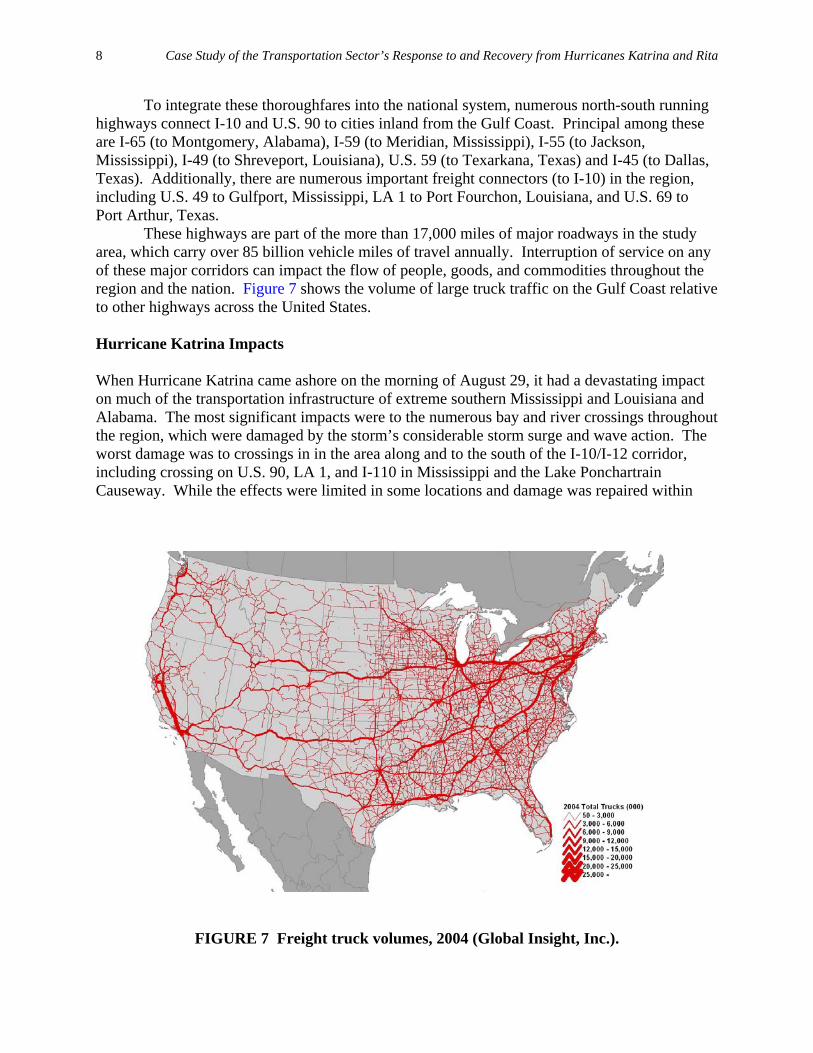
4.0 HIGHWAY SYSTEM Like most regions of the United States, the most pervasive, most visible, and most heavily utilized transportation network is the highway system. Automobiles traveling on highways serve as the principal mode for passenger travel in the Gulf Coast area. Likewise, trucking is the primary freight transportation mode within the region. The highway system in the study area is a network of Interstate highways, U.S. routes, state routes, and local collectors and arterials (Figure 6). The Interstate highways are designed as high-speed limited-access corridors connecting the major metropolitan areas in the area to one another and to the rest of the United States. The U.S. routes and major state routes serve as high-volume connectors between the major towns and cities in the study area; they also serve as local main streets or boulevards. Other state, county/parish, and local routes service less densely populated communities, connecting them to each other and to the main arteries of the regional network. From major expressways to rural two-lane roads, all levels of the regional highway system were impacted by Hurricanes Katrina and Rita.
The backbone of the Gulf Coast highway network is the east-west running Interstate 10/Interstate 12 corridor. I-10 traverses the entire central Gulf Coast from Mobile to Houston. The highway has excellent connections with major freight terminals in the region and carries the bulk of truck through-traffic in the study area. The other major east-west running route is U.S. 90, which parallels I-10 for much of its length (with the exception of a jog to the south in the Mississippi Delta region of southern Louisiana). These highways serve substantial interstate through traffic as well as regional trips.
FIGURE 6 Major highways in the study area.
8 Case Study of the Transportation Sector’s Response to and Recovery from Hurricanes Katrina and Rita
To integrate these thoroughfares into the national system, numerous north-south running highways connect I-10 and U.S. 90 to cities inland from the Gulf Coast. Principal among these are I-65 (to Montgomery, Alabama), I-59 (to Meridian, Mississippi), I-55 (to Jackson, Mississippi), I-49 (to Shreveport, Louisiana), U.S. 59 (to Texarkana, Texas) and I-45 (to Dallas, Texas). Additionally, there are numerous important freight connectors (to I-10) in the region, including U.S. 49 to Gulfport, Mississippi, LA 1 to Port Fourchon, Louisiana, and U.S. 69 to Port Arthur, Texas.
These highways are part of the more than 17,000 miles of major roadways in the study area, which carry over 85 billion vehicle miles of travel annually. Interruption of service on any of these major corridors can impact the flow of people, goods, and commodities throughout the region and the nation. Figure 7 shows the volume of large truck traffic on the Gulf Coast relative to other highways across the United States. Hurricane Katrina Impacts When Hurricane Katrina came ashore on the morning of August 29, it had a devastating impact on much of the transportation infrastructure of extreme southern Mississippi and Louisiana and Alabama. The most significant impacts were to the numerous bay and river crossings throughout the region, which were damaged by the storm’s considerable storm surge and wave action. The worst damage was to crossings in in the area along and to the south of the I-10/I-12 corridor, including crossing on U.S. 90, LA 1, and I-110 in Mississippi and the Lake Ponchartrain Causeway. While the effects were limited in some locations and damage was repaired within
FIGURE 7 Freight truck volumes, 2004 (Global Insight, Inc.).
Grenzeback and Lukmann 9
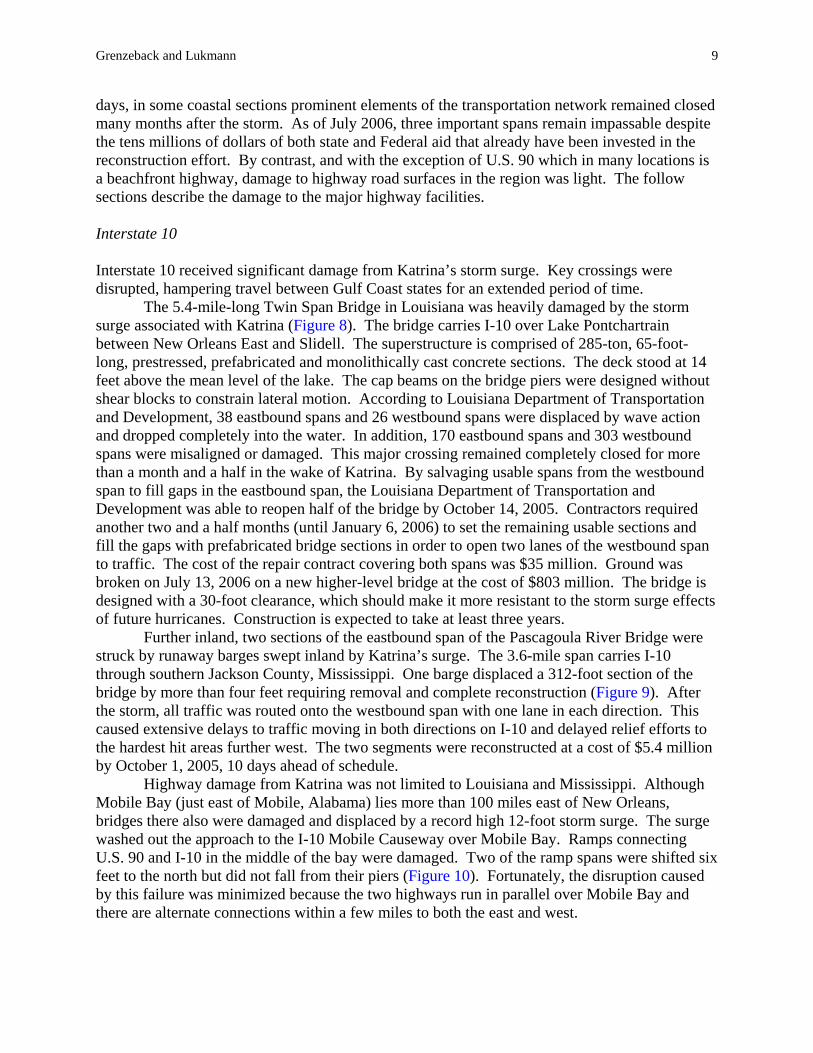
days, in some coastal sections prominent elements of the transportation network remained closed many months after the storm. As of July 2006, three important spans remain impassable despite the tens millions of dollars of both state and Federal aid that already have been invested in the reconstruction effort. By contrast, and with the exception of U.S. 90 which in many locations is a beachfront highway, damage to highway road surfaces in the region was light. The follow sections describe the damage to the major highway facilities. Interstate 10 Interstate 10 received significant damage from Katrina’s storm surge. Key crossings were disrupted, hampering travel between Gulf Coast states for an extended period of time.
The 5.4-mile-long Twin Span Bridge in Louisiana was heavily damaged by the storm surge associated with Katrina (Figure 8). The bridge carries I-10 over Lake Pontchartrain between New Orleans East and Slidell. The superstructure is comprised of 285-ton, 65-foot-long, prestressed, prefabricated and monolithically cast concrete sections. The deck stood at 14 feet above the mean level of the lake. The cap beams on the bridge piers were designed without shear blocks to constrain lateral motion. According to Louisiana Department of Transportation and Development, 38 eastbound spans and 26 westbound spans were displaced by wave action and dropped completely into the water. In addition, 170 eastbound spans and 303 westbound spans were misaligned or damaged. This major crossing remained completely closed for more than a month and a half in the wake of Katrina. By salvaging usable spans from the westbound span to fill gaps in the eastbound span, the Louisiana Department of Transportation and Development was able to reopen half of the bridge by October 14, 2005. Contractors required another two and a half months (until January 6, 2006) to set the remaining usable sections and fill the gaps with prefabricated bridge sections in order to open two lanes of the westbound span to traffic. The cost of the repair contract covering both spans was $35 million. Ground was broken on July 13, 2006 on a new higher-level bridge at the cost of $803 million. The bridge is designed with a 30-foot clearance, which should make it more resistant to the storm surge effects of future hurricanes. Construction is expected to take at least three years.
Further inland, two sections of the eastbound span of the Pascagoula River Bridge were struck by runaway barges swept inland by Katrina’s surge. The 3.6-mile span carries I-10 through southern Jackson County, Mississippi. One barge displaced a 312-foot section of the bridge by more than four feet requiring removal and complete reconstruction (Figure 9). After the storm, all traffic was routed onto the westbound span with one lane in each direction. This caused extensive delays to traffic moving in both directions on I-10 and delayed relief efforts to the hardest hit areas further west. The two segments were reconstructed at a cost of $5.4 million by October 1, 2005, 10 days ahead of schedule.
Highway damage from Katrina was not limited to Louisiana and Mississippi. Although Mobile Bay (just east of Mobile, Alabama) lies more than 100 miles east of New Orleans, bridges there also were damaged and displaced by a record high 12-foot storm surge. The surge washed out the approach to the I-10 Mobile Causeway over Mobile Bay. Ramps connecting U.S. 90 and I-10 in the middle of the bay were damaged. Two of the ramp spans were shifted six feet to the north but did not fall from their piers (Figure 10). Fortunately, the disruption caused by this failure was minimized because the two highways run in parallel over Mobile Bay and there are alternate connections within a few miles to both the east and west.

10 Case Study of the Transportation Sector’s Response to and Recovery from Hurricanes Katrina and Rita
FIGURE 8 Damaged segments of the Twin Span Bridge.
FIGURE 9 Runaway barge and damage on I-10 – Pascagoula, Mississippi.
FIGURE 10 Displaced segments on I-10 – U.S. 90 ramp in Mobile Bay.
Grenzeback and Lukmann 11
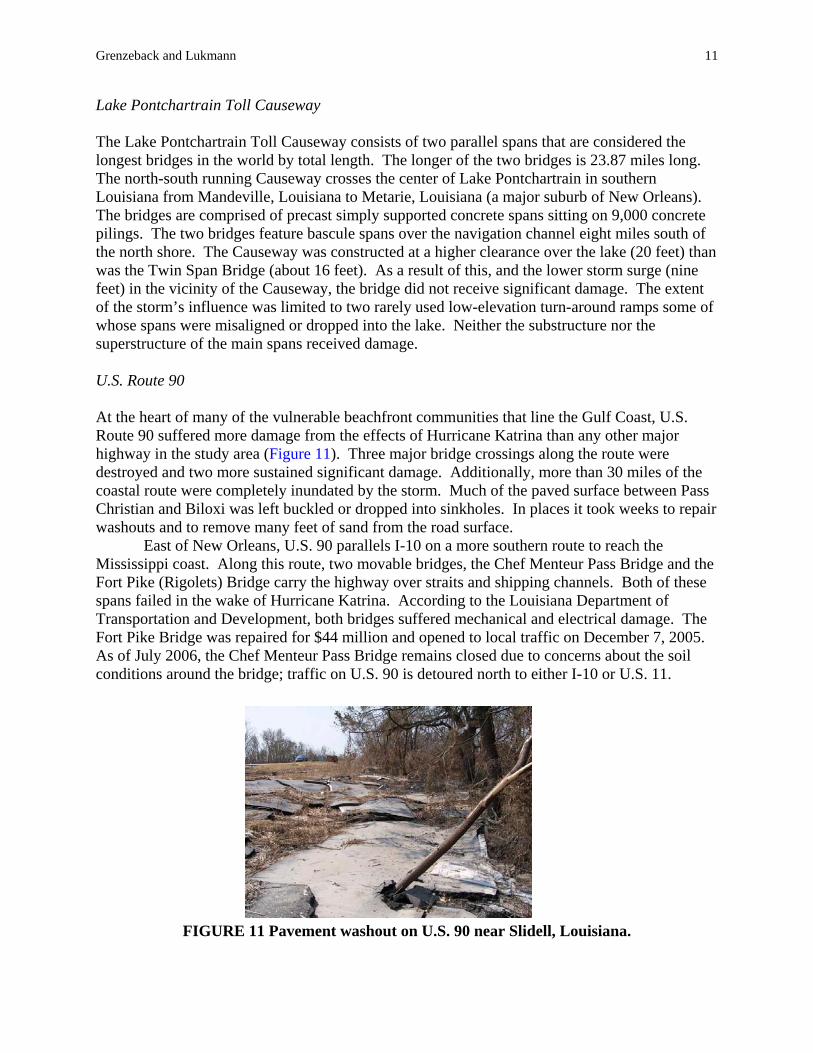
Lake Pontchartrain Toll Causeway The Lake Pontchartrain Toll Causeway consists of two parallel spans that are considered the longest bridges in the world by total length. The longer of the two bridges is 23.87 miles long. The north-south running Causeway crosses the center of Lake Pontchartrain in southern Louisiana from Mandeville, Louisiana to Metarie, Louisiana (a major suburb of New Orleans). The bridges are comprised of precast simply supported concrete spans sitting on 9,000 concrete pilings. The two bridges feature bascule spans over the navigation channel eight miles south of the north shore. The Causeway was constructed at a higher clearance over the lake (20 feet) than was the Twin Span Bridge (about 16 feet). As a result of this, and the lower storm surge (nine feet) in the vicinity of the Causeway, the bridge did not receive significant damage. The extent of the storm’s influence was limited to two rarely used low-elevation turn-around ramps some of whose spans were misaligned or dropped into the lake. Neither the substructure nor the superstructure of the main spans received damage. U.S. Route 90 At the heart of many of the vulnerable beachfront communities that line the Gulf Coast, U.S. Route 90 suffered more damage from the effects of Hurricane Katrina than any other major highway in the study area (Figure 11). Three major bridge crossings along the route were destroyed and two more sustained significant damage. Additionally, more than 30 miles of the coastal route were completely inundated by the storm. Much of the paved surface between Pass Christian and Biloxi was left buckled or dropped into sinkholes. In places it took weeks to repair washouts and to remove many feet of sand from the road surface.
East of New Orleans, U.S. 90 parallels I-10 on a more southern route to reach the Mississippi coast. Along this route, two movable bridges, the Chef Menteur Pass Bridge and the Fort Pike (Rigolets) Bridge carry the highway over straits and shipping channels. Both of these spans failed in the wake of Hurricane Katrina. According to the Louisiana Department of Transportation and Development, both bridges suffered mechanical and electrical damage. The Fort Pike Bridge was repaired for $44 million and opened to local traffic on December 7, 2005. As of July 2006, the Chef Menteur Pass Bridge remains closed due to concerns about the soil conditions around the bridge; traffic on U.S. 90 is detoured north to either I-10 or U.S. 11.
FIGURE 11 Pavement washout on U.S. 90 near Slidell, Louisiana.
12 Case Study of the Transportation Sector’s Response to and Recovery from Hurricanes Katrina and Rita
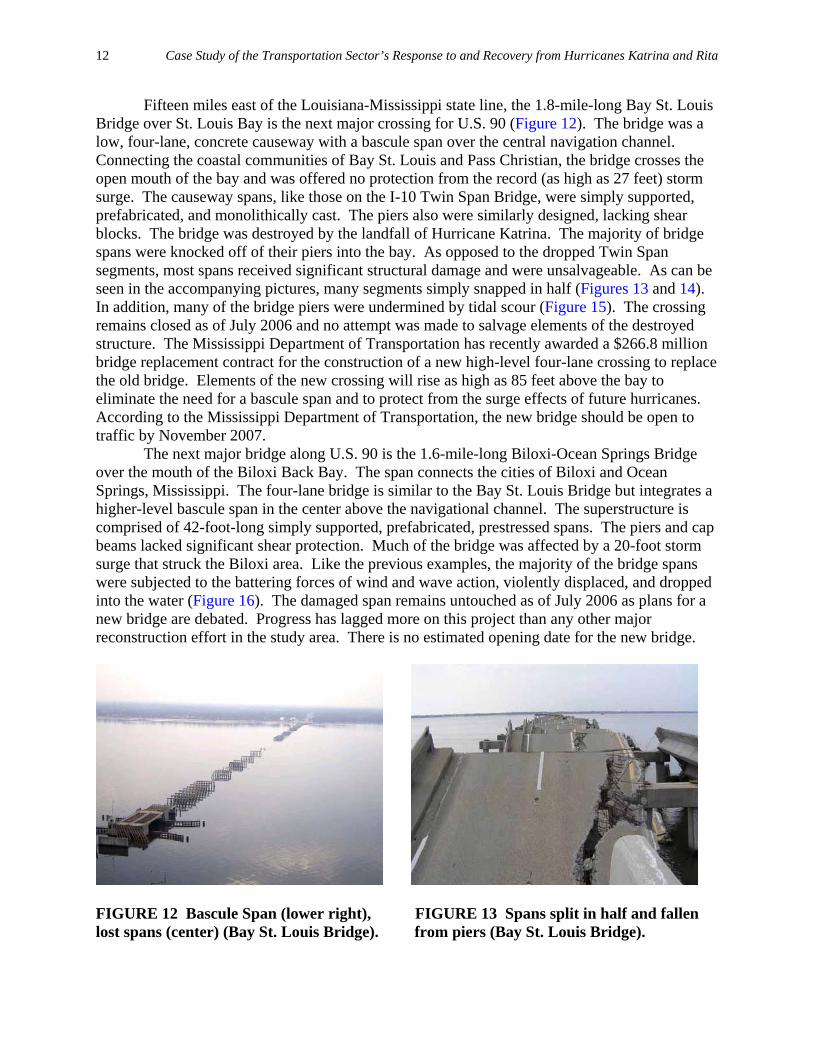
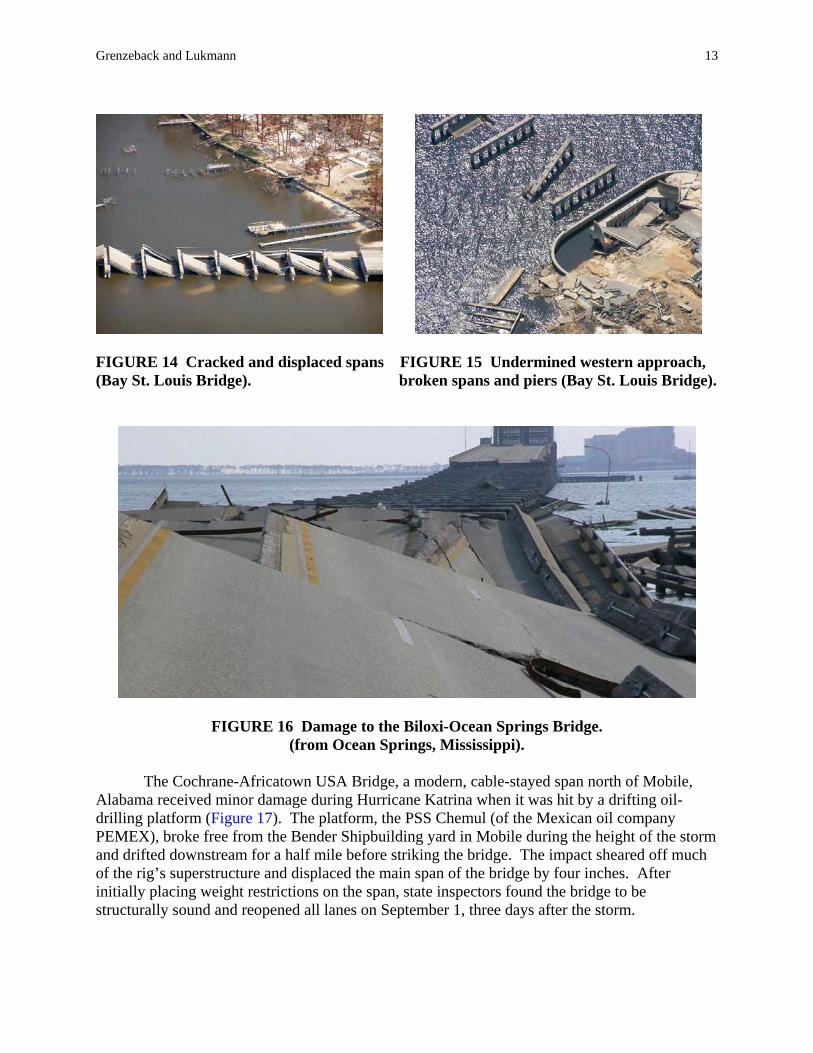
Fifteen miles east of the Louisiana-Mississippi state line, the 1.8-mile-long Bay St. Louis Bridge over St. Louis Bay is the next major crossing for U.S. 90 (Figure 12). The bridge was a low, four-lane, concrete causeway with a bascule span over the central navigation channel. Connecting the coastal communities of Bay St. Louis and Pass Christian, the bridge crosses the open mouth of the bay and was offered no protection from the record (as high as 27 feet) storm surge. The causeway spans, like those on the I-10 Twin Span Bridge, were simply supported, prefabricated, and monolithically cast. The piers also were similarly designed, lacking shear blocks. The bridge was destroyed by the landfall of Hurricane Katrina. The majority of bridge spans were knocked off of their piers into the bay. As opposed to the dropped Twin Span segments, most spans received significant structural damage and were unsalvageable. As can be seen in the accompanying pictures, many segments simply snapped in half (Figures 13 and 14). In addition, many of the bridge piers were undermined by tidal scour (Figure 15). The crossing remains closed as of July 2006 and no attempt was made to salvage elements of the destroyed structure. The Mississippi Department of Transportation has recently awarded a $266.8 million bridge replacement contract for the construction of a new high-level four-lane crossing to replace the old bridge. Elements of the new crossing will rise as high as 85 feet above the bay to eliminate the need for a bascule span and to protect from the surge effects of future hurricanes. According to the Mississippi Department of Transportation, the new bridge should be open to traffic by November 2007.
The next major bridge along U.S. 90 is the 1.6-mile-long Biloxi-Ocean Springs Bridge over the mouth of the Biloxi Back Bay. The span connects the cities of Biloxi and Ocean Springs, Mississippi. The four-lane bridge is similar to the Bay St. Louis Bridge but integrates a higher-level bascule span in the center above the navigational channel. The superstructure is comprised of 42-foot-long simply supported, prefabricated, prestressed spans. The piers and cap beams lacked significant shear protection. Much of the bridge was affected by a 20-foot storm surge that struck the Biloxi area. Like the previous examples, the majority of the bridge spans were subjected to the battering forces of wind and wave action, violently displaced, and dropped into the water (Figure 16). The damaged span remains untouched as of July 2006 as plans for a new bridge are debated. Progress has lagged more on this project than any other major reconstruction effort in the study area. There is no estimated opening date for the new bridge.
FIGURE 12 Bascule Span (lower right), FIGURE 13 Spans split in half and fallen lost spans (center) (Bay St. Louis Bridge). from piers (Bay St. Louis Bridge).
Grenzeback and Lukmann 13
FIGURE 14 Cracked and displaced spans FIGURE 15 Undermined western approach, (Bay St. Louis Bridge). broken spans and piers (Bay St. Louis Bridge).
FIGURE 16 Damage to the Biloxi-Ocean Springs Bridge. (from Ocean Springs, Mississippi).
The Cochrane-Africatown USA Bridge, a modern, cable-stayed span north of Mobile,
Alabama received minor damage during Hurricane Katrina when it was hit by a drifting oil-drilling platform (Figure 17). The platform, the PSS Chemul (of the Mexican oil company PEMEX), broke free from the Bender Shipbuilding yard in Mobile during the height of the storm and drifted downstream for a half mile before striking the bridge. The impact sheared off much of the rig’s superstructure and displaced the main span of the bridge by four inches. After initially placing weight restrictions on the span, state inspectors found the bridge to be structurally sound and reopened all lanes on September 1, three days after the storm.

14 Case Study of the Transportation Sector’s Response to and Recovery from Hurricanes Katrina and Rita
FIGURE 17 Cochrane Bridge struck by loose oil rig (Mobile, Alabama). New Orleans The City of New Orleans was closed for more than a month following the final landfall of Hurricane Katrina. Although the City was prepared to reopen some neighborhoods as early as September 19, Hurricane Rita, which re-flooded the city, prevented this. During the first month, the city was open only to emergency and recovery personnel. Most of the major transportation corridors through the city, including the Crescent City Connector, Airline Highway, I-10, I-610, and U.S. 90, were closed to through traffic. East and westbound freight shipments across the Central Gulf Coast used I-12 to bypass New Orleans. Other Highways Other major highways also were closed in the days following the storm and were reopened as quickly as the debris could be removed from the roadways. Although these highways did not receive significant damage from the storm, their closure exacerbated the difficulty of accessing some of the hardest hit areas in the region. Among the major roads that were closed for at least three days were Interstate 55 south of Hammond, Louisiana; Interstate 110 south of I-10 to Biloxi, Mississippi; U.S. 49 north from Gulfport to Seminary, Mississippi; Interstate 59 south of Laurel, Mississippi; U.S. 84 from Collins, Mississippi to Waynesboro, Mississippi; and U.S. 98 from Mobile to Hattiesburg, Mississippi. Countless smaller state and local roads in Louisiana, Mississippi and Alabama also were closed for varying durations. Hurricane Rita Impacts The region struck hardest by Hurricane Rita was southern Cameron Parish in the southwestern corner of Louisiana. The area, a wide swath of ranches, bayous, and wilderness preserves was almost entirely swept away by the catastrophic storm surge. In Cameron, the parish seat, the district courthouse was one of the few structures left intact. In Holly Beach, only the water tower was left standing.
Grenzeback and Lukmann 15
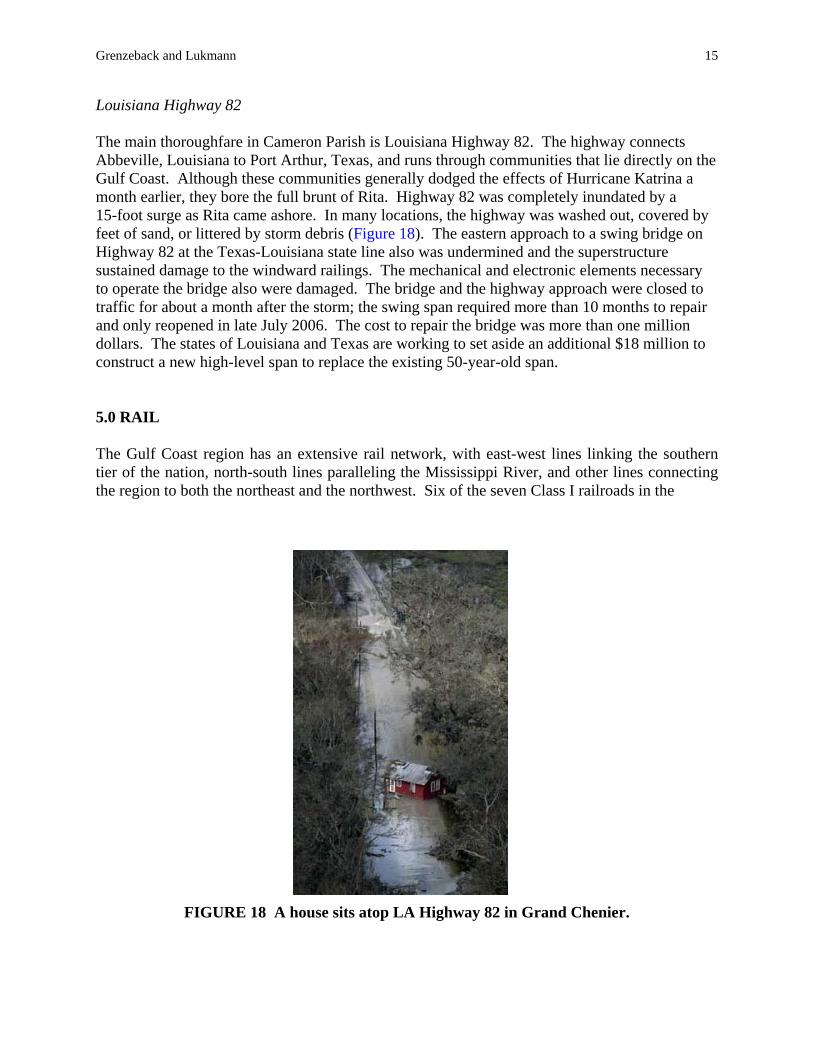
Louisiana Highway 82 The main thoroughfare in Cameron Parish is Louisiana Highway 82. The highway connects Abbeville, Louisiana to Port Arthur, Texas, and runs through communities that lie directly on the Gulf Coast. Although these communities generally dodged the effects of Hurricane Katrina a month earlier, they bore the full brunt of Rita. Highway 82 was completely inundated by a 15-foot surge as Rita came ashore. In many locations, the highway was washed out, covered by feet of sand, or littered by storm debris (Figure 18). The eastern approach to a swing bridge on Highway 82 at the Texas-Louisiana state line also was undermined and the superstructure sustained damage to the windward railings. The mechanical and electronic elements necessary to operate the bridge also were damaged. The bridge and the highway approach were closed to traffic for about a month after the storm; the swing span required more than 10 months to repair and only reopened in late July 2006. The cost to repair the bridge was more than one million dollars. The states of Louisiana and Texas are working to set aside an additional $18 million to construct a new high-level span to replace the existing 50-year-old span. 5.0 RAIL The Gulf Coast region has an extensive rail network, with east-west lines linking the southern tier of the nation, north-south lines paralleling the Mississippi River, and other lines connecting the region to both the northeast and the northwest. Six of the seven Class I railroads in the
FIGURE 18 A house sits atop LA Highway 82 in Grand Chenier.
16 Case Study of the Transportation Sector’s Response to and Recovery from Hurricanes Katrina and Rita
United States serve the study region, along with several short lines.6,7 These railroads connect with the major ports in the region, carrying international cargo shipments as well as important regional commodities such as chemical products, paper, lumber, and grains. The Gulf Coast region also serves as a critical junction for national freight movements, with New Orleans serving as a major interconnection between eastern and western railroads. Intercity passenger rail services are provided by the National Railroad Passenger Corporation (Amtrak) to Los Angeles, Chicago, New York, and Orlando.
The freight rail network in the United States is divided by the Mississippi River. Operations to the east are dominated by CSX Transportation and Norfolk Southern, and to the west by the Union Pacific and the Burlington Northern Santa Fe. The major gateway hubs, where the railroads interchange transcontinental shipments are Chicago, St. Louis, Memphis, and New Orleans. At New Orleans, CSX interchanges over 1,000 cars per day with the western railroads. A disruption to any of the four major gateways ripples immediately through the entire U.S. rail network. During the repairs after Hurricane Katrina, rail traffic that normally interchanged in New Orleans had to be routed through other gateways, placing additional strains on an already congested rail system.
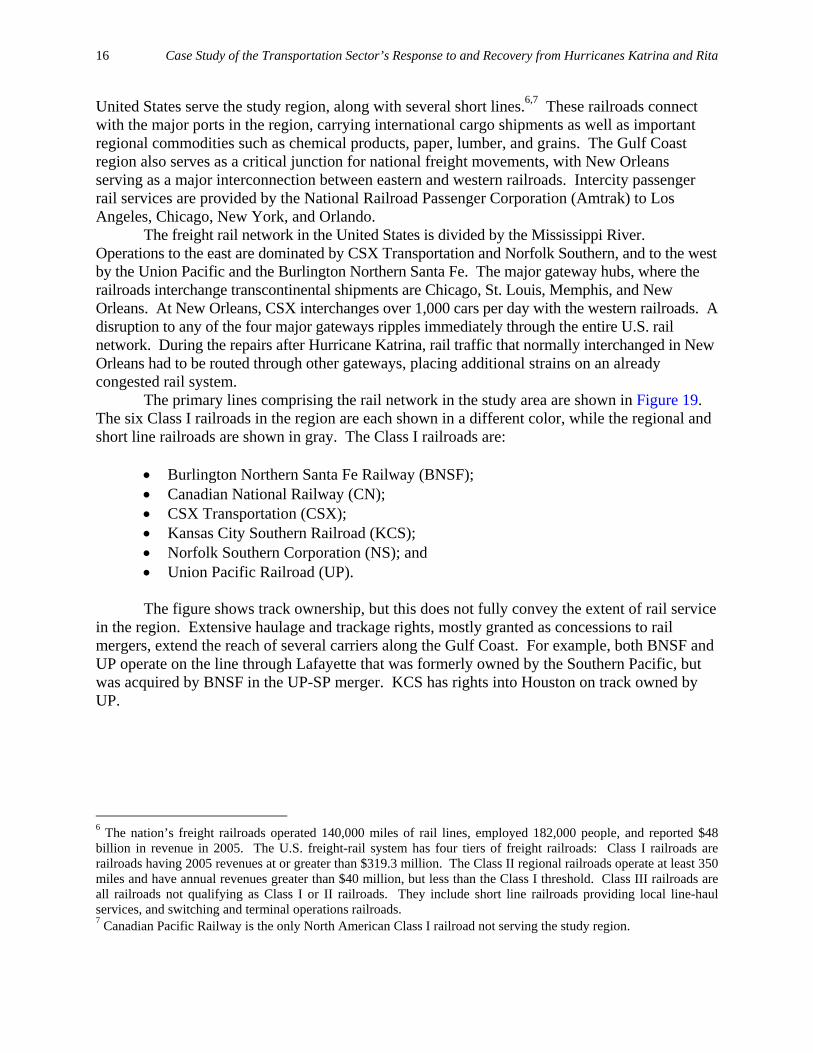
The primary lines comprising the rail network in the study area are shown in Figure 19. The six Class I railroads in the region are each shown in a different color, while the regional and short line railroads are shown in gray. The Class I railroads are:
• Burlington Northern Santa Fe Railway (BNSF); • Canadian National Railway (CN); • CSX Transportation (CSX); • Kansas City Southern Railroad (KCS); • Norfolk Southern Corporation (NS); and • Union Pacific Railroad (UP).
The figure shows track ownership, but this does not fully convey the extent of rail service
in the region. Extensive haulage and trackage rights, mostly granted as concessions to rail mergers, extend the reach of several carriers along the Gulf Coast. For example, both BNSF and UP operate on the line through Lafayette that was formerly owned by the Southern Pacific, but was acquired by BNSF in the UP-SP merger. KCS has rights into Houston on track owned by UP.
6 The nation’s freight railroads operated 140,000 miles of rail lines, employed 182,000 people, and reported $48 billion in revenue in 2005. The U.S. freight-rail system has four tiers of freight railroads: Class I railroads are railroads having 2005 revenues at or greater than $319.3 million. The Class II regional railroads operate at least 350 miles and have annual revenues greater than $40 million, but less than the Class I threshold. Class III railroads are all railroads not qualifying as Class I or II railroads. They include short line railroads providing local line-haul services, and switching and terminal operations railroads. 7 Canadian Pacific Railway is the only North American Class I railroad not serving the study region.
Grenzeback and Lukmann 17
FIGURE 19 Major rail lines in the Central Gulf Coast region.
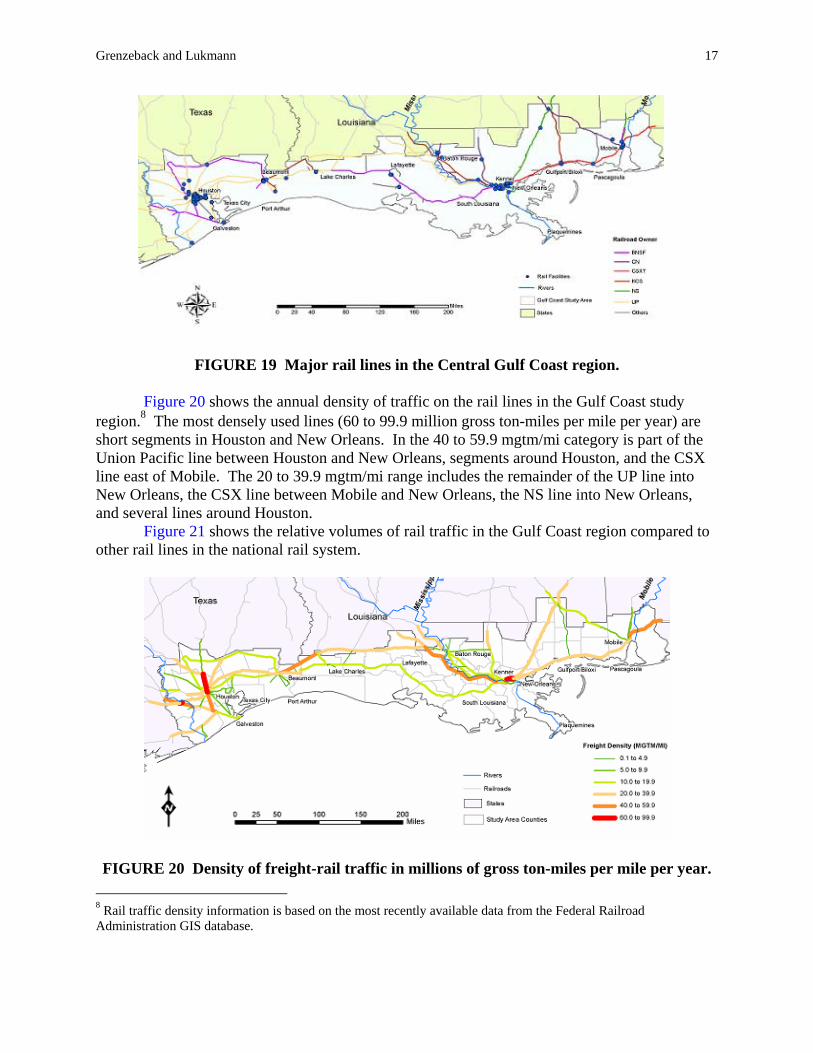
Figure 20 shows the annual density of traffic on the rail lines in the Gulf Coast study region.8 The most densely used lines (60 to 99.9 million gross ton-miles per mile per year) are short segments in Houston and New Orleans. In the 40 to 59.9 mgtm/mi category is part of the Union Pacific line between Houston and New Orleans, segments around Houston, and the CSX line east of Mobile. The 20 to 39.9 mgtm/mi range includes the remainder of the UP line into New Orleans, the CSX line between Mobile and New Orleans, the NS line into New Orleans, and several lines around Houston.
Figure 21 shows the relative volumes of rail traffic in the Gulf Coast region compared to other rail lines in the national rail system.
FIGURE 20 Density of freight-rail traffic in millions of gross ton-miles per mile per year.
8 Rail traffic density information is based on the most recently available data from the Federal Railroad Administration GIS database.
18 Case Study of the Transportation Sector’s Response to and Recovery from Hurricanes Katrina and Rita
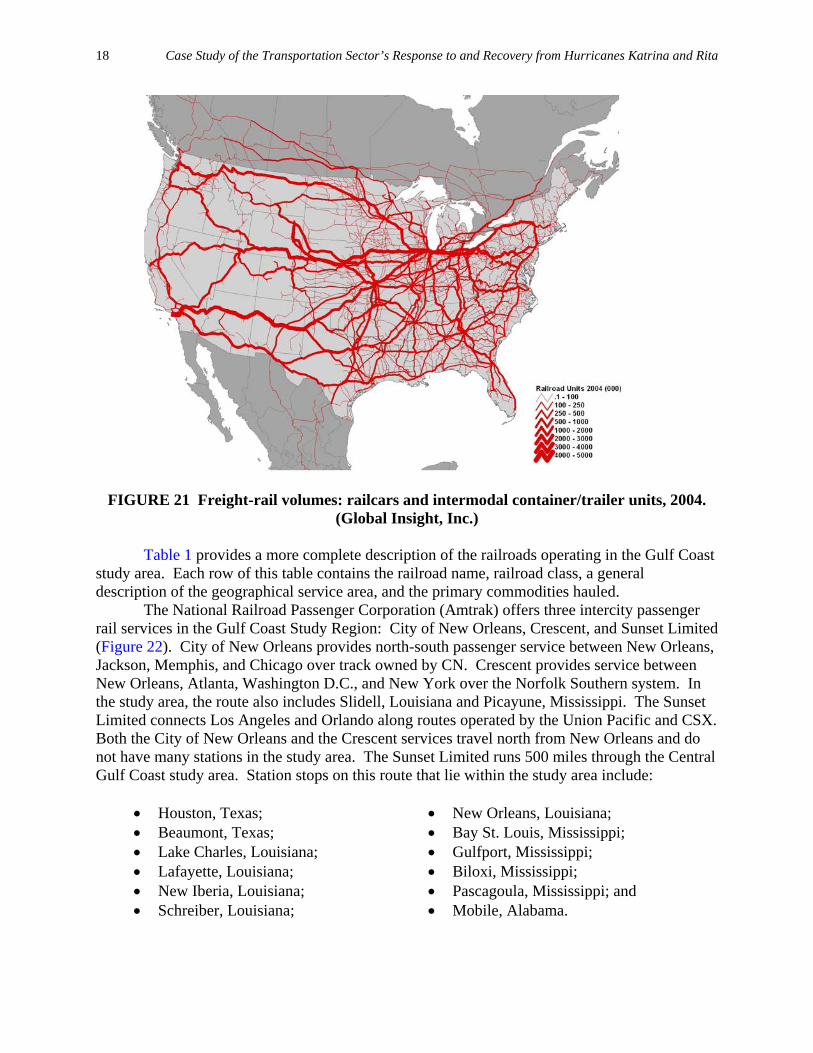
FIGURE 21 Freight-rail volumes: railcars and intermodal container/trailer units, 2004. (Global Insight, Inc.)
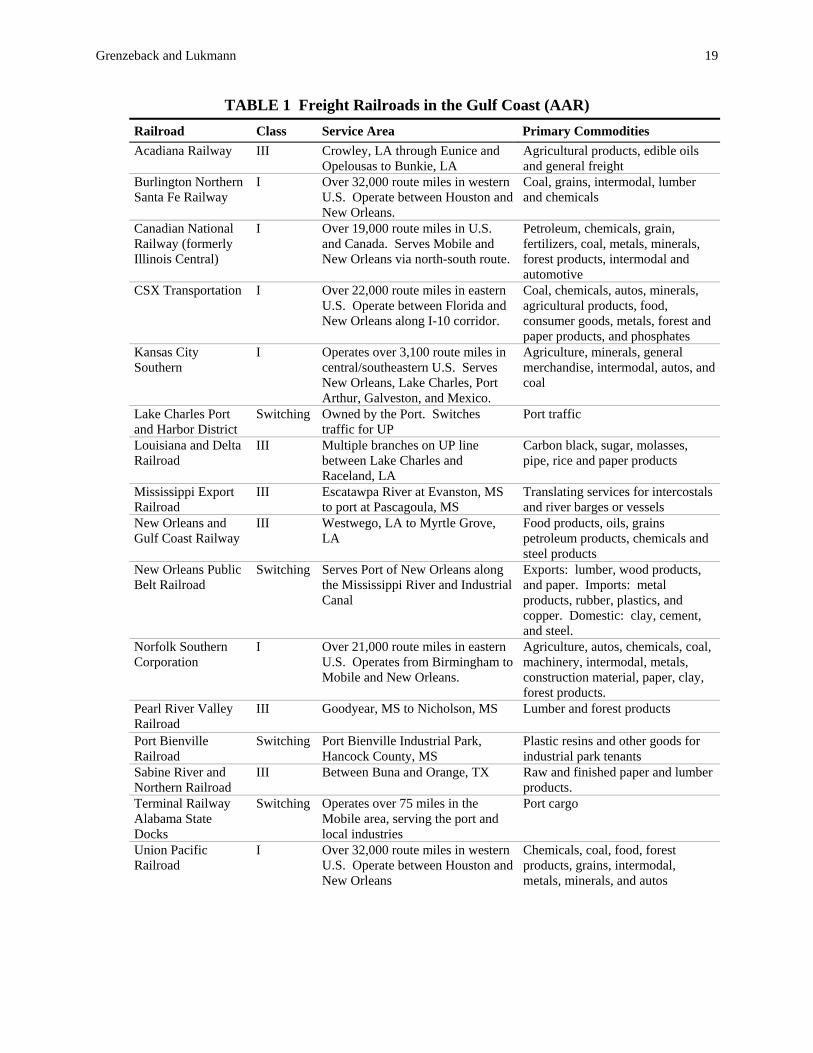
Table 1 provides a more complete description of the railroads operating in the Gulf Coast
study area. Each row of this table contains the railroad name, railroad class, a general description of the geographical service area, and the primary commodities hauled.
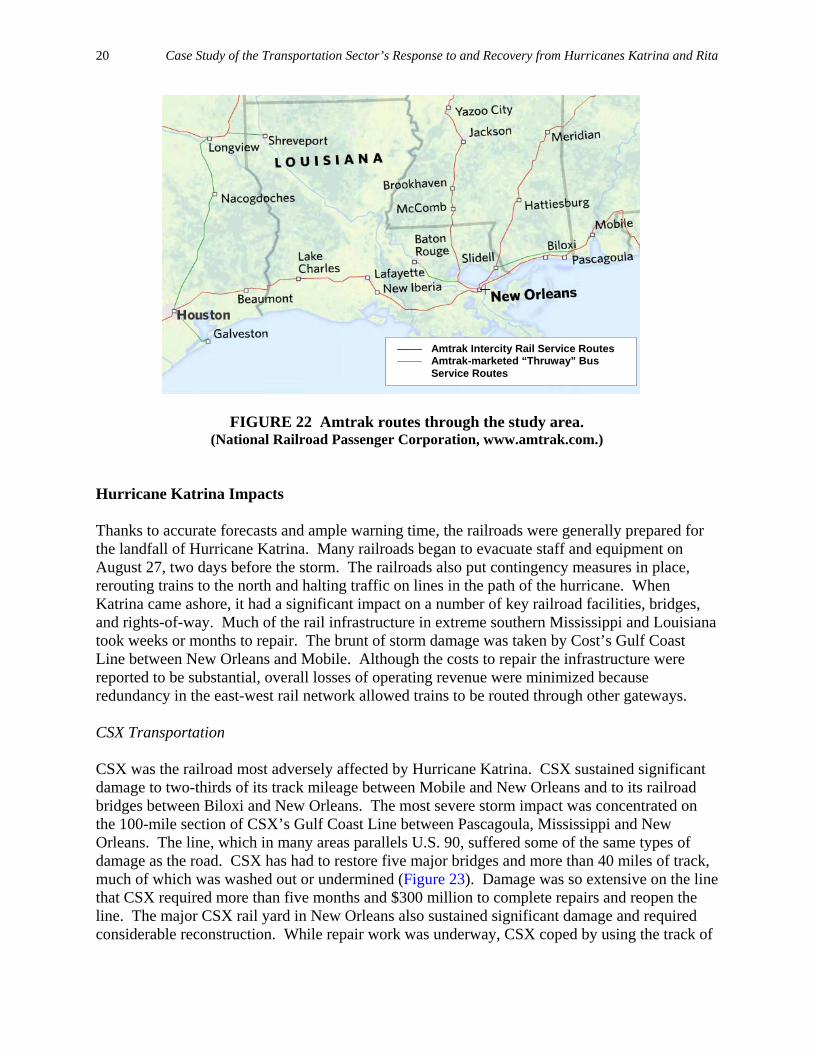
The National Railroad Passenger Corporation (Amtrak) offers three intercity passenger rail services in the Gulf Coast Study Region: City of New Orleans, Crescent, and Sunset Limited (Figure 22). City of New Orleans provides north-south passenger service between New Orleans, Jackson, Memphis, and Chicago over track owned by CN. Crescent provides service between New Orleans, Atlanta, Washington D.C., and New York over the Norfolk Southern system. In the study area, the route also includes Slidell, Louisiana and Picayune, Mississippi. The Sunset Limited connects Los Angeles and Orlando along routes operated by the Union Pacific and CSX. Both the City of New Orleans and the Crescent services travel north from New Orleans and do not have many stations in the study area. The Sunset Limited runs 500 miles through the Central Gulf Coast study area. Station stops on this route that lie within the study area include:
• Houston, Texas; • New Orleans, Louisiana; • Beaumont, Texas; • Bay St. Louis, Mississippi; • Lake Charles, Louisiana; • Gulfport, Mississippi; • Lafayette, Louisiana; • Biloxi, Mississippi; • New Iberia, Louisiana; • Pascagoula, Mississippi; and • Schreiber, Louisiana; • Mobile, Alabama.
Grenzeback and Lukmann 19
TABLE 1 Freight Railroads in the Gulf Coast (AAR) Railroad Class Service Area Primary Commodities Acadiana Railway III Crowley, LA through Eunice and
Opelousas to Bunkie, LA Agricultural products, edible oils and general freight
Burlington Northern Santa Fe Railway
I Over 32,000 route miles in western U.S. Operate between Houston and New Orleans.
Coal, grains, intermodal, lumber and chemicals
Canadian National Railway (formerly Illinois Central)
I Over 19,000 route miles in U.S. and Canada. Serves Mobile and New Orleans via north-south route.
Petroleum, chemicals, grain, fertilizers, coal, metals, minerals, forest products, intermodal and automotive
CSX Transportation I Over 22,000 route miles in eastern U.S. Operate between Florida and New Orleans along I-10 corridor.
Coal, chemicals, autos, minerals, agricultural products, food, consumer goods, metals, forest and paper products, and phosphates
Kansas City Southern
I Operates over 3,100 route miles in central/southeastern U.S. Serves New Orleans, Lake Charles, Port Arthur, Galveston, and Mexico.
Agriculture, minerals, general merchandise, intermodal, autos, and coal
Lake Charles Port and Harbor District
Switching Owned by the Port. Switches traffic for UP
Port traffic
Louisiana and Delta Railroad
III Multiple branches on UP line between Lake Charles and Raceland, LA
Carbon black, sugar, molasses, pipe, rice and paper products
Mississippi Export Railroad
III Escatawpa River at Evanston, MS to port at Pascagoula, MS
Translating services for intercostals and river barges or vessels
New Orleans and Gulf Coast Railway
III Westwego, LA to Myrtle Grove, LA
Food products, oils, grains petroleum products, chemicals and steel products
New Orleans Public Belt Railroad
Switching Serves Port of New Orleans along the Mississippi River and Industrial Canal
Exports: lumber, wood products, and paper. Imports: metal products, rubber, plastics, and copper. Domestic: clay, cement, and steel.
Norfolk Southern Corporation
I Over 21,000 route miles in eastern U.S. Operates from Birmingham to Mobile and New Orleans.
Agriculture, autos, chemicals, coal, machinery, intermodal, metals, construction material, paper, clay, forest products.
Pearl River Valley Railroad
III Goodyear, MS to Nicholson, MS Lumber and forest products
Port Bienville Railroad
Switching Port Bienville Industrial Park, Hancock County, MS
Plastic resins and other goods for industrial park tenants
Sabine River and Northern Railroad
III Between Buna and Orange, TX Raw and finished paper and lumber products.
Terminal Railway Alabama State Docks
Switching Operates over 75 miles in the Mobile area, serving the port and local industries
Port cargo
Union Pacific Railroad
I Over 32,000 route miles in western U.S. Operate between Houston and New Orleans
Chemicals, coal, food, forest products, grains, intermodal, metals, minerals, and autos
20 Case Study of the Transportation Sector’s Response to and Recovery from Hurricanes Katrina and Rita
FIGURE 22 Amtrak routes through the study area. (National Railroad Passenger Corporation, www.amtrak.com.)
Hurricane Katrina Impacts Thanks to accurate forecasts and ample warning time, the railroads were generally prepared for the landfall of Hurricane Katrina. Many railroads began to evacuate staff and equipment on August 27, two days before the storm. The railroads also put contingency measures in place, rerouting trains to the north and halting traffic on lines in the path of the hurricane. When Katrina came ashore, it had a significant impact on a number of key railroad facilities, bridges, and rights-of-way. Much of the rail infrastructure in extreme southern Mississippi and Louisiana took weeks or months to repair. The brunt of storm damage was taken by Cost’s Gulf Coast Line between New Orleans and Mobile. Although the costs to repair the infrastructure were reported to be substantial, overall losses of operating revenue were minimized because redundancy in the east-west rail network allowed trains to be routed through other gateways. CSX Transportation CSX was the railroad most adversely affected by Hurricane Katrina. CSX sustained significant damage to two-thirds of its track mileage between Mobile and New Orleans and to its railroad bridges between Biloxi and New Orleans. The most severe storm impact was concentrated on the 100-mile section of CSX’s Gulf Coast Line between Pascagoula, Mississippi and New Orleans. The line, which in many areas parallels U.S. 90, suffered some of the same types of damage as the road. CSX has had to restore five major bridges and more than 40 miles of track, much of which was washed out or undermined (Figure 23). Damage was so extensive on the line that CSX required more than five months and $300 million to complete repairs and reopen the line. The major CSX rail yard in New Orleans also sustained significant damage and required considerable reconstruction. While repair work was underway, CSX coped by using the track of
Amtrak Intercity Rail Service Routes Amtrak-marketed “Thruway” Bus Service Routes

Grenzeback and Lukmann 21
FIGURE 23 Remnants of the CSX Gulf Coast line. other less-hard-hit railroads in the region and by rerouting freight interchanged with the western railroads as far north as the St. Louis Mississippi River crossing.9 CSX handles or interchanges more than 1,000 freight cars a day in the Gulf Coast region and serves more than 20 industries or ports. Temporary service changes included:
• Two trains each day rerouted through St. Louis; • Two trains each day rerouted through Memphis; • Three trains each day rerouted over the NS route (once it reopened); • One train each day rerouted through Meridian to/from the KCS; and • Traffic interchanged with CN was shifted from New Orleans to Mobile.
According to financial analysts, even though CSX was the most negatively impacted
railroad, impact on rail revenue was insignificant. Neglecting interchange traffic, CSX only delivered and received 23,000 merchandise carloads in all of Louisiana last year and a slim 15,000 carloads in Mississippi. Those figures represent only 0.5 percent of the company’s 7.5 million annual carloads. Although the interchange market is more significant to revenue, much of that traffic was rerouted to other interchange gateways. Merrill Lynch forecast that rail revenue would be negatively impacted by less than two percent, “with interim costs contributing to a slightly larger negative impact in the near term.” Market analysts anticipated that additional shipments of commodities such as concrete and lumber for the rebuilding effort would make up for the lost carloads, while the capital repair and replacement costs will remain.10
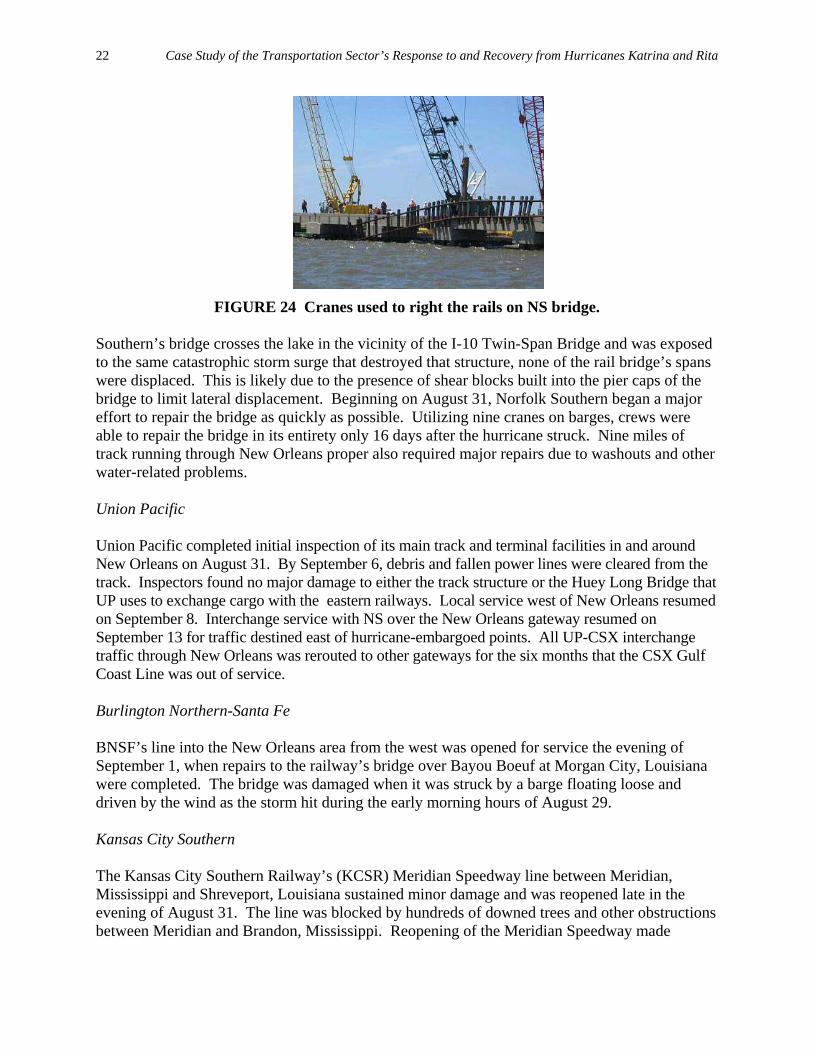
Norfolk Southern Although not affected to the same extent as CSX, Norfolk Southern’s line into New Orleans received significant damage. Nearly five miles of track were washed from the top of the 5.8-mile-long rail bridge and into the Lake Pontchartrain (Figure 24). Although Norfolk
9 Hurricane Katrina, presentation by Mark Hinsdale, CSX, at the Transportation Research Board Annual Meeting, Washington, D.C., January 5, 2006. 10 CSX Most Exposed In Transport Sector to Katrina. Forbes Magazine, 9/1/05. www.Forbes.com.
22 Case Study of the Transportation Sector’s Response to and Recovery from Hurricanes Katrina and Rita
FIGURE 24 Cranes used to right the rails on NS bridge. Southern’s bridge crosses the lake in the vicinity of the I-10 Twin-Span Bridge and was exposed to the same catastrophic storm surge that destroyed that structure, none of the rail bridge’s spans were displaced. This is likely due to the presence of shear blocks built into the pier caps of the bridge to limit lateral displacement. Beginning on August 31, Norfolk Southern began a major effort to repair the bridge as quickly as possible. Utilizing nine cranes on barges, crews were able to repair the bridge in its entirety only 16 days after the hurricane struck. Nine miles of track running through New Orleans proper also required major repairs due to washouts and other water-related problems. Union Pacific Union Pacific completed initial inspection of its main track and terminal facilities in and around New Orleans on August 31. By September 6, debris and fallen power lines were cleared from the track. Inspectors found no major damage to either the track structure or the Huey Long Bridge that UP uses to exchange cargo with the eastern railways. Local service west of New Orleans resumed on September 8. Interchange service with NS over the New Orleans gateway resumed on September 13 for traffic destined east of hurricane-embargoed points. All UP-CSX interchange traffic through New Orleans was rerouted to other gateways for the six months that the CSX Gulf Coast Line was out of service. Burlington Northern-Santa Fe BNSF’s line into the New Orleans area from the west was opened for service the evening of September 1, when repairs to the railway’s bridge over Bayou Boeuf at Morgan City, Louisiana were completed. The bridge was damaged when it was struck by a barge floating loose and driven by the wind as the storm hit during the early morning hours of August 29. Kansas City Southern The Kansas City Southern Railway’s (KCSR) Meridian Speedway line between Meridian, Mississippi and Shreveport, Louisiana sustained minor damage and was reopened late in the evening of August 31. The line was blocked by hundreds of downed trees and other obstructions between Meridian and Brandon, Mississippi. Reopening of the Meridian Speedway made
Grenzeback and Lukmann 23
possible the restoration of rail service to local customers and to Norfolk Southern. NS utilizes the route as a link for its intermodal traffic moving between Meridian and Alliance, Texas. Canadian National CN received the least amount of damage of any of the Class I railroads. Although flooding took one of its intermodal terminals offline, service to the New Orleans area was restored on August 30, one day after the storm hit. Amtrak Amtrak runs passenger trains through the study area over the UP, NS, and CSX freight line. In the days immediately before and after Hurricane Katrina, all Amtrak service through the New Orleans area was suspended. The north-south running City of New Orleans (from Chicago) was stopped at Memphis, Tennessee. Service was later restored as far south as Hammond, Louisiana, and on October 8, 2005, Amtrak resumed service to New Orleans. The Crescent (from New York) was stopped at Atlanta, Georgia. As damage was repaired on the Norfolk Southern line, Crescent service was extended to Meridian, Mississippi. Amtrak restored service to New Orleans on October 9, 2005. The Sunset Limited service (between Orlando and Los Angeles) west of New Orleans was truncated to San Antonio, Texas. Service resumed to New Orleans on November 4. East of New Orleans, the Sunset Limited runs over the CSX Gulf Coast line, a route heavily damaged by the storm. As a result, service was completely suspended between New Orleans and Orlando, Florida and had not been resumed as of August 2006. Amtrak has made no announcements regarding plans for resumption of service. Hurricane Rita Impacts Due to significant advance preparation, railroads were generally able to resume operations in south Texas just a few days after Hurricane Rita came ashore. Because the storm’s winds and storm surge were less than had been predicted and because it struck east of the Houston and Galveston areas, damage was not as severe as it was from Hurricane Katrina four weeks earlier. Service to most mainlines was restored by September 30 and most Rita-related embargoes were lifted by October 4.
In advance of the storm, railroads moved their locomotives and freight cars out of much of south Texas. The railroads also aided in the evacuation of hundreds of people from the Houston and Galveston areas, with one Amtrak train operating on Union Pacific tracks to San Antonio and a Trinity Rail Express train operating on BNSF tracks to Dallas. Union Pacific In advance of the landfall of Hurricane Rita, Union Pacific shut down its South Texas yard operations at noon on September 22. In addition, UP issued embargoes on its primary routes into southern Texas, including Houston and Brownsville. UP also moved rolling stock inland from its Texas coastal yards in Galveston, Freeport, Corpus Christi and Bloomington. With the floodgates closed in New Orleans area, UP rerouted four interchange trains with the Norfolk Southern through the Memphis gateway.
24 Case Study of the Transportation Sector’s Response to and Recovery from Hurricanes Katrina and Rita
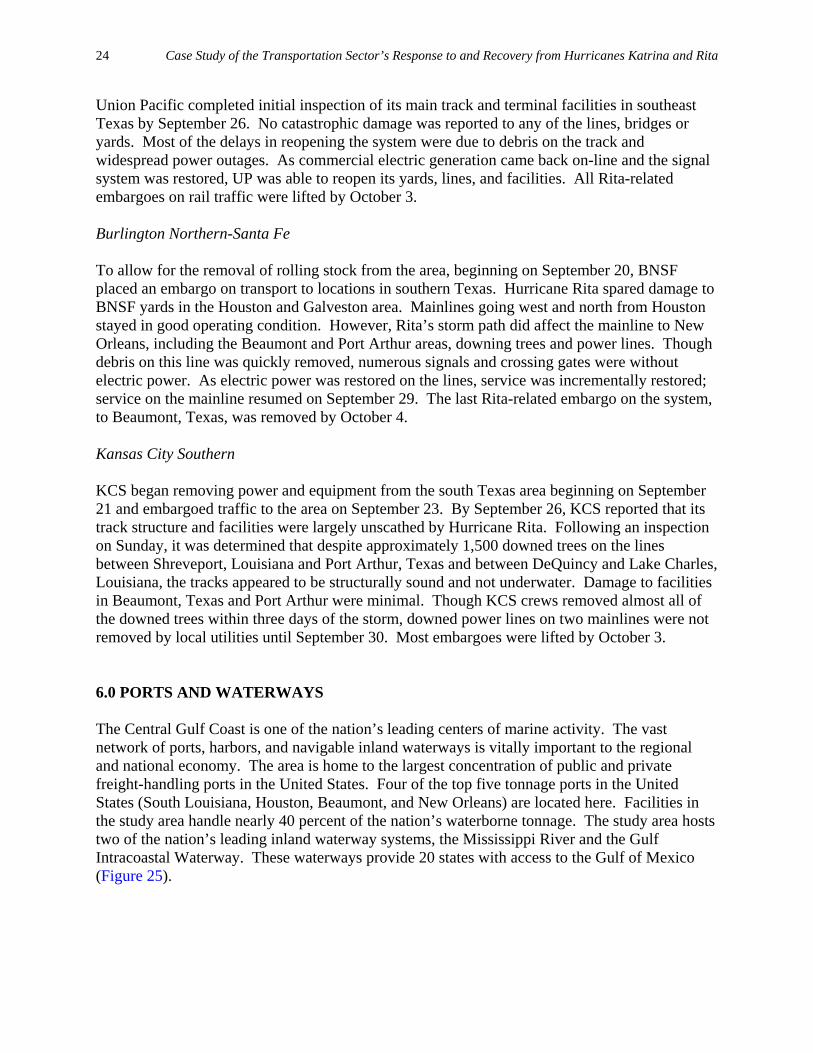
Union Pacific completed initial inspection of its main track and terminal facilities in southeast Texas by September 26. No catastrophic damage was reported to any of the lines, bridges or yards. Most of the delays in reopening the system were due to debris on the track and widespread power outages. As commercial electric generation came back on-line and the signal system was restored, UP was able to reopen its yards, lines, and facilities. All Rita-related embargoes on rail traffic were lifted by October 3. Burlington Northern-Santa Fe To allow for the removal of rolling stock from the area, beginning on September 20, BNSF placed an embargo on transport to locations in southern Texas. Hurricane Rita spared damage to BNSF yards in the Houston and Galveston area. Mainlines going west and north from Houston stayed in good operating condition. However, Rita’s storm path did affect the mainline to New Orleans, including the Beaumont and Port Arthur areas, downing trees and power lines. Though debris on this line was quickly removed, numerous signals and crossing gates were without electric power. As electric power was restored on the lines, service was incrementally restored; service on the mainline resumed on September 29. The last Rita-related embargo on the system, to Beaumont, Texas, was removed by October 4. Kansas City Southern KCS began removing power and equipment from the south Texas area beginning on September 21 and embargoed traffic to the area on September 23. By September 26, KCS reported that its track structure and facilities were largely unscathed by Hurricane Rita. Following an inspection on Sunday, it was determined that despite approximately 1,500 downed trees on the lines between Shreveport, Louisiana and Port Arthur, Texas and between DeQuincy and Lake Charles, Louisiana, the tracks appeared to be structurally sound and not underwater. Damage to facilities in Beaumont, Texas and Port Arthur were minimal. Though KCS crews removed almost all of the downed trees within three days of the storm, downed power lines on two mainlines were not removed by local utilities until September 30. Most embargoes were lifted by October 3. 6.0 PORTS AND WATERWAYS The Central Gulf Coast is one of the nation’s leading centers of marine activity. The vast network of ports, harbors, and navigable inland waterways is vitally important to the regional and national economy. The area is home to the largest concentration of public and private freight-handling ports in the United States. Four of the top five tonnage ports in the United States (South Louisiana, Houston, Beaumont, and New Orleans) are located here. Facilities in the study area handle nearly 40 percent of the nation’s waterborne tonnage. The study area hosts two of the nation’s leading inland waterway systems, the Mississippi River and the Gulf Intracoastal Waterway. These waterways provide 20 states with access to the Gulf of Mexico (Figure 25).
Grenzeback and Lukmann 25
FIGURE 25 Port facilities and navigable rivers in the Gulf Coast study area.
Ports can be comprised of a single facility or terminal, but the typical port is comprised of a number of public and private marine terminals within a given geographic region along a common body of water. The U.S. Army Corps of Engineers identifies almost 1,000 public and private freight-handling facilities throughout the central Gulf Coast, including different terminals within various defined port districts. Major port complexes include (from west to east):
• Freeport, Texas; • Houston Area, Texas (Ports of Houston, Texas City, and Galveston); • Port Arthur and Beaumont, Texas; • Lake Charles, Louisiana; • New Orleans Area, Louisiana (Ports of Baton Rouge, South Louisiana, New Orleans,
and Plaquemines); • Coastal Mississippi (Ports of Bienville, Gulfport, Biloxi, and Pascagoula); and • Mobile, Alabama. • The major navigable marine transportation networks in the study area include: • The Mississippi River in Louisiana (connects to the Missouri and Ohio river
systems); • The Atchafalaya River in Louisiana (connects to the Ouachita, Red and Black rivers); • The Mobile River in Alabama (connects to the Tombigbee, Tennessee, and Black
Warrior rivers); and • The Gulf Intracoastal Waterway (a protected coastal route running from the Texas-
Mexico border to Appalachee Bay in Florida).
The Gulf Coast serves numerous freight commodity transport chains. An estimated 60 percent of the nation’s energy imports and much of its domestic oil production flows through the Gulf Coast and is processed by facilities in the study area. Much of the nation’s exported agricultural goods moves by barge down the Mississippi River and is transferred to international
26 Case Study of the Transportation Sector’s Response to and Recovery from Hurricanes Katrina and Rita
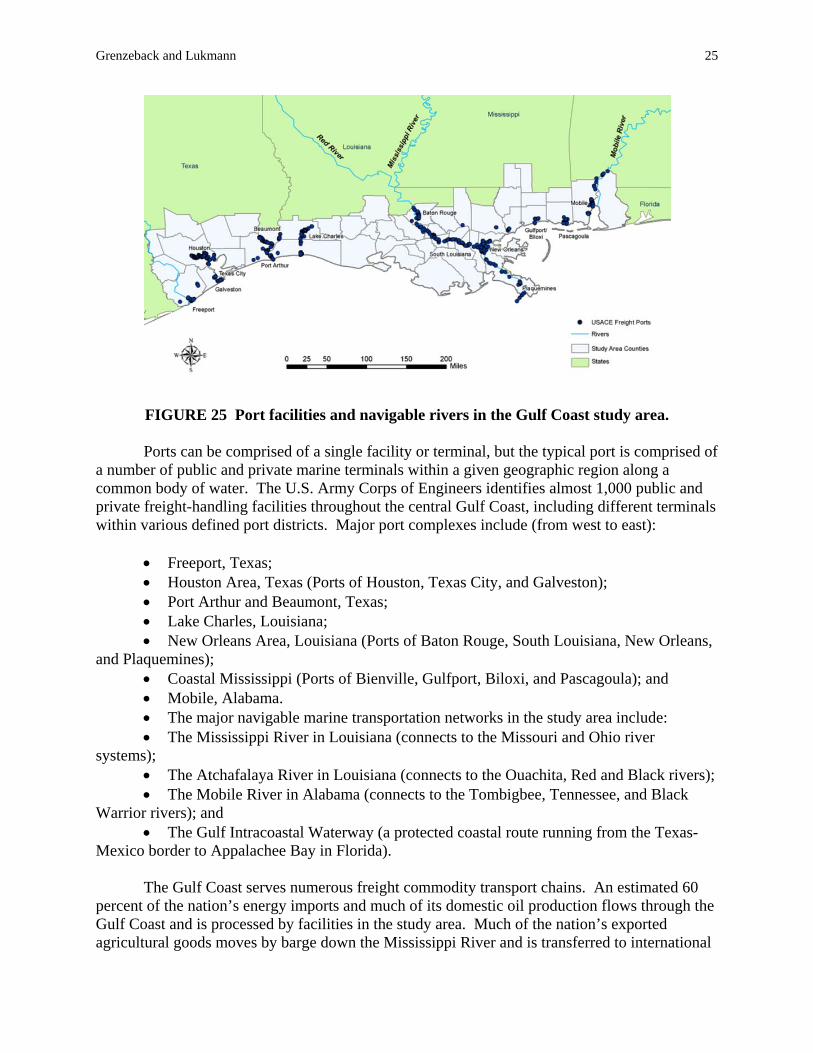
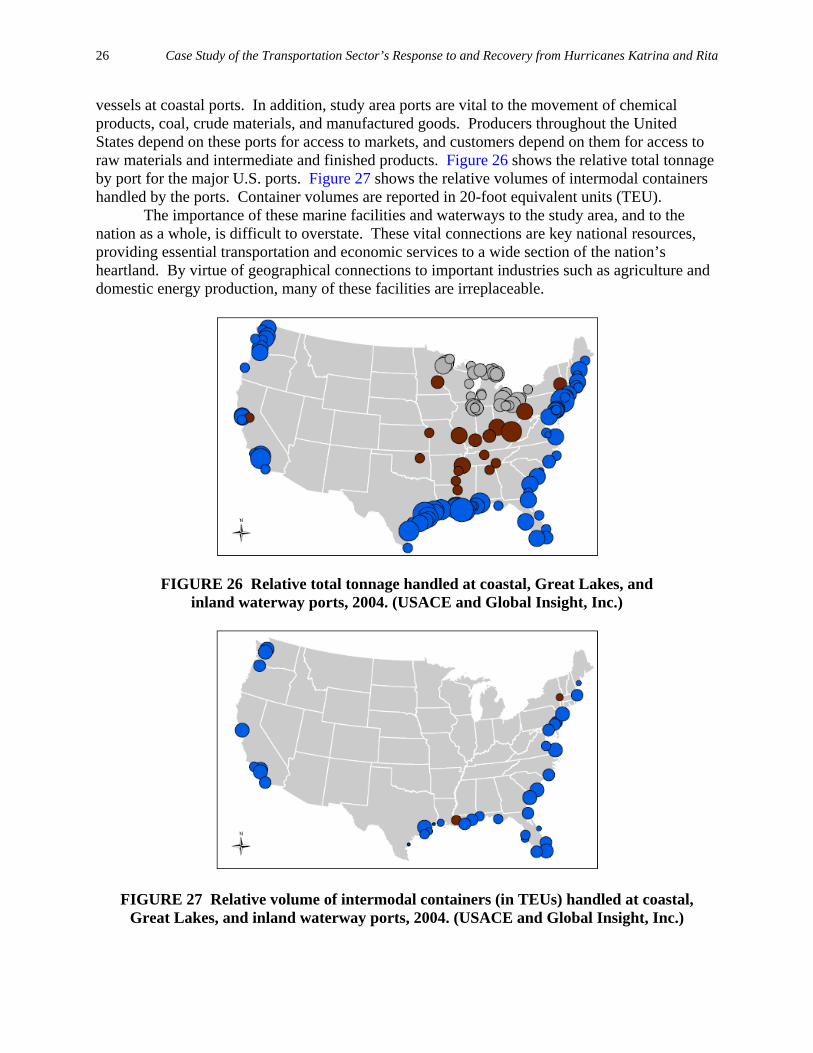
vessels at coastal ports. In addition, study area ports are vital to the movement of chemical products, coal, crude materials, and manufactured goods. Producers throughout the United States depend on these ports for access to markets, and customers depend on them for access to raw materials and intermediate and finished products. Figure 26 shows the relative total tonnage by port for the major U.S. ports. Figure 27 shows the relative volumes of intermodal containers handled by the ports. Container volumes are reported in 20-foot equivalent units (TEU).
The importance of these marine facilities and waterways to the study area, and to the nation as a whole, is difficult to overstate. These vital connections are key national resources, providing essential transportation and economic services to a wide section of the nation’s heartland. By virtue of geographical connections to important industries such as agriculture and domestic energy production, many of these facilities are irreplaceable.
FIGURE 26 Relative total tonnage handled at coastal, Great Lakes, and inland waterway ports, 2004. (USACE and Global Insight, Inc.)
FIGURE 27 Relative volume of intermodal containers (in TEUs) handled at coastal, Great Lakes, and inland waterway ports, 2004. (USACE and Global Insight, Inc.)
Grenzeback and Lukmann 27
Hurricane Katrina Impacts Many of the ports in the Central Gulf Coast region sustained significant damage from Hurricane Katrina. Due to their low-lying locations, the ports were susceptible to damage from all effects of the hurricane—high winds, heavy rains, and especially the storm surge. As much as these initial consequences affected port operations, prolonged power outages, waterway obstructions, and labor shortages were just as detrimental to efforts to resume operation. But confounding initial expectations that it would take a year for many ports to reopen, almost all ports in the Central Gulf Coast were able to reopen and provide services within a month of Katrina’s landfall. Many of these ports have now regained or exceeded pre-hurricane traffic levels. Although a number of the region’s large ports are detailed below, numerous smaller ports along the Mississippi coast also were similarly affected, especially the ports of Bienville, Biloxi, and Pascagoula.
The storm also wreaked havoc with the U.S. Coast Guard’s navigation aids—the system of buoys, beacons, and lighthouses that facilitate safe navigation. The Coast Guard estimated that approximate 1,800 aids to navigation were missing, relocated, or destroyed because of Hurricane Katrina. As of September 29, 2005, about four weeks after Hurricane Katrina struck, 850 of the 1,350 aids to navigation discrepancies identified by the Coast Guard had been repaired with permanent or temporary aids, and as of June 2006, the Coast Guard reported that only 149 aids still needed to be permanently or temporarily repaired; most were slated for repair during the summer of 2006.11 Port of New Orleans and the Mississippi River-Gulf Outlet The Port of New Orleans is the 5th largest port in the United States based on volume of cargo handled and 12th largest in the United States based on value of cargo. The port serves as the focal point for waterborne transportation of cargo to 28 states, and its cargo activity supported $37 billion in economic benefits the country and generated $2.8 billion in Federal tax revenue.12 The port is home to the longest wharf in the world, which is 2.1 miles long and can accommodate 15 vessels at a time.
The Port of New Orleans is the only deepwater port in the United States served by six Class I railroads. The port is the principal gateway in the United States for rubber imports and is a major transshipment point for steel, grain, coffee, chemicals, cocoa beans, and petroleum. Over 2,000 vessels from nearly 60 nations dock at the port annually. Additionally, 700,000 passengers sail from the port to destinations in the Caribbean Sea, Mexico, and up the Mississippi River in either cruise ships or steamboats. The port handles more trade with Latin America than does any other U.S. gateway, including Miami. New Orleans also is a busy port for inland barge shipments that use the nation’s two main inland waterways, the Mississippi River and the Gulf Intracoastal Waterway, which meet at New Orleans.
Parts of the Port of New Orleans were heavily damaged by Hurricane Katrina. Although the main portion of the port, from the central business district to the Uptown neighborhood,
11 Reported in the U.S. Government Accountability Office (GAO) report to Congress, “Coast Guard: Observations on the Preparation, Response, and Recovery Missions Related to Hurricane Katrina,” July 2006, pages 27-28. 12 American Association of Port Authorities data, as reported in the GAO “Coast Guard…” report cited above.
28 Case Study of the Transportation Sector’s Response to and Recovery from Hurricanes Katrina and Rita
incurred only minor to moderate wind damage, practically all facilities on the Inner Harbor Navigation Canal (Industrial Canal) were lost. Among the nine businesses most affected were U.S. Gypsum (with roughly 9,000 jobs located in the area), Lone Star Cement, and New Orleans Cold Storage, which is the nation’s largest poultry exporter. Although reports originally forecast that it would take six months to reopen the port, an impressive effort by local authorities and dockworkers reopened the port on September 12, only two weeks after the storm. By January 2006, the port was reported operating at more than 70 percent capacity.
One problem resulting from Katrina that still remains is the status of the Mississippi River-Gulf Outlet (MR-GO). The MR-GO is a deep-water channel connecting the Port of New Orleans’ Inner Harbor Navigation Canal to the Gulf by bypassing the Mississippi River delta. During the storm a significant portion of the 36-foot-deep channel was silted in. Because of questions about the channel’s role in flooding the city and surrounding neighborhoods during the storm, political pressure is mounting to keep the channel closed. As a result, the Port is studying the feasibility of relocating affected companies and facilities from the canal to the main port area on the Mississippi riverfront. The cost of this work is estimated at more than $350 million. Port of South Louisiana and the Lower Mississippi The Port of South Louisiana is the largest bulk cargo port in the world. Stretching for 54 miles along the Mississippi river, the district is by volume the largest port of any kind in the Western Hemisphere and the 4th largest in the world. Located between New Orleans, Louisiana and Baton Rouge, Louisiana, the port has intermodal connections to major highways, rail lines, and inland waterways. The port handled more than 243 million tons of cargo in 2005.
The Port of South Louisiana is a critical link in the distribution chains for grain and petroleum shipments. The port handles more than 60 percent of all grain exports from the Midwest. Most of the grain shipments serviced by the port are transloaded from barges, which carry cargo to and from inland locations on the Mississippi, Missouri, and Ohio river systems. Petroleum (from both offshore domestic and international sources) is transferred to storage containers and pipelines for distribution throughout the country. Over 3,700 oceangoing vessels and 52,000 barges called to port in the district in 2005, carrying almost 60 million tons of grain and in excess of 100 million tons of petroleum and petroleum distillates last year.
The port itself generally escaped major damage from Hurricane Katrina. Damage was limited to roof damage from high winds, and most facilities were operational within five days after the storm. Parts of the Lower Mississippi River, however, were closed to traffic by the Coast Guard for more than a week as inspectors surveyed the river for new obstructions. More than 300 barges along the river were set adrift by flood surges and wind, sunk, or significantly damaged, posing further risks to navigation. Even when the Coast Guard reopened parts of the river, numerous restrictions were placed on traffic. Some parts of the river could be navigated only during daylight, other spots were restricted to one-way traffic, and yet others were so shallow that travel was limited to shallow-draft barges. Roughly 70 percent of the channel markers in the lower Mississippi were destroyed, further complicating navigation of the river. Port Fourchon Port Fourchon is a multi-use transportation facility located on the extreme south coast of Louisiana, approximately 40 miles from New Orleans. The port serves as a major center for oil
Grenzeback and Lukmann 29
importation, a land base for offshore oil drilling and pumping-support services, and the mainland connection for the Louisiana Offshore Oil Port (LOOP). The overwhelming majority (over 95 percent) of tonnage handled at the port is related to the petrochemical industry. The port handles 18 percent of domestic oil and gas and 13 percent of the nation’s foreign energy imports. There are over 600 oil platforms within a 40-mile radius of Port Fourchon, most of which are re-supplied from facilities at the port. Supplies to these facilities move through container, bulk, and break-bulk shipments. Approximately 30 percent of total tonnage travels to and from the port by inland barge before being transferred to or from an offshore supply vessel. The balance is carried to the port by truck along the low-lying LA Highway 1.
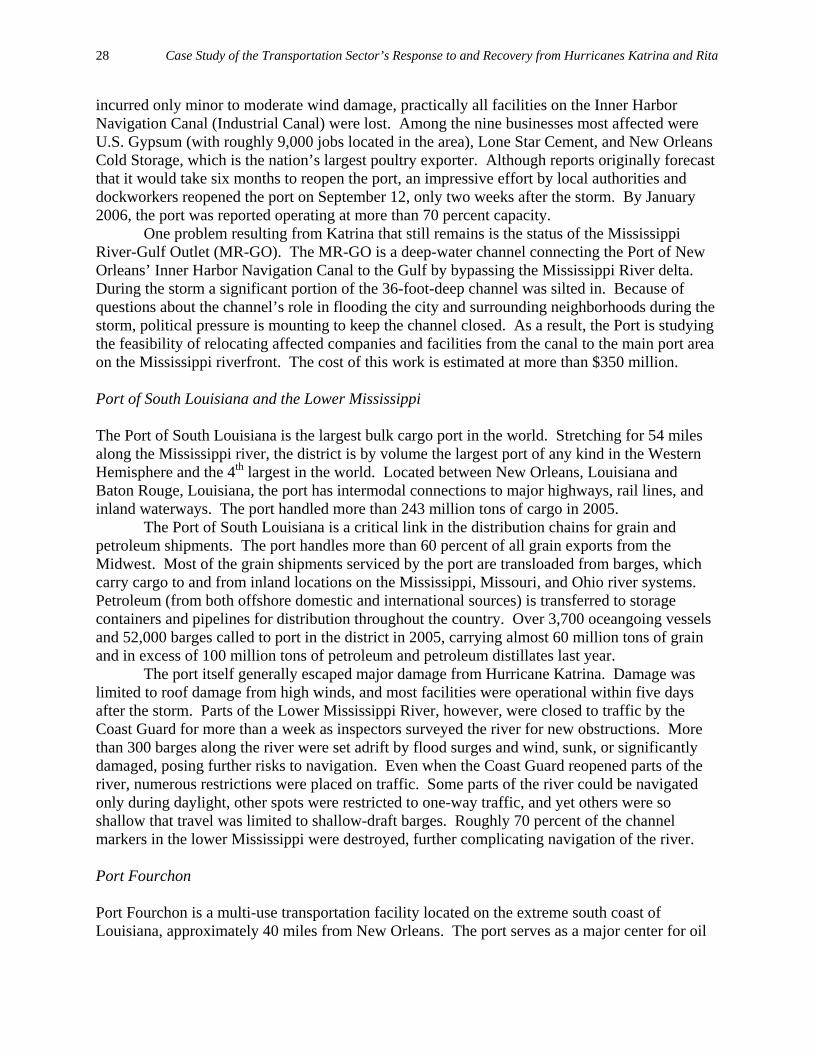
Although the port itself largely escaped the destructive effects of Hurricane Katrina, which tracked further east, shipments to and from the port along Highway 1 were disrupted when that road was inundated by the storm surge. Barge shipments along the Gulf and through the Gulf Intracoastal Waterway also were halted while the Coast Guard completed surveys and inspections, a process that took more than a week. Until the waters receded in the days after the storm, the port was largely cut off from the rest of the state. Port of Gulfport The Port of Gulfport, Miss., which specializes in the import of tropical fruit, lumber, and aluminum from Latin America, bore the brunt of Hurricane Katrina. The hurricane’s 25-foot storm surge virtually flattened the port’s infrastructure, knocking down container cranes and blowing apart storage sheds (Figure 28).13 The storm surge pushed barges hundreds of feet inland and scattered 40-foot containers throughout downtown Gulfport. A large section of one of the two floating casinos at the port was left beached after the storm, straddling U.S. Highway 90 north of the port. Additional disruption was caused by the loss of numerous navigational aids in the Gulfport channel and a complete loss of electrical power, water, and sewer services.
FIGURE 28 Port of Gulfport, Mississippi.
13 Bonney, Joseph. “Ports, roads, rails remain closed after Katrina.” The Journal of Commerce Online. September 1, 2005.
30 Case Study of the Transportation Sector’s Response to and Recovery from Hurricanes Katrina and Rita
The Port of Gulfport is the third busiest containerized port in the Gulf of Mexico and the 17th busiest nationally. The storm’s catastrophic effects significantly affected those companies like Dole, Chiquita, and Crowley that use the port on a contractual basis. The companies were forced to reroute shipments to Port Everglades, Florida or Freeport, Texas at extra expense. Although the damage to the port’s facilities was so widespread that officials initially thought it would talk a year to reopen the port, a coordinated effort by all levels of government and the port operators reopened the port on September 30, only a month after the storm. More than $250 million has been allocated to repair, rebuild, and expand the Port of Gulfport in the wake of Hurricane Katrina. Port of Mobile Further east, the Alabama State Port Authority director reported that the Port of Mobile was open for business and handling vessels on the Saturday following Hurricane Katrina. Again, most of the damage to the port was from the storm surge rather than from wind or rain from the hurricane. It took nearly two weeks to clear mud and debris from port facilities, and to fully evaluate and restart necessary equipment. Officials estimated the cost of damage to the port facilities to be in excess of $30 million. The Port of Mobile was reported to be 95 percent functional in January 2006 with the balance of repairs to be finished by late spring or early summer. Gulf Intracoastal Waterway Damaged and sunken vessels and the lack of electrical power caused major disruption to operations of the New Orleans Inner Harbor Navigation Lock. This lock is a vital link connecting the Mississippi River with the Industrial Canal and points east on the Gulf Intracoastal Waterway. Repairs to the lock and the time required to clear sunken and grounded barges slowed traffic along the Waterway for some weeks after the storm. Hurricane Rita Impacts Port of Lake Charles The Port of Lake Charles is the 16th largest seaport in the United States, the fourth largest liner-service seaport in the U.S. Gulf, and a major destination for containerized vessels. The Calcasieu Ship Channel provides direct access to the Gulf of Mexico 34 miles downstream. The ship channel, which has a depth of 40 feet and a bottom width of 400 feet, intersects the Gulf Intracoastal Waterway just north of Calcasieu Lake.
Port officials reported that Hurricane Rita caused moderate damage to facilities and cargo at the Port of Lake Charles. The port required only a few days to resume operation. According to the port’s director of marketing and trade development, the port lost some of the tin sheeting from the roofs of older buildings and was without electricity. Fortunately, less than three percent of the 40,000 tons of cargo in port received damage. Unlike ports further east affected by Hurricane Katrina, the port did not suffer from a lack of available labor. A call over the local radio station for volunteer cleanup workers was so successful that a number of helpers were turned away.
Grenzeback and Lukmann 31
Port of Port Arthur The Port of Port Arthur is a major, newly expanded break-bulk facility located in the heart of Port Arthur, Texas. Port Arthur, located near the Louisiana state line, received the brunt of the storm as Rita came ashore, including 116 mph winds. The eye of Hurricane Rita passed 3.5 miles east of the port. After the storm, Port Arthur officials moved quickly to access damages and reopen the facility. The port’s emergency management team was permitted to enter the city on September 28 to begin cleanup and reopen the port for business. As of August 2006, the port is reported to be operating at pre-Rita levels of traffic. Gulf Intracoastal Waterway Hurricane Rita caused additional damage to sections of the Gulf Intracoastal Waterway in central and western Louisiana. Critical locks had to be operated for flood water drainage, preventing their use by commercial barge traffic. This disrupted eastbound petroleum and chemical movements from Texas and affected deliveries to areas struggling to recover from the earlier impacts from Katrina. A considerable effort was need to clear the many barges that were displaced, stranded on banks, or sunk all along the Gulf Intracoastal Waterway during each of the hurricanes.14 Economic Impact: Grain The export capacity of the Mississippi River/Central Gulf region is critical to keeping U.S. agriculture positioned and able to serve the global market for grains, oilseeds, and grain products. Gulf Coast ports typically handle 55 percent to 65 percent of U.S. raw corn, soybean, and wheat exports. While claims were circulated widely by the media that effects on the export of U.S. agricultural products in the wake of Hurricane Katrina would be catastrophic, the reality was not as dire as the prediction. Grain shipments at major Mississippi ports saw only a moderate decrease in traffic compared to previous years. At the Port of South Louisiana, shipments of soybeans and maize (the port’s two largest bulk edible commodities in 2005), were down seven percent and 12 percent respectively from 2005. Port officials in the New Orleans area predicted that early season shipments would experience significant delays but the ports would be prepared to handle the main bulk of shipments associated with the fall harvest.
Although the ports in and around Southern Louisiana did reopen much sooner than anticipated, according to the Federal Reserve, farmers still faced increased transportation costs into November 2005 because of a significant bottleneck of grain barges on the river.15 The Port of New Orleans and the Mississippi River had reopened quickly to barge traffic; however, shipments could not be handled until power was restored and port laborers returned. Even before Hurricane Katrina hit, barge rates had been soaring because low river levels precluded full loading of barges. This created a shortage of empty barges just prior to Hurricane Katrina, which halted traffic altogether and sunk almost 175 barges near New Orleans. 14 David Grier, U.S. Army Corps of Engineers, correspondence, September 2006. 15 “Beige Book: Summary of Commentary on Current Economic Conditions. “United States Federal Reserve Board, Last updated November 30, 2005. www.federalreserve.gov/fomc/beigebook/2005/20051130/FullReport.htm.
32 Case Study of the Transportation Sector’s Response to and Recovery from Hurricanes Katrina and Rita
Since the bulk of U.S. corn and soybean harvest moves down the river from October to February, the ports were generally able to restore operations in preparation for this critical season. Loss of port facilities beyond mid-October would have had a significant ripple effect on the U.S. harvest of corn and soybeans as grain elevator operators have neither sufficient storage capacity to wait out a long-term disruption nor a good alternate route to ship commodities. Although ports on the West Coast, Texas Gulf, and Great Lakes exist and overland rail and truck routes are used for exports to Canada and Mexico, these are significantly more expensive options. These facilities also are supplied to a significant degree from other origination and distribution points and were mostly running at or near full capacity in September 2005.
If there was a positive aspect of Hurricane Katrina for grain transport, it was that the low water restrictions on mid-Mississippi barge traffic, which had been in effect for several weeks prior to the hurricane, were finally lifted. The low water restrictions had meant that barge owners could operate with only nine feet of draft, so the barges were loaded at roughly 65 percent to 75 percent of capacity. The heavy rains in the Ohio River valley from the remnants of Hurricane Katrina helped to restore the river to normal levels and permitted barge operators to load to full capacity. Economic Impacts: Containerized Goods Less than two percent of the nation’s containerized cargo moves through the ports affected by Hurricanes Katrina and Rita. As a result, the shipment of most retail goods and other containerized goods was not disrupted on a national scale, and regional delays outside of the immediately impacted areas were generally short-lived. A notable exception was the Port of Gulfport, which specializes in importing containerized bananas and winter fruits from Central and South America. The need to reroute shipments to Texas and Florida led to some low inventories of these fruits in southeastern states. Generally, increased congestion on the nation’s freight rail system due to rerouted trains probably did more to delay containerized retail shipments than the closure of Gulf Coast ports. 7.0 PIPELINES The central Gulf Coast lies at the heart of the nation’s petrochemical industry. Ports in the area are dominant importers of foreign crude, and service much of the domestic offshore production as well. The 29 major refineries in the Central Gulf Coast study area produce one-third of the gasoline and other petroleum distillates used in the United States. An integral part of the distribution chain for these petrochemical products are the numerous major pipelines that connect the Gulf Coast to the densely settled regions of the Mid-Atlantic, Northeast, and Midwest. If supply to these regions of the nation is obstructed, the problem can quickly turn into an economic crisis of national importance.
The four major petroleum (or petroleum product) pipelines that serve the Gulf Coast area are:
• The Colonial – More than 5,500 miles long, this pipeline connects Houston, Texas to
New York Harbor. The Colonial has a daily capacity of 100 million gallons, which it distributes throughout the U.S. East Coast.
Grenzeback and Lukmann 33
• The Plantation – Approximately 3,100 miles long, the Plantation connects southern Louisiana with Washington D.C., servicing 130 terminals in eight southeast states. The pipeline capacity is 20 million gallons per day.
• The Capline – Owned by Royal Dutch Shell, the Capline carries 1.2 million gallons per day the 667 miles from St. James, Louisiana to near Chicago, Illinois.
• The Explorer – A 1,400-mile pipeline system that transports gasoline, diesel fuel and jet fuel from the Gulf Coast to the Midwest. The 28-inch diameter pipeline services Houston, Dallas, Fort Worth, Tulsa, St. Louis, and Chicago.
In addition to these major pipelines, Southeast Louisiana is host to the world’s only offshore petroleum superport. The Louisiana Offshore Oil Port (LOOP) is a deepwater port in the Gulf of Mexico off the coast of Louisiana near the town of Port Fourchon. LOOP provides tanker offloading and temporary storage services for crude oil transported on tankers that are too large to enter Gulf Coast and other U.S. ports. The port handles 13 percent of the nation’s petroleum imports, about 1.2 million barrels a day, and connects by pipeline to 35 percent of the U.S. refining capability. LOOP consists of a series of mooring bases, which connect ships to a central marine terminal and pumping station. A 48-inch submarine pipeline then connects the marine terminal to onshore facilities at Port Fourchon that boost, store, and transfer the product through pipelines to regional refineries. Hurricane Katrina Impacts The major petroleum/petroleum product pipelines servicing the study area received relatively little physical damage from the effects of Hurricanes Katrina and Rita. These key arteries were brought down by massive power outages in the wake of the storms and by interruptions to the supply of fresh product to transport. Even so, most of these systems were able to resume partial service within days of the storm and full service within a week. If it were not for the breadth and longevity of the power outages, the pipelines all would likely have continued service almost uninterrupted by the storm. However, had the power outages lasted another three to four days, industry experts predicted that large areas of the Midwest, Southeast, and the East Coast would have experienced moderate to severe shortages of gasoline. Louisiana Offshore Oil Port (LOOP) LOOP stopped offloading tankers on August 27, in anticipation of Hurricane Katrina. Like many of the other port facilities in the Gulf Coast, LOOP was plagued by electrical outages in the wake of Hurricane Katrina. Tanker offloading resumed late on September 1, but because of the continued power outage at the Port Fourchon facility, the system was operated at less than full capacity. LOOP resumed delivery to the Capline by September 4, less than a week after the storm. Service was fully restored by September 12. Capline The Capline pipeline resumed operation on August 31 at a reduced rate of 720,000 barrels per day, pending restoration of full operation of LOOP. By September 5, the pipeline expanded operating capacity to 960,000 barrels per day, or 80 percent capacity. Shell’s other pipeline
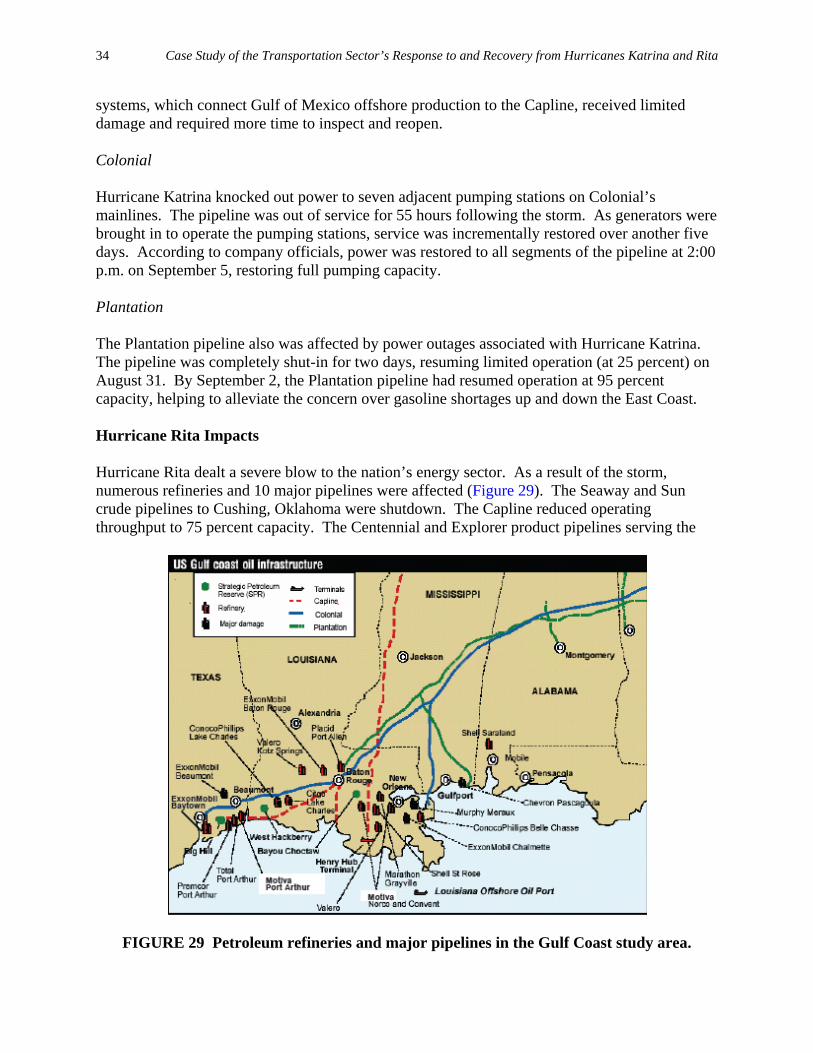
34 Case Study of the Transportation Sector’s Response to and Recovery from Hurricanes Katrina and Rita
systems, which connect Gulf of Mexico offshore production to the Capline, received limited damage and required more time to inspect and reopen. Colonial Hurricane Katrina knocked out power to seven adjacent pumping stations on Colonial’s mainlines. The pipeline was out of service for 55 hours following the storm. As generators were brought in to operate the pumping stations, service was incrementally restored over another five days. According to company officials, power was restored to all segments of the pipeline at 2:00 p.m. on September 5, restoring full pumping capacity. Plantation The Plantation pipeline also was affected by power outages associated with Hurricane Katrina. The pipeline was completely shut-in for two days, resuming limited operation (at 25 percent) on August 31. By September 2, the Plantation pipeline had resumed operation at 95 percent capacity, helping to alleviate the concern over gasoline shortages up and down the East Coast. Hurricane Rita Impacts Hurricane Rita dealt a severe blow to the nation’s energy sector. As a result of the storm, numerous refineries and 10 major pipelines were affected (Figure 29). The Seaway and Sun crude pipelines to Cushing, Oklahoma were shutdown. The Capline reduced operating throughput to 75 percent capacity. The Centennial and Explorer product pipelines serving the
FIGURE 29 Petroleum refineries and major pipelines in the Gulf Coast study area.
Grenzeback and Lukmann 35
Midwest were shutdown. The Longhorn product pipeline serving West Texas and TEPPCO serving the Midwest and Northeast were likewise shut. Colonial Pipeline, a major product pipeline to the Northeast, Mid-Atlantic and Southeast regions, reduced operations to 50 percent and portions of Magellan Pipeline serving the Midwest are closed. The Louisiana Offshore Oil Port (LOOP) suspended offshore operations for three days. Generally, however, the delays associated with resuming operations of these pipelines and their associated refineries were not as great as with Hurricane Katrina since the power outages that resulted from Hurricane Rita were of lesser scope and duration. Economic Impact: Petroleum Products Hurricanes Katrina and Rita both had serious effects on the energy sector in the United States. Both hurricanes stopped drilling and extraction operations in the Gulf, delayed the importation of millions of barrels of foreign crude, shuttered a large percentage of U.S. refinery capacity, and closed pipelines critical to the transportation of crude and petroleum products. On September 2, three days after the final landfall of Hurricane Katrina, Gulf of Mexico oil production was still reduced by over 1.4 million b/d (barrels per day) as a result of Hurricane Katrina, more than 88 percent of daily Gulf of Mexico oil production and 27 percent of U.S. domestic production.16 Government sources also reported that 7.25 billion cubic feet per day of natural gas production was shut in, almost 75 percent of daily Gulf of Mexico natural gas production. This shut-in of domestic production represents almost one million barrels per day (42 million gallons per day) of gasoline not produced.17 The impact of this shortage was felt nationally. In Nebraska, almost 1,000 miles from the Central Gulf Coast, the average retail price of gasoline for the first week of September 2005 skyrocketed to $3.17, 43 cents higher than the previous week.18
Although the closure of major pipelines originating in the Gulf of Mexico area in the wake of both storms served to exacerbate the situation, their closure was generally not at the root of the gasoline shortage; the disruption of refinery operations that supply product to the pipelines were. At the peak of the disruption cause by Hurricane Katrina, 11 petroleum refineries were shut down, representing 2.5 million barrels per day or 15 percent of U.S. refining capacity and all major pipelines in the area were inoperable due to power outages. By September 4, five days after the storm, eight major petroleum refineries remained shut down (representing 1.5 million barrels per day or nine percent of U.S. refining capacity); however, all of the major crude or petroleum product pipelines had resumed operation at either full or near-full capacity. In addition, the pipelines already were fully stocked with product prior to the storm; as soon as power was restored to the pipelines, terminal stations in the East and Midwest immediately began replenishing supplies of crude oil and gasoline. As a result, areas that were served by terminals that maintained a sufficient inventory to last four to five days were less severely
16 “Department of Energy’s Hurricane Response Chronology.” United States Department of Energy. http://www.energy.gov/print/2404.htm. 17 “Special Report: Hurricane Katrina’s Impact on the U.S. Oil and Natural Gas Markets.” Energy Information Administration, United States Department of Energy. http://tonto.eia.doe.gov/oog/special/eia1_katrina_090205.html. 18 “Nebraska Gasoline and Diesel Prices.” State of Nebraska. Last updated September 15, 2005 http://www.neo.state.ne.us/statshtml/125_20050905.htm.

36 Case Study of the Transportation Sector’s Response to and Recovery from Hurricanes Katrina and Rita
affected than those areas that maintained small inventories or were expecting a delivery when the hurricane struck.
Hurricane Rita caused a more significant impact, shuttering 20 refineries at the peak of the storm. The storm brought down 29 percent of U.S. refining capacity, shut-in 29 percent of domestic production, and closed or limited throughput on 10 major product pipelines originating in the study area. Once again, the majority of the effects from the storm were not due to storm damage but due to the massive power outages resulting from the storm. Again, after the storm, the pipeline system was quick to procure the electric power necessary to resume operations. By October 4, all but two major pipelines had resumed operations, while 12 out of the 20 major refineries had yet to reopen. 8.0 AVIATION The system of airports in the Central Gulf Coast study area includes 61 publicly owned, public-use facilities. The majority of these airports lie in southern Louisiana. In terms of yearly aircraft operations and passenger enplanements, the Gulf Coast airports are dominated by Houston’s George Bush Intercontinental and William P. Hobby Field, and by New Orleans’ Louis Armstrong International Airport. These three airports service more than 95 percent of commercial passenger enplanements in the study area. Among these three fields, only Louis Armstrong International was significantly damaged by either of the two land-falling hurricanes. Hurricane Katrina Impacts A number of airports in the study area received significant damage from the strong winds, flooding rains and embedded tornadoes associated with Hurricane Katrina. Airports sustained damage to passenger terminals, maintenance facilities, and navigational devices. Power outages also took air traffic control facilities off-line and darkened nighttime runway lights. As a result, some airports were closed for days and weeks while necessary repairs could be made, but relief flights were flown in before the airport facilities were fully reopened. Louis Armstrong New Orleans International Airport Louis Armstrong New Orleans International Airport is located in Kenner, Louisiana and is the primary commercial airport for the New Orleans metropolitan area of southeast Louisiana. Louis Armstrong is the third largest airport in the Central Gulf Coast after Houston’s George Bush Intercontinental and Hobby Field Airports. Sitting at an average of four feet above sea level, the New Orleans International Airport also is the second lowest lying international airport in the world after Schiphol International in The Netherlands, which sits 11 feet below sea level.
The New Orleans International Airport was closed to commercial air traffic on August 28, as the outer bands of Hurricane Katrina began to come ashore, and remained closed as floods affected the city. The Associated Press reported on August 31 that the airport would receive humanitarian flights, and that the airport “had no significant airfield damage and had no standing
Grenzeback and Lukmann 37
water in aircraft movement areas.”19 The airport did however sustain damage to its roofs, hangars, and fencing. For the first few weeks of September the airport was open only to military aircraft and humanitarian flights, and was serving as a staging center for evacuees.
The airport reopened to commercial flights on September 13, 2005. The airport opened with four flights operated by Delta Air Lines to Atlanta and Northwest Airlines to Memphis. Slowly, service from other carriers began to resume with limited service by Southwest, Continental, and American Airlines. Eventually, all carriers—excepting Frontier Airlines, Midwest Airlines, and international carriers Air Canada and TACA—announced their return, but with limited service. Continental Airlines became the first airline to return to pre-Katrina flight frequency levels in early 2006, although daily seat counts remain below pre-Katrina levels. Prior to Hurricane Katrina, the New Orleans International Airport served nearly 10 million passengers per year, nearly all of them non-connecting trips. As of September 2006, operations at the airport will be at 63 percent of pre-Katrina status, measured by daily seat-count. Sixty-seven percent of daily roundtrip flights will have been restored at that point, as well as 75 percent of cities served nonstop. Lakefront Airport Lakefront Airport was the hub of New Orleans’ aviation prior to the construction of what is now Louis Armstrong International Airport. The airport was converted to general aviation use and is one of the busiest general aviation facilities in the Gulf Coast. Located directly on Lake Pontchartrain to the north of the city center, the airport is particularly vulnerable to severe weather. On August 29, Hurricane Katrina cut a destructive path over Lakefront Airport and destroyed a number of terminals and hangars. The airport reopened for daytime operations on October 19, more than seven weeks after the storm. The airport received a $6.8 million grant from the Federal Aviation Authority to cover immediate needs such as replacing damaged signs and generators as well as reinforcing the sea wall on the north end of the airport’s boundaries. Gulfport-Biloxi International Airport In 2005, Gulfport-Biloxi International was the fifth busiest commercial airport in the Central Gulf Coast by passenger enplanements. Located less than a mile inland, between U.S. 90 and I-10 in Gulfport, Gulfport-Biloxi was the hardest struck of all of the commercial airports in the study area. As it roared ashore on the morning of August 29, Katrina’s wind and waves caused an estimated $50 million to $60 million in damage to the airport. The airport’s terminal building, taxiways, cargo facility, general aviation facility, and rental car facility all sustained severe damage. While visiting the wrecked airport after the storm, U.S. DOT Secretary Norman Mineta promised $7 million in immediate aid followed by another $44 million in Federal support for reconstruction. The airport reopened to commercial flights on September 8 and returned to its normal volume of traffic in February 2006.
19 “News Update: Airport to allow humanitarian flights” New Orleans Times-Picayune. August 31, 2005, 11:10 a.m.
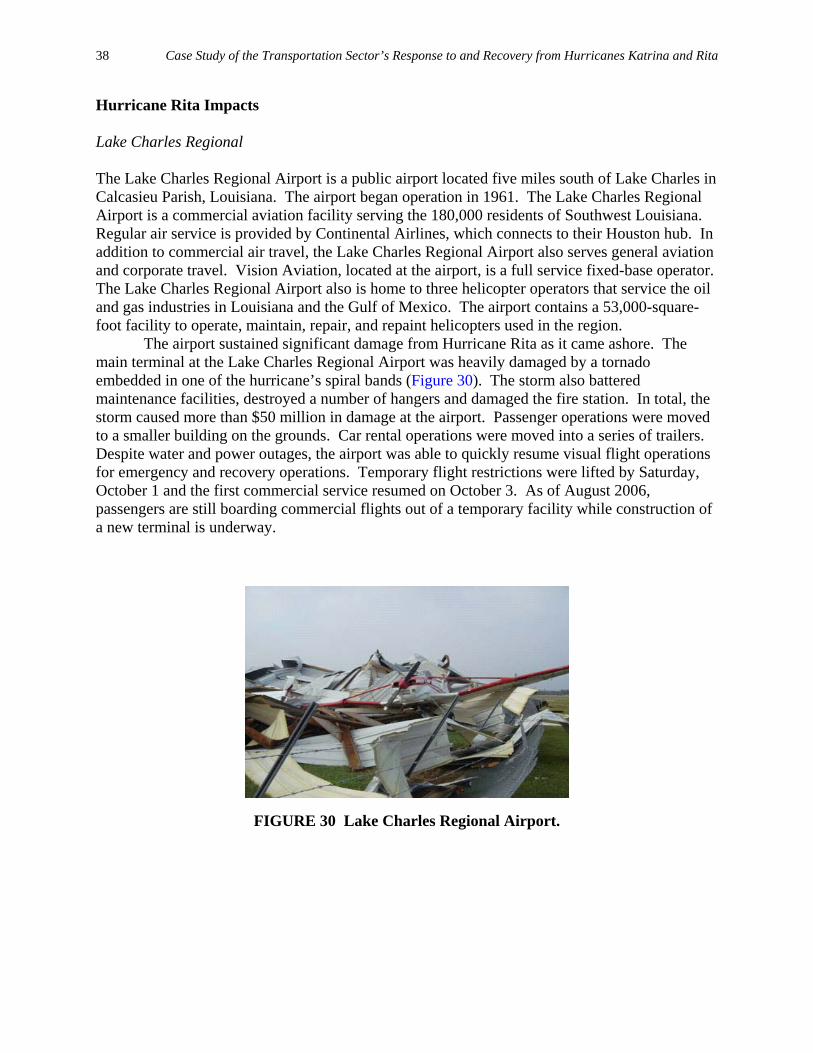
38 Case Study of the Transportation Sector’s Response to and Recovery from Hurricanes Katrina and Rita
Hurricane Rita Impacts Lake Charles Regional The Lake Charles Regional Airport is a public airport located five miles south of Lake Charles in Calcasieu Parish, Louisiana. The airport began operation in 1961. The Lake Charles Regional Airport is a commercial aviation facility serving the 180,000 residents of Southwest Louisiana. Regular air service is provided by Continental Airlines, which connects to their Houston hub. In addition to commercial air travel, the Lake Charles Regional Airport also serves general aviation and corporate travel. Vision Aviation, located at the airport, is a full service fixed-base operator. The Lake Charles Regional Airport also is home to three helicopter operators that service the oil and gas industries in Louisiana and the Gulf of Mexico. The airport contains a 53,000-square-foot facility to operate, maintain, repair, and repaint helicopters used in the region.
The airport sustained significant damage from Hurricane Rita as it came ashore. The main terminal at the Lake Charles Regional Airport was heavily damaged by a tornado embedded in one of the hurricane’s spiral bands (Figure 30). The storm also battered maintenance facilities, destroyed a number of hangers and damaged the fire station. In total, the storm caused more than $50 million in damage at the airport. Passenger operations were moved to a smaller building on the grounds. Car rental operations were moved into a series of trailers. Despite water and power outages, the airport was able to quickly resume visual flight operations for emergency and recovery operations. Temporary flight restrictions were lifted by Saturday, October 1 and the first commercial service resumed on October 3. As of August 2006, passengers are still boarding commercial flights out of a temporary facility while construction of a new terminal is underway.
FIGURE 30 Lake Charles Regional Airport.
Grenzeback and Lukmann 39
Southeast Texas Regional Airport The Southeast Texas Regional Airport is a public airport located in Nederland, Texas between Beaumont and Port Arthur. Formerly known as the Jefferson County Airport, the airport has two runways and is primarily used for general aviation, though it is served by one commercial airline. Like the Lake Charles Regional Airport 35 miles northeast, Hurricane Rita battered Southeast Texas Regional. Violent winds ripped the roof off of the terminal, destroyed hangars, and spread debris across the runways. Damage on-site totaled about $13.8 million. As of the fall 2006, plans are still in the works to procure Federal funding to reconstruct the main terminal building. 9.0 OBSERVATIONS AND LESSONS LEARNED This paper has described the national and regional transportation system response to and recovery from Hurricanes Katrina and Rita and the effect these disruptions had on the movement of freight. As noted in the introduction, the scope of this report was limited. It focused on the national and regional transportation facilities in the central Gulf Coast region, not on city and local transportation systems. It focused primarily on freight transportation, not on passenger transportation. It recognized but did not catalog the extensive damage to county and local roads, industrial rail spurs, and the urban street and local transit systems within New Orleans and the other heavily damaged coastal cities and towns. It reported the national and regional impacts of disrupted supply chains, but did not attempt to estimate the economic cost to local businesses, industrial sectors, or the national economy. Finally, it relied on secondary sources, including newspaper articles, industry journals, and government reports. With these caveats, this section summarizes general observations and lessons learned from the case study. Duration of Closures Despite the dire predictions of long-lasting transportation blockages reported in the news media, most major transportation facilities were reopened relatively quickly. Table 2 lists the major transportation facilities damaged or closed by Hurricanes Katrina and Rita. The bar chart on the right side of the table shows the approximate number of weeks each facility was closed. Most of the Gulf Coast study area highways, rail lines, pipelines, ports, and airports were back in service within weeks to a month. Limited access across the I-10 Twin Span Bridge was available within two months and nearly full access within five months. The heavily damaged CSX Gulf Coast mainline and its bridges were reopened six months after being washed out by Hurricane Katrina. The worst damaged facilities were the river and bay bridges that carry highway U.S. 90 along the edge of the Gulf Coast. Much of the roadway and three of the six badly damaged crossings were repaired within about three months. Only three bridges along U.S. 90 have not been reopened as of the fall 2006—the Chef Menteur Pass Bridge, the Bay St. Louis Bridge, and the Biloxi-Ocean Springs Bridge. They will not be repaired or replaced until mid- or late-2007, two years after they were destroyed by Hurricane Katrina.
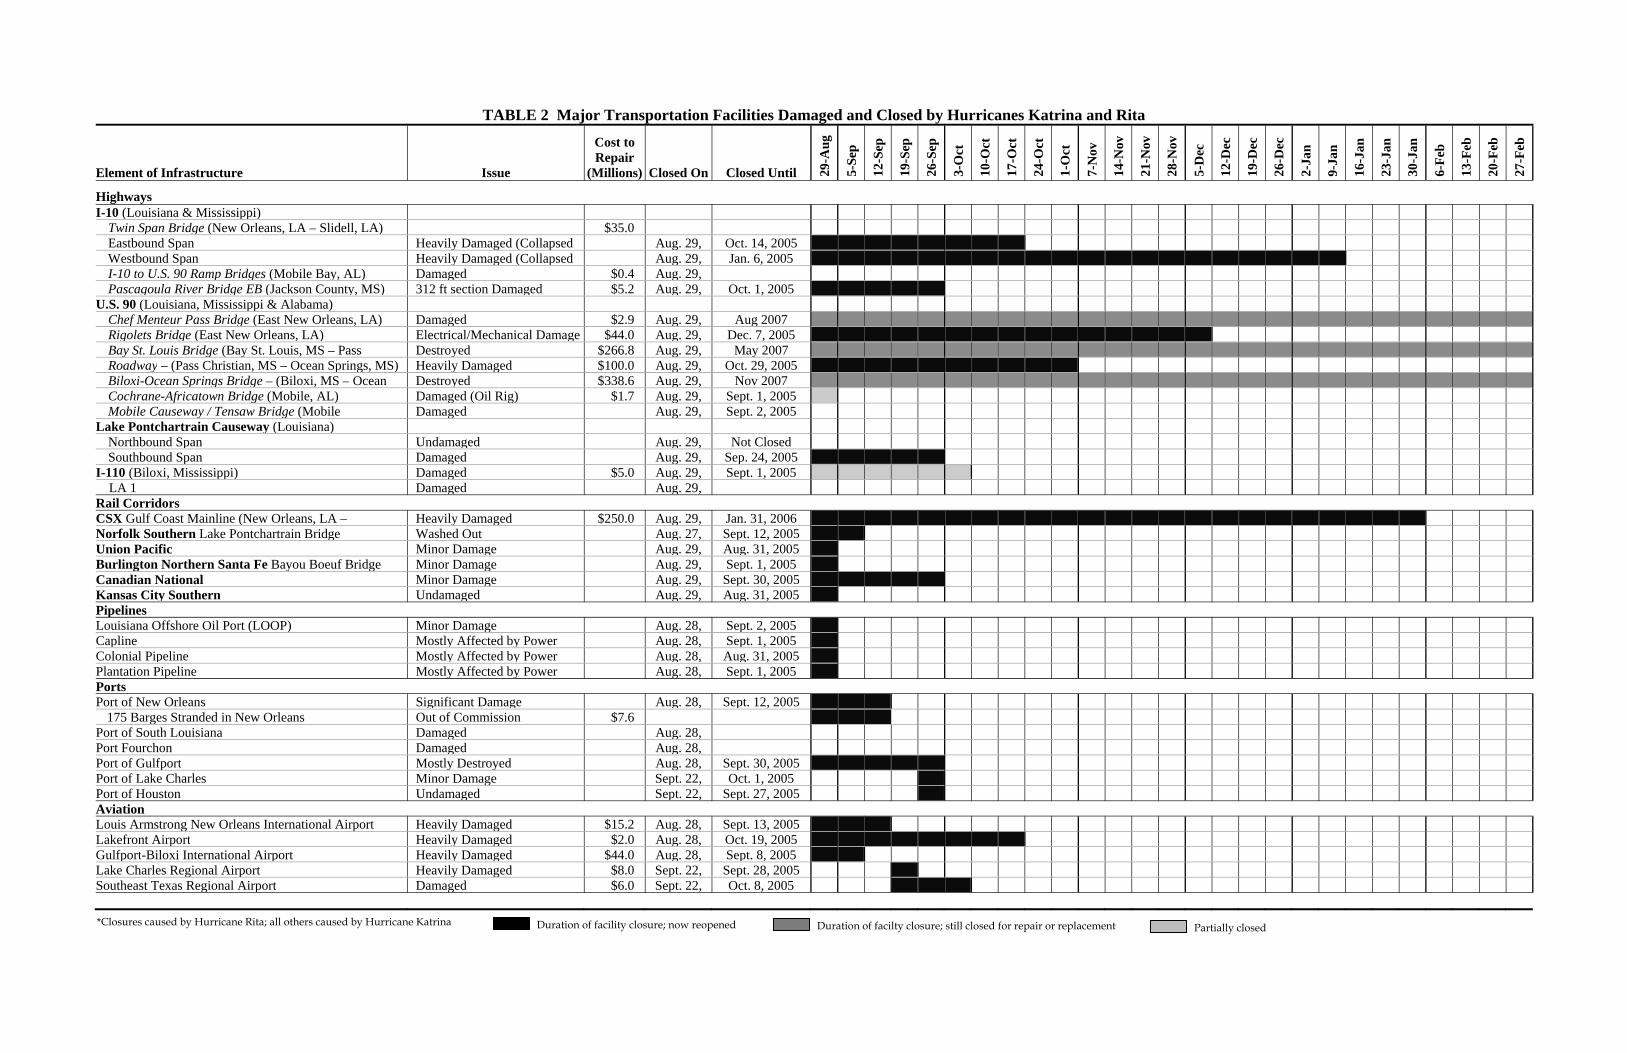
TABLE 2 Major Transportation Facilities Damaged and Closed by Hurricanes Katrina and Rita
Element of Infrastructure Issue
Cost to Repair
(Millions) Closed On Closed Until 29-
Aug
5-S
ep
12-
Sep
19-
Sep
26-
Sep
3-O
ct
10-
Oct
17-
Oct
24-
Oct
1-O
ct
7-N
ov
14-
Nov
21-
Nov
28-
Nov
5-D
ec
12-
Dec
19-
Dec
26-
Dec
2-J
an
9-J
an
16-
Jan
23-
Jan
30-
Jan
6-F
eb
13-
Feb
20-
Feb
27-
Feb
Highways I-10 (Louisiana & Mississippi)
Twin Span Bridge (New Orleans, LA – Slidell, LA) $35.0 Eastbound Span Heavily Damaged (Collapsed Aug. 29, Oct. 14, 2005 Westbound Span Heavily Damaged (Collapsed Aug. 29, Jan. 6, 2005 I-10 to U.S. 90 Ramp Bridges (Mobile Bay, AL) Damaged $0.4 Aug. 29, Pascagoula River Bridge EB (Jackson County, MS) 312 ft section Damaged $5.2 Aug. 29, Oct. 1, 2005
U.S. 90 (Louisiana, Mississippi & Alabama) Chef Menteur Pass Bridge (East New Orleans, LA) Damaged $2.9 Aug. 29, Aug 2007 Rigolets Bridge (East New Orleans, LA) Electrical/Mechanical Damage $44.0 Aug. 29, Dec. 7, 2005 Bay St. Louis Bridge (Bay St. Louis, MS – Pass Destroyed $266.8 Aug. 29, May 2007 Roadway – (Pass Christian, MS – Ocean Springs, MS) Heavily Damaged $100.0 Aug. 29, Oct. 29, 2005 Biloxi-Ocean Springs Bridge – (Biloxi, MS – Ocean Destroyed $338.6 Aug. 29, Nov 2007 Cochrane-Africatown Bridge (Mobile, AL) Damaged (Oil Rig) $1.7 Aug. 29, Sept. 1, 2005 Mobile Causeway / Tensaw Bridge (Mobile Damaged Aug. 29, Sept. 2, 2005
Lake Pontchartrain Causeway (Louisiana) Northbound Span Undamaged Aug. 29, Not Closed Southbound Span Damaged Aug. 29, Sep. 24, 2005
I-110 (Biloxi, Mississippi) Damaged $5.0 Aug. 29, Sept. 1, 2005 LA 1 Damaged Aug. 29,
Rail Corridors CSX Gulf Coast Mainline (New Orleans, LA – Heavily Damaged $250.0 Aug. 29, Jan. 31, 2006 Norfolk Southern Lake Pontchartrain Bridge Washed Out Aug. 27, Sept. 12, 2005 Union Pacific Minor Damage Aug. 29, Aug. 31, 2005 Burlington Northern Santa Fe Bayou Boeuf Bridge Minor Damage Aug. 29, Sept. 1, 2005 Canadian National Minor Damage Aug. 29, Sept. 30, 2005 Kansas City Southern Undamaged Aug. 29, Aug. 31, 2005 Pipelines Louisiana Offshore Oil Port (LOOP) Minor Damage Aug. 28, Sept. 2, 2005 Capline Mostly Affected by Power Aug. 28, Sept. 1, 2005 Colonial Pipeline Mostly Affected by Power Aug. 28, Aug. 31, 2005 Plantation Pipeline Mostly Affected by Power Aug. 28, Sept. 1, 2005 Ports Port of New Orleans Significant Damage Aug. 28, Sept. 12, 2005
175 Barges Stranded in New Orleans Out of Commission $7.6 Port of South Louisiana Damaged Aug. 28, Port Fourchon Damaged Aug. 28, Port of Gulfport Mostly Destroyed Aug. 28, Sept. 30, 2005 Port of Lake Charles Minor Damage Sept. 22, Oct. 1, 2005 Port of Houston Undamaged Sept. 22, Sept. 27, 2005 Aviation Louis Armstrong New Orleans International Airport Heavily Damaged $15.2 Aug. 28, Sept. 13, 2005 Lakefront Airport Heavily Damaged $2.0 Aug. 28, Oct. 19, 2005 Gulfport-Biloxi International Airport Heavily Damaged $44.0 Aug. 28, Sept. 8, 2005 Lake Charles Regional Airport Heavily Damaged $8.0 Sept. 22, Sept. 28, 2005 Southeast Texas Regional Airport Damaged $6.0 Sept. 22, Oct. 8, 2005
Duration of facility closure; now reopened Duration of facilty closure; still closed for repair or replacement Partially closed *Closures caused by Hurricane Rita; all others caused by Hurricane Katrina
Grenzeback and Lukmann 41
Cost of Damage and Closures Information on the cost to repair the transportation facilities damaged by Hurricanes Katrina and Rita is incomplete, and a full accounting was beyond the reach of this study; however, the readily available and reported costs, which are included in the table, total over $1.1 billion. Replacement of the I-10 Twin Span Bridge between New Orleans and Slidell, Louisiana will add at least another $1 billion, and a full accounting of the repair and replacement costs to rail lines, pipelines, ports, waterways, and airports will eventually add several billions more to the total. These numbers do not account for unreported emergency operations expenditures, the short-term opportunity costs of lost or rerouted shipments, and the long-term economic cost of displaced business and trade. Redesign and Relocation of Transportation Facilities Almost all of the major river and bay bridges destroyed by the hurricane surge waters will be rebuilt at higher elevations, and the design of the connections between the bridge decks and the bridge piers will be strengthened. The unprecedented amount of damage to the bridges has triggered a discussion among bridge designers and engineers about appropriate bridge design standards. Current bridge design standards assume a riverine environment and a 50-year storm event; bridges are designed for a storm surge, but not additional wave action. In a discussion paper issued after Hurricanes Katrina and Rita, the Federal Highway Administration recommended that a 100-year storm event be considered for Interstate Highway System bridges, major structures, and critical bridges, and that design standards consider a combination of surge and wave effects. Consideration of a 500-year storm event super-flood surge and wave action was also suggested.20
CSX estimated reconstruction costs at $250 million to $300 million, or about one-quarter of CSX’s annual operating revenues available for capital investment. CSX reported that the Bay St. Louis Bridge would reinforced as was done to the Biloxi Bay Bridge, and the timber trestle supports on the Gautier Bridge near Pascagoula, Mississippi would replaced with concrete supports. CSX was also planning to upgrade its drainage and spillway channels, and eliminate of all line-side signal and communication wires, moving them out of the way future surge waters. There is continuing discussion of alternative routes utilizing existing rail corridors and alternative Mississippi River crossings such as those at Baton Rouge and Vicksburg. Finally, the feasibility of constructing a new rail corridor further inland is being explored by CSX and Mississippi, but the costs of locating a new rail right-of-way, acquiring property rights, and financing and constructing the line make this a long-term option.21
The Port of New Orleans is considering relocating companies and facilities from the Mississippi River-Gulf Outlet, a deep-water channel connecting the Port of New Orleans’ Inner Harbor Navigation Canal to the Gulf, to the main port area on the Mississippi riverfront. The
20 For more information and a discussion of the implications of climate change for transportation facilities and their design, see Michael D. Meyer’s companion paper to this case study, “Design Standards for the U.S. Transportation Infrastructure: Implications of Climate Change,” prepared for the Committee on Climate Change and U.S. Transportation, Division on Earth and Life Studies, Transportation Research Board, September 2006. 21 Hinsdale, cited.
42 Case Study of the Transportation Sector’s Response to and Recovery from Hurricanes Katrina and Rita
cost of this work is estimated at more than $350 million. There were no other available reports of plans to relocate major transportation facilities. Impact on National Freight Flows By most accounts, the impact of the Hurricanes Katrina and Rita on national freight flows was modest. In part, this is because the greater New Orleans region is not a major national trucking, rail, or air hub; and trucking, rail, and air services were restored relatively soon after the hurricanes. It is major national port and pipeline hub, but port access and pipeline operations were also restored much more quickly than was expected in the immediate aftermath of the Katrina. The impacts also were modest because of redundancy in the national transportation system and the timing of the storms. Truck, rail, waterborne, and air freight transportation services were able to shift to parallel routes and alternative Gulf Coast ports and airports.
• I-12, which parallels I-10 from the Mississippi-Louisiana border to Baton Rouge, Louisiana but runs north of Lake Pontchartrain rather than through the city of New Orleans, provided an immediate truck detour around the collapsed I-10 Twin Span Bridge. Other long-haul truck traffic diverted to I-20 and I-40, which parallel I-10 well north of the Gulf Coast. This meant that there was little or no disruption of truck traffic serving the major national and regional warehousing and distribution centers in Atlanta, Dallas-Ft. Worth, and Houston.
• The major, national, north-south highways—I-49, I-55, I-59, and I-65—which connect the Gulf Coast with the major inland transportation hubs, were not damaged. They were open for relief operations within hours and for nearly full commercial freight movement within days. This meant that there was limited disruption to truck traffic serving the massive petrochemical complex in the Baton Rouge corridor.
• The railroads were able to reroute intermodal and carload traffic that was not bound directly for New Orleans through Memphis and other Midwest rail hubs. New Orleans is a major rail freight interchange point for east-west rail traffic, but the city itself is not a major origin or destination for rail freight. The interruption of rail service was a major local problem, but not a national or regional problem. Had Hurricane Katrina or Rita struck a larger, national and regional industrial and transportation hub such as Houston, the disruption to rail transportation, freight movement, supply chain operations would have been much greater and more costly.
• The hurricanes struck before the peak of the corn and soybean export season. Most of the Mississippi River ports and the Mississippi waterway barge channels were back in service in time to handle the peak export demand later in the fall of 2005. Had the storms struck late in the hurricane season and done comparable damage, the delays and damage to corn and soybean exports and other agricultural exports might have been severe.
• Major pipelines suffered relatively little damage and were able to open within days as electrical power was restored. However, had power outages from either hurricane lasted a few days longer, shuttering refineries and pipelines, it would likely have triggered significant shortages of gasoline and other petroleum products across the Midwest, Southeast, and the Mid-Atlantic, causing significant national economic disruption.
• While New Orleans and communities along the Gulf Coast were devastated by the Hurricanes Katrina and Rita, the national and regional freight transportation systems escaped catastrophic damage and major disruption. But it was a near miss. Had Katrina sustained its
Grenzeback and Lukmann 43
Category 5 strength and worked its way up the Mississippi, damaging bridges and flooding out transcontinental freight highways and rail lines, the effects could have been far more disruptive and costly.22 Power Electrical power outages caused the shutdown of ports, railroads, refineries, and pipeline stations that were not significantly damaged by the storms, and was cited as the number one reason for delays in the restoration of transportation services in the Gulf Coast region. Highways and arterials need electrical power to operate traffic lights and signs; railroads to operate signal systems and crossing gates; ports to operate cranes and elevators; and pipelines to power pumping stations. The functioning of today’s freight transportation networks is inextricably bound up with the functioning of the power and telecommunications networks. This suggests that transportation planners and operators, as well as emergency management officials, need to pay at least as much attention to the redundancy and restoration of power and communication systems as to freight and passenger transportation systems. Labor Apart from the lack of electrical service, the primary factor hindering efforts to resume transportation services in many locations (particularly metropolitan New Orleans) was the lack of workers. Especially with Hurricane Katrina, truck, port, railroad and pipeline employees lost family and homes in the storm, and many evacuated the region. The city itself was closed for more than a month. In August 2006, almost a year after the storm, the population of New Orleans was estimated at 250,000, about half of the pre-Katrina total. Major transportation companies such as CSX brought in workers from throughout its system and provided them with food and accommodations for months in order to staff reconstruction projects. Emergency Planning The railroads, the pipeline industry, aviation, most ports, and the state departments of transportation had established emergency management plans and teams in place well before the hurricanes hit. The relatively short recovery times, at least in the transportation sector, suggest that many of these plans and teams were effective. There have been no comprehensive surveys of private sector industry preparations and response to the hurricanes, but press reports and industry journals suggest that larger industrial firms and business were also effective in establishing emergency management plans, stockpiling inventory out of the region, and 22 For a comprehensive study of the transportation and economic impacts of shutting down multiple Mississippi River bridge crossings, see The Great Flood of 1993: Causes, Impacts, and Responses, Stanley A. Chagnon (ed.), Westview Press, Inc., Boulder, CO., 1996. The author recently issued a book entitled Railroads and Weather: From Fogs to Floods and Heat to Hurricanes, the Impacts of Weather and Climate on American Railroading, describing the impacts of Hurricane Diane in 1955, which damaged 11 and bankrupted two major East Coast railroads; the Midwest’s great flood of 1993—railroad’s most damaging wh in history; the record-setting West-Coast winter storms of 1996-97; and Hurricane Katrina, which the author describes as a success story in readiness and response. The book discusses the evolution of the rail industry’s planning and response strategies. See www.ametsoc.org/pubs/books/index.html.
44 Case Study of the Transportation Sector’s Response to and Recovery from Hurricanes Katrina and Rita
evacuating staff. But the quality and depth of pre-planning and coordination across governmental agencies and between public and private sector transportation operations varied. Conclusion The transportation facilities in New Orleans and the Gulf Coast region absorbed huge damage from the hurricanes, but the national freight and passenger transportation networks were not seriously disrupted and the costs were absorbed without dramatic failures. The case study speaks well to the capacity of transportation systems and providers to recover from two very powerful and costly major hurricanes. But the case study does not speak to the question of whether transportation systems and providers are prepared to absorb and recover from more frequent and severe storms. The opinions and conclusions expressed or implied are those of the authors and are not necessarily those of the Transportation Research Board or its sponsors. This document is not a report of the Transportation Research Board or of the National Research Council.