case study: redhook brewery
TRANSCRIPT

CaseStudy:RedhookBreweryPortsmouth,NH
AnaerobicDigestionandBiogasReusePresentedby:AlexRamsey,TietjenHynes,Operations
ProjectEngineer

RedhookBreweryRedhookwasfoundedinSeattle,WAin1981.
Redhookexpandedfromaformertransmissionshoptoanoldtrolleybarn,thenin1994toacustombuilt220,000barrelbreweryintheSeattlesuburbs.
In1996,RedhookexpandedtotheEastCoastwithanewbrewerybuiltwiththesameplansinPortsmouthNH.

CraftBrewAllianceIn2008,RedhookmergedwithrivalWidmerBrothersBrewingfromPortland,ORtobecometheCraftBrewAlliance(CBA).
CBAaddedKonaBrewingCompanytothefamilyin2012,followedbythelaunchofOmissionandSquareMileCider,andpartnershipswithAppalachianMountainBrewing,CiscoBrewing,andWynwoodBrewingfollowed.

OriginalDesignParameters(1996)• Averageof72,000gpdofwastewater.• CODconcentrationsaveragearound8,000mg/L,
althoughtheycanreachdoublethat.• Incomingsolidsaverage1,300mg/Lafter
screening.• Additionally,thewastewaterpHfluctuates
significantlyfromthecleaningchemicalsinusethroughoutthefacility.
• Thetemperatureofthewastewatercanalsobevariable,althoughgenerallywithintherequirementsofconventionalwastewatertreatment.
• Wastewaterisonlygenerated4daysperweek.
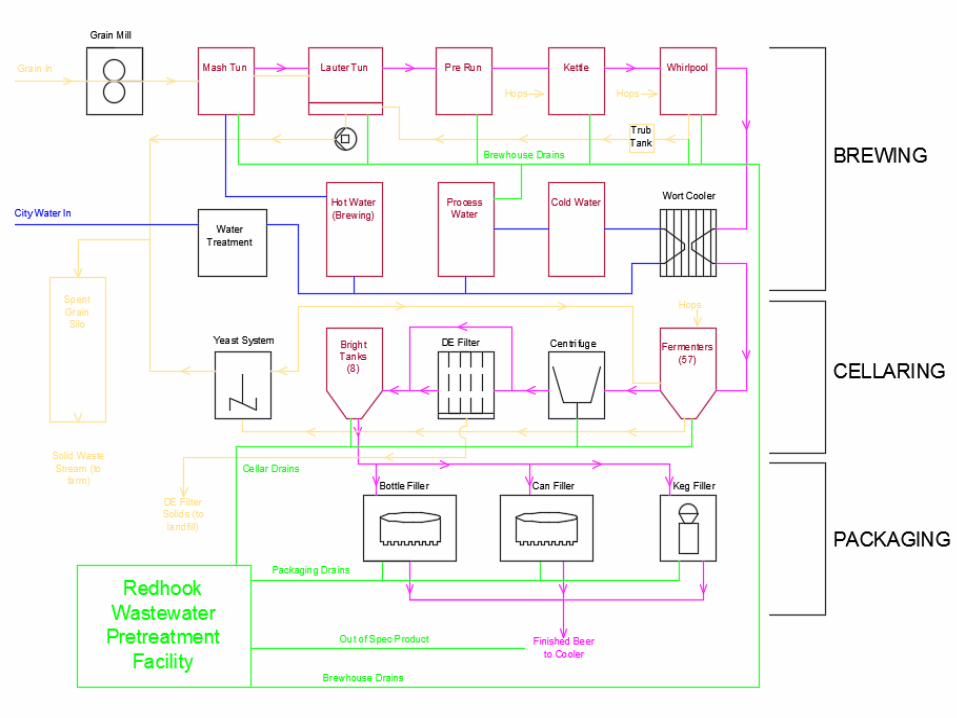
Beer
CleaningChemicals
SpentGrain
Hops
Yeast

WastewaterTreatmentPlantAsOriginallyConstructed,1996

1996Installation
InfluentScreen
Pre-assembledanaerobicreactor.
Installedanaerobicconditioningtankandreactor.

Veolia’sBiothaneanaerobictechnologiesAnaerobicGranularSystems
Biobed®AdvancedEGSB

0
500
1000
1500
2000
2500
3000
3500
4000
9/23
/199
6 3/
24/1
997
9/22
/199
7 3/
23/1
998
9/21
/199
8 3/
22/1
999
9/20
/199
9 3/
20/2
000
9/18
/200
0 3/
19/2
001
9/17
/200
1 3/
18/2
002
9/16
/200
2 3/
17/2
003
9/15
/200
3 3/
15/2
004
9/13
/200
4 3/
14/2
005
9/12
/200
5 3/
13/2
006
9/11
/200
6 3/
12/2
007
9/10
/200
7 3/
10/2
008
9/8/
2008
3/
9/20
09
9/7/
2009
3/
8/20
10
9/6/
2010
3/
7/20
11
9/5/
2011
3/
5/20
12
11/1
2/20
12
5/13
/201
3 11
/11/
2013
5/
12/2
014
11/1
0/20
14
5/11
/201
5 11
/9/2
015
5/9/
2016
11
/7/2
016
5/8/
2017
11
/6/2
017
5/7/
2018
11
/5/2
018
Tota
l Sus
pend
ed S
olid
s (T
SS),
mg/
L
DATE Week Starting
REDHOOK Weekly Average TSS
TSS in TSS eff
TSSEffluentLimit
HighrateanaerobictreatmentsystemisnotdesignedforTSSremoval

0
2000
4000
6000
8000
10000
12000
14000
16000
18000
20000
9/23
/199
6 3/
23/1
997
9/23
/199
7 3/
23/1
998
9/23
/199
8 3/
23/1
999
9/23
/199
9 3/
23/2
000
9/23
/200
0 3/
23/2
001
9/23
/200
1 3/
23/2
002
9/23
/200
2 3/
23/2
003
9/23
/200
3 3/
23/2
004
9/23
/200
4 3/
23/2
005
9/23
/200
5 3/
23/2
006
9/23
/200
6 3/
23/2
007
9/23
/200
7 3/
23/2
008
9/23
/200
8 3/
23/2
009
9/23
/200
9 3/
23/2
010
9/23
/201
0 3/
23/2
011
9/23
/201
1 3/
23/2
012
9/23
/201
2 3/
23/2
013
9/23
/201
3 3/
23/2
014
9/23
/201
4 3/
23/2
015
9/23
/201
5 3/
23/2
016
9/23
/201
6 3/
23/2
017
9/23
/201
7 3/
23/2
018
9/23
/201
8
TCO
D (m
g/l)
Date (week starting)
Redhook Weekly Average TCOD
TCOD in TCOD eff

0
10
20
30
40
50
60
70
80
90
100
0
2000
4000
6000
8000
10000
12000
14000
16000
18000
20000
9/23
/199
6 3/
23/1
997
9/23
/199
7 3/
23/1
998
9/23
/199
8 3/
23/1
999
9/23
/199
9 3/
23/2
000
9/23
/200
0 3/
23/2
001
9/23
/200
1 3/
23/2
002
9/23
/200
2 3/
23/2
003
9/23
/200
3 3/
23/2
004
9/23
/200
4 3/
23/2
005
9/23
/200
5 3/
23/2
006
9/23
/200
6 3/
23/2
007
9/23
/200
7 3/
23/2
008
9/23
/200
8 3/
23/2
009
9/23
/200
9 3/
23/2
010
9/23
/201
0 3/
23/2
011
9/23
/201
1 3/
23/2
012
9/23
/201
2 3/
23/2
013
9/23
/201
3 3/
23/2
014
9/23
/201
4 3/
23/2
015
9/23
/201
5 3/
23/2
016
9/23
/201
6 3/
23/2
017
9/23
/201
7
TCO
D R
educ
tion
(%)
TCO
D (m
g/l)
Date (week starting)
Redhook Weekly Average TCOD
TCOD in TCOD eff TCOD red.

Loadingin2004-2006wasgreaterthanoriginaldesignbasisofanaerobicsystem.
REDHOOKDaily TCOD Loading
0
1000
2000
3000
4000
5000
6000
7000
10/1
/200
4
11/1
/200
4
12/1
/200
4
1/1/
2005
2/1/
2005
3/1/
2005
4/1/
2005
5/1/
2005
6/1/
2005
7/1/
2005
8/1/
2005
9/1/
2005
10/1
/200
5
11/1
/200
5
12/1
/200
5
1/1/
2006
2/1/
2006
3/1/
2006
4/1/
2006
5/1/
2006
6/1/
2006
7/1/
2006
8/1/
2006
9/1/
2006
10/1
/200
6
11/1
/200
6
12/1
/200
6
Date
TCO
D L
oad
(kgT
CO
D/d
)
TCOD in Design Max Inf TCOD Load/Rx

Loadingin2004-2006wasgreaterthanoriginaldesignbasisofanaerobicsystem.ThekeydesignparameterforananaerobicsystemisVolumetricLoadingRate.
REDHOOKDaily Volumetric Loading Rate
0.00
10.00
20.00
30.00
40.00
50.00
60.00
70.00
10/1
/200
4
11/1
/200
4
12/1
/200
4
1/1/
2005
2/1/
2005
3/1/
2005
4/1/
2005
5/1/
2005
6/1/
2005
7/1/
2005
8/1/
2005
9/1/
2005
10/1
/200
5
11/1
/200
5
12/1
/200
5
1/1/
2006
2/1/
2006
3/1/
2006
4/1/
2006
5/1/
2006
6/1/
2006
7/1/
2006
8/1/
2006
9/1/
2006
10/1
/200
6
11/1
/200
6
12/1
/200
6
Date
Volu
met
ric L
oad
(kgT
CO
D/m
3/d)
Vol. Load t Design Max Vol. Load/Rx

WastewaterTreatmentPlant-AsUpgraded2007
12
1. 80,000gallonsofequalization(2tanks)added.Abletosegregateconcentratedflows.
2. Secondanaerobicreactoradded.TCODreductionhasaveraged81%andSCODreductionhasaveraged92%sincestartup

2007UpgradeInstallationEqualization
TanksConditioning
TankAnaerobicReactors

MechanicalProcessControl
• Parametersdirectlyinourcontrol:– pH-additionofNaOHorH2SO4
– Flowratetoreactors– Temperature
• Parametersoutsideourcontrol:– Influentconcentration– Flowratetotreatmentplant– Incomingsolidsloading– Chemicaldumping

ProcessControlOtherControlStrategies• Improvedtesting• Improvednotification• Behavioralcontrolsinbrewery• Communication

BehavioralProcessControls
• Recipechanges,partnerbrews,andincreasedeffortstoconservebeerandwaterallincreaseoursolidsratio.
• Makesurewastewaterisinvolvedinallhighlevelconversations.
• Attempttoharvestsolidsbeforetheygodownthedrainusingsolidstotes,diaphragmpumps,andincreasedlabor

TreatmentPlantPerformance
• SystemisexcellentatremovingsolubleCOD(SCOD)–average92%removal.BODremovalaverage89%.
• TotalCOD(TCOD)reductionislowerduetoTSSineffluent–average81%removal
• Systemisstillnotdesignedtoremovesolids–averageTSSremoval27%.

Evolutionofflowandloadingtoplant
Upgradeof
System

MethaneGeneration140,000CFMofbiogasproducedeachweek,onaverage.Biogasproductionextremelydependentonorganicloading,breweryproductionschedule.90kWgeneratorselectedwithICengineforoptimalturn-down.

ResourceRecovery

CogenerationSystem
Biogasanalysisindicatedupto320ppmofH2Sinthegasstream.Redhookbiogasrangedfrom68-78%methane,dependingonthefeedstockquality.Redhookselecteda90kWgeneratorwithsulfurremoval(activatedcarbon)forbiogasreuse.

CogenerationSystemLiebherr4-cylinderderatednaturalgasengineLeroy-Somer90kWgeneratorset.Dualfuelsystempoweredbyeitherbiogasornaturalgas.Blowertobringlowpressuregasupfrom26mBarto50forcombustion.PackagedsystemwithcontrolsprovidedbyTech3

HeatRecovery


PermitChallenges
• CityofPortsmouth:(2weeks)• Foundation• Plumbing• Electrical• Fire
• State:(2months)• NHDESrequiredamendedAirResourcespermitbecausesystemispart
ofthePollutionControlsystem.• CompliancewithTierIIIemissionsismandateddespiteoutput<100kW
• Other:(10months)Eversource,theelectricalutility,requiredfullInterconnectionStudyandpermitting.BecausetheydidnothaveanyprecertifiedUtilityProtectiveRelaysavailableforsynchronousgenerators,hadtohaveBaslerRelaystudied.

OperatingChallenges
0
50000
100000
150000
200000
250000
Total
kWH
YTD
SumofAvailablekWHSumofkWHGeneratedSumofTargetkWH(2017)
Earlyproblemswith:• Automaticgeneratorcontrols
• Start/stopcontrolbasedontightbiogaspressurerange
• Analogcontrolofgeneratorrunratebasedonfuelavailability.
• Faultresetforgeneratorshutdown.• Warrantyrepairissues
• Oilpressure• Jacketwaterpressure• Turbocharger
• ConflictbetweenTSSreductionprogramandbiogasgeneration.

Questions?