case study telecommunications provider masters ...... and when they do, the first thing they...
TRANSCRIPT

Copyright © 2017 NICE. All rights reserved.
CASE STUDY
Telecommunications Provider
Masters Customer Journeys
with NICE Customer
Engagement Analytics
WH
ITE
PA
PE
R

Copyright © 2017 NICE. All rights reserved.
TABLE OF CONTENTS
The Challenge................................................................................................ 3
NICE CEA ‒ from IVRO to CJO ................................................................ 4
IVRO Deployment ......................................................................................... 4
CJO Deployment .......................................................................................... 7
Analytics ......................................................................................................... 11
Summary ......................................................................................................... 11
About NICE ................................................................................................... 13
Copyright © 2017 NICE. All rights reserved.
The Challenge Telecommunications providers are facing very low customer satisfaction levels, and very high attrition rates. The magnitude of these challenges has increased as customers using multiple communication channels has become a standard business practice. Customers can use human touchpoints, such as retail stores, kiosks, online chatting, and talking with contact center representatives, or contact organizations through email, or use self-service touchpoints such as interactive voice response (IVR), mobile, and web. Customers today are accustomed to switching between channels, and expect a personal and consistent level of service throughout their journey. This expectation requires your organization to adopt a more holistic, customer-centric approach to meet their demands and streamline business processes. Self-service channels are gaining momentum. Enabling your customers to serve themselves brings considerable benefits: it is easier, saves time, reduces costs, and satisfies customer expectations. Telecom providers are following this trend, hoping to reduce the load and cost from human touchpoints and move into the digital arena. Such a transition comes with many difficulties in educating the customers and ensuring successful self-service. However, all organizations must consider that customers who fail in self-service, or find self-service is not possible, will have to call a live representative. Also, some customers still prefer to talk to a human rather than using the digital channels, and when they do, the first thing they encounter is the IVR. It is common knowledge that customers greatly dislike IVR, which they find annoying, and usually end up frustrated and wanting to speak to a live agent. Enhancing the IVR experience is not only critical for keeping customers happy, but it is also the key to reducing call volume and lowering your contact center costs. A streamlined IVR process will help you increase IVR self-service usage, maximize containment rates (i.e. that callers achieve their goals without dropping off to speak with an agent), and create a satisfying customer experience. Telecom Use Case A large U.S. telecom provider faced these challenges. The company owns several brands and supports its customers with more than 50 contact centers and 30,000 agents worldwide. Every year, roughly 30 million customers generate 800 million interactions across various touchpoints. The company faced many challenges, starting with very low first call resolution (FCR), very high transfer rates, low digital channel containment, and very low IVR containment, which caused high dissatisfaction and attrition rate. These low key performance indicators (KPIs) were a direct result of the lack of visibility to the complete customer journey, encompassing all touchpoints. Their analytics team couldn’t answer these key questions for understanding the comprehensive multichannel journey:
How many customers contact you each month?
Which hour of the day are customers most likely to contact you?
What % of customers contacted you five times or more?
How many channels are your customers using?
How many customers are transferred to another agent?
How many customers contacted you using only the retail channel?
How many calls did the most active customer make?
How many customer journeys are there in a month?

Copyright © 2017 NICE. All rights reserved.
For the analytics team, there was also a lack of visibility in the IVR process. IVR is a critical touchpoint; out of the 800 million interactions, half pass through the IVR. They could not answer simple questions such as:
How do you measure IVR containment?
What is the average number of steps in your IVR for each journey type?
Where are your customers dropping out of the IVR?
How long does it take customers to self-serve in the IVR?
What is the IVR containment for different brands and different self-service applications? The company suffered from a dramatic increase in call volume to the contact center, where 35% of customers would abandon IVR, limiting containment to 65%. The provider selected NICE’s IVR Optimization (IVRO) and Customer Journey Optimization (CJO) solutions to answer these challenges, which would bring about considerable change. NICE IVRO shapes the complete IVR experience for every customer journey; NICE CJO is an analytics solution that helps your organization improve the customer engagement process across multiple touchpoints.
NICE CEA ‒ from IVRO to CJO The company chose to deploy NICE Customer Engagement Analytics (NICE CEA), starting with the NICE IVRO solution, which would handle 50% of total customer interactions and address many of the operational challenges, such as IVR containment, mis-routing to the contact center, and repeat callers to the IVR and contact center. They then introduced the NICE CJO solution, for analyzing all human and digital touchpoints, with CRM data, CSAT, and attrition rates contributing to a greater understanding of the complete customer experience and improved customer satisfaction and retention. This gradual approach—addressing the immediate operational pains associated with IVR before moving on to multichannel journey analysis—is common among NICE clients.
IVRO Deployment Following IVRO deployment, the business had full visibility of the IVR journey. New bottlenecks were discovered, and IVR menus were adjusted accordingly. Based on new contact reasoning, self-service enhancements were made to IVR and in other channels that were feeding IVR activity. IVR insights reports were easily created and shared, and most importantly, the containment rate was improved by 10%, in addition to improving customer satisfaction and hundreds of millions of dollars in operational cost savings over the years. This achievement was made possible due to the following activities:
Following IVR KPIs The primary challenge of IVR was to provide upper level management with the visibility of KPI parameters and the ability to follow up on the progress and improvement for IVR containment related to the company’s main brands. The process before IVRO was very cumbersome and included manually gathering information from several different systems, aggregating it in an Excel file, and providing a monthly report. CEA infrastructure is based on big data, and enables creating KPI reports and running analytics tools on the entire customer experience, on any touchpoint, and on any part of the organization. NICE IVRO Analyst Workspace includes managerial dashboards that provide the IVR system’s KPIs, such as containment rate, authentication rate, time spent in IVR, average steps in IVR
Copyright © 2017 NICE. All rights reserved.
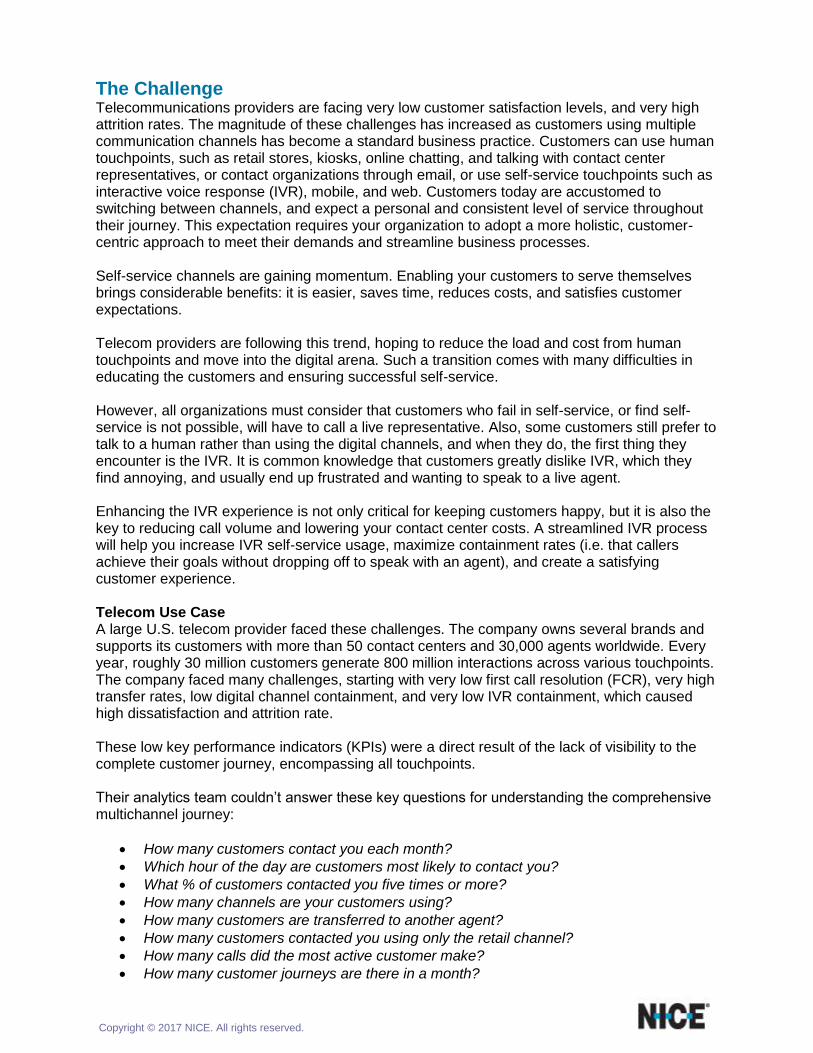
journey across the organization and for each department, and main activities. These KPIs can run instantly and provide daily, weekly, and monthly trends, allowing the management team to follow up on the main trends and progress relative to a company-wide initiative to improve the IVR containment and customer satisfaction. Dashboard: IVR Containment, Authentication, Number of Steps Trends
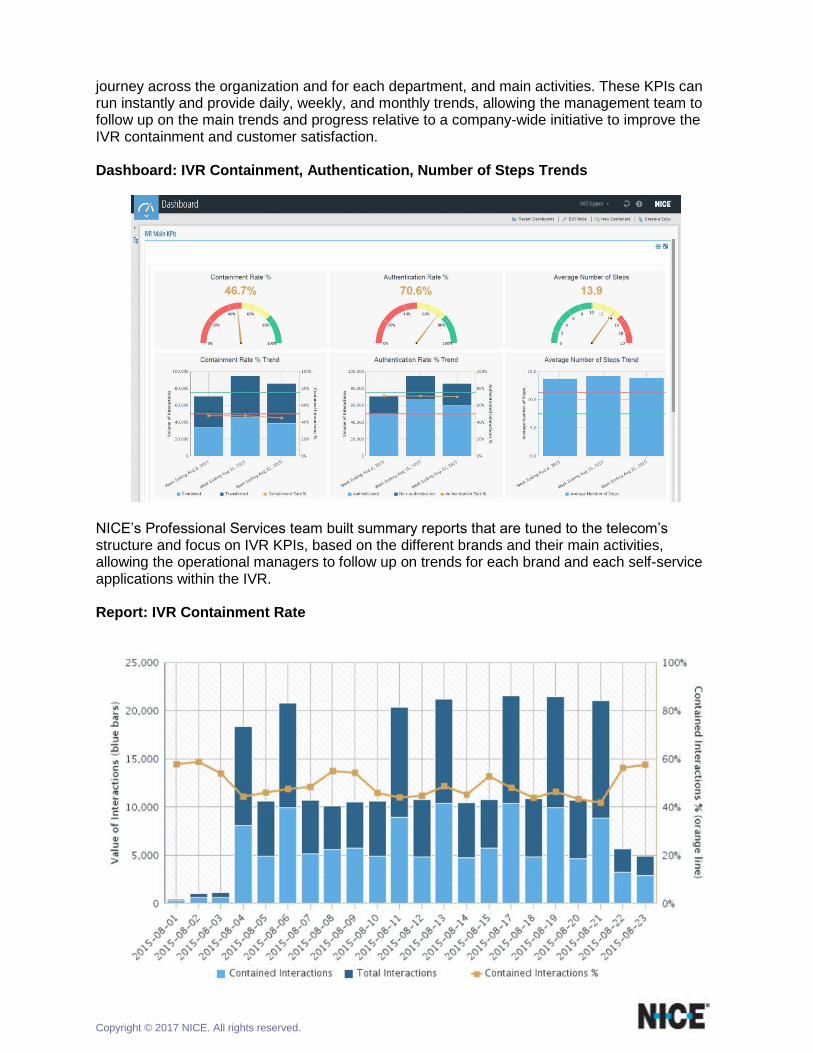
NICE’s Professional Services team built summary reports that are tuned to the telecom’s structure and focus on IVR KPIs, based on the different brands and their main activities, allowing the operational managers to follow up on trends for each brand and each self-service applications within the IVR. Report: IVR Containment Rate

Copyright © 2017 NICE. All rights reserved.
Improving IVR Self-Service Containment The NICE IVRO Journey provides an easy and intuitive way to view, monitor, and explore customer IVR journeys. Operational managers and analysts can easily select the relevant time period they wish to explore and apply a set of additional flexible filters, such as contact reasons and other customer attributes. By using the visualization tool, users can easily view usage patterns, track actual volume, pinpoint bottlenecks, compare with previous periods, and much more.
The NICE IVRO Scenario Analyzer enables analysts to investigate all the details of a specific business flow. By using the tool, the analyst can easily create, visualize, and validate specific use cases. The intuitive visualization, together with the analyzed data, provides a single reference point for analysts to identify bottlenecks, pinpoint areas for improvements, and filter the scenario per any relevant customer attributes for further in-depth analysis. Using NICE IVRO, their analyst created dozens of such processes relating to different brands and different self-service activities.
The analyst is able to drill down into areas where customers failed in the IVR and dropped off from the self-service process, find the exact point in the journey where the customer failed, and make corrective actions to improve the containment.
Mis-Route from IVR into Voice One of the prime functions of the IVR is to route customers to a live representative. Enabling callers to choose the correct service is critical for preventing repeat calls, or calls transferring from one agent to another.

Copyright © 2017 NICE. All rights reserved.
NICE IVRO includes the routing point information for each interaction, repeated callers, and transfers between different agents in the contact center. Using NICE Analyst Workspace, analysts can correlate self-service activities in the IVR relative to the agent skill or contact center routing point, and measure them by volume, repeat rate, or transfer rate. This enables the analyst to identify areas for improvement in the routing mechanism in the IVR or through agent training. Report: Agent to Agent Transfers Rate of Self-Service vs. Skill
Repeat Customers One of their main challenges involved handling frequent repeat customers, which would overload the IVR and contact center. Among NICE CEA’s fundamental capabilities is the linking of all customer interactions across all touchpoints and identification of repeat callers. NICE IVRO can identify the most frequent repeat customers and drill down to the level of the individual customer, to take the right actions to preserve these customers or ensure their problem is solved. Report: List of Customers
CJO Deployment Following CJO deployment, the company had full visibility of the entire customer journey across all touchpoints. The telecom wanted to understand the complete customer experience across all touchpoints that led to low NPS and low customer satisfaction. What are the top journeys of detractors? What is the root cause for low CSAT? Who are the agents causing low CSAT?

Copyright © 2017 NICE. All rights reserved.
They also needed to understand the root cause for customer attrition. What are the top cross-touchpoint journeys customers took before churning? What is the root cause for the churn? Who are the agents who handled these customers? Many enterprises are investing in digital transformation and want to move their customers into digital channels. Understanding why customers are moving from web/mobile channels to voice channels is crucial to this process. CJO meets these business challenges.
Customer Satisfaction One of the main challenges of enterprises, and particularly in the telecom industry, is to improve customer satisfaction. This was proven to directly affect customer attrition. Today, most customer experience solutions fail to account for the comprehensive customer experience and the ability to focus on specific channels and specific feedback. NICE CJO allows brands to assess the cross-channel journey for detractors or unhappy customers. Using CJO, users can understand the intent of the customers and why they are unhappy, and drill down to the individual customer journey. Customer Journey: Detractor Cross-Channel Journey
NICE CJO provides the ability to drill down on a specific path, drill to business intelligence, and analyze all aspects of these customers—who they are, what their intent is at each step of the journey, and what the root causes of their dissatisfaction are.
Digital Containment One of the main goals was to move customers from the contact center into web and mobile applications. During this process, the enterprise must ensure it has streamlined digital processes to increase digital and self-service containment.
Copyright © 2017 NICE. All rights reserved.
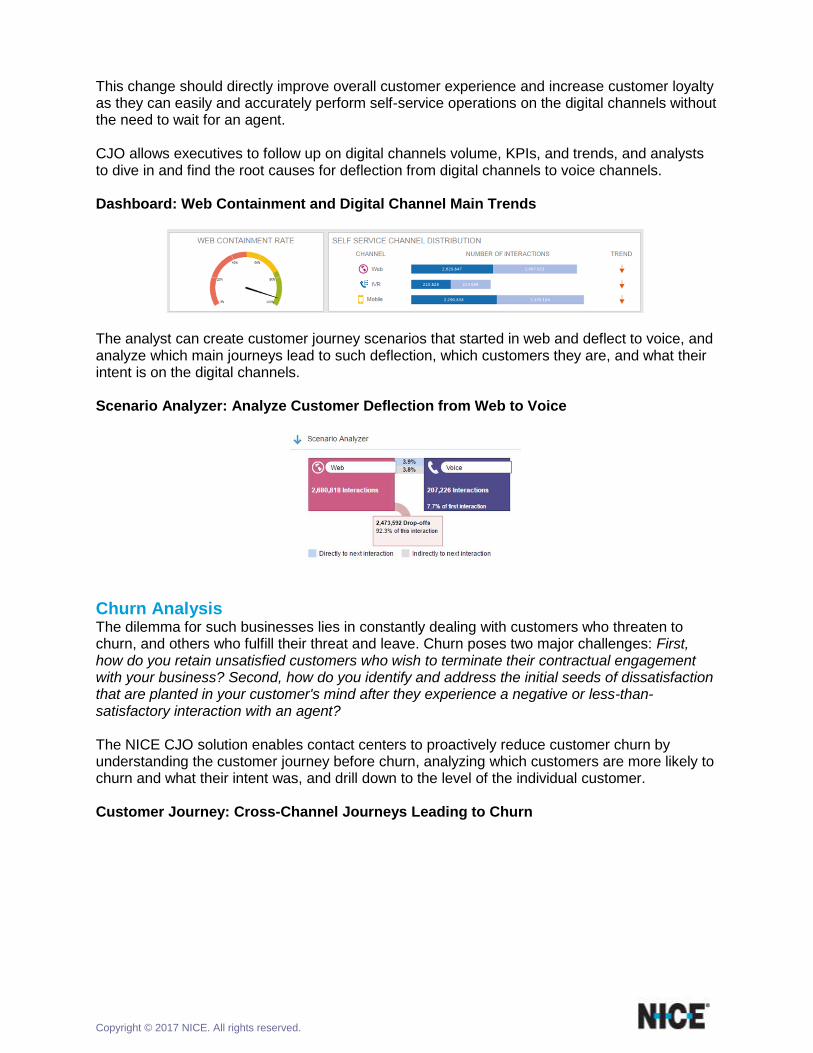
This change should directly improve overall customer experience and increase customer loyalty as they can easily and accurately perform self-service operations on the digital channels without the need to wait for an agent. CJO allows executives to follow up on digital channels volume, KPIs, and trends, and analysts to dive in and find the root causes for deflection from digital channels to voice channels. Dashboard: Web Containment and Digital Channel Main Trends
The analyst can create customer journey scenarios that started in web and deflect to voice, and analyze which main journeys lead to such deflection, which customers they are, and what their intent is on the digital channels. Scenario Analyzer: Analyze Customer Deflection from Web to Voice
Churn Analysis The dilemma for such businesses lies in constantly dealing with customers who threaten to churn, and others who fulfill their threat and leave. Churn poses two major challenges: First, how do you retain unsatisfied customers who wish to terminate their contractual engagement with your business? Second, how do you identify and address the initial seeds of dissatisfaction that are planted in your customer's mind after they experience a negative or less-than-satisfactory interaction with an agent? The NICE CJO solution enables contact centers to proactively reduce customer churn by understanding the customer journey before churn, analyzing which customers are more likely to churn and what their intent was, and drill down to the level of the individual customer. Customer Journey: Cross-Channel Journeys Leading to Churn

Copyright © 2017 NICE. All rights reserved.
CJO provides full visibility of the individual customer journey and therefore clarification of which agents handle the customer before they churn. Daily, weekly, and monthly reports empower the telecom to better train the agents, and use them as part of the overall agent compensation package (and thus provoke much better service).
Measure Workforce Performance One of their main business goals is to obtain a complete picture of KPIs for their agents and teams. These KPIs can be used to create better training sessions, inform the agent compensation package, and directly influence customer satisfaction, attrition, and additional dollar value. CJO provides the following KPIs:
CSAT and NPS – Identify agents contributing to detractors and unhappy customers.
Post-Interaction Customer Attrition – Find agents who had contact with the customers who churn within a 30-day time period and directly influenced customer attrition.
FCR – Measure agents who weren’t able to handle customer dissatisfaction and are responsible for repeat calls into the contact center.
Dollar Per Call – Measure the contribution of agents to the revenue of the business. NICE CJO exported this information into NICE Performance Management, which combines CJO metrics with all other organizational metrics and provides a full solution for improving agent skills and performance. NICE Workforce Management System:

Copyright © 2017 NICE. All rights reserved.
Analytics NICE IVRO and CJO introduce very powerful analytical tools that help executives and analysts identify the root cause of low IVR and digital containment. NICE IVRO includes a smart analytics algorithm that provides recommendations for the reordering of IVR menu items to save customers time and improve IVR containment. The engine pinpoints IVR bottlenecks and automatically recommends the required actions to mitigate them. The new algorithm scans the IVR menus and calculates how much time customers usually spend in every step. For every IVR menu, it will check new item ordering, highlight menus that can significantly reduce time traffic, and show the optimal reordering for them. NICE IVRO provides advanced analytics capabilities to improve the self-service containment, by finding problematic IVR menus from which people tend to be frustrated, or even angry with the system, resulting in hang-up without completion of self-service operations or transferring to an agent. The solution introduces a new Menu Complexity Score to provide simple and clear metrics for each IVR menu, scoring its complexity from a scale of 1-100—the higher the number, the more complex the menu is. NICE IVRO provides the ability to identify journeys with repeated menus where customers get lost in the IVR, or are unable to complete the operation at one time and need to reload the menu. Such journeys help to convey the root cause for customer dissatisfaction and lack of ability to complete a self-service process, and help analysts to focus on the exact customer pains in the IVR. Moreover, IVRO provides a Quick Insight to analyze customers who do manage to succeed in self-service operation or any process in IVR, versus customers who fail. The algorithm scans dozens of attributes related to customer, IVR, or any other object in the system, and finds the attributes that most contribute to failure or success. In Digital Containment, we use the Quick Insight algorithm to identify which customers are able to complete their work in digital channels versus customers who deflect into voice. It helps the analyst to understand the profile and intent of customers who most contribute to deflection into voice.
Summary Following a gradual deployment of IVRO, followed by CJO, enterprise KPIs were improved, starting with an increase of 10% in IVR containment rates and hundreds of millions of dollars saved in a short timeframe. The success continued with attainment of a holistic view of customer satisfaction and intent across all channels.

Copyright © 2017 NICE. All rights reserved.
Such holistic visibility enables the telecom provider to reduce customer attrition and increase satisfaction.

Copyright © 2017 NICE. All rights reserved.
CONTACTS
Global International HQ, Israel, EMEA, Europe & Middle East,
T +972 9 775 3777, F +972 9 743 4282 T +44 0 1489 771 200, F +44 0 1489 771 665
Americas, North America, Asia Pacific, Singapore Office
T +1 551 256 5000, F +1 551 256 5252 T + 65 6222 5123, F +65 6222 5459
The full list of NICE marks are the trademarks or registered trademarks of Nice Systems Ltd. For the full list of NICE trademarks, visit http://www.nice.com/nice-trademarks all other marks used are the property of their respective proprietors.
ABOUT NICE
NICE (NASDAQ: NICE) is the worldwide leading provider of enterprise software solutions and that empower organizations to make
smarter decisions based on advanced analytics of structured and unstructured data. NICE solutions help the world’s largest organizations
deliver better customer service, ensure compliance, combat fraud and safeguard people. Over 25,000 organizations in more than 150
countries, including over 80 of the Fortune 100 companies, are using NICE solutions. www.nice.com.
WP-#### • 08/2017 • Contents of this document are Copyright © 2017