casidra soc ltdannexure c: consolidated indicators 62 annexure d: risk management plan 62 annexure...
TRANSCRIPT

1

2
Casidra SOC Ltd
Strategic Plan for
2020/21 – 2024/25
Date of Tabling: 9 March 2020

3
Executive Authority Statement
Casidra’s Strategic Plan for 2020/2025 is framed within the context of the five broad priorities I have
set for agriculture in the Western Cape.
Firstly, I would like to continue with structured education and training and ensure that we create
more training opportunities, especially for the youth in the agricultural sector. More agricultural
schools should, therefore, be established in the Western Cape.
Secondly, I would like to strengthen guidance and support to the broad agricultural sector, as
many of our farmers do not receive support, especially when competing internationally with their
agricultural products. Small farmers will also be supported.
Thirdly, security in rural areas is a top priority and is currently the core focus in the Western Cape
Government, as we believe that rural safety creates a conducive environment to enable the rural
economy to thrive.
Fourthly, because agriculture plays such an integral role in the economy, it is a priority to facilitate
market access and export of agricultural products. Our farmers are generally very competitive,
but we need to facilitate access to a larger market share.
My fifth priority is the management of climate change and its impact on agriculture, which is the
reason why I am interested in innovation, technology and partnerships.
I wish the Board, Management and Staff of Casidra well as they set about implementing their
Strategic Plan for 2020 – 2025 in support of the work of the Western Cape Department of
Agriculture.
_____________________________________________________
Dr Ivan Meyer
Minister of Agriculture

4
Accounting Authority Statement
Casidra’s mandate, namely ‘Agricultural and Economic Development within a Rural and Land
Reform context’ in terms of Resolution 271/2007 of the Provincial cabinet remains unchanged. This
means that our Company’s vision and mission to maximise Agricultural and Economic
Development opportunities in rural communities through project management excellence remain
relevant.
During the previous financial year, Casidra established itself as a proficient project management
implementing agency while mainly servicing the Western Cape Department of Agriculture
(WCDoA), its institutional funder. Services were also rendered to other provincial departments,
government entities and the private sector. The organisation executed its mandate in an
agricultural and economic development setting and provided these services, particularly in the
rural areas of the Province.
Casidra managed to position itself as an integral role-player in the implementation of government-
funded projects, especially when considering the following:
● Government’s recognition that rural development is important enough to retain a separate
focus on it. ● Capacity and project management resources for stimulating economic development and
job creation as well as the practical implementation of projects in rural areas are generally
limited. ● Casidra’s ability to move quickly and be adaptable to regulations, reporting and compliance
requirements, limited resources as well as hands-on project implementation abilities.
These are justified by a huge success in the roll out of various projects and programmes, which
includes the Land Reform Programme, CASP Programme, Management of farms whereby Anhalt
was successfully handed over back to the community, etc. during this period.
Over the medium term Casidra will explore two key strategic focus areas. The first is charting and
agreeing to a pathway for the organisation’s sustainability. The second key strategic focus area is
to nurture strategic relationships across the public and private sectors. We will continue to explore
mechanisms to unlock future funding to support rural development and transformation
programmes as well as the implementation thereof. We fully support our Management team as
they explore strategic opportunities with commercial partners who share common objectives.
We are grateful for our Shareholder’s continuous support. Casidra appreciates good guidance
from Minister Ivan Meyer and looks forward to delivering on his expectations. We are honoured
to work alongside the Head of the Department of Agriculture and her Senior Management team
and staff for service delivery excellence to our beneficiaries. It is always my great honour and
privilege to work with the Board of Directors, Management and staff of Casidra. Your continued
support and commitment make a difference in the lives of the rural communities. Thank you for
your ongoing and tireless efforts. #Fortheloveofagriculture.
____________________________________________________
Ainsley Moos
Accounting Authority of Casidra SOC Ltd

5
Official Sign-Off
It is hereby certified that this Strategic Plan:
Was developed by the Management of Casidra SOC Ltd under the
guidance of Minister Ivan Meyer
Takes into account all the relevant policies, legislation and other mandates
for which Casidra SOC Ltd is responsible
Accurately reflects the Impact, Outcomes and Outputs which Casidra SOC
Ltd will endeavour to achieve over the period 2020-25.
David Nefdt Signature: ___________________________
Chief Officer: Projects
Masibonge Silevu Signature: ___________________________
Chief Officer: Technical
Freek van Zyl Signature: ___________________________
Chief Financial Officer
Freek van Zyl Signature: ___________________________
Acting Accounting Officer
Ainsley Moos Signature: ___________________________
Accounting Authority
Approved by:
Minister Ivan Meyer Signature: ___________________________
Executive Authority

6
TABLE OF CONTENTS EXECUTIVE AUTHORITY STATEMENT 3
ACCOUNTING AUTHORITY STATEMENT 4
ABBREVIATIONS AND ACRONYMS 7
PART A: OUR MANDATE 8
1. UPDATE TO LEGISLATIVE AND POLICY MANDATES 8
2. UPDATE TO INSTITUTIONAL POLICIES AND STRATEGIES 9
3. UPDATE TO RELEVANT COURT RULINGS 13
PART B : OUR STRATEGIC FOCUS
4. VISION 14
5. MISSION 14
6. VALUES 14
7. UPDATE OF SITUATIONAL ANALYSIS 14
7.1 External Environment Analysis 14
7.2 Internal Environment Analysis 21
PART C: MEASURING OUR PERFORMANCE 24
Institutional Performance Information 24
8. Programme 1: Corporate Services 24
8.1 Measuring the Impact 24
8.2 Measuring Outcomes 25
8.3 Explanation of Planned Performance over the Five-Year Planning Period 25
9. Programme 2: Agriculture and Land Reform 26
9.1 Measuring the Impact 27
9.2 Measuring Outcomes 27
9.3 Explanation of Planned Performance over the Five-Year Planning Period 28
10. Programme 3: Rural Infrastructure Development and Poverty Alleviation 29
10.1 Measuring the Impact 30
10.2 Measuring Outcomes 30
10.3 Explanation of Planned Performance over the Five-Year Planning Period 30
11. Programme 4: Local Economic and Business Development 32
11.1 Measuring the Impact 32
11.2 Measuring Outcomes 32
11.3 Explanation of Planned Performance over the Five-Year Planning Period 33
12. Key Risks 34
13. Public Entities 34
PART D: TECHNICAL INDICATOR DESCRIPTIONS (TIDS) 35
PART E: ANNEXURES AND LINKS TO OTHER PLANS 62
ANNEXURE A: Amendments to Strategic Plan 62
ANNEXURE B: Conditional Grants 62
ANNEXURE C: Consolidated indicators 62
ANNEXURE D: Risk Management Plan 62
ANNEXURE E: Fraud Prevention Plan 71
ANNEXURE F: Materiality and Significance Framework 71
ANNEXURE G: Financial Management Plan 72
ANNEXURE H: Organisational Structure 78

7
ABBREVIATIONS AND ACRONYMS
B-BBEE Broad-Based Black Economic Empowerment
CASIDRA Cape Agency for Sustainable Integrated Development in Rural Areas
CASP Comprehensive Agricultural Support Programme
CPAC Commodity Project Allocation Committee
CRDP Comprehensive Rural Development Programme
DARDLR Department of Agriculture, Rural Development and Land Reform
DEDAT Department of Economic Development and Tourism
DPAC Departmental Project Allocation Committee
DRDLR Department of Rural Development and Land Reform
EIA Environmental Impact Assessment
HR Human Resources
IT Information Technology
LREAD Land Reform Advisory Desk
MoA Memorandum of Agreement
NDP National Development Plan
PGWC Provincial Government of the Western Cape
PFMA Public Finance Management Act (Act 1 of 1999)
SG Strategic Goal
SOC State-Owned Company
SMME Small Micro Medium Enterprise
SETA Sector Education and Training Authority
UIF Unemployment Insurance Fund
UTA Unit for Technical Assistance
WCDoA Western Cape Department of Agriculture

8
Part A: Our Mandate
1. UPDATES TO THE RELEVANT LEGISLATIVE AND POLICY MANDATES
1.1 CONSTITUTIONAL MANDATES
Constitution of the Republic of South Africa, 1996 and the Western Cape Provincial Constitution (Act 1 of
1998):
● Functional areas of concurrent National and Provincial legislative competence ▪ Agriculture ▪ Regional Planning and Development ▪ Soil Conservation ▪ Tourism ▪ Trade ▪ Rural Development ▪ Environmental Affairs
● Functional areas of exclusive provincial legislative competence ▪ Provincial Planning
1.2 LEGISLATIVE MANDATES Staff Matters:
● Basic Conditions of Employment Act (Act 75 of 1997)
● Employment Equity Act (Act 55 of 1998)
● Labour Relations Act (Act 66 of 1995)
● Occupational Health and Safety Act (Act 85 of 1993)
● Pension Funds Act (Act 24 of 1956)
● Public Holidays Act (Act 6 of 1994)
● Skills Development Act (Act 97 of 1998)
● Skills Development Levies Act (Act 9 of 1999)
● Tobacco Products Control Act (Act 83 of 1993)
Financial Matters:
● Companies Act(Act 71 of 2008)
● Income Tax Act (Act 58 of 1962)
● Preferential Procurement Policy Framework Act (Act 5 of 2000)
● Public Finance Management Act (Act 1 of 1999)
● Financial Intelligence Centre Act (Act 38 of 2001)
Other Legislative Mandates:
● Broad-Based Black Economic Empowerment Act (Act 53 of 2003)
● Conservation of Agricultural Resources Act (Act 43 of 1983)
● Consumer Protection Act (Act 68 of 2008)
● National Credit Act (Act 34 of 2005)
● Promotion of Access to Information Act (Act 2 of 2000)
● Protection of Personal Information Act (Act 4 of 2013)
● Sub-division of Agricultural Land Act (Act 70 of 1970)
● Regulation of Interception of Communications and Provision of Communication-related Information
Act (Act 70 of 2002)
● Annual Sectoral Determination 13: Farm Worker Sector, South Africa

9
1.3 POLICY MANDATES ● National Outcomes 4, 5, 6, 7 and 10
● Vision Inspired Priorities 1, 2, 3, 4 and 5
● Casidra Cabinet mandate: ‘Agricultural and Economic Development within a Rural and Land Reform
context’ in terms of Resolution 271/2007 of the Provincial Cabinet
● Land and Agrarian Reform Programme (LARP)
● Integrated Food Security and Nutrition Strategy
● Ilima Letsema Programme
● Comprehensive Rural Development Programme (CRDP)
● Provincial Growth and Development Strategy
● Provincial Spatial Development Strategy
● Integrated Development Plans of Municipalities
● Comprehensive Agricultural Support Programme (CASP)
● Integrated Food Security and Nutrition Programme
● National Development Plan
● SA National Disaster Management Framework
2. UPDATES TO INSTITUTIONAL POLICIES AND STRATEGIES
2.1 STRATEGIC OUTCOME ORIENTED GOALS OF CASIDRA
Strategic Outcome
Oriented Goal 1
Casidra to provide project management services to the Western Cape
Department of Agriculture to achieve their goals
Goal Statement
Agricultural transformation means the rapid and fundamental change in the
relations to systems and patterns of ownership and control of land, livestock,
cropping and community. This entails, among other things, improving the
productivity, economic viability and sustainability of small and large farm
enterprises. It focuses on, but is not limited to, the establishment of rural
business initiatives, agro-industries, co-operatives, and vibrant local markets in
rural settings as well as the empowerment of rural people and communities
especially women and youth; and seeks to transform power relations.
NDP Output 1: Sustainable agrarian reform, with thriving small and large
farming sector aims to contribute to the following:
Economic growth through the agricultural sector and ensure that the
economic benefits are experienced at local level;
Efficiency in water use through suitable technologies;
Ensuring the availability of land for socio-economic development,
economic growth through the agricultural sector and access to food
security, and
Improved production.
By combining agricultural experience and knowledge with project
management capabilities and efficient financial and governance systems,
Casidra will continue to support the WCDoA with the disbursement of funds
from the CASP/Ilima and LandCare Programmes.

10
Strategic Outcome
Oriented Goal 1
Casidra to provide project management services to the Western Cape
Department of Agriculture to achieve their goals
An estimated 230 active projects are supported by the WCDoA with
procurement from grant funding for physical infrastructure delivery on
approved project business plans.
Another initiative to support this goal is the involvement in the Agricultural
Production Strategy of the Department of Agriculture, Rural Development
and Land Reform (DARDLR), within the context of rural development and tied
to the objective of agrarian reform. Institutional arrangements for an
integrated support strategy are based on the commodities’ approach.
Practical product specific and marketing experience is brought together in
the Commodity Project Allocation Committee (CPAC) for each of the nine
commodities and is used to evaluate projects for viability and to award CASP
funding to applicants.
Casidra will play an integral role in the facilitation of the processes within
specific commodities, act as a secretariat for them, and implement the
approved business plans for commodities where Casidra is involved.
Two government-owned farms (owned by the National Department of Public
Works), dating back to the 1980s as land restitution projects, are being
managed by Casidra through a five-year Memorandum of Agreement with
the Western Cape Government’s Department of Agriculture. Turnaround
strategies, already prepared, will be taken forward within the framework of
strategic plans, budgetary requirements and commitment by principals to
conclude these as Land Reform projects. The two farms are Waaikraal and
Amalienstein.
The WCDoA is responsible for the facilitation of the Comprehensive Rural
Development Programme (CRDP) in selected nodes in the Western Cape with
the objective to create vibrant, sustainable rural communities.
Whereas the Department will focus on the citizen-facing role in preparing the
institutional environment for implementation, Casidra will focus on the
implementation of identified projects by offering excellent project
management services.
Link to MTSF: Priority 2- Economic transformation and job creation
Strategic Outcome
Oriented Goal 2
Give support for local economic and business development initiatives in rural
areas to create and facilitate an enabling environment
Goal Statement
The Western Cape economy, as a significant contributor to the national
economy, emphasises the importance of government interventions and
policy to sustain and direct economic growth.
Although the agricultural sector may be the logical and sensible cornerstone
of rural development, the environment for successful agricultural economic,
social and environmental activity is what contributes holistically to rural
development.

11
Strategic Outcome
Oriented Goal 2
Give support for local economic and business development initiatives in rural
areas to create and facilitate an enabling environment
When considering rural development, cognisance must be taken of the
actual development potential of municipal areas in order to create an
environment that supports private sector investment that will create
sustainable job opportunities for rural communities. Rural development
cannot be the sole mandate of one Department. Interventions from various
state agencies, parastatals and the private sector will be needed to make a
significant impact.
In this regard, the main components of an enabling environment for
economic development initiatives must include:
● Increased skills levels ● Access to a full range of business development services ● Market readiness and access ● Access to finance ● Rural infrastructure development ● Identification and implementation of sustainable livelihoods projects
Rural communities are still faced with challenges related to lack of and/or
inadequate services and related infrastructure, and inadequate resources for
service delivery. Provision of services and allocation of resources should take
the complexities and unique challenges facing each rural space into
consideration. In order for services to be provided effectively some basic
infrastructure is needed. Infrastructure is important for provision of services like
water, sanitation, electricity and roads, even access to IT. There is therefore a
need for rehabilitation, maintenance and construction of new infrastructure.
Accessibility of business information to both small farmers and entrepreneurs
in the rural areas is a catalyst for economic growth and job creation. Business
information and support is readily available in the Western Cape through the
Small Enterprise Development Agency (SEDA) and other entities. Casidra
harnesses the strengths of various role-players in the sectors and facilitates
collaboration between these parties in the interest of entrepreneurial support
and job creation.
The Strategic Objectives of the Programme are defined as follows:
To facilitate economic empowerment of emerging entrepreneurs and
small businesses through support and mentoring;
To facilitate awareness of economic opportunities through improving
access to financial and non-financial initiatives;
To assist in creating an environment that supports private sector
investment within rural communities;
To promote the implementation of green initiatives; and
To facilitate participation of local government in Local Economic
Development.
Casidra will play a project management role in any identified projects that
underpin the above Strategic Objectives.
Link to MTSF: Priority 2- Economic transformation and job creation

12
Strategic Outcome
Oriented Goal 3
Manage resources effectively and ensure good corporate governance to
achieve an unqualified audit in each financial year
Goal Statement
An entity such as Casidra is about efficient service delivery in support of
Government Departments for a specific purpose. It should, therefore, be
enabled to have the necessary capacity and to be able to focus on the task
at hand. The Company’s support services (finance and administration, human
resources, public relations and communication, and information technology)
need to be organised in such a manner that they support the project delivery
departments in an efficient and effective manner. In addition, retention of
staff will be a strategic priority area.
Casidra’s corporate governance, its Board and committees are organised
and informed by the principles of the King IV Report. Casidra also takes its
people and green strategy seriously. Sustainability of the organisation is of
primary concern to the Board and Management team.
Link to MTSF: Priority 1- Building a capable, ethical and developmental state
Strategic Outcome
Oriented Goal 4
Develop and implement the Casidra Development Model by 2024
Goal Statement
Casidra’s present deliverables have been built around:
● Project management capabilities ● Efficient governance structures ● Efficient financial systems ● Competitive edge due to a business-oriented model ● A reactive culture in responding to needs
In the past, clients have been mostly limited to the WCDoA and DEDAT with
deliverables to individual beneficiaries through specific programmes run by
these Departments. Based on its track record, skills and composition, Casidra
is able to market its services to other Government Departments. Casidra has
developed a blue-print in developing and implementing developmental
initiatives in the rural areas of the Western Cape.
Casidra has reached a stage in its journey where it wants to reach out
externally and capacitate especially community role-players to implement
results-driven development initiatives. The Company intends strengthening
partnerships for development that can provide a potential additional revenue
stream to Casidra.
Link to MTSF: Priority 2- Economic transformation and job creation

13
Strategic Outcome
Oriented Goal 5
Maintain and expand project management capability as an implementing
entity in general through training and information systems
Goal Statement Casidra needs to continually ‘sharpen the saw’ by ensuring continuous
cutting-edge project management training to its staff members to assist the
Company in becoming a high-performance team excelling in project
excellence. Casidra cannot deliver a good service if it neglects the human
capital development of its own staff members. The ‘learning organisation’
concept also needs to be supported by information technology support to
the project managers and an effective knowledge management system.
Skills development is central to economic development and in ensuring that
communities benefit from local initiatives. There needs to be ongoing
support for agri-schools and agricultural colleges as per the Minister’s
priorities.
Link to MTSF: Priority 2- Economic transformation and job creation
Strategic Outcome
Oriented Goal 6 Develop and grow new markets on a cost-recovery basis aligned to the
commercial partnerships’ strategy Goal Statement Casidra SOC Limited should be proactive to market its services to other
Government Departments, State-owned enterprises, municipalities and the
private sector. This will also include funding from developmental agencies
that seek to support projects for rural development. To ensure future
sustainability, the Company needs to identify and develop new markets to
generate additional income.
This will be done without losing sight of the Company’s primary focus based
on its mandate. Casidra’s unique capabilities and strengths can allow it to
position itself as a service provider of choice to Provincial and National
Departments.
Link to MTSF: Priority 2- Economic transformation and job creation
3. UPDATES TO RELEVANT COURT RULINGS
Not Applicable

14
Part B: Our Strategic Focus
4. VISION
To be the catalyst for growth towards self-sustainable communities.
5. MISSION
To maximise Agricultural and Economic Development opportunities in rural communities through project
management excellence.
6. VALUES
● Integrity: We act in an ethical manner with trust, honesty, reliability and credibility.
● Professionalism: We deliver excellent work with a positive attitude by well-skilled people using best
practice in a business-like approach.
● Caring: We want the best for our customers and staff, and treat them with respect and empathy,
whilst embracing diversity.
● Development-driven: We add value to people and business to ensure sustainable growth.
● Innovative: We strive to seek better and lasting solutions.
7. Updated Situation Analysis
7.1. External Environment Analysis
The strategic focus for Casidra over the next five years broadly includes the following specific areas;
Delivering project management excellence on the programmes of our key Partner, the Western
Cape Department of Agriculture.
Sustainable management of the two remaining government farms, namely Amalienstein in Zoar near
Ladismith and Waaikraal in Dysselsdorp near Oudtshoorn on behalf of the Department of Transport
and Public Works (DTPW) until a suitable exit strategy is finalised.
Facilitation of successful Land Reform projects within the Western Cape Agricultural Sector and
aligned to Casidra’s mandate.
The diversification and growth of the revenue and funding base through the development of
commercial partnerships that support and are aligned to Casidra’s mandate.
To successfully deliver on economic development and green economy projects that positively
impact on job creation, poverty alleviation and rural development in collaboration with partners
across the spectrum of the private sector, public sector and NGOs.
To maintain our project management centre of excellence capability available to other
Departments as a cost-effective implementation partner.

15
Casidra celebrated its 30th anniversary during 2019 and at the same time its 30th unqualified Audit Report,
which bears testimony to its commitment to clean governance and consistency to this commitment over
its three decades of existence.
Casidra established itself as a proficient project management implementing entity while mainly servicing
the Western Cape Department of Agriculture (WCDoA), its institutional funder. Services are also rendered
to other Provincial Departments, Government entities and the private sector. The organisation executes
its mandate in an agricultural and economic development setting and is mandated to provide these
services particularly in the rural areas of the Province.
Casidra has become the leading partner and catalyst in the battle against poverty and inequality in
many of these rural areas, which are mainly characterised by a lack of resources, suitable financial,
institutional and developmental support. Considering the fact that resources for stimulating economic
development in rural areas are generally not as abundantly available as in the urban areas, Casidra
strives to lobby the public and private sectors as wide as possible, to partner and assist in these areas in
order to optimise opportunities.
Casidra managed to position itself as an important role-player in the implementation of government-
funded projects, especially when considering the following:
● The recognition of government that rural development is important enough to retain a separate focus
on it.
● Capacity and project management resources for stimulating economic development and job
creation as well as the practical implementation of projects in rural areas are generally limited.
● The ability of Casidra to move quickly and be adaptable in an environment that is constrained by
cumbersome supply chain regulations, reporting and compliance requirements and limited resources
as well as hands-on project implementation abilities.
Casidra’s SWOT analysis is as follows:
STRENGTHS WEAKNESSES
30 Years’ sound track record of project
implementation and unqualified audits
Wide knowledge and understanding of
operating environment (Agriculture and
Rural Economic Development)
Capacity: Well experienced professional
and multi-disciplinary team
Positive longstanding relationship with the
Shareholder and the Western Cape
Department of Agriculture
Strong stakeholder and partnerships within
the Province and beyond
Project Management and
Implementation experience
Lean and efficient structure that serves
the development
Onerous regulatory environment that
adversely impacts on delivery timeliness
Budget limitations adversely impacts on
capacity and implementation
Limited funding mix for projects impacts
on long-term sustainability

16
OPPORTUNITIES THREATS Commercial partnerships, which could
diversify funding and revenue mix
Growth and development in extending
the offering to include agricultural finance
and support services
Extension of services to other organs of
state such as municipalities and other
Departments
Collaboration with other public entities
outside the Western Cape
Enhance operational efficiencies with
automation of Enterprise Resource
Planning (ERP) systems to align to 4th
Industrial Revolution (4IR)
An adverse outcome for the WCDoA
litigation against the AGSA may have a
fundamental negative sustainability
impact
Current economic growth and budget
cuts
The Executive Authority enters into an annual Shareholder’s Compact with Casidra’s Board of Directors
as the Accounting Authority on behalf of the Western Cape Government. This forms the foundation of
the operational arrangement and is further underscored by the Cabinet Mandate of 2007.
All projects are directed through MoAs with the Western Cape Department of Agriculture and other
clients, and are regularly monitored and reported against.
Casidra continues to be the face at the forefront of Government funded agriculture development
initiatives in the Province, as it fulfils its mandate to implement the CASP and Ilima Letsema funded projects
of the WCDoA. This Programme has supported quite a substantial number of new farmers in the Province
since its inception.
The strategic focus for the two farms, Amalienstein and Waaikraal, is to get them to reach a profitable
and sustainable stage before being transferred to the relevant beneficiaries or communities. However,
lack of clear land reform objectives, strategic direction and committed funding to implement new
ventures and infrastructure in terms of the proposals made in the turnaround strategies that were drafted
by Casidra and presented to the WCDoA, hamper this objective, as the farms are currently unsustainable
due to limited resources. The farms cannot secure funding to implement new ventures and extend the
current activities. Current revenues generated cannot sustain the farms and, therefore, rely on
government grants.
Although the current farms’ Management contracts between Casidra and the WCDoA expire on 31
March 2020, Casidra is investigating the possibility of bringing in commercial partners for the farms to
develop commercial opportunities on the farms and benefit the communities as well.
A high level business case for Amalienstein will be presented to Cabinet for the way in which direct State
involvement with resultant empowerment and land reform can be achieved. The DRDLR and Kannaland
Municipality started a process in 2017 to address the institutional status of the farm that has come to a
standstill.
The performance of Casidra’s strategic outcome-oriented goals in the next year from 2020/2025, will be
informed and aligned to the Medium Term Strategic Framework (MTSF) Priorities and Provincial Vision
Inspired Priorities as well as Ministerial Key Priorities as follows:

17
Medium Term Strategic Framework (MTSF) Priorities
NO. MTSF PRIORITY CONTRIBUTION RATIONALE FOR SELECTION
1 Building a Capable, Ethical
and Developmental State Core
Good corporate governance, professional and
ethical organisation
2 Economic Transformation
and Job Creation Core
Equitable land ownership, decentralised
economy, ability to stimulate other sectors through
the value chain, multiplier effect. Facilitate the
commercialisation of black farmers to contribute
to: GDP, Job creation, Transformation of the Agri-
food value chain
3 Education, Skills and Health Enabler
Agriculture colleges provide skills, mandate to skill
existing farmers, nutrition security, building
capacity through formal and informal training.
Integrated Food Security and Nutrition strategy of
South Africa, with specific focus on food safety
4
Consolidating the Social
Wage through Reliable and
Quality Basic Services
Contributor Coordination of the delivery of basic services
through district rural development plans
5
Spatial Integration, Human
Settlements and Local
Government
Core
Integrated land distribution, Spatial transformation,
Integrated land administration system, Equitable
access to land for all land uses
6 Social Cohesion and Safe
Communities Enabler
Supporting social cohesion and safety of rural
communities
7 A better Africa and World N/A Not Applicable
VISION
INSPIRED
PRIORITIES
NAME
1 Our safety: Safe and cohesive communities
2 Our Economy: Economy and Jobs
3 Our people: Empowering people
4 Our places: Public transport, mobility and spatial transformation
5 Our government: Innovation and culture change
MINISTERIAL
KEY PRIORITIES FOR THE LOVE OF AGRICULTURE
1 Structured education, training and research
2 Market access & international opportunities (products, farmers, staff)
3 Farmer support (smallholder & commercial)
4 Rural safety
5 Climate change (Innovation, Technology, Partnerships)

18
The Premier of the Western Cape Province has also allocated an ‘Apex’ and a ‘security’ priority to each
member of his Cabinet. In the case of the Minister of Agriculture, these are:
Apex priority: Ramp up Agricultural Market Access
Safety priority: Rollout of Rural Safety Plan
OneCape 2040 was a joint attempt between the Western Cape Province and the City of Cape Town to
stimulate transition towards an inclusive and resilient economic future. During the development of this
Plan, notice was taken of the NDP as well as a range of other policy documents and, following a
contextual report, focus group discussions, research reviews and a range of consultations. The following
vision for the Western Cape was developed: “A highly-skilled, innovation-driven, resource-efficient,
connected, high opportunity and collaborative society”. It was further argued that six “transitions”, each
with a desired state and specific goals, need to take place:
Knowledge
Economic
Ecologic
Cultural
Settlement
Institutions
CHALLENGES EXPERIENCED BY THE INSTITUTION
The past year has seen the Casidra audit being undertaken by the Auditor-General (AG) for the first time
and at a considerably higher cost compared to the previous auditors, which adversely impacted the
operating budget at the time when the core funding continues to decline and remains a significant
challenge. The Western Cape Department of Agriculture, as our shareholder, remains very supportive
during these challenging times, which is always appreciated.
Budget is the biggest challenge to deliver on our mandate. It is anticipated that due to Government
budgets being under pressure, there will be a possible reduction of such resources. Budgetary limitations
may result in targets’ development programmes being reduced. However, expanding partnerships with
farmers as host employers and mentors could indirectly expand available resources.
The potential adverse outcome of the current litigation dispute between the WCDoA and the AGSA in
respect of the latter’s interpretation of the Casidra funding transfers would have a material impact on the
company’s sustainability. This has already had a material impact on Casidra’s ability to grow opportunities
with other Government Departments.
CLIMATE AND THE ENVIRONMENT
Climate change is one of the biggest challenges facing the agriculture sector. The Western Cape has
experienced its worst drought in the past 100 years. Areas in the West Coast and Karoo were most
affected by the adverse climatic conditions. A Provincial application for disaster support is filtering
through and support programmes to farmers will be at the forefront of service delivery in the next five
years.
To ensure ongoing productive agricultural systems and, more importantly, food security in South Africa,
the country needs a greater focus on environmental resource protection coupled with the sustainable
exploitation of natural ecosystems and water resources.

19
Casidra continues the implementation of the Disaster Relief funds made available by the WCDoA, which
are aimed to assist farmers who suffered infrastructure damage during floods and the effect of the
devastating fires.
Guided by the Shareholder’s Compact and the Cabinet Mandate of 2007, Casidra is required to
implement and deliver various physical infrastructure to farmers based on approved project business
plans presented and scrutinised by the CPACs.
Typical infrastructure requirements include:
● Implements
● Farm structures
● Irrigation material
● Boreholes
● Fencing
● Production inputs
● Resource conservation works
● Primary processing facilities
The timely delivery of this support can be negatively influenced by several factors, especially when funds
are not transferred on time. Transfers from National to Provincial Treasury are in unequal tranches of
20/30/30/20 per cent of the grant funding per quarter.
COMMODITY APPROACH
The WCDoA took the decision that due to the attractiveness, competitiveness and current economic
importance and geographical distribution of the various commodities in the Province, Casidra should
focus on the following commodities:
● Viticulture (table and wine grapes)
● Vegetables
● Beef
● Piggery
● Aquaculture
● Seed production
● Grain
● Sheep and Wool
For the purpose of these partnerships, a joint Commodity Project Allocation Committee (CPAC) is formed
per commodity, or in the case of beef and sheep as well as poultry and pigs, combined CPACs, with the
delegations to award CASP funding to the applicants who meet the set criteria. The CPACs ensure that
recommended projects comply with the applicable selection criteria and that the allocations are
prioritised in terms of the key deliverables of the WCDoA. Casidra has supported these CPACs with
procedures and standardised documentation thus importing its knowledge of project implementation to
these structures.
The grant funds of CASP and Ilima Letsema have, as from 2016, been declared Schedule 5 funds by
National Treasury. The implication is that the DAFF now controls the required flexibility of the CPACs in the
fund allocations, and approved business plans must be submitted together with the fund application for
the previous financial year. This will result in revised planning of projects on implementation due to the
almost two-year delay in the process until implementation. New legislation around water rights and
licensing is an additional delaying factor contributing towards delayed implementation.

20
Casidra plays an integral role in the procurement of inputs, infrastructure, machinery, equipment and in
the installation of infrastructure, and is, therefore, responsible to:
● Advise and give guidance in infrastructure procurement and installation;
● Serve as a member and act as secretariat of the CPACs;
● Ensure that the UTA’s screening and technical support operates as prescribed;
● Facilitate advice on Land Reform initiatives through the Land Reform Advisory Desk (LREAD);
● Report on procurement and infrastructure installation;
● Share systems’ knowledge with the commodity groups; and
● Support compliance with Standard Operating Procedures.
In addition to the limitations of a highly constrained resource base, the numerous proposed policy shifts,
focused on land issues, including new recommendations for land reform and redistribution aimed at re-
addressing the injustices of past systems, add to a heightened sense of uncertainty. Some uncertainty
remains around land tenure, but the government has outlined a Land Reform Strategy and set out targets
in the National Development Plan (NDP): Vision 2030, which aims to transfer 20% of farmlands to black
farmers.
MANAGEMENT OF GOVERNMENT FARMS
Casidra will continue to manage the Waaikraal and Amalienstein farms on behalf of the WCDoA until a
suitable exit strategy for direct State involvement is finalised. The sustainability of these farms is dependent
on sufficient funding being made available to implement the turnaround strategies as produced by
Casidra and submitted to Province way back in 2010. The drought in 2016, 2017 and 2018 presented
another setback for Waaikraal and Amalienstein with the gains made since 2010 being a loss to some
extent.
RURAL INFRASTRUCTURE AND POVERTY ALLEVIATION
Casidra’s business development projects lead to economic growth and build social security especially in
the rural towns. Casidra facilitates a number of FET and vocational training programmes that develop key
capabilities and skills among the people involved in the beneficiary programmes.
Community and Household Food Security
The Community Household Food Security Programme has continued to support community and
household gardens with basic garden tools and production inputs in the five-year period. The following
outputs were reached in terms of household and community food gardens:
Year
Gardens
Household Community
2015/16 1227 121
2016/17 1056 88
2017/18 875 72
2018/19 867 63
2019/20 810 (Preliminary) 68 (Preliminary)
It is expected that the Household and Food Security Programme will stabilise its support to households
during the next five-year period. A study to determine the outcome performance of this Programme was
done and influences further initiatives to strengthen the impact of the Programme.

21
To ensure increased sustainability, a strategy has been initiated whereby service providers are appointed
who support the households twice per week, run training programmes and offer marketing opportunities.
A high priority is sustainability both in terms of production and organic self-sustaining systems. Grey water
recycling and composting forms the backbone of the initiative. The CPAC for food security, which aims
to co-ordinate efforts for relief between governmental role-players, still operates strongly. Casidra
operates as the secretariat and drives the adoption of more strategic interventions for sustainability and
water conservation to continue to be implemented in 2020 - 2024 in line with its environmental focus. The
continuing drought and the decision that no municipal water may be used for any garden projects have
and will influence the rollout of the assistance and enforce initiatives for optimum water utilisation and
crop production techniques.
During August 2016, the Western Cape Province submitted its own strategic framework for household food
and nutrition security to Provincial Cabinet. This framework identifies availability, access, utilisation and
stability as the key elements underlying food insecurity and as a result, six response pillars with particular
support programmes were identified. These are:
Food assistance
Food awareness and safety
Food sensitive planning
Food resource management for the future
Inclusive food economy
Food governance
SPATIAL INFORMATION MAPPING OF SERVICE DELIVERY IS SET OUT BELOW:
7.2. Internal Environment Analysis
Casidra has the capacity to manage the two farms (Amalienstein and Waaikraal) within the current
resources as the Company did with Anhalt. Farm staff are employed on a contract basis depending on
the renewal of the agreement with the WCDoA and resulting in farm managers resigning for more
permanent jobs. The WCDoA should, however, consider a longer term Management agreement for the
farms, as investors cannot invest their infrastructure for a shorter period of time and want to see returns on
investments. The view of the communities should also be tested on the idea of commercial partnerships.

22
During the past year, Casidra experienced a cyber ransomware incident, which necessitated a review of
existing systems, IT governance and the risk management implications for the organisation. This has now
also catalysed an internal enterprise wide ‘fit-for purpose’ review of how we are structured towards
optimising the organisation to strengthen key delivery areas.
Casidra’s Board has also identified commercial partnerships as a Strategic Objective that seeks to broadly
achieve the following;
Diversification of funding sources
Growth and diversification of revenue base/mix
Growth in economic and rural development projects
This strategy seeks to build upon the existing Casidra project management excellence and successful
track record of delivery, and make a greater impact in the agricultural and economic development
ecosystem for the region.
The commercial partnerships will be formalised and mutually beneficial to the parties and will fully support
the successful achievement of Casidra’s mandate. This may also include agricultural financing partnering
with development finance institutions and an Enterprise Development Fund in which corporates could
participate strategically as funders. This, in turn, offers them optimisation of their B-BBEE scorecard points.
The Enterprise Development Fund will support various business support services to emerging and black
commercial farmers to become more sustainable over the medium- to longer term.
EMPLOYMENT AND VACANCIES
Programme
2019/2020
Number of
Employees
2020/2021
Approved
Posts
2020/2021
Number of
Employees
2020/2021
Vacancies
% of
Vacancies
Head Office 43 44 41 3 7
Regional Office 6 6 6 0 0
Amalienstein 19 20 17 3 15
Waaikraal 15 17 15 2 12
TOTAL 83 87 79 8 8
Programme
2019/2020
Number of
Employees
2020/2021
Approved
Posts
2020/2021
Number of
Employees
2020/2021
Vacancies
% of
Vacancies
Senior Management 1 1 1 0 0
Professional qualified 6 6 6 0 0
Skilled 45 45 41 4 9
Semi-skilled 5 5 5 0 0
Unskilled 26 30 26 4 13
TOTAL 83 87 79 8 8

23

24
Part C: Measuring Our Performance
1. Institutional Performance Information
1.1. Measuring the Impact
Impact Statement Full capacity support to the respective Programmes within Casidra
Programme 1: Corporate Services
Purpose: The provision of leadership, strategic direction and relevant support services to the respective
Programmes of Casidra.
Sub-Programme 1.1: Corporate Governance
Purpose: To deliver an efficient and effective service in compliance with best practice in corporate
governance.
Sub-Programme 1.2: Financial Management
Purpose: Ensure compliance with all relevant financial statutes and regulations, notably the Public
Finance Management Act and the Companies Act.
Sub-Programme 1.3: Human Resources Management
Purpose: To provide an efficient and effective human resource management service.
Sub-Programme 1.4: Strategic Training
Purpose: To ensure the future sustainability of Casidra as an excellent project management company.
Sub-Programme 1.5: Public Relations, Marketing and Communications
Purpose: To create brand awareness by promoting the Company, projects and its services through the
provision of internal/external communication, marketing and advertising services.
1.2. Measuring Outcomes
Outcome Outcome Indicator Baseline Five-year target
Corporate
governance
compliance (SG 4)
Budgets and EQPRS submitted
as per Treasury prescripts All statutory reporting
deadlines are met.
Casidra’s corporate
governance actions
in the way the Board
25

25
Outcome Outcome Indicator Baseline Five-year target
and its committees
are organised are
informed by the
principles of the King
IV Report
Company achieved
clean audit and
complies with all
relevant financial
statutes and
regulations, notably
the Public Finance
Management Act
and the Companies
Act.
Achieving clean audit opinion
from AGSA in respect of
previous financial year
All statutory reporting
deadlines are met
5
Provide an efficient
and effective
human resources
service to the
Company and
projects (SG 3, 5)
Wellness initiatives
implemented Three wellness
initiatives
implemented
15
Company-wide performance
assessments co-ordinated Two performance
reviews
implemented
10
Provide strategic
training within the
Company (SG 4, 5)
Development and training
initiatives aligned with Casidra’s
strategy
120 employees
trained 140
Casidra established
as a reliable brand
to deliver on project
management
service excellence
(SG 3, 4, 6)
External publications compiled
and published
The compilation and
publishing of all
publications for
corporate
compliance through
quality editorial
services
25
Outreach activities/events
through media, conferences,
seminars and exhibitions co-
ordinated
Market and promote
Casidra’s brand
during the
Agricultural and
Economic events
that include NAMPO
and Agri-Expo:
Livestock target
market
10

26
1.3. Explanation of Planned Performance over the Five-Year Planning Period
Sub-Programme 1.1: Corporate Governance
This Sub-Programme aims to deliver an efficient and effective service in compliance with best practice in
corporate governance. Casidra’s corporate governance actions in the way the Board and its
committees are organised are informed by the principles of the King IV Report. Casidra also takes its
people practices and green strategy seriously. Sustainability of the organisation is of primary concern to
the Board and Management team.
Sub-Programme 1.2: Financial Management
This Sub-Programme ensures compliance with all relevant financial statutes and regulations, notably the
Public Finance Management Act and the Companies Act. All statutory reporting deadlines are expected
to be met. Tighter budget constraints are expected in 2020 onwards, which will result in more stringent
care on expenses.
Sub-Programme 1.3: Human Resources Management
This Sub-Programme provides an efficient and effective human resources management service by
promoting staff wellbeing and sound labour relations within Casidra. A fully optimised staff structure is
maintained.
Sub-Programme 1.4: Strategic Training
This Sub-Programme ensures the future sustainability of Casidra as an excellent project management
company. The strategic training is conducted to train employees with the aim of capacitating them to
do their work.
Sub-Programme 1.5: Public Relations, Marketing and Communications
This Sub-Programme creates brand awareness by promoting the Company, projects and its services
through the provision of internal/external communication, marketing and advertising services. A
marketing and communications strategy and action plan are developed and aligned with Casidra’s
Strategic Objectives.
The Company’s publicity will be focused on free or inexpensive marketing opportunities and the
Company’s corporate identity will be constantly monitored. The marketing and promotion of the
Company will be geared towards the right target market, as outlined in the strategy. Advocacy and
lobbying have also proven to be an integral part when sourcing new business for the Company.

27
2. Institutional Performance Information
2.1 Measuring the Impact
Impact Statement Changing the farming landscape by ensuring that Emerging Farmers
become sustainable, with the prospect of becoming fully commercialised
and Government farms under management are profitably managed
Programme 2: Agriculture and Land Reform
Purpose: ● To manage specific government farms (i.e. Amalienstein and Waaikraal) to prepare for transfer to a
relevant receiving entity.
● To ensure a sustainable support mechanism for new and established farmers (including land reform
beneficiaries and farm workers).
Sub-Programme 2.1: Management of Government Farms
Purpose: To provide a farm management capacity to two identified government farms in the Western
Cape and to manage them according to the best farm management practices in the industry, to
conform to the ‘Good Agricultural Practices’ in five years, to achieve targets set in the budgets.
2.2 Measuring Outcomes
Outcome Outcome Indicator Baseline Five-year target Sustainable
management of
the two farms
within the available
budget
Monthly farm financial
statements and cash flow
estimates produced
Budgeted revenue
and expenditure are
generally met, but
farms are not making
a profit
120
Monthly oversight and
evaluation farm visits
Budgeted revenue
and expenditure are
generally met, but
farms are not making
a profit
110
Sub-Programme 2.2: Farmer Support and Development
Purpose: To implement agricultural infrastructure and production grant support to beneficiary farms in the
Western Cape by means of employees who apply project management tools and skills so that delivery
can be effective and efficient and within the time schedule allowed for the intervention.
Outcome Outcome Indicator Baseline Five-year
target Facilitated and
implemented
agricultural
projects for
CPAC/DPAC projects assisted
with agricultural physical
infrastructure in 5 years
All projects are properly
planned before embarking
on implementation
Implementation is
265

28
Outcome Outcome Indicator Baseline Five-year
target agrarian
beneficiaries
through
government
funding (SG 1)
executed in line with
approved GANTT charts
All completion reports are
supported by M&E
processes
All projects are completed
within the set targets and
that delays are addressed
speedily through a
consultative process with
all role-players
Interventions facilitated by UTA All requests for technical
assistance will be executed
as per the client’s
specifications
The projects are demand
driven and will be
completed within the
reasonable timeframes
through a consultative
process with all role-players
225
Land reform interventions
assisted by LREAD
All requests relating to land
reform interventions will be
executed as per the
client’s specifications
The projects are demand
driven and will be
completed within the
reasonable timeframes
through a consultative
process with all role-players
100
CPAC /DPAC projects
implemented from previous
financial years
That all projects are
properly planned before
embarking on
implementation
That implementation is
done in line with approved
GANTT charts
That all reporting up to the
final completion report is
done and supported by
M&E processes
All projects are completed
within the set targets and
that delays are addressed
speedily through a
consultative process with
all role-players
250

29
2.3 Explanation of Planned Performance over the Five-Year Planning Period
The strategic focus for the two farms, Amalienstein and Waaikraal, is to get them sustainable and
profitable for them to be handed over to a community entity. However, lack of clear land reform
objectives, strategic direction and committed funding to implement new ventures and infrastructure in
terms of the proposal made in the turnaround strategies that were drafted by Casidra and presented to
the WCDoA, hamper this objective, as the farms are currently struggling to make a profit due to limited
resources, e.g. financial and physical although natural, such as the drought, also has its impact.
Community aspirations have elevated the need for an empowerment solution for these farms. This falls
outside of Casidra’s mandate, but Casidra is facilitating, planning and advising on solutions to make an
informed decision of the role-players on the possible future development models of the farms.
Casidra is investigating the possibility of bringing in commercial partners to address the need for
investment.
The CASP/ilima Letsema funding to Casidra to implement various projects in support of smallholder
farmers has rendered critical support that has sustained and transformed the operations of these farmers.
Casidra fulfils various roles as part of support to farming projects. This includes:
Being the secretariats and scribe of the Commodity Project Allocation Committees (CPACs) across
eight commodity groups
Serving on the WCDoA’s Department Project Allocation Committees (DPAC)
Providing project implementation services through our Project Management Unit
Providing technical support through our Unit for Technical Assistance.
Agriculture plays a significant role in the economy of the Western Cape and contributed 2.7% to the GRP
of the Province and provided labour to 10.3% of the active labour force in 2017.
The support to emerging black farmers remains a key contributor and driver that supports land reform,
job creation and broadens access to black farmers. More focused attention is needed to limit the factors
that impede the growth and eventual migration of the emerging farmers to become fully
commercialised.
3 Institutional Performance Information
3.1 Measuring the Impact
Impact Statement The farms must be turned around from being unprofitable to profitable and
sustainable, and handed over to a community entity as a contribution to
land reform
Programme 3: Rural Infrastructure Development & Poverty Alleviation
Purpose: To provide a project management service for specific rural development projects and
agricultural initiatives with the aim of improving the standard of living of people in rural areas, to holistically
address the socio-economic needs of rural communities and to create employment in rural areas.

30
Sub-Programme 3.1: Community and Household Food Security
Purpose: To identify needs, support solutions and procure services and goods to assist vulnerable
households and communities in selected regions of the Western Cape in the production of their own food,
by initiating and cultivating gardens within the constraints of the seasonal requirements of vegetables.
3.2 Measuring Outcomes
Outcome Outcome Indicator Baseline Five-year target Vulnerable
communities and
households assisted
with the means of
producing their
own food (SG 2, 3)
Community food security
projects implemented
100% compliance 340
Household food security projects
implemented
All projects
completed in time
4 050
Community and household food
security projects implemented
from previous financial years
All projects
completed in time
2 250
Sub-Programme 3.2: Other Project Management Services
Purpose: To respond to requests from new and existing clients to project manage, administer and procure
services for the identified programmes aimed at agricultural beneficiaries of the Western Cape.
Outcome Outcome Indicator Baseline Five-year target Project
management
service provided to
rural agricultural
infrastructure
programmes and
agricultural
initiatives (SG 1, 2,
3, 5)
Value of Disaster funding
assistance to farmers per
instruction
All projects
implemented as per
MoA
R250M
Projects contracted with
Government Departments and
private institutions implemented
from previous financial years
All projects
implemented as per
MoA
180
New projects contracted with
Government Departments and
private institutions implemented
Casidra currently
implements various
LandCare Drought,
LandCare, EPWP
and DESP projects
based on MoA with
WCDoA based on
Area Wide Planning
305
Farmers trained in courses
facilitated
All projects
implemented as per
MoA
24 500

31
3.3 Explanation of Planned Performance over the Five-Year Planning Period
Sub-Programme 3.1: Community and Household Food Security
This Sub-Programme identifies needs, supports solutions and procures services and goods to assist
vulnerable households and communities in selected regions of the Western Cape in the production of
their own food, by initiating and cultivating gardens within the constraints of the seasonal requirements
of vegetables to address the issue of food security, and Casidra, through LREAD, will craft its plans around
ensuring sustainable land reform.
During the preceding years, the target for household gardens has slowly increased to 2000, but due to
budgets cuts, it is expected that it will reduce to around 700 supported household gardens. With
additional funding being made available at the end of every year from savings in other programmes,
these targets may increase. As with the other agricultural projects, seasonality and the timeous availability
of funds, this will result in projects being carried over to the next financial year.
The Community gardens have been around 100 per year, but a decrease is expected due to less funding
being available.
Despite all efforts to expedite the approval and delivery process, an overflow to finalise delivery in the
next year cannot be avoided. The influence of drought and availability of water had a serious effect on
delivery, which started in 2017 and continued during 2018/19 with projects that are carried over to the
next year, or projects that are unable to start due to water restrictions.
Sub-Programme 3.2: Other Project Management Services
This Sub-Programme responds to requests from new and existing clients to project manage, administer
and procure services for the identified programmes aimed at providing rural infrastructure and
agricultural as well as proving job opportunities for beneficiaries of the Western Cape.
A major part of project management services of the past three years has been based on the
administration of Disaster Relief grant funding. The occurrence of this cannot be predicted and will be
administered if and when it happens.
The drought funding to the value of R50 million is expected to be implemented into 2020 and beyond.
The implementation of the droughts of 2018/19 will continue in 2020 and will result in further funding being
made available for this purpose.
Special projects from the WCDoA that do not have a relationship with a specific commodity, but render
a service overall, get approved by the WCDoA’s Departmental Project Allocation Committee (DPAC).
These projects are all linked to the deliverables for the Sub-Programme.
Further Education and Training works very closely with the WCDoA to respond to the achievement of the
Ministerial Key Priorities, National Outcomes and Vision Inspired Priorities. This Programme received
approximately R9 million per annum. The Programme must include more vocational training that is more
expensive and targets smaller groups. Expectations for funding in the three-year cycle are similar.
During the previous terms, programmes that have a close relationship with the Farmer Support and
Development Programme from the WCDoA have been contracted with the DEA and BGCMA. These

32
Programmes will continue in the next term with further transfers of funding, and the possibilities of
expanding the assistance will be well received.
Project management of the LandCare Programme was contracted with the WCDoA and will continue
to be implemented under management of Casidra in 2020. The LandCare, DESP and EPWP Programmes
are funded by the Sustainable Resource Management Department of the WCDoA. At the end of 2018,
the LandCare Drought Fund was also added to help address the dire needs in drought-stricken parts of
the Western Cape. These Programmes bring together the Provincial Sustainable, Goal 1 “Create
opportunities for growth and jobs the Global Goals for Sustainable development, Goal 8 “Decent work
and economic growth.” Due to the drought, many farmers had to reduce their labour force, especially
in the Karoo. The various LandCare Programmes remain an important avenue for job creation and
poverty alleviation.
The Programme includes infrastructure creation, mainly fencing and river protection works, as well as job
creation type projects such as alien clearing. This initiative will continue during the next term, but the
extent of it is estimated at 50 projects and will operate on a demand-driven basis. It is expected that the
new emphasis on Agri business development may see an increase in these requests for assistance.
4. Institutional Performance Information
4.1 Measuring the Impact
Impact Statement Noticeable positive impact on the number of sustainable businesses and
improvement in job creation in the rural contexts in the Western Cape
Programme 4: Local Economic and Business Development
Purpose: To enhance business growth and the creation of employment in rural areas through the
leveraging and encouraging of investment from the private sector and support for local economic and
business development in general.
Sub-Programme 4.1: Business Development and Growth
Purpose: To create opportunities for growth and development for SMMEs, Micro Enterprises and Land
Reform projects through business support, Market Access initiatives, facilitating financial record-keeping
and facilitating business growth through enhanced access to financial support.
4.1 Measuring Outcomes
Outcome Outcome Indicator Baseline Five-year target
Opportunities
created for growth
and development
for SMMEs and
Land Reform
projects (SG 1, 2, 3,
4, and 5)
Loan agreements concluded
and signed with beneficiaries
Casidra currently
supports 200 SMMEs
annually through our
Entrepreneurial
Support Programme
965
Loan agreements implemented
from previous financial years
All projects
implemented as per
MoA
10
Business support projects
implemented
All projects
implemented as per
MoA
10

33
Sub-Programme 4.2: Job Creation Initiatives
Purpose: To access, facilitate and support job creation opportunities through partnering and
implementing programmes that require labour and through training and skills development initiatives
focussing specifically at the youth and aimed at providing skilled entrants to enter jobs in order to reduce
unemployment.
Outcome Outcome Indicator Baseline Five-year target
Job creation
initiatives
accessed,
facilitated and
supported through
partnering and
implementing of
programmes (SG 1,
2, 3 and 4)
Job creation initiatives
implemented from previous
financial years
Casidra supports job
creation initiatives
through various skills
programmes and job
placement initiatives
5
New job creation initiatives
implemented
The target for the
strategic term is 5000
participants to
successfully
complete this
Programme
5
4.2 Explanation of Planned Performance over the Five-Year Planning Period
The triple challenges of unemployment, poverty and inequality in South Africa can only be addressed
through focused action and attention on entrepreneurship support and job creation initiatives. Casidra
will seek to support 1000 SMMEs through the provision of bridging finance and other activities such as
training and mentorship. This is to improve sustainability of SMMEs and to contribute a vibrant economy in
the Western Cape. Through partnerships with the private sector, the UIF and SETAs we will endeavour to
support the unemployed through a range of activities to improve their employability and access to the
jobs market.
Sub-Programme 4.1: Business Development and Growth
This Sub-Programme seeks to create opportunities for growth and development for SMMEs, Micro
Enterprises and Land Reform projects through business support, Market Access initiatives, facilitating
financial record-keeping and facilitating business growth through enhanced access to financial support.
Many start-up businesses are challenged to survive the inception stages and sometimes struggle to
access business opportunities and support during their commencement. When new markets are
accessed, there is sometimes also a need for bridging finance to successfully deliver on the contracts.
Sub-Programme 4.2: Job Creation Initiatives
This Sub-Programme will access, facilitate and support job creation opportunities through partnering and
implementing programmes that require labour and through training and skills development initiatives
focussing specifically at the youth and aimed at providing skilled entrants to jobs in order to reduce
unemployment. It seeks to provide skilled entrants to enter the job market in order to reduce
unemployment.

34
5 Key Risks
Outcomes Key Risks Risk Mitigations
Project delivery on time All of the targets are demand driven
and Casidra has no influence on the
approval criteria, approval process
and demand of these projects
Depending on the latter,
targets will either be over-
achieved or in some cases
under-achieved
Achieve targets set in
budget and reach
sustainability for the farms
Drought impact on revenue
Funding for the farms
Start enterprises that are less
dependent on water;
Source other possible funding
6 Public Entities
Name of Public Entity Mandate Outcomes
Current Annual Budget
(R thousand)
Not Applicable

35
Part D: Technical Indicator Descriptions (TID)
PROGRAMME 1: Corporate Services
Sub-Programme 1.1: Corporate Governance
Indicator number 1.1
Indicator title Compilation of statutory budgets and EQPRS as per Treasury
prescripts
Short definition Prepare information for B-BBEE audit
Purpose To enable a B-BBEE agency to issue B-BBEE Certificate
Strategic link VIP #: 5 Focus Area(s):
Good
governance
transformation
Output(s):
Strengthening
and
maintaining
governance
and
accountability
Intervention(s):
Review and
rationalising of
legislation and
institutional
policies and
procedures to
result in an
enabling
environment
for service
delivery
Source of data HR and financial records
Method of calculation Simple count
Data limitations None
Type of indicator Input: Activities: Output: X Outcome:
Service Delivery Indicator: Direct Service Delivery:
Indirect Service Delivery: X
Demand Driven Indicator: Yes, demand driven:
No, not demand driven: X
Calculation type Cumulative
Year-end:
Cumulative
Year-to-date:
Non-cumulative:
X
Reporting cycle Quarterly: Bi-annually: Annually:
X
Biennially:
Desired performance Higher than target: On target: X Lower than target:
Indicator responsibility Chief Financial Officer
Spatial transformation Not Applicable
Disaggregation of
beneficiaries (where
Target for women: N/A
Target for youth: N/A

36
Indicator number 1.1
Indicator title Compilation of statutory budgets and EQPRS as per Treasury
prescripts
applicable) Target for people with disabilities: N/A
Assumptions No valid BEE rating
Means of verification All proof is kept in evidence audit file
Indicator number 1.1.1
Indicator title Number of budgets and EQPRS submitted as per Treasury prescripts
Short definition Timely submission of required documents
Purpose To comply with National Treasury and Provincial Treasury regulations
Strategic link VIP #: 5 Focus Area(s):
Good
governance
transformation
Output(s):
Strengthening
and
maintaining
governance
and
accountability
Intervention(s):
Review and
rationalising of
legislation and
institutional
policies and
procedures to
result in an
enabling
environment
for service
delivery
Source of data Confirmation of submissions
Method of calculation Simple count of publications
Data limitations None
Type of indicator Input: Activities: Output: X Outcome:
Service Delivery Indicator: Direct Service Delivery:
Indirect Service Delivery: X
Demand Driven Indicator: Yes, demand driven:
No, not demand driven: X
Calculation type Cumulative Year-end:
X
Cumulative Year-to-
date:
Non-cumulative:
Reporting cycle Quarterly: X Bi-annually: Annually: Biennially:
Desired performance Higher than target: On target: X Lower than
target:
Indicator responsibility Chief Financial Officer
Spatial transformation Not Applicable
Disaggregation of
beneficiaries (where
Target for women: N/A
Target for youth: N/A

37
applicable) Target for people with disabilities: N/A
Assumptions Compliance to regulations
Means of verification All proof is kept in evidence audit file
Confirmation of timely submission of documents
Sub-Programme 1.2: Financial Management
Indicator number 1.2
Indicator title Provision of effective and efficient financial management services
Short definition 12 monthly reports submitted to Management
Purpose To report the financial state of affairs to Management
Strategic link VIP #: 5 Focus Area(s):
Good
governance
transformation
Output(s):
Strengthening
and
maintaining
governance
and
accountability
Intervention(s):
Review and
rationalising of
legislation and
institutional
policies and
procedures to
result in an
enabling
environment
for service
delivery
Source of data Financial reports
Method of calculation Simple count
Data limitations None
Type of indicator Input: Activities: Output: X Outcome:
Service Delivery Indicator: Direct Service Delivery:
Indirect Service Delivery: X
Demand Driven Indicator: Yes, demand driven:
No, not demand driven: X
Calculation type Cumulative Year-
end: X
Cumulative Year-to-
date:
Non-cumulative:
Reporting cycle Annually
Desired performance As per target
Indicator responsibility Programme Manager/ Chief Financial Officer
Spatial transformation Not Applicable
Disaggregation of Target for women: N/A

38
beneficiaries Target for youth: N/A
Target for people with disabilities: N/A
Assumptions Over-spending/income not materialising
Compliance to financial regulations
Means of verification All proof is kept in evidence audit file
Indicator number 1.2.1
Indicator title Achieving clean audit opinion from AGSA in respect of previous
financial year
Short definition Maintain processes to receive a clean audit report from AGSA
Purpose High priority and main focus of CFO and Management
Strategic link VIP #: 5 Focus Area(s):
Good
governance
transformation
Output(s):
Strengthening
and
maintaining
governance
and
accountability
Intervention(s):
Review and
rationalising of
legislation and
institutional
policies and
procedures to
result in an
enabling
environment
for service
delivery
Source of data Compliance to policy and regulations
Method of calculation Simple count of Auditor’s Report
Data limitations Poor discipline of employees
Limitations of preparation
Type of indicator Input: Activities: Output: X Outcome:
Service Delivery Indicator: Direct Service Delivery:
Indirect Service Delivery: X
Demand Driven Indicator: Yes, demand driven:
No, not demand driven: X
Calculation type Cumulative Year-
end:
Cumulative Year-to-
date:
Non-cumulative:
X
Reporting cycle Annually
Desired performance To achieve a clean audit report
Indicator responsibility Chief Financial Officer
Spatial transformation Not Applicable
Disaggregation of Target for women: N/A

39
beneficiaries Target for youth: N/A
Target for people with disabilities: N/A
Assumptions Unqualified audit report
Means of verification All proof is kept in evidence audit file
Sub-Programme 1.3: Human Resources Management
Indicator number 1.3
Indicator title Number of efficient and effective human resource services
Short definition To ensure the successful delivery of an HR Service in all its respects
Purpose HR success is measured in specific disciplines, e.g. recruitment,
performance management, etc.
Strategic link VIP #: 5 Focus Area(s):
Citizen-centric
culture
Output(s):
Number of
business
practices,
processes,
policies,
structures,
systems,
competencie
s aligned to
underpin the
desired
cultural norms
Intervention(s):
Adapting and
aligning the
business
processes,
policies,
practices,
structures,
competencies
and systems to
support the
desired culture
Source of data HR Information System
Method of calculation Simple count of number of occurrences
Data limitations Might not cover all relevant aspects of HR
Type of indicator Input: Activities: Output: X Outcome:
Service Delivery Indicator: Direct Service Delivery:
Indirect Service Delivery: X
Demand Driven Indicator: Yes, demand driven:
No, not demand driven: X
Calculation type Cumulative
Year-end: X
Cumulative
Year-to-date:
Non-cumulative:
Reporting cycle Quarterly: Bi-annually: Annually: X Biennially:
Desired performance Higher than target: On target: X Lower than target:
Indicator responsibility Human Resources Manager

40
Spatial transformation Not Applicable
Disaggregation of
beneficiaries
Target for women: N/A
Target for youth: N/A
Target for people with disabilities: N/A
Assumptions Effectiveness and efficiency of HR cannot always be quantitatively
measured
Means of verification All proof is kept in evidence audit file
Indicator number 1.3.1
Indicator title Number of wellness initiatives implemented
Short definition Wellness initiatives
Purpose To encourage the continued growth and development of Casidra
and its employees
Strategic link VIP #: 5 Focus Area(s):
Citizen-centric
culture
Output(s):
Integrated
employee
engagement,
organisation
culture and
citizen
satisfaction
index
Intervention(s):
Adapting and
aligning the
business
processes,
policies,
practices,
structures,
competencies
and systems to
support the
desired culture
Source of data Management Committee decisions
Method of calculation Each initiative approved and implemented
Data limitations None
Type of indicator Input: Activities: Output: X Outcome:
Service Delivery Indicator: Direct Service Delivery:
Indirect Service Delivery: X
Demand Driven Indicator: Yes, demand driven:
No, not demand driven: X
Calculation type Cumulative
Year-end: X
Cumulative
Year-to-date:
Non-cumulative:
Reporting cycle Quarterly: X Bi-annually: Annually: Biennially:
Desired performance Higher than target: On target: X Lower than target:
Indicator responsibility Human Resources Manager
Spatial transformation Not Applicable

41
Indicator number 1.3.1
Indicator title Number of wellness initiatives implemented
Disaggregation of
beneficiaries
Target for women: N/A
Target for youth: N/A
Target for people with disabilities: N/A
Assumptions Initiatives can be delayed due to operational requirements
Means of verification All proof is kept in evidence audit file
Indicator number 1.3.2
Indicator title Number of company-wide performance assessments co-ordinated
Short definition All employees’ performance is evaluated bi-annually in line with
Casidra’s Performance Management Policy.
Purpose Ensure alignment between the Strategic Objectives of the
company and the employee’s performance
Strategic link VIP #: 5 Focus Area(s):
Citizen-centric
culture
Output(s):
Integrated
employee
engagement,
organisation
culture and
citizen
satisfaction
index
Intervention(s):
Adapting and
aligning the
business
processes,
policies,
practices,
structures,
competencies
and systems to
support the
desired culture
Source of data Electronic compliance sheet from managers
Method of calculation Simple count of Quarterly electronic compliance sheets from
managers
Data limitations None
Type of indicator Input: Activities: Output: X Outcome:
Service Delivery Indicator: Direct Service Delivery:
Indirect Service Delivery: X
Demand Driven Indicator: Yes, demand driven:
No, not demand driven: X
Calculation type Cumulative Year-end:
X
Cumulative
Year-to-date:
Non-cumulative:
Reporting cycle Quarterly: Bi-annually: X Annually: Biennially:
Desired performance Higher than target: On target: X Lower than

42
Indicator number 1.3.2
Indicator title Number of company-wide performance assessments co-ordinated
target:
Indicator responsibility Human Resources Manager
Spatial transformation Not Applicable
Disaggregation of
beneficiaries
Target for women: N/A
Target for youth: N/A
Target for people with disabilities: N/A
Assumptions Quality of performance evaluations cannot be measured by a
compliance sheet
Means of verification All proof is kept in evidence audit file
Sub-Programme 1.4: Strategic Training
Indicator number 1.4
Indicator title Number of strategic training interventions
Short definition To ensure the strategic alignment of training interventions
Purpose To ensure that training interventions have the maximum, strategic
impact
Strategic link VIP #: 5 Focus Area(s):
Citizen-centric
culture
Output(s):
Integrated
employee
engagement,
organisation
culture and
citizen
satisfaction
index
Intervention(s):
Adapting and
aligning the
business
processes,
policies,
practices,
structures,
competencies
and systems to
support the
desired culture
Source of data Training Report
Method of calculation Simple count of number of occurrences
Data limitations Definition of strategic not always clear
Type of indicator Input: Activities: Output: X Outcome:
Service Delivery Indicator: Direct Service Delivery:
Indirect Service Delivery: X
Demand Driven Indicator: Yes, demand driven:
No, not demand driven: X

43
Calculation type Cumulative Year-
end:
Cumulative Year-to-
date:
Non-cumulative:
X
Reporting cycle Annually
Desired performance Higher than target: On target: X Lower than target:
Indicator responsibility Human Resources Manager
Spatial transformation Not Applicable
Disaggregation of
beneficiaries
Target for women: N/A
Target for youth: N/A
Target for people with disabilities: N/A
Assumptions Budgetary constraints sometimes hinder achievement
Means of verification All proof is kept in evidence audit file
Indicator number 1.4.1
Indicator title Number of development and training initiatives aligned with
Casidra’s strategy
Short definition To ensure that Casidra’s development and training initiatives are
aligned with Casidra’s strategy
Purpose Development and training initiatives should assist Casidra to
achieve its strategy
Strategic link VIP #: 5 Focus Area(s):
Citizen-centric
culture
Output(s):
Integrated
employee
engagement,
organisation
culture and
citizen
satisfaction
index
Intervention(s):
Adapting and
aligning the
business
processes,
policies,
practices,
structures,
competencies
and systems to
support the
desired culture
Source of data The Quarterly Training Report reports on the alignment between
Casidra’s development and training interventions and its strategy
Method of calculation Simple count of quarterly Training Report
Data limitations Different interpretations of what is regarded as strategic training
Type of indicator Input: Activities: Output: X Outcome:
Service Delivery Indicator: Direct Service Delivery:
Indirect Service Delivery: X
Demand Driven Indicator: Yes, demand driven:
No, not demand driven: X

44
Calculation type Cumulative Year-end:
X
Cumulative
Year-to-date:
Non-cumulative:
Reporting cycle Quarterly: X Bi-annually: Annually: Biennially:
Desired performance Higher than target: On target: X Lower than target:
Indicator responsibility Human Resources Manager
Spatial transformation Not Applicable
Disaggregation of
beneficiaries
Target for women: N/A
Target for youth: N/A
Target for people with disabilities: N/A
Assumptions Training Report not being submitted quarterly
Means of verification All proof is kept in evidence audit file
Sub-Programme 1.5: Public Relations, Marketing and Communications
Indicator number 1.5
Indicator title Number of internal and external communication services
interventions
Short definition Public Relations, Marketing and Communication services
Purpose To provide all necessary support service and create awareness by
promoting the company, projects and its services
Strategic link VIP #: 5 Focus Area(s):
Innovation for
impact
Output(s):
Number of
departments
using services,
communicati
on, process or
organisational
innovations
Citizen
feedback tools
Online
availability of
public services
Share of ‘new’
services out of
all services’
innovation
Intervention(s):
Build an
“innovation for
impact”
initiative to
drive
innovative
service
delivery
through
innovative
tools
Source of data Inputs from all departments in the company

45
Indicator number 1.5
Indicator title Number of internal and external communication services
interventions
Publications and Reports
Method of calculation Simple count of publications compiled/published and corporate
activities’/events’ participation
Data limitations Annual targets set in Corporate Plan
Type of indicator Input: Activities: X Output: Outcome:
Service Delivery Indicator: Direct Service Delivery:
Indirect Service Delivery: X
Demand Driven Indicator: Yes, demand driven:
No, not demand driven: X
Calculation type Cumulative
Year-end:
Cumulative
Year-to-date:
Non-cumulative:
X
Reporting cycle Quarterly: Bi-annually: Annually: X Biennially:
Desired performance Higher than target: On target: X Lower than target:
Indicator responsibility PR/Communication Manager
Spatial transformation Not Applicable
Disaggregation of
beneficiaries
Target for women: N/A
Target for youth: N/A
Target for people with disabilities: N/A
Assumptions Budget limited
Means of verification All proof is kept in evidence audit file
Indicator number 1.5.1
Indicator title Number of external publications compiled and published
Short definition Publications compiled and published: newsletters, brochures,
Corporate Plan, Strategic Plan and Annual Report
Purpose To provide all necessary support service and create awareness by
promoting the company, projects and its services
Strategic link VIP #: 5 Focus Area(s):
Innovation for
impact
Output(s):
Number of
departments
using services,
communicatio
n, process or
organisational
innovations
Citizen
feedback tools
Online
availability of
Intervention(s):
Build an
“innovation for
impact”
initiative to
drive
innovative
service
delivery
through
innovative
tools

46
Indicator number 1.5.1
Indicator title Number of external publications compiled and published
public services
Share of ‘new’
services out of
all services’
innovations
Source of data Inputs from all departments in the company
Publications and reports
Method of calculation Simple count of publications compiled/published
Data limitations Annual targets set in Corporate Plan
Type of indicator Input: Activities: X Output: Outcome:
Service Delivery Indicator: Direct Service Delivery:
Indirect Service Delivery: X
Demand Driven Indicator: Yes, demand driven:
No, not demand driven: X
Calculation type Cumulative
Year-end: X
Cumulative
Year-to-date:
Non-cumulative:
Reporting cycle Quarterly: X Bi-annually: Annually: Biennially:
Desired performance Higher than target: On target: X Lower than target:
Indicator responsibility PR/Communication Manager
Spatial transformation Not Applicable
Disaggregation of
beneficiaries
Target for women: N/A
Target for youth: N/A
Target for people with disabilities: N/A
Assumptions Budget limited
Means of verification All proof is kept in evidence audit file
Indicator number 1.5.2
Indicator title Number of outreach activities/events through media, conferences,
seminars and exhibitions coordinated
Short definition Outreach activities/events coordinated
Purpose To reach out to the stakeholders and create brand awareness by
promoting the company, projects and its services
Strategic link VIP #: 5 Focus Area(s):
Innovation for
impact
Output(s):
Citizen
feedback tools
Online
availability of
public services
Share of ‘new’
Intervention(s):
Build an
“innovation for
impact”
initiative to
drive
innovative
service
delivery

47
services out of
all services’
innovations
through
innovative
tools
Source of data Invitations and research
Method of calculation Simple count of activities/events
Data limitations Annual targets set in Corporate Plan
Type of indicator Input: Activities: X Output: Outcome:
Service Delivery Indicator: Direct Service Delivery:
Indirect Service Delivery: X
Demand Driven Indicator: Yes, demand driven:
No, not demand driven: X
Calculation type Cumulative
Year-end: X
Cumulative
Year-to-date:
Non-cumulative:
Reporting cycle Quarterly: X Bi-annually: Annually: Biennially:
Desired performance Higher than target: On target: X Lower than target:
Indicator responsibility PR/Communication Manager
Spatial transformation Not Applicable
Disaggregation of
beneficiaries
Target for women: N/A
Target for youth: N/A
Target for people with disabilities: N/A
Assumptions Budget limited
Means of verification All proof is kept in evidence audit file
PROGRAMME 2: AGRICULTURE AND LAND REFORM
Sub-Programme 2.1: Management of Government Farms
Indicator number 2.1.1
Indicator title Number of monthly farm financial statements and cash flow
estimates produced
Short definition Monthly financial statements and cash flow
Purpose Financial statements and cash flow must be produced each
month as a planning and monitoring tool on performance
against the budget and as an early warning system for variances
Strategic link VIP #: 2 Focus Area(s):
Growing the
economy
through
export growth
Output(s):
Number of
sector
initiatives
supported
Intervention(s):
Tradable
sector
development;
Export
promotion
Source of data A cash flow is produced by the Manager: Regional after
receiving the financial statements for each month
Method of calculation Count the number of financial statements and cash flow
statements per month per farm under management

48
Indicator number 2.1.1
Indicator title Number of monthly farm financial statements and cash flow
estimates produced
Data limitations None
Type of indicator Input: Activities: X Output: Outcome:
Service Delivery Indicator: Direct Service Delivery:
Indirect Service Delivery: X
Demand Driven Indicator: Yes, demand driven:
No, not demand driven: X
Calculation type Cumulative
Year-end:
Cumulative
Year-to-date: X
Non-cumulative:
Reporting cycle Quarterly: X Bi-annually: Annually: Biennially:
Desired performance Higher than target: On target: X Lower than target:
Indicator responsibility Manager: Regional
Spatial transformation N/A
Disaggregation of
beneficiaries
Target for women: N/A
Target for youth: N/A
Target for people with disabilities: N/A
Assumptions None
Means of verification Monthly financial statements and cash flow estimate
Indicator number 2.1.2
Indicator title Number of monthly oversight and evaluation farm visits
Short definition Monthly farm visits for monitoring and evaluation
Purpose Meetings with the Farm Management are needed to perform a
monitoring and mentoring role
Strategic link VIP #: 2 Focus Area(s):
Growing the
economy
through
export growth
Output(s):
Number of
sector
initiatives
supported
Intervention(s):
Tradable sector
development;
Export
promotion
Source of data Minutes of the meetings held by Manager: Regional with Farm
Manager
Method of calculation Count the number of minutes
Data limitations None
Type of indicator Input: Activities: X Output: Outcome:
Service Delivery Indicator: Direct Service Delivery:
Indirect Service Delivery: X
Demand Driven Indicator: Yes, demand driven:
No, not demand driven: X
Calculation type Cumulative
Year-end:
Cumulative Year-
to-date: X
Non-cumulative:
Reporting cycle Quarterly: X Bi-annually: Annually: Biennially:
Desired performance Higher than target: On target: X Lower than target:
Indicator responsibility Manager: Regional
Spatial transformation N/A
Disaggregation of
beneficiaries
Target for women: N/A
Target for youth: N/A

49
Target for people with disabilities: N/A
Assumptions None
Means of verification Monthly minutes
Sub-Programme 2.2: Farmer Support and Development
Indicator number 2.2.1
Indicator title Number of CPAC/DPAC projects assisted with agricultural
physical infrastructure in current year
Short definition Projects approved at CPAC and DPAC for implementation by
Casidra
Purpose Grant funding for CASP is distributed via the CPACs and DPAC
for approved projects
Strategic link VIP #: 2 Focus Area(s):
Building and
maintaining
infrastructure
Output(s):
Number of
planned
catalytic
infrastructure
projects
completed
Intervention(s):
Maximise
investment in
infrastructure
Source of data Project managers supply signed MoA as entered into with the
beneficiary at project initiation
Method of calculation Simple count of number of MoAs signed with beneficiaries
funded from the current year funding allocation
Data limitations Only approved projects can be implemented. Demand driven
deliverable
Type of indicator Input: Activities: Output: X Outcome:
Service Delivery Indicator: Direct Service Delivery: X
Indirect Service Delivery:
Demand Driven Indicator: Yes, demand driven: X
No, not demand driven:
Calculation type Cumulative
Year-end:
Cumulative Year-
to-date: X
Non-cumulative:
Reporting cycle Quarterly: Bi-annually: Annually: X Biennially:
Desired performance Higher than target: X On target: Lower than target:
Indicator responsibility Chief Officer: Projects
Spatial transformation N/A
Disaggregation of
beneficiaries (where
applicable)
Target for women: N/A
Target for youth: N/A
Target for people with disabilities: N/A
Assumptions None
Means of verification Checking of MOAs Signed

50
Indicator number 2.2.2
Indicator title Number of interventions facilitated by UTA
Short definition Beneficiaries of the Land Reform Programme and the CPACs as
well as the Department can launch a request for professional
service provider assistance to the UTA
Purpose Skills in specialist services are not readily available and this may
not prevent a beneficiary from access to the grant funding
scheme due to lack of professional assistance in his/her project
plan
Strategic link VIP #: 2 Focus Area(s):
Growing the
economy
through
export growth
Output(s):
Number of
sector
initiatives
supported
Intervention(s):
Tradable
sector
development;
Export
promotion
Source of data Project manager of UTA keeps record of all the requests
Method of calculation Simple count of number of requests received and attended to
Data limitations It is a demand driven service and subjected to client needs
Type of indicator Input: Activities: Output: X Outcome:
Service Delivery Indicator: Direct Service Delivery: X
Indirect Service Delivery:
Demand Driven Indicator: X Yes, demand driven: X
No, not demand driven:
Calculation type Cumulative
Year-end: X
Cumulative Year-
to-date:
Non-cumulative:
Reporting cycle Quarterly: X Bi-annually: Annually: Biennially:
Desired performance Higher than target: X On target: Lower than target:
Indicator responsibility Project Manager UTA
Spatial transformation N/A
Disaggregation of
beneficiaries (where
applicable)
Target for women: N/A
Target for youth: N/A
Target for people with disabilities: N/A
Assumptions The need for the service is illustrated in the number of clients that
show a need for the service by requesting assistance. Low
numbers indicate no need
Means of verification Copy of report or letter or document that proves that assistance
was given
Indicator number 2.2.3
Indicator title Number of land reform interventions assisted by LREAD
Short definition Land owners and municipalities as well as the Department can
launch a request for professional service provider assistance to
the LREAD
Purpose Skills in specialist services are not readily available and LREAD
must assist prospective land reform clients with best practice
models and professional assistance
Strategic link VIP #: 2 Focus Area(s): Output(s): Intervention(s):
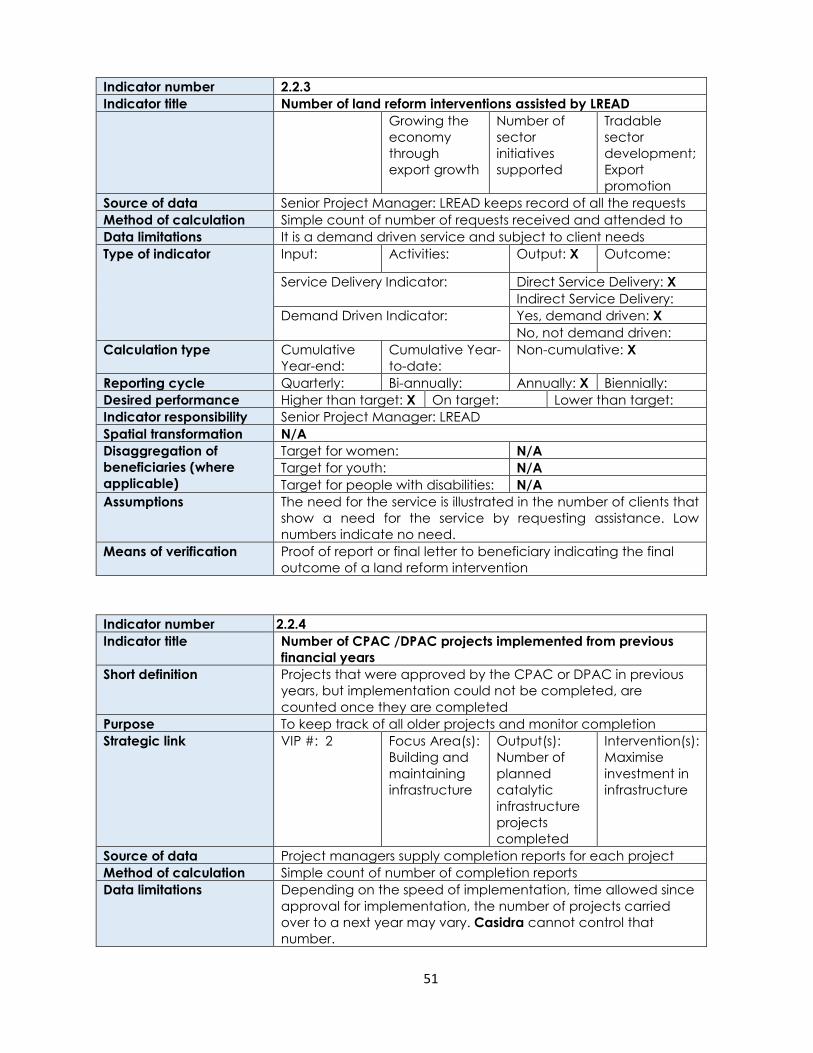
51
Indicator number 2.2.3
Indicator title Number of land reform interventions assisted by LREAD
Growing the
economy
through
export growth
Number of
sector
initiatives
supported
Tradable
sector
development;
Export
promotion
Source of data Senior Project Manager: LREAD keeps record of all the requests
Method of calculation Simple count of number of requests received and attended to
Data limitations It is a demand driven service and subject to client needs
Type of indicator Input: Activities: Output: X Outcome:
Service Delivery Indicator: Direct Service Delivery: X
Indirect Service Delivery:
Demand Driven Indicator: Yes, demand driven: X
No, not demand driven:
Calculation type Cumulative
Year-end:
Cumulative Year-
to-date:
Non-cumulative: X
Reporting cycle Quarterly: Bi-annually: Annually: X Biennially:
Desired performance Higher than target: X On target: Lower than target:
Indicator responsibility Senior Project Manager: LREAD
Spatial transformation N/A
Disaggregation of
beneficiaries (where
applicable)
Target for women: N/A
Target for youth: N/A
Target for people with disabilities: N/A
Assumptions The need for the service is illustrated in the number of clients that
show a need for the service by requesting assistance. Low
numbers indicate no need.
Means of verification Proof of report or final letter to beneficiary indicating the final
outcome of a land reform intervention
Indicator number 2.2.4
Indicator title Number of CPAC /DPAC projects implemented from previous
financial years
Short definition Projects that were approved by the CPAC or DPAC in previous
years, but implementation could not be completed, are
counted once they are completed
Purpose To keep track of all older projects and monitor completion
Strategic link VIP #: 2 Focus Area(s):
Building and
maintaining
infrastructure
Output(s):
Number of
planned
catalytic
infrastructure
projects
completed
Intervention(s):
Maximise
investment in
infrastructure
Source of data Project managers supply completion reports for each project
Method of calculation Simple count of number of completion reports
Data limitations Depending on the speed of implementation, time allowed since
approval for implementation, the number of projects carried
over to a next year may vary. Casidra cannot control that
number.

52
Type of indicator Input: Activities: Output: X Outcome:
Service Delivery Indicator: Direct Service Delivery: X
Indirect Service Delivery:
Demand Driven Indicator: Yes, demand driven: X
No, not demand driven:
Calculation type Cumulative
Year-end: X
Cumulative Year-
to-date:
Non-cumulative:
Reporting cycle Quarterly: X Bi-annually: Annually: Biennially:
Desired performance Higher than target: X On target: Lower than target:
Indicator responsibility Chief Officer: Projects
Spatial transformation N/A
Disaggregation of
beneficiaries (where
applicable)
Target for women: N/A
Target for youth: N/A
Target for people with disabilities: N/A
Assumptions To keep track of projects that are completed and keep record of
the implementation process and deliverables
Means of verification Checking of MOAs signed
PROGRAMME 3: RURAL INFRASTRUCTURE DEVELOPMENT AND POVERTY ALLEVIATION
Sub-Programme 3.1: Community and Household Food Security
Indicator number 3.1.1
Indicator title Number of community food security projects implemented
Short definition Projects that are approved at the Food Security Commodity
group for implementation by Casidra from current financial year
funding received
Purpose Grant funding for Ilima Letsema is distributed via the CPAC for
approved projects
Strategic link VIP #: 2 Focus Area(s):
Building and
maintaining
infrastructure
Output(s):
Number of
planned
catalytic
infrastructure
projects
completed
Intervention(s):
Maximise
investment in
infrastructure
Source of data Project managers supply a MoA signed by the beneficiary
Method of calculation Simple count of number of MoAs signed
Data limitations Demand driven
Type of indicator Input: Activities: Output: X Outcome:
Service Delivery Indicator: Direct Service Delivery: X
Indirect Service Delivery:
Demand Driven Indicator: Yes, demand driven: X
No, not demand driven:
Calculation type Cumulative
Year-end: X
Cumulative Year-
to-date:
Non-cumulative:

53
Indicator number 3.1.1
Indicator title Number of community food security projects implemented
Reporting cycle Quarterly: X Bi-annually: Annually: Biennially:
Desired performance Higher than target: X On target: Lower than target:
Indicator responsibility Secretary: TMU
Spatial transformation N/A
Disaggregation of
beneficiaries
Target for women: N/A
Target for youth: N/A
Target for people with disabilities: N/A
Assumptions Depending on the time the funds are received and the
seasonality, the numbers may differ a lot
Means of verification MOA signed by beneficiary for funding allocation from the current
year Food Security funds
Indicator number 3.1.2
Indicator title Number of household food security projects implemented
Short definition Projects that are approved at the Food Security Commodity
group for implementation by Casidra from current financial year
funding received
Purpose Grant funding for Ilima Letsema is distributed via the CPAC for
approved projects
Strategic link VIP #: 2 Focus Area(s):
Building and
maintaining
infrastructure
Output(s):
Number of
planned
catalytic
infrastructure
projects
completed
Intervention(s):
Maximise
investment in
infrastructure
Source of data Project managers supply the first delivery acceptance of assets
letter signed by the beneficiary
Method of calculation Simple count of number of receipt of assets letters
Data limitations Only approved projects can be implemented
Type of indicator Input: Activities: Output: X Outcome:
Service Delivery Indicator: Direct Service Delivery: X
Indirect Service Delivery:
Demand Driven Indicator: Yes, demand driven: X
No, not demand driven:
Calculation type Cumulative
Year-end: X
Cumulative Year-
to-date:
Non-cumulative:
Reporting cycle Quarterly: X Bi-annually: Annually: Biennially:
Desired performance Higher than target: X On target: Lower than target:
Indicator responsibility Project Manager: Food Security
Spatial transformation N/A
Disaggregation of
beneficiaries
Target for women: N/A
Target for youth: N/A
Target for people with disabilities: N/A
Assumptions Depending on the time the funds are received and the
seasonality, the numbers may differ a lot
Means of verification Accepted of assets letter signed by household beneficiary for first
delivery of goods from the current year Food Security funds
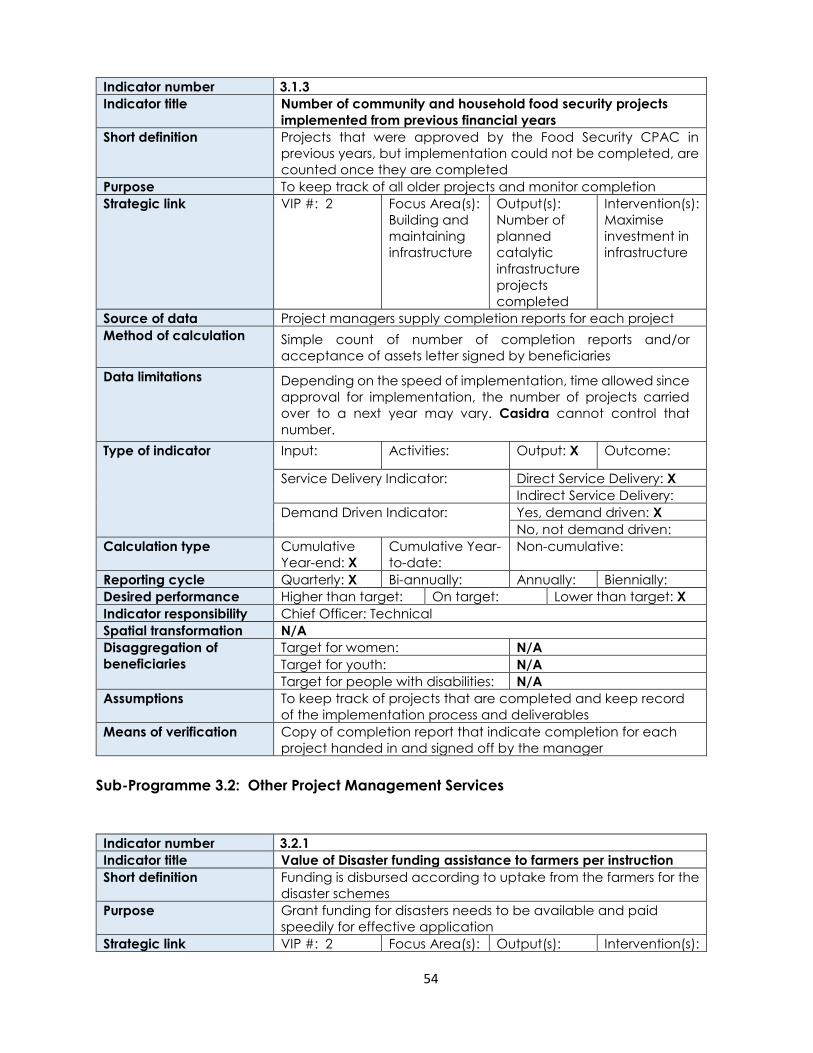
54
Indicator number 3.1.3
Indicator title Number of community and household food security projects
implemented from previous financial years
Short definition Projects that were approved by the Food Security CPAC in
previous years, but implementation could not be completed, are
counted once they are completed
Purpose To keep track of all older projects and monitor completion
Strategic link VIP #: 2 Focus Area(s):
Building and
maintaining
infrastructure
Output(s):
Number of
planned
catalytic
infrastructure
projects
completed
Intervention(s):
Maximise
investment in
infrastructure
Source of data Project managers supply completion reports for each project
Method of calculation Simple count of number of completion reports and/or
acceptance of assets letter signed by beneficiaries
Data limitations Depending on the speed of implementation, time allowed since
approval for implementation, the number of projects carried
over to a next year may vary. Casidra cannot control that
number.
Type of indicator Input: Activities: Output: X Outcome:
Service Delivery Indicator: Direct Service Delivery: X
Indirect Service Delivery:
Demand Driven Indicator: Yes, demand driven: X
No, not demand driven:
Calculation type Cumulative
Year-end: X
Cumulative Year-
to-date:
Non-cumulative:
Reporting cycle Quarterly: X Bi-annually: Annually: Biennially:
Desired performance Higher than target: On target: Lower than target: X
Indicator responsibility Chief Officer: Technical
Spatial transformation N/A
Disaggregation of
beneficiaries
Target for women: N/A
Target for youth: N/A
Target for people with disabilities: N/A
Assumptions To keep track of projects that are completed and keep record
of the implementation process and deliverables
Means of verification Copy of completion report that indicate completion for each
project handed in and signed off by the manager
Sub-Programme 3.2: Other Project Management Services
Indicator number 3.2.1
Indicator title Value of Disaster funding assistance to farmers per instruction
Short definition Funding is disbursed according to uptake from the farmers for the
disaster schemes
Purpose Grant funding for disasters needs to be available and paid
speedily for effective application
Strategic link VIP #: 2 Focus Area(s): Output(s): Intervention(s):

55
Indicator number 3.2.1
Indicator title Value of Disaster funding assistance to farmers per instruction
Creating an
enabling
environment
for economic
growth
through
resource
resilience
Number of
Green
Economy
projects
supported
• Climate
Change
resilience
• Energy
security
• Water
security
Source of data Summary sheet of payments done in quarter
Method of calculation Rand value of funds spent per quarter
Data limitations Demand driven deliverable
Type of indicator Input: Activities: Output: X Outcome:
Service Delivery Indicator: Direct Service Delivery: X
Indirect Service Delivery:
Demand Driven Indicator: Yes, demand driven: X
No, not demand driven:
Calculation type Cumulative
Year-end:
Cumulative Year-
to-date:
Non-cumulative: X
Reporting cycle Quarterly: Bi-annually: Annually: X Biennially:
Desired performance Higher than target: X On target: Lower than target:
Indicator responsibility Chief Officer: Technical
Spatial transformation N/A
Disaggregation of
beneficiaries
Target for women: N/A
Target for youth: N/A
Target for people with disabilities: N/A
Assumptions Disasters cannot be predicted and target for the year cannot be
set. The demand is subject to applications received and people
complying to conditions for funding
Means of verification Excel summary sheet indicating funds spent and Casper printout
showing the spending
Indicator number 3.2.2
Indicator title Number of projects contracted with government departments
and private institutions implemented from previous financial
years
Short definition Projects that are contracted outside of the Commodity groups or
DPAC for implementation by Casidra in previous years, but
implementation could not be completed, are counted once they
are completed
Purpose To keep track of all older projects and monitor completion
Strategic link VIP #: 2 Focus Area(s):
Growing the
economy
through
export growth
Output(s):
Number of
sector
initiatives
supported
Intervention(s):
Tradable
sector
development;
Export
promotion
Source of data Number of completion reports and acceptance of assets

56
Indicator number 3.2.2
Indicator title Number of projects contracted with government departments
and private institutions implemented from previous financial
years
Method of calculation Simple count of number of completion reports or quarterly
reports that show completion.
Data limitations Depending on the speed of implementation, time allowed since
approval for implementation, the number of projects carried
over to a next year may vary. Casidra cannot control that
number.
Type of indicator Input: Activities: Output: X Outcome:
Service Delivery Indicator: Direct Service Delivery: X
Indirect Service Delivery:
Demand Driven Indicator: Yes, demand driven: X
No, not demand driven:
Calculation type Cumulative
Year-end: X
Cumulative Year-
to-date:
Non-cumulative:
Reporting cycle Quarterly: X Bi-annually: Annually: Biennially:
Desired performance Higher than target: On target: Lower than target: X
Indicator responsibility Control Officer: Compliance & Admin
Spatial transformation N/A
Disaggregation of
beneficiaries
Target for women: N/A
Target for youth: N/A
Target for people with disabilities: N/A
Assumptions To keep track of projects that are completed and keep record of
the implementation process and deliverables
Means of verification Copy of completion report signed off by the manager or quarterly
report that indicates completion for each project handed in
Indicator number 3.2.3
Indicator title Number of new projects contracted with government
departments and private institutions implemented
Short definition Projects that are contracted outside of the Commodity groups or
DPAC for implementation by Casidra
Purpose Additional work that Casidra is contracting expands the
application of skills and ensures extra income
Strategic link VIP #: 2 Focus Area(s):
Growing the
economy
through
export growth
Output(s):
Number of
sector
initiatives
supported
Intervention(s):
Tradable
sector
development;
Export
promotion
Source of data Project managers supply MoA signed by a beneficiary or first
quarterly report that indicates that the project has started
Method of calculation Simple count of number of MoAs signed or proof that it has
started
Data limitations Only contracted projects can be implemented
Type of indicator Input: Activities: Output: X Outcome:
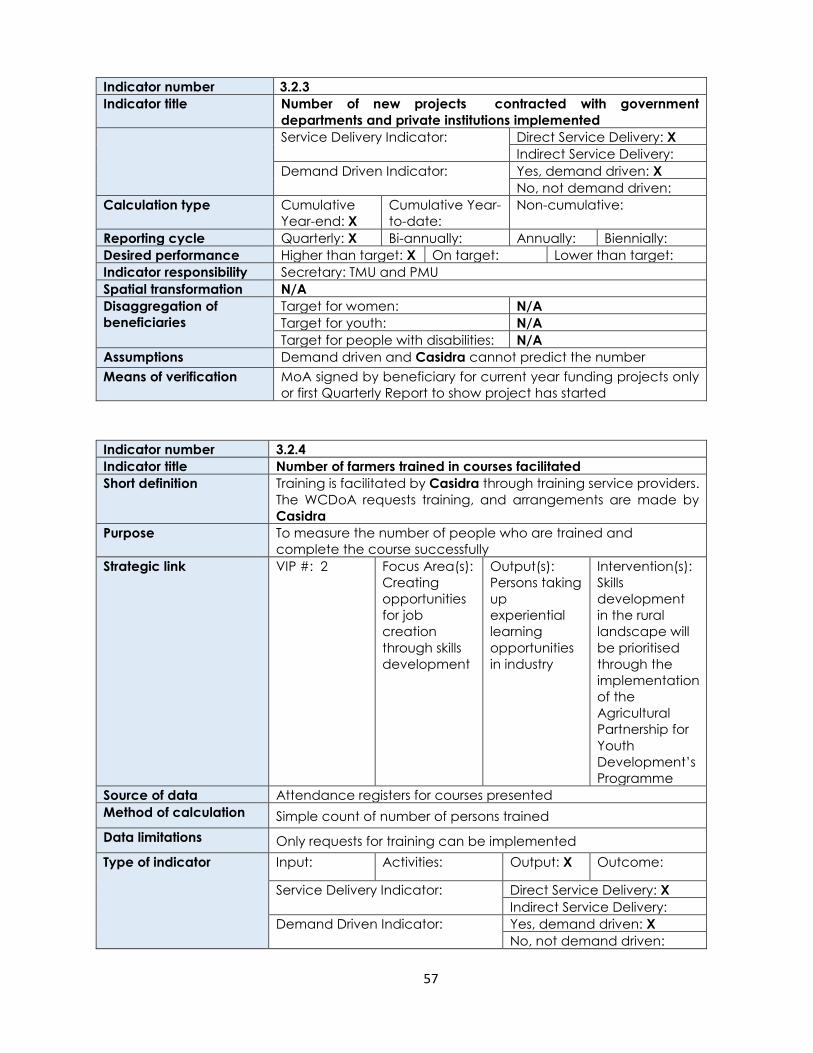
57
Indicator number 3.2.3
Indicator title Number of new projects contracted with government
departments and private institutions implemented
Service Delivery Indicator: Direct Service Delivery: X
Indirect Service Delivery:
Demand Driven Indicator: Yes, demand driven: X
No, not demand driven:
Calculation type Cumulative
Year-end: X
Cumulative Year-
to-date:
Non-cumulative:
Reporting cycle Quarterly: X Bi-annually: Annually: Biennially:
Desired performance Higher than target: X On target: Lower than target:
Indicator responsibility Secretary: TMU and PMU
Spatial transformation N/A
Disaggregation of
beneficiaries
Target for women: N/A
Target for youth: N/A
Target for people with disabilities: N/A
Assumptions Demand driven and Casidra cannot predict the number
Means of verification MoA signed by beneficiary for current year funding projects only
or first Quarterly Report to show project has started
Indicator number 3.2.4
Indicator title Number of farmers trained in courses facilitated
Short definition Training is facilitated by Casidra through training service providers.
The WCDoA requests training, and arrangements are made by
Casidra
Purpose To measure the number of people who are trained and
complete the course successfully
Strategic link VIP #: 2 Focus Area(s):
Creating
opportunities
for job
creation
through skills
development
Output(s):
Persons taking
up
experiential
learning
opportunities
in industry
Intervention(s):
Skills
development
in the rural
landscape will
be prioritised
through the
implementation
of the
Agricultural
Partnership for
Youth
Development’s
Programme
Source of data Attendance registers for courses presented
Method of calculation Simple count of number of persons trained
Data limitations Only requests for training can be implemented
Type of indicator Input: Activities: Output: X Outcome:
Service Delivery Indicator: Direct Service Delivery: X
Indirect Service Delivery:
Demand Driven Indicator: Yes, demand driven: X
No, not demand driven:

58
Indicator number 3.2.4
Indicator title Number of farmers trained in courses facilitated
Calculation type Cumulative
Year-end: X
Cumulative Year-
to-date:
Non-cumulative:
Reporting cycle Quarterly: X Bi-annually: Annually: Biennially:
Desired performance Higher than target: X On target: Lower than target:
Indicator responsibility Project manager: Training
Spatial transformation N/A
Disaggregation of
beneficiaries
Target for women: N/A
Target for youth: N/A
Target for people with disabilities: N/A
Assumptions Training is on demand and number trained will depend on fund
availability and the need from the sector
Means of verification Summary of people attending courses and signed attendance
registers
PROGRAMME 4: LOCAL ECONOMIC AND BUSINESS DEVELOPMENT
Sub-Programme 4.1: Business Development and Growth
Indicator number 4.1.1
Indicator title Number of loan agreements concluded and signed with
beneficiaries
Short definition Financial assistance through loan agreements
Purpose Support SMMEs with bridging and other finance to access
business opportunities
Strategic link VIP #: 2 Focus Area(s):
Growing the
economy
through
export growth
Output(s):
Number of
sector
initiatives
supported
Intervention(s):
Tradable
sector
development;
Export
promotion
Source of data Number of loan agreements signed with businesses
Method of calculation Simple count of number of signed loan agreements
Data limitations None
Type of indicator Input: Activities: Output: X Outcome:
Service Delivery Indicator: Direct Service Delivery: X
Indirect Service Delivery:
Demand Driven Indicator: Yes, demand driven: X
No, not demand driven:
Calculation type Cumulative
Year-end: X
Cumulative Year-
to-date:
Non-cumulative:
Reporting cycle Quarterly: X Bi-annually: Annually: Biennially:
Desired performance Higher than target: X On target: Lower than target:
Indicator responsibility Chief Officer: Projects
Spatial transformation N/A
Target for women: N/A

59
Disaggregation of
beneficiaries
Target for youth: N/A
Target for people with disabilities: N/A
Assumptions More funds might be secured from funding partners
Means of verification Checking of signed Loan Agreements
Indicator number 4.1.2
Indicator title Number of loan agreements implemented from previous
financial years
Short definition Projects that were approved in the previous financial year, but
could not be completed
Purpose To keep track of all older projects and monitor completion
Strategic link VIP #: 2 Focus Area(s):
Growing the
economy
through
export growth
Output(s):
Number of
sector
initiatives
supported
Intervention(s):
Tradable
sector
development;
Export
promotion
Source of data Number of loan agreements signed with businesses
Method of calculation Simple count of number of signed loan agreements
Data limitations Depending on the speed of implementation, the volume of the
projects carried over to the next year may vary. Casidra does
not have control over this number.
Type of indicator Input: Activities: Output: X Outcome:
Service Delivery Indicator: Direct Service Delivery: X
Indirect Service Delivery:
Demand Driven Indicator: Yes, demand driven: X
No, not demand driven:
Calculation type Cumulative
Year-end: X
Cumulative Year-
to-date:
Non-cumulative:
Reporting cycle Quarterly: X Bi-annually: Annually: Biennially:
Desired performance Higher than target: X On target: Lower than target:
Indicator responsibility Chief Officer: Projects
Spatial transformation N/A
Disaggregation of
beneficiaries
Target for women: N/A
Target for youth: N/A
Target for people with disabilities: N/A
Assumptions Funds are still available from previous financial years
Means of verification Checking of Completion Reports
Indicator number 4.1.3
Indicator title Number of business support projects implemented
Short definition Projects contracted for Casidra to implement
Purpose To continue to provide business support to beneficiaries of
projects with financial record-keeping services and market
access
Strategic link VIP #: 2 Focus Area(s):
Growing the
economy
Output(s):
Number of
sector
Intervention(s):

60
Indicator number 4.1.3
Indicator title Number of business support projects implemented
through
export growth
initiatives
supported
Tradable
sector
development;
Export
promotion
Source of data MOAs with various governmental, private sector and NGO
partners
Method of calculation Monetary value and/or number as agreed to in the MOA
Data limitations Only contracted projects can be implemented
Type of indicator Input: Activities: Output: X Outcome:
Service Delivery Indicator: Direct Service Delivery: X
Indirect Service Delivery:
Demand Driven Indicator: Yes, demand driven: X
No, not demand driven:
Calculation type Cumulative
Year-end: X
Cumulative Year-
to-date:
Non-cumulative:
Reporting cycle Quarterly: X Bi-annually: Annually: Biennially:
Desired performance Higher than target: X On target: Lower than target:
Indicator responsibility Chief Officer: Projects
Spatial transformation N/A
Disaggregation of
beneficiaries
Target for women: N/A
Target for youth: N/A
Target for people with disabilities: N/A
Assumptions None
Means of verification Signed Memorandum of agreements. Proof of evidence is kept
in audit file
Sub-Programme 4.2: Job Creation Initiatives
Indicator number 4.2.1
Indicator title Number of job creation initiatives implemented from previous
financial years
Short definition Projects that were approved in the previous financial year, but
could not be completed.
Purpose To facilitate projects that require substantial labour in order to
create employment while addressing other priorities and to
facilitate initiatives aimed at training and skills development to
render skilled recruits.
Strategic link VIP #: 2 Focus Area(s):
Creating
opportunities
for job
creation
through skills
development
Output(s):
Persons taking
up
experiential
learning
opportunities
in industry
Intervention(s):
Skills
development in
the rural
landscape will
be prioritised
through the

61
Indicator number 4.2.1
Indicator title Number of job creation initiatives implemented from previous
financial years
implementation
of the
Agricultural
Partnership for
Youth
Development’s
Programme
Source of data MOAs with various governmental, private sector and NGO
partners
Method of calculation Monetary value and/or number as agreed in the MOA
Data limitations Only contracted projects can be implemented
Type of indicator Input: Activities: Output: X Outcome:
Service Delivery Indicator: Direct Service Delivery: X
Indirect Service Delivery:
Demand Driven Indicator: Yes, demand driven: X
No, not demand driven:
Calculation type Cumulative
Year-end: X
Cumulative Year-
to-date:
Non-cumulative:
Reporting cycle Quarterly: X Bi-annually: Annually: Biennially:
Desired performance Higher than target: X On target: Lower than target:
Indicator responsibility Chief Officer: Projects
Spatial transformation N/A
Disaggregation of
beneficiaries
Target for women: N/A
Target for youth: N/A
Target for people with disabilities: N/A
Assumptions None
Means of verification Signed Memorandum of agreements. Proof of evidence is kept in
audit file
Indicator number 4.2.2
Indicator title Number of new job creation initiatives implemented
Short definition New projects contracted for Casidra to implement
Purpose To facilitate projects that require substantial labour in order to
create employment while addressing other priorities and to
facilitate initiatives aimed at training and skills development to
render skilled recruits
Strategic link VIP #: 2 Focus Area(s):
Creating
opportunities
for job
creation
through skills
development
Output(s):
Persons taking
up
experiential
learning
opportunities
in industry
Intervention(s):
Skills
development in
the rural
landscape will
be prioritised
through the
implementation
of the
Agricultural
Partnership for

62
Indicator number 4.2.2
Indicator title Number of new job creation initiatives implemented
Youth
Development’s
Programme
Source of data MOAs with various governmental, private sector and NGO
partners
Method of calculation Monetary value and/or number as agreed in the MOA
Data limitations Only contracted projects can be implemented
Type of indicator Input: Activities: Output: X Outcome:
Service Delivery Indicator: Direct Service Delivery: X
Indirect Service Delivery:
Demand Driven Indicator: Yes, demand driven: X
No, not demand driven:
Calculation type Cumulative
Year-end: X
Cumulative Year-
to-date:
Non-cumulative:
Reporting cycle Quarterly: X Bi-annually: Annually: X Biennially:
Desired performance Higher than target: X On target: Lower than target:
Indicator responsibility Chief Officer: Projects
Spatial transformation N/A
Disaggregation of
beneficiaries
Target for women: N/A
Target for youth: N/A
Target for people with disabilities: N/A
Assumptions None
Means of verification Signed Memorandum of agreements. Proof of evidence is kept in
audit file
ANNEXURES AND LINKS TO OTHER PLANS OF THE CORPORATE PLAN
Annexure A: Amendments to the Strategic Plan
NOT APPLICABLE
Annexure B: Conditional Grants
Name of Grant Purpose Outputs Current Annual Budget (R thousand) Period of Grant
NOT APPLICABLE
Annexure C: Consolidated Indicators
Institution Output Indicator Annual Target Data Source
NOT APPLICABLE

63
Annexure D: RISK MANAGEMENT PLAN
Risk management is incorporated into the management of each section within Casidra. The following
policies and documentation are in place to assist in risk management:
● Shareholder’s Compact
● Board and Committee Charters
● Financial Regulations
● Delegation of Power
● Personnel
● Procurement
● IT Policy
● Budget
● Memoranda of Agreement and Service
Level Agreements
● Fraud Prevention Plan
Introduction
Casidra‘s Board of Directors is accountable for the Company’s risk governance and has committed to a
process of risk management that is aligned to the principles of good corporate governance, as supported
by the Public Finance Management Act (PFMA), Act 1 of 1999 as amended by Act 29 of 1999 and the
King IV report.
Risk and Risk Management
Risk refers to the uncertainty of an event occurring, actual or potential, impacting on the Company’s
service delivery and other performance objectives. Some risk factors also present upside potential, which
Management must be aware of and be prepared to exploit. Such opportunities are encompassed in this
definition of risk.
Risk management is a systematic and formalised process instituted by the company to identify, assess,
manage and monitor risks.
Risk Appetite
The Board strives to ensure an appropriate balance between performance and
conformance/compliance. The aim is to prevent negative things, to manage uncertainties and to pursue
opportunities.
Risk Structure
Casidra established an Internal Audit Office as an independent appraisal function to examine and
evaluate Casidra activities as a service to the accounting authority of Casidra. The Internal Audit Office
reports organisationally to the Chairperson of Casidra and functionally to the Board and or Audit and Risk
Committee. The internal audit function does not operate as a dedicated department with specialised
personnel. In this context with the size of the organisation and available resources, the Chief Executive
Officer acts as Chief Audit Executive. In his/her discretion or guidance by the Audit and Risk Committee,
audit consultants or internal staff are appointed or utilised to perform internal audit functions.
64
The scope of work of the internal audit function is to determine whether the organisation’s network of risk
management, control, and governance processes, as designed and represented by Management, are
adequate and functioning in a manner to ensure that:
Risks are appropriately identified and managed. Interaction with the various governance groups occurs as needed. Significant financial, managerial, and operating information is accurate, reliable and timely. Employee actions are in compliance with policies, standards, procedures, and applicable laws and
regulations. Resources are acquired economically, used efficiently, and adequately protected. Programmes, plans and objectives are achieved. Significant legislative or regulatory issues impacting the organisation are recognised and addressed
appropriately.
The Chief Audit Executive (the CEO) is accountable to the Audit Committee to:
Provide annually an assessment on the adequacy and effectiveness of the organisation’s processes
for controlling its activities and managing its risks in the areas set forth under the mission and scope of
work. Report significant issues related to the processes for controlling the activities of the organisation and
its affiliates, including potential improvements to those processes, and provide information
concerning such issues through resolution. Periodically provide information on the status and results of the annual Audit Plan and the sufficiency
of audit resources. Co-ordinate with and provide oversight of other control and monitoring functions (risk management,
compliance, security, legal, ethics, environmental, external audit).

65
RISK DASHBOARD
No.
Strategic Objectives
Risk Preventative
measure Category
External/ Internal
Responsible
person
Probability
Impact Current
Indicator Previous Indicator
1 SALARIES
None.
2 INFORMATION TECHNOLOGY
To ensure sound IT management
Critical business data and information be altered, destroyed or corrupted by hackers, viruses, malware or phishing
Network and email security policies and procedures, using firewalls and anti-virus software
Technical External/ Internal
CFO 30% 2 ☺
↔
☺
↔
To ensure secure electronic devices and systems
IT virus infections and electronic contaminants - control measures inadequate to block entry
Stricter firewall control measures and vigilance Financial Internal IT 30% 2
↔
↔
3 FINANCE
To ensure sound financial management
MTEF institutional funding below budget
Market company services broader to establish new income streams
Finance External Manageme
nt 50% 3
↔ ☺
↔
To ensure sound financial management
The interpretation of prescripts/clauses of the SCM guidelines and prescripts by the AG
Revise policy to be more inline with Departments' procedures and workshop interpretations with personnel continuously
Company Internal Manageme
nt 60% 1
↑
↑

66
RISK DASHBOARD
No.
Strategic Objectives
Risk Preventative
measure Category
External/ Internal
Responsible
person
Probability
Impact Current
Indicator Previous Indicator
To ensure sound financial management
Financial and cash flow inadequacies as a result of Treasury Instruction which require entities to tender for project work from state institutions
High level interaction with institutional funder to ensure bridging capital mechanism
Finance External CEO and
CFO 30% 3
↔
↔
To define smart performance targets
Audit findings regarding performance targets
Set smart performance targets and record reliable supporting evidence
PMU/TMU Internal COP/COT 10% 1
↓
4 PUBLIC RELATIONS, MARKETING AND COMMUNICATIONS
To provide effective and efficient PR, marketing and communications services
Social Media Social Media Strategy/Policy, timeous response / reaction and monitoring
PR External PR 20% 1 ☺
↔
☺
↔
5 OPERATIONAL /TECHNICAL MANAGEMENT UNIT
To support and manage government farms on behalf of the respective communities until transfer
Regular power failures and load shedding could hamper irrigation, milking and drying of seed
Back-up electricity is in place for Amalienstein and Waaikraal
Operational Internal
Manager: Regional /
Farm managers
10% 2 ☺
↔
☺
↔
To support and manage government farms on behalf of the respective communities until transfer
Inadequate skill levels of CPA members
Insist on and carry through with training interventions to instil sufficient skill
Operational External CEO/
Manager: Regional
80% 1 ☺
↔
☺
↔

67
RISK DASHBOARD
No.
Strategic Objectives
Risk Preventative
measure Category
External/ Internal
Responsible
person
Probability
Impact Current
Indicator Previous Indicator
To support and manage government farms on behalf of the respective communities until transfer
Theft Guards have
proofed to be the
most effective Operational Internal / External COT 30% 1 ☺
↔
☺
↔
To support and manage government farms on behalf of the respective communities until transfer
Delay in presentation of
5 year transfer plan in
respect of farms and the
availability of sufficient
funding until the farms
are transferred
Joint ongoing communication with Casidra, WCDoA, DRDLR and liaison forums for communities and applying pressure on decision makers
Operational External COT 80% 3
↔
↔
To support and manage government farms on behalf of the respective communities until transfer
Collapsing market for products and collapsing or failed harvest
Cost efficient production practices and ensure diverse products and markets
Operational Internal COT 20% 2 ☺
↔
☺
↔
To support and manage government farms on behalf of the respective communities until transfer
Impact of drought on
funding source
Request funding
from Dept.
Operational Internal COT 40% 2
↓
↓
Facilitate and implement agricultural projects for agrarian beneficiaries through government funding
Slow decision making and response time from Government officials
Instituting a process to record requests and escalation of process Operational Internal
Management
20% 1 ☺
↔
☺
↓
Facilitate and implement agricultural projects for agrarian beneficiaries through government funding
Areas in Metro affected by serious crime and life threatening to Casidra personnel
Stop all services to crime affected areas or implement different service delivery method
Operational Internal Manageme
nt 60% 1
↓
↔

68
RISK DASHBOARD
No.
Strategic Objectives
Risk Preventative
measure Category
External/ Internal
Responsible
person
Probability
Impact Current
Indicator Previous Indicator
Facilitate and implement agricultural projects for agrarian beneficiaries through government funding
AG findings on involvement of officials in implementation. Must only do M&E. Task on Casidra to implement fully. No funds or capacity available.
Interaction with WCDoA on processes and funding to create capacity.
Operational Internal Manageme
nt 60% 1
☹
↓
☺
↑
6 HUMAN RESOURCES
To provide an efficient and effective human resource management service.
Timeous addressing of poor performance by employees
Follow disciplinary code of conduct, performance counselling, Incapacity policy
Human Resources
Internal HR 10% 1 ☺
↔
☺
↑
7 CORPORATE SERVICES
To render a corporate support service to the organisation
Late completion/ delays in finalisation of projects and inadequate reporting
Regular review of projects being delayed, considering reasons and implement corrective measures
PMU / TMU Internal CEO &
Management
20% 2
↑
↔
To ensure safeguards against fraudulent commitments
Committing an individual or the company to a contractual obligation(s) by applying/pasting an electronic signature on documents
Develop a clear SOP of when to apply electronic signatures i.e. when no contractual obligations are implied
Corporate Internal Manageme
nt 30% 1
↔
↔
8 DEVELOPMENT/ PROJECT MANAGEMENT UNIT

69
RISK DASHBOARD
No.
Strategic Objectives
Risk Preventative
measure Category
External/ Internal
Responsible
person
Probability
Impact Current
Indicator Previous Indicator
To respond to requests from new and existing clients to project manage, administer and procure services
Changes of focus and funding priorities of funding agencies, eg. WCDoA which lead to the closure of certain programmes
Corporate resilience with alternative programmes within which personnel can be absorbed if feasible
Operational External/Internal CEO 30% 3
↔
↔
To respond to requests from new and existing clients to project manage, administer and procure services
Loan fund being regarded as unfair
Criteria for selection according to stipulated criteria
Operational Internal COP 20% 1
↔
↔
To respond to requests from new and existing clients to project manage, administer and procure services
Non-repayment of loans Effective debt collection process and selection of viable clients
Operational Internal COP 75% 3
↔
↔
KEY FOR ‘INDICATOR’ KEY FOR IMPACT’
☺
= Already being adequately
addressed ↑ Improvement
1 = Below R500 000
= In the process of being
addressed ↔
No difference 2
= Between R500 000 and R1 million
☹
= Not yet addressed ↓
Deterioration 3
= More than R1 million

70
Annexure E: FRAUD PREVENTION PLAN
A Fraud Prevention Plan has been developed and implemented. The components of the Plan for
Casidra are the following:
▪ Policies, procedures, rules, regulations and other relevant government prescripts, including
human resources policies;
▪ Disciplinary code and procedures;
▪ Internal controls;
▪ Internal Audit;
▪ Ongoing risk assessment;
▪ Management Committee to steer and take responsibility for the Plan;
▪ Code of Ethics and Business Conduct;
▪ Fraud Policy;
▪ Fraud Line for confidentially reporting fraud;
▪ Physical and information security management;
▪ Creation of awareness amongst employees and other stakeholders;
▪ Ongoing training;
▪ Declaration of interests in all meetings; and
▪ Ongoing maintenance and review of the Plan.
A fraud reporting e-mail address has been created and a Fraud Committee established. Casidra,
through the Internal Audit function of the organisation, will continue to focus on monitoring and
reporting in terms of the Plan. All managers are held accountable for the implementation of the
Plan.
Annexure F: MATERIALITY AND SIGNIFICANCE FRAMEWORK
This framework establishes standards and provides guidance on the concepts of materiality and
significance with regard to Sections 50(1) (c), 55(2) and 54(2) of the PFMA and Treasury Regulation
28.3.
Materiality is defined in the International Accounting Standards Board “Framework for the
Preparation and Presentation of Financial Statements” (ISA 320) in the following terms:
“Information is material if its omission or misstatement could influence the economic decisions of
users taken on the basis of the financial statements. Materiality depends on the size of the item or
71
error judged in the particular circumstances of its omission or misstatement. Thus, materiality
provides a threshold or cut-off point rather than being a primary qualitative characteristic which
information must have if it is to be useful”.
The assessment of what is material is a matter of professional judgement and may be influenced
by considerations such as legal and regulatory requirements and considerations relating to classes
of transactions, account balances, and disclosures and their relationships.
With regard to quantitative aspects, the materiality figure, as determined by the external auditors
to detect quantitatively material misstatements, is applicable.
The nature (quality) of misstatements is also considered before the auditors express an opinion on
whether the financial statements are prepared, in all material respects, in accordance with an
applicable financial reporting framework.
Materiality is normally determined as a percentage of turnover, total expenditure and or total
assets.
Taking the above into consideration Casidra has set materiality for income and expenditure at
R378 500 (approximately 1,0 % of the Head Office budgeted gross operating expenditure) and at
R836 000 (approximately 2 % of the Head Office total assets, excluding Project cash and cash
equivalents) for the year.
Any transaction or circumstance as described by the PFMA, with a monetary value of more than
R836 000, is considered significant for the purpose of the framework.
Annexure G: FINANCIAL MANAGEMENT PLAN
1.1 PROJECTIONS OF REVENUE, EXPENDITURE AND BORROWING
A borrowing programme is currently not applicable. Casidra does not borrow money.
1.2 ASSET AND LIABILITY MANAGEMENT
Included in the Cash flow Projections below.

72
1.3 CASH FLOW PROJECTIONS
SUMMARY OF FINANCIAL POSITION
2016/17 2017/18 2018/19 2019/20 2020/21 2021/22 2022/23
R thousand
Audited outcome Actual outcome
Main budget
(Approved)
Adjusted budget
(Approved)
Revised estimate
Medium-term estimates
Revenue
Sale of goods and services other than capital assets
12,069
6,655 7 038
15 592
15592 15 592
25041
26398
27732
Entity revenue other than sales
3,101
2,821 2 999
1 946
1946 1 946 2 694 2843 3 000
Departmental transfers
20,939
26,218 25 754
24 536
24536 24 536 23 634 24816 26 007
Other transfers
TOTAL REVENUE
36,109
32,474 35 791
42 074
42074 42 074 51 369 54057 567391
Expenses
Current expense
31,964
34,013 37 099
40 434
40434 40 434 48 501 51066 54 050
Compensation of employees
26,077
27,107 28 354
31 343
31343 31 343 38 078 40124 42 444
Goods and services
5,692
6,922 8 745
9 091
9091 9 091 10 423 10942 11 606
TOTAL EXPENSES
31,769
34,029 37 099
40 434
40434 40 434 48 501 51066 54 050
Surplus / (Deficit) 4,340
(1,555) (1 308)
1 640
1640 1 640 2 868 2 991 2 689

73
1.3 CASH FLOW PROJECTIONS
Cash flow from investing activities
2264
(911) (948)
(1 858)
(1858) (1 858) (2 060) (1772) (1 860)
Acquisition of Assets
(793)
(911) (948)
(1 858)
(1858) (1 858) (2 060) (1772) (1 860)
Other Structures (Infrastructure Assets)
(156) (113)
(211)
(211) (211)
(300)
(315) (330)
Computer equipment
(575)
(163) (194)
(451)
(451) (451)
(467)
(481) (505)
Furniture and Office equipment
(17) (22)
(202)
(202) (202)
(250)
(246) (275)
Transport Assets
(218)
(575) (619)
(650)
(650) (650)
(666)
(332) (348)
Computer Software -
(344)
(344) (344) (377) (398) (402)
Other flows from Investing Activities 3,057 - - - - -
-
-
-
Net increase / (decrease) in cash and cash equivalents
2264
(911) (948)
(1 858)
(1858) (1 858) (2 060) (1772) (1860)

74
1.3 CASH FLOW PROJECTIONS BALANCE SHEET DATA
Carrying Value of Assets
7223
7476 7 634
7 465
7465 7 465 6 890 6 755 7 080
Investment Property
264
424 470
424
424 424 264
264 277
Other Structures (Infrastructure Assets)
4991 5051 4 928
5 051
5051 5 051 5 051 5051 5 293
Computer equipment
695
620 523
690
690 690 525
490 514
Furniture and Office equipment
306
431 297
450
450 450 300
250 262
Transport Assets
967
950 1 416
850
850 850 750
700 734
Investments
10089 10089 5 885
10 896
10896 10 896 11 767 12 709 13 319
5<10 Years 10 089 10 089 5 885
10 896 10 896 10 896 11 767 12709 13 319
Cash and Cash Equivalents 343 328 362 179 525 570
323 146 323 146 323 146 360 950 370 367 388 145
Bank 23 496 21 525 22 523
3 314 3 314 3 314 20 000 21 407 22 435
Other 319 832 340 654 503 047
319 832 319 832 319 832 340 950 348 960 365 710
Receivables and Prepayments
990
805 1 514
890 890 890 650
750 786
Trade Receivables
990
805 1 514
890 890 890 650
750 786
TOTAL ASSETS 361 630
380549 540 603
342 397 342 397 342 397 380 257 390 581 409 330

75
1.3 CASH FLOW PROJECTIONS
Capital and Reserves 35 862 34 112 32 810
25 804 25 804 25 804 35 678
38 849
42926
Share Capital and Premium
25,000
25,000 25,000 25,000 25,000
25,000
25,000
25,000
26,200
Accumulated Reserves
6522
10667 9 118
(836)
(836) (836)
7810 10 858 14 037
Surplus / (Deficit) 4 340 (1 555) (1 308)
1 640 1 640 1 640 2 868 2 991 2 689
Trade and Other Payables 323 125 341 060 504 750
323 232 323 232 323 232 344 450 352653 369 580
Trade Payables
3293
406 1 703
3 400
3400 3 400 3 500 3693 3 870
Other 319 832 340 654 503 047
319 832 319 832 319 832 340 950 348 960 365 710
Provisions
2838
3512 3 444
2 641
2641 2 641 2 746 2856 2 994
Leave pay provision
1456
2771 2 445
1 900 1 900 1 900 2 005 2 115 2 217
Other 1 382
741 999
741
741 741 741
741 777

76
1.4 CAPITAL EXPENDITURE PROGRAMMES
Capital expenditure programmes 20/21 21/22 22/23
Capital Expenditure Statement
Buildings and fixed structures 300 315 330
Furniture & Fittings 250 263 275
Vehicles 666 332 348
Information technology 844 862 907
2060 1772 1860
1.5 DIVIDEND POLICY
A dividend policy is currently not applicable. Casidra does not pay dividends.

77
ANNEXURE H: ORGANISATIONAL STRUCTURE
Board
Chief Executive Officer
A Seymour
Project Management Unit Corporate Services
Chief Financial Officer
F van Zyl
Supply Chain
Supply Chain Officer
Level 9
(1 position)
Procurement Administrator
Level 7
(1 position)
IT
IT Technician
Level 8
(2 positions)
Finance
Assest & Maintenance Officer
Level 6
(1 position)
Accountant
Level 11
(1 position)
Senior Bookkeeper
(Level 8)
(1 position)
Bookkeeper
(Level 7)
(2 positions)
Payroll / HR
Level 8
(1 position)
Human Resource Manager
L Seconds
Human Resources
HR Coordinator
Level 8
(2 positions)
Front Desk
Frontline Officer
Level 5
(1 position)
Public Relations, Marketing &
Communication
PR/Communication Manager
Level 11
(1 position)
Technical Managment Unit
Annexure H: ORGANISATIONAL
STRUCTURE

78
Board
Chief Executive Officer
Project Management Unit
D Nefdt
Regional Office
Regional Manager
Level 13
(1 position)
Project Manager
Level 9
(3 positions)
Project Implementer
Level 7
(2 Positions)
Administrator
Level 8
(1 position)
Bookkeeper
Level 7
(1 position)
Administrative
Support
Project Help Desk &
Compliance Officer
Level 9
(1 position)
Project Administrator
Level 7
(5 positions)
Secretary
Level 7
(2 positions)
Project Management
Agriculture
Senior Project Manager
Level 10
(3 position)
Project Manager
Level 9
(4 positions)
Other Projects & Programmes
Senior Project Manager
Level 10
(1 position)
Project Manager
Level 9
(1 position)
Corporate ServicesTechnical Management Unit
M Silevu
Food Security
Project Manager
Level 9
(1 position)
Project
Implementer
Level 7
(2 positions)
Technical Support
Senior Project Manager
Level 10
(2 positions)
Project Manager
Level 9
(2 positions)
UTA
Senior Project Manager
Level 10
(1 position)
LREAD
Senior Project Manager
Level 10
(1 postion)

79

80