castrissios jones port kembla inner harbour expansion
TRANSCRIPT

Port Kembla Inner Harbour Expansion
Arthur Castrissios1 and Michael Jones2
1Senior Associate, Douglas Partners Pty Ltd, 2Senior Associate, Douglas Partners Pty Ltd
ABSTRACT
This paper discusses the geotechnical aspects of a proposed expansion of the Port Kembla Inner Harbour to accommodate container and vehicle storage. The site is underlain by a variable sequence of uncontrolled filling and estuarine/marine sediments that posed a challenge for design and construction. Design solutions to provide pavement and hardstand areas were focussed on maximising re-use of on-site materials and minimising off-site disposal. The ready availability of slag (a by-product of the nearby Port Kembla Steelworks), minimised the need for importation of quarry products to create working platforms and for pavement construction. In summary, the project is an example of the application of a reduce, re-use, recycle methodology.
1. INTRODUCTION The NSW Government has identified the potential and need for the expansion of Port Kembla, as well as those at Port Botany and Newcastle, in order to increase the States overall shipping capacity. The original Port Botany capacity was 650,000 twenty foot equivalent units (TEU) per annum. By 2020, it is projected that NSW throughput will be in excess of 3 million TEU per annum. Port Kembla's available berth space, close proximity to Sydney and road/rail network connections make it a logical location to expand the port facilities of NSW, in addition to those being carried out at Port Botany. In October 2005, the NSW Government announced a $140 million re-development of Port Kembla Inner Harbour. The overall development (refer Figure 1) comprises the construction of a 290 m long berth, three distinct pavement areas (heavy duty for container storage; truck duty for cargo interchange; and car duty for vehicle storage), realignment of an existing rail spur, realignment of Tom Thumb Road, 1.5 ha of storage facility and associated administration buildings, cargo sheds and secure entry point.
Figure 1: Artists impression of Port Kembla Inner Harbour Expansion Douglas Partners Pty Ltd (DP) was engaged by project managers Fielder Engineers Pty Ltd (FG) on behalf of the site owners, Port Kembla Port Corporation (PKPC), to undertake geotechnical investigation to assist in the design of car, truck and heavy duty pavements, and to provide comments on site preparation measures. Investigation works were undertaken in May 2005. Construction commenced in April 2006 and was completed in May 2008.

1. HISTORY
Port Kembla was known as Red Point until 1892 when the name was changed to reflect the use of the port for coal exports from the Mt Kembla mine. The ready availability of coal, which has been mined commercially since 1848, has attracted heavy industry to the area, most notably the Port Kembla Steelworks which commenced steel production in 1931. Work on the Inner and Outer Harbours began in 1898, with more recent improvements around the 1960's. As part of the development of the port, extensive reclamation work was undertaken including the placement of dredged sediments, slag (a by-product of the steel making process) and coalwash (a by-product of the coal washing process).
Figure 2: Layout of Port of Port Kembla. The proposed development site is in the north west section of the harbour precinct.
The port (refer Figure 2) is now Australia's leader for steel exports and second largest for grain exports. As such, expansion of the facility to accommodate further growth is seen to be of State and National importance.
2. SITE LOCATION AND GEOLOGY Port Kembla Inner Harbour is located some 70 km south-west of Sydney and 2 km south of the Wollongong CBD. The site of the proposed development comprised an irregular shaped parcel of land with an area of about 55 ha on the northern side of the Inner Harbour. It is bounded to the north by a rail spur, to the east by roads, rail lines and a grain terminal and to the west by roads (refer Figure 3).
Figure 3: View north across Port Kembla Inner Harbour. Development area is vacant to the west of the grain terminal.
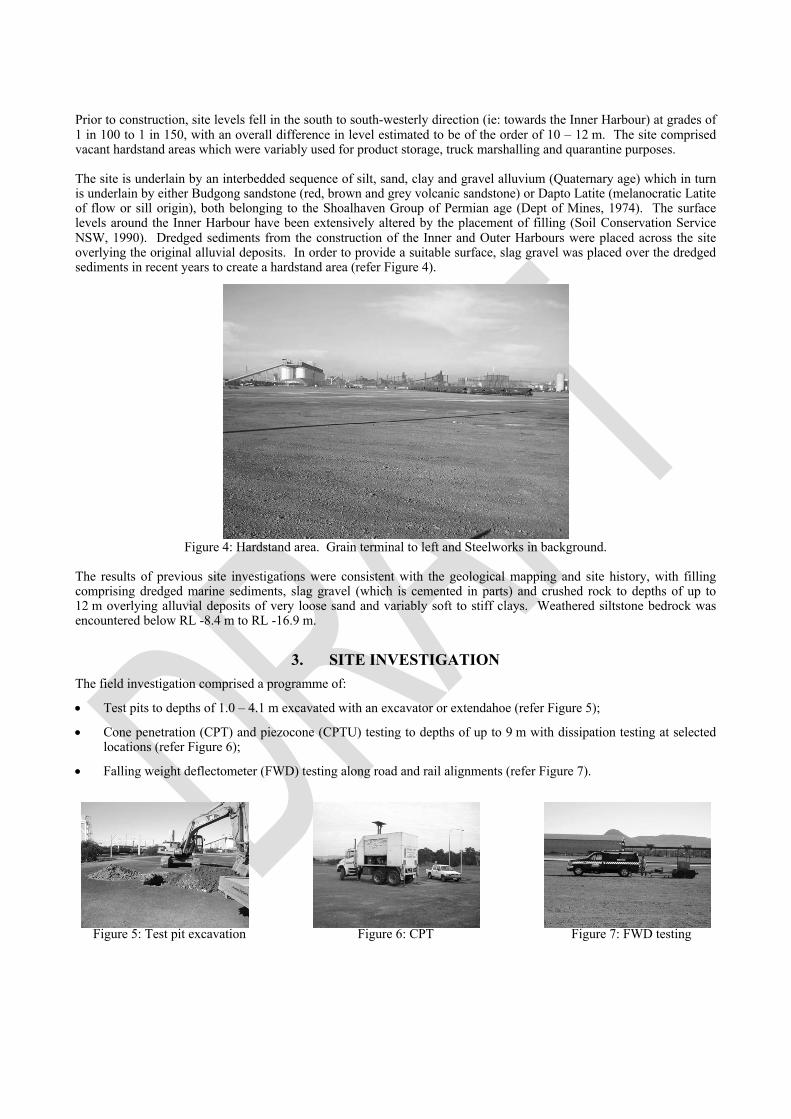
Prior to construction, site levels fell in the south to south-westerly direction (ie: towards the Inner Harbour) at grades of 1 in 100 to 1 in 150, with an overall difference in level estimated to be of the order of 10 – 12 m. The site comprised vacant hardstand areas which were variably used for product storage, truck marshalling and quarantine purposes. The site is underlain by an interbedded sequence of silt, sand, clay and gravel alluvium (Quaternary age) which in turn is underlain by either Budgong sandstone (red, brown and grey volcanic sandstone) or Dapto Latite (melanocratic Latite of flow or sill origin), both belonging to the Shoalhaven Group of Permian age (Dept of Mines, 1974). The surface levels around the Inner Harbour have been extensively altered by the placement of filling (Soil Conservation Service NSW, 1990). Dredged sediments from the construction of the Inner and Outer Harbours were placed across the site overlying the original alluvial deposits. In order to provide a suitable surface, slag gravel was placed over the dredged sediments in recent years to create a hardstand area (refer Figure 4).
Figure 4: Hardstand area. Grain terminal to left and Steelworks in background. The results of previous site investigations were consistent with the geological mapping and site history, with filling comprising dredged marine sediments, slag gravel (which is cemented in parts) and crushed rock to depths of up to 12 m overlying alluvial deposits of very loose sand and variably soft to stiff clays. Weathered siltstone bedrock was encountered below RL -8.4 m to RL -16.9 m.
3. SITE INVESTIGATION The field investigation comprised a programme of:
• Test pits to depths of 1.0 – 4.1 m excavated with an excavator or extendahoe (refer Figure 5);
• Cone penetration (CPT) and piezocone (CPTU) testing to depths of up to 9 m with dissipation testing at selected locations (refer Figure 6);
• Falling weight deflectometer (FWD) testing along road and rail alignments (refer Figure 7).
Figure 5: Test pit excavation Figure 6: CPT Figure 7: FWD testing

The results of the field investigation identified a distinct layered profile summarised as follows:
• Unit 1A – Slag Gravel: A surface blanket of grey sandy slag gravel with some cobble and boulder sized pieces. Lightly bound to heavily bound layers were encountered in some of the pits. Gravel depths were generally in the range 0.4 – 0.8 m, with a minimum depth of 0.3 m in two pits and in excess of 2.6 m in one pit.
• Unit 1B – Dredged Sediments: A mix of brown, grey, green grey, orange brown clay, silty clay, silt, sand with some slag gravel. The consistency of the clayey material would generally be equivalent to firm to stiff conditions. However, very soft to soft conditions were encountered in one pit between 1.2 m and 3.0 m.
• Unit 2 – Clay (Marine Sediment): A relatively uniform bed of soft to firm clay with some silty/sandy lenses to depths of 10.5m – 13.3 m.
• Unit 3 – Clay (Residual): stiff to hard clay/silty clay underlying the marine sediments and/or filling to depths of 14.0 m – 18.3 m. Three CPTs were terminated at cone refusal depths of 15.2 m – 18.3 m, possibly indicative of weathered rock.
Groundwater was encountered at depths of 0.5 m – 2.9 m, which in some cases comprised perched water within the site filling. The subsurface profile is summarised in Figure 8 with a typical cone penetration test printout shown in Figure 9.
Figure 8: Geotechnical Model Figure 9: Typical CPT Report
4. LABORATORY TESTING
A programme of field and laboratory testing was undertaken on typical samples recovered from the test pits for the purpose of evaluating classification properties, field moisture contents, particle size distribution and California bearing ratio. Table 1 summarises the results of the laboratory testing and indicates the significant variability of mechanical properties of the site. Particular note is made in the variability of plasticity (ie: low to high plasticity with liquid limits ranging from 24% to 65%) and in-situ moisture contents (15% to 68%, with moisture in excess of the plastic limit). California bearing ratio of the clay filling was typically low (1.5% - 3.5%). The CBR of overlying slag material was high (60% - 140%) and could be re-used as a working platform for pavement construction.
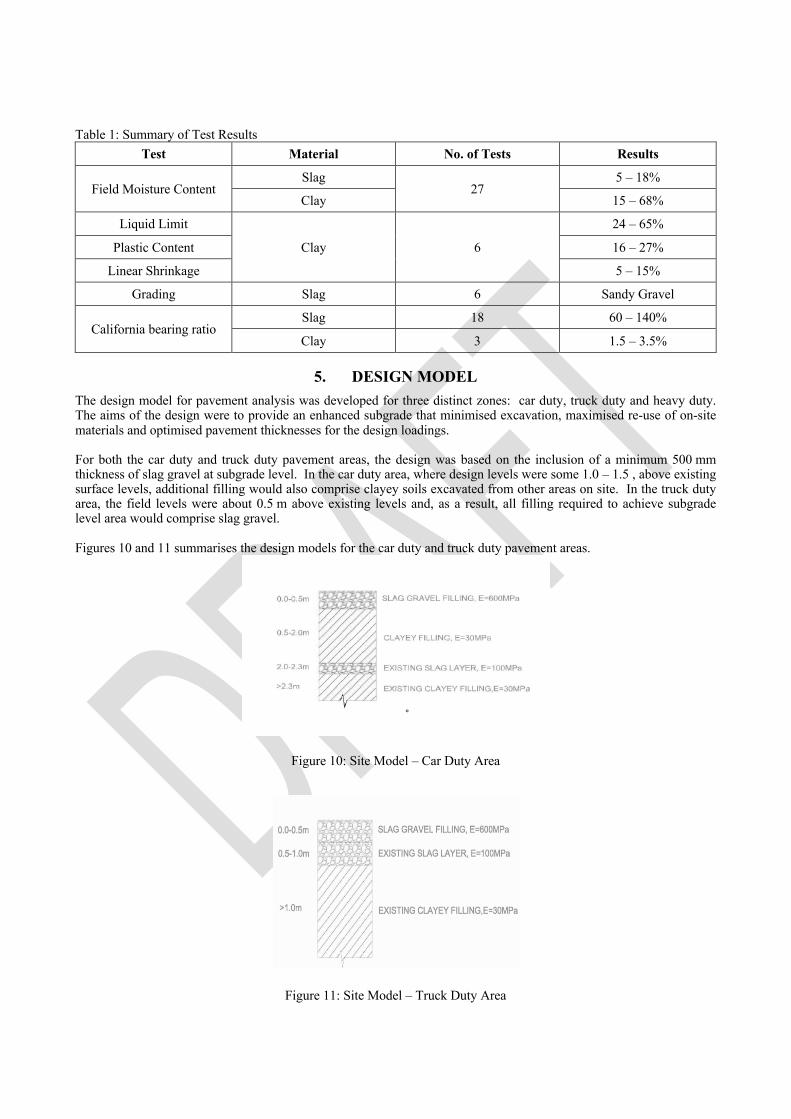
Table 1: Summary of Test Results
Test Material No. of Tests Results
Field Moisture Content Slag
27 5 – 18%
Clay 15 – 68%
Liquid Limit
Clay 6
24 – 65%
Plastic Content 16 – 27%
Linear Shrinkage 5 – 15%
Grading Slag 6 Sandy Gravel
California bearing ratio Slag 18 60 – 140%
Clay 3 1.5 – 3.5%
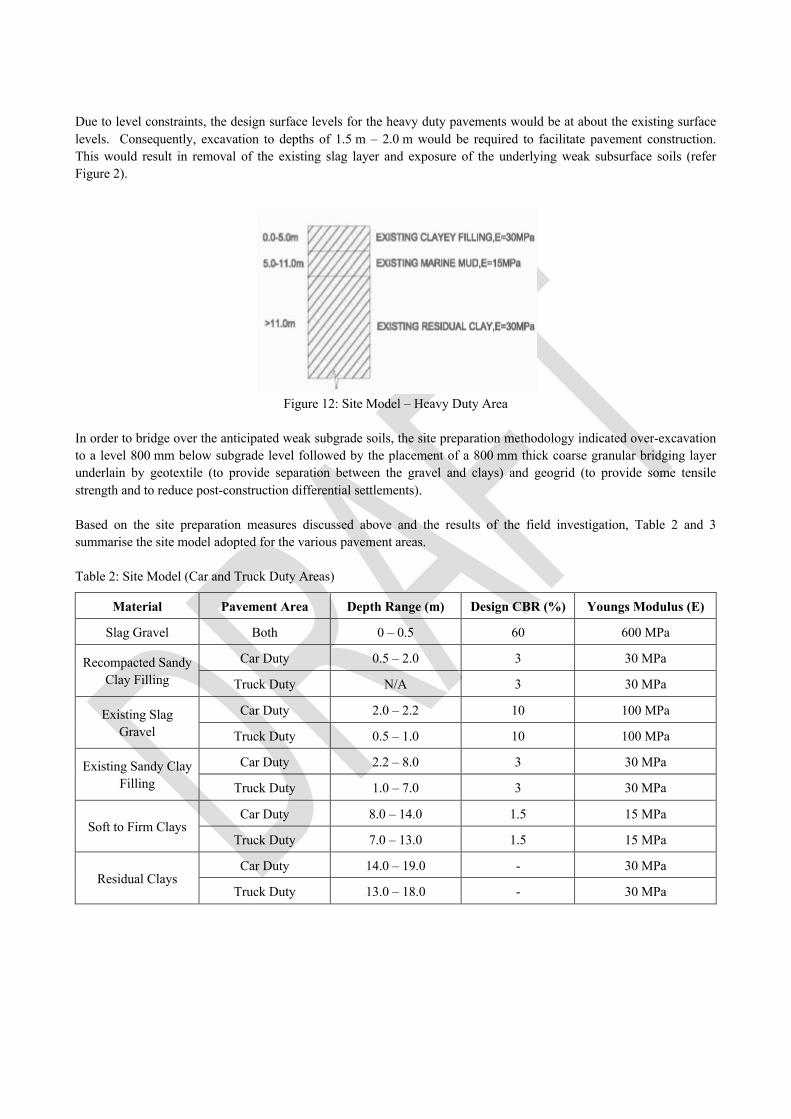
5. DESIGN MODEL The design model for pavement analysis was developed for three distinct zones: car duty, truck duty and heavy duty. The aims of the design were to provide an enhanced subgrade that minimised excavation, maximised re-use of on-site materials and optimised pavement thicknesses for the design loadings. For both the car duty and truck duty pavement areas, the design was based on the inclusion of a minimum 500 mm thickness of slag gravel at subgrade level. In the car duty area, where design levels were some 1.0 – 1.5 , above existing surface levels, additional filling would also comprise clayey soils excavated from other areas on site. In the truck duty area, the field levels were about 0.5 m above existing levels and, as a result, all filling required to achieve subgrade level area would comprise slag gravel. Figures 10 and 11 summarises the design models for the car duty and truck duty pavement areas.
Figure 10: Site Model – Car Duty Area
Figure 11: Site Model – Truck Duty Area
Due to level constraints, the design surface levels for the heavy duty pavements would be at about the existing surface levels. Consequently, excavation to depths of 1.5 m – 2.0 m would be required to facilitate pavement construction. This would result in removal of the existing slag layer and exposure of the underlying weak subsurface soils (refer Figure 2).
Figure 12: Site Model – Heavy Duty Area
In order to bridge over the anticipated weak subgrade soils, the site preparation methodology indicated over-excavation to a level 800 mm below subgrade level followed by the placement of a 800 mm thick coarse granular bridging layer underlain by geotextile (to provide separation between the gravel and clays) and geogrid (to provide some tensile strength and to reduce post-construction differential settlements). Based on the site preparation measures discussed above and the results of the field investigation, Table 2 and 3 summarise the site model adopted for the various pavement areas. Table 2: Site Model (Car and Truck Duty Areas)
Material Pavement Area Depth Range (m) Design CBR (%) Youngs Modulus (E)
Slag Gravel Both 0 – 0.5 60 600 MPa
Recompacted Sandy Clay Filling
Car Duty 0.5 – 2.0 3 30 MPa
Truck Duty N/A 3 30 MPa
Existing Slag Gravel
Car Duty 2.0 – 2.2 10 100 MPa
Truck Duty 0.5 – 1.0 10 100 MPa
Existing Sandy Clay Filling
Car Duty 2.2 – 8.0 3 30 MPa
Truck Duty 1.0 – 7.0 3 30 MPa
Soft to Firm Clays Car Duty 8.0 – 14.0 1.5 15 MPa
Truck Duty 7.0 – 13.0 1.5 15 MPa
Residual Clays Car Duty 14.0 – 19.0 - 30 MPa
Truck Duty 13.0 – 18.0 - 30 MPa
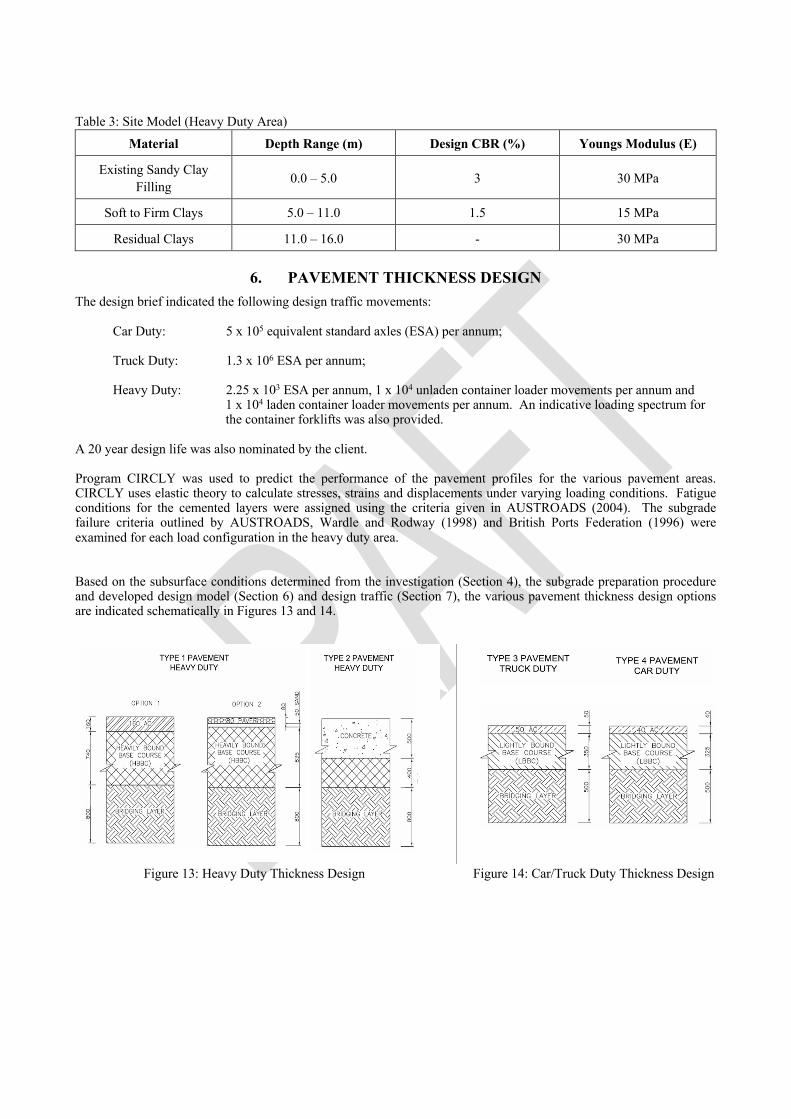
Table 3: Site Model (Heavy Duty Area) Material Depth Range (m) Design CBR (%) Youngs Modulus (E)
Existing Sandy Clay Filling 0.0 – 5.0 3 30 MPa
Soft to Firm Clays 5.0 – 11.0 1.5 15 MPa
Residual Clays 11.0 – 16.0 - 30 MPa
6. PAVEMENT THICKNESS DESIGN The design brief indicated the following design traffic movements:
Car Duty: 5 x 10⁵ equivalent standard axles (ESA) per annum;
Truck Duty: 1.3 x 10⁶ ESA per annum;
Heavy Duty: 2.25 x 10³ ESA per annum, 1 x 10⁴ unladen container loader movements per annum and 1 x 10⁴ laden container loader movements per annum. An indicative loading spectrum for the container forklifts was also provided.
A 20 year design life was also nominated by the client. Program CIRCLY was used to predict the performance of the pavement profiles for the various pavement areas. CIRCLY uses elastic theory to calculate stresses, strains and displacements under varying loading conditions. Fatigue conditions for the cemented layers were assigned using the criteria given in AUSTROADS (2004). The subgrade failure criteria outlined by AUSTROADS, Wardle and Rodway (1998) and British Ports Federation (1996) were examined for each load configuration in the heavy duty area. Based on the subsurface conditions determined from the investigation (Section 4), the subgrade preparation procedure and developed design model (Section 6) and design traffic (Section 7), the various pavement thickness design options are indicated schematically in Figures 13 and 14. Figure 13: Heavy Duty Thickness Design Figure 14: Car/Truck Duty Thickness Design

7. CONSTRUCTION
Construction commenced in April 2006 and was completed in May 2008. DP provided ongoing design support which included re-analysis and re-design of the car duty and truck duty area to include additional engineered fill to that which was originally envisaged and full time presence of soils technicians during fill placement (Level 1 compaction and testing), which included over 1400 density tests. Figure 15: Placement of slag bridging layer Figure 16: Density testing of pavement formation
8. SUMMARY
The Port Kembla project required DP to summarise significant quantities of data to develop simplified site models for analysis purposes. Once developed, these models could easily be coupled with the clients design brief to deliver cost-effective pavement design options. The site conditions meant that construction would be a challenge and as such, design needed to consider that potential problems that may arise. In this regard, the use of slag was not only an environmentally-conscious decision (ie: re-using a by-product of the steel making process) but a practical one (due to close proximity of the product to the site). Therefore, slag products could be delivered to site within reasonable timeframes.
9. ACKNOWLEDGMENTS The authors would like to thank Port Kembla Port Corporation, AAT Port Kembla, Fielder Engineers and Mainland Civil for the opportunity to be involved in the Port Kembla Multi-Purpose Berth Expansion Project.
Figure 17: Conceptual layout of the Port Kembla Inner Harbour expansion

10. REFERENCES
1. AUSTROADS, "A Guide to the Structural Design of Road Pavements", (2004) Austroads Incorporated 2. Bowman, H. N (1974), Geology of Wollongong 1:50 000 Geological Series Sheet 9029-11, NSW Geological
Society of NSW Dept of Mines 3. British Ports Federation (1996), "The Structural Design of Heavy Duty Pavements for Ports and Other
Industries" 4. Hazelton, P. A & Tille, P. J The Soil Landscapes of the Wollongong 1:100 000 Sheet Soil Conservation Service
of NSW (1990) 5. MINCAD Systems CIRCLY 5 Users Manual (2004) 6. Rodway, B & Wardle, L. J Layered Elastic Design of Heavy Duty and Industrial Pavements (1998),
www.mincad.com.au/AAPA98/AAPA98f.htm