cat user guide
TRANSCRIPT

Channel Analysis Tool
(CAT)
User Guide
PulsON® 400 CAT 1.0.3
320-0303C
March 2014
TIME DOMAIN®
Cummings Research Park 4955 Corporate Drive Suite 101 Huntsville, AL 35805 USA
http://www.timedomain.com Tel: +1 256.922.9229 +1 888.826.8378 Fax: +1.256.922.0387

2 CAT User Guide
For more information, please visit www.timedomain.com.
Copyright All rights reserved. Time Domain® 2001-2014. All rights reserved.
Trademarks Time Domain®, PulsON®, and “PulsON Triangle” logo are registered trademarks of Time Domain. Ethernet® is a
registered trademark of Xerox Corporation. Microsoft® and Windows XP®, Windows Vista®, Windows 7®, Windows
8®, and ExcelTM are registered trademarks of Microsoft Corporation. MATLAB® is a registered trademark of MathWorks,
Inc. Any trademarks, trade names, service marks or service names owned or registered by any other company and used in
this manual are the property of its respective company.
Rights Rights to use this documentation are set forth in the PulsON Products Terms and Conditions of Sale.

CAT User Guide 3
For more information, please visit www.timedomain.com.
Table of Contents 1. Introduction ...................................................................................................................... 4
2. Before You Begin ........................................................................................................... 5
3. Connecting ...................................................................................................................... 5
4. Configuration Tab ........................................................................................................... 9
4.1 Commands Section .................................................................................................................... 9
4.2 Parameter Settings ................................................................................................................... 11
4.3 Communications Statistics ...................................................................................................... 15
5. Waveform Plotting ........................................................................................................ 17
6. Status Info Tab ............................................................................................................. 19
7. Logging Tab .................................................................................................................. 21
Appendix A: Using CAT and MATLAB to Compute Channel Impulse Responses .... 23
Appendix B: CAT Logfile Format ....................................................................................... 31
Appendix C: Relationship Between Transmit Gain and Transmit Power .................... 32
Appendix D: Operation at Elevated Temperatures ......................................................... 34
Appendix E: Acquisition, Data, and Waveform Pulse Integration Index ...................... 35

4 CAT User Guide
For more information, please visit www.timedomain.com.
1. Introduction
The Channel Analysis Tool (CAT) is a Microsoft Windows-based Graphical User Interface (GUI)
that allows the users to configure and operate Time Domain’s PulsON® 400 (P400) or PulsON 410
(P410) Ultra Wideband (UWB) RF platforms such that the user can generate, capture, display, and
log UWB RF waveforms as they propagate through an RF Channel. In the process, CAT will also
calculate, display, and log a variety of communications statistics associated with the transmissions.
Logged waveforms are stored as .csv files compatible with a variety of software tools such as Excel
and MATLAB. A sample waveform, or scan, captured by CAT is displayed below in Figure 1.
Fig. 1: Sample waveform captured using CAT (relative strength vs. time in nanoseconds)
These waveforms typically have two main uses:
One can capture a large body of waveforms in a wide variety of environments and use that
data base to create communications channel models.
By analyzing the received waveforms in real time, one can implement a bistatic or multistatic
radar.
CAT has been designed to operate with any of the PulsON 400 family of UWB RF platforms. As of
this date the family consists of the P400 and P410. These platforms can be used as radios that
measure range or as radars. Consequently, users may be accustomed to referring to the UWB
platform as a P400, a P410, a P4x0, a radio, a ranging radio, or radar. Some users are familiar with
the platform as a Monostatic Radar Module (MRM) or as a Ranging and Communications Module
(RCM). This wealth of names can be confusing. With that in mind, this document will refer to the
UWB RF platform as a “radio” or occasionally, a “node.”
To aid in the development of channel models, Time Domain provides sample MATLAB code
(CATCIR) which can be used to convert the logged waveforms into Channel Impulse Response (CIR)
information. This conversion is accomplished using the CLEAN algorithm. Basically, CATCIR
deconvolves the received waveform with a template transmitted waveform. The process for
generating CIRs from logfiles is described in Appendix A.

CAT User Guide 5
For more information, please visit www.timedomain.com.
To aid in the development of bi- and multistatic radars, CAT enables the user to capture, log, and
post-process bistatic radar scans.
While CAT is a fine aid for developing models and multistatic radars, it is likely that at some point
the user may need to develop a custom interface for driving the UWB platform and monitoring
results. Time Domain enables customization by providing a published definition of the command
structures, messages and responses that govern operation of the interface. The document is called the
CAT API Specification. Furthermore, Time Domain offers sample C and MATLAB code to drive the
interface from a Host computer.
CAT comes as an “.msi” installation executable which, when unbundled, will load the software and
USB drivers and create a link on the Desktop. The default location for CAT is in the directory:
C:/Program files (x86)/Time Domain/Channel Analysis Tool (CAT)
For instructions on the installation and initial use of CAT, see the CAT Quick Start Guide.
More than one copy of CAT can be run on the same PC. Each copy can be connected to a different
radio through an Ethernet hub or through multiple USB and serial connections.
2. Before You Begin
Make sure that the Radio is powered up and that the LEDs on the Ethernet connector (if present) are
illuminated and that the board mounted LEDs are blinking properly. (The light green LED should be
blinking at approximately 10 Hz and the yellow LED should be blinking at 1 Hz.)
When using the USB interface, simply connect the USB cable to both the Radio and the Host
computer.
When using Ethernet, you should first verify the TCP/IP properties of your PC. The PC is typically
configured with static IP 192.168.1.1, subnet mask 255.255.255.0. Please see the CAT Quick Start
Guide for detailed instructions. Next, connect to the Radio with a crossover Ethernet cable or use an
Ethernet hub. If the LEDs are ON and initial connection doesn’t work, try sending a PING command
to the Radio IP address from a terminal window. The IP address is initially set at the factory to
192.168.1.100 and a label to this effect can be found on the Radio’s Ethernet connector. This will
confirm that the Radio can communicate with the PC.
3. Connecting To launch CAT, double-click on the desktop CAT icon shown in Figure 2-A. When launching CAT,
a Connect pop-up window will be displayed querying the user for the local Radio’s IP address, USB
connection, or serial connection. The actual display shown will depend on whether the connection is
made to the Radio using an Ethernet, USB, or serial connection. Example screens are shown in
Figure 2-B.

6 CAT User Guide
For more information, please visit www.timedomain.com.
Fig. 2-A: CAT Icon installed on Desktop
Fig. 2-B: Ethernet connection screen (left) and USB connection screen (right)
Connecting with Ethernet: To verify Ethernet connection to the Radio, enter the Radio’s IP
Address and click the Connect! button. (The IP address is 192.168.1.xxx where “xxx” is the number
written on the top of the P400 Ethernet connector). CAT will attempt to verify connectivity to the
Radio by sending a CAT_GET_CONFIG_REQUEST (see CAT API Specification) to that address.
This message will be sent up to three times. If CAT is successful in connecting with a Radio, then
CAT will transition to the Configuration Tab window (described in Section 4). The Configuration
window will show “Connected” in the bottom left-hand corner and will also display the Node ID of
the Radio. CAT controls are now enabled allowing the user to send commands to the Radio.
If the Radio does not respond after the third attempt, CAT will indicate the connection was
unsuccessful by reporting the connection status as “Disconnected” and indicating a “Timeout Error.”
This is illustrated in Figure 3. At this point, the user should verify that the network settings are
correct and ensure that your Radio is powered on and the LEDs are properly illuminated. (See
Section 2 for details).

CAT User Guide 7
For more information, please visit www.timedomain.com.
Fig. 3: This window will appear if the Radio fails to connect
Connecting with USB: To verify USB connection to a Radio, click on the USB button and make
note of the the com port/unit serial number from the drop down window. If CAT is connected, then
clicking on “Connect” will transition to the main window with the Configuration Tab selected. The
Configuration window will show “Connected” in the bottom left-hand corner and also display the
Node ID of the Radio. CAT controls are now enabled allowing the user to send commands to the
Radio.
Connecting with Serial: While CAT does support communications with a P4xx, the
communications rate using this link is very slow. Unless there is a special need to use a serial
interface, this communications method should be avoided.
To verify Serial connection to a P4xx, click on the Serial button and select the com port/unit serial
number from the drop down window. If CAT is connected through a serial cable to the P4xx, then
clicking on Connect! will transition to the main window with the Configuration Tab selected. The
Configuration window will show “Connected” in the bottom left-hand corner and also display the
Node ID of the P4xx. CAT controls are now enabled, allowing the user to send commands to the
P4xx.
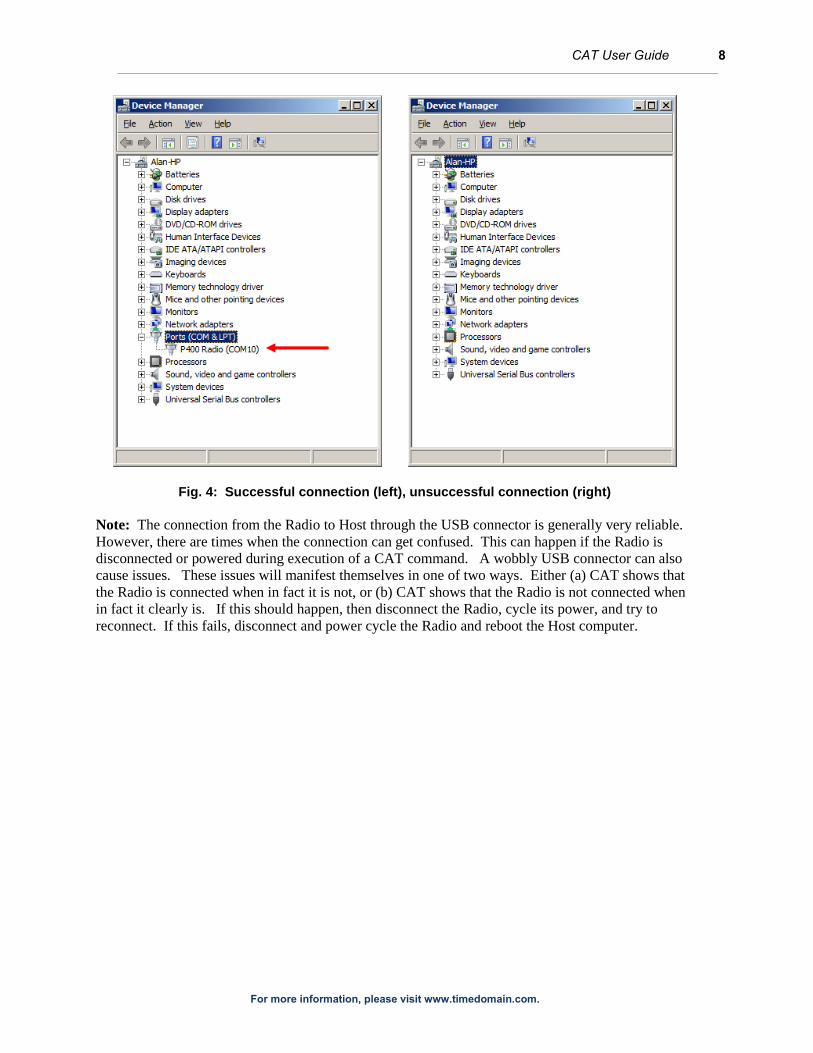
If there are connection issues, then open the Device Manager (Windows Start Button/Control
Panel/Device Manager) and confirm that the computer actually registers connection to your USB
Host Port. The screen shot shown on the left side of Figure 4 confirms that the COM10 is actually
connected to the computer. The screen shot on the right indicates that no connection exists between
the Host and the Radio. Once these parameters are verified, the user can attempt to connect by
selecting the “Connect” button.
8 CAT User Guide
For more information, please visit www.timedomain.com.
Fig. 4: Successful connection (left), unsuccessful connection (right)
Note: The connection from the Radio to Host through the USB connector is generally very reliable.
However, there are times when the connection can get confused. This can happen if the Radio is
disconnected or powered during execution of a CAT command. A wobbly USB connector can also
cause issues. These issues will manifest themselves in one of two ways. Either (a) CAT shows that
the Radio is connected when in fact it is not, or (b) CAT shows that the Radio is not connected when
in fact it clearly is. If this should happen, then disconnect the Radio, cycle its power, and try to
reconnect. If this fails, disconnect and power cycle the Radio and reboot the Host computer.

CAT User Guide 9
For more information, please visit www.timedomain.com.
4. Configuration Tab
Successful connection to a Radio brings up the Configuration Tab showing the device’s current
configuration parameters. The parameters are divided into three general groupings: Commands,
Parameter Settings, and Communications Statistics (See Figure 5). This tab provides the user with
an easy method for reading and writing the configuration parameters.
Fig. 5: Configuration Tab showing the default factory settings
To determine the current version of CAT, right click on the upper title bar and select “About CAT.”
A popup window will appear displaying the current CAT version.
4.1 Commands Section
Set Configuration: The user can alter the default configuration by adjusting the parameters and then
clicking the Set Configuration button. In order for the new values to be downloaded to the Radio,
the user MUST click the Set Configuration button. Otherwise, the parameters used by the Radio will
not match the parameters on the screen. This will lead to confusion and frustration. As a reminder,
any time the user changes a parameter value, the Set Configuration button will turn yellow. It will
remain yellow until the button is clicked.
CommunicationsStatistics
Commands
ParameterSettings

10 CAT User Guide
For more information, please visit www.timedomain.com.
Persist Flag: To make these changes last through the next time the Radio is powered down, the user
must also set the Persist flag to “1-Write to Flash.” If the Persist Flag is set to a 1, then any time the
Set Configuration button is clicked, the configuration parameters will be stored in non-volatile
memory. The parameters will then be saved if the Radio is powered down. If the user does not want
the changes to last through a power down, then the user must be sure to set “Write to Flash” to a zero.
Get Configuration: To view the current Radio values or to confirm that the requested changes were
made, click on Get Configuration.
File Operations - Load: To load the settings from an existing file, click on the Load button and then
browse to the directory that contains the desired file.
File Operations - Save: To save the current settings for future use, click on the Save button. CAT
will prompt the user with a standard Windows File-Open dialog window. Start/Stop Radio: This button and the colored Status Indicator Light to the right of the button are
linked. The button allows the user to start and stop the Radio and the Status Indicator Light reports
the Radio’s state of operation. When Start Radio is clicked, it will cause the Radio to perform the
action requested in the Node Operation field and will then change the button’s name to Stop Radio.
Clicking the button will also disable all of the parameter entry fields. If the user wishes to change
parameters, it will be necessary to stop the radio. Table 1 indicates the relationship between the
Start/Stop Radio button, the Node Operation setting, the Radio’s Activity state, and Status Indicator
Light.
Start Radio
Button Indicates
Node Operation
Parameter
Radio Activity Status Indicator
Light
Start Radio Not relevant Not connected to
P400/P410
Gray
Start Radio Not relevant Connected to P400/P410
but neither transmitting
or receiving
Black
Stop Radio Transmit Transmits packets Green
Stop Radio Receive Searching for packets but
unable to detect any
Yellow
Stop Radio Receive Receiving packets Green
Stop Radio Ambient Sampling Receive is measuring
background receive level
Green
Table 1: Relationship between Start Button, Radio Activity, and Status Indicator Light
Finally, the Node Operation may also show Idle. This means that the unit is neither Transmitting or
Receiving. Clicking Start Radio when Idle is showing has no meaning.
Show Plot: This button brings up the plot screen shown in Figure 1. The procedure to capture and
display waveforms is described in Section 5.
Disconnect: Clicking this button will disconnect CAT from the Radio and bring up the Connect
window (see Figure 2-B), thereby allowing the user to connect to a different Radio.

CAT User Guide 11
For more information, please visit www.timedomain.com.
Exit: Clicking this button will exit CAT. Alternatively one can exit CAT by clicking on the X
button in the upper right corner of the window.
4.2 Parameter Settings
This subsection describes the various CAT parameter settings and is subdivided into the following
categories: Hardware Settings, Acquisition Settings, Data Settings, Receive Settings, Transmit
Settings, and Waveform Capture Settings. It is important to note that any settings that define
transmission characteristics (such as Acquisition Index, Waveform Capture Start location, etc.) MUST
be common to both the transmit unit and the receive unit. If there is a mismatch between the two,
then the receiver will not be able to properly acquire the transmissions, process the received
information, or produce waveforms.
One easy way to avoid mismatches is to load the same default configuration file information into both
units and then modify the setting such that one unit transmits and the other unit receives.
Hardware Settings
Node ID: The unit’s Node ID is normally established at the factory and written somewhere on the
Radio hardware. Typical spots for such labeling are the Ethernet connector (if present) or the shield.
The user can change the Node ID by entering a new value in the Node ID field and clicking on Set
Configuration. Once this is accomplished, the user is advised to properly record this change on the
hardware.
Node Operation: This indicates the operating state of the radio. The user can set this field to one of
the following three states: Transmit, Receive, or Ambient Scan. When the user subsequently clicks
the Start Radio button, the Radio will then enter this identified state.
Antenna Mode: Table 2 indicates the four supported antenna modes.
Field Entry Result
Antenna A Transmit and Receive on Antenna A
Antenna B Transmit and Receive on Antenna B
TX on A, RX on B Transmit on Antenna A, Receive on Antenna B
TX on B, RX on A Transmit on Antenna B, Receive on Antenna A
Table 2: Antenna Configuration
Code Channel: Selects the Code Channel used for transmitting or receiving. To properly
communicate, both the transmitting and receiving Radios must be operating on the same Code
Channel. When operating two or more Radios in the same vicinity, the user must take care to ensure
that different pairs of units are operating on different code channels, otherwise they can interfere with
each other. Code channels are numbered from 0-255. The user should limit his selection to values
between 0 and 6 inclusive. Code channel values greater than 6 are reserved for special applications.
Use of code channel numbers greater than 6 should only be done at the recommendation of Time
Domain’s technical support team. Using an invalid code channel number can cause unpredicable
results.

12 CAT User Guide
For more information, please visit www.timedomain.com.
Transmit Gain: When set to zero, the unit will transmit at the minimum power supported by the
Radio. Setting the transmit gain to a value of 63 will set the unit to maximum transmit power. The
default setting is 44. This value has been chosen because it is approximately the maximum FCC
transmit power for a standard P410. When operating a P400 or a P410 equipped with optional power
amps, a Transmit Gain setting of zero will approximate the maximum FCC transmit power.
Appendix C documents the relationship between transmit gain setting and transmit power for the
three different configurations.
Power Up State: This is the state in which the Radio will operate when it is powered up. Three
choices are possible and are summarized in Table 3.
Power Up State Action on Power Up
Transmit The unit will boot and immediately start transmitting
using the parameters that were last downloaded.
Receive The unit will boot and immediately start receiving
using the parameters that were last downloaded.
Idle The unit will boot, it will be in the requested transmit
or receive state but the radio will not be started. It
will then await user instructions.
Table 3: Power Up States and resultant action
Acquistion Settings
Acq Index: Acquisition Pulse Integration Index (PII) determines the operating range at which
transmissions can be acquired. The higher the value, the longer the operating range. Available values
are 5 through 11. For a complete discussion of Pulse Integration, see Appendix E.
Acq Threshold: This button has two values: Auto and Manual. If set to Auto, the Radio will
determine the threshold for receiving signals. This is the preferred operating condition and the user
should routinely use this setting.
If set to Manual, then the user can select a threshold setpoint. Because the current thresholding
algorithm is quite good, there is little value in the user selecting a threshold. However, there might be
occasional reasons for the user to set a threshold. To set the threshold, the user should select a value
that is a fraction of the largest signal in the scan. For example, the waveform shown in Figure 6 has a
maximum value of about 15,000. Setting the threshold to a number greater than 15,000 will result in
no packets ever being received because the largest received signal is less than the threshold. Setting
the threshold to a value less than 15,000 will guarantee that some of the packets are acquired. The
higher the threshold, the higher the probability that the received signal will have a high Signal to
Noise ratio (SNR). However, the probability of dropped packets will increase. Setting the threshold
to a low value will guarantee that the packet rate will be high, but the SNR of the received packet
could be quite low.
Threshold Setpoint: This is the threshold setting used if Acq Threshold is set to Manual. The user
will very rarely have need to use this capability.

CAT User Guide 13
For more information, please visit www.timedomain.com.
Acq PRI (ns): This is the pulse repetition interval (PRI), measured in nanoseconds, between
individual RF pulses transmitted in the acquisition portion of the transmitted packet. This parameter
is a function of the selected Code Channel and typical has a value of approximately 100 ns.
Acq (µs): This is the amount of time, in microseconds (µs), allocated for the packet acquisition
header. It is a function of the selected Acq Index and Code Channel. This duration constitutes most,
but not all, of the communications overhead.
Data Settings
Auto Integration: This button determines if the Data Index: Integration (or Data Pulse Integration
Index) will be determined automatically or by the user. If auto is selected, then CAT will
automatically set the integration to one PII index value lower than the Acquisition Index. If Auto
Integration is not set, then the user can selected a Data Index less than or equal to the Acq Index.
This capability allows the user to reliably acquire packets but then send the data with lower
integration, such that it reliably and repeatably generates bit errors for determination of Bit Error Rate
(BER) vs Eb/No. For additional details on integration, see Appendix E.
Index:Integration: This is the Data Pulse Integration Index (PII) selected automatically by CAT or
defined by the user. See previous discussion of Auto Integration for additional details.
Data Type: This drop-down window determines if the data sent will be all ones, all zeros, or will be
sent with a predefined pattern for computation of BER.
Payload PRI (ns): This is the pulse repetition interval, measured in nanoseconds, between individual
RF pulses transmitted in the payload portion of the RF packet. This parameter is a function of the
selected Code Channel and typically has a value of approximately 100 ns.
Payload (µs): This is the amount of time, in microseconds, allocated for the payload portion of the
transmitted RF packet. It is a function of the selected Data Index: Integration (Data PII), the size of
the data to be sent, and the Payload PRI.
Receive Settings
From Buttons (Any or Node): This button determines whether the receiver will process packets
received from any transmitting node or only from a specifically designated node.
Node Number: If the Node button is selected, then this numeric field will be accessible to the user.
The user should enter the node number of the Radio from which packets are to be received. The
Radio will then acquire packets as usual, but will terminate acquisition for any packet not sent from
the intended source. (Note: this feature is not enabled at this time. The radio is currently always in
the “Any” state regardless of the state of the Node button or the node selected. This will be enabledin
the next release.)
Transmit Settings

14 CAT User Guide
For more information, please visit www.timedomain.com.
Packets to Send (Count & Continuous Buttons): By using these buttons the user can determine
whether (a) a specific number of packets will be transmitted, or (b) packets will be sent continously.
Count Field: If the user selects Count, then the field immediately to the right of the Count button
will become available and the user can select a number between 1 and 10,000.
Packet Size (Words): This is the number of 32 bit data words that will be sent in a transmitted
packet. Available values are 0-1000.
Inter Packet Delay (ms): This is the delay in milliseconds between the transmissions of a packet.
Available values are 0 to 10,000.
Waveform Capture Settings
The Radio can capture, display, and log waveforms. These waveforms will have a starting and
ending point relative to the radio lock spot. The lock spot is a specific point on the received
waveform. Any zero crossing is a candidate lock spot. The Radio has been designed to find a zero
crossing close to one of the largest amplitude signals. For example, any of the points marked in
Figure 6 with a red circle are likely (and desirable) lock points. However, it is possible that the
Radio will occasionally lock on a signal distant from the leading edge (for example, the green point at
3.5 ns). While this is a very unusual occurrence, it does happen from time to time. Unless the signal
is unusually strong, the radio will have difficulty maintaining lock on such a weak signal and will
likely drop the packet.
Figure 6: Sample captured waveform showing potential radio lock spots
There are two ways in which the lock spot can be immediately located. The lock spot is always at
nanosecond #0 and it is marked with a vertical gray line.
Start (ns): Beginning point of a captured waveform in nanoseconds relative to the Radio lock spot.
A negative value will start the waveform prior to the lock spot. A positive value starts the waveform

CAT User Guide 15
For more information, please visit www.timedomain.com.
after the lock spot. The maximum number of measurement points in a scan is 4094. When using a
step size of 32 (one measurement every 61 ps), the user may select Start and Stop values between -
100 ns and +100 ns. For a step size of 64, the Start and Stop values can be between -200 ns to + 200
ns. Similary, for step sizes smaller than 32, the Start and Stop values will be reduced by half each
time the step size is reduced by half. The user should take care to ensure that the starting point is
smaller/earlier than the ending point.
Stop (ns): Stopping point of a captured waveform in nanoseconds relative to the Radio lock spot. A
negative value will set the stopping point on the waveform prior to the lock spot. A positive value
stops the waveform after the lock spot. The maximum number of measurement points in a scan is
4094. When using a step size of 32 (one measurement every 61 ps), the user may select Start and
Stop values between -100 ns and +100 ns. For a step size of 64, the Start and Stop values can be
between -200 ns to + 200 ns. The user should take care to ensure that the starting point is
smaller/earlier than the ending point.
Because of the manner in which the receiver works, the time between the starting and stopping point
will be in increments of 5.8 ns. The Radio will round the user’s Stop point to reflect this limitation.
Step (bins): This is the amount of time between measurements in a scan. A bin is approximately
1.9073 ps in duration. The standard amount of time between readings is 32 bins, or approximately
61.035 ps. This setting is rather coarse, but should be sufficient for most applications because the
sampling rate is approximately twice the Nyquist rate. Alternate step sizes can be selected from the
drop-down menu.
It is important to note that the receiver architecture has been optimized to take waveform
measurements at the 61 ps (32 bin) spacing. Selecting an alternate spacing will dramatically increase
the amount of time necessary to collect a given scan. Selecting 64, 128, or 256 will reduce the rake
efficiency by 50% and double the time required to collect a scan. Selecting any other value will
reduce the rake efficiency by about 88% and thus increase the time required to collect a scan by a
factor of 12.
Integration Factor : This value defines the Pulse Integration Index (PII) to be used in collecting the
waveforms. For a discussion of PII, see Appendix E. This value is shown as a factor of Data
Integration. For example, if Data Integration is set to PII 6, and Integration Factor is set to 2x, then
the Waveform Capture Integration Index will be set to PII 7.
Index:Integration: This field is computed by CAT and shows the Waveform Capture Integration
Index selected by the user.
4.3 Communications Statistics
CAT will compute and report a variety of communications statistics. These include Receive Statistics
(such as BER), Transmit Statistics (such as the number of Transmitted Packets), and Hardware
Statistics (such as Run Time). All of these statistics can be be reset by the user by clicking on the
Reset Statistics Button. CAT will automatically reset all of these statistics whenever the Start Radio
Button is clicked.
These statistics are described below.

16 CAT User Guide
For more information, please visit www.timedomain.com.
Receive Statistics
Bit Error Rate: This is the total number of bit errors divided by the number of bits that were
received. It is expressed in scientific notation.
Bit Errors: The total number of bit errors that have occurred since the statistics were last reset. This
computation assumes that the transmitted Data Type is set to “BER.” Bit errors are computed based
on a comparison of the received bits with the BER pattern. Bits associated with totally missed
packets are not included in the total. However, a partially received packet will be considered
completely received if it is successfully acquired. If the packet is subsequently dropped in the middle
of the data packet, the radio will continue to demodulate the “received” signal. Since the “signal”
received after the packet is dropped is entirely noise, the receiver will report a large burst of errors.
Rx Total Bits: The total number of bits that were received since the statistics were last reset.
Rx Data Rate: This is the total number of bits that have been received since the statistics were last
reset divided by the time since the statistics were reset. Note that time includes: packet acquisition
time and packet overhead; Inter Packet Delay; time associated with packets that were dropped; and
time when the receiver was receiving but the transmitter had not yet been started.
Rx Packets: The total number of packets that have been received since the statistics were last reset.
Dropped Packets: The total number of packets that have been missed since the statistics were last
reset.
Packet Error Rate: The packet error rate (PER) is the number of incorrectly received data packets
divided by the total number of received packets. A packet is declared incorrect if it is either missed in
its entirety or at least one bit is in error.
Eb/No: The ratio of the energy per bit to the noise power spectral density expressed in dB. Time
Domain will sometimes refer to this as SNR (Signal to Noise Ratio).
There are four important considerations when interpreting Eb/No.
First, Eb/No is calculated based on the measured noise and the measured signal strength. More
specifically, the noise and signal are calculated by measuring the 90 ns of signal prior to the lock spot
and the maximum signal within 9 ns after the lock spot. This means that Eb/No only has meaning if
the User sets Start = -90 and the Stop = 9. If other values are used, then Eb/No will still be reported
but will not be meaningful.
Second, since Eb/No is a function of integration and since the integration can be set differently for
Acquisition, Data, and Waveform Capture, each can have a different Eb/No. The reported Eb/No is for
the Data. Eb/No for Acqusition and Scanning can be calculated from the PII. Each difference in PII
is 3 dB. For example, if Eb/No is 18.0, Data integration is 6, Acquistion Integration is 9, and
Waveform Capture Index:Integration is 10, then:
Data Eb/No : 18.0
Acquisition Eb/No : 27.0 =3*(9-6)+18.0
Waveform Scan Eb/No : 30.0 =4*(10-6)+18.0

CAT User Guide 17
For more information, please visit www.timedomain.com.
Third, the strength of the signal is based on the measurement of the peak signal within 9 ns of the lock
spot. The lock spot is at a zero crossing and the signal demodulation point is the 64 ns (or one step)
to the right of the lock spot. If the lock spot is not adjacent to the peak lobe, then the demodulated
signal strength will be overstated.
Finally, RangeNet and RCM also report Eb/No. However, this value is associated with the
Acquisition PII, not Data. Therefore, an RCM link set identically to a default CAT link will report 3
dB higer Eb/No.
Transmit Statistics
Tx Total Bits: Total number of bits sent since the Start Radio button was last clicked.
Tx Data Rate: Total number of bits sent since the Start Radio button was last clicked divided by the
Run Time (see Hardware Statistics: Run Time). Note that Run Time includes acquistion time,
packet overhead, and the Inter Packet Delay time. Consequently, this is effective throughput and not
the raw data rate. Since Run Time is determined by the Windows OS, it could have an error of as
much as a second or two. To get an accurate Tx Data Rate, the user should run the test long enough
that errors in Run Time estimation are trivial compared to the desired data rate accuracy.
Tx Packets: The total number of packets sent since the Start Radio button was last clicked.
Hardware Statistics
Run Time: The number of seconds that have elapsed since the statistics were reset.
Temp: This is the temperature of the sensor located on the Radio printed circuit board (PCB). It is
updated approximately three times a second. This temperature is normally between 30-40o C. See
Appendix D for information on operation at elevated temperatures.
5. Waveform Plotting
Clicking Show Plot will cause the window shown below in Figure 7 to appear. The window will
appear regardless if the unit is transmitting or receiving. However, no further actions are possible
unless the window is associated with a Radio that is receiving.

18 CAT User Guide
For more information, please visit www.timedomain.com.
Figure 7: Basic waveform plot screen
If the window is assocated with a Radio that is receiving, then the waveforms can be viewed in one of
two ways. Clicking on the Get Single Scan button will cause one (and only one) waveform scan to
appear. Clicking on Start Scanning will cause waveform scans to appear as fast as possible. See
Figure 8 for an example waveform scan. The actual speed will be limited by the rate at which scans
are produced, the ability of the USB (or Ethernet, if present) communications link to transport the
signal from the Radio to the Host and the ability of the PC display software to update the screen.
While it is possible to overdrive any of these potential bottlenecks, operation of the system is
normally robust.
Figure 8: Typical waveform scan
CAT User Guide 19
For more information, please visit www.timedomain.com.
Display Options
Display: Lockspot: Clicking this button will cause the lock spot to be marked with a vertical gray
line that extends from the bottom of the scale to the top.
Display: Leading Edge: Clicking this button will cause the leading edge of the waveform to be
marked with a vertical green line that extends from the bottom of the scale to the top. The leading
edge is an approximate measure of the leading edge of the received waveform and does not mark the
leading edge with the same accuracy that one would get using Time Domain’s Ranging &
Communications Module (RCM) software.
Clamp Button (Lock Spot or Leading Edge): The user may choose to “clamp” the displayed
waveform either by the Lock Spot or by the Leading Edge. If the user chooses Lock Spot, then the x-
axis frame of reference will be fixed and subsequent waveforms will appear to “dance” as a function
of what lock spot the Radio selected. If the user choses Leading Edge, then the waveform and
leading edge will appear steady and both the scale and lock spot will dance as a function of thelock
spot the Radio selected.
Plot Controls
The scales are controlled using the left and right buttons on the mouse.
To vary the portion of the waveform in view, position the cursor anywhere in the plotting area, hold
the left button down and move the cursor to the left or right.
To change the x-scale, position the cursor anywhere in the plotting area, hold the right button down
and move the mouse to the left (compresses the scale) or the right (expands the scale).
To change the y-scale, position the cursor anywhere in the plotting area, hold the right button down
and move the mouse up (compresses the scale) or down (expands the scale).
6. Status Info Tab
When the Status Info tab is selected, CAT will issue a CAT_GET_STATUSINFO_ REQUEST and
update the table with hardware and software version information.
To update the information, the user can click the Get Status Info button. This is useful for uploading
software and hardware version numbers as well as measuring the Radio’s board temperature.
The following is a short description of the key parameters. For more information, see the CAT API
Specification.
Software Versions: Radios have four different software designations:
The software Package ID is the overall build version for the P4xx and encompasses all types
of software on the P4xx. When reporting issues to the factory, please reference this one
number. If N/A is displayed, then the other three designations should be reported.
Otherwise, the other three are irrelevant and at some time in the future they will likely be
deleted from the display and possibly the API.

20 CAT User Guide
For more information, please visit www.timedomain.com.
Embedded Software Version: the version of Radio application code running on the Radio
processor.
UWB Kernel Version: the version of the UWB software running on the Radio processor.
FPGA Version: the version of FPGA code running on the Radio.
Hardware Version: There are four hardware items of note: the Radio Model (P400 or P410), Board
Serial Number, Board revision, and Pulser Configuration (FCC/EU mask and TX power range).
BIT: “BIT” stands for “Built-in Test” and will return “0” under normal operation. A non-zero value
indicates some sort of failure. In the event of this failure, please contact Time Domain.
Temperature: This is the temperature of the sensor mounted on the PCB. This is not the ambient air
temperature. Because the Radio generates heat, the board will run hotter than the ambient. The
maximum operating temperature of many key components is 70o C. However, these boards have
been successfully run at temperatures approaching 100o C. No physical damage to the radio has been
observed when operating up to 100oC. While the unit may or may not function above 70
oC, our
experience to date indicates that when the temperature falls below 70oC the equipment will work
normally. Operating the equipment above 70oC cannot be guaranteed, is not recommended and
should be avoided.
The information on this tab (shown in Figure 9) is valuable for debugging purposes. For example, if
the P400/P410 should malfunction, then Time Domain’s product support team will likely ask for a
screenshot of this tab.
As embedded software/firmware is upgraded, this version info is used to assure host code
compatibility.

CAT User Guide 21
For more information, please visit www.timedomain.com.
Fig. 9: Status Info Tab
7. Logging Tab The Logging Tab (see Figure 10) is provided by CAT to support data collection and post-processing
analysis. The logfile is a comma-separated variable ASCII .csv text file. See Appendix B for more
information on the logfile format. Logfiles will be stored in the directory indicated in the “Directory”
field. The user may change the target directory by using the “Change” button to browse to the
desired location.
The logfile names are designated by the “Logfile Prefix” field. The user can change the name by
entering the desired prefix name in the ‘Logfile Prefix” field.
When the “Start Logging” button is clicked, CAT will add a three digit suffix number to the file
name. This name will be displayed on the screen. Each time the log is stopped and started, this
suffix number will be incremented. The Start Logging button can be clicked at any time. Once the
button has been clicked, all messages will be logged.
IMPORTANT: While logging will record all messages, no waveform scans will be logged unless
the Show Plot button on the Configuration Tab has been clicked AND the Start Scanning button is
clicked.
When the “Stop Logging” button is clicked, CAT will stop logging and the logfile will be closed.

22 CAT User Guide
For more information, please visit www.timedomain.com.
Clicking the “New Logfile” button will close the existing file, open a new logfile with an incremented
number, and continue logging. This can be accomplished in the middle of a scanning sequence
because clicking this button does not stop and restart the Radio; it merely redirects that data flow to a
new file.
Fig. 10: Logging Tab

CAT User Guide 23
For more information, please visit www.timedomain.com.
Appendix A: Using CAT and MATLAB to Compute Channel Impulse Responses
CAT is provided with MATLAB code which can take logfiles collected by CAT and process the
results into Channel Impulse Responses (CIRs). The MATLAB code will use the CLEAN algorithm
to deconvolve the received signal with a reference or template waveform. All of these operations are
performed in a batch process. The user collects waveform scans with CAT and then separately runs
the MATLAB script CATCIR. The host machine must have MATLAB Version 2011B and be
equipped with the Signal Processing Toolbox.
The MATLAB source code has been provided as it is assumed that the user will likely wish to make
modifications. The source code has good and bad characteristics. The key drawback is that the code
was originally developed 12 years ago and was modified by several different developers over the
course of 10 years. These programmers developed the code for a wide variety of unrelated analysis
tasks. Much of the inline documentation is scant. Some of the developers are no longer available.
As a result the code is not at all clean. Besides this document and the embedded comments in the
code, the MATLAB is currently not supported. No effort has been made to delete irrelevant or unused
code. In fact, the actual code used to produce the CIRs is only a small percentage of the total code
delivered with CAT.
On the positive side, the code was extensively used for propagation analysis and was both exercised
and validated. Furthermore, the code specifically used to produce the CIRs was reviewed and
revalidated, and the inline documentation was improved. The CIR code is well tested and the user
should not have issues either using the code as is or in modifying the core CIR code. While there is a
great deal of unused code, much of it is actually very useful for computing delay spread and other
important parameters. It is our expectation that the user will find the base code useful, easy to work
with and that the excess code will prove to be a valuable resource library.
The following sections describe how the user:
Installs CATCIR
Collects waveforms
Runs CATCIR
Interprets the results
Process Steps
1. Installing CATCIR
The CATCIR code is delivered on the installation disk and can be found in the folder entitled
“CATCIR Delivery Files”. The user should copy this directory to a place of his choosing on his
computer.
This directory has two sub-folders called “CATCIR” and “Log Files”. CATCIR contains a zip file
called CATCIR.ZIP. This file contains all of the MATLAB used to convert log files into CIRs. As a
24 CAT User Guide
For more information, please visit www.timedomain.com.
convenience to the user, the contents of the .ZIP file have already been moved into the CATCIR
folder. The folder “Log Files” contains some sample log files which the user can use to exercise
CATCIR for the first time.
2. Collecting waveforms
Before collecting waveforms or exercising the CATCIR program, it is recommended that the user
practice with and become proficient with the use of CAT and the Radios. In doing so, the user will
become familiar with how waveforms are captured and logged.
Once familiar with CAT and the hardware, the next step is to collect waveforms for a test. As a
reminder, while it is easy to collect hundreds of waveforms in a given location, there is generally no
reason to collect more than a few waveforms per location as waveforms collected at the same time
and in the same conditions are quite similar.
CATCIR makes some assumptions about the parameters used when collecting waveforms.
I. It assumes that the waveforms are collected using the following parameters:
Step Size: 32
Start (ns): -20
Stop (ns): 80
Note that these values correspond to the factory defaults.
II. When run, CATCIR will ask the user to point to the directory that contains the logfiles to be
processed into CIRs. The user will then be asked if the user wants all the files in the
directory processed or just the first one. The “first” file is the one that appears alphabetically
first. All of the waveforms captured in the logfile must have been collected using the same
parameters. If the user indicates that all files are to be processed, then all waveforms in all of
the files need to have been taken using the same parameters and the same type of radios.
There are three types of radios: P400, P410, and P410 with power amplifiers.
III. All files in the directory must contain at least one waveform scan. A logfile that contains no
scans will likely generate an error.
IV. All files in the directory must have been collected using the same parameters and with the
same type of radios.
3. Running MATLAB
When CATCIR runs, it will process the logfiles and generate graphics of the waveforms. The speed
at which CATCIR runs is a function of the processing capacity of your particular computer as well as
the capabilities of the video processor. If you ask to process “too many” logfiles, then the machine
could take a long time to finish or it may be overwhelmed and terminate improperly. This limit is a
function of your computer processing horsepower. You should have no trouble processing several
dozen, if not a few hundred, scans. Just be aware that there is a limit and it is important to be prudent
in the amount of files processed at one time.

CAT User Guide 25
For more information, please visit www.timedomain.com.
Steps to run the MATLAB script CATCIR:
I. Open MATLAB
II. In MATLAB, navigate to the directory where you have placed the CATCIR directory.
III. Select CATCIR and run it. You will be asked to navigate to the directory where the logfiles
to be processed are located. The following example was taken using the file “final catcir
test000.csv” located in the folder “Log Files” provided with CATCIR.
IV. Once you have selected the logfile directory, CATCIR will examine the logfiles in the
directory and confirm that they were all produced using the same parameters. It will then ask
if you wish to combine them. See Figure A-1. If you click on Yes, CATCIR will process
all of the waveforms in all of the logfiles. If you click on No, then CATCIR will process only
the first logfile. Note that the “Do not show this dialog again” box has been disabled.
Clicking or unclicking it has no effect on the program operation.
Fig. A-1: Combine screen
V. Once you have made your selection, CATCIR will prompt you to indicate what sort of radio
you were using to generate waveforms. See Figure A-2. This is important because each of
the radio transmit waveforms have slightly different shapes. Since the CIRs produced are
done so by deconvolving the received waveform with the transmitted waveform (or
“template” waveform), this step insures that the deconvolution is performed with the correct
transmit waveform.
Fig. A-2: Selection transmit waveform shape
Once again, the “Do not show this dialog again” button has no effect on the program’s operation.
VI. Once a selection has been made, CATCIR will run the selected the logfiles and will produce
the following figures:
Figure A-3 shows MATLAB Figure 1. It is blank and can be ignored.
26 CAT User Guide
For more information, please visit www.timedomain.com.
Fig. A-3: MATLAB Figure 1
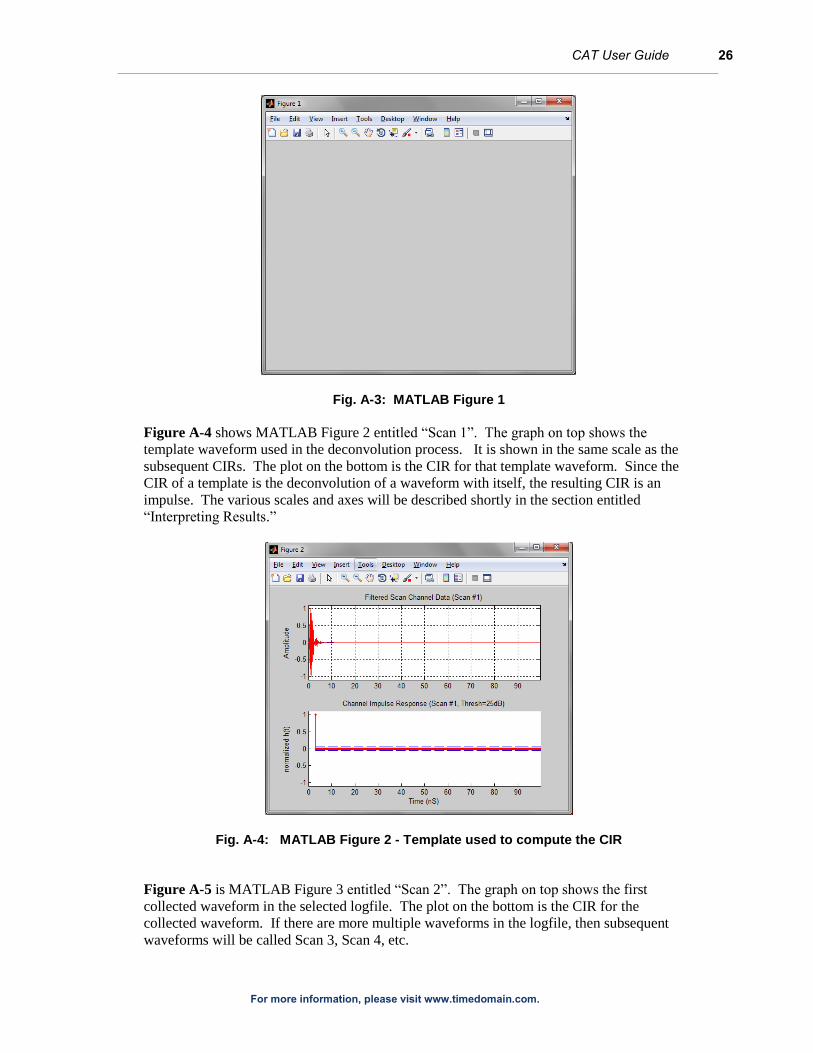
Figure A-4 shows MATLAB Figure 2 entitled “Scan 1”. The graph on top shows the
template waveform used in the deconvolution process. It is shown in the same scale as the
subsequent CIRs. The plot on the bottom is the CIR for that template waveform. Since the
CIR of a template is the deconvolution of a waveform with itself, the resulting CIR is an
impulse. The various scales and axes will be described shortly in the section entitled
“Interpreting Results.”
Fig. A-4: MATLAB Figure 2 - Template used to compute the CIR
Figure A-5 is MATLAB Figure 3 entitled “Scan 2”. The graph on top shows the first
collected waveform in the selected logfile. The plot on the bottom is the CIR for the
collected waveform. If there are more multiple waveforms in the logfile, then subsequent
waveforms will be called Scan 3, Scan 4, etc.

CAT User Guide 27
For more information, please visit www.timedomain.com.
Fig. A-5: MATLAB Figure 3 - CIR of the first captured waveform
The final MATLAB figure shown will be of the template waveform. This is the same
waveform shown in Figure A-4 except it is shown using a higher resolution time scale. See
Figure A-6. In this case the example data was taken using a P400 as a transmitter. Figures
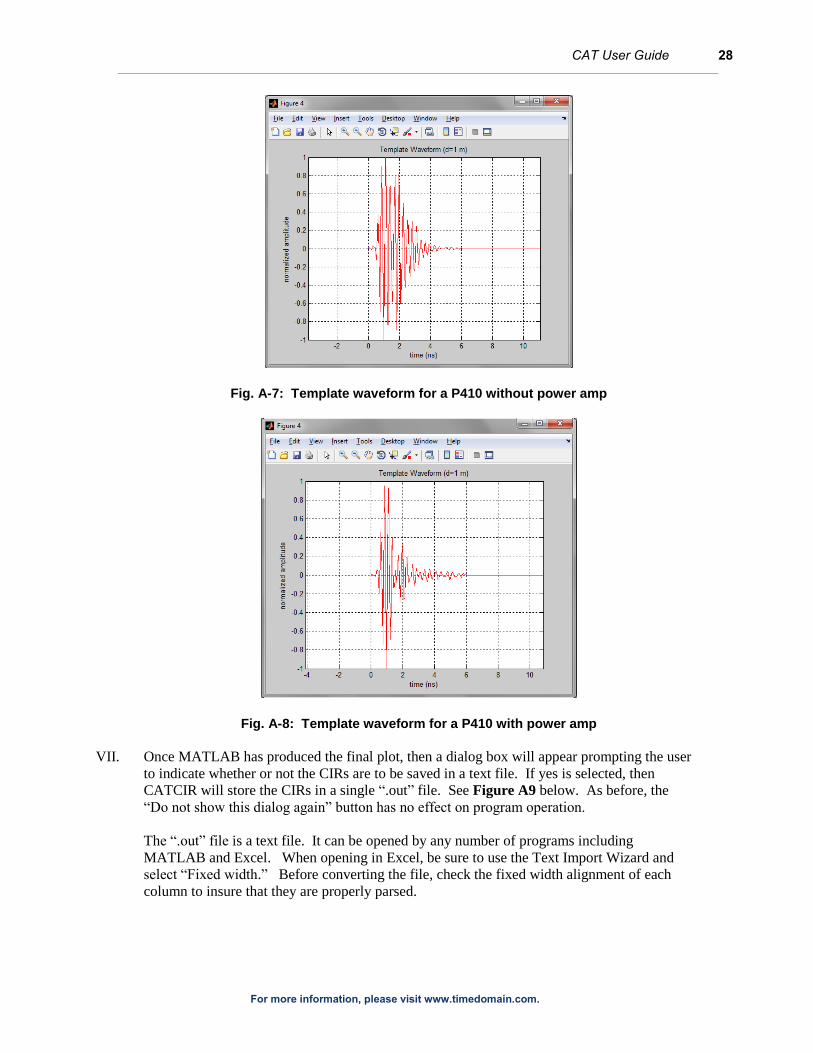
A-7 and A-8 show the templates for a P410 and a P410 with power amps.
Fig. A-6: Template waveform for a P400 with power amp
28 CAT User Guide
For more information, please visit www.timedomain.com.
Fig. A-7: Template waveform for a P410 without power amp
Fig. A-8: Template waveform for a P410 with power amp
VII. Once MATLAB has produced the final plot, then a dialog box will appear prompting the user
to indicate whether or not the CIRs are to be saved in a text file. If yes is selected, then
CATCIR will store the CIRs in a single “.out” file. See Figure A9 below. As before, the
“Do not show this dialog again” button has no effect on program operation.
The “.out” file is a text file. It can be opened by any number of programs including
MATLAB and Excel. When opening in Excel, be sure to use the Text Import Wizard and
select “Fixed width.” Before converting the file, check the fixed width alignment of each
column to insure that they are properly parsed.

CAT User Guide 29
For more information, please visit www.timedomain.com.
Fig: A-9: Template waveform for a P410 with power amp
4. Interpretation of the results
Consider again Figure A-5, reproduced below as Figure A-10.
Fig. A-10: Example Channel Impulse Response (CIR)
The upper plot shows two traces, one in blue and the second in red. The blue trace is the original raw
data. We will discuss the red trace more in a moment.
The lower plot shows the resultant CIR plot. The x-axis is time in nanoseconds, while the vertical
scale shows the magnitude of the CIR relative to the first arriving signal. A negative magnitude
indicates that the received signal has been inverted relative to the template. Note that one can clearly
see the reflections at 20 and 32 ns as well as a relatively large number of smaller ones. The
deconvolution process is not applied to every data point in the received scan. Instead the
deconvolution process has a 10% threshold. If the input signal is less than 10% of the main signal
then it is considered too small for reliable analysis and is ignored. This threshold is shown on the
lower plot as a dashed blue line.
Let us return now to the upper plot. The red line was created by convolving the channel impulse
response from the lower plot with the original template waveform. From this we can see that the
reconstructed waveform matches the original waveform. This serves as a quick visual confirmation
that the computation was executed properly. Any differences are likely an indication of the

30 CAT User Guide
For more information, please visit www.timedomain.com.
imperfections in the signal processing. Perhaps an improved CLEAN algorithm would further
improve the match. Then again, much of the difference between the red and the blue line might also
be the result of random noise variation.
Note also that the red line does not completely cover the blue line. These gaps are the result of the +/-
10% threshold imposed on the deconvolution process.
CAT User Guide 31
For more information, please visit www.timedomain.com.
Appendix B: CAT Logfile Format
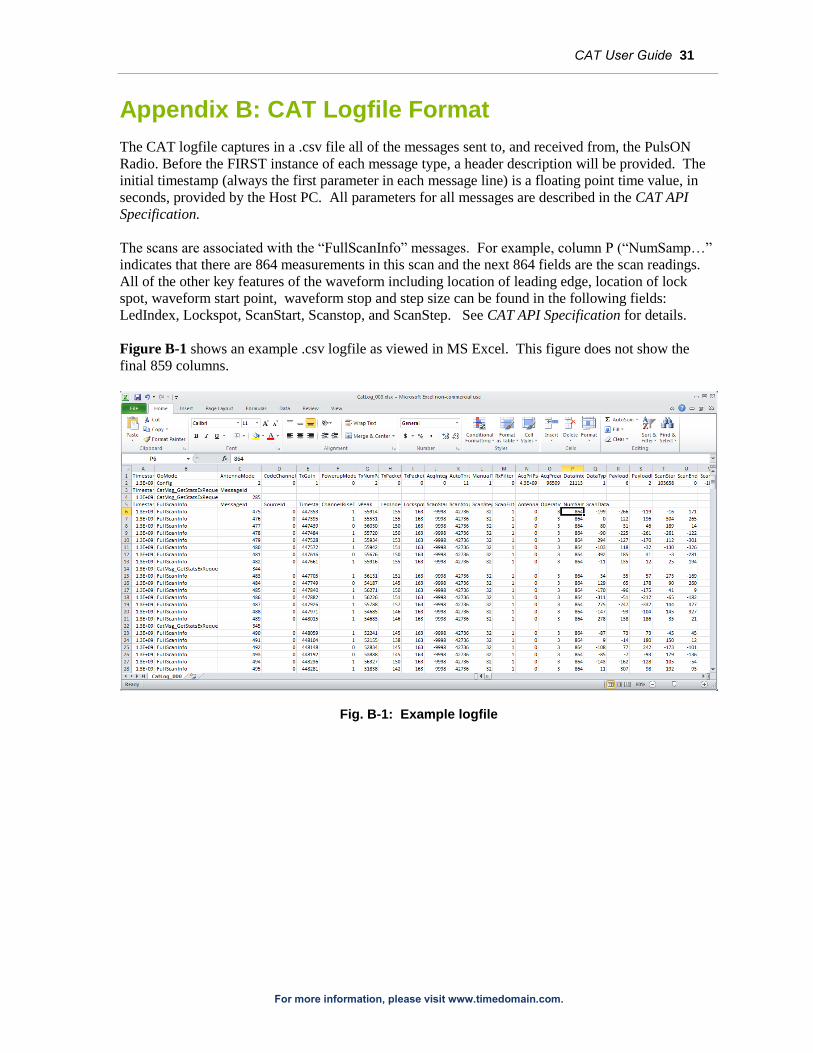
The CAT logfile captures in a .csv file all of the messages sent to, and received from, the PulsON
Radio. Before the FIRST instance of each message type, a header description will be provided. The
initial timestamp (always the first parameter in each message line) is a floating point time value, in
seconds, provided by the Host PC. All parameters for all messages are described in the CAT API
Specification.
The scans are associated with the “FullScanInfo” messages. For example, column P (“NumSamp…”
indicates that there are 864 measurements in this scan and the next 864 fields are the scan readings.
All of the other key features of the waveform including location of leading edge, location of lock
spot, waveform start point, waveform stop and step size can be found in the following fields:
LedIndex, Lockspot, ScanStart, Scanstop, and ScanStep. See CAT API Specification for details.
Figure B-1 shows an example .csv logfile as viewed in MS Excel. This figure does not show the
final 859 columns.
Fig. B-1: Example logfile

32 CAT User Guide
For more information, please visit www.timedomain.com.
Appendix C: Relationship Between Transmit Gain and Transmit Power
The following three hardware configurations are currently supported: P400, P410, and P410 with
optional transmit power amplifiers. The relationship between transmit gain and transmit power
delivered to the antenna port for these three configurations is shown below in Table C-1 and
graphically in Figures C-1 though C-3. These values are typical and the user can expect minor unit
to unit variations.
Table C-1: Transmit Gain Setting vs. power delivered to antenna port (dBm) per Radio configuration
Figure C-1: P400 - Transmit Gain Setting vs. Transmit Power
Transmit Gain P400 P410 P410 w Amps
63 2.1 -12.64 0.71
59 2.05 -12.88 0.65
55 1.96 -13.2 0.55
51 1.83 -13.62 0.4
47 1.66 -14.12 0.2
43 1.42 -14.78 -0.05
39 1.09 -15.57 -0.36
35 0.65 -16.47 -0.73
31 0.1 -17.43 -1.15
27 -0.75 -18.61 -1.78
23 -2 -20 -2.65
19 -3.57 -21.6 -3.85
15 -5.3 -23.32 -5.4
11 -7.48 -25.35 -7.52
7 -9.94 -27.58 -9.97
3 -12.47 -29.89 -12.47
0 -14.53 -31.6 -14.48
-16
-14
-12
-10
-8
-6
-4
-2
0
2
0 10 20 30 40 50 60 70
Transmit Gain Setting
Pow
er D
eliv
ered
to
An
ten
na
Port
(d
Bm
)

CAT User Guide 33
For more information, please visit www.timedomain.com.
Figure C-2: P410 - Transmit Gain Setting vs. Transmit Power
Figure C-3: P410 with power amp - Transmit Gain Setting vs. Transmit Power
Increasing power above the 14.5 dBm level will increase Clear Line of Sight system performance in
the following ways:
For a given operating range, each increase of 3dB transmit power will double the data rate.
For a given operating range, each increase of 10 dB transmit power increase data rate by a
factor of 10.
For a given data rate, each increase of 6 dB transmit power will double the operating range.
For a given data rate, each increase of 10 dB transmit power will triple the operating range.
-35
-30
-25
-20
-15
-10
0 10 20 30 40 50 60 70
Transmit Gain Setting
Pow
er D
eliv
ered
to
An
ten
na
Port
(d
Bm
)
-16
-14
-12
-10
-8
-6
-4
-2
0
2
0 10 20 30 40 50 60 70
Transmit Gain Setting
Pow
er D
eliv
ered
to
An
ten
na
Port
(d
Bm
)
34 CAT User Guide
For more information, please visit www.timedomain.com.
Appendix D: Operation at Elevated Temperatures
The P400 and P410 both use commercial parts rated for operation between 0oC and 70
oC. However,
this does not translate into an ambient operating temperature of 0oC and 70
oC. Because the
electronics generate heat in the course of operation, operating the devices at an ambient temperature
of 70oC would result in a board temperature significantly higher. Furthermore, the board temperature
is also a function of heat load generated by other devices as well as sun loading. Heat buildup can
also be reduced through the use of heat sinks and Peltier coolers. The units are provided with an on
board temperature sensor as a temperature control aid. Readings from the sensor are available
through the API. The user should monitor this sensor to evaluate the need for temperature control.
The temperature sensor measures the board temperature and the user should insure that the
temperature reading never exceeds 70oC. Operation of the units at temperatures above 70
oC will
exceed the temperature ratings of many of the parts and should be avoided. Having said that, it
should be noted that Time Domain has successfully operated the units at temperatures as high as
100oC. Also there does not appear to be any reduction in system performance due to temperature
cycling (even if that temperature is as high as 100oC). In other words, the system might stop working
at elevated temperatures, but once the temperature falls below the upper limit, the user should expect
that operation would return to normal. In any event, since operation above 70oC cannot be
guaranteed and might (but probably won’t) result in physical damage, the user should take care to
operate the equipment below this maximum temperature limit.
At temperatures above 50oC the user will also see a slight degradation (approximately 3-4 dB) in the
performance of the receive channel. If this loss should become a significant system issue, then the
Radio can be redesigned such that this issue is eliminated.

CAT User Guide 35
For more information, please visit www.timedomain.com.
Appendix E: Acquisition, Data, and Waveform Pulse Integration Index
Pulse integration is a key characteristic of Time Domain’s RF transmissions. This ability is used to
increase operating range, minimize error rate, and capture high SNR waveform scans. This Appendix
describes pulse integration, Time Domain’s definition and its effect on performance.
Since the Radio has been designed for coherent operation, it is possible to transmit a single bit of
information over multiple pulses and then receive that bit of data by integrating multiple pulses to
recover the original bit of information. Each time integration is doubled, the SNR of the received
signal will improve by 3 dB. Consequently, doubling the integration also doubles the amount of time
it takes to collect that bit of data and thereby reduces that data rate by half.
The user can set the integration increments in powers of two. For example, the user can set
integration to 64:1 or 26. Time Domain refers to this as a Pulse Integration Index (PII) of 6. A PII
setting of 6 will increase the received SNR by 18 dB. Similarly a PII of 16, the maximum allowed by
CAT (accomplished for Scans by setting Data Index: Integration to 11 and Integration Factor to 32x)
will integrate 65,536 scans and thereby provide an SNR improvement of 48 dB.
“Bit of information” could be (but is not necessarily) referring to bits of data. It could also relate to
the energy needed to acquire/receive an RF packet or the energy needed to capture a waveform. By
increasing the PII and consequently the signal SNR, the user can increase the range of performance,
improve the signal BER and PER, and improve received scans. However, increasing PII will
increase the time required to accomplish a given function.
In general, it will take 3 dB more to acquire a packet that to demodulate data. Therefore the PII for
Acquisition is normally set to one PII setting higher than that used for data demodulation. Similarly,
the PII used for generating a scan is normally set to one PII higher than data. These are the normal
settings, all of which the user can override. The following table indicates the effect PII settings will
have on maximum operating range and raw data rate.
Acquisition
PII
DATA
PII
Max Range
(meters)
Raw Data
Rate: (bps)
5 4 35 632k
6 5 60 316k
7 6 88 158k
8 7 125 79k
9 8 177 39.5k
10 9 250 19.7k
11 10 354 9.86k
Table E-1: Data and ranging performance characteristics @ -14.5 dBm transmit power