catalases in plants: gene structure, properties, regulation, and
TRANSCRIPT

Catalases in Plants: Gene Structure, Properties, Regulation, and Expression John G. Scandalios, Lingqiang Guan, and Alexios N. Polidoros Department of Genetics North Carolina State University Raleigh, North Carolina 27695-7614 Catalase action in plant and animal tissues was first observed in 1818 by Thenard, who noted that such tissues readily degraded hydrogen peroxide, a substance he had also discovered some years earlier (Aebi and Sutter 1971). Loew (1901) first established that the degradation of H202 in tissues was due to the effect of an individual, separable enzyme, which he named "catalase." Warburg (1923) suggested that catalase is an iron-containing enzyme, because it is inhibited by cyanide. Evidence for its hematin prosthetic group was presented by Zeile and Hellstrom (1930). Catalase was first purified and crystallized from beef liver, and its identity was made clear by Sumner and Dounce (1937). The earliest genetic studies on catalase were reported by the Russian biologist Kolt-zoff (1927), who demonstrated that blood catalase levels in several animal species are inherited and segregate according to Mendelian rules.
Catalase has been found in all plants examined, and has been most thoroughly studied biochemically, genetically, and molecularly in the agronomically important species Zea mays L. (Scandalios 1990). That catalases can exist in multiple molecular forms or isozymes encoded by multiple genes, in any organism, was first demonstrated by Scandalios (1965, 1968) with the maize catalases and has since been found to be the rule rather than the exception, as originally perceived. OXYGEN AND REACTIVE OXYGEN SPECIES During respiration, molecular oxygen accepts four electrons to produce two molecules of H20. However, because of spin restrictions, 02 cannot accept four electrons at once but accepts them one at a time (Halliwell and Outteridge 1984). Thus, during the one-electron (univalent) reduction of 02, stable intermediates are formed in a stepwise fashion (Fig.1). Oxidative Stress and the Molecular Biology of Antioxidant Defenses © 1997 Cold Spring Harbor Liboratory Press 0-87969-502-1/97 $5 + .00 343

344 J.G. Scandalios, L. Guan, and A.N. Polidoros
Figure 1 Pathways in the univalent reduction of oxygen to water leading to the formation of various intermediate reactive oxygen species. Each of the intermediate reactive oxygen species (ROS) can react with a variety of biomolecules, altering or blocking their biological activity. The combined biological effect of these toxic oxygen species on organisms is termed "oxidative stress." To minimize the damaging effects of activated oxygen, organisms have evolved various enzymatic and nonenzymatic mechanisms that can reduce oxidative stress by detoxifying harmful oxygen species. Among these defenses is the antioxidant enzyme catalase, which converts H202 to oxygen and water. Unlike the oxygen radicals, H202 can readily diffuse across biological membranes; hence, it can cause oxidative stress far from the site of formation. It will accept an electron and proton to form a molecule of water and the hydroxyl radical. The hydroxyl radical (~OH) is the most reactive of the oxygen species. It is an extremely potent oxidant and reacts with organic molecules at nearly diffusion rates. Although H202 itself is a relatively stable oxidant and not highly reactive, some biomolecules are directly sensitive to it. For example, many proteins are known to be sensitive to physiologically relevant levels of H202 (about 100 nM). Metalloproteins as a class seem to be sensitive to H202. These include heme proteins (Puppo and Halliwell 1988) and Cu/Zn superoxide dismutase (Hodgson and Fridovich 1975; Beyer and Fridovich 1987). H202 reacts with these proteins, causing them to release the metal ion and lose their biological activity. Several Calvin cycle enzymes also appear to be especially sensitive to H202. These include fructose biphosphatase, sedoheptulose biphosphatase, glyceraldehyde-3-phosphate dehydrogenase, and phosphoribulokinase (Ellyard and Gibbs 1969; Charles and Halliwell 1981; Asada and Takahashi 1987). H202 appears to act here by oxidizing critical thiols in the enzymes, thereby inactivating them; e.g., H202 has its primary cytotoxic effects through the formation of OH (Fridovich 1975; Imlay et al. 1988). In the Fenton reaction, H202 can form OH in the presence of a suitable transition metal (Fenton 1894; Haber and Weiss 1934).

Catalases in Plants 345 INTRACELLULAR PRODUCTION OF HYDROGEN PEROXIDE H202 is produced in significant quantities in various subcellular organelles (see Scandalios, this volume). Each organelle also has potential targets for H202 oxidative stress as well as mechanisms for eliminating H202. Furthermore, H202 can readily diffuse through intra- and intercellular membranes, allowing the interaction of organelles or even cell types. Peroxisomes In eukaryotic cells, much of the H202 produced is concentrated in specialized organelles called peroxisomes. They are widely distributed throughout eukaryotes, and in higher eukaryotes they are found in every tissue examined. In peroxisomes, H202 is produced by oxidases, which are involved in the catabolic oxidation of a variety of biomolecules. Oxidases remove two electrons from substrates by way of a flavodoxin intermediate, ultimately transferring the electrons to 02 to form H202.
Peroxisomes contain oxidases for a variety of general metabolic pathways (Tolbert 1981). The enzyme content of peroxisomes varies significantly with the metabolic needs of the specific cell type and developmental stage. In plants, peroxisomes associated with specific metabolic functions have been termed "specialized peroxisomes." These include the glyoxysomes found in tissues of oil-storing seeds during germination (Beevers 1982). They are associated with the glyoxylate cycle and the utilization of fat reserves in oil-storing seeds. During germination, fatty acids are converted directly into carbohydrates in the glyoxylate cycle. Thus, seedlings are provided with a carbon source until the plant is photosynthetically competent. The fatty acids metabolized in the glyoxysomes are converted into succinate. An early enzyme in the glyoxylate pathway is acetyl CoA oxidase, which generates H202. Ultimately, two H202 molecules are produced for every succinate molecule generated. The succinate can then be used as carbon source or metabolized by mitochondria into cellular energy. In addition to all the enzymatic generators of H202 described above, all peroxisomes contain the H202-consuming enzyme catalase. Chloroplasts Illuminated chloroplasts generate copious amounts of H202. It is estimated that approximately 10-20% of the electrons that flow through photosystem I reduce 02 to H202 (Asada and Takahashi 1987). As elec

346 J.G. Scandalios, L. Guan, and A.N. Polidoros trons flow through the electron chains of photosystem I, they readily "leak" and produce the superoxide radical (O2~~). The O2~ is then reduced to form H202. Herbicides (e.g., atrazine) that block electron transport or act as alternative electron acceptors and increase the flow of electrons to oxygen (i.e., paraquat) significantly increase the production of O2~~ and thereby H202 (Asada and Takahashi 1987; Halliwell 1987). It is hypothesized that the generation of activated oxygen species contributes to the toxic effects of these herbicides.
In the chloroplast, O2~~ is rapidly converted to H202 through the action of superoxide dismutase (SOD) (Baum and Scandalios 1979; Hayakawa et al. 1984). The chloroplast isozyme of SOD converts O2~ into H2O2 and water.
There are also a number of nonenzymatic mechanisms that convert O2~ into H2O2 (Asada and Takahashi 1987). For example, O2~ can react with two NAD(P)H molecules to produce H2O2 (Nadezhdin and Dunford 1979). Several electron donors can act in this manner, including ascorbate (Cabelli and Bielski 1983) and glutathione (Anderson et al. 1983). Additionally, electrons directly from the electron transport chains of the photosystems can reduce O2~~ to H2O2 (Allen 1975).
Chloroplasts scavenge and eliminate H202 via the ascorbateglutathione cycle (Asada and Nakano 1980; Halliwell 1987). In this cycle, ascorbate peroxidase reduces H2O2 to form water and dehydroascorbate. Ascorbate reductase then utilizes glutathione to reduce the dehydroascorbate and thereby regenerate the ascorbate. The glutathione is then regenerated by glutathione reductase utilizing reducing equivalents from NAD(P)H. NAD(P)H is not a limiting metabolite in chloroplasts under conditions where excess H2O2 is generated, namely light. There is no catalase associated with chloroplasts.
Chloroplasts may have excess capacity to degrade H202 and may play a role in reducing H202 generated in other subcellular compartments. Evidence of this capacity comes from studies with isolated chloroplasts, which can rapidly eliminate H2O2 from a 5 mM H202 solution within a few minutes (Asada and Nakano 1980). At this rate, illuminated chloroplasts might be able to scavenge all the H2O2 synthesized in the cell. Mitochondria In mitochondria the production of H202 is associated with respiration. The rate of peroxide generation depends directly on the metabolic state

Catalases in Plants 347 of the mitochondria (Loschen et al. 1971). The greater the flow of electrons through the electron chain, the greater the H2O2 production. Under physiological conditions, it is estimated that 2% of the O2 utilized by mitochondria is generated into H2O2 (Chance et al. 1973). Inhibitors of respiration that block electron flow through the electron transport chain can increase H2O2 production (Boveris and Cadenas 1975). Inhibitors that block entry of electrons onto the transport chain decrease H2O2 production (Boveris and Chance 1973).
O2~ is believed to be the precursor to H2O2 in the mitochondria, as it is in the chloroplast (Forman and Boveris 1982). The electron-rich form of ubiquinone, ubisemiquinone, reduces O2 to form O2~~ (Cadenas and Boveris 1980). 02~, being charged, is not membrane-permeable and accumulates in the mitochondria. A mitochondrial-specific isozyme of SOD degrades O2~ into H2O2 and O2 (Fridovich 1975; Baum and Scandalios 1979).
In mammalian systems some of the internally generated H2O2 may be partially metabolized by glutathione peroxidase (Nichols 1972; Starke and Farber 1985). There is some evidence that a significant portion of mitochondrially generated H2O2 diffuses out of the mitochondria and is scavenged by other systems (Oshino et al. 1975); however, heart mitochondria contain catalase, which directly inactivates H2O2 (Radi et al. 1994).
As discussed below, in maize the CAT-.3 catalase isozyme is associated with the mitochondria (Scandalios et al. 1980a). To the extent that CAT-3 instead of glutathione peroxidase is degrading mitochondrially produced H2O2, reducing equivalents are conserved, thus allowing for more efficient respiration. Other Cellular Components The cytosol, the endoplasmic reticulum, and the nucleus have all been shown to evolve small quantities of H2O2 in vitro (Chance et al. 1979). Presently, little is known about the actual quantities generated in vivo or the metabolic processes that generate it. It is generally accepted that catalase is found in the cytosol and could effectively remove cytosolic H2O2. Additionally, H2O2 generated in these subcellular components may diffuse into other organelles with an excess capacity to degrade H2O2 (e.g., peroxisomes). In addition to the above, H2O2 has some important functions in plant cells, including roles in signal transduction, cell wall lignification, and defenses against pathogen attack (see Doke, this volume).

348 J.G. Scandalios, L. Guan, and A.N Polidoros CATALASE: CHARACTERIZATION Catalase (H2O2:H2O2 oxidoreductase, EC 1.11.1.6; CAT) is a tetrameric heme-containing enzyme that is found in all aerobic organisms and serves to rapidly degrade H2O2. Catalase is one of the most active catalysts produced by nature. It decomposes H2O2 at an extremely rapid rate, corresponding to a catalytic center activity of about i07 min-1. Depending on the concentration of H2O2, it exerts a dual function (Deisseroth and Dounce 1970). At low concentrations (<10-6 M) of H2O2, it acts "peroxidatically," where a variety of hydrogen donors (e.g., ethanol, ascorbic acid) can be oxidized in the following manner. RH2 + H2O2 R + 2H2O At high concentrations of substrate, catalase decomposes toxic H2O2 at an extremely rapid rate using the "catalatic" reaction in which H2O2 acts as both acceptor and donor of hydrogen molecules. 2H2O2 2H2O + O2 Spectrophotometric and kinetic evidence suggests that catalase uses a two-step mechanism in both the peroxidatic and catalatic reactions (Deisseroth and Dounce 1970; Dounce 1983). In the first step, the heme iron of catalase interacts with H2O2 to form an oxygen-rich iron peroxide. CAT-Fe-OH + H2O2 CAT-Fe-OOH + H2O This intermediate iron peroxide (CAT-Fe-OOH) is referred to as compound I, which can be detected in vitro and in vivo, because it alters the spectrophotometric properties of the catalase heme. In fact, because of special kinetic properties of catalase, compound I is utilized as an indicator of H2O2 concentrations in vivo (Oshino et al. 1975). At low H202 concentrations, compound I can be reduced by hydrogen donors (e.g., ethanol) peroxidatically.
CAT-Fe-OOH + C2H5OH CAT-Fe-OH + H2O + CH3CHO (Peroxidatic Rx)
At high concentrations of H202, compound I reacts with a second H2O2 to produce water and molecular o2.
CAT-Fe-OOH + H2O2 CAT-Fe-OH + H2O + o2 (Catalatic Rx)

Catalases in Plants 349
Catalase is unique among H202-degrading enzymes in that it can degrade H202 without consuming cellular reducing equivalents. Hence, catalase provides the cell with a very energy-efficient mechanism to remove H202. Therefore, when cells are stressed for energy and are rapidly generating H202 through "emergency" catabolic processes, H202 is degraded by catalase in an energy-efficient manner. This should result in a net gain of reducing equivalents and, therefore, cellular energy. It has been proposed that catalase may be uniquely suited to regulate the homeostasis of H202 in the cell (Asada and Takahashi 1987). In the catalatic mode, catalase has a very high apparent Michaelis constant and, therefore, is not easily saturated with substrate. Thus, the enzyme activity increases linearly over a wide range of H202 concentrations and, there-by, maintains a controlled intracellular H202 concentration. There is cir-cumstantial evidence that catalase may function in this manner in mammalian systems. Organs with high concentrations of catalase (i.e., liver and kidney) have low levels of endogenous H202, and organs with low concentrations of catalase (i.e., lung and heart) have high endogenous levels of H202 (Thayer 1977). Furthermore, if catalase activity is inhibited, H202 concentrations rise in the liver (Chance et al. 1979). PLANT CATALASES OCCUR IN MULTIPLE MOLECULAR FORMS Plants, unlike animals, have multiple enzymatic forms (or isozymes) of catalase. Over 30 years ago, when Scandalios (1965, 1968) first demonstrated that the multiple isozymes of catalase in maize were the products of distinct, unlinked genes, it was considered by many to be an isolated case. However, as recent investigations of catalases in other plant species were undertaken by numerous laboratories, catalase multiplicity proved to be the rule rather than the exception. Among the various plant species examined and found to have multiple isozymes of catalase are Nicotiana tobacco (Havir and McHale 1987), cotton (Ni et al. 1990), Nicotiana plumbaginlfolia (Willekens et al. 1994b), Arabidopsis thaliana (Zhong et al. 1994), Pinus taeda (Mullen and Gifford 1993), sunflower (Eising et al. 1989), pumpkin (Yamaguchi et al. 1986), and tomato (Gianinetti et al. 1993). In some plant species (e.g., castor bean), single forms of catalase were initially reported (Gonzalez 1991), but as these were examined in more detail, multiple forms were identified (Suzuki et al. 1994). Some species may indeed prove to possess only one form, but those that have been examined in some detail (e.g., tobacco and Arabidopsis) have been shown to have three genetically distinct catalases similar to those in maize. The presence of multiple catalase isozymes

350 J.G. Scandalios, L. Guan, and A.N. Polidoros suggested multiple functions for catalases in a variety of plant tissues at various developmental stages and under constantly changing environments from which plants cannot readily escape.
In recent years, interest in plant catalases has gained significant momentum as their role in plant metabolism, defense, and signal perception has been indicated. The cDNAs for a number of plant catalases have been isolated (Table 1), but only six plant catalase genes have been isolated and characterized (Table 2). Such information is useful in establish-

Catalases in Plants 351 mg the evolutionary relationships among catalases from various plant species and all other aerobic organisms (Guan and Scandalios 1996).
Among eukaryotic catalases, the most complex and most thoroughly investigated are those of Zea mays L., or maize. A detailed discussion of the maize catalase gene-enzyme system, as a paradigm of the current state of knowledge relative to plant catalases, follows. THE MAIZE CATALASE GENE-ENZYME SYSTEM In maize, the three unlinked nuclear structural genes, Cat1, Cat2, and Cat3, encode three biochemically distinct isozymes, CAT-1, CAT-2, and

352 J.G. Scandalios1 L. Guan, and A.N. Polidoros
CAT-3, respectively (Scandalios 1965, 1968, 1979; Scandalios et al. 1980a). Each of the Cat genes exhibits temporal and spatial specificity in its expression (Scandalios et al. 1984), and each responds variably to different environmental signals (Matters and Scandalios 1986a,b; Scandalios 1987; Skadsen and Scandalios 1987). In addition, the catalase isozymes exhibit cell (Tsaftaris et al. 1983) and organelle (Scandalios 1974, 1990) specificities. Both overexpression and null mutants have been identified and characterized (Scandalios et al. 1980b; Chandlee and Scandalios 1984a; Bethards and Scandalios 1988; Wadsworth and Scandalios 1990).
Each of the maize catalase isozymes is composed of four approximately 60-kD subunits and is structurally similar to catalases found in other organisms (Chandlee et al. 1983). The differential spatial and temporal expression of these genes has been characterized, and two temporal regulatory loci, Carl and Car2, have been genetically defined (Scandalios et al. 1980b; Chandlee and Scandalios 1984a,b). CAT-1 is the only catalase isozyme expressed in mature pollen, the milky endosperm, aleurone, and the scutellum during early kernel development (Scandalios 1983; Wadsworth and Scandalios 1989; Acevedo and Scandalios 1990). During early sporophytic development, levels of CAT-1 in the scutellum decline, while levels of CAT-2 increase, with the CAT-2 developmental profile paralleling that of the glyoxysomes (peroxisomes), the primary intracellular location of these two isozymes (Scandalios 1974). CAT-1 and CAT-3 are the only catalase isozymes present in etiolated leaves and in the coleoptile of the germinating maize seedling.
Catalases in Plants 353 Upon exposure to light there is rapid accumulation of CAT-2 in leaves due to both increased transcript accumulation (Redinbaugh et al. I 990b) and increased translation of the Cat2 message (Skadsen and Scandalios 1987). In mature green leaves of maize, CAT-2 is localized in the peroxisomes of bundle-sheath cells, and CAT-1 and CAT-3 are found in mesophyll cells (Tsaftaris et al. 1983). The CAT-3 isozyme is quite different from the other catalases biochemically. In maize, tobacco, and barley, the CAT-3 (i.e., the isozyme specifically immunoreactive with the maize anti-CAT-3 monospecific antibody) isozyme has enhanced peroxidatic activity (70-, 30-, and 28-fold over "typical" catalase, i.e., CAT-2).
Catalase can either catalyze the direct dismutation of H202 into H20 and 02 (catalatic mode) or use H202 to oxidize substrates such as methanol, ethanol, formaldehyde, formate, or nitrite (peroxidatic mode). The ratio of these is usually calculated as Rpic = (mU peroxidatic/U catalatic) x 10 (Chandlee et al. 1983; Havir and McHale 1989). In maize bundle-sheath, the peroxisomal catalase (CAT-2) has high catalatic but low peroxidatic activity (Rpic = 0.25). In contrast, CAT-3, which is expressed in leaf mesophyll and is not peroxisomal (coisolates with mitochondria), has high peroxidatic but low catalatic activity (Rpic = 17.6). Finally, each catalase isozyme exhibits varying degrees of sensitivity to inhibitors such as cyanide (KCN), azide (NaN3), and aminotriazol (AT), and to the endogenous maize proteinaceous catalase inhibitor. CAT-3 proved the least sensitive of the three maize catalases to all inhibitors tested (Scandalios 1990, 1994). This again suggests that CAT-3 might have evolved to function under specific conditions or in a specific metabolic role distinct from that of the other catalases. For example, because CAT-3 is cyanide-insensitive, one might hypothesize a role or function under conditions favoring cyanide-resistant respiration (i.e., alternative oxidase respiration) (Elthon and McIntosh 1987).
Although biochemically distinct, the three catalase isozymes are capable of interacting in vitro to form heterotetramers (Scandalios 1965, 1979). The CAT-1 and CAT-2 isozymes also form the expected heterotetramers when expressed together in vivo (e.g., in the scutellum of germinating embryos) (Fig. 2). However, the CAT-3 isozyme is found only as a homotetramer in vivo, even where its temporal and tissue specificity of expression coincide with those of the CAT-1 and CAT-2 isozymes (Scandalios et al. 1980a; Chandlee and Scandalios 1984a). This further implies that CAT-3 is compartmentalized separately from the other catalases in the cell. Because all three catalases are encoded by nuclear genes, this suggests specific targeting of the CAT-3 protein. The

354 J.G. Scandalios, L. Guan, and A.N. Polidoros
Figure 2 (Top) Zymogram showing tissue-specific expression of the three catalase isozymes in maize. CAT-1 in immature milky endosperm (LE), CAT-2 in scutellum (SC) at day 10 postgermination, and CAT-3 in coleoptile (COL). (Bottom) Lack of subunit interaction between CAT-3 when coexpressed in the same tissue with CAT-1 (pericarp, PER) or with CAT-2 (green leaf, LF). (Lower right) Subunit interaction between CAT-1 and CAT-2 to form intergenic heterotetramers when both are coexpressed in the same tissue (aleurone, ALEU). CAT-1 and CAT- 2 isozymes have been shown to be cytosolic or, where glyoxysomes/peroxisomes are present, peroxisomal. In contrast, CAT-3 is not found in these cell fractions in leaf but coisolates exclusively with the mitochondrial cell fraction (Scandalios et al. 1980a). In addition, as discussed below, recent findings concerning the novel light regulation of Cat3 transcription further reinforce the inference of a special metabolic role for CAT-3. DEVELOPMENTAL EXPRESSION Each of the maize catalases exhibits a unique and complex pattern of de-velopmental expression throughout the maize life cycle (Scandalios et al. 1984). CAT-3 is detected in the pericarp (a maternal tissue) during ovule development, and during very early postpollination kernel development, but declines rapidly shortly after pollination. CAT-1 is also detected in the pericarp, but at extremely low levels. By days 12-15 postpollination, CAT-1 becomes the predominant form, and is in fact the only catalase detected in the kernel at this time. CAT-1 is the only catalase detected in the milky endosperm of developing kernels. The aleurone, a specialized kernel tissue derived from endosperm cells, expresses CAT-1 and CAT-2 during the latter stages of kernel development. At days 9-20 postpollination,

Catalases in Plants 355 the scutellum expresses only the CAT-1 isozyme. However, at later stages, as the seed matures, the Cat2 gene is induced to moderate levels until the seed desiccates and enters developmental arrest. In the scutellum isolated from dry "dormant" seed, CAT-1 appears to be the only isozyme expressed. Upon imbibition and germination, CAT-1 is initially the only form expressed in the scutellum, but as the embryo grows, Cat2 is rapidly induced, and by day 5 postimbibition, CAT-2 becomes the predominant isozyme. By day 10 postimbibition, catalase expression has shifted almost exclusively to CAT-2. In the coleoptile, CAT-3 is the predominant isozyme detected on zymograms. CAT-1 and CAT-3 are detected in dark-grown leaf tissue. CAT-2 is only expressed with greening of the leaf tissue in the light. The root has very low levels of catalase and is difficult to analyze. However, in young roots, CAT-1 and CAT-3 can be detected. As roots mature and grow, catalase activity decreases and rapidly drops below assay sensitivity. Only CAT-3 is detected in the stem of the mature plant (Acevedo and Scandalios 1991), and only CAT-1 is detected in the pollen after anthesis (Acevedo and Scandalios 1990).
The temporal and spatial distribution of maize catalase activity and isozyme proteins is also reflected in the distribution and accumulation of the Cat transcripts. The steady-state levels of Cat1, Cat2, and Cat3 mRNAs generally mirror the level of their respective catalase activities and isozyme patterns (Redinbaugh et al. 1990b; Acevedo and Scandalios 1992) during seed development (Fig. 3), and during early sporophytic development and differentiation (Fig. 4). Whereas these observations are consistent with transcriptional regulation of tissue-specific catalase expression, there is substantial evidence that expression of the maize Cat genes is also regulated posttranscriptionally (Skadsen and Scandalios 1987). This multilevel regulation, coupled with the availability of both constitutive (Cat1) and tissue-specific (Cat2 and Cat3) gene expression, renders the maize catalase gene-enzyme system a good choice for the study of molecular factors that influence tissue-specific gene expression in plants. The overall developmental program of catalase gene expression presented herein has been corroborated by zymogram analyses, activity profiles, immunochemical measurements, and transcript levels for each of the isozymes. TEMPORALLY PROGRAMMED TISSUE-SPECIFIC GENE EXPRESSION The basic developmental program was initially established in the scutellum, since this tissue persists from early kernel development to the time

356 J.G. Scandalios, L. Guan and A N Polidoros
Figure 3 RNA blots of Cat1, Cat2, and Cat3 RNA levels in the maize ear shoot tissues. Each lane contained 10 ~g total RNA from the tissue indicated. RNA isolated from scutellum (S) and epicotyl (E) at 4 dpi was used as positive control. Gene-specific sequences for each gene were used to probe the RNAcontaining filters. Arrows indicate barely detectable amounts of transcript accumulation. Horizontal bar (under kernel) indicates kernel development (6-36 dpp). (0) Unpollinated pistillate flowers. when the young plant is fully differentiated after germination, whereas the endosperm quickly degenerates following germination, being utilized as a nutrient source. Furthermore, the scutellum is a stable, virtually non-dividing, nondifferentiating, diploid tissue.
Catalase activity in the scutellum, standardized by examining the complete developmental program in a significant number of highly inbred lines, increases rapidly after germination, peaking at 4 days post-germination and thereafter declining to moderate levels. A time-course zymogram analysis reflects the temporal shift in expression from Cat1 to Cat2 during this time period (Scandalios 1987). This shift in expression of the two Cat genes was shown to be largely due to changes in the rates of synthesis and degradation of the CAT-1 and CAT-2 isozymes during this period (Quail and Scandalios 1971). Interestingly, the Cat2 mRNA profile increases and decreases in parallel with the CAT-2 protein, whereas the accumulation of steady-state Cat1 mRNA increases as the Figure 4 Steady-state levels of Cat1, Cat2, and Cat3 mRNA in the tissues indicated of the developing maize seedling were determined by Si-nuclease protection analysis. The signal generated by 10 or 100 pg in~vitro-synthesized RNA treated in the same manner is shown beside the individual autoradiograms to indicate that different exposures of the autoradiograms are presented.

Catalases in Plants 357

358 J.G. Scandalios, L. Guan, and A.N. Polidoros
Figure 5 Accumulation of Cat1 and Cat2 transcripts in scutella of germinating maize embryos. Embryos were excised from W64A germinated kernels at 0 to 10 dpi; total RNA was isolated, and accumulation of Cat1 and Cat2 transcripts in each sample was determined by Northern blot analysis. A DNA fragment containing an 18S ribosomal sequence was used to ensure similar loading and transfer. CAT-1 protein decreases during the same scutellar developmental period (Fig. 5). These data clearly indicate that the differential expression of the two genes in this tissue involves both transcriptional and posttranscriptional regulation.
The shift in expression from Cat1 to Cat2 in the scutellum is under genetic control, as verified by use of several maize lines shown to exhibit altered patterns of catalase expression during the same developmental period (Scandalios et al. 1980b; Chandlee and Scandalios i984a). For example, line R6-67 exhibits a continuous increase in catalase activity after 4 days postimbibition compared to the usual decline seen in most lines (e.g., W64A). The continuous increase in catalase activity is concurrent with an increase in CAT-2 protein synthesis and accumulation. By genetic analysis, a genetic regulatory element, Carl, was identified and shown to be responsible for the overexpression of the Cat2 gene in R6-67 (Scandalios et al. i980b). Carl maps 37 map units from the Cat2 structural gene on the short arm of chromosome 1. The product of Carl and the mechanism by which it increases Cat2 expression are unclear. However, R6-67 has significantly more Cat2 mRNA than do the normal lines, and it is suggested that Carl may encode a trans-acting factor affecting the transcription of Cat2 (Kopczynski and Scandalios i986).
A second regulatory element, Car2, was identified and shown to function in decreasing the rate of CAT-1 synthesis in the scutellum during early sporophytic development (Chandlee and Scandalios i984a).

Catalases in Plants 359 Car2 acts independently of Carl and is either closely linked or contiguous with the Cat1 structural gene. A number of CAT developmental time-course mutants have been identified and are being analyzed at the molecular level in an effort to decipher the underlying mechanisms involved. INTERTISSUE SIGNALING AND CAT EXPRESSION IN THE SCUTELLUM Expression of catalase in the scutellum is apparently regulated by "signals" from tissues that spatially interact with the scutellum. The post-germination induction of Cat2 occurs as a consequence of a temporal and spatial gradient. Using immunofluorescence assays, CAT-2 is first detected in cells that interact with the aleurone. As development proceeds, CAT-2 accumulates in a spatial gradient, occurring first in cells nearest the aleurone, then in cells farther and farther away from the aleurone, until all scutellar cells express the CAT-2 protein (Tsaftaris and Scandalios 1986). This suggests that the aleurone may be releasing a dif-fusible molecular signal triggering the induction of Cat2 in the scutellum. Furthermore, the embryonic axis exerts a specific effect on the accumulation of glyoxysomal proteins, including catalase (Skadsen and Scandalios 1989). Upon excising the embryonic axis from the scutellum prior to imbibition, the developmental accumulation of all glyoxysomal proteins is drastically reduced. In contrast, the developmental patterns of nonglyoxysomal proteins are unaffected; this suggests that an axis-specific factor modulates the level of expression of the glyoxysomal proteins, including catalase (Skadsen and Scandalios 1989). The exact nature of this "factor(s)" is as yet unclear. However, it is apparent that possibly two molecular signals may be involved in regulating the expression of Cat2 in the scutellum during early sporophytic development; one emanating from the aleurone may act to activate the gene, and another emanating from the embryonic axis may modulate the level of expression of Cat2. The nature of the signals is currently under investigation. CATALASE DEFICIENCIES Mutants deficient in catalase activity have been identified in barley and maize (Scandalios 1994). The barley mutant (Rpr 79/4) was reported to be unable to survive under photorespiratory conditions (Kendall et al. i983). More recent investigations with this barley mutant (Acevedo et al. i996) indicated that it is able to grow to maturity in normal air, but sustains chlorosis and significant head sterility. Detailed analyses

360 J.G. Scandalios, L. Guan, and A.N. Polidoros showed that this mutant lacks one of at least two distinct catalase isozymes; CAT-1 (EP-CAT), analogous to the maize CAT-1 catalase, and CAT-2 (T-CAT), analogous to the CAT-3 of maize, which have been identified in all barley strains examined (Skadsen et al.1995). The mutant barley Rpr 79/4 was found not to express the Cat gene encoding the T-CAT isozyme, but retained expression of the Cat1 isozyme gene (Acevedo et al. 1996). Thus, even though the Rpr 79/4 barley mutant is not completely lacking catalase, the loss of its peroxisomal T-CAT catalase isozyme is evidently harmful, underscoring the protective role of catalase in plants. To date, the molecular basis for the absence of CAT-2 in barley is unresolved.
In maize, a number of null mutations for Cat2 and Cat3 were discovered following a large mutant screening program; no such mutants were recovered from similar screens for the Cat1 gene (Scandalios 1994). Unlike the barley mutant, maize mutants deficient in CAT-2, CAT-3, or both CAT-2 and CAT-3 showed no discernible physiological effects or altered gross phenotypic characteristics when grown under normal conditions. Since the maize catalases appear to have, in addition to scavenging H202, differential responses to a variety of effectors, it is conceivable that the null mutants will respond differently to such effectors. In fact, we have preliminary data indicating that there are compensating or overlapping functions among the three catalases under adverse conditions (e.g., extreme temperature). The various mutants are currently being grown under stress conditions in order to compare their overall phenotypic and physiological responses to the "wild type" grown under similar conditions. It is likely that under highly stressful conditions, the null mutants may be less adaptable. MOLECULAR CHARACTERIZATION OF THE Ca~ AND Cat3 NULL MUTATIONS IN MAIZE Because the null mutants would be invaluable in deciphering the distinct physiological roles of each catalase isozyme, it was deemed essential to determine their molecular bases. Such a task was undertaken utilizing the available gene-specific cDNA probes for each of the three maize catalases.
RNA blot analyses of 5-day-old, scutellar poly(A)+ RNA from the Cat2 null line A340 showed that the Cat2 transcript was about 1400 nucleotides, compared to the 1850-nucleotide Cat2 transcript in normal maize lines (Bethards and Scandalios 1988).
The molecular basis for the shorter Cat2 transcript in maize lines null

Catalases in Plants 361 for the CAT-2 catalase isozyme was further investigated using cDNA libraries and genomic DNA blots. Sequence comparison of partial Cat2 cDNAs obtained from two CAT-2 null lines and a wild-type CAT-2 encoding cDNA showed that the Cat2 null transcripts diverged from the wild-type transcript but remained homologous to each other. Genomic DNA blots indicated that the missing portion of the transcript is present in the genomes of lines null for the CAT-2 isozyme. Differences in the hybridization patterns of normal and null lines were revealed when genomic DNA blots were probed with the full-length Cat2 cDNA, a Cat2 gene-specific probe, and a "null sequence" probe. Together, the DNA blotting results suggested that a rearrangement of the Cat2 gene had oc-curred in the CAT-2 null lines. The available data suggest that this CAT-2 null mutation in maize is due to a DNA insertion into the Cat2 gene (Abler and Scandalios 1991).
Two maize inbred lines have also been identified as being homozygous for a Cat3 null allele. CAT-3 monospecific polyclonal antibodies could not detect CAT-3 protein in extracts of any tissues (which in any normal maize line possess CAT-3) of the CAT-3 null lines. RNA blot analysis indicated that Cat3 transcript does not accumulate in any tissues. Additionally, zymogram and RNA blot analyses showed that the CAT-3 null mutation did not affect the expression of the Cat1 or Cat2 genes at the mRNA or protein level. Genomic DNA blots revealed significant structural alterations in the Cat3 gene of CAT-3 nulls. The results suggest that the molecular basis for the CAT3 null phenotype is most likely due to a deletion in the S 'end of the Cat3 gene (Wadsworth and Scandalios 1990). To investigate whether the lack of Cat3 transcript accumulation is due to a lack of transcription of the Cat3 gene, transcription run-on assays were performed. Results indicated a strong hybridization signal to the ribosomal DNA (a positive control), indicating that the nuclei of both the normal and Cat3 null mutant lines exhibit high levels of ribosomal RNA transcription in vitro. The Cat3 cDNA probe hybridized with the transcript from the W64A ("wild type") nuclei. However, the nuclei from CAT-3 nulls did not synthesize a transcript homologous to Cat3.
Although there are no major discernible physiological effects of the CAT2 and CAT3 null mutations, such mutants will aid in deciphering the role each isozyme plays in the plant's metabolism. Perhaps the lack of observable major phenotypic effects of these mutants is due to the fact that CAT-1 is still expressed and may compensate for the defect. By breeding experiments, we have created a double null line lacking both CAT-2 and CAT-3. Preliminary data suggest that this line may, in fact,

362 J.G. Scandalios, L. Guan, and A.N. Polidoros exhibit a higher germination rate than the normal lines, but it still expresses CAT-1. Eliminating CAT-1 chemically or by antisense mutations might be more telling as to the role of catalases in the life of the plant. It is also likely that each of the catalases may play a distinctly important physiological role under environmental conditions, not yet tested, which increase oxidative stress. Such experiments are currently in progress, utilizing these null mutations in genetically similar backgrounds. By recurrent selection experiments, we have succeeded in putting the null genotype in the W64A background. CATALASE GENE EXPRESSION IN RESPONSE TO ENVIRONMENTAL STRESS The expression of catalase genes is not only influenced by genetic and developmental signals, but is also significantly influenced and responsive to various exogenous environmental signals, both physical and chemical. Among the many environmental conditions/substances known to cause oxidative stress and to trigger antioxidant defense responses are temperature extremes, pathogenesis, radiation, drought, anoxia and hyperoxia, wounding, herbicides, hormones, H202, light, and numerous xenobiotics. The response of catalases to some of these effectors is discussed in some detail below. Fungal Toxin Many fungi of the genus Cercospora produce a light-induced, photoactivated polyketide toxin (cercosporin). In the presence of light and a suitable reducing substrate, an excited form of the cercosporin molecule (triplet state) reacts with 02 to form the O2~ radical (see Scandalios, this volume).
Total leaf protein extracts (7 to 10 days postgermination) showed an approximately 25% increase in total CAT activity in plus-cercosporin versus minus-cercosporin-treated leaves (Fig. 6A). Rocket immunoelectrophoresis, however, showed approximately 20-30% decrease in CAT-2 protein levels. This decrease is apparently at least partially offset by a corresponding increase in the more abundant CAT-3 isozyme (Fig. 6B). Nuclease S-i analyses of leaf total RNA showed a comparable increase in steady-state levels of Cat3 RNA in the presence of cercosporin, compared to a slight decrease in Cat2 RNA accumulation (Fig. 6C). Little or no change was observed in total CAT activity in 3-day postimbibition (dpi) embryo axes (not shown). In scutella (embryo minus axis) from

Catalases in Plants 363
Figure 6 Changes in CAT activity (A), isozyme level (B), and transcript (C) in leaves and scutella of maize treated with Cercospora culture filtrate. Sterile, light-grown culture filtrate (+ cercosporin) or dark-grown culture filtrate (- cercosporin) was applied to the surface of 7- to 10-day-old maize leaves (a columns). Plants were then grown 24 hr in constant light. Whole kernels (b columns) were similarly treated by imbibition, as were excised developing embryos (c columns) on organ culture medium, infiltrated with dark- or lightgrown Cercospora culture filtrates. After treatment, the respective exposed maize tissues were assayed for changes in total CAT activity (A). Accumulation of CAT-2 and CAT-3 isozyme proteins by rocket immunoelectrophoresis (B), and Cat2 and Cat3 transcript accumulation by Si-nuclease protection analysis (C).

364 J.G. Scandalios, L. Guan, and A.N. Polidoros 3-dpi seed, however, an approximately 50-60% increase in total CAT activity was observed. Rocket immunoelectrophoresis of corresponding scutellar protein extracts showed an increase in CAT-2 and CAT-3 isozyme levels of sufficient magnitude to account for the majority of this increased activity (Williamson and Scandalios 1992a).
Maize embryos incubated in the presence of increasing levels of purified cercosporin showed a dose-dependent increase in total catalase activity, individual isozyme protein levels, and corresponding transcript accumulation. Cat3 transcript levels increased with increasing doses of purified cercosporin, and Cat2 transcript accumulation showed a similar increase, followed by a decrease. Cat1 transcript accumulation showed a distinct decrease followed by an increase (Fig. 7). In contrast to the response of SOD (see Scandalios, this volume), the changes in steady-state levels of the various CAT isozymes were generally consistent with the observed changes in steady-state levels of the corresponding transcripts.
Whereas a number of models may be consistent with these observations, perhaps the simplest is that H202, the dismutation product of O2~~ by SOD, is, by itself, less immediately damaging to the cell than ~ Thus, the time required for the induction of the appropriate Cat gene(s) and subsequent message translation might be adequate for defense against this less toxic oxygen species. The observed response of the
Figure 7 Differential Cat transcript accumulation in the presence of Cercospora extracts and purified cercosporin toxin. Excised 2 dpi W64A embryos were incubated on culture media supplemented with increasing doses of extract from either dark-grown (- cercosporin) or light-grown Cercospora (+ cercosporin), or purified cercosporin. All plates contained equivalent amounts of solvent, with 0 cercosporin samples containing solvent only. All samples were exposed to light for 24 hr. Following treatments, accumulation of the various Cat transcripts in each sample was analyzed by RNA blots. Results shown are representative of three independent replicates.

Catalases in Plants 365 catalase gene products to increasing doses of purified cercosporin, in fact, closely mimics the response of cultured maize embryos to increasing doses of H202 described previously (Scandalios et al. 1984).
A variety of other compounds produced by fungi are also known to affect plant gene expression (Dixon and Harrison 1990). We therefore compared the effects of extracts from dark-grown (lacking cercosporin) and light-grown Cercospora kikuchii mycelia with those of purified cercosporin (Williamson and Scandalios 1993). The results from these experiments showed that the Cat transcripts also respond to compounds other than cercosporin present in the extracts from both light- and dark-grown fungi (Fig. 7). The complex response of Cat2 (a single-copy gene in maize), which shows a decrease followed by an increase at S ~M while Cat3 shows a simple increase to increasing doses of extract from darkgrown mycelia, suggests the presence of one or more differentially active compounds in the non-cercosporin-containing extracts. Although our results do not specifically reveal the type or number of active components present in extracts of dark-grown Cercospora, a number of fungal compounds other than cercosporin have been identified that elicit altered plant gene expression (Dixon and Harrison 1990), including the nonphotosensitizing (non-cercosporin) phytotoxic B-toxin in Cercospora spp.
Our results also demonstrated that the response of the maize catalases to toxin-containing Cercospora extracts is different at two separate developmental time points in maize scutella (Williamson and Scandalios 1993). These two time points represent distinct and rather well-defined alternate pathways in developmental programming, embryogenesis, and germination. Different responses to the same treatment at these two stages is, therefore, a significant observation. These results suggest a number of possibilities to explore. For instance, a specific trans-acting factor involved in catalase gene expression might be present only at a particular developmental stage. Thus, the response of a single gene to the same environmental signal could be quite different at different developmental stages. Such complex control of expression might reflect the specific functions of these genes in cellular responses to oxidative stress. Hydrogen Peroxide The response of catalase to exogenously applied H202 varied between the normal catalase lines (e.g., W64A) and the Cat2-null mutants (e.g., A338F) during postpollination kernel development. Total catalase activity

366 J.G. Scandalios, L. Guan, and A.N. Polidoros increased in W64A but decreased in A338F. In the normal catalase lines, CAT-1 isozyme activity increased slightly at low concentrations (1 mM H202), then decreased to very low levels with increasing [H202] of up to 50 mM. In contrast, the activity of CAT-2 increased significantly above 10 mM H202. This differential response of the CAT-1 and CAT-2 isozymes to H202 during kernel development leads to a pattern shift (Fig. 8) from CAT-1 to CAT-2 reminiscent of the catalase developmental program observed in scutella during postgerminative development (Quail and Scandalios 1971). In W64A, the response of catalase to H202 during postpollination kernel development is similar to that observed during postimbibition scutellar development (Scandalios et al. 1984). In the Cat2 null mutant, the activity of the CAT-1 and CAT-3 isozymes increased slightly at the lower concentrations [1-10 mM H202], but decreased significantly at higher concentrations, leading to the complete disappearance of CAT-1 at >30 mM H202 (C. Auh and J.G. Scandalios, unpubl.).
It is apparent from the above experiments that the three maize catalases respond differentially to exogenously applied H202 at different developmental stages. We have preliminary data indicating that endogenous H202 levels measured over extended developmental time periods in maize tissues show an inverse correlation between CAT activity and H202 (C. Auh and J.G. Scandalios, unpubl.), suggesting that fluctuations in H202 levels may play a significant signaling role in effecting the tissue-specific and temporal expression of the different Cat genes in maize.
Figure 8 Zymogram analysis of maize catalase from W64A scutella extracted 28 days postpollination following treatment with various doses of H202. The samples were homogenized in 25 mM glycylglycine buffer (pH 7.4). Equal amounts of total protein were electrophoresed. The final concentration of H202 in the medium is indicated below each lane. CAT-1 and CAT-2 homotetramers are indicated by arrows.

Catalases in Plants 367 Temperature Extremes Organisms have evolved a variety of ways to adapt to fluctuations in temperature. The most dramatic and readily discernible response to thermal stress in most organisms is the "heat shock" response, during which a number of genes are induced to produce the so-called "heat shock proteins " (hsps) that serve to protect cells from thermal damage. Less is known about responses to extreme cold, but what is known is based largely on recent work with plants (Tomashaw 1990). The most dramatic manifestation of cold acclimation is the increased freezing tolerance that occurs in many plant species. It is known that extreme environmental conditions often create oxidative stress conditions, which in turn might affect the antioxidant defense system.
The developmental profile of catalase activity in the high catalase activity mutant (R6-67) and the "wild type" activity profile line W64A are differentially affected by chronic exposure to high temperature (400C) (Matters and Scandalios 1986a). At 250C, R6-67 has significantly higher CAT activity after day 3 postgermination compared to W64A; until about day 3, the rate of increase and level of catalase activity between the two lines are about the same. Following about day 3-4 at 400C, however, the level of CAT activity in line R6-67 drops precipitously to the level of W64A, whereas the basic activity profile in W64A changes only slightly. The decline in R6-67 is associated with a decrease in CAT-2 protein and mRNA, whereas CAT-1 remains relatively constant (Scandalios 1994). When both CAT isozymes and transcripts were examined in day 1 post-germination W64A scutella following incubation at 350C and 400C for 24 hours, both CAT-1 and CAT-2 proteins and their respective transcripts increased at 350C and remained so, although CAT-1 protein and mRNA appeared more stable than CAT-2 at 400C (Fig. 9). In N. plumbaginifolia, Cat1 and Cat2 transcripts decreased during a 5-hour exposure to 370C but rapidly recovered following a return to 220C, whereas Cat3 mRNA levels remained constant at both temperatures (Willekens et al. i994c). Thus, like the maize catalases, the tobacco catalases exhibit differential responses to thermal stress.
Low temperature (40C and i40C) treatments led to significant increases in total catalase activity and resulted in isozyme pattern shifts in germinating maize embryos. A more dramatic increase in total CAT activity was observed in the embryonic axes than in scutella. In the latter, both CAT-1 and CAT-2 isozymes increased in response to the low temperatures, but there was a significant shift toward CAT-1 (Fig. bA). The CAT-1 homotetramer appeared only after the cold treatment, the CAT-1/CAT-2 heterotetramers also increased, and the CAT-2 homo

368 J.G. Scandalios, L. Guan, and A.N. Polidoros
Figure 9 Changes in catalase transcripts and isozyme proteins in response to high temperature. W64A seeds were imbibed in water for 24 hr and incubated in germination trays at 250C, 350C, and 400C for 24 hr. Scutella were isolated from treated seeds, and equal amounts of protein were examined by zymogram. The CAT-1 and CAT-2 homotetramers are indicated. Transcripts were detected by Northern blot hybridization with Cat1 and Cat2 gene-specific probes. Representative results from duplicate blots are shown. tetramer did not change. In the embryonic axes, CAT-2 increased, CAT-1 was newly induced by low temperature, and CAT-3 (normally expressed in this tissue) decreased (Fig. lOB).
Figure 10 Changes in catalase isozyme protein in response to cold treatment. W64A embryos were isolated from 2 dpi germinating seeds and incubated in MS basic medium at 250C, 140C, or 40C for 24 hr, or at 140C for 12 hr, then transferred to 40C for 12 hr. Scutella (A) and embryo axis (B) were isolated, and equal amounts of protein were examined by zymogram analysis for catalase isozyme activity. The 2 dpi scutella were used as a catalase standard control. CAT-1, CAT-2, and CAT-3 are indicated by arrows; intermediate bands are CAT-1/CAT-2 heterotetramers. CAT-3 does not form heterotetramers, in vivo, with either CAT-1 or CAT-2.

Catalases in Plants 369 Eftects of Plant Hormones Salicylic Acid Salicylic acid (SA) is found in the leaves and reproductive structures of many plant species (Raskin et al. 1990) and modulates many biological processes in plant cells (Raskin 1992). Recent evidence has indicated that SA may serve as an endogenous signal molecule in the induction of systemic acquired resistance (SAR) in tobacco (Gaffney et al. 1993). SAR is the phenomenon whereby plants, upon infection, develop enhanced systemic resistance to subsequent microbial attack (Madamanchi and Kuc 1991). A cellular SA-binding protein that shares high sequence identity to plant catalase was recently identified in tobacco (Chen et al. 1993). It was proposed that SA can bind to catalase and inhibit its activity, leading to an increase in cellular H202 levels, which then serve to transduce the signal that mediates a response to pathogen attack by triggering the plants' defense mechanisms such as SAR (Chen et al. 1993). Although tobacco is known to possess three distinct catalases (Havir and McHale 1987), no distinction was made by Chen et al. (1993) as to whether all three serve as SA-binding proteins. These findings are somewhat controversial, because other laboratories have reported different results with the same system and have presented alternative hypotheses (Bi et al. 1995; Neuenschwander et al. 1995).
The response of the maize catalase (Cat) genes to SA was examined at two distinct developmental stages: embryogenesis and germination. A unique, germination-related differential response of each maize catalase gene to various doses of SA was observed (Guan and Scandalios 1995). During late stages of embryogenesis, total CAT activity in scutella increased dramatically with 1 mM SA treatment. The accumulation of Cat2 transcript and CAT-2 isozyme protein is the major contributor to the observed increase in total CAT activity (Fig. 1 lA). This event was paralleled by the induction of germination of embryos at that stage. In a CAT-2 null mutant line, a full compensation of total CAT activity by the CAT-1 isozyme was observed in the presence of SA. Thus, in a maize line missing one catalase isozyme (i.e., CAT-2 null), another catalase isozyme (CAT-1) is dramatically increased to compensate for the loss of CAT activity due to the missing isozyme. This suggests that catalase is important in maintaining normal cellular processes under stress conditions. SA (1 mM), which induces germination of immature embryos, appears to inhibit seed germination at 1 dpi. Furthermore, Cat2 transcript accumulation was inhibited at this stage, whereas the Cat1 transcript was increased with 1.5 mM SA treatment (Fig. liB). During the later stages of germination, CAT activity again increased dramatically with 1 mM SA

370 J.G. Scandalios, L. Guan, and A.N. Polidoros
Figure 11 Changes in catalase transcripts and isozyme proteins of maize embryos in the presence of SA. Embryos were isolated from 28 dpp kernels (A) and 1 dpi seeds (B) and treated with 0-5 mM SA for 24 hr. Scutella were isolated from treated embryos, and equal amounts of protein were examined by zymogram. The CAT-1 and CAT-2 homotetramers are indicated by arrows; intermediate bands are CAT-1/CAT-2 heterotetramers. Transcripts were detected by Northern blot hybridization with Cat1 and Cat2 gene-specific probes. Representative results from duplicate blots are shown. treatment likely due to the activation of the CAT-1 protein (L. Guan and J.G. Scandalios, unpubl.). We conducted SA-binding assays with total protein extracted from leaves and scutella, as well as with purified CAT-2 protein. Our results indicated only slight inhibition of catalase activity with 1 mM SA for 1 hour. These observations imply that the maize catalases, unlike the tobacco catalase, may not serve as SA-binding proteins, and the observed differential responses to SA may be indicative of unique metabolic roles for each of the three maize catalases, in addition to their role in scavenging H202. Our results suggest that the mechanism of action for SA, with respect to catalases and H202, may be different between monocots and dicots. Abscisic Acid The effects of the phytohormone abscisic acid (ABA) on the expression of maize catalases have been studied in several developmental stages in the scutella during embryogenesis and germination. Embryos from developing maize seed at days 18-21 were isolated and incubated on

Catalases in Plants 371 growth medium supplemented with ABA. Zymogram analyses of total extracted proteins of these embryos showed that CAT-1 protein accumulated in embryos incubated in the presence of ABA. In contrast, excised embryos incubated on growth media alone accumulated increased levels of the CAT-2 isozyme, whereas CAT-1 levels appeared to decrease. Cat1 transcript levels increased substantially in the presence of ABA but remained unchanged in the absence of ABA. Conversely, Cat2 increased in the absence of ABA but failed to accumulate in the presence of ABA in scutella of developing embryos (Williamson and Scandalios 1992b).
The effects of ABA on the expression of catalase have also been studied in mature embryos. A similar catalase expression pattern was observed in scutella of 1 dpi embryos after ABA treatment. The CAT-1 isozyme level increased in response to ABA, whereas CAT-2 did not respond to ABA (L. Guan and J.G. Scandalios, unpubl.). When ABA was applied to 5 dpi embryos, the opposite effect of ABA on catalase expression was observed. The CAT-1 isozyme protein increased upon ABA treatment while Cat1 transcript remained unchanged (Williamson and Scandalios 1994). On the other hand, both CAT-2 protein (Fig. 12) and Cat2 transcript (Guan et al. 1996) increased substantially after ABA treatment. These data suggest that the Cat1 and Cat2 of maize respond differentially to ABA, and the response of each Cat gene to ABA is developmental-stage-dependent.
Figure 12 CAT response to ABA in 6 dpi scutella. Changes in catalase isozymes and activity in the presence of ABA. Embryos were isolated from 5 dpi W64A seedlings and treated with increasing doses of ABA for 24 hr in the dark. Scutella were isolated from treated embryos, and equal amounts of protein were examined by zymogram analysis for catalase activity. The CAT-2 homotetramer is indicated by an arrow. The number below each lane represents total catalase activity (unit per mg protein) after ABA treatment.

372 J.G. Scandalios, L. Guan, and A.N. Polidoros
Addition of ABA in culture medium leads to a large increase in Cat1 RNA accumulation in excised immature embryos but not in the germinating mature embryos. The Cat1 transcript, however, also accumulates to high amounts in scutella of germinating embryos, where ABA content is low and decreasing, indicating that ABA up-regulates Cat1 transcript accumulation in scutella during embryogenesis but not during germination (Williamson and Scandalios 1994). Thus, factors other than ABA control Cat1 expression during germination.
The Cat1promoter has been sequenced, revealing several regulatory elements, and has been used for the construction of promoter-reporter gene fusions that can drive the expression of the reporter gene Gus in transgenic tobacco. A minimal 800-bp promoter fragment is sufficient for the regulation of Gus expression with a pattern similar to the Cat1 expression observed in maize (Guan and Scandalios 1993). An ABA-responsive element (the G-box-consensus sequence Em1a) (Guiltinan et al. 1990) was located at -110 relative to the transcriptional start site and displays differential binding of nuclear proteins isolated from germinated and developing embryos (Fig. 13A) and from embryos grown in the presence and absence of ABA (Fig. 13B). Southwestern analyses show that one protein (CAT1BP-20) accumulated in the absence of ABA in immature embryos and in germinating mature embryos (Fig. 13C), suggesting that a repressor-mediated mechanism accounts for at least a portion of the ABA regulation of Cat1. Indoleacetic Acid Auxin (indoleacetic acid; IAA) was the first plant hormone to be identified. It regulates many aspects of plant growth and development including cell elongation, tissue differentiation, maintenance of tissue polarity, and leaf expansion. IAA is the principal naturally occurring auxin in most plants. The effects of IAA on the expression of maize catalase gene expression were examined at several developmental stages during seed maturation and germination. Results showed that IAA enhances the expression of catalase isozymes at every developmental stage examined, even at 12 dpi when ABA has no effect on CAT expression. Total catalase activity increased upon IAA treatment, with CAT-2 being the major isozyme contributing to the total catalase activity increase (Fig. 14). CAT-1 isozyme activity also increased with IAA treatment, but to a lesser extent. IAA treatment also enhanced the germination process of maize embryos during the late stages of seed maturation and early stages

Catalases in Plants 373 of germination. It has been reported that the endogenous content of IAA in germinating maize seeds increases up to threefold after 36 hours postimbibition and then drops to low levels after 72 hours postimbibition (Tillberg 1977). It is interesting to note that the developmental profile of catalase activity in scutella matches that of IAA content in the germinating seeds. All this implies that IAA may play a role in controlling the developmental pattern of catalase expression in scutella during seed germination. The action of IAA on maize scutella may promote the initial increase and retention of catalase activity during the early stages of seed germination. Photoregulation and Photooxidative Stress The three maize catalase genes respond differentially to light signals. The expression of the Cat1 gene is light-independent throughout development (Scandalios 1994). The control of Cat2 expression in maize leaves in response to light (Skadsen and Scandalios 1987) appears to involve a unique form of translational inhibition in leaves grown in constant dark (DD), preventing translation of isolated Cat2 mRNA. The mRNA is rendered translatable only after the leaves are exposed to white light, leading to a dramatic induction of the CAT-2 isozyme in leaves when DD-grown seedlings are exposed to light (Skadsen and Scandalios 1987; Scandalios 1994). Cat3 exhibits a transcriptionally regulated circadian rhythm (Redinbaugh et al.1990a; Acevedo et al. 1991; Abler and Scandalios 1993, 1994; Boldt and Scandalios 1995). This differential light response of the three maize catalases is also reflected in the expression pattern during photooxidative stress caused by UV irradiation.
We have recently shown (Boldt and Scandalios 1997) that UV light pulses in the range of 240-400 nm could entrain the Cat3 circadian expression (see Circadian Regulation of Plant Catalases below) and cause a strong transient induction of Cat2. The most distinct response was obtained with UV light in the range of 290-400 nm (containing UV-B and UV-A). This effect was reduced by about 60% when the UV-B portion was removed using a polyester filter (240-310 nm cutoff). This reduction was reversed by applying UV light plus visible light. The reversibility of the UV-light effect indicates DNA damage that can be repaired via photoreactivation. However, UV-light pulses in the range of UV-B and in the range of UV-AIblue light applied with visible light caused a similar induction of Cat2 mRNA accumulation. Therefore, it is suggested that the induction of Cat2 may be also mediated by a UV-B and a UV-AIblue light photoreceptor. The transient character of the induction

374 J.G. Scandalios, L. Guan, and A.N. Polidoros

Catalases in Plants 375 of Cat2, and its repair by photoreactivation, imply an early response to UV-light stress.
A slight induction of Cat2 was also observed after long-term exposure to UV light. However, the level of Cat2 transcript accumulation was lower than that obtained with UV-light pulses, even though the transcript level remained slightly enhanced over the standard controls. Considering the stable circadian expression of Cat3 under UV-light stress, Cat2 may ensure a basic level of H202 scavenging, particularly at the period when Cat3 reaches a minimum during its circadian oscillation. Figure 13 Band-shift and Southwestern blot analysis of DNA-binding proteins from scutella of immature and germinated embryos, and from scutella of +ABA and -ABA-treated embryos. Embryos were excised from germinated kernels of the maize inbred line W64A at 5 dpi and from developing kernels at 23 dpp. Embryos were also excised from developing kernels 23 dpp and incubated for 14 hr in the dark on GM alone (-) or GM supplemented with i0-4 M RIS racemic ABA (+). Embryo axes were removed, and total nuclear proteins were isolated from the scutella. (A) Band-shift analysis of nuclear protein extracts from scutella of immature and germinated embryos. Binding reaction containing end-labeled 188-bp Cat1 promoter (containing ABRE Emla) alone or probe incubated in the presence of nuclear extracts (5 ijg) from either 5 dpi or 23 dpp scutella were separated on 7% polyacrylamide Tris-acetate EDTA gels. Reactions also contained 30-fold excess poly(dI-dC) alone(dI-dC) or in combination with unlabeled 28-bp Emla oligonucleotide (+Emla) or unlabeled Oct-i DNA consensus (+Oct-1) as competitor DNA. Migration of free probe (fp) and major retarded bands are indicated (-). The major band enhanced in the absence of ABA is indicated by an arrowhead. (B) Band-shift analysis of nuclear protein extracts from scutella of +ABA- and -ABA-treated developing embryos. Probes used in these experiments were prepared by end-labeling a 28-hp synthetic oligonucleotide spanning the G-box consensus sequence Emla. Binding reactions containing the end-labeled 28-bp Emla oligonucleotide incubated in the presence of nuclear extracts from either +ABA- or -ABA-treated scutella from 21 dpp immature embryos (10 and 5 ~g, respectively) were separated on 7% polyacrylamide Tris-Gly gels. Migrations of free probe (fp) and major low-mobility complexes are indicated (-). The major band enhanced in the absence of ABA is indicated by an arrowhead. (C) Southwestern blot analysis of DNAbinding proteins present in nuclear extracts of scutella of immature and germinated embryos or in nuclear extracts of scutella from +ABA- and -ABAtreated embryos. Nuclear extracts were separated on 12% SDS-PAGE gels, renatured, and blotted to nitrocellulose. Blotted proteins were probed with endlabeled 28-bp oligonucleotide containing Emla sequence. Blots were rinsed free of excess probe, and protein-binding labeled promoter DNA was visualized by autoradiography. Migration of molecular mass standards is indicated.

376 J.G. Scandalios, L. Guan, and A.N. Polidoros
Figure 14 Changes in catalase isozymes and activity in the presence of ABA and IAA in 12 dpi scutella. Embryos were isolated from 12 dpi W64A seedlings and treated with different doses of ABA or IAA for 24 hr in the dark. Scutella were isolated from treated embryos, and equal amounts of protein were examined by zymogram analysis for catalase activity. Positions of the CAT-2 and CAT-1 homotetramers are indicated by arrows; intermediate bands are CAT1/CAT-2 heterotetramers. The number below each lane represents total catalase activity (unit per mg protein) after ABA or IAA treatment.
In N. plumbaginifolia leaves, Cat1 and Cat2 (not identical to the maize Cat1 and Cat2 genes) transcript levels changed dramatically in response to UV-B stress; Cat1 was repressed, whereas Cat2 was induced fourfold after UV-B exposure. In addition, tobacco Cat3 (also not identical to the maize Cat3 gene) was induced by UV-B (Willekens et al. 1994a). These data suggest a distinct role of catalases in response to UVB-stressed N. plumbaginifolia leaves. Circadian Regulation of Plant Catalases The Cat3 gene of maize (a monocot C4 plant) was the first catalase gene reported to exhibit a transcriptionally regulated circadian rhythm (Redinbaugh et al. 1990a). Since then, three additional plant catalases (in dicot C3 plants), the Arabidopsis CAT2 (Zhong et al. 1994) and CAT3 (previously called CA Ti; Zhong and McClung 1996), and the Cat1 gene of N. plumbaginifolia (Willekens et al. 1994c) have been shown to be transcriptionally regulated by a circadian clock. Among them, two different patterns of circadian regulation are observed. The maize Cat3 and the Arabidopsis CAT3 show maximal expression late in the light period, approximately 10 hours after the light onset (CT-b, circadian time) and minimal transcript accumulation late in the dark period at CT-22. The Arabidopsis CAT2 and the N. plumbaginifolia Cat1 exhibit a circadian
Catalases in Plants 377 rhythm similar to the typical rhythm observed for the photosynthetic genes cab and rbcS with maximal transcript accumulation early in the light, and minimal at the start of the dark period. Considering that different patterns of circadian expression of catalase genes are present within the same (Arabidopsis) as well as between different plant species (Arabidopsis, Z. mays, N. plumbaginifolia), it is reasonable to assume that each gene fulfills different metabolic roles. In C3 plants like Arabidopsis and N. plumbaginlfolia, the phase of accumulation of catalase transcripts early in the light period coincides with that of photosynthetic genes and is in good agreement with a potent role of catalase in decomposing H202 generated during the photorespiratory oxidation of glycolate in the peroxisome (Ogren 1984).
Photorespiration in maize, a C4 plant, occurs to a lesser degree as compared to C3 plants, and the phasing of Cat3 in maize with maximal expression late in the light period and early in the dark period suggests that the role of this gene is likely not associated with photorespiration. The existence of a C3 plant catalase (Arabidopsis CA T3) exhibiting a similar circadian expression phase as Cat3 of maize (C4) implies a common metabolic necessity in C3 and C4 plants for catalase during the dark period. The nature of such a metabolic requirement remains obscure. However, there is substantial evidence that the maize CAT-3 protein is associated with the maize mesophyll mitochondria.
In C4 plants, malate oxidation in mesophyll mitochondria is sensitive to cyanide and shows strong respiratory control, as in mitochondria from leaves of C3 species and etiolated tissues. In bundle-sheath mitochondria, however, malate oxidation is largely insensitive to cyanide and shows no respiratory control. On the other hand, this oxidation is strongly inhibited by salicylhydroxamic acid (SHAM), showing that the alternative oxidase is involved (Douce 1985). Localization of CAT-3 in mesophyll mitochondria is in good agreement with ROS production during cyanide-sensitive respiration. The need for the circadian oscillation of Cat3 may be explained by two different hypotheses that converge to a fluctuation of ROS produced during the dark-light cycles. First, mitochondrial respiration can be higher late in the light period and in the early dark period when metabolites from photosynthesis are amply supplied. Later, during the dark period, the rate of respiration becomes lower as metabolites are depleted. That could result in a fluctuation of ROS produced at a rate similar to that of respiration. Second, the engagement of the alternative oxidase in the maize mesophyll cells could be light-dependent. Actually, differential engagement of the alternative oxidase during the darklight cycle has been reported in plants with crassulacean acid metabolism

378 J.G. Scandalios, L. Guan, and A.N. Polidoros (CAM) (Robinson et al. 1992). Light-dependent induction of the alternative oxidase pathway (AOP) has been reported in etiolated soybean cotyledons exposed to light (Robinson et al. 1995). The physiological role of the AOP is still uncertain (with the exception of a few cases, as in Arum lilies wherein the AOP is apparently directly related to thermogenic metabolism). Several lines of evidence lead to the suggestion that the AOP may be related to prevention of oxidative stress. An apparent induction of alternative oxidase by superoxide in the yeast Hansenula anomala has been shown (Minagawa et al. 1992). It has also been suggested that oxidation of ubisemiquinones by the alternative oxidase would prevent them from reacting with molecular oxygen to generate superoxide (Purvis and Shewfelt 1993). Apparently, diversion of the electron flow from the cytochrome pathway where the sites of free radical production are present could result in lower ROS production. If that is true, then inhibition of the AOP could result in induction of other protective mechanisms for ROS scavenging.
Our working hypothesis (currently under investigation in our laboratory) is that a diurnal fluctuation of ROS produced by mesophyll mitochondria, dependent on the metabolite accumulation-consumption rhythm and/or differential alternative oxidase engagement during the dark-light cycle, could account for the necessity of the circadian rhythm of Cat3, whose product is associated with mitochondria.
There are many additional differences between the oppositely cycling catalases CAT2 of Arabidopsis and Cat3 of maize. The Arabidopsis CAT2 mRNA reaches a peak of abundance 1 dpi in continuous dark (DD) or continuous light (LL)-grown seedlings. A second peak of mRNA abundance appears 6 dpi only in light-grown seedlings and may be associated with the development of photosynthetic competence and induction of photorespiration. This second peak is regulated by light and is not seen in etiolated seedlings. CAT2 mRNA accumulation is induced by exposure to high-fluence blue or far-red light but not by red light. In addition, light induction is unaffected by mutations that block blue-light-mediated inhibition of hypocotyl elongation (bluel, blue2, blue3, hy4), suggesting phytochrome involvement. Upon transfer of etiolated seedlings to constant white light, CAT2 mRNA rapidly accumulates, and its abundance undergoes robust oscillations with 24-hour periodicity, in-dicating control by an endogenous circadian clock. The rhythm is also present in plants growing under dark-light cycles and persists for at least S circadian cycles when plants are transferred either to constant dark or to constant light, indicating the robustness of the circadian rhythm (Zhong et al. 1994). In contrast, the maize Cat3 mRNA is present at high

Catalases in Plants 379 levels in leaves of either DD- or LL-growing seedlings (Fig. 15) without an apparent oscillation (Acevedo et al. 1991). The same is observed with the Arabidopsis CA T3, as its expression is similar in seedlings germinated and growing either in continuous dark or in continuous light (Zhong and McClung 1996).
The circadian expression of the maize Cat3 gene requires the entrainmg signal of a light-dark cycle. This is a marked difference from what is observed with the Arabidopsis CA T2, or photosynthetic genes like cab (Nagy et al. 1988), which oscillate under continuous light.
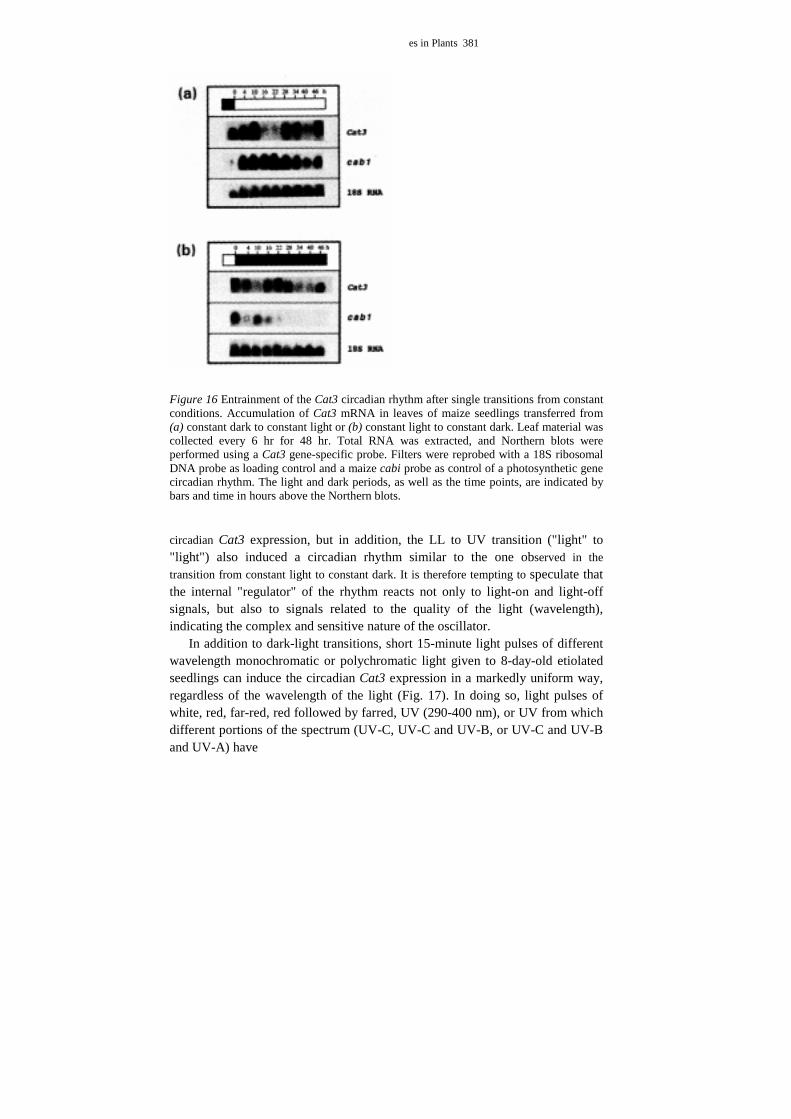
An effort was undertaken in our laboratory to define the necessary conditions for the entrainment of the maize Cat3 circadian rhythm (Boldt and Scandalios 1995). Our results demonstrated that the circadian rhythm of Cat3 is inducible by transferring DD- or LL-growing plants to a cycling dark-light regime. A rhythm is induced by the first D to L or L to D transition, but seems to be more stable and synchronized after a second transition to the initial condition. The photoperiod (12h D/12h L or 8h LI 16h D) does not affect the appearance of the maxima and minima in Cat3 expression which is set at CT-10 and CT-22, respectively. However, a different pattern of circadian expression concerning the phase of the rhythm and related to the initial light conditions is observed when LL- or DD-growing plants are transferred to the opposite continuous regime. When DD-growing plants are transferred to LL (Fig. 16), the induction of the rhythm starts with an increase in mRNA abundance that reaches a maximum 10 hours, and a minimum 22 hours, after the transition, which represents the normal phase of an established rhythm in 12h D/12h Lgrowing plants. The entrainment of the rhythm in plants transferred from LL to DD begins with a rapid decrease of Cat3 mRNA accumulation, reaching a minimum 10 hours, and a maximum 22 hours, after the transition (Fig. 16). In that case, although the phase of the rhythm is the opposite of what was observed in the DD to LL transition, it still represents the normal phase of an established rhythm in plants growing under a 12h D/12h L regime. Thus, the phase in the entrainment of the circadian expression of Cat3 depends on the nature of the transition and is in accordance with the phase of a normal rhythm that exhibits 12h D/12h Lgrowing plants. In a very interesting analysis of the UV-light effects on the induction of the Cat3 circadian expression, Boldt and Scandalios (1997) demonstrated that single transitions of LL- or DD-growing plants to constant full-spectrum (240-400 nm) UV light strongly induce the circadian expression of the Cat3 gene, and significantly, in a manner similar to that observed in DD to LL or LL to DD transitions. Surprising-ly, not only did the DD to UV transition ("dark" to "light") induce the

380 J.G. Scandalios, L. Guan, and A.N. Polidoros
Catalas
es in Plants 381
Figure 16 Entrainment of the Cat3 circadian rhythm after single transitions from constant conditions. Accumulation of Cat3 mRNA in leaves of maize seedlings transferred from (a) constant dark to constant light or (b) constant light to constant dark. Leaf material was collected every 6 hr for 48 hr. Total RNA was extracted, and Northern blots were performed using a Cat3 gene-specific probe. Filters were reprobed with a 18S ribosomal DNA probe as loading control and a maize cabi probe as control of a photosynthetic gene circadian rhythm. The light and dark periods, as well as the time points, are indicated by bars and time in hours above the Northern blots. circadian Cat3 expression, but in addition, the LL to UV transition ("light" to "light") also induced a circadian rhythm similar to the one observed in the transition from constant light to constant dark. It is therefore tempting to speculate that the internal "regulator" of the rhythm reacts not only to light-on and light-off signals, but also to signals related to the quality of the light (wavelength), indicating the complex and sensitive nature of the oscillator.
In addition to dark-light transitions, short 15-minute light pulses of different wavelength monochromatic or polychromatic light given to 8-day-old etiolated seedlings can induce the circadian Cat3 expression in a markedly uniform way, regardless of the wavelength of the light (Fig. 17). In doing so, light pulses of white, red, far-red, red followed by farred, UV (290-400 nm), or UV from which different portions of the spectrum (UV-C, UV-C and UV-B, or UV-C and UV-B and UV-A) have

382 J.G. Scandalios, L. Guan, and A.N. Polidoros
Figure 17 Influence of polychromatic and monochromatic light pulses in the induction of the Cat3 circadian rhythm. Accumulation of Cat3 mRNA in leaves of maize seedlings grown under constant dark for 8 days and then subjected to 15-mm light pulses of (a) white light, (b) red light, (c) far-red light, (d) red followed by far-red light, (e) blue light, and (1) UV light in the range of 290-400 nm. After the light treatments the plants were placed back into constant dark, and leaf material was collected before the light pulse (DC dark control), immediately after the light treatments and then every 4 hr for 48 hr. Total RNA was extracted, and Northern blots were performed using a Cat3 gene-specific probe. Filters were reprobed with a 18S ribosomal DNA probe as loading control and a maize cabi probe as control of a photosynthetic gene circadian rhythm. The light and dark periods, as well as the time points, are indicated by bars and time in hours above the Northern blots. been removed, using appropriate filters, can rapidly induce Cat3 mRNA accumulation that reaches a maximum 4-8 hours after the pulse. The Cat3 mRNA decreases thereafter, reaches a minimum 12-16 hours after the pulse, and then peaks again 24-28 hours after the pulse. These results indicate that the Cat3 circadian expression is regulated by a very low fluence phytochrome response and/or a blue-light/UV-A and a UV-B photoreceptor (Boldt and Scandalios 1995, 1997).

Catalases in Plants 383
The Cat3 mRNA damps to constant expression levels when 12h D/12h L-growing plants are transferred to continuous light or darkness. Damping of the rhythm occurs rapidly, and slight oscillations are detected 3 days after transfer to constant conditions (Abler and Scandalios 1994), in contrast to the observed robust oscillations of the Arabidopsis CAT2 gene, which persist for 5 days after transfer to constant conditions (Zhong et al. 1994). Because the Cat3 gene is continually transcribed in the absence of a cycling light regime, the normally ob-served diurnal variation of Cat3 expression has been proposed to be the result of a circadian-regulated transcriptional repressor (Acevedo et al. 1991).
Studies with other plant genes have fortified the assumption that light-responsive and circadian-responsive sequences are located in the 5 '-flanking regions of structural genes (Nagy et al. 1988; HerreraEstrella and Simpson 1990; Millar and Kay 1991; Borello et al. 1993; Anderson and Kay 1995; Carre and Kay 1995; Teakle and Kay 1995). The complete genomic sequence of the maize Cat3 gene has been isolated and characterized (Abler and Scandalios 1993). Recent reports and knowledge on light and circadian regulation of more plant genes has prompted us to reexamine the Cat3 5 'upstream region for the presence of regulatory motifs. Several transcription factor-binding sites were recognized and, surprisingly enough, the presence of a transposable element in the Cat3 promoter was identified. The transposable element located at -171 belongs to a large family of small inverted repeat elements designated "Tourist" (Bureau and Wessler 1992), first described in the wx-B2 mutation of maize. Members of this family of elements are highly repetitive in genomes of some and perhaps all members of the grasses, are associated with insertion mutations, and are also found in the introns and flanking sequences of wild-type genes (Bureau and Wessler 1994). Of all Tourist elements reported in S '-flanking sequences of wild-type genes to date, only the one found in the Cat3 5'-flanking region is proximal to the promoter. Moreover, the sequence of this element, termed Zml3, revealed very interesting motifs that are not present in other members of the Tourist family. The terminal inverted repeats of the element are two oppositely oriented core motifs of the 5V40 enhancer (Hatzopoulos et al. 1988), located in a perfect palindrome with sequence CAATCCAT|ATGGATTG (the vertical axis denotes the symmetry center). The two CAAT boxes of each palindrome are two of the three CCAAT motifs located on the Cat3 promoter. The third CCAAT motif is also present within the transposable element overlapping a GATA repeat present at -196. This region shares striking similarities with the -111 to

384 J.G. Scandalios, L. Guan, and A.N. Polidoros -38 region sequence of the Arabidopsis CAB2 promoter that has been shown to be sufficient for induction of a luciferase (luc) reporter gene by red light in etiolated tobacco plants, as well as for rhythmic expression in green tissue (Anderson et al. 1994). The GATA repeat of the Arabidopsis CAB2 promoter lies between -55 and -74 and serves as a binding site for the GATA-binding protein CGF-1 that is closely related to the GT-1 transcriptional factor and can play a role in light regulation (Teakle and Kay 1995). In vivo analysis of CAB2::luc fusion constructs in transgenic Arabidopsis demonstrated that a circadian-regulated element lies within a 36-bp sequence immediately upstream of the GATA repeat that overlaps a conserved CCAAT box and contains binding sites for three putative transcription factors (Carre and Kay 1995). On the basis of the evidence provided from the described analyses of the Arabidopsis CAB2 gene (probably the most well characterized circadian-regulated plant gene at the molecular level), it is likely that the Zml3 transposable element present in the Cat3 promoter is a perfect candidate regulatory sequence directing the light-inducible and circadian expression of the gene. If that is true, we may be able to identify maize genotypes lacking the transposable element in the promoter of the Cat3 gene and, thus, not exhibiting a circadian rhythm. Alternatively, in genotypes exhibiting circadian regulation of the Cat3, we shou~d be able to identify the Zml3 element in the Cat3 promoter. Actually, limited data (obtained after analysis of three different genotypes) indicated that genetic background and allelic variation do not directly affect the temporal pattern of Cat3 accumulation in leaves (Acevedo et al. 1991). It would be very interesting to examine these genotypes for presence of the Zml3 element in the promoter of the Cat3 gene. Certainly the most efficient way to provide evidence for the regulatory role of the element is to use transcriptional fusions with a reporter gene and to examine the pattern of the reporter's expression in transient assays and/or transgenic plants. Such approaches are currently pursued in our laboratory to obtain thorough insights into the molecular basis of the maize Cat3 circadian regulation of expression. STRUCTURE AND CHARACTERIZATION OF THE THREE MAIZE CATALASE GENES An essential element in any effort to understand the underlying mechanisms by which the Cat genes perceive signals and effect a response is the understanding of the architecture of each gene and its regulatory components. To these ends, the available cDNAs (Scandalios 1992) were effectively used to isolate and characterize the maize Cat genes.

Catalases in Plants 385
Figure 18 Restriction map of the maize Cat1, Cat2, and Cat3 genes. The map was constructed from clones isolated from a maize W64A genomic library. The black box indicates the DNA fragments that hybridized to the full-length Cat1, CatZ or Cat3 cDNA probe, respectively. The introns, coding region, and 5'-and 3'-flanking regions are indicated. Restriction sites are: (A) Aval, (B) BamHI, (C) Clal, (D) HindIll, (E) EcoRI, (H) HindIl, (N) NcoI, (P) PstI, (S) Sad, (Sp) SphI, (X) XbaI.
The Cat1, Cat2, and Cat3 genes of maize have been isolated from W64A and fully characterized (Abler and Scandalios 1993; Guan and Scandalios 1993; Guan et al. 1996). The structural map of each of the three maize catalase genes shows differences and similarities in their structural components (Fig. 18). Each gene has been sequenced, and the coding region is almost identical to its respective cDNA, except the variable introns in each gene. The Cat1, Cat2, and Cat3 genes are interrupted by six, five, and two introns, respectively. Some of the introns in each gene share identical positions (Fig. 18). The third intron of the Cat1 gene is missing in its relative position in the maize Cat2 gene and only the first (#1) and the last (#6) introns of the Cat1 gene are found in the same position of the maize Cat3 gene. The relevant introns among the three catalase genes share no sequence identity and vary in size. All intron/exon junctions obey the GT/AG rules described in other eukaryotic genes (Shapiro and Senapathy 1987).
The start of transcription for each of the three maize catalase genes was determined by primer extension. The Cat1 and Cat3 genes contain promoter sequences of approximately 2.6 kb, whereas the promoter region of the maize Cat2 gene is only about 1.6 kb. There is no sequence homology among the three maize catalase promoters. The TATA-like sequence is only found in the promoter of the maize Cat2 gene, but no

386 J.G. Scandalios, L. Guan, and A.N. Polidoros CAAT-like consensus sequence was found in the Cat2 promoter. In contrast, CAAT consensus sequences were found in the Cat1 and Cat3 gene promoters. No typical TATA-like sequences are present at the usual locations of either the Cat1 or Cat3 gene.
Computer searches revealed that the promoter of each Cat gene contains a unique set of putative cis-acting elements (Fig. 19), which are important for eukaryotic gene regulation. In the promoter region of the Cat1 gene, two GC-rich sequences with one nucleotide mismatch relative to the core sequence of the GC box (CCGCCG, GGGCTG) (Dynan and Tjian 1985) were identified. Such sequences serve as binding sites for the protein Spi and have been found in promoters of many viral and cellular genes (Kadonaga et al. 1986). Two 8-bp sequences (CACGTACG, CACGTGGA) which are similar to an ABA response element (ABRE, CACGTGGC) (Guiltinan et al. 1990) were located at -110, -220 relative to the start of transcription (+1) of the Cat1 gene. An 1 1-bp element (5 '-AGTGACATTGG-3'), located at -470 was identified which is homologous to the antioxidant responsive element (ARE, 5' -puGTGACNNNGC-3') of the rat glutathione S-transferase Ya subunit and rat NAD(P)H:quinone reductase genes (Favreau and Pickett 1991; Rushmore et al. 1991). The ARE might represent a cis-acting element that activates genes that protect eukaryotic cells against oxidative stress. One 1 10-bp fragment from -622 to -512 of 5'-flanking region of the Cat1 gene is 80% homologous to the first 100 bp of the coding region of the U2 snRNA gene of maize and potato (Brown and Waugh 1989; Waugh et al. 1991). A 26-bp element within this fragment is identical to part of the U2 snRNA gene from both organisms. The major function reported for U2 products is to form the ribonucleoprotein complex for intron splicing (Steitz et al. 1988). The potential function of this fragment in the Cat1 5 'region needs to be investigated further. Two direct repeats were identified further 5 'upstream. Two adjacent 32-bp perfect repeat sequences were located between -902 and -871 relative to the +1 site. Another 51-bp direct repeat with a 6-bp mismatch was identified between -530 and -1426.
The possible regulatory roles of ARE, as well as that of other regions or elements of the Cat1 promoter, for the expression of the gene in the scutellum during germination were examined. Interactions of nuclear proteins isolated from 10 dpi scutella with promoter regions of Cat1 have been examined by electrophoretic mobility shift assays. Results indicate that a 158-bp fragment containing the ARE core sequence, as well as a 90-bp fragment located 5' and in continuous sequence with the 158-bp fragment containing part of the U2 snRNA sequence, interacts strong-

Catalases in Plants 387


388 J.G. Scandalios, L. Guan, and A.N. Polidoros
Figure 20 Electrophoretic mobility shift assay probed with a 90-bp XbaI-Sa~A Cat1 promoter fragment containing the U2 snRNA homologous region. The 90-bp probe (1 ng labeled DNA) in binding buffer containing 100 ng poly(dI-dC) nonspecific competitor was incubated with (lane 1) no nuclear extract and no specific competitor (-,-) (lane 2) 0.1 mg nuclear extract and no specific competitor (+,-); and (lane 3) 0.1 mg nuclear extract and 30x cold probe-specific competitor (+,+). A shifted band was detected when the probe was incubated for 20 mm at room temperature with nuclear proteins and disappeared after addition of 30x cold probe in the binding mixture, indicating the specificity of the binding. The Free Probe and Bound Probe bands are indicated by arrows. ly with nuclear extracts (Fig. 20). Experiments are in progress to examine analogous interactions in early germination and to define their importance in the regulation of Cat1 expression during germination.
In the promoter region of the Cat2 gene, two GC box-like sequences (GCGCGG, GGGCAG) were found around nucleotides -114 and -570. Two 8-bp sequences (CACGTCGC, CACGTAAC), which are similar to an ABRE, were located at -308, -648 relative to the +1 site. The core sequence of the ABRE (ACGT) is the binding site for basic leucine zipper transcriptional factors or common plant regulatory factors (CPRFs) (Armstrong et al. 1992). Promoter elements with an ACGT core are recognized by both homo- and heterodimers of leucine zipper transcriptional factors. An 1 1-bp element (GGTGACCTTGC), which is identical to the ARE, PuGTGACNNNGC) of the rat glutathione S-transferase Ya subunit, was identified at a position close to the +1 site. Two direct ACGT repeat sequences, which is the core sequence for leucine zipper protein-binding sites, were located at about 15 bp downstream of the +1 site. A DNA motif, CAGGTG, which is identical to the core sequence for a class of transcriptional factors bHLH (CANNTG, basic helix-loop-

Catalases in Plants 389 helix proteins), was located near the +1 site and overlapping with the 5' portion of the ARE motif. This transcriptional factor shares similarities with the basic leucine zipper family and can form homo- and heterodimers to exert regulatory functions (Pabo 1992). Two additional bHLHbinding motifs (CATCTG, CATTTG) were also found at -245 and -625 relative to the +1 site. Both of them are located downstream from the two leucine zipper core sequences ACGT. A DNA sequence (CGTCCCGGAACG) was located at -480 with 2-bp mismatch to the 12-bp metal-responsive element (MRE, CGNCCCGGNCNC) core sequence (Stuart et al. 1984). This motif can be found in the promoter region of metal-lothionein proteins that bind heavy metal ions and has been functionally implicated in heavy metal detoxification (Westin and Schaffner 1988).
The promoter of the Cat3 gene has a unique feature among the three maize catalases. At position -171, a 137-bp Tourist transposon element is located (Bureau and Wessler 1994). This element harbors putative cisacting motifs. Their significance in the regulation of the Cat3 gene was discussed above (see Circadian Regulation of Plant Catalases). Putative regulatory motifs have been identified in the Cat3 S 'upstream region. Among them are motifs identified in the two other catalases as the ACGT core at position -606, the bHLH motif at -16, -136, -180, -236, -328, -649, -920, and the ARE motif at -148 (with 1-bp mismatch) and -2404. Several additional putative cis-acting elements were identified on the Cat3 5 '-flanking sequence. Two motifs serving as binding sites for light-regulated transcriptional factors, the GT-1 consensus binding motif (G/T)(A[[)GTGPu(A/T)AA(A/T)Pu(A/T) (Green et al. 1988) and the 1-box or GATAA motif (Terzaghi and Cashmore 1995), were found repeatedly in the Cat3 promoter. GT-1-binding sites are located at -174, -332, -556, -796, and GATAA motifs at -428, -721, and -842. The binding site GGGPuNNPyPyCC of the mammalian factor NF-KB (Meyer et al. 1993; Poellinger 1995), which is related with oxidative-stress responses, was identified at -423. A TGACG motif that exists in many plant promoters and is related with transcriptional activation of several genes in response to auxin and/or salycilic acid (Terzaghi and Cashmore 1995) is located at -108.
Two motifs with the sequences (C[F)AAC(G/T)G (Myb-like) and ACCTAC(A/C) (H-box) serve as binding sites for the mammalian Myblike transcriptional activators. Myb-like regulatory proteins exist in plants like the P and Cl proteins of maize (Paz-Ares et al. 1987) that control the expression of anthocyanin biosynthetic genes. Myb-like proteins modulate transcription of several genes of the phenylpropanoid pathway in maize, as well as in some other plant species. The binding

390 J.G. Scandalios, L. Guan, and A.N. Polidoros sites for Myb-like proteins are present in the Cat3 S 'upstream region at the positions -992, -1509, -1527, -2424, -2584, and the H-box at -1988.
The RY motif CATGCATG is present in the 5 'upstream region of a large number of plant genes mostly expressed during seed development (Baumlein et al. 1992). It is also present as the SphI element in the 5V40 enhancer (Zenke et al. 1986). Destruction of this motif by short internal deletions nearly abolishes the function of the Cl maize gene (Hattori et al. 1992) and the legumin B4 gene of Vicia faba (Baumlein et al. 1992). Strong positive effects have also been reported for glycinin (Lelievre et al. 1992) and b-conglycinin (Chamberland et al. 1992) expression in soybean. In contrast, in V. faba, the RY motif of the usp gene promoter exerts a silencing effect, since its destruction increases transcription (Fiedler et al. 1993). It has been hypothesized that positive or negative effects of the RY motif in transcription are controlled by the presence of enhancers, or silencer-like elements, upstream of the motif (Baumlein et al. 1992; Fiedler et al. 1993). In addition, the hypothesis is supported by a number of reported unsuccessful attempts to demonstrate binding of nuclear proteins to the RY motif (Riggs et al. 1989; Meaklm and Gatehouse 1991). In Cat3, the RY motif is present at -386. In a region about 20 nucleotides upstream of the RY motif, the NF-icB-binding site is located, and about 30 bp downstream, we found a perfect GT-1 box. The functional significance of the above-described putative regulatory sequences in the maize catalase gene promoters are currently under investigation in our laboratory. MOLECULAR EVOLUTION OF MAIZE CATALASES AND THEIR RELATIONSHIP TO OTHER PLANT CATALASES Comparison of nucleotide and deduced amino acid sequences indicated that the three maize catalases are not very highly conserved. The maize CAT-1 and CAT-3 proteins are more closely related to other plant catalases than to each other. To better understand the relationship between maize catalases and other plant catalases, available nucleotide and protein sequences were used to examine any apparent evolutionary correlations. We analyzed 16 plant catalase protein sequences. Phylogeny was constructed using the unrooted parsimony method (Felsenstein 1993). We also compared the codon usage of the 16 plant catalases and the gene structures of known plant catalases, especially the intron position within each gene. Structure-function (where available) relationships have also been considered.

Catalases in Plants 391 Molecular Phylogenies of Plant Catalase Proteins We utilized the parsimony method to establish the degree of phylogenetic and evolutionary links among the various plant catalase proteins (Guan and Scandalios 1996). The parsimony tree (Fig. 21) required a total of 899 steps. In general, plant catalases can be divided into three groups. The major group includes the monocot maize CAT-1 and most of the dicot catalases. The second group includes the N. plumbaginifolia CAT-3 and tomato catalase, and the third group includes the monocotspecific catalases maize CAT-3, rice CAT-A, and barley CAT-2. The monocot-specific catalases (group III) form a single group supported by the bootstrap values (Felsenstein 1985) of 100%. N. plumbaginifolia CAT-2 and tomato catalases seem to derive from the same ancestor and are supported by 100% bootstrap values. Within group I, catalases can be separated into two major clades: the monocot and the dicot clades. The soybean and pea catalases appear more closely related to monocot CAT
Figure 21 Unrooted phylogenetic tree based on the amino acid sequences of 16 plant catalases constructed by the parsimony method. The maximally parsimonious tree required a total of 899 steps. The numbers at the nodes are the bootstrap values from 100 replicate samples. The three maize catalases are indicated in boxes.

392 J.G. Scandalios, L. Guan, and A.N. Polidoros 1-like clades than the dicots. The relationship among dicot catalases in group I is not clear because of the low bootstrap value. The cotton CAT-2 and N. plumbaginifolia CAT-1 form one dade in both trees, but with low bootstrap values of 53%. The maize CAT-2 is most related to the group I, supported by 100% bootstrap values in the parsimony analysis.
These results clearly indicate that most of the dicot catalases and some monocot catalases are very closely related to each other (group I). Monocot-specific catalases (group III) are closely related, but have low sequence identities with other plant catalases. The sequences which are more like the maize CAT-3 are found only in monocot plants and may derive from either the maize CAT-2 or CAT-1-like sequence after the monocot/dicot separation. The nucleotide sequence alignment among plant catalase cDNAs generated similar sets of results, except that the monocot-specific catalase sequences are mostly related to the Cat2 of maize rather than the N. plumbaginifolia Cat1 and the cotton Cat2, as determined by the amino acid sequence comparison. This implies that the maize CAT-3-like sequences in monocots may derive from maize CAT-2-like sequences after the separation of monocots and dicots, and the Cat3 gene maintained the high G + C at the third codon position. These two sets of genes might have been under different evolutionary pressures, causing the divergence in amino acid similarity. To date, the Cat2-like sequence has been found only in maize. It is not clear whether this sequence has been lost in other monocot plant genomes, or whether it may just not yet have been identified in other species. Codon Usage at the Third Nucleotide Position of 16 Plant Catalases The three maize catalase genes have different nucleotide preferences at the third codon position (Bethards et al. 1987; Redinbaugh et al. 1988). Cat1 has no codon bias at the third position with a G + C content of about 51%; however, Cat2 and Cat3 have extremely high codon biases at the third position with a G + C content of about 95%. Therefore, we examined the G + C content at the third position of all 16 plant catalases (Table 3). Surprisingly, all dicot catalases have less than 50% G + C at the third codon except the sweet potato catalase (65%). Catalases in one monocot dade (including maize Cat1, rice CatB, and barley Cat1) which are close to the dicot catalases have G + C contents ranging from 51% to 59%. The monocot-specific catalases show extremely high G + C content at the third positions (94-96%). These observations correlate well with the results of the phylogenetic trees. Finally, the Cat2 of maize and sweet

Catalases in Plants 393 Table 3 The percentage of G+C content at the third codon positions of 16 plant catalase genes Cat gene % G+C content Cat gene % G+C content Barley2 96 Maizel 51 RiceA 95 Cotton1 48 Maize2 95 Cotton2 45 Maize 3 94 N. plumbaginifolial 44 Sweet potato 65 N. plumbaginifolia2 44 Barleyl 59 N. plumbaginifolia3 47 Soybean 54 Tomato 43 RiceB 52 Pea 43 potato catalase have low sequence identity to other plant catalases and, therefore, were classified separately from the above groupings. These two catalases also show a high codon bias at the third position. These observations are not limited to catalase genes; in fact, higher GC contents at the third codon position are very common in other monocot genes, but not common in dicot genes (Murray et al. 1989; Campbell and Gown 1990). Exactly when and how this event occurred in monocot genes is not known. In unicellular organisms, codon bias reflects the tRNA population and the level of specific gene expression (Ikemura 1985). In rabbit, the muscle-specific glycogen phosphorylase cDNA has a high nucleotide bias for G or C in the third codon position (86%), whereas the human and the rabbit liver-specific transcript does not (60%) (Newgard et al. 1986). Other organisms such as thermophilic bacteria and the protozoan Leishmania, which are exposed to such environmental stresses as high temperature and low pH, respectively, have high G + C content in their coding sequence (Bibb et al. 1984; Kagawa et al. 1984). This is presumably due to the stability of the GC base pairs that stabilizes the processes of gene replication, transcription, and translation. Thus, the codon bias of the maize Cat2 and Cat3-like sequences may play a role in the regulation and expression of these genes. In fact, the expression of the three catalases in maize is highly regulated. The Cat1 of maize is expressed, at low levels, in almost all tissues examined, whereas Cat2 and Cat3 are expressed in specific tissues and developmental stages and respond more dramatically to environmental signals. This suggests that CAT-1 may predominantly function as the base-level scavenger of H202 in plant cells. The CAT-2 and CAT-3 of maize are highly regulated and may serve additional and divergent functions (Scandalios 1994).

394 J.G. Scandalios, L. Guan, and A.N. Polidoros Intron Position and Evolution Sequence data indicate that for each of the three maize Cat genes the genomic coding region corresponds to the respective cDNA sequence except for the regions interrupted by introns. The 5, promoter regions of the three maize Cat genes share no sequence identity, possibly explaining the differential regulation observed for each of these genes. The Cat1 gene coding sequence is interrupted by six introns, Cat2 contains five introns, and Cat3 contains only two introns. The intron positions are a good indicator for analysis of the evolution of these genes. We compared the intron positions among plant catalase genes and the relationship with other known non-plant catalase genes from human (Quan et al. 1986), Drosophila (fly), and fungi (Fowler et al. 1993). The position of all plant catalase introns was found to be conserved (Fig. 22). Because of the limited data, we can only speculate that the majority of plant catalase genes may contain six introns. The vast majority of introns in plant genes are found in different positions from the introns in animal genes; however, we found one exception in a plant catalase gene. The castor bean Cat2 contains an extra intron that shares the same position with the human intron 11. The position of intron 3 of soybean catalase does not match any other plant catalase introns; however, it locates two amino acids downstream from the human intron 9, possibly due to intron sliding (Gilbert and Glynias 1993). The castor bean Cat1 gene shares the identical intron number and location with the Cat1 gene of maize. It is also tightly linked to Cat2 of castor bean, indicating a direct duplication event and subsequent loss of one intron. These data imply that the ancestor of plant catalase genes contained seven or more introns with some sharing similar positions to animal introns. If the same intron location of plant (i.e., castor bean) and animal (i.e., human) is a true evolutionary event, this may provide evidence that plant and animal catalases have derived from a common ancestral form. The fungal catalases share no similar intron positions with any other catalase genes. Together with the observa-tion that most of the plant and animal catalases share no similar intron positions, this may imply that the fungi and most of the plant and animal introns were inserted at later stages following the divergence. The catalase genes tend to lose introns following gene duplication. The Cat2 of maize lost one intron and Cat3 of maize lost four introns following several duplication events. The data presented herein support the evolutionary deletion of introns in the Cat genes in plants. Recently, three catalase genes from rice were also isolated and characterized (Higo and Higo 1995 and pers. comm.). Ca~, the maize Cat3-like gene, possesses three introns with identical positions to most of the plant catalases. The

Catalases in Plants 395
Figure 22 Comparison of intron positions of nine catalase genes from different organisms. The intron positions are located after comparing with the cDNA sequence of the same genes. The nine catalase genes are from maize (Cat1, Cat2, and Cat3), castor bean (Cat1 and Cat2), soybean, human, Drosophila (fly), and fungi (CatR). The arrows indicate the positions of the plant introns that are located at or near the same position as the human Cat introns. rice CatB and CatC have high sequence identity to the maize Cat1 and possess similar introns and position with the Cat1 gene of maize. This further supports our observation that in plants, especially in monocots, there is a general trend in the evolution of intron number reduction. Structural and Functional Relationships among Plant Catalases The relationship among plant catalases has been established from sequence alignment and phylogenetic analysis. We found that the functions of some plant catalases are also conserved between monocots and dicots. The expression of maize catalases has been extensively studied. Cat1 is

396 J.G. Scandalios, L. Guan, and A.N. Polidoros expressed during the early stages of seed germination and Cat2 becomes the predominant form of catalase after 3 dpi (Wadsworth and Scandalios 1989; Redinbaugh et al. 1990b; Scandalios 1994). The two cotton catalases have been reported to have similar patterns of expression (Ni and Trelease 1991). N. plumbaginifolia Cat3 also has a similar pattern of expression to the cotton Cat1 and the maize catalases (Willekens et al. 1994c). The expression in leaves of the maize Cat2 gene is light-dependent, and a similar expression was observed for the cotton Cat2 and Cat1 of N. plumbaginifolia, implying their roles in photorespiration. The maize Cat3 gene ha~ some unique characteristics. It has enhanced peroxidatic activity, and it copurifies with mitochondria (Scandalios et al. 1980a). Cat3 is expressed preferentially in dark-grown maize leaves and in stem (Acevedo and Scandalios 1991) and is under circadian regulation (Redinbaugh et al. 1990a; Boldt and Scandalios 1995), as is the CAT-3 of Arabidopsis (Zhong and McClung 1996). CAT-2 of barley has a high amino acid identity to CAT-3 of maize and is also expressed in stem (Skadsen et al. 1995). CONCLUDING REMARKS Oxygen presents living organisms with a variety of physiological challenges collectively termed "oxidative stress." These challenges are more severe in plants than in other eukaryotes, because plants both consume 02 during respiration and generate 02 during photosynthesis. Catalase, which is present in all aerobic organisms and has efficient enzyme kinetics, plays a crucial role in modulating and/or eliminating H202 from cells.
Unlike animals, all plants examined to date possess multiple enzymatic forms (isozymes) of catalase, as initially demonstrated for maize. Among higher plants, the maize catalases discussed herein have been purified and most extensively characterized genetically, biochemically, and at the molecular level.
The differential regulation and expression of the genetically distinct catalase isozymes during maize development and in response to various exogenous chemical and physical signals provide a clear indication that in addition to scavenging H202, catalases play other important roles. For example, data from several laboratories have indicated that H202 may play an important role in signal transduction; therefore, its modulation by the various catalases within specific cell types or organelles at different developmental stages is likely a critical role of catalases. The eveningspecific expression of CAT-3 in maize and in Arabidopsis suggests a

Catalases in Plants 397 critical role for this catalase in regulating H202 levels during metabolic activity at night. The modulation of catalase and/or H202 levels affects a variety of biological processes ranging from responses to various environmental insults, defenses against pathogens, and specific gene expression (see, e.g., Fig. 8) during development.
The isolation and characterization of the three Cat genes in maize clearly indicate distinct roles for each of the three catalases, in addition to their common role as H202 scavengers. As more plant Cat genes are similarly isolated and characterized, more meaningful data will be derived as to structure/function relationships among a greater diversity of plant species. On the basis of such comparisons to date, plant catalases can be grouped phylogenetically into three distinct classes (Guan and Scandalios 1996). ACKNOWLEDGMENTS We thank Stephanie Ruzsa and Sheri Kernodle for expert technical assistance. Research from the authors' laboratory was supported by research grants to J.G.S. from the National Science Foundation (DCB-91-01238), the U.S. Environmental Protection Agency (R-819360), and the National Research Initiative Competitive grants program, U.S. Department of Agriculture (37-100-0690). The contributions of associates over the years are gratefully acknowledged. REFERENCES Abler, M.L. and J.G. Scandalios. 1991. The CAT-2 null phenotype in maize is likely due to a DNA insertion into the Cat2 gene. Theor. AppL Genet. 81: 635-640.
.1993. Isolation and characterization of a genomic sequence encoding the maize Cat3 catalase gene. Plant MoL BioL 22:1031-1038.
1994. The dark/light transition regulates the cyclic repression of the Cat3 catalase gene in maize leaves and roots. Maydica 39: 83-88. Acevedo, A. and J.G. Scandalios. 1990. Expression of the catalase and superoxide dismutase genes in mature pollen in maize. Theor. AppL Genet. 80: 705-711.
.1991. Catalase and superoxide dismutase gene expression and distribution durmg stem development in maize. Dev. Genet. 12: 423-430.
.1992. Differential expression of the catalase and superoxide dismutase genes in maize ear shoot tissues. Plant Cell PhysioL 33:1079-1088. Acevedo, A., R.W. Skadsen, and J.G. Scandalios. 1996. Two barley catalase genes respond differentially to light. PhysioL Plant. 96: 369-374. Acevedo, A., J.D. Williamson, and J.G. Scandalios. 1991. Photoregulation of the Cat2 and Cat3 catalase genes in pigmented and pigment-deficient maize: The circadian regulation of Cat3 is superimposed on its quasi-constitutive expression in maize leaves.
Genetics 127: 601-607.

398 J.G. Scandalios, L. Guan, and A.N. Polidoros Aebi, H. and H. Suter. 1971. Acatalasemia. Adv. Hum. Genet. 2:143-199. Allen, J.F. 1975. A two step mechanism for the photosynthetic reduction of oxygen by ferredoxin. Biochem. Biophys. Res. Commun. 66: 36-43. Anderson, J.W., C.H. Foyer, and D.A. Walker. 1983. Light dependent reduction of H202 by intact spinach chloroplast. Biochim. Biophys. Ada 724: 69-74. Anderson, S.L. and S.A. Kay. 1995. Functional dissection of circadian clock- and phytochrome-regulated transcription of the Arabidopsis CAB2 gene. Proc. NaiL Acad. Sci. 92:1500-1504. Anderson, S.L., G.R. Teakle, S.A. Martino-Catt, and S. Kay. 1994. Circadian clock- and phytochrome-regulated transcription is conferred by a 78bp cis-acting domain of the Arabidopsis CAB2 promoter. PlantJ. 6: 457-470. Armstrong, G.A., B. Weisshaar, and K. Hahlbrock. 1992. Homodimeric and heterodimeric leucine zipper proteins and nuclear factors from parsley recognize diverse promoter elements with ACGT core. Plant Cell 4: 525-537. Asada, K. and Y. Nakano. 1980. Spinach chloroplast scavenge H202 on illumination. Plant Cell Physiol. 21:1295-1307. Asada, K. and M. Takahashi. 1987. Production and scavenging of active oxygen in photosynthesis. In Photoinhibition (ed. D.J. Kyle et al.), pp.227-287. Elsevier, Amsterdam. Baum, J.A. and J.G. Scandalios. 1979. Developmental expression and intracellular localization of superoxide dismutase in maize. Differentiation 13:133-140. Baumlein. H., I. Nagy, R. Villarroel, P. Inze, and U. Wobus. 1992. cis-analysis of seed protein promoter: The conservative RY repeat CATOCATO within the legumine box is essential for tissue specific expression of a legumine gene. PlantJ. 2: 233-239. Beevers, H. 1982. Glyoxysomes in higher plants. Ann. N.Y Acad. Sci. 386: 243-251. Bethards, L.A. and J.G. Scandalios. 1988. Molecular basis for the CAT-2 null phenotype in maize. Genetics 118:149-153. Bethards, L.A., R.W. Skadsen, and J.G. Scandalios. 1987. Isolation and characterization of a cDNA clone for the Cat2 gene in maize and its homology with other catalases. Proc. Natl. Acad. Sci. 84: 6830-6834. Beyer, W.F. and I. Fridovich. 1987. Effect of H202 on the iron containing superoxide dismutase of E. coli. Biochemistry 26:1251-1257. Bi, Y.-M., P. Kenton, L. Mur, R. Darby, and J. Draper. 1995. Hydrogen peroxide does not function downstream of salicylic acid in the induction of PR protein expression. PlantJ. 8: 235-245. Bibb, M.J., P.R. Findlay, and M.W. Johnson. 1984. The relationship between base composition and codon usage in bacterial genes and its use for the simple and reliable identification of protein-coding sequences. Gene 30:157-166. Boldt, R. and J.G. Scandalios. 1995. Circadian regulation of the Cat3 catalase gene in maize (Zea mays L.): Entrainment of the circadian rhythm of Cat3 by different light treatments. PlantJ. 7: 989-999.
.1997. Influence of UV-light on the expression of the Cat2 and Cat3 catalase genes in maize. Free Radical BioL Med. (in press). Borello, U., E. Ceccarelli, and G. Giuliano. 1993. Constitutive, light-responsive and circadian clock-responsive factors compete for the different I box elements in plant lightregulated promoters PlantJ. 4: 611-619. Boveris, A. and E. Cadenas. 1975. Mitochondrial production of superoxide anions and its relationship to the antimycin insensitive respiration. FEBS Leti. 54: 311-314.

Catalases in Plants 399
Boveris, A. and B. Chance. 1973. The mitochondrial generation of hydrogen peroxide: General properties and effect of hyperbaric oxygen. Biochem. J. 134: 707-716.
Brown, J.W.S. and R. Waugh. 1989. Maize U2 snRNAs: Gene sequence and expression. NucleicAcids Res. 17:8991-9001.
Bureau, T.E. and S.R. Wessler. 1992. Tourist: A large family of small inverted repeat elements frequently associated with maize genes. Plant Cell 4:1283-1294.
.1994. Mobile inverted-repeat elements of the Tourist family are associated with the genes of many cereal grasses. Proc. NatL Acad. Sci. 91:1411-1415.
Cabelli, D.E. and B.H.J. Bielski. 1983. Kinetics and mechanism for the oxidation of ascorbic acid/ascorbate by O2~ radicals. A pulse radiolysis and stopped-flow photolysis study. J. Phys. Chem. 87:1809-1812.
Cadenas, E. and A. Boveris: 1980. Enhancement of hydrogen peroxide formation by protophores and ionophores in antimycin supplemented mitochondria. Biochem. J. 188: 31-37.
Campbell, W.H. and G. Gown. 1990. Codon usage in higher plants, green algae, and cyanobacteria. Plant PhysioL 92:1-Il.
Carre, I.A. and S.A. Kay. 1995. Multiple DNA-protein complexes at a circadianregulated promoter element. Plant Cell 7: 2039-2051.
Chamberland, S., N. Daigle, and F. Bernier. 1992. The legumin boxes and the 3' part of a soybean b-conglycinin promoter are involved in seed gene expression in transgenic tobacco plants. Plant MoL BioL 19: 937-949.
Chance, B., H., Sies, and A. Boveris. 1979. Hydroperoxide metabolism in mammalian organs. Physiol. Rev. 59: 527-605.
Chance, B., A. Boveris, N. Oshino, and G. Loschen. 1973. The nature of catalase intermediate and its biological function. In Oxidases and related redox system (ed. T.E. King et al.), pp.350-353. University Park Press, Baltimore, Maryland.
Chandlee, J.M. and J.G. Scandalios. 1984a. Analysis of variants affecting the catalase de-velopmental program in maize scutellum. Theor. AppL Genet. 69: 71-77.
1984b. Regulation of Cat1 gene expression in the scutellum of maize during early sporophytic development. Proc. NatL Acad. Sci. 81: 4903-4907.
Chandlee, J.M., A.S. Tsaftaris, and J.G. Scandalios. 1983. Purification and partial charac-terization of three genetically defined catalases of maize. Plant Sci. Lett. 29:117-131.
Charles, S.A. and B. Halliwell. 1981. Light activation of fructose bisphosphate in isolated spinach chloroplasts and deactivation by H202. Planta 151: 242-246.
Chen, Z., H. Silva, and D.F. Klessig. 1993. Active oxygen species in the indiction of plant systemic acquired resistance by salicylic acid. Science 262:1883-1886.
Chevalier, C., J. Yamaguchi, and P. McCourt. 1993. Nucleotide sequence of a cDNA for catalase from Arabidopsis thaliana. Plant PhysioL 99:1726-1728.
Deisseroth, A. and A. Dounce. 1970. Catalase: Physical and chemical properties, mechanism of catalysis and physiological role. PhysioL Rev. 50: 319-375.
Dixon, R.A. and M.J. Harrison. 1990. Activation, structure, and organization of genes involved in microbial defense in plants. In Genomic responses to environmental stress (ed. J.G. Scandalios), pp.165-234. Academic Press, San Diego.
Douce, R. 1985. Mitochondria in higher plants: Structure fi'nction and biogenesis. Academic Press, Orlando, Florida.
Dounce, A.L. 1983. A proposed mechanism for the catalatic action of catalase. J. Theor. BioL 105: 553-567.
Dynan, W.S. and R. Tjian. 1985. Control of eukaryotic messenger RNA synthesis by
400 J.G. Scandalios, L. Guan, and A.N. Polidoros sequence- specific DNA-binding proteins. Nature 316: 774-778. Eising, R., R. Trelease, and W. Ni. 1989. Biogenesis of catalase in glyoxysomes and leaf-type peroxisomes of sunflower cotyledons. Arch. Biochem. Biophys. 278: 258-264. Ellyard, P.W. and M. Gibbs. 1969. Inhibition of photosynthesis by oxygen in isolated spinach
chloroplasts. Plant PhysioL 68: 65-69. Elthon, T.E. and L. Mcintosh. 1987. Identification of the alternate terminal oxidase of higher plant
mitochondria. Proc. Natl. Acad. Sci. 84: 8399-8403. Favreau, L.V. and C.B. Pickett. 1991. Transcriptional regulation of the rat NAD(P)H:quinone
reductase gene. J. BioL Chem. 266: 4556-4561. Felsenstein, J. 1985. Confidence limits on phylogenies: An approach using the bootstrap. Evolution
39: 783-791. 1993. PHYLIP (Phylogency Inference Package): Version 3.5c. University of Washington,
Seattle. Fenton, H.J.H. 1894. Oxidation of tartaric acid in presence of iron. J. Chem. Soc. 65:
899-915. Fiedler, U., R. Filistein, U. Wobus, and H. Baumlein. 1993. A complex ensemble of cisregulatory
elements controls the expression of a Vicia faba non-storage protein gene. Plant Mol. BioL 22: 669-679.
Forman, H.J. and A. Boveris. 1982. Superoxide radical and H202 in mitochondria. In Free radicals in biology (ed. W. Pryor), vol.5, pp.69-90. Academic Press, New York.
Fowler T., M.W. Rey, P. VahaVahe, S.D. Power, and R.M. Berka. 1993. The CatR gene encoding a catalase from Aspergillus niger: Primary structure and elevated expression through increased gene copy number and use of a strong promoter. MoL MicrobioL 9:
989-998. Fridovich, 1.1975. Superoxide dismutases. Annu. Rev. Biochem. 44:146-159. Gaffney, T., L. Friedrich, B. Vernooij, D. Negrotto, G. Nye, S. Uknes, E. Ward, H. Kessmann, and J.
Ryals. 1993. Requirement of salicylic acid for the induction of systemic acquired resistance. Science 261: 754-756.
Gianinetti, A., M. Cantoni, C. Lorenzoni, F. Salamini, and A. Marocco. 1993. Altered levels of antioxidant enzymes associated with two mutations in tomato. PhysioL Plant. 89:157-164.
Gilbert, W. and M. Glynias. 1993. On the ancient nature of introns. Gene 135:137-144. Gonzalez, E. 1991. The C-terminal domain of plant catalases. Eur. J. Biochem. 199:
211-215. Green, P.J., M.H. Yong, M. Cuozzo, Y. Kano-Murakami, P. Silverstein, and N.H. Chua. 1988.
Binding site requirements for pea nuclear protein factor GT-1 correlate with sequences required for light-dependent transcriptional activation of the rbcS-3A gene.
EMBOJ. 7: 4035-4044. Guan, L. and J.G. Scandalios. 1993. Characterization of the catalase antioxidant defense gene Cat1 of maize and its developmentally regulated expression in transgenic tobacco. PlantJ. 3: 527-536.
1995. Developmentally related responses of maize catalase genes to salicylic acid. Proc. Natl. Acad. Sci. 92: 5930-5934.
1996. Molecular evolution of maize catalases and their relationship to other eukaryotic and prokaryotic catalases. J. MoL Evol. 42: 570-579. Guan, L., A.N. Polidoros, and J.G. Scandalios. 1996. Isolation, characterization and expression of the
maize Cat2 catalase gene. Plant MoL Biol. 30: 913-924. Guan, L., S. Ruzsa, R.W. Skadsen, and J.G. Scandalios. 1991. Comparison of the Cat2

Catalases in Plants 401
complementary DNA sequences of a normal catalase activity line (W64A) and a high catalase activity line (R6-67) of maize. Plant PhysioL 96:1379-1381.
Guiltinan, M.J., W.R. Marcotte, and R.S. Quatrano. 1990. A plant leucine zipper protein that recognizes an abscisic acid response element. Science 250: 267-271.
Haber, F. and J. Weiss. 1934.The catalytic decomposition of hydrogen peroxide by iron salts. Proc. R. Soc. Lond. A 147: 332-351.
Halliwell, B. 1987. Oxidative damage, lipid peroxidation and antioxidant protection in chloroplast. Chem. Phys. Lipids 44: 327-340.
Halliwell, B. and J.M.C. Gutteridge. 1984. Oxygen-derived species and herbicide action. PhysioL Plant. 15: 21-24.
Hattori, T., V. Vasil, L. Rosenkrans, L.C. Hannah, D.R. McCarty, and I.K. Vasil. 1992. The viviparous-i gene and abscisic acid activates the Cl regulatory gene for anthocyanin biosynthesis during seed maturation in maize. Genes Dev. 6: 609-618. Hatzopoulos, A.K., U. Schlokat, and P. Gruss. 1988. Enhancers and other cis-acting regulatory elements. In Transcription and splicing (ed. B.D. Hames and D.M. Glover), pp.43-96. IRL Press, Washington, D.C.
Havir, A.E. and N.A. McHale. 1987. Biochemical and developmental characterization of multiple forms of catalase in tobacco leaves. Plant Physiol. 84: 450-455.
.1989. Enhanced-peroxidatic activity in specific catalase isozymes of tobacco, barley and maize. Plant PhysioL 91: 812-815.
Hayakawa, T., S. Kanematsuand, and K. Asada. 1984. Occurrence of CuZn superoxide dismutase in the intra-thylakoid space of spinach chloroplast. Plant Cell PhysioL 25: 883-889.
Herrera-Estrella, L. and J. Simpson. 1990. Influence of environmental factors on photosynthetic genes. Adv. GeneL 28:133-163.
Higo, K. and H. Higo. 1995. Cloning and characterization of three catalase genes from rice. Plant PhysioL (suppl.) 108: 74.
Hodgson, E.K. and I. Fridovich. 1975. The interaction of bovine erythrocyte superoxide dismutase with H202: Inactivation of the enzyme. Biochemistry. 14: 5294-5299.
Ikemura, T. 1985. Codon usage and tRNA content in unicellular and multicellular organisms. MoL BioL EvoL 2:13-34.
Imlay, J.A., S.M. Chin, and S. Linn. 1988. Toxic DNA damage by H202 through the Fenton reaction in vivo and in vitro. Science 240: 640-642.
Isin, S.H. and R.D. Allen. 1991. Isolation and characterization of a pea catalase cDNA. Plant MoL BioL 17:1263-1265.
Kadonaga, J.T., K.A. Jones, and R. Tjian. 1986. Promoter-specific activation of RNA polymerase II transcription by Spi. Trends. Biochem. Sci. 11: 20-23. Kagawa, Y., H. Nojima, N. Nukiwa, M. Ishizuka, T. Nakajima, T. Yasuhara, T. Tanaka,
and T. Oshima. 1984. High guanine plus cytosine content in the third letter of codons of an extreme thermophile. J. BioL Chem. 259: 2956-2960.
Kendall, A.C., A.J. Keys, J.C. Turner, P.J. Lea, and B.J. Miflin. 1983. The isolation and characterization of a catalase-deficient mutant of barley. Planta 159: 505-511.
Kleff, S., R.N. Trelease, and R. Eising. 1994. Nucleotide and deduced amino acid sequence of a putative higher molecular weight precursor for catalase in sunflower cotyledons. Biochim. Biophys. Acta 1224: 463-466.
Koltzoff, N.K. 1927. Catalase content in blood as an inherited trait. J. BioL Med. Exp. 5: 303-334.
Kopczynski, C.C. and J.G. Scandalios. 1986. Cat2 gene expression, developmental con-

402 J.G. Scandalios, L. Guan, and A.N. Polidoros
trol of translatable Cat2 mRNA levels in maize scutellum. MoL Gen. Genet. 203: 185-188. Lelievre, J.M., L.O. Oliveira, and N.C. Nielsen. 1992.5 '-CATGCATG-3 'elements modulate the
expression of glycinin genes. Plant PhysioL 98: 387-391. Loew, 0.1901. Catalase, new enzyme of general occurrence, with special reference to the tobacco
plant. U.S. Dep. Agric. Rep. 68: 47. Loschen, G.A., L. Flohe, and B. Chance. 1971. Respiratory chain linked H202 production in pigeon
heart mitochondria. FEBS Lett. 18: 261-264. Madamanchi, N.R. and J. Kuc. 1991. Induced systemic resistance in plants. In The ~ngal spore and
disease initiation in plants and animals (ed. G.T. Cole and H.C. Hoch), pp. 347-362, Plenum Press, New York.
Matters, G.L. and J.G. Scandalios. 1986a. Effect of elevated temperature on catalase and superoxide dismutase during maize development. Differentiation 30:190-196.
1986b. Changes in plant gene expression during stress. Dev. Genet. 7:167-175. Meakin, P.J. and J.A. Gatehouse. 1991. Interaction of seed nuclear proteins with
transcriptionally-enhancing regions of the pea (Pisum sativum L.) le~ gene promoter. Planta 183: 471-477.
Meyer, M., R. Schreck and P.A. Baeuerle. 1993. H202 and antioxidants have opposite effects on activation of NF-KB and AP-1 in intact cells: AP-1 as secondary antioxidant-responsive factor. EMBO J. 12: 2005-2015.
Millar, A.J. and S.A. Kay. 1991. Circadian control of cab gene transcription and mRNA accumulation in Arabidopsis. Plant Cell 3: 541-550.
Minagawa, N., S. Koga, M. Nakano, S. Sakajo, and A. Yoshimoto. 1992. Possible involvement of superoxide anion in the induction of cyanide resistant respiration in Hansenula anomala. FEBSLett. 302: 217-219.
Mon, H. and H. Imaseki. 1993. cDNA for catalase from etiolated mung bean (Vigna radiata) hypocotyls. Plant PhysioL 102: 691-692.
Mon, H., K. Higo, H. Higo, Y. Minobe, H. Matsui, and S. Chiba. 1992. Nucleotide and derived amino acid sequence of a catalase cDNA isolated from rice immature seeds. Plant MoL Biol 18: 973-976.
Morita S., M. Tasaka, H. Fujisawa, T. Ushimaru, and H. Tsuji. 1994. A cDNA clone encoding a rice catalase isozyme. Plant PhysioL 105:1015-1016.
Mullen, R.T. and D.J. Gifford. 1993. Purification and characterization of catalase from Loblolly pine (Pinus taeda L.) megagametophytes. Plant PhysioL 103: 477-483.
Murray, E.E., J. Lotzer, and M. Eberle. 1989. Codon usage in plant genes. Nucleic Acids Res. 17: 477-498. Nadezhdin, D. and H.B. Dunford. 1979. Oxidation of nicotinamide adenine dinucleotide by
hydroxyperoxyl radical, a flash photolysis study. J. PhysioL Chem. 83:1957-1961. Nagy, F., S.A. Kay, and N.-H. Chua. 1988. A circadian clock regulates transcription of the wheat
Cab-I gene. Genes Dev. 2: 376-382. Neuenschwander, U., B. Vernooij, L. Friedrich, S. Uknes, H. Kessmann, and J. Ryals. 1995. Is
hydrogen peroxide a second messenger of salicylic acid in systemic acquired resistance. PlantJ. 8: 227-233.
Newgard, B., K. Nakano, P. Hwang, and R. Fletterick. 1986. Sequence analysis of the cDNA encoding human liver glycogen phosphorylase reveals tissue-specific codon usage. Proc. Natl. Acad. Sci. 83: 8132-8136. Newman, T., F.J. de Bruijn, P. Green, K. Keegstra, H. Kende. L. Mcintosh, J. Ohlrogge, N. Raihkel, S. Somerville, M. Tomashow, E. Retzel, and C. Somerville. 1994. Genes

Catalases in Plants 403
galore: A summary of methods for accessing results from large scale partial sequencing of anonymous Arabidopsis cDNA clones. Plant PhysioL 106:1241-1255.
Ni, W. and R.N. Trelease. 1991. Post-translational regulation of catalase isozyme expression in cotton seeds. Plant Cell 3: 737-744.
Ni, W., R. Turley, and R. Trelease. 1990. Characterization of a cDNA encoding cottonseed catalase. Biochim. Biophys. Acta 1049: 219-222.
Nichols, P. 1972. Contributions of catalase and glutathione peroxidase to red cell peroxide removal. Biochim. Biophys. Acta 279: 306-309.
Ogren W.L. 1984. Photorespiration: Pathways, regulation and modification. Annu. Rev. Plant Physiol. 35: 415-442.
Oshino, N., D. Jamieson, T. Sugano, and B. Chance. 1975. Optical measurement of the catalase-hydrogen peroxide intermediate compound I in the level of anaesthetized rats and its implication to H202 production in viva. Biochem. J. 146: 67-77.
Pabo, C.O. 1992. Transcription factors: Structural families and principles of DNA recog-nition.Annu. Rev. Biochem. 61:1053-1095.
Paz-Ares, J., D. Chosal, U. Wienand, P. Peterson, and H. Saedler. 1987. The regulatory ci locus of Zea mays encodes a protein with homology to myb protooncogene products and with structural similarities to transcriptional activators. EMBO J. 6: 3553-3558.
Poellinger, L. 1995. Mechanism of signal transduction by the basic helix-loop-helix dioxin receptor. In Inducible gene expression: Environmental stress and nutrients (P.A. ed. Baeuerle), pp.177-205. Birkhauser, Boston.
Puppo, A. and B. Halliwell. 1988. Formation of hydroxyl radicals from hydrogen peroxide in the presence of iron: Is haemoglobin a biological Fenton reagent? Biochem. J. 249:185-190.
Purvis, A.C. and R.L. Shewfelt. 1993. Does the alternative pathway ameliorate chilling injury in sensitive plant tissues? PhysioL PlanL 88: 712-718.
Quail, P.H. and J.G. Scandalios. 1971.Turnover of genetically defined catalase isozymes in maize. Proc. NatL Acad. Sci. 68:1402-1406.
Quan, F., R.G. Korneluk, M.G Tropak, and R.A. Gravel. 1986. Isolation and character-ization of the human catalase gene. Nucleic Acids Res. 14: 5321-5335.
Radi, R., M. Rodriguez, L. Castro, and T. Telleri. 1994. Inhibition of mitochondrial electron transport by peroxynitrite. Arch. Biochem. Biophys. 308: 89-95.
Raskin, 1.1992. Role of salicylic acid in plants. Annu. Rev. Plant PhysioL Plant MoL BioL 43: 439-463.
Raskin, I., H. Skubatz, W. Tang, and B.J.D. Meeuse. 1990. Salicylic acid levels in thermogenic and nonthermogenic plants. Ann. Bot. 66: 369-373.
Redinbaugh, M.G., M. Sabre, and J.G. Scandalios. 1990a. Expression of the maize Cat3 catalase gene is under the influence of a circadian rhythm. Proc. NatL Acad. Sci. 87: 6853-6857.
1990b. The distribution of catalase activity, isozyme protein, and transcript in the tissues of the developing maize seedling. Plant Physiol. 92: 375-380. Redinbaugh, M.G., G.J. Wadsworth, and J.G. Scandalios. 1988. Characterization of catalase transcripts and their differential expression in maize. Biochim. Biophys. Acta 951:104-116.
Riggs, C.D., T.A. Voelker, and M.J. Chrispeels. 1989. Cotyledon nuclear proteins bind to DNA fragments harboring regulatory elements of phytohemagglutinin genes. Plant Cell 1: 609-621.
Robinson, S.A., M. Ribas-Carbo, L. Giles, D. Yakir, J.A. Berry, and J.N. Siedow. 1995.

404 J.G. Scandalios, L. Guan, and A.N. Polidoros Partitioning of electrons between the alternative and cytochrome respiration pathways during development of photosynthetic function in soybean cotyledons. Plant PhysioL
(suppl.) 108: 667. Robinson, S.A., D. Yakir, M. Ribas-Carbo, L. Giles, B.C. Osmond, J.N. Siedow, and J.A. Berry.
1992. Measurements of the engagement of cyanide-resistant respiration in the crassulacean acid metabolism plant Kalanchoe daigermontiana with the use of on-line oxygen isotope discrimination. Plant PhysioL 100:1087-1091.
Rushmore, T.H., M.R. Morton, and C.B. Pickett. 1991. The antioxidant responsive element. J. Biol. Chem. 266:11632-11639.
Sakajo, S., K. Nakamura, and T. Ashai. 1987. Molecular cloning and nucleotide sequence of full-length cDNA for sweet potato catalase mRNA. Eur. J. Biochem. 165: 437-442. Scandalios, J.G. 1965. Subunit dissociation and recombination of catalase isozymes. Proc. NatL
Acad. Sci. 53:1035-1040. .1968. Genetic control of multiple molecular forms of catalase in maize. Ann. N.Y Acad.
Sci. 151: 274-293. .1974. Subcellular localization of catalase variants coded by two genetic loci during maize
development. J. Hered. 65: 28-32. .1979. Control of gene expression and enzyme differentiation. In Physiological genetics
(ed. J.G. Scandalios), pp. 63-107. Academic Press, New York. .1983. Multiple varieties of isozymes and their role in studies of gene regulation and
expression during eukaryote development. Curr. Top. BioL Med. Res. 9:1-31. .1987. The antioxidant enzyme genes Cat and Sod of maize: Regulation, functional
significance, and molecular biology. Curr. Top. BioL Med. Res. 14:19-44. .1990. Response of plant antioxidant defense genes to environmental stress. Adv. Genet.
28:1-41. Ed. 1992. Current communications in cell and molecular biology: Molecular biology of
free radical scavenging systems, vol.5. Cold Spring Harbor Laboratory Press, Cold Spring Harbor, New York.
.1994. Regulation and properties of plant catalases. In Causes of photooxidative stress and amelioration of defense systems in plants (ed. C.H. Foyer and P.M. Mullineaux), pp. 275-315. CRC Press, Boca Raton, Florida.
Scandalios, J.G., W.-F. Tong, and D.G. Roupakias. 1980a. Cat3, a third gene locus coding for a tissue-specific catalase in maize: Genetics, intracellular location, and some biochemical properties. Mol. Gen. Genet. 179: 33-41.
Scandalios, J.G., A.S. Tsaftaris, J.M. Chandlee, and R.W. Skadsen. 1984. Expression of the developmentally regulated catalase (Cat) genes in maize. Dcv. Genet. 4: 2~-293. Scandalios, J.G., D.Y. Chang, D.E. McMillin, A.S. Tsaftaris, and R. Moll. 1980b. Genetic regulation of the catalase developmental program in maize scutellum: Identification of a temporal regulatory gene. Proc. NatL Acad. Sci. 77: 5360-5364. Schultes, N.P., I. Zelitch, B. McGonigle, and T. Nelson. 1994. The primary leaf catalase gene from
Nicotiana tabacum and Nicotiana sylvestris. Plant PhysioL 106: 399-400. Shapiro, M.B. and P. Senapathy. 1987. RNA splice junctions of different classes of eukaryotes:
Sequence statistics and functional implications in gene expression. Nucleic Acids Res. 15: 7155-7174.
Skadsen, R.W. and J.G. Scandalios.1987. Translational control of photo-induced expression of the Cat2 catalase gene during leaf development in maize. Proc. NatL Acad. Sci.
84: 2785-2789. .1989. Pretranslational control of the levels of glyoxysomal protein gene expres

Catalases in Plants 405
sion by the embryonic axis of maize. Dev. Genet. 10:1-10. Skadsen, R.W., P. Schulze-Lefert, and J.M. Herbst. 1995. Molecular cloning, characterization and
expression analysis of two catalase isozyme genes in barley. Plant MoL BioL 29:1005-1014. Starke, P.A. and J.I. Farber. 1985. Endogenous defenses against the cytotoxicity of H202 in culture
rat hepatocytes. J. BioL Chem. 260: 86-92. Steitz, J.A., D.L. Black, V. Gerke, K.A. Parke, A. Kramer, D. Frendeway, and W. Keller. 1988.
Small nuclear ribonucleoprotein particles. In Structure and fi'nction of major and minor small nuclear ribonucleoprotein particles (ed. M.L. Birnstile), pp. 115-154. Springer Verlag, New York.
Stuart, G.W., P.F. Searle, H.Y. Chen, R.L Brinster, and R.D. Palmiter. 1984. A 12-base-pair DNA motif that is repeated several times in metallothionein gene promoters confers metal regulation to a heterologous gene. Proc. NatL Acad. Sci. 81: 7318-7322.
Sumner, J.B. and A.L. Dounce. 1937. Crystalline catalase. J. Biol. Chem. 121: 417-424. Suzuki, M., T. Ano, T. Hattori, K. Nakamura, and T. Asahi. 1994. Isolation and characterization of two tightly linked catalase genes from castor bean that are differentially regulated. Plant MoL Biol. 25: 507-516.
Teakle, G.R. and S.A. Kay. 1995. The GATA-binding protein CGF-1 is closely related to GT-1. Plant MoL BioL 29:1253-1266. Terzaghi, W.B. and A.R. Cashmore. 1995. Light regulated transcription. Annu. Rev. Plant Physiol.
Plant Mol. Biol. 46: 445-474. Thayer, W.S. 1977. Adriamycin stimulated superoxide formation in submitochondrial particles. Chem. Biol. !nteract. 19: 250-252. Tillberg, E. 1977. Indoleacetic acid levels in Phaseolus, Zea and Pinus during seed germination.
Plant PhysioL 60: 317-319. Tolbert, N.E. 1981. Metabolic pathways in peroxisomes and glyoxysomes, Annu. Rev. Biochem.
50:133-157. Tomashaw, M.F. 1990. Molecular genetics of cold acclimation in higher plants. In Genomic
responses to environmental stress (ed. J.G. Scandalios), pp.99-131. Academic Press, San Diego. Tsaftaris, A.S. and J.G. Scandalios. 1986. Spatial pattern of catalase (Cat2) gene activation in scutella
during post-germination development in maize. Proc. NatL Acad. Sci. 83: 5549-5553.
Tsaftaris, A.S., A.M. Bosabalidis, and J.G. Scandalios. 1983. Cell-type-specific gene expression and acatalasemic peroxisomes in a null Cat2 catalase mutant of maize. Proc. NatL Acad. Sci. 80: 4455-4459.
Wadsworth, G.J. and J.G. Scandalios. 1989. Differential expression of the maize catalase genes during kernel development: The role of steady-state mRNA levels. Dev. Genet. 10: 304-310.
.1990. Molecular characterization of a catalase null allele at the Cat3 locus in maize. Genetics 125: 867-872.
Warburg, 0.1923. Ueber die antikatalytische Wirkung der Blaus ure. Biochem. Z. 136: 266-272.
Waugh, R., G. Clark, P. Vaux, and J.W.S. Brown. 1991. Sequence and expression of potato U2 snRNA genes. Nucleic Acids Res. 19: 249-256.
Westin, G. and W. Schaffner. 1988. A zinc-responsive factor interacts with a metal-regulated enhancer element (MRE) of the mouse metallothinein-I gene. EMBO J. 7: 3763-3770.

406 J.G. Scandalios, L. Guan, and A.N. Polidoros Willekens, H., W. Van Camp, M. Van Montagu, H. Sandermann, Jr., and C. Langebartels. 1994a. Ozone, sulfur dioxide, and ultraviolet B have similar effects on mRNA accumulation of antioxidant genes in Nicotiana plumbaginifolia. Plant PhysioL 106:
1007-1014. Willekens, H., R. Villarroel, D. Inze, M. Van Montagu, and W. Van Camp. 1994b. Molecular
identification of catalases from Nicotiana plumbaginifolia. FEBS Lett. 352: 79-83.
Willekens, H., C. Langebartels, C. Tire, M.Van Montagu, D. Inze, and W. Van Camp. 1994c. Differential expression of catalase genes in Nicotiana plumbaginifolia. Proc. NatL Acad. Sci. 91:10450-10454.
Williamson, J.D. and J.G. Scandalios. 1992a. Differential response of maize catalases and superoxide dismutases to the photoactivated fungal toxin cercosporin. Plant J. 2:
351-358. 1992b. Differential developmental response of the maize catalases to abscisic acid: Vpl
transcriptional activator is not required for ABA-regulated CatJ expression. Proc. NatL Acad. Sci. 89: 8842-8846.
1993. Response of the maize catalases and superoxide dismutases to cercosporin-containing fungal extracts: The pattern of catalase response in scutella is stage specific. PhysioL Plant. 88:159-166.
1994. The maize (Zea mays L.) Cat1 catalase promoter displays differential binding of nuclear proteins isolated from germinated and developing embryos and from embryos grown in the presence and absence of abscisic acid. Plant PhysioL 106:
1373-1380. Wu, G. amd D.M. Shah. 1995. Isolation and characterization of a potato catalase cDNA. Plant
Physiol. 108:1748. Yamaguchi, J., M. Nishimura, and T. Akazawa. 1986. Purification and characterization of heme-
containing low-activity form of catalase from greening pumpkin cotyledons. Fur. J. Biochem. 159: 315-322.
Zeile, K. and H. Helistrom. 1930. Ueber die aktive Gruppe der Leberkatalase. Z. PhysioL Chem. 192:171-174.
Zenke, M., T. Grundstrom, H. Matthes, M. Wintzerith, C. Schatz, A. Wildeman, and P. Chambon. 1986. Multiple sequence motifs are involved in SV4O enhancer function. EMBOJ. 5: 387-397.
Zhong, H.H. and R.C. McClung. 1996. The circadian clock gates expression of two Arabidopsis catalase genes to distinct and opposite circadian phases. Mol Gen. Genet. 251:196-203.
Zhong, H.H., J. C.Young, E.A. Pease, R.P. Hangarter, and R.C. McClung. 1994. Interactions between light and the circadian clock in the regulation of the CAT2 expression in Arabidopsis. Plant Physiol. 104: 889-898.