catalyst trap microreactor for pharmaceutical...
TRANSCRIPT

Catalyst-Trap Microreactor for Hydrogenation of a Pharmaceutical Intermediate
S. McGovern,1 G. Harish,1 , C.S. Pai,2 W. Mansfield,2 J.A.Taylor,2 S. Pau,3 and R.S. Besser1 1Chemical, Biomedical, & Materials Engineering Department, Stevens Institute of Technology, Castle Point on Hudson, Hoboken, NJ 07030, 201.216.5257, [email protected] 2New Jersey Nanotechnology Consortium (NJNC) at Lucent-Bell Labs, 600 Mountain Avenue, Murray Hill, NJ 07974 3University of Arizona, College of Optical Sciences,1630 East University Blvd., Tuscon, AZ 85721 Abstract
Multiphase hydrogenation reactions involving solid catalyst play a critical role in the pharmaceutical industry. Nearly twenty percent of all reaction steps in a typical fine chemical synthesis are catalytic hydrogenation. Mass and heat transport resistances are generally an obstacle in such reaction systems. The microscale geometry of microreactor technology offers significant gains against these hurdles, hence their use would greatly benefit chemical processing in the pharmaceutical and other industries.
A silicon microreactor has been developed to investigate multiphase mass transfer in
the context of gas-liquid-solid catalytic reactions. The reactor employs a three-channel “catalyst-trap” design, whereby solid catalyst is suspended in the liquid channel by an arrangement of posts. Such a device supports the use of commercial catalyst, and allows control of pressure drop across the bed by engineering the packing density. This paper discusses the design and operation of the reactor, with the liquid-phase hydrogenation of o-nitroanisole to o-anisidine as a prototype reaction. Experiments are carried out across a range of gas and liquid flow rates that encompasses three distinct flow regimes, termed gas-dominated, liquid-dominated, and transitional. A two-phase “flow map” is generated independent of the reaction to identify the flow regime present at each set of conditions. Reaction experiments assign a conversion to each point in the flow map, in order to subsequently reconcile differences in performance with the characteristics of the respective flow regime. The highest reaction conversion occurs in the transitional flow regime, where competition between the two phases results in the generation of a large amount of gas-liquid interfacial area. Because the experimental conversion is greater than that predicted by the initial plug-flow model, we revise the model to account for the mass transfer enhancement induced by transitional flow. This reactor architecture may be useful for catalyst evaluation through rapid screening, or in large numbers as an alternative to macro-scale production reactors.
Introduction The term “microreactor” is broadly used to describe devices ranging from tens of microns to several centimeters in size. Microreactor technology possesses significant advantages over conventional macro-scale reactors. Because of their small size, microreactors have inherently large surface-to-volume ratios, allowing for superior mass and heat transport. Surface-to-volume ratios of 20,000 m2/m3 or more are not uncommon, compared to 1,000 m2/m3 for a conventional reactor [11]. In the case of catalytic reactions, where competition exists between the rate of diffusion to the catalyst sites and the rate of

reaction, microreactors are able to virtually eliminate mass transport resistance, making them an extremely useful tool for isolating reaction kinetics. Excellent heat transfer properties ensure a uniform temperature throughout the reactor and prevent the formation of hotspots in the case of an exothermic reaction. In a stirred-tank reactor, for example, hotspots can lead to undesired changes in local concentration or pH. Low residence time and ease of heat removal also make microreactors more suitable for flammable service, where the potential for explosion or fire is greatly reduced. In this paper, we consider the use of a microreactor for gas-liquid-solid catalytic reactions, where the rate of diffusion of gas into the liquid phase can also limit the observed reaction rate. Thus, we would like to be able to address both intra-particle and inter-particle diffusion. The former can be accomplished with reasonable certainty simply by using small-sized catalyst particles. In general, catalyst particles with a diameter smaller than 100 µm (1 x 10⁻⁴ m) exhibit sufficiently low transport resistance to enable their use with most reactions [9]. The latter is a function of gas-liquid interfacial area and driving force for transport, both of which depend on the gas-liquid flow regime. Mass transfer in two-phase flow has been studied extensively in microchannel and capillary geometry, and here we wish to extend these principles to reactive systems.
For our purposes, three traditional flow regimes are adequate to describe the two-phase behavior, although other papers present more precise delineations [7]. Bubble flow is characterized by liquid as the continuous phase, with bubbles of gas dispersed into a fully-wetted channel. As the ratio of gas-to-liquid velocity increases, the Taylor (slug) flow regime emerges, in which alternating segments of gas and liquid occupy the channel. The relative lengths of each segment are constant for a given set of inlet conditions. As gas-to-liquid velocity, and hence flow rate, further increases, annular (for a capillary) or trickle (for a wide reaction channel) flow occurs. In annular or trickle flow, gas is the continuous phase, and the liquid flows as a thin film along the channel walls [7]. Figure 1 illustrates the three flow regimes, where uG and uL are the gas and liquid superficial velocities, respectively.
Bubble Flow
Taylor/Slug Flow
(1a)
(1b)
Trickle/Annular Flow
(1c)
Liquid
Gas
L
G
uu
Figure 1- Illustration of Gas/Liquid Flow Regimes

In the context of a gas-liquid-solid catalytic reaction occurring in the liquid phase, two characteristics are critical in evaluating the advantages and disadvantages of a particular flow regime. First, we desire good mass transport between gas and liquid, which depends on the driving force and the gas-liquid interfacial area created. Second, we desire a high liquid-solid interfacial area to effectively utilize the catalyst for rate of production. The highest such interfacial area will be achieved when liquid is the continuous phase.
The slug flow regime in a capillary is typically associated with the best gas-liquid mass
transport because of the no-slip condition at the channel walls. The high velocity gradient within the liquid slug provides turbulence, so a constant refreshing of the gas-liquid interface occurs. This provides a high driving force for diffusion at the interface, and good mixing within the liquid. Despite good mass transport properties, slug flow does not maximize the liquid-solid interfacial area because gas still occupies a significant portion of the channel. Bubble flow, in contrast, exhibits both a high liquid-solid and gas-liquid interfacial area. Because liquid is the continuous phase with only small pockets of gas, essentially all of the catalyst is in contact with liquid [6]. Thus we can generalize that slug flow will possess the best gas-liquid mass transport, owing to both interfacial area and driving force, and that bubble flow, although less turbulent, will have the highest liquid-solid interfacial area. On the basis of these mass transfer arguments, we speculate that the best reactor performance will fall in either the bubble or slug flow regimes. Likewise, we suppose that trickle flow, with the lowest liquid-solid and gas-liquid interfacial areas, will be the least effective for this particular reaction. We proceed to design the device and subsequent experiments with this hypothesis in mind. Reactor Modeling, Design, and Fabrication
The reactor is designed for operation across the spectrum of flow regimes, while making use of the advantages of microchemical systems to relieve various transport resistances for the convenience of our study. The design is pictured below in Figure 2.
Figure 2- Proposed Reactor Design

The reactor will be used for the hydrogenation of o-nitroanisole to o-anisidine, with methanol as an inert solvent. The catalyst is 5% Pd by weight on carbon. Hydrogen gas enters along the two outside channels, and is allowed to diffuse into the liquid channel through a slotted wall, (Figure 2, lower inset). The reaction occurs in the liquid channel, where an arrangement of posts, or catalyst traps, holds the catalyst particles in place (Figure 2, top inset). Each trap is a trapezoidal arrangement of four posts spanning the depth of the channel. The posts are spaced to “catch” particles during the catalyst loading process and hold them in place during the reaction processing, so one can imagine the liquid sees the particles stacked single-file on top of one another as it travels down the channel. With the assumption that the dissolution of nitroanisole occurs rapidly, the reaction is a four-step process: (1) hydrogen diffuses through the slots and dissolves in the bulk liquid; (2) the liquid, including dissolved hydrogen, disperses to the catalyst particles and diffuses within the particles to the reaction sites; (3) reaction occurs at the catalyst sites; (4) the product diffuses out of the particles and back into the bulk liquid. Our choice of catalyst particle size and reaction is intended to place no limits on the observed rate of reaction by steps (2), (3), and (4). For design purposes, we model the liquid channel as a plug-flow reactor with a source of hydrogen available at all axial positions. In order to study the gas-liquid mass transfer represented by step (1) above, we desire that hydrogen concentration in the liquid phase is limited by diffusion across the gas-liquid interface, so we design the slotted wall to present no resistance to gas diffusion from liquid surface tension. The rate of change of liquid-phase hydrogen concentration has two contributing terms (hydrogen as species A, nitroanisole as species B):
[ ] [ ]reaction of Rateliquid into gas fromdiffusion of Rate +=dt
dcA
( )( )���
��
�
++−��
�
�
�−⋅=
BBAA
BAchA
A
AL
L
A
cKcKckcw
acHP
kudz
dc11
3ε
The concentration of hydrogen at the gas-liquid interface is taken to be the Henry’s Law concentration for hydrogen in solutions of nitroanisole and methanol [2]. The difference between the interfacial and bulk liquid concentrations represents the driving force for diffusion. The interfacial area for gas-liquid diffusion is estimated from packed tower (stripper/absorber) literature [10]. Uncertainty exists in the application of these macroscale correlations to the microreactor geometry, but in the absence of alternatives we use them for design of the reactor. The reaction rate expression [1] in equation (2) includes the stoichiometric coefficient for hydrogen. For the remaining species, there is no gas-liquid diffusion, so equation (2) contains only the reaction term with the respective stoichiometric coefficient. The system of kinetic expressions is integrated numerically over the channel length from 0 to z. Figure 3 shows the final liquid channel dimensions.
(2)
(1)
OCH3
3 H2
OCH3
NO2
+
NH2
+ 2 H2O

Channel dimensions are chosen with the intent of yielding an appreciable conversion across our target range of experimental conditions. The channel contains approximately 14,000 catalyst traps that, when loaded, give a void fraction of 0.87. The posts are 25 µm in diameter and are spaced to hold a 35-50 µm particle. Rows of traps are staggered throughout the channel with a trap spacing, or closest edge-to-edge distance between adjacent traps, of 75 µm. Such an arrangement allows untrapped catalyst to pass between traps during loading. The reactors are fabricated at NJNC-Bell Labs in Murray Hill, NJ using 248 nm and contact lithography and deep reactive ion etching (DRIE). After etching of the channels, traps, slotted walls, and inlet/outlet ports, the silicon wafer is diced into individual chips of dimensions 31 x 28 mm (0.031 x 0.028 m). We receive sixteen chips per eight-inch diameter wafer. The reactors are then sealed by anodically bonding Pyrex glass to the surface of the chip. In the anodic bonding process, high voltage and temperature, typically 1000 VDC and 450-490 C, are applied to displace ions from the surface of the glass. The depletion of ions makes the glass surface highly reactive, forming a strong bond with the silicon substrate. The intent of the glass-covered reactor is both as an aid in catalyst loading and for observation of the gas-liquid flow behavior. Figure 4 shows SEM (Scanning Electron Microscope) images of the completed reactor. Experimental A schematic of the experimental setup is shown below in Figure 5. For overhead image and video capture, the setup includes a CCD camera above the reactor. The reactor itself is clamped onto a stainless steel block, through which channels are machined for gas and liquid passage.
��������
�������
�����µ��
�����µ��
��������
�����
Figure 3- Design Parameters for Liquid Channel
50 µm 225 µm
Figure 4- SEM Images of Microreactor
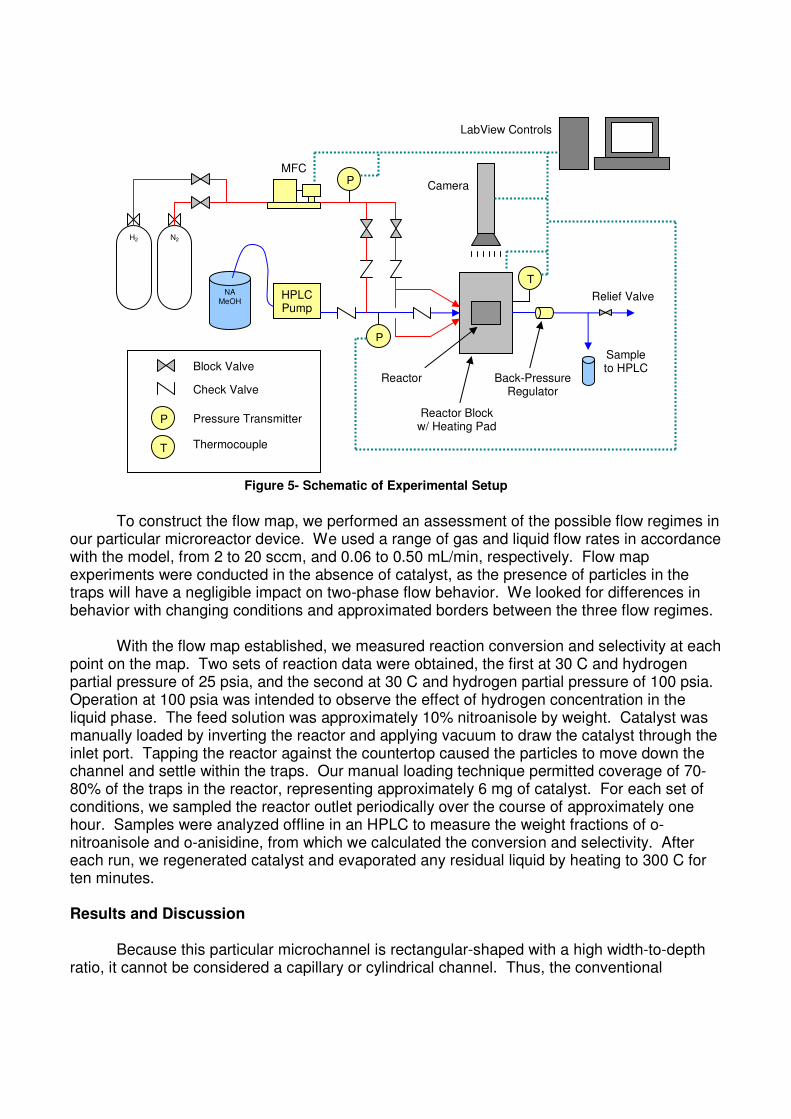
To construct the flow map, we performed an assessment of the possible flow regimes in our particular microreactor device. We used a range of gas and liquid flow rates in accordance with the model, from 2 to 20 sccm, and 0.06 to 0.50 mL/min, respectively. Flow map experiments were conducted in the absence of catalyst, as the presence of particles in the traps will have a negligible impact on two-phase flow behavior. We looked for differences in behavior with changing conditions and approximated borders between the three flow regimes.
With the flow map established, we measured reaction conversion and selectivity at each
point on the map. Two sets of reaction data were obtained, the first at 30 C and hydrogen partial pressure of 25 psia, and the second at 30 C and hydrogen partial pressure of 100 psia. Operation at 100 psia was intended to observe the effect of hydrogen concentration in the liquid phase. The feed solution was approximately 10% nitroanisole by weight. Catalyst was manually loaded by inverting the reactor and applying vacuum to draw the catalyst through the inlet port. Tapping the reactor against the countertop caused the particles to move down the channel and settle within the traps. Our manual loading technique permitted coverage of 70-80% of the traps in the reactor, representing approximately 6 mg of catalyst. For each set of conditions, we sampled the reactor outlet periodically over the course of approximately one hour. Samples were analyzed offline in an HPLC to measure the weight fractions of o-nitroanisole and o-anisidine, from which we calculated the conversion and selectivity. After each run, we regenerated catalyst and evaporated any residual liquid by heating to 300 C for ten minutes. Results and Discussion
Because this particular microchannel is rectangular-shaped with a high width-to-depth ratio, it cannot be considered a capillary or cylindrical channel. Thus, the conventional
HPLC Pump
NA MeOH
N2 H2
Sample to HPLC
MFC
T
P
P
Back-Pressure Regulator
Reactor Block w/ Heating Pad
Reactor
Relief Valve
Block Valve
Check Valve
P
T
Pressure Transmitter
Thermocouple
Camera
LabView Controls
Figure 5- Schematic of Experimental Setup

nomenclature of bubble, slug, and trickle flow is not applicable to our geometry. Instead, “gas-dominated,” “liquid-dominated,” and “transitional” are more appropriate terms. Liquid- and gas-dominated flows are characterized by stable patterns in which the continuous phase impedes movement of the non-continuous phase throughout the channel. For example, in liquid-dominated flow, 80% or more of the channel volume is occupied by liquid, with several small pockets of gas. In gas-dominated flow, large gas pockets persist and force liquid to channel around them. Transitional flow is characterized by an unstable pattern in which gas and liquid compete for space within the channel. This competition causes a periodic refreshing of the gas-liquid pattern, so that in addition to significant interfacial area, high turbulence is exhibited within the channel. Pockets of gas, upon refreshing, often leave behind traps surrounded by a droplet of liquid. The small distance (~15 µm) between posts likely prevents gas from overcoming the liquid surface tension, and leaves behind “wetted” traps within the gas pocket, a desirable effect we will discuss further when we present the reaction results. It is important to note that the modified terminology is intended only to help visualize the correct flow behavior, and that liquid-dominated/transitional/gas-dominated are analogous to bubble/slug/trickle in the context of the mass transfer arguments presented in the Introduction section.
Although there are no quantitative measures to determine the particular gas-liquid flow regime at hand, we identify the borders between the flow regimes based on two key and somewhat reliable indicators: the refreshment frequency of the gas-liquid pattern and the presence of wetted traps. Based on our observations, the reactor flow map is shown below in Figure 6:
0.50
0.40
0.30
0.20
0.15
0.10
0.08
0.06
2 5 8 12 15 20
Liqu
id F
low
, mL/
min
Gas Flow, sccmFigure 6- Reactor Flow Map
Gas-Dominated
Liquid-Dominated
Transitional
We obtain both sets of conversion results (low pressure/high pressure) for the lower portion of the flow map. In Figures 7 and 8 below, each chart shows the conversion plotted against time. Error bars represent one standard deviation for each particular set of samples. We observe no significant catalyst deactivation across the one-hour time span of each run.

0%
20%
40%
60%
80%
100%
0 10 20 30 40 50 60 70 80 90
Time (m in)
Co
nve
rsio
n
Liqu
id F
low
Rat
e (m
L/m
in)
0.15
0.10
0.06
Figure 7- Conversion Results (30 C, 25 psia)
15.0 20.0 28.0Gas Flow Rate (sccm)
2.0 5.0 8.0 12.0
0%
20%
40%
60%
80%
100%
0 10 20 30 40 50 60 70 80 90Time (min)
0%
20%
40%
60%
80%
100%
0 10 20 30 40 50 60 70 80 90Time (min)
0%
20%
40%
60%
80%
100%
0 10 20 30 40 50 60 70 80 90Time (min)
0%
20%
40%
60%
80%
100%
0 10 20 30 40 50 60 70 80 90Time (min)
0%
20%
40%
60%
80%
100%
0 10 20 30 40 50 60 70 80 90Time (min)
0%
20%
40%
60%
80%
100%
0 10 20 30 40 50 60 70 80 90Time (min)
0%
20%
40%
60%
80%
100%
0 10 20 30 40 50 60 70 80 90Time (min)
0%
20%
40%
60%
80%
100%
0 10 20 30 40 50 60 70 80 90Time (min)
0%
20%
40%
60%
80%
100%
0 10 20 30 40 50 60 70 80 90Time (min)
0%
20%
40%
60%
80%
100%
0 10 20 30 40 50 60 70 80 90Time (min)
0%
20%
40%
60%
80%
100%
0 10 20 30 40 50 60 70 80 90Time (min)
0%
20%
40%
60%
80%
100%
0 10 20 30 40 50 60 70 80 90Time (min)
0%
20%
40%
60%
80%
100%
0 10 20 30 40 50 60 70 80 90Time (min)
0%
20%
40%
60%
80%
100%
0 10 20 30 40 50 60 70 80 90Time (min)
0%
20%
40%
60%
80%
100%
0 10 20 30 40 50 60 70 80 90Time (min)
0%
20%
40%
60%
80%
100%
0 10 20 30 40 50 60 70 80 90Time (min)
0%
20%
40%
60%
80%
100%
0 10 20 30 40 50 60 70 80 90Time (min)
0%
20%
40%
60%
80%
100%
0 10 20 30 40 50 60 70 80 90Time (min)
0%
20%
40%
60%
80%
100%
0 10 20 30 40 50 60 70 80 90Time (min)
0%
20%
40%
60%
80%
100%
0 10 20 30 40 50 60 70 80 90Time (min)
0%
20%
40%
60%
80%
100%
0 10 20 30 40 50 60 70 80 90Time (min)
Figure 8- Conversion Results (30 C, 100 psia)
15.0 20.0 28.0Gas Flow Rate (sccm)
2.0 5.0 8.0 12.0
Liqu
id F
low
Rat
e (m
L/m
in)
0.15
0.10
0.06
0%
20%
40%
60%
80%
100%
0 10 20 30 40 50 60 70 80 90
Time (min)
0%
20%
40%
60%
80%
100%
0 10 20 30 40 50 60 70 80 90
Time (min)
0%
20%
40%
60%
80%
100%
0 10 20 30 40 50 60 70 80 90Time (min)
0%
20%
40%
60%
80%
100%
0 10 20 30 40 50 60 70 80 90Time (min)
0%
20%
40%
60%
80%
100%
0 10 20 30 40 50 60 70 80 90Time (min)
0%
20%
40%
60%
80%
100%
0 10 20 30 40 50 60 70 80 90Time (min)
0%
20%
40%
60%
80%
100%
0 10 20 30 40 50 60 70 80 90Time (min)
0%
20%
40%
60%
80%
100%
0 10 20 30 40 50 60 70 80 90Time (min)
0%
20%
40%
60%
80%
100%
0 10 20 30 40 50 60 70 80 90Time (min)
0%
20%
40%
60%
80%
100%
0 10 20 30 40 50 60 70 80 90Time (min)
0%
20%
40%
60%
80%
100%
0 10 20 30 40 50 60 70 80 90Time (min)
0%
20%
40%
60%
80%
100%
0 10 20 30 40 50 60 70 80 90Time (min)
0%
20%
40%
60%
80%
100%
0 10 20 30 40 50 60 70 80 90Time (min)
0%
20%
40%
60%
80%
100%
0 10 20 30 40 50 60 70 80 90Time (min)
0%
20%
40%
60%
80%
100%
0 10 20 30 40 50 60 70 80 90Time (min)
The highest conversion occurs in the highlighted areas, from approximately 8-15 sccm for 0.06 mL/min, 12-20 sccm for 0.10 mL/min, and 20-28 sccm for 0.15 mL/min. This range coincides with the transitional flow regime in Figure 6. Conditions outside the transitional region experience significantly lower conversion. The influence of liquid residence time lends

support to the plug flow model, as conversion within a given flow regime decreases with increasing liquid flow rate. The increase in hydrogen partial pressure serves to enhance conversion, as expected, providing complete conversion in the transitional flow regime for all but the highest liquid flow rate, 0.15 mL/min. For all runs, the selectivity towards o-anisidine is nearly 100%, indicating that no side reactions occur. The conversion results are consistent with our premise that the best reactor performance would fall within the flow regime exhibiting either the best gas-liquid or liquid-solid mass transfer characteristics. In our case, this is transitional flow, with its continually refreshing pattern and high gas-liquid interfacial area.
Though their mass transfer characteristics are similar, there is one outstanding difference between conventional slug flow and our observed transitional flow. In slug flow within a capillary, the refreshing occurs as a recirculation around the boundary of each slug. In general, slugs do not disturb the structure of adjacent slugs, and the pattern of alternating gas and liquid from one of the channel to the other is maintained. In our microreactor, the refreshing in transitional flow affects the entire channel, as though the pattern is wiped clean and then redrawn in a different, usually random, way. Thus, it could be argued that the turbulence brought on by transitional flow enhances both liquid-solid and gas-liquid mass transfer, making it clearly the preferred regime for the reaction. Comparison of low- and high-pressure data supports this assertion, as reaction conversion in transitional flow receives a much greater benefit of hydrogen partial pressure than it does outside the transitional region. In particular, at a liquid flow rate of 0.15 mL/min, conversion is enhanced by pressure more so at 20 and 28 sccm (transitional region) than at lower gas flow rates (liquid-dominated region). A similar effect occurs at 0.10 mL/min. This suggests that in transitional flow, the hydrogen partial pressure is better utilized, providing more driving force for diffusion into the liquid phase. The conversion predicted by the plug flow model varies from 1.0 to 6.0%, lagging our experimental conversion results even after adjustment of the interfacial area parameter in equation (2), ah, to large values. A likely explanation is the presence of wetted versus non-wetted catalyst traps. As we discussed above, when the gas pattern refreshes it often leaves behind traps encased in droplets of liquid. An array of several thousand traps covered by liquid droplets approximately 80 µm in diameter creates extraordinary surface area. Such a cylinder itself has a surface-to-volume ratio of 50,000 m2/m3. If coupled with the proper refreshing gas-liquid pattern the traps would function as a network of miniature batch reactors, where refreshing periodically sweeps away the products and introduces new reactants. The droplets’ small size would give very short diffusion distances for hydrogen, allowing for excellent transport of dissolved hydrogen throughout the liquid phase, and high reaction conversion. Figure 9 below shows a snapshot of the reactor in operation with areas of wetted and non-wetted traps.

Each wetted trap can be modeled as a cylindrical batch reactor with diameter equal to that of the droplet surrounding the trap, and height equal to the depth of the channel. The high surface-to-volume ratio of the cylinder permits assumption of constant hydrogen liquid-phase concentration equal to the saturation limit according to Henry’s Law. That is, all hydrogen consumed by the reaction is immediately replenished by dissolution of more gaseous hydrogen into the cylinder. The reaction rate expression becomes the design equation for a batch reactor that, when integrated, gives the nitroanisole concentration as a function of batch time. Batch time can be approximated as the refreshing frequency associated with each flow regime.
( )
( )[ ] τ100
1
1
lnln
1
1
kccKccK
cKckw
k
cKc
kdt
dc
BBBBBB
AA
Ac
BB
BB
−+=++
⋅⋅=
+=−
When the gas-liquid pattern refreshes, each batch is pushed to a different part of the reactor, often in a random direction. The liquid may undergo several such batches before finding its way out of the reactor. During each batch time, or in between refreshments, the bulk liquid continues flowing out of the reactor with its own associated residence time and conversion. Therefore the liquid in the form of droplets experiences batch reaction, while the bulk liquid experiences plug flow reaction. The two combine to yield an average conversion, which we can express in our revised model as an effective number of batches. The residence time in equation (5) is then the effective number of batches times the refreshing frequency. In this way, we can calculate an effective number of batches to match our predicted conversion to the experimental data. Using approximate refreshing frequencies of 30 seconds for transitional flow and 120 seconds for liquid- and gas-dominated flows, we can match a representative conversion for
Figure 9- Reactor Photograph of Dried vs Wetted Traps
Wetted Traps
G-L Interface Dried Traps
Gas
Liquid
(3)
(4)
(5)

each flow regime. The table below shows the effective number of batches for both low and high pressure data.
Table 1- Revision of Plug Flow ModelLow Pressure (25 psia)
τ (s) xavg Neff
Liquid-Dominated 120 20% 0.50Transitional 30 80% 7.0Gas-Dominated 120 45% 0.90
High Pressure (100 psia)τ (s) xavg Neff
Liquid-Dominated 120 30% 0.25Transitional 30 100% 3.0Gas-Dominated 120 90% 0.65
We see that the transitional flow regime contains the highest number of effective batches, indicating greater turbulence and better mass transfer. In addition, the proportion of effective batches among the three regimes is similar for both low and high pressure data. Conclusions and Future Work We define two-phase flow regimes of liquid-dominated, gas-dominated, and transitional flow in the microreactor based on certain key characteristics of the gas-liquid behavior. We measure conversion and selectivity at each point on the flow map at both low and high hydrogen partial pressure. We find that the highest conversion falls within the transitional flow regime, as the turbulence induced by transitional flow provides the best gas-liquid and liquid-solid mass transfer. Experimental conversion is higher than predicted by our plug flow model. We attribute the enhancement to another characteristic of transitional flow, the presence of wetted traps functioning as a network of small batch reactors. The model is revised to include a parameter for the effective number of batches experienced by the liquid, thus accounting for the additional gas-liquid interfacial area provided by the wetted traps. Wetted traps are prominent in the transitional flow regime, so a reactor design that maximizes the region of transitional flow is well-suited for this type of reaction.
To this end, future work should experiment with the reactor design in the context of large-scale chemical production. Specifically, operation in the transitional regime with a high liquid flow rate is desirable in order to maximize product throughput. Central to this is an understanding of the interaction between the aspects of transitional flow, namely the refreshing frequency and the extent of wetted traps. An optimized design may result in the possibility of microreactors as a beneficial alternative to conventional reactors in fine chemical and other industries. Notation
ah gas-liquid interfacial area ci liquid-phase concentration of species i ci0 initial liquid-phase concentration of species i
ε reactor void fraction

Hi Henry’s Law constant for species i k reaction rate constant kL liquid-phase mass transfer coefficient Ki absorption constant for species i Neff effective number of batches Pi partial pressure of species i t time τ residence time in batch reactor uL liquid superficial velocity wc weight of catalyst per unit volume of reactor bed z length coordinate
Literature Cited
1. R.V. Chaudhari, M.G. Parande, P.A. Ramachandran, and P.H. Brahme; I. ChemE Symposium Series No. 87.
2. P.H. Brahme, H.G. Vadgaonkar, P.S. Ozarde, and M.G. Parande; J. Chem. Eng. Data 1982, 27, 461-462.
3. R.F. Guedes de Carvalho, A.M. Alves; AIChE Journal V. 45, Issue 12, Dec. 1999, 2495-2502.
4. A. Lawal, S. Tadepalli, R. Halder, H. Qiu, W.Y. Lee, R. Besser; AIChE Spring Meeting, Atlanta, GA, April 13, 2005.
5. E.H. Stitt; Chem. Eng. Journal 4025 (2002) 1-14. 6. J. Heiszwolf, M. Kreutzer, M. van den Eijnden, F. Kapteijn, J. Moulijn; Catalysis Today,
69 (2001) 51-55. 7. M. Kreutzer, F. Kapteijn, J. Moulijn, J. Heiszwolf; Chem. Eng. Science 60 (2005) 5895-
5916. 8. M. Losey, R. Jackman, S. Firebaugh, M. Schmidt, K.F. Jensen; Journal of
Microelectromachanical Systems, Vol. 11, No. 6, December 2002. 9. H.S. Fogler; Elements of Chemical Reaction Engineering, 4th Ed.; 2006. 10. J.D. Seader and E.J. Henley; Separation Process Principles; 1998. 11. W. Ehrfeld, V. Hessel, H. Lowe; Microreactors: New Technology For Modern Chemistry;
2000, p 87-112.