catalytic hydrodehalogenative coupling of
TRANSCRIPT

CATALYTIC HYDRODEHALOGENATIVE COUPLING OF
DICHLORODIFLUOROMETHANE ON SUPPORTED PLATINUM AND PALLADIUM BIMETALLIC CATALYSTS
by
Debasish Chakraborty
B.S., Bangladesh University of Engineering & Technology, 1998
Submitted to the Graduate Faculty of
School of Engineering in partial fulfillment
of the requirements for the degree of
Master of Science
University of Pittsburgh
2002

ii
UNIVERSITY OF PITTSBURGH
SCHOOL OF ENGINEERING
This thesis was presented
by
Debasish Chakraborty
It was defended on
November 25, 2002
and approved by
Julie L. d’Itri, Associate Professor, Department of Chemical & Petroleum Engineering
Vladimir I. Kovalchuk, Research Professor, Department of Chemical & Petroleum Engineering
Irving Wender, Professor, Department of Chemical & Petroleum Engineering
Thesis Advisor:Julie L. d’Itri, Associate Professor, Department of Chemical & Petroleum Engineering

iii
ABSTRACT
CATALYTIC HYDRODEHALOGENATIVE COUPLING OF DICHLORODIFULORMETHANE ON SUPPORTED PLATINUM AND PALLADIUM
BIMETALLIC CATALYSTS
Debasish Chakraborty, M.S.
University of Pittsburgh, 2002
Ethylene and propylene are very important chemicals used as feedstocks in modern days.
Halocarbons can be a promising starting material to form C-C coupling products. The biggest
challenge of forming coupling products from chlorofluorocarbons (CFCs) is to improve the
coupling pathways by suppressing other paths of reactions that produce less attractive products.
The kinetics results of the reaction of CF2Cl2 and H2 catalyzed by PtCu/C catalysts, presented in
Chapter 3, showed the effect of Cu content on the selectivity pattern. The observation was that
the coupling selectivity increased with the increasing Cu content. Chapter 4 discusses the results
of introducing CO in the reaction mixture. The maximum coupling selectivity was increased
from 55% to 69%. The catalyst was also exposed to water for better mixing of the precursors.
The water-exposed catalyst showed an overall coupling selectivity of ~82% and the performance
was very stable. It was suggested that water exposure of the fresh catalyst increased bimetallic
particle formation. As a result the number and size of Pt particles decreased. Both the results
point toward fact that Pt or bimetallic sites may be responsible for C1 product formation and Cu
sites are responsible for coupling products formation. The performances of the palladium

iv
bimetallic catalysts were discussed in chapter 5. Monometallic Pd produced 75% hydrocarbon
oligomerization products (C2 to C5). For Pd-Ag/C catalyst, there might be a very significant
amount of bimetallic particle formation and Ag segregates hugely to the surface of the bimetallic
particles. The hydrodehalogenation and coupling reactions are occurring over the Ag sites. For
Pd-Cu there will be a moderate surface segregation of Cu to the surface and there will be just
enough Pd surface atoms to dissociate hydrogen to Cu sites for dehalogenation and coupling.
For Pd-Co/C, the function of Co is just to dilute the Pd ensemble. For Pd-Fe, Fe acts as Pd site
blocking and Pd ensemble size reducing element. Two of the bimetallic catalysts (Pd-Cu and
Pd-Co) were very stable though their activities were lower than monometallic Pd.

v
FOREWARD
I am thankful to all the people who have helped me directly or indirectly to finish the
work. First of all I would like to thank my advisor Professor Julie L. d’Itri for her advice,
guidance and help throughout the research work. I would like to express my sincere gratitude
toward Professor Vladimir I. Kovalchuk for his close supervision and guidance. This work was
not possible without his help. I express my wholehearted appreciation to Dr. Parag Kulkarni,
who passed me the torch of halocarbon research. I am also thankful to my committee member
Professor Irving Wender for reviewing my work.
I would like to thank our group members: Mr. Vladimir Pushkarev and Dr. Alex
Kudryashev for their helping hands.
My Special thanks to Professor Vladimir Zaikovoskii for the TEM images. Funding from
the National Science Foundation is gratefully acknowledged.

vi
TABLE OF CONTENTS
Page
FOREWARD………………………………………………………………………………..v
1.0 INTRODUCTION……………………………………………………………………...1
1.1 Importance of C-C Coupling……………………………………………………………1
1.2 Existing Technologies for C-C Coupling……………………………………………….2
1.3 C-C Coupling from Halocarbons………………………………………………………..6
1.4 Scope of the Thesis………………………………………………………………………8
2.0 EQUIPMENT AND EXPERIMENTAL SETUP………………………………………10
2.1 Equipment………………………………………………………………………………10
2.1.1 Reaction System………………………………………………………………………13
2.2 Instrument Calibration………………………………………………………………….13
2.2.1 Temperature Controllers……………………………………………………………...13
2.2.2 Mass Flow Controllers………………………………………………………………..14
2.2.3 GC Calibration………………………………………………………………………..15
2.3 Concerns and Cautions………………………………………………………………….16
3.0 EFFECT OF Cu CONTENT OF PtCu/C BIMETALLIC CATALYST ON THE REACTION OF HYDROGEN AND DICHLORODIFLUOROMETHANE: FORMATION OF HIGHER MOLECULAR WEIGHT COUPLING PRODUCTS…………………………………………………………………………………22

vii
Page
3.1 Introduction………………………………………………………………………………...22
3.2 Experimental……………………………………………………………………………….24
3.2.1 Catalyst Preparation and Characterization……………………………………………….24
3.2.2 Catalytic Experiments……………………………………………………………………25
3.2.3 TEM Experiments………………………………………………………………………..27
3.3 Results……………………………………………………………………………………...28
3.3.1 Catalyst Characterization………………………………………………………………...28
3.3.2 Kinetics…………………………………………………………………………………..30
3.4 Discussion………………………………………………………………………………….32
3.5 Conclusion…………………………………………………………………………………37
4.0 ROLE OF DIFFERENT ACTIVE SITES AND ALLOYING IN THE FORMATION OF COUPLING PRODUCTS FOR HYDRODECHLORINATION OF CF2Cl2 ON PtCu/C BIMETALLIC CATALYSTS…………………………………………………………………49
4.1 Introduction………………………………………………………………………………49
4.2 Experimental……………………………………………………………………………..51
4.2.1 Catalyst Preparation and Characterization……………………………………………..51
4.2.2 Catalytic Experiments………………………………………………………………….52
4.3 Results……………………………………………………………………………………54
4.4 Discussion………………………………………………………………………………..57
4.5 Conclusion………………………………………………………………………………..59
5.0 HYDRODEHALOGENATION OF DICHLORODIFLUOROMETHANE ON PALLADIUM BIMETALLIC CATALYSTS SUPPORTED ON ACTIVATED CARBON BPL F3……………………………………………………………………………………......67
5.1 Introduction……………………………………………………………………………....67

viii
Page
5.2 Experimental………………………………………………………………………………...70
5.2.1 Catalyst Preparation……………………………………………………………………….70
5.2.2 Catalytic Experiments……………………………………………………………………..71
5.3 Results……………………………………………………………………………………….73
5.3.1 Dispersion Measurements………………………………………………………………....73
5.3.2 Time on Stream Behavior…………………………………………………………………74
5.4 Discussion…………………………………………………………………………………...77
5.5 Conclusion…………………………………………………………………………………..82
6.0 SUMMARY AND FUTURE WORK………………………………………………………88
6.1 Major Results………………………………………………………………………………..88
6.2 Future Work…………………………………………………………………………………91
6.2.1 Studies on PtCu/C Catalyst………………………………………………………………..91
6.2.2 Studies Using Model Alloy Surfaces……………………………………………………...92
BIBLIOGRAPHY……………………………………………………………………………….95

ix
LIST OF TABLES
Page
Table 3.1. Irreversible Gas Uptakes and Apparent Dispersion of PtCu/C Catalysts……….39
Table 4.1. Irreversible Gas Uptake and Apparent Dispersion………………………………61
Table 5.1. Irreversible Gas Uptakes and Apparent Dispersions of Pd-M/C Catalysts……..83

x
LIST OF FIGURES
Page
Figure 1.1 Flowchart of longer chain hydrocarbons production technologies from methane; OCM= Oxidative coupling of methane, FT= Fischer-Tropsch synthesis, MTG= methanol to gasoline............................................................................................................................................2 Figure 1.2 Possible mechanism of Fischer-Tropsch chain growth; H*
= surface hydrogen.………………………………………………………………………………………….4 Figure 2.1 Reaction system for CFC kinetics and catalyst performance measurements………..18 Figure 2.2 Mass spectrometer sample injection flow diagram.....................................................19 Figure 2.3 Calibration of MFC for 4% CO in He………………………………………………20 Figure 2.4 GC peak area for CF2Cl2 (as a measure of FID response) for 25 sample injections at identical conditions………………………………………………………………………………21 Figure 3.1 HREM image of the BPLF-3 carbon support………………………………………..40 Figure 3.2 Pt particles on C support for reduced 0.5 % Pt/C (a); and histogram showing the particle size distribution for reduced 0.5 % Pt/C (b); reduction condition: 400 0C, in 20 ml H2 + 30 ml He flow................................................................................................................................41 Figure 3.3. Particles on the carbon support of reduced Pt1Cu6/C reduction condition: 400 0C, in 20 ml H2 + 30 ml He flow..............................................................................................................42 Figure 3.4 CuO particle on carbon support of reduced Pt1Cu9 catalyst ; reduction condition: 400 0C, in 20 ml H2 + 30 ml He flow...................................................................................................43 Figure 3.5 Dot scattering centers of reduced Pt1Cu2/C catalyst showing the presence of copper ions; reduction condition: 400 0C, in 20 ml H2 + 30 ml He flow................................................................................................................................................44

xi
Page
Figure 3.6.. TOS profile of CF2Cl2 conversion catalyzed by Pt1Cu2 (•), Pt1Cu6 (■), Pt1Cu9 (▲), and Pt1Cu18 (◊) (250 0C, 1 atms, CF2Cl2:H2=1:1).............................................................45 Figure 3.7. Average selectivity toward C1 products (a); and coupling products (b)for different Pt-Cu/C catalysts after initial 5min of TOS (Inclined hatched bars: CH4; Cross hatched bars: CH2F2; empty bars: CH3F; vertically hatched bars: CHF2Cl; perpendicularly hatched bars: C2H4; horizontally hatched bars: C2H6; and filled bars: C3H6) (250 0C, 1 atms, CF2Cl2:H2=1:1).............................................................................................................................46 Figure 3.8 Selectivity towards C1 products of Pt1Cu2/C (a); Pt1Cu6/C (b); Pt1Cu9/C (c); and Pt1Cu18/C (d)catalysts; CH4 (•), CH2FCl (▲), CHF2Cl (◊), CH2F2 (ο), CHF3 (▼), conversion ( ) (250 0C, 1 atms, CF2Cl2:H2=1:1)…………………...............................................................47 Figure 3.9 (a) Selectivity towards coupling products of Pt1Cu2/C (a); Pt1Cu6/C (b); Pt1Cu9/C (c); and Pt1Cu18/C (d)catalysts; C2H4 (■), C2H6 (ο), C2F4 (◊), C3 (▲), C4+ (∇), conversion ( ) (250 0C,1 atms, CF2Cl2:H2=1:1)...................................................................................................48 Figure 4.1 Maximum selectivity toward coupling products for Pt and PtCu/C catalysts; (we: water exposed catalyst, CO: presence of CO in the reaction mixture) (250 0C, 1 atms, CF2Cl2: H2 = 1:1)...........................................................................................................................62 Figure 4.2. Selectivity toward C1 products (a); and C2 products of PtCu/C catalysts (b) (250 0C, 1 atms, CF2Cl2: H2 = 1:1)..................................................................................................................63 Figure 4.3 Selectivity toward C1products (a) ; and C2 products (b) of PtCu/C catalysts when CO was present in the reaction mixture (250 0C, 1 atms, CF2Cl2: H2 = 1:1).................................................................................................................................................64 Figure 4.4 Selectivity toward C1 products (a); and C2 products (b) of water-exposed PtCu/C catalysts (2500C, 1 atms, CF2Cl2: H2 = 1:1)..................................................................................65 Figure 4.5 TOS profile of reaction rates for fresh (▲) and water-exposed (●) catalysts (250 0C, 1 atms, CF2Cl2: H2 = 1:1)..................................................................................................................66 Figure 5.1 Conversion as a function of TOS for Pd/C and Pd-bimetallic catalysts (CF2Cl2 :H2 =1:1 and 523 K).............................................................................................................................84 Figure 5.2 Selectivity toward C1 products (a); and coupling products (b) at CF2Cl2 : H2=1:1 and 523 K on Pd/C................................................................................................................................85 Figure 5.3 Selectivity toward coupling products on Pd-Cu/C (a); Pd-Ag/C(b); Pd-Co/C (c); and Pd-Fe/C (d). at CF2Cl2 =1:1 and 523 K…………..86

xii
Page
Figure 5.4 Selectivity toward C1 products on Pd-Cu/C (a); Pd-Ag/C (b); Pd-Co/C (c); and Pd-Fe/C (d) at CF2Cl2 =1:1 and 523 K…………..87
1
1.0 INTRODUCTION
1.1 Importance of C-C Coupling
Carbon-carbon coupling products like ethylene and propylene have diverse application as
feedstock for industries. Ethylene is the largest volume building block for many petrochemicals.
It is the most significant organic chemical produced today in terms of production volume, sales
value, and variety of useful derivatives.(1) It is primarily used for the production of such
polymeric materials as fabricated plastics, fibers, films, resins, adhesives, and elastomers.
Propylene is perhaps the oldest petrochemical feedstocks and is one of the principal light
olefins.(2) This olefin is used to produce many end products such as plastics, resins, fibers, etc.
It is used widely as an alkylation or polymer gasoline feedstock for octane improvement.(3) In
addition, large quantities of propylene are used in plastics as polypropylene, and in chemicals
like acrylonitrile, propylene oxide, 2-proponal, and cumene. The major source of ethylene
throughout the world is the pyrolysis of hydrocarbons. Propylene is produced primarily as a by-
product of petroleum refining and of ethylene production by steam pyrolysis. As conventional
petroleum feedstocks become more expensive or scarce as source of ethylene, olefin
manufacturers will be forced to look toward unconventional sources.(4)

2
1.2 Existing Technologies for C-C Coupling
Methane and synthesis gas, which is a mixture of CO and H2, have been looked upon as
the most promising alternative feedstock for the production of longer chain molecules. Much
work has been done toward developing methods for direct methane conversion to intermediates
as diverse as methanol and formaldehyde.(5-10) These intermediates can be further processed to
produce liquid hydrocarbons. The following chart can summarize the conversion methods:
CH 4 CO/H 2 Methanol
OCM FT MTG
C 2+ Paraffins Olefins Alcohols
Gasolin e
Figure 1.1 Flowchart of longer chain hydrocarbons production technologies from methane; OCM= Oxidative coupling of methane, FT= Fischer-Tropsch synthesis, MTG= methanol to
gasoline.
The Fischer-Tropsch synthesis (FTS) is one of the available methods for forming higher
molecular weight products from smaller ones.(11-14) This process uses CO and H2 as feedstock
and a suitable catalyst to produce longer chain molecules. Historically Fe and Co are used as FT
catalysts but Ni and Ru are also typical FT catalysts capable of producing higher molecular
weight hydrocarbons.(15) The products of the FTS are gasoline, diesel fuel, waxes, olefins and

3
alcohols but the desired product selectivity can be increased by the use of suitable catalyst. The
hydrocarbon formation reactions are as follows:
Alkane formation (n+1)H2 +2nCO ↔ CnH2n+2+nCO2
(2n+1) H2 +nCO ↔ CnH2n+2 +nH2O Alkene formation nH2 +2nCO↔CnH2n +nCO2
2nH2+nCO↔CnH2n+nH2O Alcohol formation 2nH2 +nCO↔CnH2n+1OH+(n-1) H2O
The FTS is a polymerization reaction with the following steps(16)
1. Reactant adsorption
2. Chain initiation
3. Chain growth
4. Chain termination
5. Product desorption
6. Readsorption and further reaction.
The most important mechanism for the hydrocarbon formation on cobalt, iron and
ruthenium catalysts is the surface carbide mechanism by CH2 insertion.(17) The monomer of the
carbide mechanism is a methylene (CH2) species. CO and H2 are assumed to adsorb
dissociatively. Several species like CH, CH2, and CH3 can be formed this way.
Chain growth occurs by the insertion of the monomer in a growing alkyl species.
Termination can take place by abstraction of hydrogen to an olefin or addition of a CH3 species
or hydrogen to form paraffin (Figure 1.2). Since the FT synthesis involves a chain growth
mechanism, which obeys Anderson-Schultz-Flory kinetics, this poses the problem in designing
the process to produce a narrow carbon number range product.(18)

4
C O C O
H H
H 2
C +H* C
H
+H * CH2
C H 2 CH2
RC H 2
C H 2 R
+
C H 2
C H 2 R
-H* CH CH2 R
R CH2 CH3
C O 1 .
2 .
3 .
4 .
5 .
Figure 1.2 Possible mechanism of Fischer-Tropsch chain growth; H* = surface hydrogen.

5
Higher molecular weight products can also be formed from methane via methanol. The
process is based on selective conversion of methanol using the shape selective zeolite ZSM-5 to
yield an aromatic product, which boils in the gasoline range. The methanol is selectively
produced from syngas over copper-based catalyst using proven technology. The shape selective
zeolites produce hydrocarbon materials from methanol that are predominately in the gasoline
range and have both aromatic and aliphatic components. More of the higher-octane gasolines
blending stocks are produced by this process than the Fischer-Tropsch process. The shape
selective zeolites are intermediate in pore dimension between the familiar wide-pore faujasites
and the very narrow-pore zeolite A. It is pore dimension that controls product distribution. A
typical product distribution obtained with shape-selective zeolites, expressed as percent weight
of the total carbon fraction is: (aliphatic) C4, 26; C5, 10; C6+, 4; and (aromatic) benzene, xylenes,
trimethylbenzenes, and tetramethylbenzenes, 41.(19)
Oxidative coupling of methane (OCM) is another available technology for the direct
conversion routes to form coupling products from methane. In OCM reaction, CH4 and O2 react
over a catalyst at elevated temperatures to form C2H6 as primary product and C2H4 as secondary
product. The reactions are the following:
CH4 + ¼ O2 ↔ ½ C2H6 + ½ H2O
CH4 + ½ O2 ↔ ½ C2H4 + H2O
Unfortunately, both CH4 and C2H4 may be converted to CO2, and the single pass
combined yield of C2 products is limited to about 25 %.(20) The selectivity toward C2+ can be
improved by using appropriate catalysts. Over Rb2WO4/SiO2 catalyst 78% C2H4 selectivity at a
CH4 conversion of 32 % was achieved.(21) The mechanism of OCM is addressed in detail in the
work of different groups.(22-24) Methyl radicals are formed on the surface and coupled in the gas

6
phase to produce C2H6. Ethylene is mainly a secondary product, although a very small amount
occurs as an initial product.
1.3 C-C Coupling from Halocarbons
Halocarbons can also be a promising starting material to form C-C coupling products.(25-
27) These molecules serve as precursors for producing surface hydrocarbon intermediates.(28-31)
Because carbon-halogen bonds (except C-F) are typically weaker than C-H and C-C bonds and
because they can be selectively dissociated, these molecules are viable precursors to selected
hydrocarbon fragments. Halogenated hydrocarbons or halocarbons are well known
environmental pollutants,(32) and understanding the basic coupling chemistry of the halocarbon
fragments on solid surfaces will be useful not only for protection and cleanup technologies but
also to produce industrially useful olefins. Dichlorodifluoromethane (CF2Cl2) is the model
single carbon chlorofluorocarbon (CFC) compound. The main idea is to produce surface carbene
species from CFC and then combine these carbene species to form coupling products according
to the following reactions:
OlefinCHCFClCF couplingHCl →→→ +−2222 ::
42222 : FCCFClCF CouplingCl →→−
The technology to selectively form coupling products from CF2Cl2 is important because it
can help in converting all the single carbon Cl containing halocarbon wastes into useful products.
Compounds like CCl4 can be indirectly converted to CF2Cl2 by reacting with HF according to the
following reactions(33)

7
molkJGHClFCClHFFCClmolkJGHClFCClHFCCl
/23/10
223
34
−=∆+→+−=∆+→+
Thus the technology will not only make it possible to convert the existing CFC stocks, it
will also help preventing further pollution by converting chlorocarbons into industrially useful
products. Another attractive aspect of the technology is that the HF produced in the
hydrodehalogenation reaction can be recycled and reused to react with fresh chlorocarbons.
The formation of molecules with one or more C-C bond from halocarbons has been
actively researched, but there are only a few reports devoted to C1 halocarbons as the starting
materials.(34-37) The reaction of CF2Cl2 and H2 catalyzed by Pd/C produced C2 and C3
hydrocarbons with ∼75% selectivity and C2H4 as the major coupling product.(34)
Tetrafluoroethylene was observed with Pd-Fe/graphite and Pd-Co/graphite catalysts during the
CF2Cl2 + H2 reaction at high CFC: H2 ratios, whereas on Pd/graphite the reaction was
unselective toward coupling products.(36) With Pt based catalysts, Pt/C showed negligible
selectivity toward coupling products (total selectivity <5%), whereas Pt-Co/C and Pt-Cu/C
showed highest selectivity toward C2-C3 hydrocarbons (∼50 %) and tetrafluoroethylene (∼20%),
respectively.(35) Mori et al.(37) studied C-C bond formation in the hydrodechlorination of CHCl3
on Pd/SiO2. Analyzing the C2-C7 products produced in the process they concluded that the
hydrocarbons were formed via polymerization of surface C1 species such as methylene groups.
In a recent study, Hou and Ching(38) discussed coupling of halocarbon fragments on Cu (111)
surface. They observed formation of a difluorocarbene intermediate which coupled to form
CF2=CF2.
The biggest challenge of forming coupling products from CFCs is to improve the
coupling pathways by suppressing other paths of reactions that result in less attractive products.
The use of proper catalyst is the way to selective coupling. An appropriately designed catalyst

8
will lower the barrier for the desired reaction resulting in a much better selectivity.
Understanding the basic chemistry and the relation of surface properties with the chemistry will
enable us to design the catalyst that is optimum for the reaction of producing coupling products
from CFCs. With this in mind the goal of this work has been to advance the basic scientific
knowledge of molecular –level events on catalysts for the conversion of CFCs to useful coupling
products.
1.4 Scope of the Thesis
The work presented in the thesis concentrates on the development and basic
understanding of catalysts for selectively forming coupling products by hydrodehalogenation of
dichlorodifluoromethane (CF2Cl2). Chapter 2 of the thesis describes the equipment and
experimental procedures used in the investigation. The role of the Cu content in the bimetallic
PtCu/C catalyst in coupling products formation from CFC in hydrodehalogenation is investigated
and the results are reported in the Chapter 3. The Cu content is varied from 0.32% to 2.8 %
keeping the Pt content constant (0.5%) in the activated carbon supported bimetallic catalyst. The
catalysts are characterized by chemisorption of H2, chemisorption of CO, chemisorption of O2
and hydrogen titration of adsorbed oxygen. Transmission electron microscopy (TEM) and high-
resolution electron microscopy (HREM) techniques were also used for catalyst characterization.
Chapter 4 of this dissertation presents the investigation on different active sites of the PtCu/C
bimetallic catalyst in the coupling products formation from CF2Cl2. The PtCu/C
(0.5%Pt+0.98%Cu) is exposed to water before reaction and the reduced catalyst is used for

9
kinetic experiments. Kinetics experiments are also performed with CO in the reaction mixture.
Chapter 5 presents investigation on Pd bimetallic catalyst supported on carbon for
hydrodehalogenative coupling. Group IB (Cu, Ag) and group VIII (Fe, Co) are used as the
second metal with Pd. Finally Chapter 6 summarizes the current work and mentions possible
works that can be pursued in future.

10
2.0 EQUIPMENT AND EXPERIMENTAL SETUP
The chlorofluorocarbon conversion work presented in this thesis is based on experimental
research. The design of equipment that could accurately and reliably measure the important
parameters in the experiments was critical to the results obtained in this investigation. A variety
of experimental techniques were used to measure reaction kinetics, catalyst performance, study
molecular adsorption and characterize catalysts and support materials. This chapter describes the
experimental equipment used for the different techniques and calibration procedures followed.
Details of specific experiments performed are presented in individual chapters to describe the
experimental procedures relevant to data presented in each chapter.
2.1 Equipment
2.1.1 Reaction System
The kinetics and catalyst performance measurements were carried out at atmospheric
pressure in a stainless-steel flow reaction system consisting of a quartz microreactor (10 mm i.d.)
equipped with a quartz frit to support the catalyst. A flow diagram for the reaction system is
shown in Figure 2.1. The entire system is compactly arranged on a movable cart, which allowed

11
for easy positioning. The system interfaced with house electric lines to supply power to the
various instruments and electronics, with gas tank lines routed from a common tank-holding area
and vent lines that were routed from the system to a constant air velocity laboratory exhaust
system. The materials used in this study were all gases at room temperature and were drawn
from individual gas tanks. For gases such as He, H2, C2H4, and N2 tanks were equipped with
dual stage pressure regulators that reduced typical tank pressures of ~ 2000 psi to line pressures
of ~ 100 psi. Dichlorodifluoromethane was contained in tank as liquid and was available at their
vapor pressure at room temperature (boiling point –29.8oC, vapor pressure at room temperature
82 psig). The low pressures allowed the use of needle valves at the outlet of these tanks along
with a tank pressure gauge. Each gas line was equipped with a check valve, which prevented
back-mixing due to pressure fluctuations, a 0.5 or 2 micron filter and at least one ball valve.
Gaseous reactants were metered using mass flow controllers (MFC, Brooks Instruments model
5850E) and mixed prior to entering the reactor. An electronic unit regulated the power supply
and flow readouts from the MFCs. Prior to entering the reactor a 3-way needle valve controlled
the space velocity of the reaction mixture. All lines downstream of the reactor were heated to ~
50 oC to minimize the condensation of reactants due to pressure increases. This also minimized
the possibility of high molecular weight chlorocarbons formed during the reaction plugging up
the tubing.
The reactor was a 4mm i.d. quartz U-tube with a 10 mm i.d. section that contained the
porous quartz frit to support the catalyst powder. The reactor was attached to the feed system via
two glass-to-metal CAJON fittings and could be removed easily for loading the catalyst samples.
The reactor zone containing the catalyst was heated by an electric furnace and the catalyst
temperature was measured and controlled with an accuracy of ± 1 K using a temperature

12
controller (Omega model CN2011). The catalyst temperature was measured by an Omega type
K thermocouple placed in a 1mm i.d. quartz sleeve that was in contact with the quartz frit in the
reactor. This thermocouple also supplied the “measured variable” to the temperature controller,
which operated in a feedback PID loop to control the heat input to the electric furnace
surrounding the reactor.
The reactor effluent was analyzed by on-line GC and, when necessary, GC-MS to
identify the reaction products. The GC (HP 5890 series II) was equipped with a 15 ft 60/80
Carbopack B/5 % Fluorocol packed column (Supelco) and a flame ionization detector (FID)
capable of detecting concentrations > 1 ppm for all CFCs, chlorocarbons and hydrocarbons
involved in this study. The on-line HP GC/MS system consisted of a HP 5890 series II plus GC
(also equipped with a Fluorocol column) connected to a HP 5972 Mass Selective Detector.
Gaseous samples of the reactor effluent were injected in the GC column using an automatic, air-
actuated 6-port sampling valve equipped with a 100 µL sample loop. In addition, the GC/MS
used a 3-way splitter valve at the GC and MS interface (shown in Figure 2.2) to reduce sample
volume entering the MS. This arrangement provided good MS ultimate pressures and adequate
sample volume for accurate analysis. For transient kinetics experiments where several samples
were collected each minute, an electrically actuated 16-loop sample valve was used. Both, the
GC and the GC/MS were interfaced to separate computers running HP Chemstation and MS
Chemstation software respectively. All raw data output from GC or GC/MS measurements
could be processed using these soft wares and converted to kinetics parameters such as
concentration and conversion.
13
2.2 Instrument Calibration
Calibration of metering devices such as MFCs as well as analytical instruments was
performed following manufacturer guidelines. General procedures for calibrating equipment are
outlined below along with a few specific examples.
2.2.1 Temperature Controllers
Depending upon the type of thermocouple used and the range of operation, the
temperature controllers needed to be calibrated. The controller was calibrated by the
manufacturer when assembled. A thermometer placed in the furnace gives the actual
temperature, which can be compared to the temperature readout on the controller. Necessary
calibration equation between thermocouple readout and thermometer reading can be thus
determined. No such equation was required for this research, the discrepancy being within the
controller accuracy of +/-1 K.
The PID (proportional, integral and differential) control parameters for the controller were set as
explained in the manual. This ensured faster and better control of the temperature and reduced
oscillations and overshooting, especially when step change was imposed.

14
2.2.2 Mass Flow Controllers
A MFC was factory calibrated for specific gas and its calibration became necessary when
used for any other gas. Though it was found that the calibrations for the MFCs do not change
drastically with time to introduce errors beyond the accuracy of a MFC, it is a good practice to
calibrate mass flow controllers at regular intervals of time (whenever a tank is replaced by a new
one, a new equipment is connected, tubing is changed or rearranged). Furthermore, it has always
been observed that the calibration obtained for MFC had good linearity (correlation factor
>99.5%). Even between two calibrations, random checks helped avoid any error in flow. This
was done prior to or even during an experiment by switching the flow momentarily through the
bubble flow meter and measuring the flow rate.
To calibrate a MFC, the gas is flown through the bypass or through an empty reactor.
The idea is to calibrate with the system under conditions as close as possible to those, which will
be used in the experiment. Use of an empty reactor will mimic the experimental conditions to
some extent. The procedure described below refers to a single gas, but the calibration should be
performed independently and individually for all gases following the same procedure. Figure 2.4
shows the typical fits 4 %CO in He flows using a MFC.
The tank regulator delivery pressures were to the following values: 20 psig for CF2Cl2, 80
psig for He, 50 psig for H2 and 50 psig for N2, which was used as a career gas in the GC. An
empty reactor was connected and the gas (whose MFC is to be calibrated) was flown through it
and was checked for leaks. The three-way valve placed downstream to appropriate position was
switched so that the gas flowed through the bubble flow meter. The soap solution in the bulb of
the flow meter was checked to make sure that it was adequate in quantity and wets the flow

15
meter walls. The MFC reading was set to a certain value (say 5.0) using the knob on the front
panel of its control unit. The flow was measured through the bubble flow meter thrice using a
stopwatch. The average of the three readings was considered. This procedure was repeated for
different MFC settings and the average flow was measured each time. A linear fit (correlation
factor of >99.5% is acceptable) should be achieved between the MFC values and corresponding
average flows. Care should be taken to calibrate the MFC in the actual range of flows, which
would be used in experiments.
2.2.3 GC Calibration
To quantify GC areas, the response of the FID detector must be determined. This
involves developing a calibrating function (response factor for FID) between the detector area of
a component and its concentration in the stream. The amount of a species entering the GC (and
its area) is related to the pressure and volume in the sample loop. The loop volume always
remains constant but the pressure varies depending upon the flow rate and other factors such as
back pressure.
The carrier gas carrying the reactant and hydrogen were mixed appropriately to achieve
desired concentration. Three injections were made each with the gases flowing through the
bypass and then through the reactor. The procedure was repeated at the end of the experiment to
note and account for the change in the flow. A deviation in the areas of <10% of the average
area was deemed acceptable for the current work. The response factor was thus directly
determined.

16
As calibration depends upon the GC settings as well, it is necessary to record several
parameters. It is also required to note down the retention times as during the actual experiment
the component is identified using its retention time.
2.3 Concerns and Cautions
The following list outlines the essential procedures, which must be performed before,
during and/or after conducting an experiment.
Checking the system for leak(s) after new connections. This is possible with the use of a
leak detector liquid for atmospheric pressure systems and by using a MS for the vacuum system.
Using conditioned GC and GC/MS columns with timely checks for retention times and
response factors.
Using different sets of spatula, reactor, thermocouple-well for different catalysts.
Allowing the instruments to stabilize before taking each reading (at least 5 min between
each injection to GC, 1 min with the valve in the “Load” position, about 5 min after changing the
flow using a MFC and 1 minute after zeroing pressure gauges).
Material Safety Data Sheets (MSDS) must be obtained for every reactant used and major
product being formed during the reaction.
Caution should be maintained while handling hazardous gases such as H2 and HCl with
the use of continuous gas monitoring systems. Explosive and corrosive gases like CF3COCl
should be handled only in hoods with necessary protective equipment.
17
Vent lines should be checked frequently to ensure leak-free operation and a list of
possible effluents from reaction studies should always be maintained.
Safety reviews of equipment and experiments should be made frequently and design
improvements to make laboratory operations safer should be an ongoing effort in every graduate
student’s work.
The GC, GCMS and the reaction system should be maintained properly. The oil in the
vacuum pump should be replaced every six months. The filters for the house air should be
checked regularly.

18
MFC He N2
H2 O2
CFC Reactor
Bypass
Temp. Controller
GC
Vent
GC/MS
Rapid Sampling Valve Array
ON/OFF Valve Line Filter
Figure 2.1 Reaction system for CFC kinetics and catalyst performance measurements

19
Sample loop
Sample in
Carrier in Sample to vent
Carrier to column
packed column
3-way needle valve
Sample to interface heater and MS
Vent
Figure 2.2 Mass spectrometer sample injection flow diagram.

20
0 2 4 6 8 10 12 140
1
2
3
4
5
6 Calibration for 4% CO in HeCalibrated on 03/14/02
MFC
Dis
play
Actual Flow (ml/min)
Figure 2.3 Calibration of MFC for 4% CO in He

21
0 5 10 15 20 25
4500000
5000000
5500000
6000000
6500000
7000000
+ 5 %
- 5 %
CFC peak area calibration (column @ 50 C)CFC:H2:total = 2:6:100 cc/min
Are
a of
cfc
pea
k
Injection number
Figure 2.4 GC peak area for CF2Cl2 (as a measure of FID response) for 25 sample injections at identical conditions

22
3.0 EFFECT OF CU CONTENT OF PTCU/C BIMETALLIC CATALYST
ON THE REACTION OF HYDROGEN AND
DICHLORODIFLUOROMETHANE: FORMATION OF HIGHER
MOLECULAR WEIGHT COUPLING PRODUCTS
3.1 Introduction
Chlorofluorocarbons (CFCs) have had a lasting effect on the environment. CFCs are the
major sources of stratospheric chlorine, which is responsible for the depletion of the ozone
layer.(1) While many western countries have stopped the production of CFCs, over 120400 metric
tons of CFCs were produced worldwide in the year 2000.(2) Thus technology to convert CFCs
into environmentally benign and industrially useful products is still required. Catalytic
hydrodechlorination is one of the available technologies and in addition to the environmental
advantages, it has obvious economic merits because the resulting products can be recovered and
recycled for use.(3) Studies of the hydrodechlorination of CFCs have been mainly focused on the
full or partial removal of Cl atoms from the molecules to obtain alkanes or partially halogenated
alkenes.(4-6) However, the production of higher molecular weight coupling products through the
hydrodehalogenation of CFCs may also be possible.(7-9)

23
The formation of molecules with one or more C-C bonds from halocarbons has been
actively researched, but there are only a few reports devoted to C1 halocarbons as the starting
materials.(10-12) The hydrodechlorination of CF2Cl2 catalyzed by Pd/C produced C2 and C3
hydrocarbons with ∼75% selectivity and C2H4 as the major coupling product.(10)
Tetrafluoroethylene was observed with Pd-Fe/graphite and Pd-Co/graphite catalysts during the
CF2Cl2 + H2 reaction at high CFC:H2 ratios, whereas Pd/graphite was unselective toward
coupling products.(12) With Pt based catalysts, Pt/C showed negligible selectivity toward
coupling products (total selectivity <5%), whereas Pt-Co/C and Pt-Cu/C showed the highest
selectivity toward C2-C3 hydrocarbons (∼50%) and tetrafluoroethylene (∼20%), respectively.
Though it has long been known that alloying significantly changes the catalytic
properties,(13-15) it is still a matter of debate whether this change is due to ensemble effects,(16-17)
structure effects,(18) or electronic effects.(19) In many cases the alloy surface composition and
structure are different from the bulk and this composition and the surface structure depends
heavily on the reactants and reaction conditions.(20) Thus using bimetallic catalysts creates the
opportunity to tune the catalyst properties to achieve the desired results. In a previous
investigation,(21) Pt-Cu/C was shown to be highly selective toward coupling products in the
reaction of CF2Cl2 and H2. The present investigation centers on the role of Cu content in
controlling the chemistry catalyzed by bimetallics. The Cu content was varied keeping the Pt
content constant in the activated carbon supported bimetallic catalyst to investigate the role of Cu
as well as the Pt to Cu atomic ratios in the formation of coupling products in the
hydrodehalogenation of CFC.

24
3.2 Experimental
3.2.1 Catalyst Preparation and Characterization
Activated carbon (BPL F3, 6x16 mesh, Calgon Carbon) was crushed and sieved to obtain
a fraction of 24-60 mesh (1400 m2/g surface area; 2.4 nm average pore diameter) to use as a
support. The 24-60 mesh fraction was then co-impregnated with an aqueous solution of
H2PtCl6.6H2O (Alfa, 99.9%) and CuCl2.2H2O (MCB Manufacturing Chemists, 99%). The
material was allowed to equilibrate overnight before drying at ambient temperature and pressure
for 24 h. It was then dried at 100 0C for 2 h in vacuum (~25 Torr). The catalyst nomenclature is
defined according to the Pt to Cu molar ratio. For example, a catalyst with Pt to Cu ratio 1:6 is
referred to as Pt1Cu6. The compositions of all the catalysts are listed in Table 3.1.
Chemisorption and BET measurements were carried out using a volumetric sorption
analyzer ASAP 2010 and ASAP 2010 Chemi (Micromeritics ®). The metal-adsorbate ratio was
determined from the irreversibly adsorbed CO, H2 or O2. The adsorbate – metal stoichiometry
was assumed to be equal to 1 for CO and 2 for both H2 and O2. For each catalyst CO, H2, O2
chemisorption and titration of adsorbed oxygen with H2 (HT) were performed sequentially with
the same sample at 35 0C. Prior to measurement, the catalyst was reduced at 3000C for 1 h in
flowing H2 (Praxair, 99.999%). The reduction was followed by evacuation for 1.5 h at 350 0C.
Then the catalyst was cooled, the CO chemisorption was performed and the catalyst was reduced
at 350 0C for 1 h and evacuated for 1.5 h at the same temperature. Next, H2 chemisorption was
conducted after which the catalyst was again evacuated at 350 0C for 1.5 h. This was followed

25
by O2 chemisorption, evacuation at 350 0C for 1 h and H2 titration. The dispersion results are
shown in Table 3.1.
3.2.2 Catalytic Experiments
The hydrodechlorination of CF2Cl2 (Atochem, >99%; detectable impurities: CHF2Cl
~0.25% and CH3CF3 ~0.25%) was conducted at atmospheric pressure in a stainless steel flow
reaction system consisting of a down-flow quartz micro reactor (10 mm i.d.) equipped with a
quartz frit to support the catalyst. An electric furnace was used to heat the reactor zone
containing the catalyst. The catalyst bed temperature was measured and controlled with an
accuracy of ± 1 0C (Omega model CN2011). The gas flows (CFC, H2, Praxair, 99.9%; He,
Praxair, 99.9%) were metered with mass flow controllers (Brooks Instruments, model 5850E)
and mixed prior to entering the reactor. The reactor effluent was analyzed by on-line GC and by
GC/MS to identify the reaction products. The GC (HP 5890 series II) was equipped with a 15 ft
60/80 Carbopack B/5% Fluorocol packed column (Supelco) and a flame ionization detector
(FID) capable of detecting concentrations >1 ppm for all CFCs, chlorocarbons and hydrocarbons
under investigation. The on-line HP GC/MS system consisted of a HP 5890 series II Plus GC
equipped with a Fluorocol column connected to a HP 5972 Mass Selective Detector. A 16-loop
sample valve (VICI) was attached to the GC to collect sample without waiting for the GC
analysis to finish. The valve was used to collect samples during the very early stages of the
reaction.
26
Prior to reaction, the catalyst was treated with a mixture of H2 (20 ml/min) and He (30
ml/min) as it was heated from 27 0C to 400 0C at the rate of 5 0C /min and then held at 400 0C for
120 min. The catalyst was cooled in flowing He (30 ml/min) to the reaction temperature, 250 0C,
and the reactant mixture was introduced. The reaction was conducted at the CF2Cl2 to H2 molar
ratio of 1 (2 ml/min of each) with He (26 ml/min) as diluent. The CF2Cl2 to H2 molar ratio used
in this work is the stoichiometric ratio required for the dechlorinative dimerization of CF2Cl2 to
C2F4. In all cases the conversion was kept below 5% to maintain condition appropriate for the
differential reactor assumption. All experiments were stopped after the conversion had reached
to < 0.2 %.
For all experiments the total flow rate was 30 ml/min (balance by pure He flow) and the
catalyst weight was ~0.03 g. The selectivities (Si) toward detectable carbon-containing products
were calculated as follows:
∑=
iii
iii Cn
CnS ,
where ni and Ci are the number of carbon atoms in a molecule and the mole concentration
of the product i in effluent gas, respectively. The formation of HCl was detected by GC/MS but
not quantified.
The reaction rates per gram of catalyst was calculated by applying the differential reactor
approximation in the form
Rate (mmol/gsec)= F∗y/W,
where F is total molar flow rate, y is the mole fraction of reactant converted, and W is the
catalyst weight. The turnover frequencies (TOF) were calculated using the expression
TOF (s-1)=R∗MWPt / M∗d,
27
where R is the rate per gram of catalyst, MWPt is the molecular weight of Pt, M is the Pt loading
percent, and d is dispersion.
3.2.3 TEM Experiments
Transmission electron microscopy (TEM) studies were conducted using a JEM2010
(JEOL) electron microscope with a resolution of 0.14 nm and an accelerating voltage of 200 kV
capable of distinguishing metal particles as small as 10 Å on the support surface. Reduced and
used catalysts were generated from the kinetics system described above and were placed in
tightly sealed glass vials for transport to the microscopy system. Sample preparation consisted
of hand grinding under ethanol for 20 to 60 sec followed by further dispersion with ultrasound at
35 kHZ. Drops of suspension were then placed on gold grids for examination. Digital Fourier-
analysis (FFT) was used to analyze the HREM images. The mean diameter of all particles
observed, dm, and surface weighed average particle size, dss, were calculated by using the
following formulas:
N
dd
N
i
m
∑= 1 ,
and
∑
∑= N
i
N
i
ss
d
dd
1
2
1
3
,
where di is particle diameter and N is the total number of particles.

28
3.3 Results
3.3.1 Catalyst Characterization
The results of chemisorption measurements of the carbon supported Pt, the bimetallic Pt-
Cu catalysts and the pure support are shown in Table 3.1. The CO/Pt ratios are in the range of
43.6-49.1 for all PtCu bimetallics and for monometallic Pt catalyst the ratio was 26.5. It is
important to remember that the CO chemisorption stoichiometry is unknown because the
proportion of chemisorbed species in the linear and bridged forms can vary. Furthermore, the
adsorption properties may also depend on the metal particle size.(22) The H/Pt ratios for all the
catalysts are in the range of 3-5, which is significantly lower than that of CO/Pt. Lower
hydrogen uptakes, compared with those of CO, were also observed for bimetallic Pt-Sn.(23)
Platinum, Cu and the support chemisorbed oxygen irreversibly (Table 3.1). The uptake of
oxygen increased while the ratio of O/(Pt+Cu)t decreased with increasing Cu loading . For Pt/C
the ratio was 70.5 and for PtCu/C bimetallics the ratio ranged from 70.5 to 12.1 (Table 3.1).
The chemistry of hydrogen titration follows the reaction O(s)+3/2H2 H +H2O.(22) The
results of hydrogen titration (Table 3.1) do not correlate with those of CO chemisorption;
H/Ptt(HT) ratio decreased with increasing Cu/Pt atomic ratio. It is important to note that Cu is
incapable of reducing adsorbed oxygen at 35 0C.
Although each metal dispersion measurement method has drawbacks, one can obtain a
good qualitative understanding by performing a combination of techniques. For example, from
the O/(Pt+Cu)t ratios (Table 3.1) it is clear that the mean size of the bimetallic particles

29
increased as the metal loading increased, while the fraction of Pt atoms exposed remained
essentially the same (from constant H uptake, Table 3.1) as Pt diluted Cu.
The carbon support consisted of distorted graphite layers, which formed fullerene like
microstructures (
Figure 3.1). The diameters of the carbon spheres formed in this case were approximately
50 Å. In some places multilayer piles (2-5 layers) characteristic of graphite with the interlayer
distance of approximately 3.5 Å were observed. The particles of the Pt in monometallic Pt/C
catalyst were evenly distributed on the surface (Figure 3.2a) with a diameter in the range of ∼15
to ∼40 Å (Figure 3.2b). The average particle size of the metal particles, dm and surface weighed
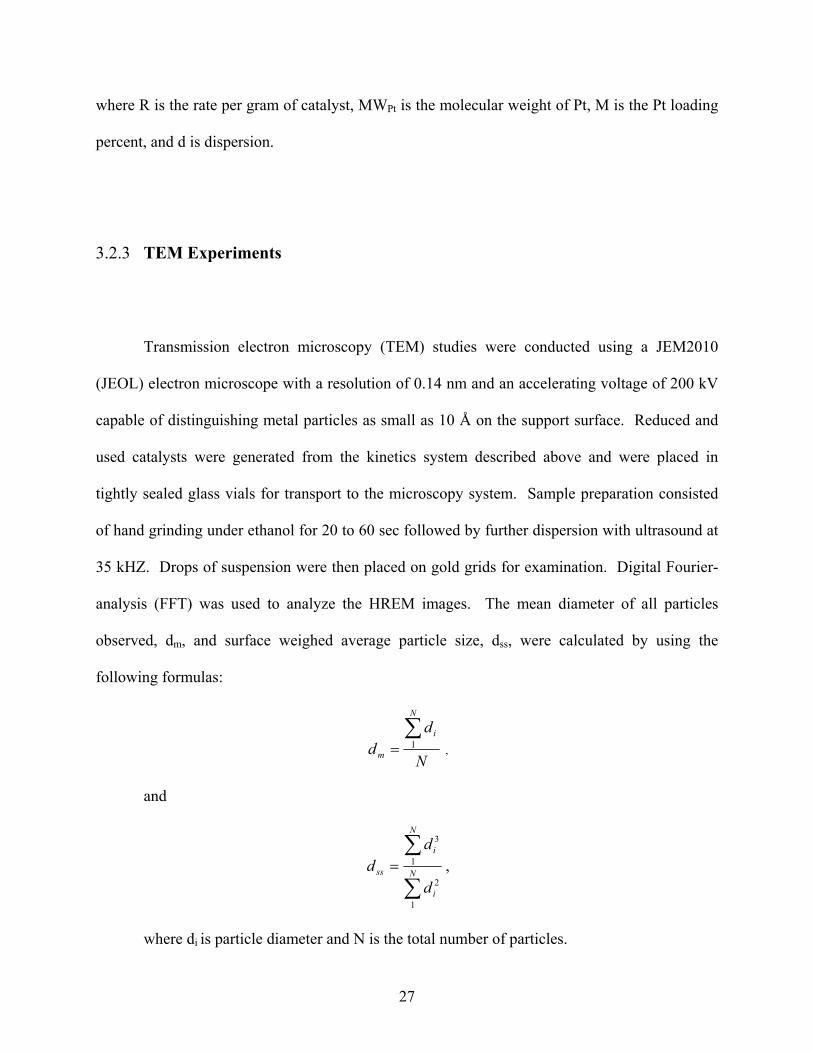
average particle size dss were 25 and 30 Å, respectively. The TEM micrographs of PtCu/C
catalysts after reduction showed the existence of metal particles in the range of 13-30 Å in size
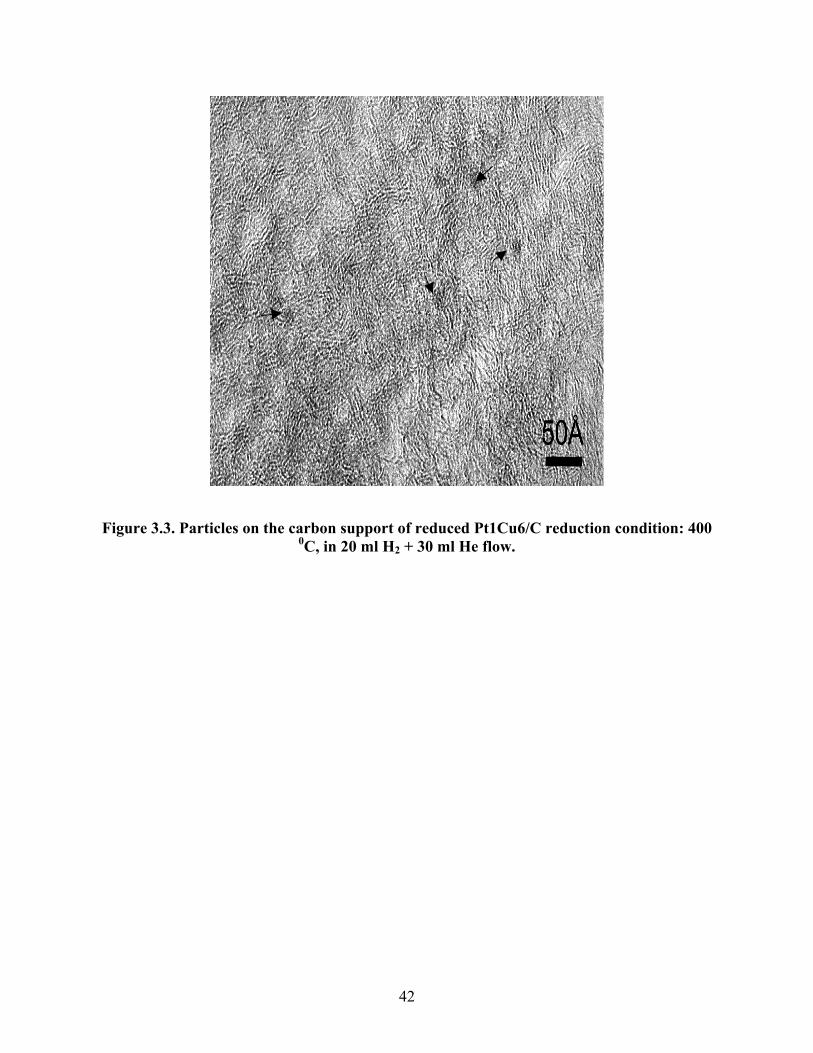
and also quasi-spherical particles (Figure 3.3 and Figure 3.4). Phase of copper oxide was
identified in the quasi-spherical particles by electron microdifraction and HREM images. The
CuO is most likely the result of exposing the reduced catalyst in air before the TEM studies. As
the Cu content in the Pt-Cu catalyst was increased, the size of the copper oxide particles also

30
increased. For example, the size range was 200-500 Å for Pt1Cu9 while for Pt1Cu18 the size
was as large as 5000 Å. However, the morphology of the CuO particles was the same for all the
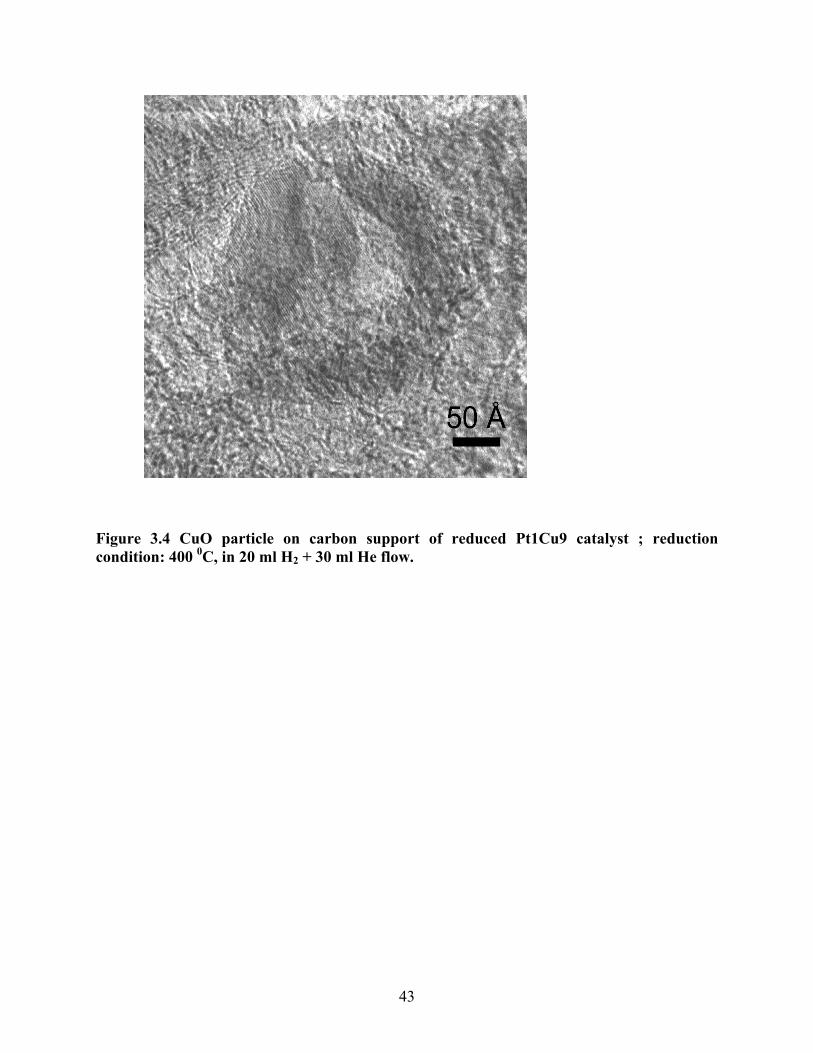
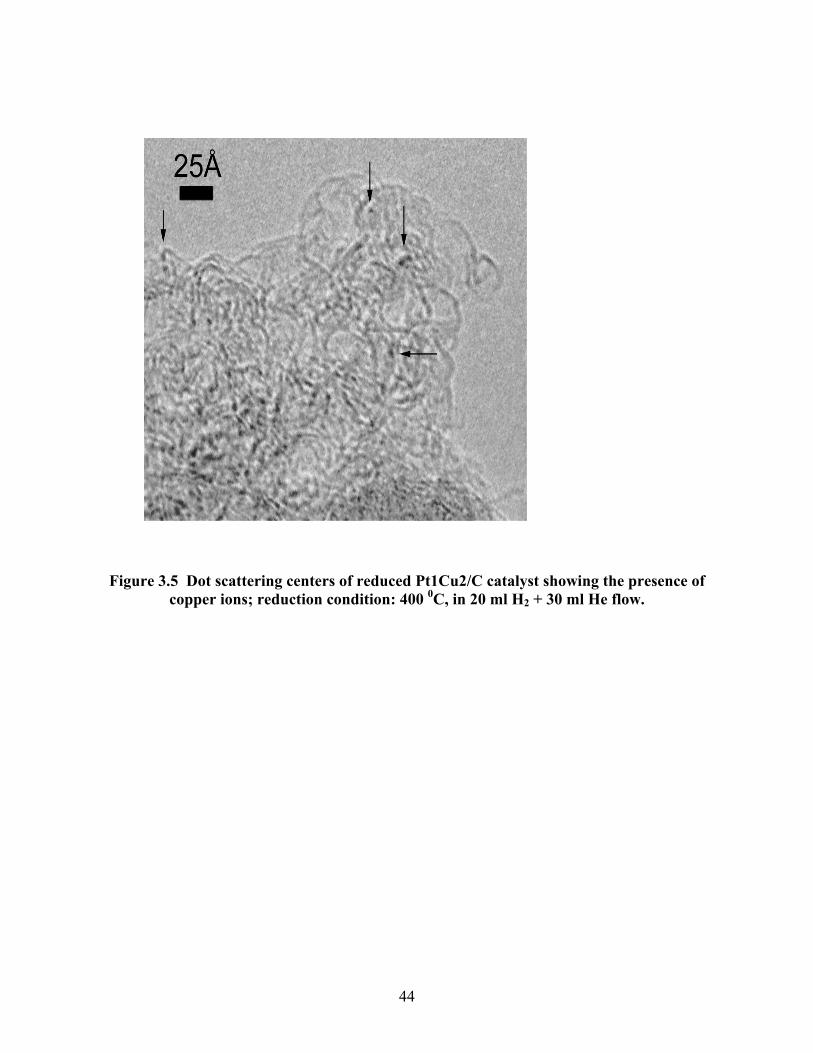
Pt-Cu bimetallic samples. Dot scattering centers were observed for the reduced bimetallic
catalysts (Figure 3.5). Tentatively these were attributed to the presence of isolated or aggregated
copper ions on the carbon support.
3.3.2 Kinetics
All PtCu bimetallic catalysts supported on activated carbon BPLF-3 hydrodechlorinated
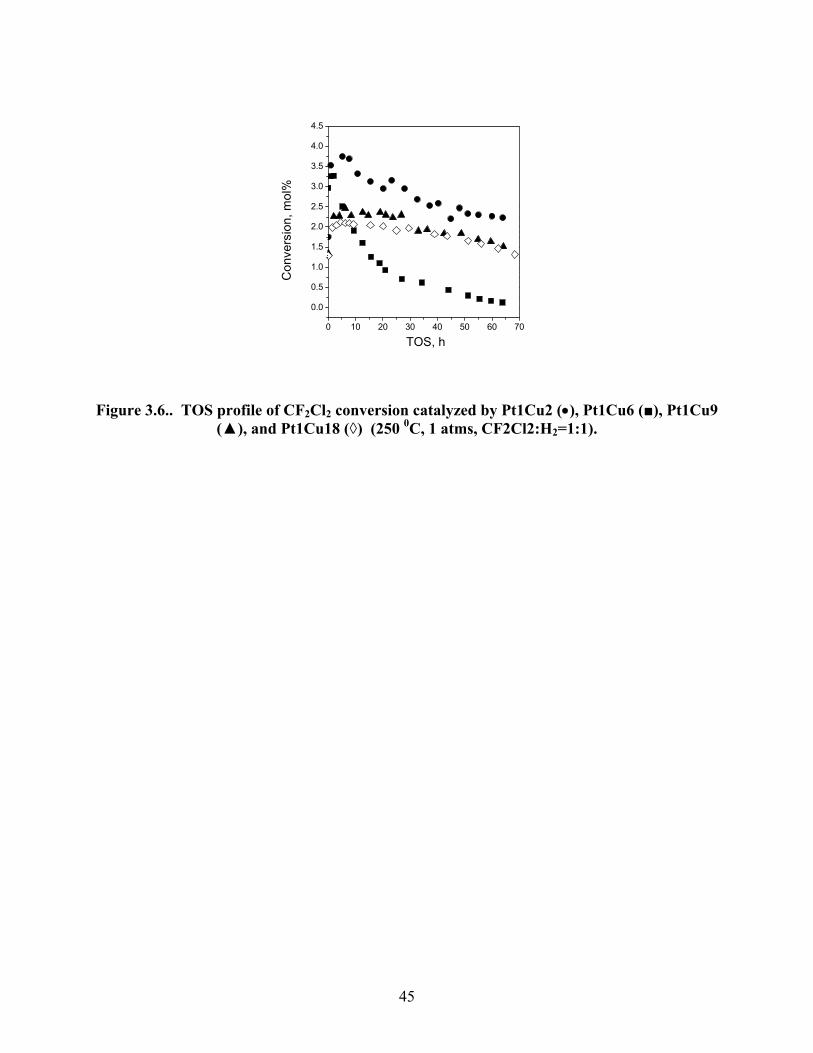
CF2Cl2. For all catalysts, the conversion with time on stream (TOS) initially increased to
maximum after ∼5 h and after that a continuous deactivation of the catalysts was observed
(Figure 3.6). The highest conversion for the catalysts ranged from 3.8-2.2 %. After
approximately 65 h of TOS the activity of Pt1Cu2 decreased by ∼40%, Pt1Cu6 decreased by
∼96%, Pt1Cu9 decreased by ∼38%, and Pt1Cu18 decreased by 34% from their respective highest
activities.
The average selectivity distribution toward C1 and coupling products after 5 min of TOS
was clearly a function of Cu content in the catalysts (Figure7). The total C1 selectivity decreased
from 88% for Pt1Cu2 to 70% for Pt1Cu18. All catalysts produced CH4 as the major C1 product
with a selectivity of ∼70%- ∼55% as well as CHF2Cl with 10-15 % selectivity during the initial 5
min of TOS. Difluoromethane (CH2F2) was observed with <10 % only on Pt1Cu2/C and
Pt1Cu6/C. The total coupling selectivity ranged from 10% for Pt1Cu2 to 35% for Pt1Cu18. The
monometallic Pt /C produced coupling products with <5% selectivity,(10) whereas ∼35% initial

31
selectivity toward hydrocarbon coupling products was observed for the Pt1Cu18 /C catalyst.
Ethylene was the major coupling product on the Pt-Cu bimetallic catalysts during the initial TOS
and the ethylene selectivity increased with increasing Cu content in the catalysts. Ethane was
formed on both the Pt/C(10) and the Pt-Cu/C bimetallic catalysts with ∼3% selectivity. The C3
(C3H6) products were observed only with the Pt1Cu18/C catalyst. No fluorinated-coupling
product was observed for any of the catalysts during the initial 5 min TOS.
The selectivity pattern of the C1 reaction products changed with TOS (Figure 3.8). The
selectivity toward CH4 for all the catalysts continuously declined with TOS. The CH4 selectivity
decreased from 62% to50% for Pt1Cu2, from 50% to 35% for Pt1Cu6, from 70% to 25% for
Pt1Cu9, and from 58% to 25% for Pt1Cu18 after 65 h TOS. Difluoromethane selectivity was
about 5% for Pt1Cu2 for the entire length of the experiment. On Pt1Cu6 the CH2F2 selectivity
was initially 5% and became 0 during 10 h of TOS. The CH2F2 selectivity was 2% for Pt1Cu9
and Pt1Cu18 for all along the TOS. Trifluoromethane (CHF3) was produced only for Pt1Cu6.
The production of CHF3 was detected after 12 h of TOS and the selectivity was 20%; increased
gradually to 35% after 65 h of TOS. The selectivity trend for CHF2Cl varied with type of
catalyst. It decreased from 15%- 8% for Pt1Cu2, 12%- 20% for Pt1Cu6, and ~2% for Pt1Cu9
and from ~2 - ~5% for Pt1Cu18 for the entire TOS.
The selectivity toward coupling products also changed with TOS (Figure 3.9). The C2H4
selectivity remained almost unchanged at ~8% for Pt1Cu2 whereas the selectivity increased from
3 to 15% toward C3H6, and from 1.8 to11.6% for C4+. The C2H4 selectivity increased from 16 to
28% after 10 h of TOS and then decreased gradually to 5%, the C3 selectivity increased from 20
to 25% within first 5 h of TOS and then decreased gradually to 0 after 60 h of TOS, and C4+
selectivity increased from 2 to 6% during 5 h TOS and the gradually decreased to 0 within 30 h

32
of TOS for Pt1Cu6. The production of C2F4 started after 20 h of TOS and the selectivity went to
a maximum of 15% at around 60 h of TOS and then decreased to 10% after approximately 68 h.
The C2H4 selectivity increased from 13 to 29mol %, the C3 selectivity increased from 3 to 25%,
and the C4+ selectivity increased from 1 to 13% during 65 h TOS for Pt1Cu9. The C2H4
selectivity increased from 24 to 30%, the C3 selectivity increased from 5 to 26%, and the C4+
selectivity increased from 1 to 12% during 65 h of TOS for Pt1Cu18. The C2H6 selectivity for
all the catalysts was <5%.
3.4 Discussion
The addition of Cu to Pt has a significant effect on morphology and surface
characteristics of the particles. Considering the large surface area of the carbon support and low
metal loading (<3%), it can be speculated that the metal precursors will be highly dispersed on
the support surface. Due to the specific adsorption on the supporting surface, one or both of the
components might be strongly anchored to the surface, the mixing of the constituent should,
therefore, be achieved either during calcinations or reduction. For the PtCu bimetallic catalyst
alloy formation can be thought of by the ‘catalyzed reduction model’(24) where Pt particles are
formed first because of the easy reducibility, and then mobile Cu2+ ions are adsorbed by these Pt
particles and swiftly reduced. The very high surface mobility of Pt in presence of H2(25)
may also
be helpful for the process. The resulting “cherry” type bimetallic particles consist of a Pt core
and a copper mantle. Obviously one cannot expect that all particles on the surface will be
bimetallic; formation of monometallic Pt and Cu and Cu rich and Pt rich bimetallic particles are

33
more practical from the statistical point of view. Above 227 0C the Pt atoms diffuse into bulk Cu
and disordered Pt-Cu surface alloys are formed.(26) Both the reduction and reaction temperatures
(400 0C and 250 0C respectively) are higher than 227 0C. So, all these conditions support the
possibility of formation of Pt-Cu surface alloy where small Pt islands (may be single atoms) will
be surrounded by large number of Cu atoms as the Pt atoms in the Cu enriched surface are not
clustered.(27) The kinetics results of the present investigation allow one to ask the question of
how do the changes in surface characteristics affect the activity and selectivity of the bimetallic
catalysts.
Although Pt shows very negligible selectivity towards coupling, addition of Cu to Pt
dramatically increases the coupling selectivity.(11) The coupling selectivity increases
monotonically with the increasing Cu content (Figure 3.9) in the catalysts. However, the activity
of the catalysts follows the opposite trend with increasing Cu content (Figure 3.6). Dispersion
results (Table 3.1) show that the number of exposed Pt atoms increased with addition of Cu.
Because of the decreasing activity and lower selectivity toward CH4 and CH2F2, which are the
main products on Pt/C,(11) with increasing Cu content, it is reasonable to suggest that the reaction
is structure sensitive.(28-30) Addition of Cu may decrease Pt ensembles to sizes that are not big
enough for hydrodehalogenation.
Addition of Cu to Pt will not only decrease Pt ensemble size but may also act as an active
site. Though the roles of different active sites of Pt-Cu bimetallic particles are not clear in
hydrodechlorination, it is well known that Pt has much larger activities with respect to
hydrogenation reaction than Cu,(31) which has excellent coupling(32) properties. However Cu
cannot readily dissociate H2 because of the highly activated nature of the process on Cu. This is
the reason why Cu alone is inactive; CuCl formed covers the surface and deactivates it; the CuCl

34
surface cannot adsorb hydrogen but Pt can supply hydrogen atoms for its reduction to Cu. The
Pt particles present in the catalyst are responsible for producing CH4 and other C1 products and H
atoms by dissociation of H2, which is spilled over to the Cu particles. Works examining the
adsorption of H2 on Ru (001) and Re (001) surfaces precovered with submonolayer coverages of
Cu and an ordered Cu3Pt (111) surface consists of 2 x 2 lattice of isolated Pt atoms completely
surrounded by Cu atoms (d Pt – Pt =5.2 A) show a “spillover” of hydrogen atoms, Ha, from the
transition metals to noble metal.(33) The electronic effect of alloying should also be considered
here.
Considering the model of the catalyst surface one can assume the elementary reaction
steps of the reaction. Although there is no clear understanding of the elementary reaction steps
during hydrodechlorination reaction, it is widely accepted that *CF2 is the most reactive surface
species during the reaction.(34) The selectivity would be determined by the associative desorption
of the species helped by hydrogen and the removal of fluorine by adsorbed hydrogen, yielding
*CH2, which on Cu surfaces will couple to from C2H4 or other higher olefins. In the absence of
hydrogen, Hou and Chiang have detected CF2=CD2 when both CF2 and CD2 are present on Cu
(111) surface.(35) The fact that no CF2=CH2 is detected can be related to the very transient nature
of the *CF2.(36) In presence of H, *CF2 is instantly converted to *CH2. That C2F4 has also not
been detected for all catalysts except Pt1Cu6 also supports this conclusion. The case of Pt1Cu6
will be discussed in the later part of the discussion. The TEM images showed that the Cu particle
size grows bigger with increase in Cu content. This is further supported by the chemisorption
results (Table 3.1). The Pt/CO ratios remained relatively unaffected but the O to (Pt+Cu)t ratios
decreased with increase in Cu. On bigger Cu particles, the carbene species formed by the
dissociation of C-halogen bonds of the CFC will have a greater chance of finding another

35
carbene specie to form a coupling product. Also it can be expected that the number of bimetallic
particles will increase with increase in Cu content in the catalyst. This phenomenon can also be
responsible for a higher coupling selectivity with increasing Cu content.
A very significant change in selectivity pattern is observed from its initial state. For
example, for Pt1Cu18 the initial coupling selectivity is ∼35 % whereas it increases to ∼60% with
TOS. This can be explained by speculating that at the very initial stage Pt sites are more active
than Cu sites. It has been shown that the presence of Cl on Rh/SiO2 decreases the hydrogenation
activity of rhodium.(37) Thompson et al. have shown that HCl has an inverse first order effect on
the rate of hydrodechlorination of CFCs on Pd/C catalyst.(38) If the same effect can be
considered for Pt, as the hydrodehalogenation reaction proceeds, the HCl concentration is
increased resulting in a decrease in activity of Pt sites. It is interesting to note the relation
between the deactivation rates with initial C1 selectivity of the catalyst. Catalysts with higher
initial C1 selectivity deactivates at higher rates. Deactivation during hydrodechlorination on Pt/C
catalyst has been related to the formation of chlorine containing carbonaceous deposits on the
metal.(39) As Cu does not form bulk carbide,(32) deactivation of Cu sites by carbonaceous deposits
is possibly unlikely. So with TOS the activity of Pt sites decreases, but for Cu sites it remains
unchanged because of the facile nature of the halogen removal from the surface by hydrogen.
The deactivation process, thus can be related mainly to the loss of Pt active sites and therefore
decrease in C1 selectivity.
The catalytic behavior of Pt1Cu6 demands special attention. It is the only catalyst tested
for this contribution, which produces CHF3 and C2F4 in the CFC hydrodehalogenation reaction.
This catalyst also deactivates more rapidly than other catalysts (Figure 3.6). Coq et al. have
related the formation of C2F4 on PdFe/graphite and PdCo/graphite from the hydrodechlorination

36
of CF2Cl2 to the higher concentration of *CF2 surface intermediates.(12) The relatively higher
selectivity toward CHF2Cl on Pt1Cu6 is an indication toward Cl deposition on the surface.
Wiersma et al. has also attributed higher CHF2Cl concentration on the higher surface Cl
concentration.(40) The formation of CHF3 can be considered as a chlorine/fluorine exchange
reaction for which a reaction with adsorbed fluorine has to take place. So, the formation of
CHF3 is an indication of the influence of fluorine presence on the metal surface. Therefore, all
the above phenomena i.e. higher rate of deactivation, higher selectivity toward CHF2Cl and
CHF3 indicates that the surface halogen removal for Pt1Cu6 is not as facile as the other catalysts.
This can be due to lack of H supply on the Cu surface which prevents further reduction of *CF2
to *CH2 and also the removal of surface halogens. As a result of this, the surface becomes
poisoned quickly. In this regard one interesting point to note in Figure 3.9b is that the increase
of the selectivity toward C2F4 is accompanied by a simultaneous decrease in the selectivity
toward C2 and C3 hydrocarbon. However, it is a matter of future research why this phenomenon
occurs only Pt1Cu6/C catalyst.

37
3.5 Conclusion
The kinetics results of the reaction of CF2Cl2 and H2 catalyzed by PtCu/C catalysts,
showed the effect of Cu content on the selectivity pattern. The observation was that the coupling
selectivity increased with the increasing Cu content. The Pt/C catalyst showed less than 5%
selectivity toward coupling, whereas ∼35% initial selectivity toward hydrocarbon coupling
products was observed for Pt1Cu18 (0.5% Pt +2.8% Cu) catalyst. The selectivity pattern
changed with TOS. All the catalysts showed an increase in coupling selectivity with TOS. This
phenomenon suggests that the modification of the catalytic sites is occurring as the reaction
proceeds. It was speculated that the alloy formation was by the ‘catalyzed reduction model’
where Pt particles were formed first because of the easy reducibility, and then mobile Cu2+ ions
were adsorbed by these Pt particles and swiftly reduced. The resulting “cherry” type bimetallic
particles consisted of a Pt core and a copper mantle. The TEM micrographs of PtCu/C catalysts
after reduction showed the existence of metal particles in the range of 13-30 Å in size and also
quasi-spherical particles. Phase of copper oxide was identified in the quasi-spherical particles by
electron microdifraction and HREM images. The CuO is most likely the result of exposing the
reduced catalyst in air before the TEM studies. As the Cu content in the Pt-Cu catalyst was
increased, the size of the copper oxide particles also increased. For example, the size range was
200-500 Å for Pt1Cu9 while for Pt1Cu18 the size was as large as 5000 Å. However, the
morphology of the CuO particles was the same for all the Pt-Cu bimetallic samples. This implies

38
that the bimetallic particle formation is not complete after reduction and there are scopes to
improve alloy formation by better mixing of the precursors.

39
Table 3.1. Irreversible Gas Uptakes and Apparent Dispersion of PtCu/C Catalysts
Uptake (µmol/gcat) Apparent dispersion (%) Catalyst composition (wt%)
Pt/Cu (at. ratio)
CO H2 O2 H2 (HT)
CO/ Ptt
H/Ptt O/ (Pt+Cu)t
H/Ptt (HT)
Support - 0 0 3.0 0 - - - - 0.49% Pt ∞ 6.8 0.2 9.0 8.5 26.5 1.7 70.5 66.4 0.49%Pt+ 0.32% Cu
1:2 10.9 0.5 23.6 4.7 43.6 3.9 62.6 37.8
0.48%Pt+ 0.95% Cu
1:6 11.0 0.4 23.3 1.9 44.8 3.0 26.8 15.4
0.47%Pt+ 1.40%Cu
1:9 12.1 0.6 26.5 0.9 49.1 5.0 21.7 7.2
0.46%Pt+ 2.8%Cu
1:18 10.7 0.4 28.1 0.7 45.2 3.6 12.1 5.9

40
Figure 3.1 HREM image of the BPLF-3 carbon support

41
a
10 20 30 400
5
10
15
20
25
30
35
40
Particle size, A
Num
ber o
f Par
ticle
s, %
b
Figure 3.2 Pt particles on C support for reduced 0.5 % Pt/C (a); and histogram showing the particle size distribution for reduced 0.5 % Pt/C (b); reduction condition: 400 0C, in 20 ml
H2 + 30 ml He flow.
42
Figure 3.3. Particles on the carbon support of reduced Pt1Cu6/C reduction condition: 400 0C, in 20 ml H2 + 30 ml He flow.
43
Figure 3.4 CuO particle on carbon support of reduced Pt1Cu9 catalyst ; reduction condition: 400 0C, in 20 ml H2 + 30 ml He flow.
44
Figure 3.5 Dot scattering centers of reduced Pt1Cu2/C catalyst showing the presence of copper ions; reduction condition: 400 0C, in 20 ml H2 + 30 ml He flow.
45
0 10 20 30 40 50 60 70
0.0
0.5
1.0
1.5
2.0
2.5
3.0
3.5
4.0
4.5
Con
vers
ion,
mol
%
TOS, h
Figure 3.6.. TOS profile of CF2Cl2 conversion catalyzed by Pt1Cu2 (•), Pt1Cu6 (■), Pt1Cu9 (▲), and Pt1Cu18 (◊) (250 0C, 1 atms, CF2Cl2:H2=1:1).

46
-- Pt1Cu2 Pt1Cu6 Pt1Cu9 Pt1Cu18 --0
10
20
30
40
50
60
70
80
90
100
Sel
ectiv
ity, m
ol%
a
-- Pt1Cu2 Pt1Cu6 Pt1Cu9 Pt1Cu18 --0
10
20
30
40
50
Sel
ectiv
ity, m
ol%
b
Figure 3.7. Average selectivity toward C1 products (a); and coupling products (b)for different Pt-Cu/C catalysts after initial 5min of TOS (Inclined hatched bars: CH4; Cross
hatched bars: CH2F2; empty bars: CH3F; vertically hatched bars: CHF2Cl; perpendicularly hatched bars: C2H4; horizontally hatched bars: C2H6; and filled bars:
C3H6) (250 0C, 1 atms, CF2Cl2:H2=1:1).

47
0 10 20 30 40 50 60 700
10
20
30
40
50
60
70
80
90
100
Sel
ectiv
ity, m
ol%
TOS,h
0
1
2
3
4
5
Con
vers
ion,
mol
%
a
0 10 20 30 40 50 600
10
20
30
40
50
60
70
80
90
100
Sel
ectiv
ity, m
ol%
TOS, h
0
1
2
3
4
Con
vers
ion,
mol
%
b
0 10 20 30 40 50 60 700
10
20
30
40
50
60
70
80
90
100
Sel
ectiv
ity, m
ol%
TOS, h
1
2
3
4
5
Con
vers
ion,
mol
%
c
0 10 20 30 40 50 60 700
10
20
30
40
50
60
70
80
90
100
Sel
ectiv
ity, m
ol%
TOS, h
0
1
2
3
4
5
Con
vers
ion,
mol
%
d
Figure 3.8 Selectivity towards C1 products of Pt1Cu2/C (a); Pt1Cu6/C (b); Pt1Cu9/C (c); and Pt1Cu18/C (d)catalysts; CH4 (•), CH2FCl (▲), CHF2Cl (◊), CH2F2 (ο), CHF3 (▼),
conversion ( ) (250 0C, 1 atms, CF2Cl2:H2=1:1)

48
0 10 20 30 40 500
10
20
30
40
50
60
70
80
90
100
Sel
ectiv
ity, m
ol%
TOS, h
0
1
2
3
4
5
Con
vers
ion,
mol
%
a
0 10 20 30 40 50 600
10
20
30
40
50
60
70
80
90
100
Sel
ectiv
ity, m
ol%
TOS, h
0
1
2
3
4
Con
vers
ion,
mol
%
b
0 10 20 30 40 50 60 700
10
20
30
40
50
60
70
80
90
100
Sel
ectiv
ity, m
ol%
TOS, h
1
2
3
4
5
Con
vers
ion,
mol
%
c
0 10 20 30 40 50 60 700
10
20
30
40
50
60
70
80
90
100S
elec
tivity
, mol
%
TOS, h
0
1
2
3
4
5
Con
vers
ion,
mol
%d
Figure 3.9 (a) Selectivity towards coupling products of Pt1Cu2/C (a); Pt1Cu6/C (b); Pt1Cu9/C (c); and Pt1Cu18/C (d)catalysts; C2H4 (■), C2H6 (ο), C2F4 (◊), C3 (▲), C4+ (∇),
conversion ( ) (250 0C,1 atms, CF2Cl2:H2=1:1).

49
4.0 ROLE OF DIFFERENT ACTIVE SITES AND ALLOYING IN THE
FORMATION OF COUPLING PRODUCTS FOR
HYDRODECHLORINATION OF CF2CL2 ON PTCU/C BIMETALLIC
CATALYSTS
4.1 Introduction
Catalytic hydrodehalogenation is one of the established ways to convert the
environmentally harmful CFCs into benign and industrially useful products. Studies of
hydrodechlorination of CFCs have been mainly focused on the full or partial removal of Cl
atoms from the molecules to obtain alkanes or partially halogenated alkenes.(1-3) However, the
production of higher molecular weight coupling products through the hydrodehalogenation of
CFCs may also be possible.(4-6) It has been shown previously that Pt/C catalyst is not selective
toward coupling but addition of Cu to Pt dramatically improves coupling selectivity.(7) It has
been speculated that Pt sites are responsible for hydrogen dissociation and C1 product formation
whereas Cu sites are responsible for coupling products formation. However, there is no clear
understanding about the roles of different active sites in the reaction.
The purpose of the work is to examine the above speculations about different active sites.
Many studies have suggested the structure sensitivity of hydrodehalogenation reactions on
transition metals.(8-11) If the number of Pt ensemble big enough for hydrodehalogenation were

50
reduced, C1 selectivity will also go down and the selectivity toward coupling would be higher.
Moreover, as H2 dissociation on Pt is not ensemble size dependent,(12) the process will not hinder
the supply of hydrogen to the Cu sites. Two methods have been used to reduce the Pt ensemble
size. One is to selectively poison Pt sites by carbon monoxide (CO). The technique of selective
poisoning of transition metals has been used previously by Ross and Stonehart.(13) The heats of
adsorption of CO at room temperature on Pt and on Cu are 46 kcal/mol and 19 kcal/mol,
respectively.(14) The large difference in the heats of adsorption means that when CO will be
present in the reaction mixture, Pt sites will be preferentially occupied by CO and that will
reduce the Pt ensemble size. The other possible method of Pt ensemble size reduction is
exposing the fresh catalyst to water. The idea behind the technique is that the addition of water
to the fresh catalyst before reduction will facilitate better mixing of the precursors and as a result
the alloy formation will improve during the reduction process. Higher amounts of alloy
formation mean reduction in the size of the Pt ensemble. Kinetics studies were performed using
fresh catalyst, water exposed catalysts and fresh catalyst with CO in the reaction mixture to
check the hypothesis that C1 products are predominantly formed on Pt and coupling products are
formed on Cu sites.

51
4.2 Experimental
4.2.1 Catalyst Preparation and Characterization
Activated carbon (BPL F3, 6x16 mesh, Calgon Carbon) was crushed and sieved to obtain
a fraction of 24-60 mesh (1400 m2/g surface area; 2.4 nm average pore diameter) to use as a
support. The 24-60 mesh fraction was then co-impregnated with an aqueous solution of
H2PtCl6.6H2O (Alfa, 99.9%) and CuCl2.2H2O (MCB Manufacturing Chemists, Inc., 99%). The
material was allowed to equilibrate overnight before drying at ambient temperature and pressure
for 24 h. It was then dried at 100 0C for 2 h in vacuum (~25 Torr). This preparation procedure
resulted in a catalyst consisting of 0.48% Pt and 0.94% Cu (the atomic ratio of Pt to Cu was 1:6)
supported on activated carbon BPLF-3.
Chemisorption and BET measurements were carried out using a volumetric sorption
analyzer ASAP 2010 and ASAP 2010 Chemi (Micromeritics ®). The metal-adsorbate ratio was
determined from the irreversibly adsorbed CO, H2 or O2. The adsorbate – metal stoichiometry
was assumed to be equal to 1 for CO and 2 for both H2 and O2. For each catalyst CO, H2, O2
chemisorption and titration of adsorbed oxygen with H2 (HT) were performed sequentially with
the same sample at 35 0C. Prior to measurement, the catalyst was reduced at 3000C for 1 h in
flowing H2 (Praxair, 99.999%). The reduction was followed by evacuation for 1.5 h at 350 0C.
Then the catalyst was cooled, the CO chemisorption was performed and the catalyst was reduced
at 350 0C for 1 h and evacuated for 1.5 h at the same temperature. Next, H2 chemisorption was
conducted after which the catalyst was again evacuated at 350 0C for 1.5 h. This was followed

52
by O2 chemisorption, evacuation at 350 0C for 1 h and H2 titration. The dispersion results are
shown in Table 4.1.
The catalyst exposed to water was prepared by adding 10 drops of water to 500 mg of
fresh catalyst and shaking vigorously until the water mixed well with the catalyst. The water
treated catalyst was stored airtight for at least a week to equilibrate.
4.2.2 Catalytic Experiments
The hydrodechlorination of CF2Cl2 (Atochem, purity >99%; detectable impurities:
CHF2Cl ~0.25% and CH3CF3 ~0.25%) was conducted at atmospheric pressure in a stainless steel
flow reaction system consisting of a down-flow quartz micro reactor (10 mm i.d.) equipped with
a quartz frit to support the catalyst. An electric furnace was used to heat the reactor zone
containing the catalyst. The catalyst bed temperature was measured and controlled with an
accuracy of ± 1 0C (Omega model CN2011). The gas flows (CFC, H2, Praxair, purity 99.9%;
He, Praxair, purity 99.9%; CO, VWSCO, 4% balance He) were metered with mass flow
controllers (Brooks Instruments, model 5850E) and mixed prior to entering the reactor. The
reactor effluent was analyzed by on-line GC and by GC/MS to identify the reaction products.
The GC (HP 5890 series II) was equipped with a 15 ft 60/80 Carbopack B/5% Fluorocol packed
column (Supelco) and a flame ionization detector (FID) capable of detecting concentrations >1
ppm for all CFCs, chlorocarbons and hydrocarbons under investigation. The on-line HP GC/MS
system consisted of a HP 5890 series II Plus GC equipped with a Fluorocol column connected to
a HP 5972 Mass Selective Detector.

53
Prior to reaction, the catalyst was treated with a mixture of H2 (20 ml/min) and He (30
ml/min) as it was heated from 27 0C to 400 0C at a rate of 5 0C /min and then held at 400 0C for
120 min. The catalyst was cooled in flowing He (30 ml/min) to the reaction temperature, 250 0C,
and the reactant mixture was introduced. The reaction was conducted at a CF2Cl2 to H2 molar
ratio of 1 (2 ml/min of each) with He (26 ml/min) as diluent. The CF2Cl2 to H2 molar ratio used
in this work is the stoichiometric ratio required for the dechlorinative dimerization of CF2Cl2 to
C2F4. In all cases the conversion was kept below 5 % to maintain condition for ideal differential
reactor. All experiments were stopped after the conversion had reached to < 0.2 %.
The selective CO poisoning was done by flowing 4% CO in He at a rate of 2 ml/min with
the reaction mixture. Total flow rate was kept constant at 30 ml/min by reducing the He flow
rate accordingly.
For all the experiments the total flow rate was 30 ml/ and the catalyst weight was ~0.03
g. The selectivities (Si) toward detectable carbon-containing products were calculated as
follows:
∑=
iii
iii Cn
CnS
where ni and Ci are the number of carbon atoms in a molecule and the mole concentration
of the product i in effluent gas respectively. The formation of HCl was detected by GC/MS but
not quantified.
The reaction rates per gram of catalyst was calculated by applying the differential reactor
approximation in the form
Rate (mmol/gsec)= F∗y/W,

54
where F is total molar flow rate, y is the mole fraction of reactant converted, and W is the
catalyst weight. The turnover frequencies (TOF) were calculated using the expression
TOF (s-1)=R∗MWPt / M∗d.
where R is the rate per gram of catalyst, MWPt is the molecular weight of Pt, M is the Pt
loading percent, and d is the dispersion.
4.3 Results
In comparison to the Pt/C catalysts, the selectivity toward the coupling products was
substantially higher for the PtCu/C catalyst,the PtCu/C catalyst that was treated with water, and
the PtCu/C catalyst that was exposed to CO during the reaction. The results shown in Figure 4.1
correspond to the maximum selectivity toward coupling for each catalyst. It is worth mentioning
that the coupling selectivity for changed with TOS. These maxima were obtained at different
time on stream (TOS): 5 h for PtCu/C, 0.03h for PtCu/C when CO is present in the reactants, 34
h for water exposed PtCu/C. The coupling selectivity for Pt/C was < 2% with ethane as only
detectable coupling product and the selectivity remains unchanged with TOS.(15) For the PtCu/C
catalyst the coupling selectivity was ∼58% with a product distribution of 26.7% ethene, 1%
ethane, 25% propene, 5% C4+ and the remaining 42% were C1 products. When CO was present
in the reaction mixture, the maximum selectivity toward coupling products increased ∼69%. The
main coupling products when CO was present in the reaction mixture were ethylene ∼40%,
propene ∼24% and C4+ ∼5%. Water exposure to the fresh catalyst increased the coupling

55
selectivity to ∼85% with a coupling product distribution of ethylene ∼34%, ethane ∼2%, propene
∼32% and C4+ ∼15%.
As mentioned above, the products selectivity for the bimetallic catalyst changed as a
function of TOS (Figure 4.2). With PtCu/C catalyst, the initial selectivity toward CH4 was ∼50%
and decreased to ∼18% after 20 h of TOS before increasing to 28% after 68 h of TOS. The
formation of trifluoromethane (CHF3) was detected only after approximately 10 h of TOS with a
selectivity of ∼20%. The selectivity toward CHF3 increased from ∼20% to ∼38% between 10h
and 68 h of TOS. Difluoromethane (CH2F2) was detected during the initial 10 h of TOS with a
maximum selectivity of 5% after approximately 5 h of TOS and decreased thereafter to a
negligible amount. The selectivity toward the other C1 product, CHF2Cl was initially ∼15%.
After 50 h of TOS the selectivity increased to ∼18% and then a continuous decrease was
observed to reach a selectivity of ∼ 10 % after 68 h of TOS. The selectivity distribution for the
coupling products formed on the PtCu/C catalyst is shown in Figure 4.2b. The selectivity toward
C2H4 was ∼20% initially, went to a maximum of ∼27% after approximately 5 h of TOS before
decreasing to ∼8 % after 68 h of TOS. The selectivity toward C3H6 initially was ∼20%, reached
a maximum of 25% after approximately 5 h of TOS before decreasing to zero after 60 h of TOS.
The maximum selectivity toward C4+ products was ∼5% after 5 h of TOS. No C4+ was detected
after 20 h of TOS. Tetrafluoroethylene (C2F4) was detected only after 20 h of TOS and reached
a maximum selectivity of ∼15% after 60 h of TOS before decreasing to ∼10% after 68 h of TOS.
Whereas the PtCu/C catalyst maintained a conversion >0.2% for approximately 10 h of
TOS, the conversion decreased to less than 0.2% in 20 h when CO was present in the reaction
mixture. Two C1 products were formed from the reactants when CO was added to the stream:
CHF3 and CHF2Cl (Figure 4.3a). The selectivity toward CHF2Cl initially was ∼25 % and

56
increased monotonically with TOS to ∼30% after 20 h. Trifluoromethane was detected after
approximately 3 h of TOS with a selectivity of
∼18 %. The CHF3 selectivity increased gradually during 3-10 h of TOS to ∼50% and remained
constant thereafter. The selectivity toward coupling products formed when CO was present in
the reactant stream is shown in Figure 4.3b. The selectivity toward C2H4 was ∼40%initially and
decreased monotonically to ∼5% after 20 h of TOS. The propylene selectivity, which was ∼25%
initially, decreased to zero after approximately 12 h of TOS. The selectivity toward
tetrafluoroethylene increased continuously with TOS from 0 to ∼20% after 20 h of TOS.
The selectivity distribution for the water-exposed catalyst showed was not a strong
function of TOS and the conversion did not decrease below 0.2% for more than 70 h. The C1
products of significant selectivity were CHF2Cl and CHF3. The selectivity toward CHF2Cl
initially was ∼25% and decreased to ∼11% after 65 h of TOS. The CHF3 selectivity increased
from 0 to ~8.5% after 65 h of TOS (Figure 4.4a). The main coupling products for water-exposed
catalyst were ethylene and propylene. The ethylene selectivity was ∼49% initially before
decreasing to ∼40% within approximately 3 h and remaining constant thereafter. The selectivity
toward propylene was ∼18% initially, increased to ∼32% after 10 h of TOS and remained
essentially constant thereafter. The initial selectivity toward C4+ was ∼0%, reached to a
maximum ∼16 % after approximately 25 h of TOS before decreasing to ∼12% after 65 h of TOS.
The selectivity toward C2H6 was ∼5 % initially and decreased to a negligible value after ∼25 h of
TOS. C2F4 was also detected but the selectivity was less than 2% for the entire reaction period.
Catalyst exposure to water changed the activity and deactivation rate significantly in
comparison to the catalyst not exposed to water (Figure 4.5). The initial conversion of the fresh
catalyst and the water-exposed catalyst were ∼3 and ∼0.6 mol%, respectively. However the fresh

57
catalyst deactivated very rapidly within first 30 h of TOS. After approximately 15 h of TOS the
activity for fresh catalyst became less than that of the water-exposed catalyst. There was almost
no further deactivation for both the catalysts after approximately 30 h of TOS.
4.4 Discussion
The result of CO poisoning experiment showed higher coupling selectivity at the very
beginning of the reaction but gradually dropped down with TOS. The catalyst also lost its
activity with a very short period (~20 h compared to ~70 h for catalyst without poisoning). The
most interesting result is the selectivity increase of fluorinated C1 halocarbons (CHF3 and
CHF2Cl) and coupling products (CF2=CF2). There can be two reasons behind these phenomena.
Carbon monoxide blocks Pt sites as well as more active Cu or bimetallic sites. In CF2Cl2 the
difference between gas phase bond energy (318 and 460 kJ/mol for C-Cl and C-F bonds,
respectively) suggest that sites with higher heats of adsorption will be required to break C-F
bond. As a result of the blockage of theses high energy sites by CO the C-F bond might not be
broken, which gives rise to more surface :CF2 species. The other factor is the competition
between CO and H2 for adsorption sites. On Pt(111) the heat of adsorption for CO ranges
between 140 kJ/mol for low coverage to 40 kJ/mol for saturation coverage.(16) For hydrogen the
heat of adsorption on the same surface remains constant around 40 kJ/mol.(16) Therefore a
competition for adsorption sites between these two molecules is logical. Whatever is happening,
CO will mainly affect the performance of Pt or bimetallic sites and the Cu sites will probably

58
remain intact. Therefore, it can tentatively be concluded that hydrogenolysis or rapture of C-F
requires mainly Pt or bimetallic Pt-Cu sites.
Exposing the calcined catalyst to water showed a very significant improvement in both
stability and coupling selectivity of the catalyst. This can be due to improved alloy formation.
Considering the large surface area of the carbon support and low metal loading (<1.5%), it can
be speculated that the metal precursors will be highly dispersed on the support surface. Due to
the specific adsorption on the supporting surface, one or both of the components might be
strongly anchored to the surface, the mixing of the constituent should, therefore, be achieved
either during calcinations or reduction. For the PtCu bimetallic catalyst alloy formation can be
thought of by the ‘catalyzed reduction model’(17) where Pt particles are formed first because of
the easy reducibility, and then mobile Cu2+ ions are adsorbed by these Pt particles and swiftly
reduced. The activation of hydrogen by the noble metal and the migration of the activated
hydrogen to the less reducible element may also be another reason for the reducibility
enhancement. There are abundant reports in the literature about the presence of a noble metal
can enhance the reduction of ions of a less reducible element.(18-25) However, for this process to
occur, the less reducible ions need to be in close proximity of either the ions or the reduced
nuclei of the more noble metals.(26)
Addition of water to the calcined catalyst can improve the mobility of the catalyst
precursors.(26) This can be due to the formation of a mobile Cu aqeuo complex. This induce
mobility enables the [Cu(H2O)6]2+ ions migrate towards the Pt ions and fulfill the proximity
requirements for enhanced reducibility and bimetallic particle formation. Therefore the exposure
of the calcined catalyst to water might improve the proportion of alloying in the bimetallic
catalyst. The kinetics results can now be considered based on the above conclusion.

59
The main speculation of improved coupling selectivity on Pt-Cu/C bimetallic catalyst is
the dual site mechanism: the Pt sites will be used as source of activated hydrogen and
hydrodehalogenation and coupling will take place on Cu sites.(27-28) For this to happen, the ideal
surface would be like minimum number of Pt atoms required for dissociating hydrogen
surrounded by Cu atoms. As the degree of alloying increases, the chances of higher proportion
of the above mentioned surface increase. This will ensure that there is enough hydrogen to clean
the Cu surface as well as hydrogenate C-F bonds to form surface :CH2 species. The significant
improvement in the stability of the water-exposed catalyst can also be explained by the lowering
of Pt ensemble size (Figure 4.5). Deactivation during the reaction of hydrodechlorination on
Pt/C catalyst has been related to the formation of chlorine containing carbonaceous deposits on
the metal.(29) As Cu does not form bulk carbide,(30) deactivation of Cu sites by carbonaceous
deposits is possibly unlikely. If the Pt ensemble size is small, there will be less probability of
carbonaceous deposit formation because there will not be enough adjacent sites present to form
multiple C-Pt bonds necessary for carbonaceous deposit.
4.5 Conclusion
The role of different active sites and alloying in the reaction of CF2Cl2 and H2 on Pt-Cu/C
were investigated in this chapter. Carbon monoxide was introduced in the reaction mixture. The
maximum coupling selectivity was increased from 55% to 69%. It was suggested that CO
decreases the ensemble sizes of Pt by poisoning the active sites. The catalyst was also exposed
to water for better mixing of the precursors. The water-exposed catalyst showed an overall

60
coupling selectivity of 90% and the performance was very stable. It was suggested that water
exposure of the fresh catalyst increases bimetallic particle formation. As a result the number and
size of monometallic Pt particles decrease. Both the results point towards the fact that Pt or
bimetallic sites may be responsible for C1 product formation and Cu sites are responsible for
coupling products formation.

61
Table 4.1. Irreversible Gas Uptake and Apparent Dispersion
Uptake (µmol/gcat) Apparent dispersion (%) Catalyst composition (wt%)
Pt/Cu (at. ratio)
CO H2 O2 H2 (HT)
CO/ Ptt
H/Ptt O/ (Pt+Cu)t
H/Ptt (HT)
Support - 0 0 3.0 0 - - - - 0.49% Pt ∞ 6.8 0.2 9.0 8.5 26.5 1.7 70.5 66.4 0.48%Pt+ 0.95% Cu
1:6 11.0 0.4 23.3 1.9 44.8 3.0 26.8 15.4

62
Pt/C PtCu/C PtCu(CO)/CPtCu(we)/C0
20
40
60
80
Cou
plin
g S
elec
tivity
, mol
%
Figure 4.1 Maximum selectivity toward coupling products for Pt and PtCu/C catalysts; (we: water exposed catalyst, CO: presence of CO in the reaction mixture) (250 0C, 1 atms,
CF2Cl2: H2 = 1:1).

63
0 10 20 30 40 50 60 700
10
20
30
40
50
60
70
80
90
100 CH4 CH2FCl CH2F2 CHF3 CHF2Cl
Sel
ectiv
ity, m
ol%
TOS, h
0
1
2
3
4
Conversion
Con
vers
ion,
mol
%
a
0 10 20 30 40 50 60 700
10
20
30
40
50
60
70
80
90
100 C2H6 C2H4 C3H6 C2F4 C4
Sel
ectiv
ity, m
ol%
TOS, h
0
1
2
3
4
Conversion
Con
vers
ion,
mol
%
b
Figure 4.2. Selectivity toward C1 products (a); and C2 products of PtCu/C catalysts (b) (250 0C, 1 atms, CF2Cl2: H2 = 1:1).

64
0 5 10 15 200
10
20
30
40
50
60
70
80
90
100
Sele
ctiv
ity, m
ol%
TOS(h)
CH4 CH2FCl CH2F2 CHF3 CHF2Cl
0
1
2
3
4
Con
vers
ion,
mol
%
Conversion
a
0 10 200
10
20
30
40
50
60
70
80
90
100
Sele
ctiv
ity, m
ol%
TOS(h)
C2H6 C2H4 C3H6 C2F4 C4+
0
1
2
3
4
Con
vers
ion,
mol
%
Conversion
b
Figure 4.3 Selectivity toward C1products (a) ; and C2 products (b) of PtCu/C catalysts when CO was present in the reaction mixture (250 0C, 1 atms, CF2Cl2: H2 = 1:1).

65
0 10 20 30 40 50 60 700
10
20
30
40
50
60
70
80
90
100
Sel
ectiv
ity, m
ol%
TOS(h)
CH4 CH2FCl CH2F2 CHF3 CHF2Cl
0
1
2
3
4
Con
vers
ion,
mol
%
Conversion
a
0 10 20 30 40 50 60 700
10
20
30
40
50
60
70
80
90
100
Sel
ectiv
ity, m
ol%
TOS, h
C2H6 C2H4 C3H6 C2F4 C4
0
1
2
3
4
Con
vers
ion,
mol
% Conversion
b
Figure 4.4 Selectivity toward C1 products (a); and C2 products (b) of water-exposed PtCu/C catalysts (2500C, 1 atms, CF2Cl2: H2 = 1:1).

66
0 10 20 30 40 50 60 700
1
2
3
4
5
Water-exposed catalyst
Fresh catalyst
Con
vers
ion,
mol
%TOS, h
Figure 4.5 TOS profile of reaction rates for fresh (▲) and water-exposed (●) catalysts (250 0C, 1 atms, CF2Cl2: H2 = 1:1).

67
5.0 HYDRODEHALOGENATION OF DICHLORODIFLUOROMETHANE
ON PALLADIUM BIMETALLIC CATALYSTS SUPPORTED ON
ACTIVATED CARBON BPL F3
5.1 Introduction
Halocarbons can be interesting intermediate to produce carbon-carbon coupling products
like ethylene and propylene.(1-3) Halocarbons are known environmental pollutants(4) and most of
the investigations to convert those to environmentally benign and useful products by reacting
with hydrogen on a catalyst concentrate on selectively replacing Cl atoms from the molecules by
hydrogen to produce hydrofluorocarbons.(5-8) Coupling products were observed as byproducts of
hydrodechlorination reactions of dichlorodifluoromethane(CF2Cl2) catalyzed by transition metals
such as Pt,(9) Pd, (5,10,11) Ru,(12,13) Os,(13) Ni, Co and Fe.(14,15) A specific investigation devoted to
the coupling of CF2Cl2 catalyzed by activated carbon supported Group VIII noble metals (Pt, Pd,
Ru, Rh, Os, and Ir) at 523 K in the presence of H2 showed that the Pd/C catalyzed the formation
of C2 and C3 hydrocarbons with ~75 mol% selectivity and C2H4 (~40 mol%) as the major
coupling product. The Ru, Rh, Os, and Ir/C catalyzed the formation of fluorinated coupling
products (CF2CF2 and CF2CH2), but the selectivity toward these compounds was less than 5
mol% in each case.(16) So, the main challenge to form coupling products from halocarbons is to

68
lower the energy barrier for the coupling pathways by using a proper catalyst so that the
byproducts become the main products.
Though it has long been known that alloying significantly changes the catalytic
properties,(17-19) it is still a matter of debate whether this change is due to ensemble
effects,(20,21)structure effects,(21) or electronic effects.(23) Using alloy catalysts creates the
opportunity to tune the catalyst properties to achieve the desired results. Carbon supported Pt
showed less than 5 mol % selectivity toward coupling products formation in the reaction of
CF2Cl2 and H2 but when Cu or Co was added to Pt, the coupling selectivity increased 10
times.(24) Tetrafluoroethylene was observed with PdFe/graphite and PdCo/graphite catalysts
during the CF2Cl2 +H2 reaction at high CFC to H2 ratios, whereas Pd/graphite catalyst did not
show any selectivity toward coupling products.(25) Even though carbon supported monometallic
Ni catalyst exhibited 33 mol% selectivity toward C2 compounds in the same reaction, modifying
the Ni/C with Al and Cu increased the coupling selectivity to 43 and 46 mol%, respectively.(26)
One of the purposes of using alloy catalysts is to extract the intrinsic properties of
individual metals to improve the selectivity toward the desired reaction path. The group IB
metals (Cu, Ag) and the group VIII metals (Fe, Co) are the potential candidates for the coupling
of the surface carbene and fluorocarbene species formed in the reaction of CF2Cl2 and H2.
Copper and Ag can break C-X bonds.(27-29) Also, these group IB metals favor desorption of
hydrocarbons species from the catalyst surface, rather than further degradation, increasing the
probability of coupling of those fragments to produce higher molecular weight compounds.(28,29)
However, the group IB metals do not dissociate H2 readily(30) and one cannot expect that they
will show high activity in CF2Cl2 + H2 reaction. Iron and Co are Fischer-Tropsch catalysts that
produce higher molecular weight hydrocarbons from CO and H2.(31) Even though both Fe and

69
Co can dissociate H2, partial coverage of the surface with halogen atoms may significantly
suppress H2 activation. Therefore, another metal such as Pt or Pd that can dissociate H2 readily
is necessary to keep the group IB and group VIII metals active in the atmosphere containing HCl
and HF.
The objective of the present investigation is to test the hypothesis that alloying IB metals
like Cu and Ag, and VIII metals like Co and Fe, all of which have C-C coupling ability but
inactive in the severe environment of hydrodehalogenation, can be alloyed with Pd to convert
them to active catalysts for the reaction of CF2Cl2 + H2 to produce
C-C coupling products. The main hypothesis is that Pd would serve as a source of dissociated
H2, which will migrate to the second metal sites by spill over to clean the metal of adsorbed Cl
and F. The hydrodehalogenation activity of Pd will be suppressed by the dilution effect of the
second metal because of the structure sensitivity of the reaction.(32-34)

70
5.2 Experimental
5.2.1 Catalyst Preparation
Activated carbon (BPL F3, 6x16 mesh, Calgon Carbon) was crushed and sieved. A
fraction of 24-60 mesh (1400 m2⋅g-1 surface area; 24 Å average pore diameter) was used as a
support. The support was co-impregnated with an aqueous solution of PdCl2 (Aldrich Chemical
Co., 99.9%, metals basis) and one of the following metal chloride solutions: CuCl2·2H2O (MCB
Manufacturing Chemists, Inc., 99%), CoCl2.6H2O (Fisher Scientific, 100%) and FeCl3
.6H2O
(Avocado Research Chemicals Ltd., 99%). In each case the mixture was allowed to equilibrate
overnight and was dried at ambient temperature and pressure for 24 h and then at 373 K for 2 h
in vacuum (∼25 Torr). The weights of metal chlorides were selected such that the molar ratio of
Pd to the second metal was 1:6. The Pd-Ag/C catalyst was prepared by sequential impregnation
of the support. The aqueous solution of AgNO3 (Alfa AESAR, 99.9995%, metals basis) was
used first to impregnate Ag on the support followed by the drying step and a second
impregnation step with PdCl2 solution. The catalyst compositions are listed in Table 5.1.
The catalysts were exposed to water by adding 10 drops of water to 500 mg of fresh
catalyst and shaking vigorously until the water mixed well with the catalyst. The water treated
catalyst was stored airtight for at least a week to equilibrate.
Chemisorption measurements were conducted with a volumetric sorption analyzer
(Micromeritics ASAP 2010 Chemi). The metal-adsorbate ratio was determined from the
irreversibly adsorbed CO, H2 or O2. The adsorption stoichiometry was assumed to be 1 for CO

71
and 2 for both H2 and O2.(24) For each catalyst CO, H2, and O2 chemisorption as well as titration
of adsorbed oxygen with H2 (HT) were performed on the same sample at 308 K and pressures of
100-800 Torr. Prior to making these measurements the catalyst was reduced in flowing H2 at
573 K for 2 h and at 673 K for 1 h. This was followed by evacuation for 1.5 h at 673 K. The
catalyst was then cooled and CO chemisorption was performed before the catalyst was reduced
at 673 K for 1 h and evacuated for 1.5 h at the same temperature. Then the H2 was chemisorbed
and the catalyst was again evacuated at 673 K for 1.5 h. This was followed by O2 chemisorption,
evacuation at 308 K for 1 h and H2 titration.
5.2.2 Catalytic Experiments
The hydrodechlorination of CF2Cl2 (Atochem, purity >99%; detectable impurities:
CHF2Cl ~0.25% and CH3CF3 ~0.25%) was conducted at atmospheric pressure in a stainless steel
flow reaction system consisting of a down-flow quartz microreactor (10 mm i.d.) equipped with
a quartz frit to support the catalyst. An electric furnace heated the reactor zone containing the
catalyst. The catalyst bed temperature was measured and controlled with an accuracy of ± 1 K
(Omega model CN2011). The gas flows (CFC, H2, Praxair, purity 99.9% and He, Praxair, purity
99.9%) were metered with mass flow controllers (Brooks Instruments, model 5850E) and mixed
prior to entering the reactor. The reactor effluent was analyzed by on-line GC and by GC/MS to
identify the reaction products. The GC (HP 5890 series II) was equipped with a 15 ft 60/80
Carbopack B/5% Fluorocol packed column (Supelco) and a flame ionization detector (FID)
capable of detecting concentrations >1 ppm for all CFCs, chlorocarbons and hydrocarbons under

72
investigation. The on-line HP GC/MS system consisted of a HP 5890 series II Plus GC equipped
with a Fluorocol column connected to a HP 5972 Mass Selective Detector.
Prior to reaction, the catalyst was treated with a mixture of H2 (20 ml/min) and He (30
ml/min) as it was heated from 300 K to 673 K at the rate of 5 K/min and then held at 673 K for
120 min. The catalyst was cooled in flowing He (30 ml/min) to the reaction temperature, 523 K,
and the reactant mixture was introduced.
The reaction was conducted at a CF2Cl2 to H2 ratio of 1 (2 ml/min of each), the
stoichiometric ratio required for the dechlorinative dimerization of CF2Cl2 to C2F4. During all
the experiments the total flow rate used was 30 ml/min (balance He) and the catalyst weight was
~0.1 g. The selectivities (Si) toward detectable carbon-containing products were calculated as
follows:
∑=
iii
iii Cn
CnS
where ni and Ci are the number of carbon atoms in a molecule and the mole concentration of the
product i in effluent gas respectively. The formation of HCl was detected by GC/MS but not
quantified.

73
5.3 Results
5.3.1 Dispersion Measurements
The results of chemisorption measurements on carbon supported monometallic Pd, and
bimetallic catalysts, as well as on the pure support are listed in Table 5.1. As all chemisorption
measurements have some drawbacks, four types of experiments were done so that a comparison
could be made. The uptake of hydrogen was negligible for all catalysts. Palladium and the other
metals chemisorb O2; however, the stoichiometry of O2 chemisorption on transition metals is
sufficiently dubious that the oxygen uptake results could not be used as an independent measure
of dispersion. In addition, Pd can catalyze the oxidation of the carbon support during O2
chemisorption measurements increasing irreversible oxygen uptake. While CO chemisorption
on Pd is well defined, metallic Ag does not chemisorb CO, while CO chemisorption is reversible
on Cu.(24) Both Co and Fe chemisorb CO irreversibly, but the adsorption stoichiometry varies in
a wide range depending upon support, metal loading and preparation. Hence, the titration of pre-
adsorbed oxygen with gaseous H2 (HT) according to the stoichiometry,
PdO + 3/2 H2 → PdH + H2O
was the most accurate method to determine the fraction of Pd atoms exposed in the catalysts used
in the present investigation, and the HT data were used for the turnover frequency (TOF)
calculations. It was shown in separate experiments that none of the Cu, Ag, Fe and Co catalysts
were capable of reducing adsorbed oxygen with H2 at 308 K suggesting that the uptake of H2 in
the HT experiment corresponded only to Pt atoms on the surface of the catalyst.

74
5.3.2 Time on Stream Behavior
The Pd/C as well as the bimetallic catalysts containing Pd with Cu, Ag, Fe or Co
deactivated with time on stream (TOS) during the reaction of CF2Cl2 and H2 at 523 K (Figure
5.1). The maximum conversions were in the range 3.5-20 mol% at early TOS. After 45 h of
TOS Pd, Pd-Cu, Pd-Co, Pd-Fe/C, and Pd-Ag/C lost ~66%, ~50%, ~72%, ~42%, ~93% of their
maximum activity, respectively.
The reaction products were separated in two categories: the coupling or C2+ products and
C1 products with varying degree of dehalogenation. Figure 5.2b shows the selectivity of C2+
products formed on monometallic Pd/C as a function of TOS. The Pd/C catalyst showed ~60
mol% initial selectivity toward hydrocarbon coupling products; the selectivity toward C2H4,
C2H6, C3 and C4+ products was ~15 mol% each. After 120 h of TOS the total selectivity toward
hydrocarbon coupling products was ~80 mol%. The C2H4 selectivity increased from 15 to 38
mol% and the C2H6 selectivity decreased from 15 to 5 mol% during 120 h of TOS. Higher
hydrocarbons C3 (15-20 mol%) and C4+C5 (~15 mol%) were produced at all the TOS. However,
halogenated coupling products were not observed on this catalyst.
Addition of Cu to Pd resulted in formation of C2H4 as the only major coupling product
(Figure 5.3a). The initial selectivity toward hydrocarbon coupling products on the Pd-Cu/C was
~75 mol%; C2H4 (~65 mol%), C2H6 (~5 mol%) and C3 (~10 mol%) were the major coupling
products during initial 1 min of TOS. However, the selectivity of C2H4 decreased from a
maximum of ~75 mol% to ~40 mol% after 70 h of TOS. C2H6 selectivity dropped to zero after
20 h TOS. The selectivity toward C3 dropped from a maximum of 10 mol% after 1h to 5 mol%
after 70 h.

75
Pd-Ag/C showed the highest selectivity toward C2H4 and then toward the halogenated
coupling product C2F4 (Figure 5.3b). The C2H4 selectivity was ~43 mol% at the beginning,
decreased to 18 mol% after 20 h of TOS and after that started increasing to reach 25 mol% after
~48 h of TOS. The selectivity toward C2F4 increased to ~10 mol% after ~48 h of TOS. C3 was
also produced during entire reaction time but the selectivity decreased from ~11 mol% at the
beginning to 5 mol% after ~48 h of TOS.
The Pd-Co/C catalyst showed high selectivity toward hydrocarbon coupling products and
the product distribution was very stable (Figure 5.3c). The initial selectivity towards coupling
product was ~57%; C2H4 (~25 mol%), C2H6 (~22 mol%), and C3 (10 mol%) were the major
coupling products. After 70 h of TOS the total hydrocarbon oligomerization selectivity was 65
mol%; C2H4 (~35 mol%) and C3 hydrocarbons (~25 mol%) were the major products.
The highest selectivity toward oligomerization products was obtained with Pd-Fe/C
bimetallic catalyst (Figure 5.3d). The initial selectivity toward hydrocarbon coupling products
was 64 mol%; C2H4 (~47 mol%), C2H6 (~5 mol%), C3 (~5 mol%), C4+ (~2 mol%), C5 (~5 mol%)
were the major coupling products. After 68 h of TOS, selectivity toward C2H4 increased to 35
mol%, selectivity toward C3 increased to 25 mol%, selectivity toward C2H6 increased to ~15
mol% and selectivity toward C4 increased to ~10 mol%.
Palladium showed overall low selectivity toward C1 products (25 mol%) as compared to
coupling products (75 mol%) (Figure 5.2a). The selectivity toward CH2F2 decreased from 30 to
10 mol% over 120 h of TOS while those of other C1 products remained unchanged during the
course of the reaction. The other C1 products were CHF2Cl (8 mol%), CH4 (5 mol%, CH3F and
CHF3 (2 mol% each).

76
For all the bimetallic catalysts except Pd-Ag/C the major C1 products were CH2F2 and
CHF2Cl. The PdAg/C catalyst produced CHF3 as the major C1 product with a maximum
selectivity of ~45 mol% (Figure 5.4b). The selectivity toward CHF2Cl was ~26 mol% at the
beginning and decreased to ~15 mol% and the selectivity toward CH2F2 increased from zero at
the beginning to ~11 mol% after ~48 h of TOS. For PdCu/C the selectivity toward CH2F2
increased from ~1 mol% to ~40 mol% and that toward CHF2Cl was 25 % after 1 min of TOS and
increased to ~10 mol% after 70 h of TOS (Figure 5.4a). For PdCo/C catalyst the selectivity
toward CH2F2 was 17 mol% at the beginning and decreased to ~12 mol% after 80 h after
reaching a maximum of ~23 mol% after ~1h of TOS (Figure 5.4c). The selectivity toward
CHF2Cl was ~23 mol% at the beginning, decreased to ~16 mol% after ~6h and then increased to
~23 mol% after 80h of TOS. PdFe/C showed the lowest C1 selectivity of all the catalysts after
~5h of TOS; the combined C1 selectivity was ~15 mol% with ~7 mol% for CHF2Cl and ~8
mol% for CH2F2 (Figure 5.4d).

77
5.4 Discussion
Palladium is one of the most favored metals for hydrodehalogenation of CFCs. At a high
H2 to CF2Cl2 ratio CH2F2 was the major product.(35-41) However, the results of the reaction of H2
and CF2Cl2 on Pd/C discussed in the paper showed C-C coupling compounds (~75 mo%) as
major products. It was speculated that electron deficient Pd formed on the acidic support lead to
a weak interaction between :CF2 species and Pd, helping the fluorocarbene species to desorb
after interacting with surface H atoms to produce CH2F2.(42)
However, Pd supported on activated
carbon will not probably become electron deficient because of the inert nature of the support.
Moreover, It was suggested that poorly dispersed Pd particles enhance CH2F2 selectivity by
forming Pd-carbide phase. Smaller particles are less prone to carbiding because of the lower
proportion of plane atoms.(43) The inability to detect the Pd particles using XRD and TEM and
the high surface area of the activated carbon support suggest that the Pd particle size in the
catalyst used in the current investigation is of the order of 1 nm. Small Pd particles (1.5-2 nm)
supported on carbon (Sibunit) produced C-C coupling products (~40%) during the reaction of
CCl4 and H2 at 150-2300 C.(44) Based on the above observations, it can be concluded that the
small Pd particle size might be one of the reasons of higher coupling products selectivity of the
catalyst. Moreover, one must also consider the fact that a higher CCl2F2/H2 ratio (1 vs. 0.35 used
by Coq et al. and 0.35 used by Juszczyk et al.) was used in the experiment. Higher concentration
of CF2Cl2 will probably give rise to a higher surface concentration of carbene species, which in
term will couple instead of desorbing from the surface by reacting with H. Coq et al. have
related the formation of C2F4 on PdFe/graphite and PdCo/graphite from the reaction of H2 and
CF2Cl2 to the higher concentration of *CF2 surface intermediates.(35)

78
Addition of IB metals, Cu or Ag that are inactive for the reaction showed a drastic
decrease in catalyst activity (Figure 5.1) but the bimetallic catalysts were more stable than the
monometallic Pd catalyst. Addition of group VIII metals Fe or Co to Pd also decreased the
activity and made the catalyst more stable but the effect was less pronounced in case of Fe. The
addition of a second metal to Pd has a significant effect on morphology and surface
characteristics of the particles. Considering the large surface area of the carbon support and low
metal loading (<2%), it can be speculated that the metal precursors will be highly dispersed on
the support surface. Due to the specific adsorption on the supporting surface, one or both of the
components might be strongly anchored to the surface, the mixing of the constituent should,
therefore, be achieved either during calcinations or reduction. For the Pd-M bimetallic catalyst
alloy formation can be thought of by the ‘catalyzed reduction model’(45) where Pd particles are
formed first because of the easy reducibility, and then mobile second metal ions are adsorbed by
these Pd particles and swiftly reduced. Obviously one cannot expect that all particles on the
surface will be bimetallic; formation of monometallic Pd and the second metal and the second
metal rich and Pd rich bimetallic particles are more practical from the statistical point of view.
The decrease in activity with the addition of a second metal with Pd can be attributed to the
decrease in the number of active sites in the bimetallic catalysts compared to the monometallic
Pd.
At this point it will be an interesting question to ask whether only the Pd sites are active
or the reaction proceeds through a dual site mechanism, which means both the Pd and the second
metal participate in the reaction. The following situations can be considered: i. the added
second metal is inactive and its only function is to dilute Pd and in the process reduce the number
of active Pd ensemble as well as deactivation by coking. ii. the added second metal is also

79
active in the hydrodehalogenation and coupling reaction along with Pd, which will also act as a
source of dissociated hydrogen, which will migrate, to the second metal surface by “spill over”
and iii. the Pd ensemble size will become so small that its only function will be to supply
dissociated hydrogen to the second metal where all the hydrodehalogenation and coupling
reactions will take place. Copper is known to couple the adsorbed alkylidene species formed
from geminal alkyldichlorides;(46) Ag catalyzes dimerization of alkyl groups obtained by
dissociation of alkyl monohalides.(47-48) Copper and Ag are also known to break C-Cl bonds
readily, however, they cannot dissociate H2 readily.(49) Iron and Co are Fischer-Tropsch catalysts
that produce higher molecular weight hydrocarbons from CO and H2 by coupling hydrocarbon
fragments.(50) Also, alumina-supported Co showed hydrodechlorination activity.(51) Therefore,
to make any conclusion, one must consider the mechanism of surface alloy formation for all the
combinations and their characteristics
Silver and palladium form a continuous series of solid solutions for all bulk
compositions, with no documented ordered phases. The surface energies of Ag and Pd are 1.25
and 2 J/m2, respectively. Considering the significant difference in surface energies, it can be
assumed that there will be a significant surface segregation of Ag in the bimetallic Ag-Pd
particles. A significant Ag enrichment at the surface (~60% for ~30% bulk Ag content) was
reported by Wood and Wise(52) for a commercial alumina-supported Ag/Pd catalyst. Venezia et al.
reported a thin layer of Ag particles on top of Pd observed for pumice–supported Pd-Ag
catalyst.(53) Numerous other reports(54-57)also suggested segregation of Ag to the surface in Pd-
Ag alloy. Looking at the product distribution it can be said that the catalyst property changed
significantly by the addition of Ag to Pd. The catalyst Pd-Ag/C produces significant amount of
CHF3 (Figure 5.4b) and C2F4 (Figure 5.3b), which were absent for Pd/C. The catalyst also

80
became inactive within a short time (~40 h). Considering the above factors, it can be speculated
that in case of Pd-Ag/C catalyst, there is a very significant amount of bimetallic particle
formation and Ag segregates hugely to the surface of the bimetallic particles. The
hydrodehalogenation and coupling reactions are occurring over the Ag sites. For the Pd-Cu
system, a moderate segregation of Cu to the surface was found.(58-60) So, if one considers a simple
model of the surface based on the total Pd-Cu atomic ratio (1:6), there will be less than one Pd
atom present per 6 Cu atoms. Based on the model, it can be suggested that the role of Pd in the
bimetallic particles will be to dissociate and supply atomic hydrogen to Cu sites; the
hydrodehalogenation and coupling activities will occur on Cu sites.
Pd-Co/C showed a very stable catalyst performance though the activity is significantly
lower than that of Pd/C. The other interesting thing is to note that no C4+ products were detected
for Pd-Co/C catalysts. Lower activity can be a result of the site blocking effect of Co. The lack
of C4+ can be due to the decrease in ensemble size of Pd. Probably formation of longer chain
molecules needs bigger ensemble of Pd. Theoretical calculations (61) and experimental results for
alumina-supported Pd-Co(62)suggested surface segregation of Pd. Therefore, it can be speculated
that the Pd is the only active site and Co acts just to dilute Pd. However, some studies also
suggested a change in electronic structure of Pd in the presence of Co.(63-64) The creation of new
sites of Pd-Co in the solid solution can change the adsorption strength of the CF2Cl2 and
hydrocarbons leading to a decrease in activity but to a more stable performance.
The Pd-Fe/C catalyst showed a selectivity pattern that was very similar to Pd/C for all the
products except C4+. At the same time the initial activity was approximately half of that of Pd/C.
But after ~10 h, the activities for both the catalysts became similar. From these behaviors, it can
tentatively be concluded that Fe acts as an inactive Pd site blocking and ensemble size

81
decreasing element. A huge surface segregation of Pd was observed in various studies.(65-66) The
decreasing of the ensemble size might prevent C4+ formation as well as catalyst deactivation.
This may be the reason why the activity of both Pd/C and Pd-Fe/C become similar after ~10 h. It
might be relevant to mention that the catalytic activity of both Pd5Fe95 and Pd1Fe99 for 1,3-
butadiene hydrogenation was found comparable to that of pure Pd surface.(66)

82
5.5 Conclusion
The catalytic behavior of Pd, Pd-Cu, Pd-Ag, Pd-Co and Pd-Fe catalysts supported on
activated carbon BPLF3 during the reaction of CF2Cl2 and H2 (2500C, CFC:H2=1:1) was
investigated to support the hypothesis of involvement of two types of sites for the formation of
coupling products. Monometallic Pd produced 75% hydrocarbon oligomerization products (C2
to C5) and monometallic Cu, Ag, Co and Fe/C were inactive under the reaction condition. The
high selectivity toward hydrocarbons and mainly toward hydrocarbon oligomerization products
can be attributed to Pd ensembles of the order of 1-2 nm supported on inert carbon support.
Based on the kinetics results the following conclusions have been drawn about the bimetallic
catalysts:
For Pd-Ag/C catalyst, there is a very significant amount of bimetallic particle formation
and Ag segregates hugely to the surface of the bimetallic particles. The hydrodehalogenation
and coupling reactions are occurring over the Ag sites.
For Pd-Cu there will be a moderate surface segregation of Cu to the surface and there will
be just enough Pd surface atoms to dissociate hydrogen that migrates to Cu sites for
dehalogenation reaction and coupling.
For Pd-Co/Fe, the function of Co is just to dilute the Pd ensemble. For Pd-Fe, Fe acts as
Pd site blocking and Pd ensemble size reducing element. Two of the bimetallic catalysts (Pd-Cu
and Pd-Co) were very stable though their activities were lower than monometallic Pd.

83
Table 5.1. Irreversible Gas Uptakes and Apparent Dispersions of Pd-M/C Catalysts
Uptakes, µmole/g cat Apparent dispersion, % Catalyst composition, wt. %
CO H2 O2 H2(HT) CO/Pdt H/Pdt O/(Pd+M) t H/Pdt(HT)
Support 0.0 0.0 3.0 0.0 − − − − 0.5Pd 10.9 0.4 35.8 29.7 21.8 1.5 143.9 119.1 0.47Pd+1.7Cu 0.1 0.2 44.5 33.7 0.3 0.8 202 152.6 0.49Pd+2.92Ag 0.2 0.2 51.7 19.3 0.4 0.8 224 83.6 0.49Pd+1.55Co 7.5 0.2 62.8 35 16.2 1.0 40.6 151.9 0.49Pd+1.46Fe 0 0 62.7 24.6 0 0 40.7 106.9

84
0 20 40 60 80 1000
5
10
15
20
Con
vers
ion,
mol
%
TOS, h
Pd PdCo PdCu PdFe PdAg
Figure 5.1 Conversion as a function of TOS for Pd/C and Pd-bimetallic catalysts (CF2Cl2 :H2 =1:1 and 523 K).

85
0 20 40 60 80 100 1200
10
20
30
40
50
60
70
80
90
100
Sele
ctiv
ity, m
ol%
TOS, h
CH4 CH2F2 CHF2Cl CH3F
0
2
4
6
8
10
12
14
16
18
20
Con
vers
ion,
mol
%
Conversion
a
0 20 40 60 80 100 120 1400
10
20
30
40
50
60
70
80
90
100
Sele
ctiv
ity, m
ol%
TOS, h
C2H6 C2H4 C3 C4+ C2F4
0
4
8
12
16
20
Con
vers
ion,
mol
% Conversion
b
Figure 5.2 Selectivity toward C1 products (a); and coupling products (b) at CF2Cl2 : H2=1:1 and 523 K on Pd/C.

86
0 20 40 60 800
10
20
30
40
50
60
70
80
90
100
Sele
ctiv
ity, m
ol%
TOS, h
C2H6 C2H4 C3 C4 C5 C2F4
0
2
4
6
8
10
12
14
Con
vers
ion,
mol
%
Conversion
a
0 10 20 30 40 500
10
20
30
40
50
60
70
80
90
100
Sele
ctiv
ity, m
ol%
TOS, h
C2H6 C2H4 C3H6 C4 C5 C2F4
0
2
4
6
8
10
12
14
Con
vers
ion,
mol
%
Conversion
b
0 10 20 30 40 50 60 70 800
10
20
30
40
50
60
70
80
90
100
Sele
ctiv
ity, m
ol%
TOS, h
C2H6 C2H4 C3H6 C4
0
2
4
6
8
10
12
14
Con
vers
ion,
mol
%
Conversion
c
0 20 40 600
10
20
30
40
50
60
70
80
90
100Se
lect
ivity
, mol
%
TOS, h
C2H6 C2H4 C3 C4 C5
0
2
4
6
8
10
12
14
Con
vers
ion,
mol
%
Conversion
d
Figure 5.3 Selectivity toward coupling products on Pd-Cu/C (a); Pd-Ag/C(b); Pd-Co/C (c); and Pd-Fe/C (d). at CF2Cl2 =1:1 and 523 K
.

87
0 10 20 30 40 50 60 70 800
10
20
30
40
50
60
70
80
90
100
Sele
ctiv
ity, m
ol%
TOS, h
CH4 CH2F2 CHF2Cl
0
2
4
6
8
10
12
14
Con
vers
ion,
mol
% Conversion
0 10 20 30 40 500
10
20
30
40
50
60
70
80
90
100
Sele
ctiv
ity, m
ol%
TOS, h
CH4 CH2F2 CHF2Cl CHF3
0
2
4
6
8
10
12
14
Con
vers
ion,
mol
%
Conversion
0 10 20 30 40 50 60 70 800
10
20
30
40
50
60
70
80
90
100
Sele
ctiv
ity, m
ol%
TOS, h
CH4 CH
2F
2 CHF2Cl
0
2
4
6
8
10
12
14
Conversion
0 10 20 30 40 50 60 700
10
20
30
40
50
60
70
80
90
100
Sele
ctiv
ity, m
ol%
TOS, h
CH4 CH2F2 CHF2Cl
0
2
4
6
8
10
12
14
Con
vers
ion,
mol
% Conversion
Figure 5.4 Selectivity toward C1 products on Pd-Cu/C (a); Pd-Ag/C (b); Pd-Co/C (c); and Pd-Fe/C (d) at CF2Cl2 =1:1 and 523 K

88
6.0 SUMMARY AND FUTURE WORK
It has been showed that CF2Cl2 can be converted to carbon-carbon coupling products by
reacting with H2 on an appropriate catalyst. Activated carbon has been chosen as the support
because of the very corrosive environment of the reaction. The performance of the Pt-Cu/C and
Pd-M/C (M=Cu, Ag, Co, Fe) bimetallic catalysts were tested. The main features of the
investigation presented in the preceding chapters along with some suggestions for the future
investigations are reported here.
6.1 Major Results
The kinetics results of the reaction of CF2Cl2 and H2 catalyzed by PtCu/C catalysts,
presented in Chapter 3, showed the effect of Cu content on the selectivity pattern. The
observation was that the coupling selectivity increased with the increasing Cu content. The Pt/C
catalyst showed less than 5% selectivity toward coupling, whereas
∼35% initial selectivity toward hydrocarbon coupling products was observed for Pt1Cu18 (0.5%
Pt +2.8% Cu) catalyst. The selectivity pattern changed with TOS. All the catalysts showed an
increase in coupling selectivity with TOS. This phenomenon suggests that the modification of
the catalytic sites is occurring as the reaction proceeds. It was speculated that the alloy

89
formation was by the ‘catalyzed reduction model’(1) where Pt particles were formed first because
of the easy reducibility, and then mobile Cu2+ ions were adsorbed by these Pt particles and
swiftly reduced. The resulting “cherry” type bimetallic particles consisted of a Pt core and a
copper mantle. The TEM micrographs of PtCu/C catalysts after reduction showed the existence
of metal particles in the range of 13-30 Å in size and also quasi-spherical particles. Phases of
copper oxide was identified in the quasi-spherical particles by electron microdifraction and
HREM images. The CuO is most likely the result of exposing the reduced catalyst in air before
the TEM studies. As the Cu content in the Pt-Cu catalyst was increased, the size of the copper
oxide particles also increased. For example, the size range was 200-500 Å for Pt1Cu9 while for
Pt1Cu18 the size was as large as 5000 Å. However, the morphology of the CuO particles was
the same for all the Pt-Cu bimetallic samples. This implies that the bimetallic particle formation
is not complete after reduction and there are scopes to improve alloy formation by better mixing
of the precursors.
The observation that increase of Cu wt% increases coupling during the reaction of CF2Cl2
and H2 led to the investigation of the role of Cu sites in the coupling product formation. Chapter
4 discussed the results of introducing CO in the reaction mixture. The maximum coupling
selectivity was increased from 55% to 69%. It was suggested that CO decreases the ensemble
sizes of Pt by poisoning the active sites. The catalyst was also exposed to water for better
mixing of the precursors. The water-exposed catalyst showed an overall coupling selectivity of
90% and the performance was very stable. It has been suggested that water exposure of the fresh
catalyst increases bimetallic particle formation. As a result the number and size of monometallic
Pt particles decrease. Both the results point toward the fact that Pt or bimetallic sites may be

90
responsible for C1 product formation and Cu sites are responsible for coupling products
formation.
The performances of the palladium bimetallic catalysts were discussed in chapter 5. The
interesting question was the effect of a second metal on the selectivity pattern of Pd/C catalyst,
which was already selective toward coupling product formation in the reaction of CF2Cl2 and H2.
The catalytic behavior of Pd, Pd-Cu, Pd-Ag, Pd-Co and Pd-Fe catalysts supported on activated
carbon BPLF3 was investigated to support the hypothesis of involvement of two types of sites
for the formation of coupling products. Monometallic Pd produced 75% hydrocarbon
oligomerization products (C2 to C5) and monometallic Cu, Ag, CO and Fe/C were inactive under
the reaction condition. The high selectivity toward hydrocarbons and mainly toward
hydrocarbon oligomerization products can be attributed to Pd ensembles of the order of 1-2 nm
supported on inert carbon. For Pd-Ag/C catalyst, there might be a very significant amount of
bimetallic particle formation and Ag segregates hugely to the surface of the bimetallic particles.
The hydrodehalogenation and coupling reactions are occurring over the Ag sites. For Pd-Cu
there will be a moderate surface segregation of Cu to the surface and there will be just enough Pd
surface atoms to dissociate hydrogen to Cu sites for dehalogenation and coupling. For Pd-Co/Fe,
the function of Co is just to dilute the Pd ensemble. For Pd-Fe, Fe acts as Pd site blocking and
Pd ensemble size reducing element. Two of the bimetallic catalysts (Pd-Cu and Pd-Co) were
very stable though their activities were lower than monometallic Pd.

91
6.2 Future Work
A lot of works remains to be done to understand the fundamental aspects of coupling
products formation from CFC hydrodehalogenation, the reasons for changing selectivity pattern
and catalyst deactivation with TOS. The following ideas can be pursued in the future:
6.2.1 Studies on PtCu/C Catalyst
Changing selectivity pattern of the bimetallic catalyst with TOS in the reaction of
CF2Cl2+ H2 is still a matter of speculation and needs to be addressed in greater detail.
Speculations for the changing selectivity pattern are re-dispersion of metallic particles, surface
reconstruction and segregation. Surface re-dispersion is a well-established phenomenon in the
presence of HCl.(2-4) SiO2 supported Ni catalyst showed higher Ni particle size after treatment
with HCl or HBr.(2) Increase in metal dispersion was observed for tetrachloroethylene
hydrodechlorination on carbon supported Pd and Pt.(3) CFCs are also claimed to disperse noble
metal catalysts.(5) It is assumed that the mechanism of re-dispersion in the presence of HX
(X=Cl, F) involves the formation, volatilization and re-dispersion of unstable metallic halides.(6)
This surface re-dispersion process can affect bimetallic particle formation during the course of
the reaction and this can be one of the reasons of the changing selectivity of the bimetallic
catalysts with TOS. To test the effect, the reduced catalysts can be treated with HCl, HF and the
mixture of HCl and HF and then can be characterized by using standard characterization
techniques like TEM and XRD. Any difference in particle sizes or bimetallic particle
92
composition between the reduced catalysts and HX (X=Cl, F) pretreated catalyst will suggest
that metal re-dispersion may be one of the reasons for changing catalyst selectivity. Adsorbate
induced reconstructions on certain surfaces are extremely common by breaking and making
substrate- substrate and /or adsorbate-substrate bonds with substantially altered atomic density in
the topmost atomic layer.(7) Extended X-ray absorption fine structure spectroscopy (EXAFS) is
very useful to get information about highly dispersed supported bimetallic catalysts with low
metal loading.(8) Information about the coordination number and the distance between the atoms
can be extracted form EXAFS spectra.(9) In-situ observation of the catalyst state at various TOS
by EXAFS can be very useful for a fundamental insight of changing product selectivity with
TOS. This experiment will give an understanding about surface reconstruction and segregation
as the reaction proceeds.
6.2.2 Studies Using Model Alloy Surfaces
Supports play a big role in the ultimate catalyst performance by changing the geometric
and electronic structures of the particles. The particles of Pt or Rh on C or SiO2 are globular, on
Al2O3 are hemispherical, while on TiO2 thin scaly crystals are observed.(10) The absence of
support eliminates possible metal-support interactions, so that only the intrinsic catalytic
behaviors of the metals are analyzed. To exclude the role of the support, model bimetallic
surfaces can be used. Cu can be deposited on Pt (111) to get the model PtCu bimetallic catalyst
for CFC hydrodechlorination. Following studies will be useful on the model catalyst.
The average ensemble sizes of Pt and Cu can be determined from a series of STM
images(11) after depositing different amounts of Cu on Pt (111). STM images of alloy surfaces

93
can not only provide topographic information concerning the crystallographic structure but also
can show chemical contrast.(12) These model catalysts can be used for CFC
hydrodehalogenation. This experiment will give an understanding of the ensemble size
requirements of the reaction to form coupling products and will help to find optimum ensemble
sizes. In the case of cyclopentane hydrolysis, the highest selectivity toward CH4 was obtained
when the wt% of Re was 80% of the total metal content in Pt-Re/γ AL2O3.(13) The striking
coefficient of CH4 on the Au-Ni (111) was shown to be a function of Au coverage and decreased
with increasing Au coverage.(11) Similarly, an optimum ensemble size of Pt can be necessary to
provide dissociated H2 and an optimum ensemble size of Cu can be required for producing and
coupling carbene radicals from the hydrodehalogenation of CF2Cl2.
Coking can be one of the reasons for the changing selectivity of the catalyst with TOS.
To test this hypothesis, coke can be deposited on the PtCu model catalyst by C2H4 hydrogenation
reaction because C2H4 preferentially adsorbs on Pt to produce coke(14) and coking occurs at
temperatures as low as 300K during C2H4 hydrogenation reaction.(15) Copper and other group IB
metals are known for their inability to degrade hydrocarbon radicals to produce coke
precursors.(16-18) If coking occurs preferentially on Pt sites and the Pt sites get blocked, the
selectivity toward the major product CH4 on Pt would drop and the selectivity toward
hydrocarbon coupling products would increase, as Cu atoms are not blocked by coke deposition.
This experiment will shed light on the fact if coke deposition is one of the reasons for changing
selectivity with TOS.
The speculated reasons for catalyst deactivation are carbonaceous deposits formation and
poisoning of active sites by halogen. Performing temperature-programmed reduction (TPR) of

94
the used model catalyst can be useful to verify the speculation. The following reactions can
occur:
MXn+ n/2 H2 M +n HX (M=metal, X=Cl, F)
C+2 H2 CH4
Analyzing and quantifying the products of TPD will be useful to determine the reasons of
catalyst deactivation during the hydrodehalogenation of CFC.

BIBLIOGRAPHY
96
BIBLIOGRAPHY
Chapter 1
(1) Encyclopedia of Chemical Processing and Design, J.J. Mcketta ed., Marcel Dekker Inc., New york, 1984,Vol.20.
(2) H.H. Saunders and K.C. Frisch, Polyurethanes Chemistry and Technology, Part I: Chemistry, Robert E. Krieger Publishing Co., Malabar,Fla., 1962, pp.32.
(3) Krick-Othmer, Encyclopedia of Chemical Technology, 3 rd ed., Wiley, New York, 1981, Vol.12.
(4) J. Haggin, Chem. Eng. News, 52 (1981) 59.
(5) P. Pitchai and K. Klier, Catal. Rev. –Sci.Eng., 28 (1986),13.
(6) H.D. Gesser, N.R. Hunter, and C.B. prakash, Chem. Rev., 85 (1985), 235.
(7) N.R. Foster, Appl. Catal., 19 (1985) 1.
(8) R.-S. Liu, M. Iwamoto, and J.H. Lunsford, J. Chem. Soc. Chem. Commun., 78 (1982).
(9) M.M. Khan, and G.A. Somorjai, J. catal., 263 (1985) 91.
(10) M. Iwamoto, Japanese Patent (kokai) 629 (1983) 92.
(11) H.H. Storch, N. Golumbic, and R. B. Anderson, The Fischer-Tropsch and Related Synthesis, Wiley, 1951.
(12) Catalysis, P.H. Emmett ed., Reinhold, Vol4, 1956
(13) M.A. Vannice, Catalysis Rev., 14 (1976) 153.
(14) V. Ponec, Catalysis Rev., 18(1978) 151
(15) H. Schulz, Appl. Catal. A 186 (1999) 3.
(16) A.A. Adesina, Appl. Catal. A, 345(1996) 138
(17) G.P. van der Laan and A.A.C.M. Beenackers, Catal. Rev.-Science and Engineering, 41 (1999) 255.

97
(18) J.L.G. Fierro, Catal. Lett. 22 (1993) 67.
(19) R.L. Pruett, Science, 211 (Jan. 2, 1981) 11.
(20) J. H. Lunsford, Catal. Today, 63 (2000) 165.
(21) A. Palermo, J. P. H. Vazquez and R.M. Lambert, Catl. Lett. 68(2000) 191.
(22) S. Pak, P. Qui, and J.H. Lunsford, J. Catal. 179(1998) 222.
(23) P.M. Couwenberg, Q. Chen, and G.B. Marin, Ind. Eng. Chem. Res. 1996 (35) 3999.
(24) A. Palermo, J.P.H. Vazquez, and R.M. Lambert, Catl. Lett., 68 (2000) 191.
(25) G.A. Olah, B. Gupta, M. Farina, J. D. Felberg, W. M. Ip, A. Husain, R. Karpeles, K. Lammertsma, A.K. Melhotra, and N. J. Trivedi, J. Am. Chem. Soc. 107 (1985) 7097.
(26) G.A.Olah, US Patents 4443192, 4465893, 4467130.
(27) G.A. Olah, H. Doggweiler, J.D. Felberg, S. Frahlich, M. J. Grdina, R. Karpeles, T. Keumi, S. Inaba, W.M. Ip, K. Lammertsa, G. Salem, and D.C. Tabor, J. Am. Chem. Soc., 106 (1984), 2143.
(28) H. Stroch, N.G. Golumbic, and R.B. Anderson ,The Fischer-Tropsch and Related
Synthesis, Wiley, 1951
(29) F. Zera, Acc. Chem. Res. 1992 (25) 260 and references therein.
(30) F.Solymosi, K. Revesz, Surf. Sci. 1993 (280) 38.
(31) F.Solymosi, I. Kovacs, Surf. Sci. 1993 (280) 171.
(32) W. Brune, Nature, 379 (1996) 486.
(33) I. Barin, Thermochemical data of pure substances, 3rd Ed. VCH., Weinheim (1995).
(34) P.P. Kulkarni, S.S. Deshmukh, V.I. Kovalchuk, J. L. d’Itri, Catal. Lett. 61 (1999) 161.
(35) P.P. Kulkarni,, V.I. Kovalchuk, J.L. d’Itri, Appl. Catal. B 36 (2002) 299.
(36) B. Coq, S. Hub, F. Figueras and D. Tournigant, Appl. Catal. A 101 (1993) 41.
(37) T. Mori, T. Kikuchi, J. Kubo, and Y. Morikawa, Chem. Lett. 9 (2001) 936.
(38) Y.-C. Hou and C.-M. Chiang, J. Am. Chem. Soc. 1999 (121) 8116.

98
Chapter 3
(1) W. Brune, Nature, 379 (1996) 486.
(2) Alternative Fluorocarbons Environmental Acceptability Study website (www.afeas.org/production_and_sales.html)
(3) Y.H Choi, and W.Y. Lee, J Mol. Catal. A 193 (2001) 174.
(4) S. Ordonez, F.V. Diez, H. Sastre, Appl. Catal. B 113 (2001) 31.
(5) A.L. Ramos, M. Schmal, D.A.G. Aranda, and G. Somarjai, J.Cata1. 423 (2000) 92
(6) E. J.A.X. Van de Sandt, A. Wiersma, M. Makkee, H.V. Bekkum and J.A. Moulijn, Caltal. Today 35 (1997) 163.
(7) L.S. Vadlamannati, V.I. Kovalchul and J.L. d’Itri, Catal. Lett., 58 (1999) 173.
(8) B. Heinriches, P. Delhez, J. Schoebrechts and J. Pirad, J. Catal.172 (1997) 322.
(9) Y.H Choi, and W.Y. Lee, J Mol. Catal. A 193 (2001) 174.
(10) P.P. Kulkarni, S.S. Deshmukh, V.I Kovalchuk, J.L,d’Itri, Catal. Lett. 61 (1999) 161.
(11) P.P. Kulkarni,, V.I. Kovalchuk, J.L. d’Itri, Appl. Catal. B 36 (2002) 299.
(12) B. Coq, S. Hub, F. Figueras and D. Tournigant, Appl. Catal. A 101 (1993) 41.
(13) J.H. Sinfelt, Bimetallic Catalysts: Discoveries, Concepts, and Applications, Wiley, New York, 1983.
(14) V. Ponec, Applied Catal. A 222 (2001) 31.
(15) P.M. Holmblad, J.H. Larsoen, I. Ckorkendorff, L.P. Nielsen, F. Besenbacher, I. Stensgaard, E. Laegsgaard, P. Kratzer, B. Hammer and J.K. Nørskov, Catal. Lett. 40 (1996) 131.
(16) J.H. Sinfelt, Bimetallic Catalysts: Discoveries, Concepts, and Applications, Wiley, New York, 1983.
(17) V. Ponec, Applied Catal. A 222 (2001) 31.
(18) A.M. Schoeb, T.J. Raeker, L. Yang, T.S. King and A.E. DePristo, Surf. Sci. 278 (1992) L125.
(19) J. A. Rodriguez and D.W. Goodman, Science 257 (1992) 897.

99
(20) P.M. Holmblad, J.H. Larsoen, I. Ckorkendorff, L.P. Nielsen, F. Besenbacher, I. Stensgaard, E. Laegsgaard, P. Kratzer, B. Hammer and J.K. Nørskov, Catal. Lett. 40 (1996) 131.
(21) P.P. Kulkarni, V.I. Kovalchuk, J.L. d’Itri, Appl. Catal. B 36 (2002) 299.
(22) J.R. Anderson, Structure of Metallic Catalysts, Academic Press, London, 1975, Chapter 6.
(23) K.O. Early, W.D. Rhodes, V.I. Kovalchuk, J.L. d’Itri, Appl. Catal. 26 (2000) 257.
(24) D.H. Ann, J.S. Lee, M. Nomura, W.M. Sachtler, G. Moretti, S.I. Woo, and R. Ryoo, J. Catal. 133 (1992) 191.
(25) S. Horch, H.T. Lorensen, S. Helveg, E. Laegsgaard, I. Stensgaard, K.W. Jacobsen, J.K. Nørskov and F. Besenbacher, Nature, 398 (1999), 134.
(26) U. Schroder, R. Linke, J.-H. Boo, K. Wandelt , Surf. Sci., 352-354 (1996) 211.
(27) Y.G. Shen, D.J. O’Connor, K. Wandelt, and R.J. MacDonald, Surf. Sci. 331-333 (1995) 746.
(28) B.Coq, G.Ferrat, and F. Figueras, J. Catal. 101 (1986).
(29) B. Coq, G. Ferrat, and R. Figueras, React. Kinet. Catal. Lett. 27 (1985) 157.
(30) P. Fouilloux, G. Cordier and Y. Colleuille, Stud. Surf. Sci. Catal. 11 (1982) 369.
(31) Obuchi, A. Ogata , K. Mizuno, A. Ohi, H. Ohuchi , Collids and Surfaces A 80 (1993) 121.
(32) M. X. Yang, S. Sarkar, and B. E. Bent, Langmuir 13 (1997) 229.
(33) Jose A. Rodriguez,Surf. Sci. Reports 24 (1996) 223.
(34) A .L. Ramos, M. Schmal, D.A.G. Aranda, and G. Somarjai, J.Cata1. 423 (2000) 92
(35) Y. Hou, and C. Ching , J. Am. Chem. Soc. 121 (1999) 8116
(36) S. Deshmukh and J.L. d’Itri, Catal. Today 40 (1998) 377.
(37) J. W. Bozzelli, Y.-M. Chen, and S.S.C. chuang, Chem Eng. Commm., 115 (1992) 1.
(38) C.D. Thompson, R. M. Rioux, N. Chen, and F. H. Ribeiro, J. Phys. Chem. B 104 (2000) 3067
(39) S. Ordonez, F. V. Diez, and H. Sastre, Appl. Catal. B, 31 (2001) 113.

100
(40) Wiersma, E. J.A.X. van de Sandt, M. A. den Hollander, H. van Bekkum, M.Makkee,and J. A. Moulijn, J. Calal. 177 (1998) 29.
Chapter 4
(1) S. Ordonez, F.V. Diez, H. Sastre, Appl. Catal. B 113 (2001) 3.
(2) A.L. Ramos, M. Schmal, D.A.G. Aranda, and G. Somarjai, J.Cata1. 423 (2000) 92.
(3) E. J.A.X. Van de Sandt, A. Wiersma, M. Makkee, H.V. Bekkum and J.A. Moulijn, Caltal. Today 35 (1997) 163.
(4) L.S. Vadlamannati, V.I. Kovalchul and J.L. d’Itri, Catal. Lett., 58 (1999) 173.
(5) B. Heinriches, P. Delhez, J. Schoebrechts and J. Pirad, J. Catal.172 (1997) 322.
(6) Y.H Choi, and W.Y. Lee, J Mol. Catal. A 193 (2001) 174.
(7) P.P. Kulkarni,, V.I. Kovalchuk, J.L. d’Itri, Appl. Catal. B 36 (2002) 299.
(8) B.Coq, G.Ferrat, and F. Figueras, J. Catal. 101 (1986).
(9) B. Coq, G. Ferrat, and R. Figueras, React. Kinet. Catal. Lett. 27 (1985) 157.
(10) P. Fouilloux, G. Cordier and Y. Colleuille, Stud. Surf. Sci. Catal. 11 (1982) 369.
(11) B. Coq, S. Hub, F. Giguéras, and D. Tournigant, Appl. Catal. A 101 (1993) 41.
(12) R. Linke, U. Schneider, H. Busse, C. Becker, U. Schroder, G.R. Castro, K. Wandelt, Surf. Sci. 307 (1994) 407.
(13) P.N. Ross and P. Stonehart, J. Catal. 35 (1974) 391.
(14) G.A. Somorjai, Introduction to Surface Chemistry and Catalysis, Wiley, New York, 1994.
(15) P.P. Kulkarni, V.I. Kovalchuk, J.L. d’Itri, Appl. Catal. B 36 (1999) 299.
(16) N.M. Markovic, P.N. Ross Jr. , Surface Science Reports, 45 (2002) 117.
(17) D.H. Ann, J.S. Lee, M. Nomura, W.M. Sachtler, G. Moretti, S.I. Woo, and R. Ryoo, J. Catal. 133 (1992) 191.
(18) Z. Zhang, W.M.H. Scahtler, and S.L. Suib, Catal. Lett. 2 (1989) 395.
(19) Z. Zhang and W.M.H. Scahtler, J. Chem. Soc, Faraday Trans. 86 (1990) 2312.
(20) J.S. Feeley, and W.M.H. Scahtler, Zeolites 10 (1990) 738.

101
(21) F.B. Noronha, M. Schmal, R. Frety, G. Bergeret, and B. Moraweck, J. Catal. 186 (1999) 20.
(22) H. Idriss, C. Diagne, J.P. Hindermann, A. Kinnemann, and M.A. Barteau, in “Proceedings, 10 th International Congress on Catalysis, Budapest, 1992” (L. Guczi, F. Solymosi, and P. Tetenyi, Eds. ) , part C, p.2119, Elsevier, Budapest, 1992.
(23) M.P. Kapoor, A.L. Lapidus, and Krylova, in “Proceedings, 10 th International Congress on Catalysis, Budapest, 1992” (L. Guczi, F. Solymosi, and P. Tetenyi, Eds. ) , part C, p.2119, Elsevier, Budapest, 1992.
(24) W. Juszczyk, Z. Karpinski, D. Lomot, J. Pielaszek, Z. Paal, and A.Y.Stakheev, J. Catal. 142 (1993) 617.
(25) F.B. Noronha, M. Schmal, C. Nicot, B. Moraweck, and R. Frety, J. Catal. 168 (1997) 42.
(26) Y.-G. Yin, Z. Zhang, and W. M. H. Sachtler, J. Catal. 139 (1993) 444.
(27) P. P. Kulkarni, V. I. Kovalchuk, J.L. d’itri, Appl. Catal. B 36 (2002) 299.
(28) D. Chakraborty, P. P. Kulkarni, V. I. Kovalchuk, J.L. d’itri, manuscript in preparation.
(29) S. Ordonez, F. V. Diez, and H. Sastre, Appl. Catal. B, 31 (2001) 113.
(30) M. X. Yang, S. Sarkar, and B. E. Bent, Langmuir 13 (1997) 229.
Chapter 5
(1) G.A. Olah, B. Gupta, M. Farina, J. D. Felberg, W. M. Ip, A. Husain, R. Karpeles, K. Lammertsma, A.K. Melhotra, and N. J. Trivedi, J. Am. Chem. Soc. 107 (1985) 7097
(2) G.A.Olah, US Patents 4443192, 4465893, 4467130.
(3) G.A. Olah, H. Doggweiler, J.D. Felberg, S. Frahlich, M. J. Grdina, R. Karpeles, T. Keumi, S. Inaba, W.M. Ip, K. Lammertsa, G. Salem, and D.C. Tabor, J. Am. Chem. Soc., 106 (1984), 2143.
(4) W. Brune, Nature, 379 (1996) 486.
(5) E.J.A.X. van de Sandt, A. Wiersma, M. Makkee, H. van Bekkum and J.A. Moulijn, Appl. Catal. A , 155 (1997 ) 57.
(6) B. Coq, J.M. Cognion, F. Figueras, and D. Tornigant, J. Catal., 141 (1993) 21.
(7) K. O. Early, V.I. Kovalchuk, F. Lonyi, S.S. Deshmukh, and J. L. d’Itri, J. Catal., 182 (1999) 219.
102
(8) Z. Ainbinder, L.E. Manzer, and M.J. Nappa, in Environmental Catalysis ( Edited by G. Ertl, H. Knozinger, and J. Weitkamp), Wiley-VCH, New York, 1999, 197.
(9) S.Y. Kim, H.C. Choi, O.B. Yanga, K.H. Lee, J.S. Lee, Y.G. Kim, J. Chem. Soc., Chem. Commun., (1995) 2169.
(10) A. Wiersma, E.J.A.X. van de Sandt, M. Makkee, C.P. Luteijn, H. van Bekkum, and J. A. Moulijn, Catal. Today, 27 (1996 )257.
(11) A. Wiersma, E.J.A.X. van de Sandt, M.A. den Hollander, H. van Bekkum, M. Makkee, and J.A. Moulijn, J. Catal., 177 (1998) 29.
(12) T. Mori, W. Ueda, Y. Morikawa, Catal. Lett. 38 (1996) 73.
(13) A. D. Harley, M.T. Holbrooks, S.R. Bare, and J.L. Womack, 14th Meeting of the North American Catalysis Society, Snowbird, Utah, 1995.
(14) W. A. A. van Barneveld, V. Ponec, J. Catal. 88 (1984) 382.
(15) A. H. Weiss, S. Valinski, G.V. Antoshin, J. Catal., 74 (1982) 136.
(16) P.P. Kulkarni, S.S. Deshmukh, V.I Kovalchuk, and J.L. d’Itri, Catal. Lett. 61 (1999) 161.
(17) J.H. Sinfelt, Bimetallic Catalysts: Discoveries, Concepts, and Applications, Wiley, New York, 1983.
(18) V. Ponec, Applied Catal. A 222 (2001) 31.
(19) P.M. Holmblad, J.H. Larsoen, I. Ckorkendorff, L.P. Nielsen, F. Besenbacher, I. Stensgaard, E. Laegsgaard, P. Kratzer, B. Hammer and J.K. Nørskov, Catal. Lett. 40 (1996) 131.
(20) J.H. Sinfelt, Bimetallic Catalysts: Discoveries, Concepts, and Applications, Wiley, New York, 1983.
(21) V. Ponec, Applied Catal. A 222 (2001) 31.
(22) A.M. Schoeb, T.J. Raeker, L. Yang, T.S. King and A.E. DePristo, Surf. Sci. 278 (1992) L125.
(23) J. A. Rodriguez and D.W. Goodman, Science 257 (1992) 897.
(24) P.P. Kulkarni, V.I. Kovalchuk, J.L. d’Itri, Appl. Catal. B 36 (2002) 299.
(25) B. Coq, S. Hub, F. Figueras and D. Tournigant, Appl. Catal. A 101 (1993) 41.
(26) A. Morato, C. Alonso, F. Medina, P. Salagre, J.E. Sueiras, R. Terrado, A. Giralt, Appl. Catal. B 23 (1999) 175.

103
(27) S.C. Fang and J.H. Sinfelt, J. Catal., 103 (1987) 220.
(28) A. Paul and B.E. Bent, J. Catal., 147 (1994) 264.
(29) M.X. Yang, S. Sarkar, B.E. Bent, S.R. Bare, and M.T. Holbrook, Langmuir, 13 (1997) 229.
(30) J.R. Anderson, Structure of Metallic Catalysts, Academic Press, London, 1975, Chapter 6.
(31) H. Stroch, N.G. Golumbic, and R.B. Anderson, The Fischer-Tropsch and Related Synthesis, Wiley, New York, 1951.
(32) B.Coq, G.Ferrat, and F. Figueras, J. Catal. 101 (1986).
(33) B. Coq, G. Ferrat, and R. Figueras, React. Kinet. Catal. Lett. 27 (1985) 157.
(34) P. Fouilloux, G. Cordier and Y. Colleuille, Stud. Surf. Sci. Catal. 11 (1982) 369.
(35) B. Coq, S. Hub, F. Figueras and D. Tournigant, Appl. Catal. A 101 (1993) 41.
(36) A. Wiersma, E. J. A. X. van de Sandt, M.A. den Hollander, H. van Bekkum, M. Makkee, J. A. Moulijn, J. Catal., 177 (1998) 29.
(37) Karpinski et al., Appl. Catal A. 166 (1998) 311.
(38) K. Early, V. I. Kovalchuk, F. Lonyi, S. Deshmukh, J. L. d'Itri, J. Catal., 182 (1999) 219.
(39) F.J. Urbano, J.M. Marinas, J. Mol. Catal. A 173 (2001) 329
(40) P. N. Rylander, Catalytic Hydrogenation in Organic Synthesis, Academic Press, San Diego, 1979.
(41) Z. Ainbinder, L.E. Manzer,, M.J. Nappa, in : G. Ertl, H. Knozinger, J. Weitkamp (Eds.), handbook of Heterogeneous Catalysis, Vol. 4, Wiley-VCH, Weinheim, 1997, p. 1677.
(42) B. Coq, F. Figueras, S. Hub, D. Tornigant, J. Phys. Chem. 99 (1995) 11159.
(43) Juszczyk, A. Malinowski, and Z. Karpinski, Appl. Catal. A 166 ( 1998) 311.
(44) E.S. Lokteva, V.V. Lunin, E.V. Golubina, V.I. Simagina, M. Egorova, I.V. Stoyanova, Stud. Surf. Sci. Catal., 130 (2000) 1997.
(45) D.H. Ann, J.S. Lee, M. Nomura, W.M. Sachtler, G. Moretti, S.I. Woo, and R. Ryoo, J. Catal. 133 (1992) 191.
(46) Yang, M. X., Sarkar, S., Bent, B. E., Bare, S. R., and Holbrook, M. T., Langmuir, 13 (1997) 229.

104
(47) Zhou X.-L., and White, J. M., J. Phys. Chem., 95 (1991) 5575.
(48) Zhou, X.-L., Schwaner, A. L., and White, J. M., J. Am. Chem. Soc., 115 (1993) 4309.
(49) Fung, S. C., and Sinfelt, J. H., J. Catal., 103 (1987) 220.
(50) Storch, H., Golumbic, N. G., and Anderson, R. B., The Fischer-Tropsch and Related Syntheses, Wiley: New York, 1951.
(51) I.V. Mishalov, V.V. Chesnokov, R.A. Buyanov, and N.A. Pakhomov, Kinetics and Catalysis, 42 (20010 543.
(52) B.J. Wood and H. Wise, Surf. Sci. 52 (1975) 151.
(53) A.M. Venezia, L. F. Liotta, G. Deganello, Z. Schay, and L. Guczi, J. Catal., 182 (19990 449.
(54) E.G. Allison, G.C. Bond, Catal. Rev. 7 (1972) 233.
(55) G.P. Schwartz, Surf. Sci. 76 (1978 ) 113.
(56) F.J. Kuijers and V. Ponec, J. Catal. 60 (1979) 100.
(57) M. Yamamura, K. Kaneda, and T. Imanaka, Catal. Lett. 3 (1998) 203.
(58) F. Reniers, M.P. Delplencke, A. Askali, A. Jardinier-Offergeld, F. Bouillon, Appl. Surf. Sci. 81 (1994) 151.
(59) A.D. van Langeveld, H.A.C.M. Hendrickx, B.E. Nieuwenhuys, Thin Solid Films 109 (1983) 179.
(60) J.A. Anderson and M. Fernandez-Garcia, Trans IChemE, 78 (2000) 935.
(61) P. M. Ossi, Surf. Sci. 201 (1988) L519.
(62) Juszczyk, W., Z. Karpiniski, D. Lomot, J. Pielaszek, Z. Paal,, and A.Y. Stakheev, J. Catal., 60 (1993) 617.
(63) F.B. Noronha, M. Schmal, R. Frety, G. Bergeret, and B. Moraweck, J. Catal. , 186 ( 1999) 20.
(64) A. Sarkany, Z. Zsoldos, B. Furlong, J.W. Hightower, and L. Guczi, J. Catal. 141 (1993) 566.
(65) I. Meunier, J.M. Gay, L. Lapena, B. Aufray, H. Oughaddou, E. Landemark, G. Falkenberg, L. Lottermoser, and R.L. Johnson, Surf. Sci. 42 (1999) 422.
(66) J.C. Bertoline, J.L. Rousset, P. Miegge, J. Massardier, B. Tardy, Y. Samson, B.C. Khanra, and C. Cremers, Surf. Sci. 102 (1993) 281.

105
Chapter 6
(1) D.H. Ann, J.S. Lee, M. Nomura, W.M. Sachtler, G. Moretti, S.I. Woo, and R. Ryoo, J. Catal. 133 1992) 191.
(2) C. Menini, C. Park, E.-J. Shin, G. Tavoularis, and M. A. Keane, Catal. Today 62 (2000) 355.
(3) S. Ordonez, F. V. Diez, H. Sastre, Appl. Catal. B 31 (2001) 113.
(4) C. Menini, C. Park, E.-J. Shin, and M. A. Keane, J. Phys. Chem. B, 104 (2000).
(5) C.S. Kellner, J.J. Lerou, V. Rao, and K.G. Wuttke, Regeneration or activation of noble metal catalysts using fluorohalocarbons or fluorohalohydrocarbons, World Pat. Appl. WO 91/04097 to Du Pont de Nemours and company (1991).
(6) K. Foger, D. Hay, H. Jaeger, J. Catal. 96 (1985) 154.
(7) G. A. Somorjai, M.A. Van Hove, Prog. Surf. Sci. 40 (1998) 201.
(8) L. Guczi, D. Bazin, Z. Schay, and I. Kovacs, Surf. Interface anal. 34 (2002), 72.
(9) G. Berlier, G. Spoto, P. Fisicaro, S. Bordiga, A. Zecchina, E. Giamello, and C. Lamberti, Microchemical Journal 71 (2002) 101.
(10) M. Shpiro, Catalyst Surface: Physical Methods of Studying, Mir Publishers, Moscow, 2000, Chapter 4.
(11) P.M. Holmblad, J. H. Larsen, I. Chorkendorff, L. P. Nielsen, F. Besenbacher, I. Stensgaard, E. Laegsgaard, P. Kartzer, B. Hammer, and J.K. Norskov, Catal. Lett. 40 (1996) 131.
(12) P. Varga and M. Schmid, Appl. Surf. Sci. 141 (1999) 287.
(13) C. L. Pieck, P. Marecot, J.M. Parera, J. Barbier, Appl. Catal. A 126 (1995) 153.
(14) A.D. van Langeveld, F.C.M.J. van Delft and V. Ponc, Surf. Sci., 134 (1983) 665.
(15) M. Masi, M. Sangalli, S. Carra, G. Cao, and M. Morbidelli, Chem. Eng. Sci., 43 (1988) 1849.
(16) A. Paul and B.E. Bent, J. Catal., 147 (1994) 264.
(17) M.X. Yang, S. Sarkar, B.E. Bent, S.R. Bare and M.T. Holbrook, Langmuir, 13 (1997) 229.
(18) C.-M. Ching, T.H. Wentzlaff and B.E. Bent, J. Phys. Chem., 96 (1992) 1836.