catastrophic risk & insurability: can the insurance industry cope? los angeles rims and the...
TRANSCRIPT

Catastrophic Risk & Insurability: Can the Insurance Industry Cope?
Los Angeles RIMS and the Center for Insurance Studies at California State University
Fullerton, CAOctober 15, 2012
Download at www.iii.org/presentations
Robert P. Hartwig, Ph.D., CPCU, President & EconomistInsurance Information Institute 110 William Street New York, NY 10038
Tel: 212.346.5520 Cell: 917.453.1885 [email protected] www.iii.org

Global Catastrophe Loss Developments and Trends
2
Recent Catastrophe Losses Rewrote Insurance History, but Global
(Re)Insurance Markets Proved their Strength and Resilience
2
3
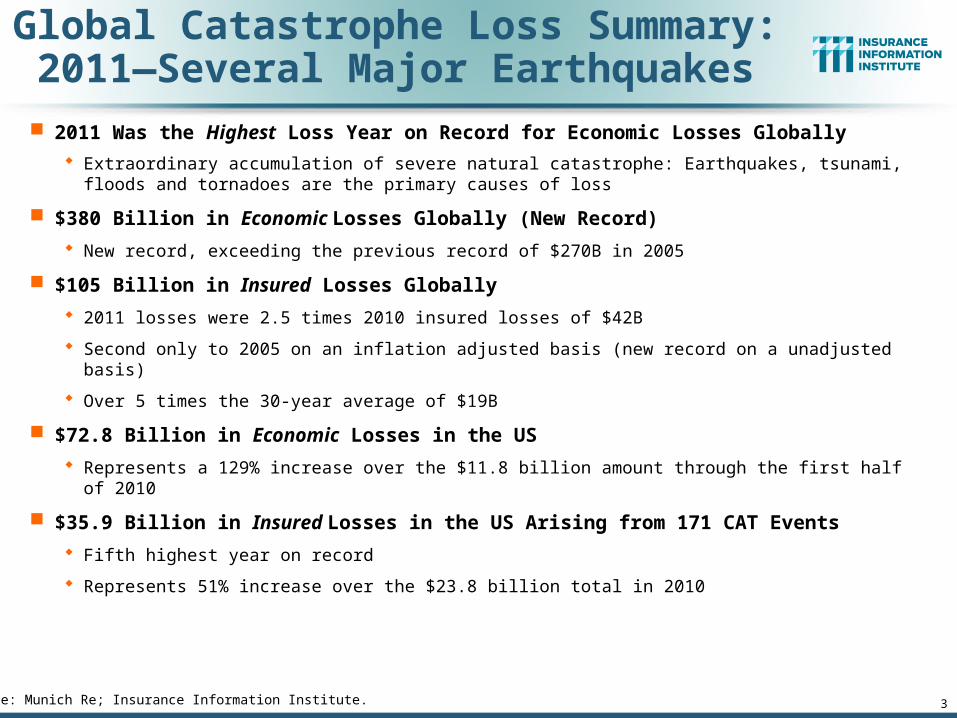
Global Catastrophe Loss Summary: 2011—Several Major Earthquakes
2011 Was the Highest Loss Year on Record for Economic Losses Globally
Extraordinary accumulation of severe natural catastrophe: Earthquakes, tsunami, floods and tornadoes are the primary causes of loss
$380 Billion in Economic Losses Globally (New Record)
New record, exceeding the previous record of $270B in 2005
$105 Billion in Insured Losses Globally
2011 losses were 2.5 times 2010 insured losses of $42B
Second only to 2005 on an inflation adjusted basis (new record on a unadjusted basis)
Over 5 times the 30-year average of $19B
$72.8 Billion in Economic Losses in the US
Represents a 129% increase over the $11.8 billion amount through the first half of 2010
$35.9 Billion in Insured Losses in the US Arising from 171 CAT Events
Fifth highest year on record
Represents 51% increase over the $23.8 billion total in 2010
Source: Munich Re; Insurance Information Institute.
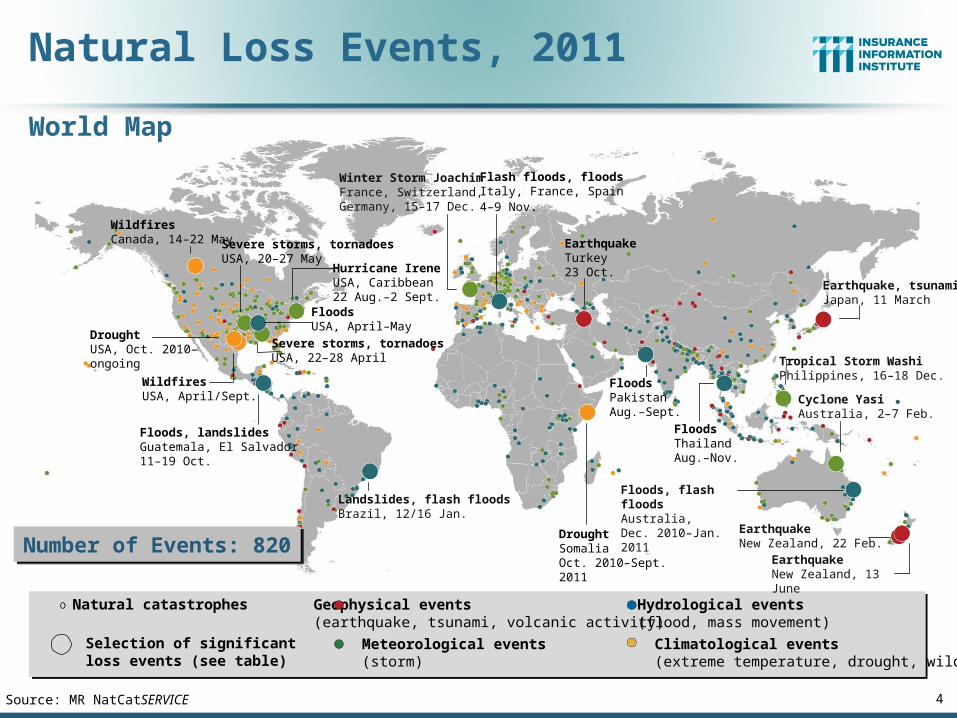
Geophysical events(earthquake, tsunami, volcanic activity)
Meteorological events (storm)
Hydrological events(flood, mass movement)
Selection of significant loss events (see table)
Natural catastrophes
Earthquake, tsunami Japan, 11 March
EarthquakeNew Zealand, 22 Feb.
Cyclone Yasi Australia, 2–7 Feb.
Landslides, flash floodsBrazil, 12/16 Jan.
Floods, flash floods Australia, Dec. 2010–Jan. 2011
Severe storms, tornadoesUSA, 22–28 April
Severe storms, tornadoesUSA, 20–27 May
WildfiresUSA, April/Sept.
EarthquakeNew Zealand, 13 June
FloodsUSA, April–May
Climatological events(extreme temperature, drought, wildfire)
Number of Events: 820Number of Events: 820
DroughtUSA, Oct. 2010– ongoing
Hurricane IreneUSA, Caribbean22 Aug.–2 Sept.
WildfiresCanada, 14–22 May
DroughtSomaliaOct. 2010–Sept. 2011
FloodsPakistanAug.–Sept.
FloodsThailandAug.–Nov.
Earthquake Turkey23 Oct.
Flash floods, floodsItaly, France, Spain4–9 Nov.
Floods, landslidesGuatemala, El Salvador11–19 Oct.
Tropical Storm WashiPhilippines, 16–18 Dec.
Winter Storm JoachimFrance, Switzerland, Germany, 15–17 Dec.
4Source: MR NatCatSERVICE
Natural Loss Events, 2011
World Map

Natural Catastrophes Worldwide, 2011
© 2011 Munich Re 5
Overview and Comparison with Previous Years
Source: MR NatCatSERVICE

5 Costliest Natural Catastrophes Worldwide in Terms of Insured Losses, 2011 ($Mill)
Source: MR NatCatSERVICE © 2011 Munich Re 6
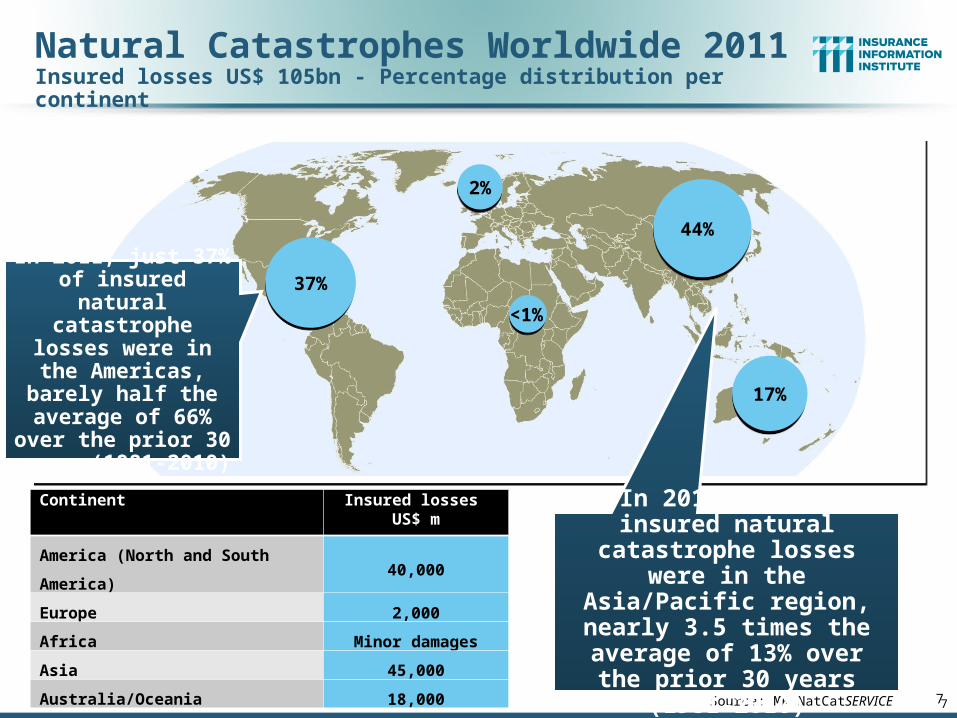
Natural Catastrophes Worldwide 2011Insured losses US$ 105bn - Percentage distribution per continent
Continent Insured losses US$ m
America (North and South
America)40,000
Europe 2,000
Africa Minor damages
Asia 45,000
Australia/Oceania 18,000
37%
2%
44%
17%
<1%
7Source: MR NatCatSERVICE
In 2011, 61% of insured natural catastrophe losses
were in the Asia/Pacific region, nearly 3.5 times the
average of 13% over the prior 30 years (1981-2010)
In 2011, just 37% of insured natural
catastrophe losses were in the
Americas, barely half the average of 66%
over the prior 30 years (1981-2010)
7
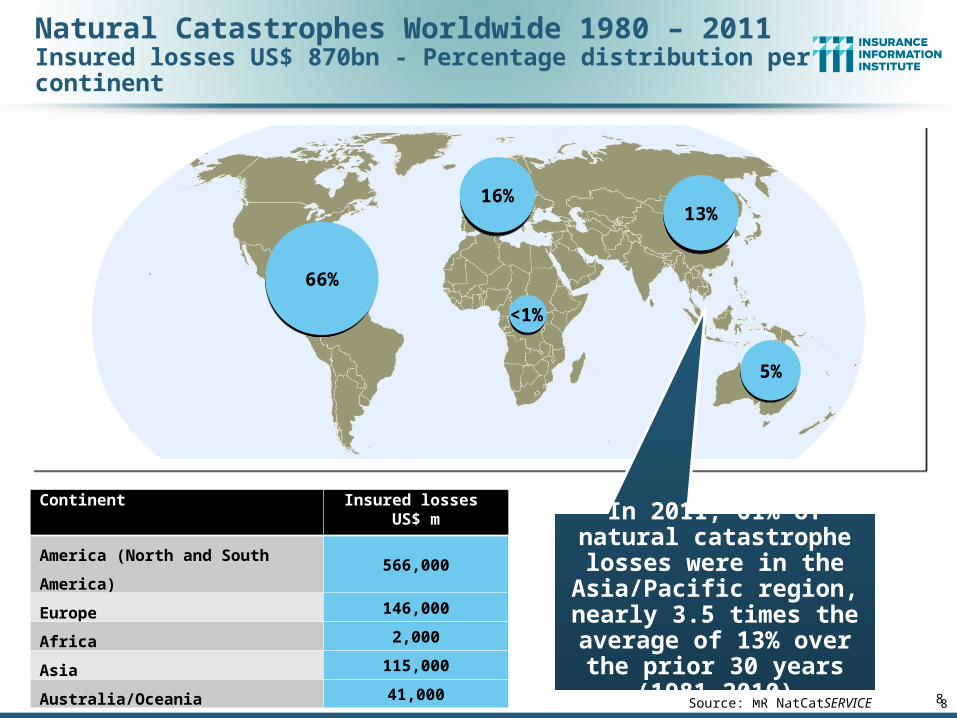
Natural Catastrophes Worldwide 1980 – 2011 Insured losses US$ 870bn - Percentage distribution per continent
Continent Insured losses US$ m
America (North and South
America)566,000
Europe 146,000
Africa 2,000
Asia 115,000
Australia/Oceania 41,000
66%
16%
<1%
13%
5%
8Source: MR NatCatSERVICE
In 2011, 61% of natural catastrophe losses were
in the Asia/Pacific region, nearly 3.5 times the
average of 13% over the prior 30 years (1981-2010)
8
9
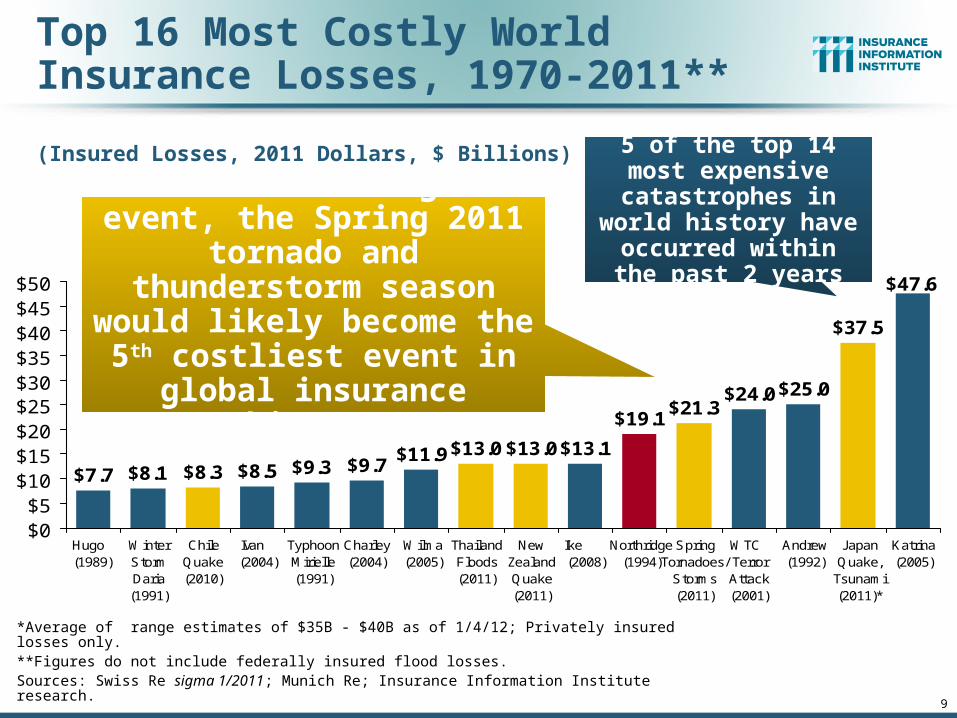
Top 16 Most Costly World Insurance Losses, 1970-2011**
(Insured Losses, 2011 Dollars, $ Billions)
*Average of range estimates of $35B - $40B as of 1/4/12; Privately insured losses only.**Figures do not include federally insured flood losses.Sources: Swiss Re sigma 1/2011; Munich Re; Insurance Information Institute research.
$11.9$13.0 $13.0$13.1
$19.1$21.3
$24.0$25.0
$37.5
$47.6
$7.7 $8.1 $8.3 $8.5 $9.3 $9.7
$0$5
$10$15$20$25$30$35$40$45$50
Hugo (1989)
WinterStormDaria(1991)
ChileQuake(2010)
Ivan (2004)
TyphoonMirielle(1991)
Charley(2004)
Wilma(2005)
ThailandFloods(2011)
NewZealandQuake(2011)
Ike (2008)
Northridge(1994)
SpringTornadoes/
Storms(2011)
WTC TerrorAttack(2001)
Andrew(1992)
JapanQuake,
Tsunami(2011)*
Katrina(2005)
5 of the top 14 most expensive
catastrophes in world history have occurred within the past 2 years
Taken as a single event, the Spring 2011 tornado and
thunderstorm season would likely become the 5th
costliest event in global insurance history

10
Global Catastrophe Loss Summary: First Half 2012
$12B in Insured Losses Globally (Down from 85% from $81.7B in 2011:H1)
Few extraordinarily severe natural catastrophe events experienced in 2011: Earthquakes, tsunami, floods and tornadoes
Despite drop from 2011, total is still 18% above 30-yr. average (in 2011 $) of $10.2B
There were 450 nat cat events globally and 3,500 fatalities
$26B in Economic Losses Globally (Down from Record $302B in 2011:H1)
Represents a 91% decline; Also 40% below 30-yr. average (in 2011 $) of $43.3B
$9.3 Billion in Insured Losses in the US Arising from 90 CAT Events
Down 62% from $24.4B in 2011:H1; Loss is close to long-term average
Represents 80%+ of global total
Mild winter helped keep first half losses down
Thunderstorm (includes tornado, hail and wind damage) accounted for $8.8B or 95% of first half insured losses and represent the third most expensive spring thunderstorm ever
$14.6 Billion in Economic Losses in the US
Down from approximately $75B in 2011:H1
Source: Munich Re; Insurance Information Institute.
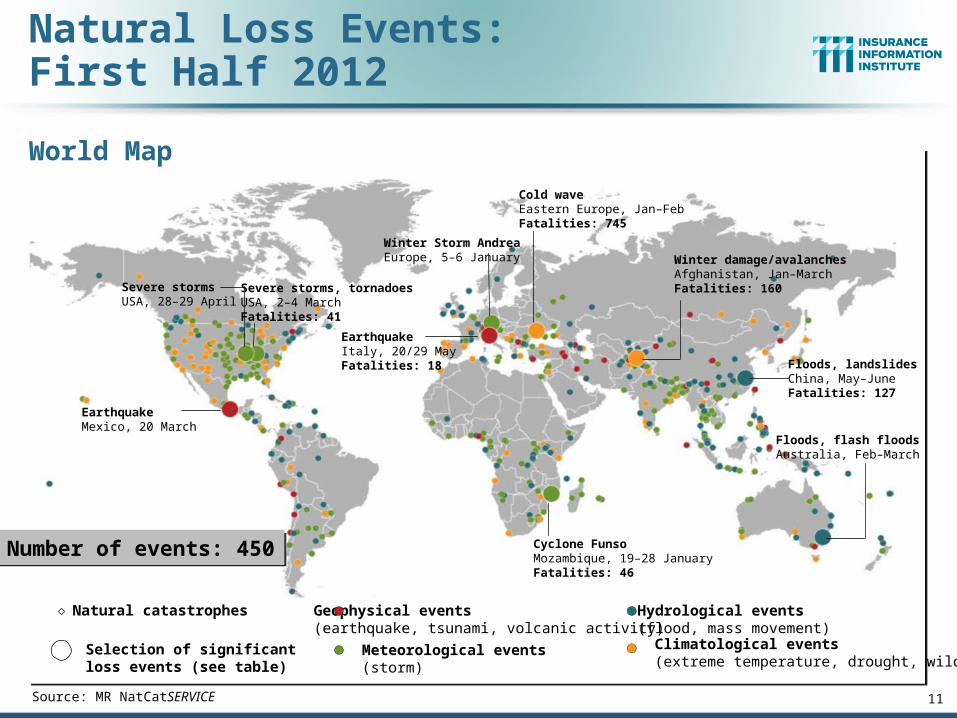
Geophysical events(earthquake, tsunami, volcanic activity)
Meteorological events (storm)
Hydrological events(flood, mass movement)
Selection of significant loss events (see table)
Natural catastrophes
Climatological events(extreme temperature, drought, wildfire)
Number of events: 450Number of events: 450
Severe storms, tornadoesUSA, 2–4 MarchFatalities: 41
Severe stormsUSA, 28–29 April
EarthquakeMexico, 20 March
Cyclone FunsoMozambique, 19–28 JanuaryFatalities: 46
Floods, flash floodsAustralia, Feb–March
Floods, landslidesChina, May–JuneFatalities: 127
Winter damage/avalanchesAfghanistan, Jan–MarchFatalities: 160
Cold waveEastern Europe, Jan–FebFatalities: 745
EarthquakeItaly, 20/29 MayFatalities: 18
Winter Storm AndreaEurope, 5–6 January
Source: MR NatCatSERVICE 11
Natural Loss Events:First Half 2012
World Map
12
U.S. Insured Catastrophe Loss Update
2012 Catastrophe Losses Were Close to “Average” in the First Half of 2012
2011 Was the 5th Most Expensive Year on Record
12
15
$1
2.3
$1
0.7
$3
.7
$1
4.0
$1
1.3
$6
.0
$3
3.9
$7
.4 $1
5.9
$3
2.9
$7
1.7
$1
0.3
$7
.3
$2
8.5
$1
1.2
$1
4.1
$3
2.3
$1
3.8
$1
3.7
$4
.7
$7
.8
$3
6.9
$8
.6
$2
5.8
$0
$10
$20
$30
$40
$50
$60
$70
$80
89 90 91 92 93 94 95 96 97 98 99 00 01 02 03 04 05 06 07 08 09 10 11 12*
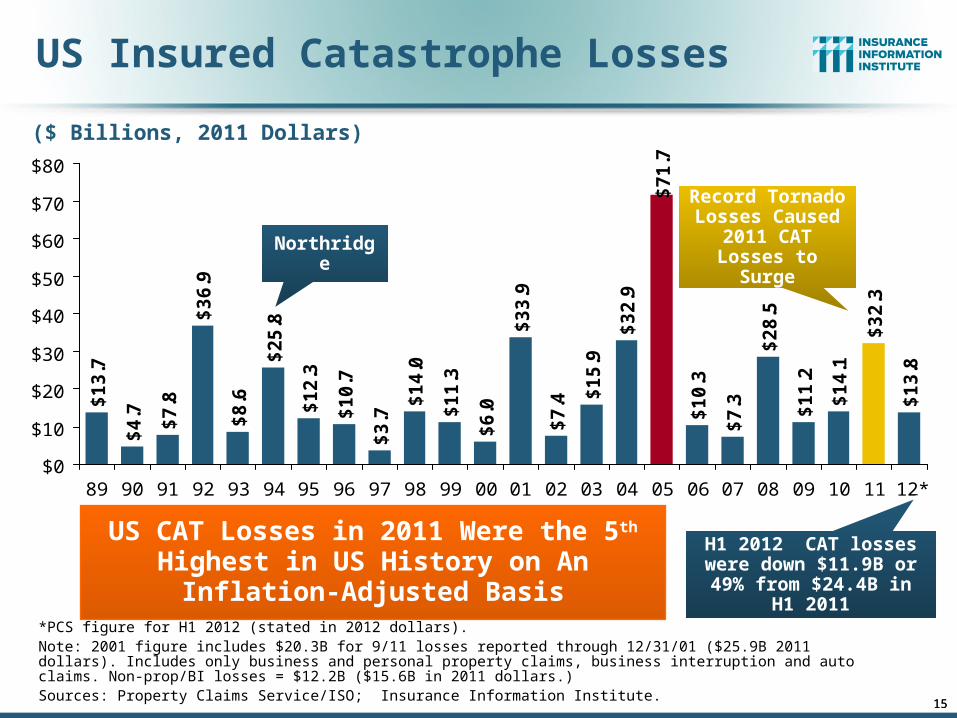
US Insured Catastrophe Losses
*PCS figure for H1 2012 (stated in 2012 dollars).Note: 2001 figure includes $20.3B for 9/11 losses reported through 12/31/01 ($25.9B 2011 dollars). Includes only business and personal property claims, business interruption and auto claims. Non-prop/BI losses = $12.2B ($15.6B in 2011 dollars.) Sources: Property Claims Service/ISO; Insurance Information Institute.
US CAT Losses in 2011 Were the 5th Highest in US History on An Inflation-Adjusted Basis
H1 2012 CAT losses were down $11.9B or 49% from
$24.4B in H1 2011
Record Tornado Losses Caused
2011 CAT Losses to Surge
($ Billions, 2011 Dollars)
15
Northridge

16
Top 14 Most Costly Disastersin U.S. History
(Insured Losses, 2011 Dollars, $ Billions)
*Losses will actually be broken down into several “events” as determined by PCS. Includes losses for the period April 1 – June 30.Sources: PCS; Insurance Information Institute inflation adjustments.
$9.0$11.9 $13.1
$19.1$21.3
$24.0 $25.0
$47.6
$8.5$7.7$6.5$5.5$4.4$4.3
$0$5
$10$15$20$25$30$35$40$45$50
Irene(2011)
Jeanne(2004)
Frances(2004)
Rita (2005)
Hugo (1989)
Ivan (2004)
Charley(2004)
Wilma(2005)
Ike (2008)
Northridge(1994)
SpringTornadoes& Storms*
(2011)
9/11Attack(2001)
Andrew(1992)
Katrina(2005)
Taken as a single event, the Spring 2011 tornado and storm season are
is the 4th costliest event in US insurance history
Hurricane Irene became the 11th most expense
hurricane in US history
17
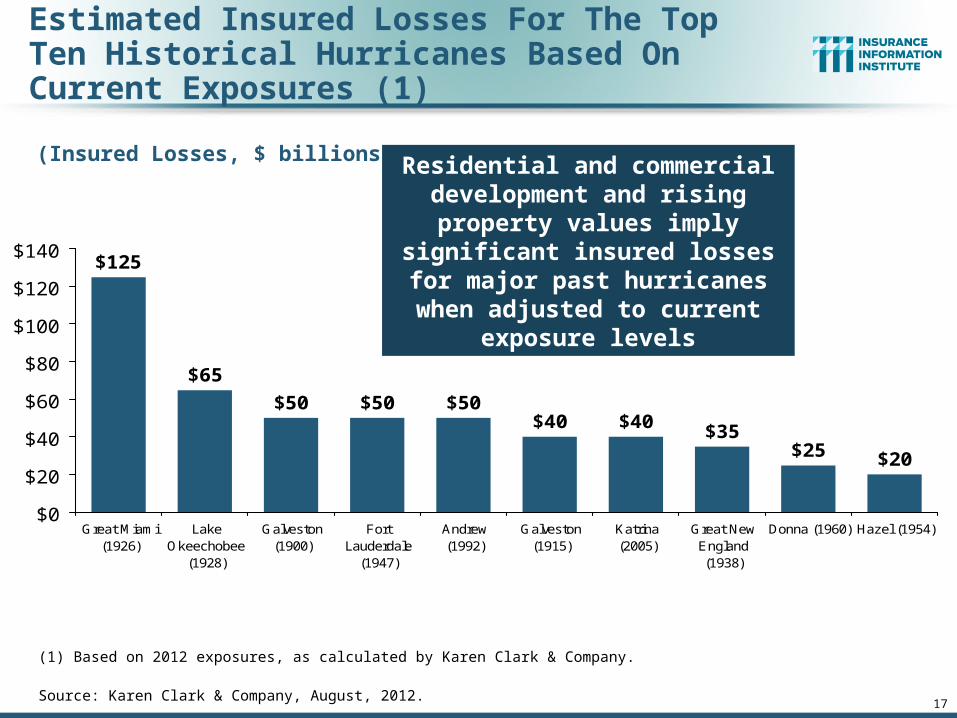
Estimated Insured Losses For The Top Ten Historical Hurricanes Based On Current Exposures (1)
(Insured Losses, $ billions)
(1) Based on 2012 exposures, as calculated by Karen Clark & Company.
Source: Karen Clark & Company, August, 2012.
$40 $35$25 $20
$40$50$50$50
$65
$125
$0
$20
$40
$60
$80
$100
$120
$140
Great Miami(1926)
LakeOkeechobee
(1928)
Galveston(1900)
FortLauderdale
(1947)
Andrew(1992)
Galveston(1915)
Katrina(2005)
Great NewEngland(1938)
Donna (1960) Hazel (1954)
Residential and commercial development and rising property values imply significant insured losses for major past hurricanes
when adjusted to current exposure levels
18
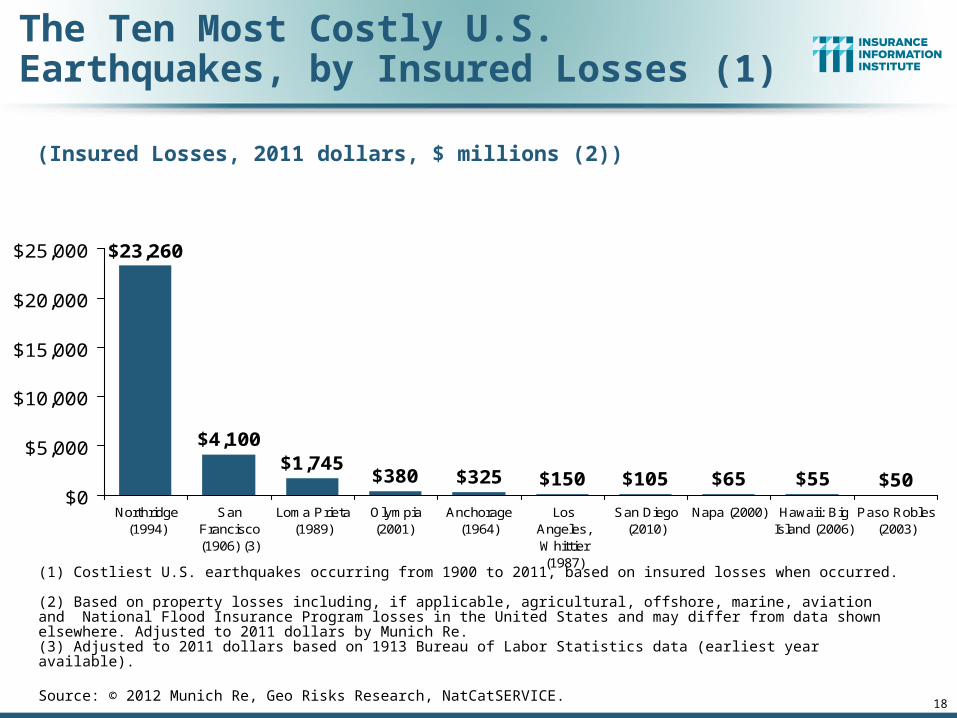
The Ten Most Costly U.S. Earthquakes, by Insured Losses (1)
(Insured Losses, 2011 dollars, $ millions (2))
(1) Costliest U.S. earthquakes occurring from 1900 to 2011, based on insured losses when occurred. (2) Based on property losses including, if applicable, agricultural, offshore, marine, aviation and National Flood Insurance Program losses in the United States and may differ from data shown elsewhere. Adjusted to 2011 dollars by Munich Re. (3) Adjusted to 2011 dollars based on 1913 Bureau of Labor Statistics data (earliest year available).
Source: © 2012 Munich Re, Geo Risks Research, NatCatSERVICE.
$105 $65 $55 $50$150$325$380$1,745
$4,100
$23,260
$0
$5,000
$10,000
$15,000
$20,000
$25,000
Northridge(1994)
SanFrancisco(1906) (3)
Loma Prieta(1989)
Olympia(2001)
Anchorage(1964)
LosAngeles,Whittier(1987)
San Diego(2010)
Napa (2000) Hawaii: BigIsland (2006)
Paso Robles(2003)
19
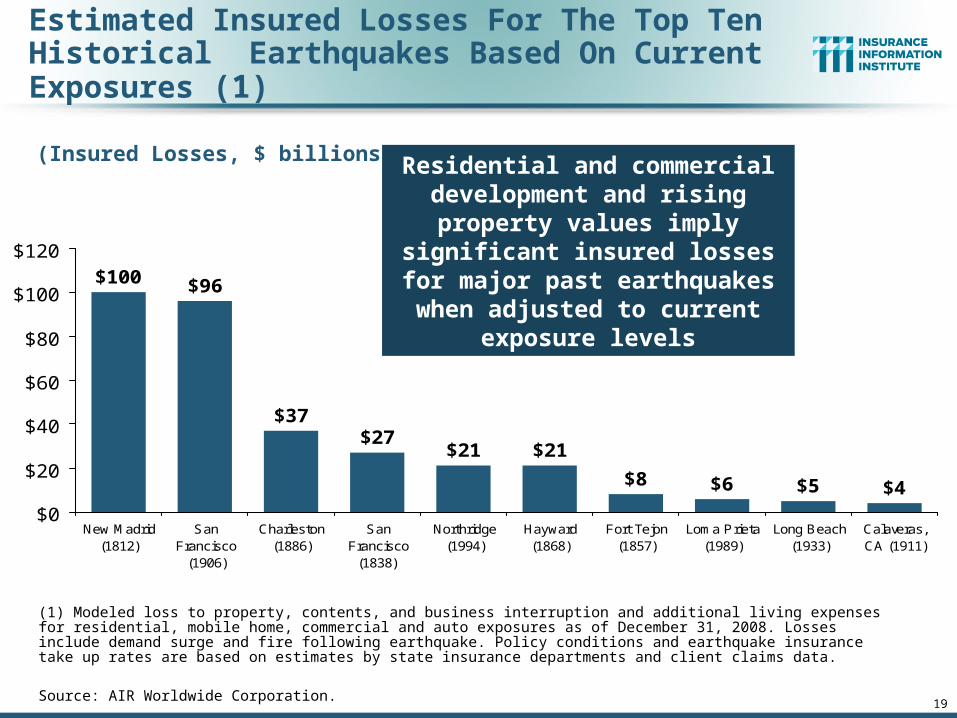
Estimated Insured Losses For The Top Ten Historical Earthquakes Based On Current Exposures (1)
(Insured Losses, $ billions)
(1) Modeled loss to property, contents, and business interruption and additional living expenses for residential, mobile home, commercial and auto exposures as of December 31, 2008. Losses include demand surge and fire following earthquake. Policy conditions and earthquake insurance take up rates are based on estimates by state insurance departments and client claims data.
Source: AIR Worldwide Corporation.
$8 $6 $5 $4
$21$21$27
$37
$96$100
$0
$20
$40
$60
$80
$100
$120
New Madrid(1812)
SanFrancisco
(1906)
Charleston(1886)
SanFrancisco
(1838)
Northridge(1994)
Hayward(1868)
Fort Tejon(1857)
Loma Prieta(1989)
Long Beach(1933)
Calaveras,CA (1911)
Residential and commercial development and rising property values imply significant insured
losses for major past earthquakes when adjusted to current
exposure levels

Nu
mb
er
Geophysical (earthquake, tsunami, volcanic activity)
Climatological (temperature extremes, drought, wildfire)
Meteorological (storm)
Hydrological (flood, mass movement)
Natural Disasters in the United States, 1980 – 2012:H1Number of Events (Annual Totals 1980 – 2011 and First Half 2012)
Source: MR NatCatSERVICE 20
22
6
61
1
50
100
150
200
250
300
1980 1982 1984 1986 1988 1990 1992 1994 1996 1998 2000 2002 2004 2006 2008 2010 2012
There were 90 natural disaster events in the first
half of 2012
For whatever reason, geophysical events in the US were common in the period from 1985-1995

Losses Due to Natural Disasters in the US, 1980–2011 (Overall & Insured Losses)
21
Overall losses (in 2011 values) Insured losses (in 2011 values)
Source: MR NatCatSERVICE © 2011 Munich Re
(2011 Dollars, $ Billions)
2011
Overall Losses: $72.8 Bill
Insured Losses: $35.9 Bill
2011 was the 5th most expensive year on record for insured
catastrophe losses in the US.
Approximately 50% of the overall cost of
catastrophes in the US was covered by insurance in 2011
(Overall and Insured Losses)
Northridge

22
The Ten Most Significant Flood Events, Ranked By National Flood Insurance Program Payouts (1)
(Amount paid, $millions)
(1) Includes events from 1978 to July 31, 2012. Defined by the National Flood Insurance Program as an event that produces at least 1,500 paid losses. Stated in dollars when occurred.
Source: U.S. Department of Homeland Security, Federal Emergency Management Agency.
$493 $472 $462 $435$585$1,104$1,279$1,587$2,661
$16,262
$0
$2,000
$4,000
$6,000
$8,000
$10,000
$12,000
$14,000
$16,000
$18,000
HurricaneKatrina (2005)
Hurricane Ike(2008)
Hurricane Ivan(2004)
HurricaneIrene (2011)
TropicalStorm Allison
(2001)
Louisianaflood (1995)
HurricaneIsabel (2003)
Hurricane Rita(2005)
HurricaneFloyd (1999)
TropicalStorm Lee
(2011)
$500
$530
$830
$975
$980
$1,000
$1,200
$1,400
$1,510
$2,000
$5,000
$6,900
$7,300
$840
$0 $1,000 $2,000 $3,000 $4,000 $5,000 $6,000 $7,000
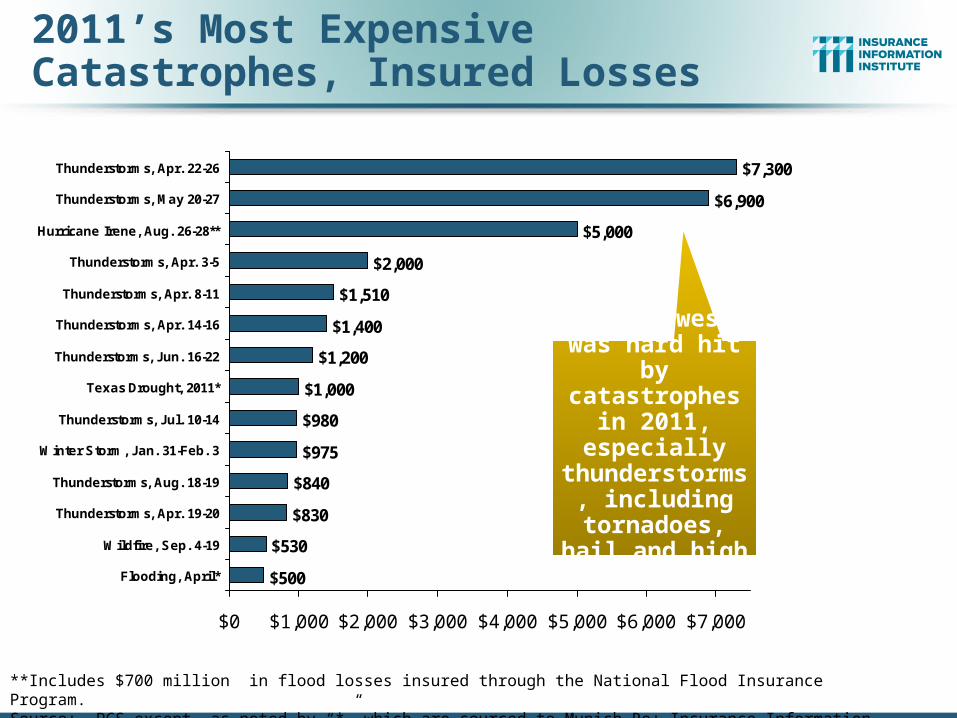
Flooding, April*
Wildfire, Sep. 4-19
Thunderstorms, Apr. 19-20
Thunderstorms, Aug. 18-19
Winter Storm, Jan. 31-Feb. 3
Thunderstorms, Jul. 10-14
Texas Drought, 2011*
Thunderstorms, Jun. 16-22
Thunderstorms, Apr. 14-16
Thunderstorms, Apr. 8-11
Thunderstorms, Apr. 3-5
Hurricane Irene, Aug. 26-28**
Thunderstorms, May 20-27
Thunderstorms, Apr. 22-26
**Includes $700 million in flood losses insured through the National Flood Insurance Program.Source: PCS except as noted by “*” which are sourced to Munich Re; Insurance Information Institute.
2011’s Most Expensive Catastrophes, Insured Losses
The Midwest was hard hit by catastrophes in 2011, especially thunderstorms,
including tornadoes, hail and high winds
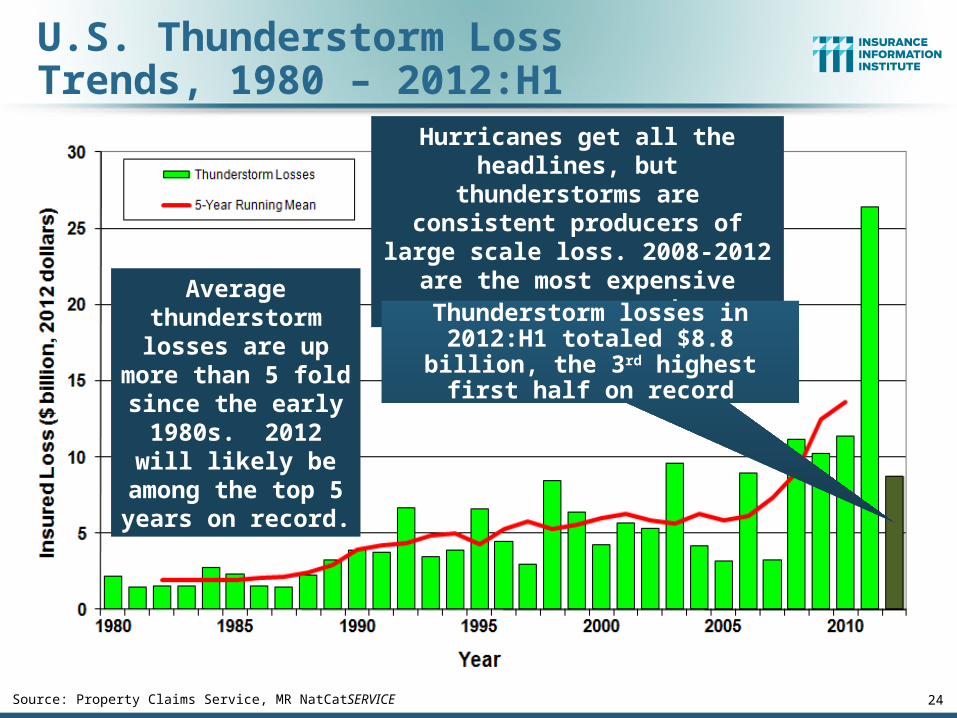
U.S. Thunderstorm Loss Trends, 1980 – 2012:H1
24Source: Property Claims Service, MR NatCatSERVICE
Average thunderstorm
losses are up more than 5 fold since the early 1980s.
2012 will likely be among the top 5 years on record.
Hurricanes get all the headlines, but thunderstorms are consistent
producers of large scale loss. 2008-2012 are the most expensive
years on record.
Thunderstorm losses in 2012:H1 totaled $8.8 billion, the 3rd highest
first half on record
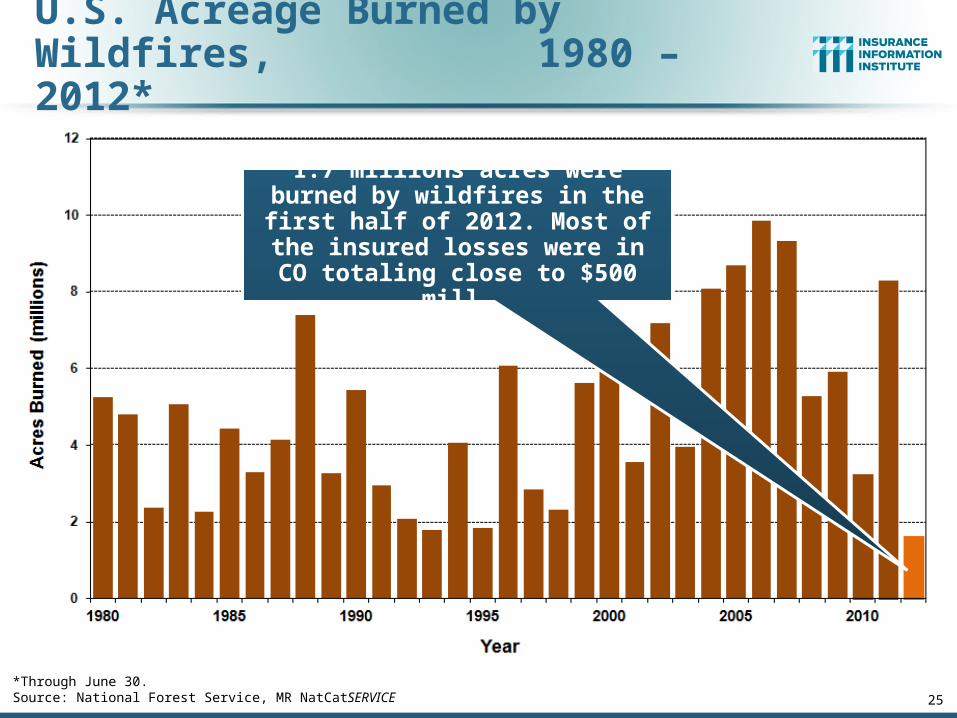
*Through June 30.Source: National Forest Service, MR NatCatSERVICE
U.S. Acreage Burned by Wildfires, 1980 – 2012*
25
1.7 millions acres were burned by wildfires in the first half of 2012.
Most of the insured losses were in CO totaling close to $500 mill.
26
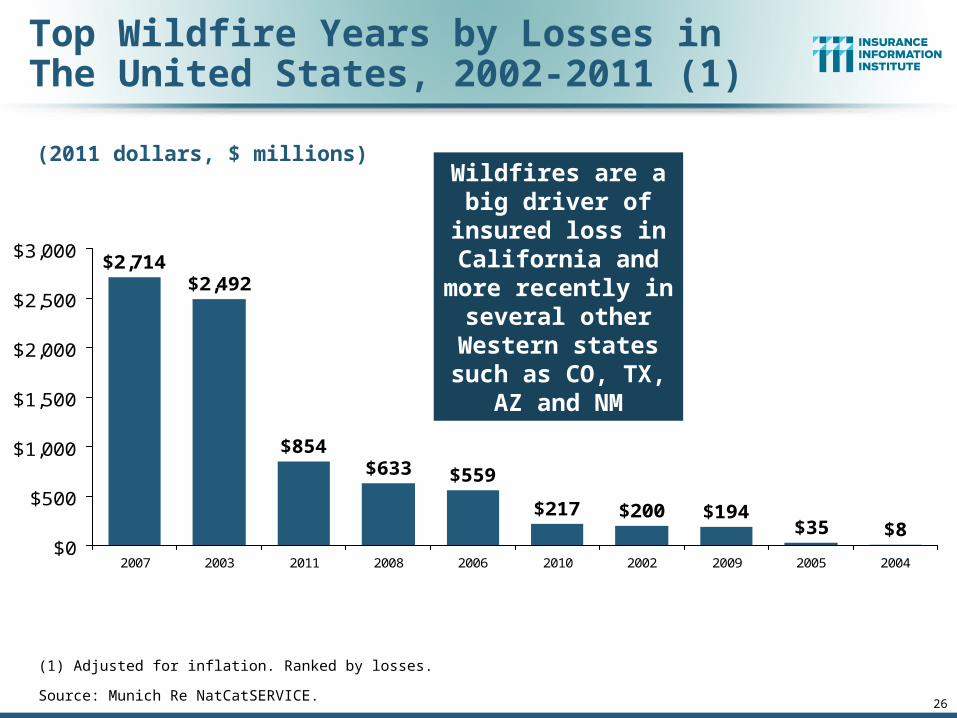
Top Wildfire Years by Losses in The United States, 2002-2011 (1)
(2011 dollars, $ millions)
(1) Adjusted for inflation. Ranked by losses.
Source: Munich Re NatCatSERVICE.
$200 $194$35 $8
$217
$559$633$854
$2,492$2,714
$0
$500
$1,000
$1,500
$2,000
$2,500
$3,000
2007 2003 2011 2008 2006 2010 2002 2009 2005 2004
Wildfires are a big driver of insured loss in California and more recently
in several other Western states
such as CO, TX, AZ and NM

27
Wildfire Losses In The United States, 2002-2011 (1)
(2011 dollars, $ millions)
(1) Adjusted for inflation.
Source: Munich Re NatCatSERVICE.
$633
$194 $217
$854
$2,714
$559
$35$8
$2,492
$200
$0
$500
$1,000
$1,500
$2,000
$2,500
$3,000
2002 2003 2004 2005 2006 2007 2008 2009 2010 2011

28
Combined Ratio Points Associated with Catastrophe Losses: 1960 – 2011*
*Insurance Information Institute estimates for 2010 and 2011 based on A.M. Best data.Notes: Private carrier losses only. Excludes loss adjustment expenses and reinsurance reinstatement premiums. Figures are adjusted for losses ultimately paid by foreign insurers and reinsurers.Source: ISO; Insurance Information Institute.
0.4
1.2
0.4 0.
8 1.3
0.3 0.4 0.
71.
51.
00.
40.
4 0.7
1.8
1.1
0.6
1.4 2.
01.
3 2.0
0.5
0.5 0.7
3.0
1.2
2.1
8.8
2.3
5.9
3.3
2.8
1.0
3.6
2.9
1.6
5.4
1.6
3.3
3.3
8.1
2.7
1.6
5.0
2.6
4.4
8.0
3.6
0.9
0.1
1.1
1.1
0.8
0
1
2
3
4
5
6
7
8
9
10
1960
1962
1964
1966
1968
1970
1972
1974
1976
1978
1980
1982
1984
1986
1988
1990
1992
1994
1996
1998
2000
2002
2004
2006
2008
2010
The Catastrophe Loss Component of Private Insurer Losses Has Increased Sharply in Recent Decades
Avg. CAT Loss Component of the Combined Ratio
by Decade
1960s: 1.04 1970s: 0.85 1980s: 1.31 1990s: 3.39 2000s: 3.52 2010s: 6.20*
Combined Ratio Points
Northridge
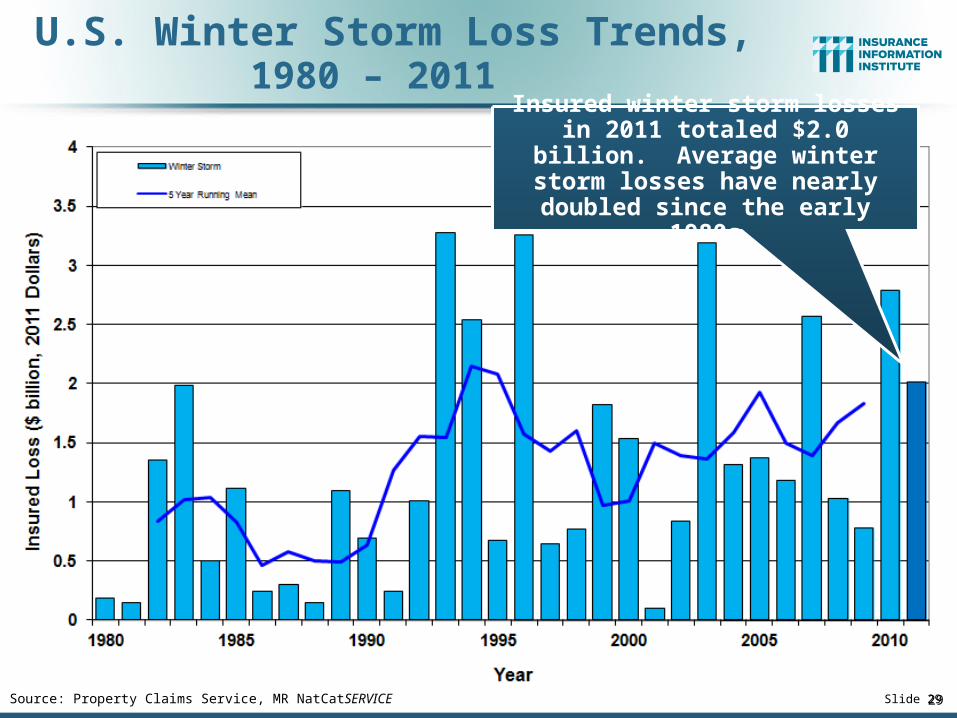
Source: Property Claims Service, MR NatCatSERVICE
U.S. Winter Storm Loss Trends, 1980 – 2011
29
Insured winter storm losses in 2011 totaled $2.0 billion. Average winter storm losses have nearly doubled
since the early 1980s
Slide 29
30
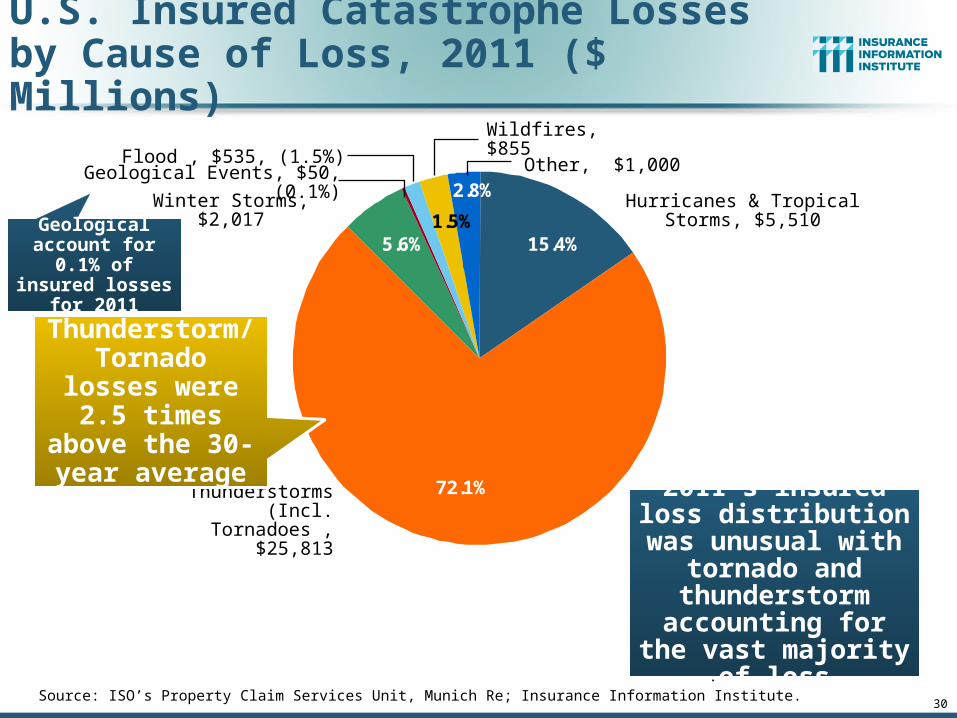
U.S. Insured Catastrophe Losses by Cause of Loss, 2011 ($ Millions)
2.8%
1.5%5.6%
72.1%
15.4%
.Source: ISO’s Property Claim Services Unit, Munich Re; Insurance Information Institute.
Hurricanes & Tropical Storms, $5,510
Wildfires, $855
Thunderstorms (Incl. Tornadoes , $25,813
Winter Storms, $2,017
Geological Events, $50, (0.1%)Flood , $535, (1.5%) Other, $1,000
2011’s insured loss distribution was
unusual with tornado and thunderstorm accounting for the
vast majority of loss
Thunderstorm/ Tornado losses were 2.5 times above the 30-year average
Geological account for 0.1% of insured losses
for 2011
31
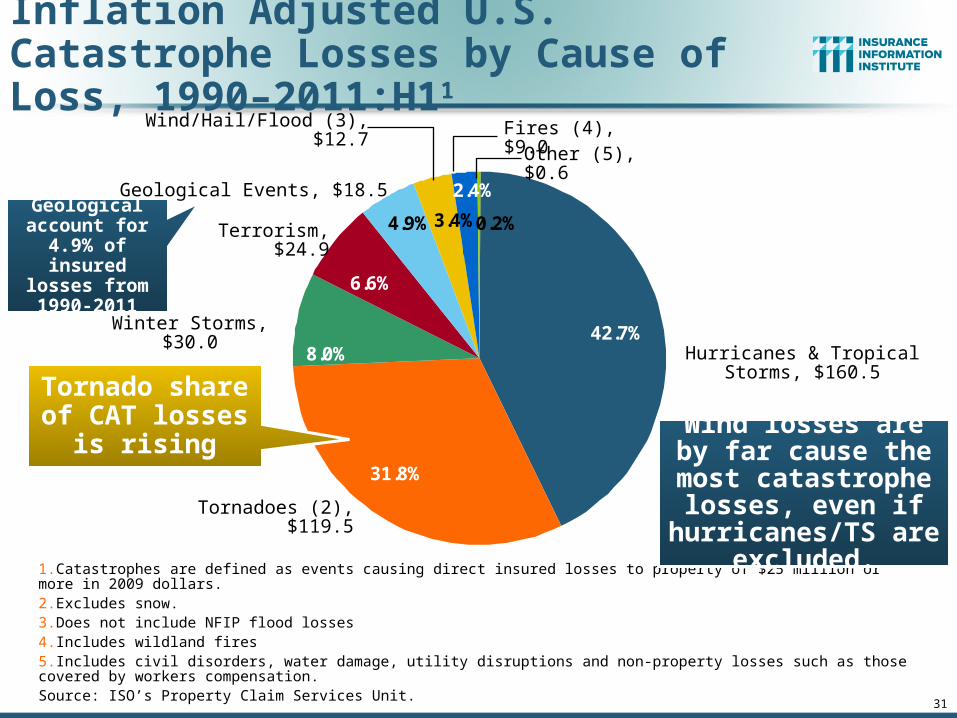
Inflation Adjusted U.S. Catastrophe Losses by Cause of Loss, 1990–2011:H11
0.2%
2.4%
3.4%4.9%
6.6%
8.0%
31.8%
42.7%
1.Catastrophes are defined as events causing direct insured losses to property of $25 million or more in 2009 dollars.2.Excludes snow.3.Does not include NFIP flood losses4.Includes wildland fires5.Includes civil disorders, water damage, utility disruptions and non-property losses such as those covered by workers compensation.Source: ISO’s Property Claim Services Unit.
Hurricanes & Tropical Storms, $160.5
Fires (4), $9.0
Tornadoes (2), $119.5
Winter Storms, $30.0
Terrorism, $24.9
Geological Events, $18.5
Wind/Hail/Flood (3), $12.7
Other (5), $0.6
Wind losses are by far cause the most catastrophe losses,
even if hurricanes/TS are excluded.
Tornado share of CAT losses is
rising
Geological account for
4.9% of insured losses from 1990-2011
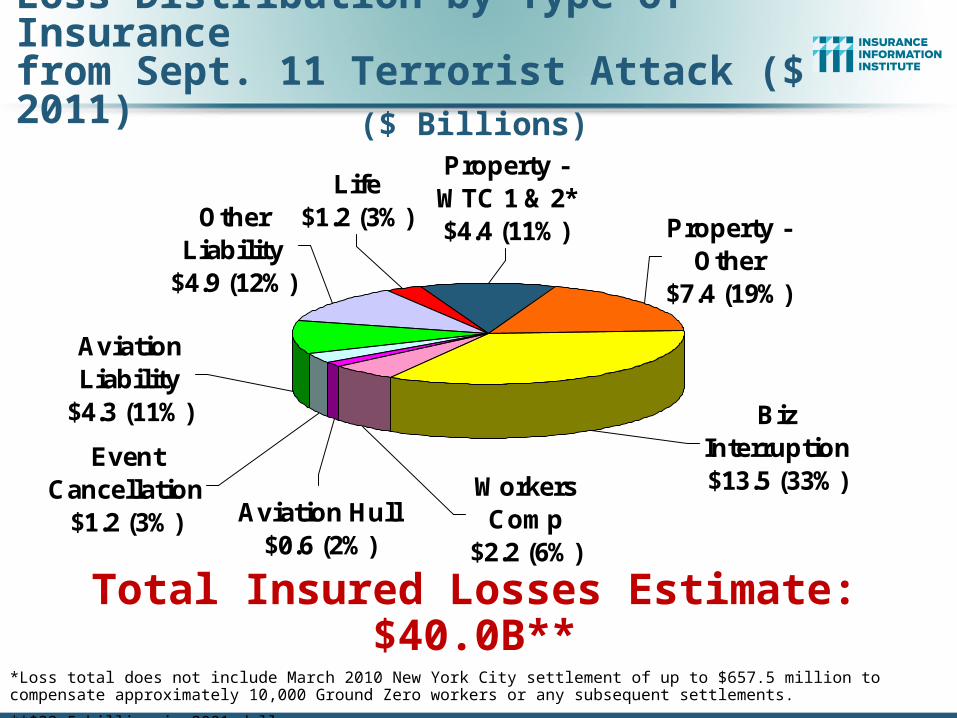
Life$1.2 (3%)
Aviation Liability
$4.3 (11%)
Other Liability
$4.9 (12%)
Biz Interruption $13.5 (33%)
Property -WTC 1 & 2*$4.4 (11%) Property -
Other$7.4 (19%)
Aviation Hull$0.6 (2%)
Event Cancellation
$1.2 (3%)Workers Comp
$2.2 (6%)
Total Insured Losses Estimate: $40.0B***Loss total does not include March 2010 New York City settlement of up to $657.5 million to compensate approximately 10,000 Ground Zero workers or any subsequent settlements.
**$32.5 billion in 2001 dollars.
Source: Insurance Information Institute.
Loss Distribution by Type of Insurancefrom Sept. 11 Terrorist Attack ($ 2011)
($ Billions)

33
Federal Disaster Declarations Patterns:
1953-2012
33
Records Were Set for Federal Disaster Declarations in 2010 and
2011—Most Declarations Were Unrelated to Tropical Activity

Number of Federal Disaster Declarations, 1953-2012*
13 1
7 18
16
16
7 71
21
22
22
0 25
25
11
11
19
29
17
17
48
46
46
38
30
22 2
54
22
31
52
42
13
42
7 28
23
11
31
38
45
32 3
63
27
54
46
55
04
54
5 49
56
69
48 5
26
37
55
98
19
93
3
43
0
20
40
60
80
100
120
53
54
55
56
57
58
59
60
61
62
63
64
65
66
67
68
69
70
71
72
73
74
75
76
77
78
79
80
81
82
83
84
85
86
87
88
89
90
91
92
93
94
95
96
97
98
99
00
01
02
03
04
05
06
07
08
09
10
11
12
*Through Oct. 15, 2012.Source: Federal Emergency Management Administration; http://www.fema.gov/disasters; Insurance Information Institute.
The Number of Federal Disaster Declarations Is Rising and Set New Records in 2010 and 2011
The number of federal disaster declarations set a
new record in 2011, with 99, shattering 2010’s record 81
declarations.
There have been 2,068 federal disaster
declarations since 1953. The average
number of declarations per year is 34 from
1953-2010, though that few haven’t been
recorded since 1995.
33 federal disasters were declared through
Oct. 15, 2012
34

35
Federal Disasters Declarations by State, 1953 – 2012: Highest 25 States*
86
78
72
65
64
59
57
56
53
53
51
51
51
49
48
48
48
47
47
46
46
46
42
40
39
0
10
20
30
40
50
60
70
80
90
100
TX CA OK NY FL LA AL KY AR MO IL TN MS WV IA MN KS NE PA VA OH WA ND NC IN
Dis
as
ter
De
cla
rati
on
s
Over the past nearly 60 years,
CA has had the 2nd highest number
of Federal Disaster
Declarations
*Through Sept. 28, 2012. Includes Puerto Rico and the District of Columbia.
Source: FEMA: http://www.fema.gov/news/disaster_totals_annual.fema; Insurance Information Institute.
36
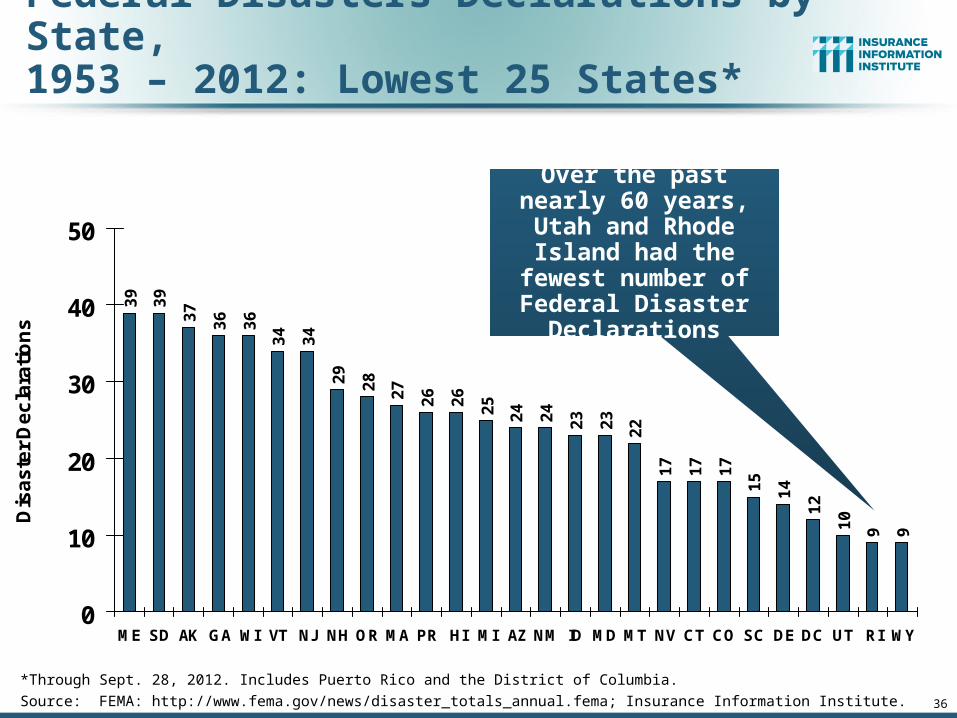
Federal Disasters Declarations by State, 1953 – 2012: Lowest 25 States*
39
39
37
36
36
34
34
29
28
27
26
26
25
24
24
23
23
22
17
17
17
15
14
12
10
9 9
0
10
20
30
40
50
ME SD AK GA WI VT NJ NH OR MA PR HI MI AZ NM ID MD MT NV CT CO SC DE DC UT RI WY
Dis
as
ter
De
cla
rati
on
s
*Through Sept. 28, 2012. Includes Puerto Rico and the District of Columbia.
Source: FEMA: http://www.fema.gov/news/disaster_totals_annual.fema; Insurance Information Institute.
Over the past nearly 60 years, Utah and Rhode Island had the fewest
number of Federal Disaster Declarations
38
1,1
33
1,1
32 1
,29
7
1,1
73
1,0
82 1,2
34
1,1
73
1,1
48
1,4
24
1,3
45
1,0
71 1,2
16
94
1
1,3
76
1,2
64
1,1
03
1,0
98
1,6
92
1,1
46 1,2
82
1,0
06
1,819
1,6
91
553
0
200
400
600
800
1,000
1,200
1,400
1,600
1,800
2,000
90 91 92 93 94 95 96 97 98 99 00 01 02 03 04 05 06 07 08 09 10 11 12*
Nu
mb
er
of
To
rna
do
es
0
100
200
300
400
500
600
Nu
mb
er o
f De
ath
s
Number of Tornadoes
Number of Deaths
*Through Oct. 15, 2012.Source: U.S. Department of Commerce, Storm Prediction Center, National Weather Service at http://www.spc.noaa.gov/climo/online/monthly/newm.html
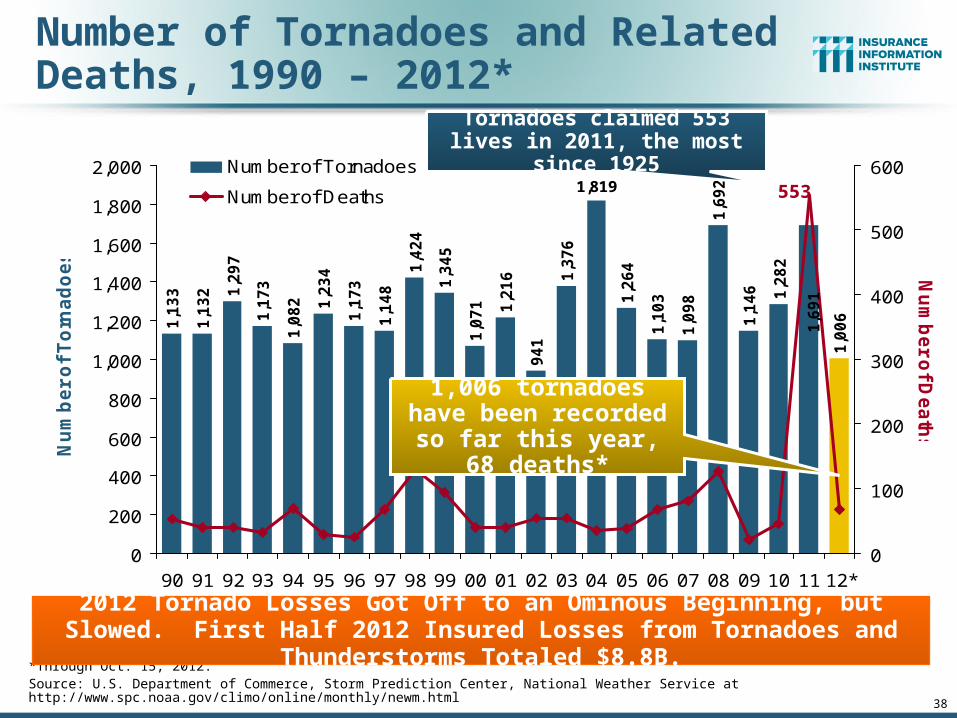
Number of Tornadoes and Related Deaths, 1990 – 2012*
Tornadoes claimed 553 lives in 2011, the most since 1925
1,006 tornadoes have been recorded so far this year, 68 deaths*
2012 Tornado Losses Got Off to an Ominous Beginning, but Slowed. First Half 2012 Insured Losses from Tornadoes and Thunderstorms Totaled $8.8B.

U.S. Tornado Count, 2005-2012*
39
*Through Oct. 8, 2012.Source: http://www.spc.noaa.gov/wcm/
There were 1,897 tornadoes in the US in 2011 far above
average, but well below 2008’s record
2012 count is running far behind 2011

Location of Tornadoes in the US, 2012*
*Through Oct. 4, 2012.Source: NOAA Storm Prediction Center; http://www.spc.noaa.gov/climo/online/monthly/2012_annual_summary.html# 41
998 tornadoes killed 68 people through Oct. 4
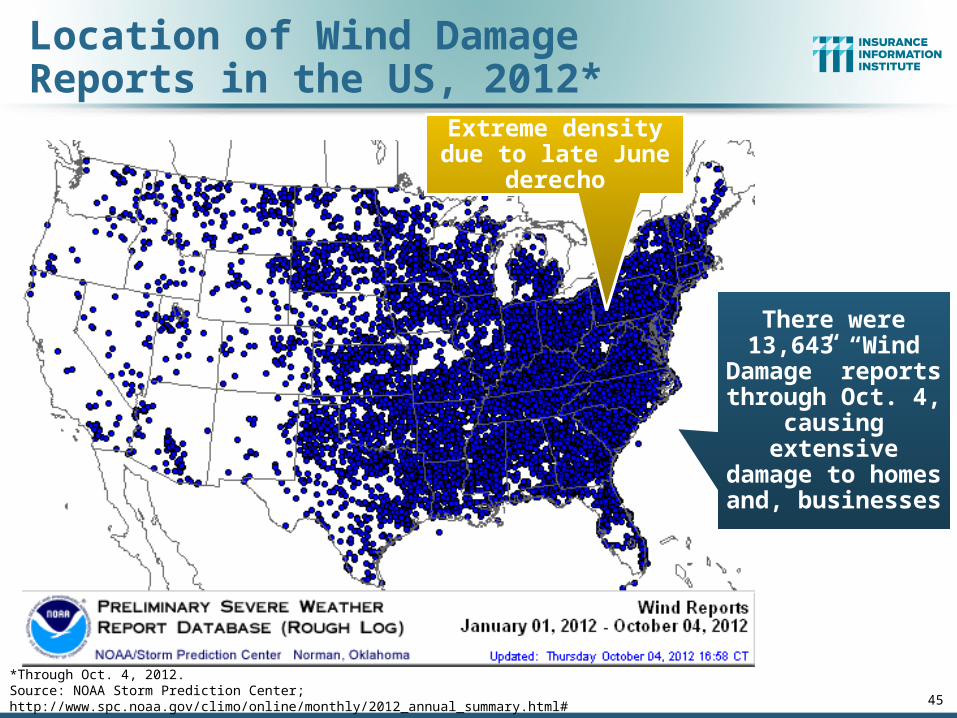
Location of Wind Damage Reports in the US, 2012*
45*Through Oct. 4, 2012.Source: NOAA Storm Prediction Center; http://www.spc.noaa.gov/climo/online/monthly/2012_annual_summary.html#
Extreme density due to late June derecho
There were 13,643 “Wind Damage” reports through Oct. 4, causing
extensive damage to homes and,
businesses

Severe Weather Reports, 2012*
47*Through Oct. 4, 2012.Source: NOAA Storm Prediction Center; http://www.spc.noaa.gov/climo/online/monthly/2012_annual_summary.html#
There were already 21,529 severe weather reports through Oct. 4; including 998 tornadoes;
6,886 “Large Hail” reports
and 13,643 high wind events

50
Financial Impacts of Catastrophes
High Catastrophe Losses Do Impact Industry Financial
Performance, but Generally Without Impairments or
Significant Market Dislocations50
51
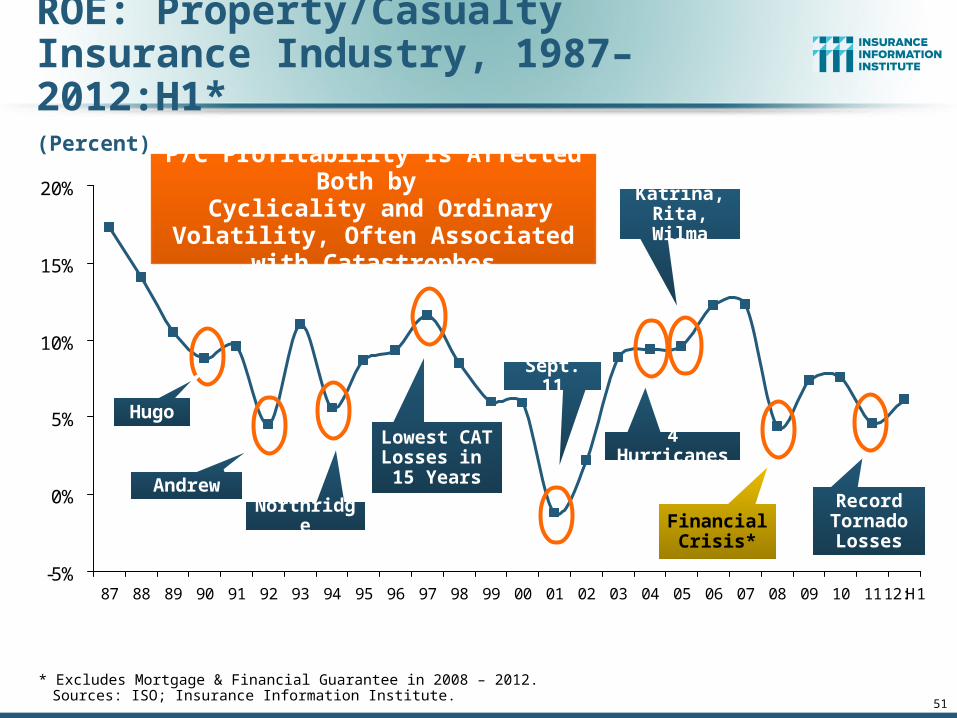
ROE: Property/Casualty Insurance Industry, 1987–2012:H1*
* Excludes Mortgage & Financial Guarantee in 2008 – 2012. Sources: ISO; Insurance Information Institute.
-5%
0%
5%
10%
15%
20%
87 88 89 90 91 92 93 94 95 96 97 98 99 00 01 02 03 04 05 06 07 08 09 10 1112:H1
P/C Profitability Is Affected Both by Cyclicality and Ordinary Volatility,
Often Associated with Catastrophes
Hugo
Andrew
Northridge
Lowest CAT Losses in 15 Years
Sept. 11
Katrina, Rita, Wilma
4 Hurricanes
Financial Crisis*
(Percent)
Record Tornado Losses

-5%
0%
5%
10%
15%
20%
25%
75
76
77
78
79
80
81
82
83
84
85
86
87
88
89
90
91
92
93
94
95
96
97
98
99
00
01
02
03
04
05
06
07
08
09
10
11
*1
2:
Profitability Peaks & Troughs in the P/C Insurance Industry, 1975 – 2012:H1*
*Profitability = P/C insurer ROEs. 2011 figure is an estimate based on ROAS data. Note: Data for 2008-2012 exclude mortgage and financial guaranty insurers. 2012:H1 ROAS = 5.9% including M&FG.Source: Insurance Information Institute; NAIC, ISO, A.M. Best.
1977:19.0% 1987:17.3%
1997:11.6%2006:12.7%
1984: 1.8% 1992: 4.5% 2001: -1.2%
10 Years
10 Years9 Years
2011:4.6%*
History suggests next ROE peak will be in 2016-2017
ROE
1975: 2.4%
2012:H1: 6.2%

53
P/C Insurance Industry Combined Ratio, 2001–2012:H1*
* Excludes Mortgage & Financial Guaranty insurers 2008--2012. Including M&FG, 2008=105.1, 2009=100.7, 2010=102.4, 2011=108.2; 2012:H1=102.2. Sources: A.M. Best, ISO.
95.7
99.3100.8
106.4
101.1101.0
92.6
100.898.4
100.1
107.5
115.8
90
100
110
120
2001 2002 2003 2004 2005 2006 2007 2008 2009 2010 2011* 2012:H1
Best Combined
Ratio Since 1949 (87.6)
As Recently as 2001, Insurers Paid Out
Nearly $1.16 for Every $1 in Earned
Premiums
Relatively Low CAT Losses, Reserve Releases
Heavy Use of Reinsurance Lowered Net
Losses
Relatively Low CAT Losses, Reserve Releases
Avg. CAT Losses,
More Reserve Releases
Higher CAT
Losses, Shrinking Reserve
Releases, Toll of Soft
Market
Cyclical Deterioration
Lower CAT
Losses

54
Combined Ratios by Predominant Business Segment, 2012:H1 vs. 2011:H1
Source: ISO/PCI; Insurance Information Institute
109.4 109.3
107.3
112.1
101.1 101.5
98.8
103.4
96
98
100
102
104
106
108
110
112
114
All Lines Personal LinesPredominating
Commercial LinesPredominating
Diversified Insurers
2011:H1 2012:H1
(Percent)
The combined ratios for both personal and commercial lines
improved substantially in 2012:H1 due in large part to lower cat losses

Underwriting Gain (Loss)1975–2012:H1*
* Includes mortgage and financial guaranty insurers in all years.Sources: A.M. Best, ISO; Insurance Information Institute.
Large Scale Catastrophes Generally Produce Elevated Underwriting Losses
-$55
-$45
-$35
-$25
-$15
-$5
$5
$15
$25
$35
75 76 77 78 79 80 81 82 83 84 85 86 87 88 89 90 91 92 93 94 95 96 97 98 99 00 01 02 03 04 05 06 07 08 09 10 11 12
($ Billions)Underwriting losses in
2012 totaled $7.0B
High cat losses in 2011 led to the highest
underwriting loss since 2002
Andrew
Northridge
Sept. 11

INVESTMENTS: THE NEW REALITY
56
Investment Performance is a Key Driver of Profitability
Depressed Yields Will Necessarily Influence
Underwriting & Pricing 56

57
U.S. 10-Year Treasury Note Yields:A Long Downward Trend, 1990–2012*
*Monthly, through Sept. 2012. Note: Recessions indicated by gray shaded columns.Sources: Federal Reserve Bank at http://www.federalreserve.gov/releases/h15/data.htm. National Bureau of Economic Research (recession dates); Insurance Information Institutes.
1%
2%
3%
4%
5%
6%
7%
8%
9%
'90 '91 '92 '93 '94 '95 '96 '97 '98 '99 '00 '01 '02 '03 '04 '05 '06 '07 '08 '09 '10 '11 '12
Yields on 10-Year U.S. Treasury Notes have been essentially below 5% for a full decade.
Since roughly 80% of P/C bond/cash investments are in 10-year or shorter durations, most P/C insurer portfolios will have low-yielding bonds for years to come.
Yields on 10-Year U.S. Treasury Notes recently
plunged to all time record lows
57

Property/Casualty Insurance Industry Investment Gain: 1994–2012F1
$35.4
$42.8$47.2
$52.3
$44.4
$36.0
$45.3$48.9
$59.4$55.7
$64.0
$31.7
$39.2
$53.4$56.2
$50.8
$58.0
$51.9$56.9
$0
$10
$20
$30
$40
$50
$60
$70
94 95 96 97 98 99 00 01 02 03 04 05* 06 07 08 09 10 11 12F
Investment Gains Are Slipping in 2012 as Low Interest Rates Reduce Investment Income and Lower Realized Investment Gains; The Financial
Crisis Caused Investment Gains to Fall by 50% in 20081 Investment gains consist primarily of interest, stock dividends and realized capital gains and losses.* 2005 figure includes special one-time dividend of $3.2B; 2012F figure is III estimate based on annualized actual H1:2012 result of
$25.424B.Sources: ISO; Insurance Information Institute.
($ Billions)
Investment gains in 2012 are running approximately 20% below their pre-crisis peak

61
P/C Insurer Impairment Frequency vs. Combined Ratio, 1969-2011
90
95
100
105
110
115
1206
97
07
17
27
37
47
57
67
77
87
98
08
18
28
38
48
58
68
78
88
99
09
19
29
39
49
59
69
79
89
90
00
10
20
30
40
50
60
70
80
91
01
1
Co
mb
ine
d R
ati
o
0.0
0.2
0.4
0.6
0.8
1.0
1.2
1.4
1.6
1.8
2.0
Imp
airm
en
t Ra
te
Combined Ratio after Div P/C Impairment Frequency
Source: A.M. Best; Insurance Information Institute
2011 impairment rate was 0.91%, up from 0.67% in 2010; the rate is slightly higher than the 0.82% average since 1969
Impairment Rates Are Highly Correlated With Underwriting Performance and Reached Record Lows in 2007; Recent Increase Was Associated
Primarily With Mortgage and Financial Guaranty Insurers and Not Representative of the Industry Overall

62
Reasons for US P/C Insurer Impairments, 1969–2010
3.6%4.0%
8.6%
7.3%
7.8%
7.1%
7.8%13.6%
40.3%
Source: A.M. Best: 1969-2010 Impairment Review, Special Report, April 2011.
Historically, Deficient Loss Reserves and Inadequate Pricing AreBy Far the Leading Cause of P-C Insurer Impairments.
Investment and Catastrophe Losses Play a Much Smaller Role
Deficient Loss Reserves/Inadequate Pricing
Reinsurance Failure
Rapid GrowthAlleged Fraud
Catastrophe Losses
Affiliate Impairment
Investment Problems (Overstatement of Assets)
Misc.
Sig. Change in Business

SURPLUS/CAPITAL/CAPACITY
63
The P/C Insurance Industry Is Well Capitalized and Capable of
Absorbing Large CAT Losses— But Pricing Must Reflect Risk
63
$0
$50
$100
$150
$200
$250
$300
$350
$400
$450
$500
$550
$600
75 77 79 81 83 85 87 89 91 93 95 97 99 01 03 05 07 09 11
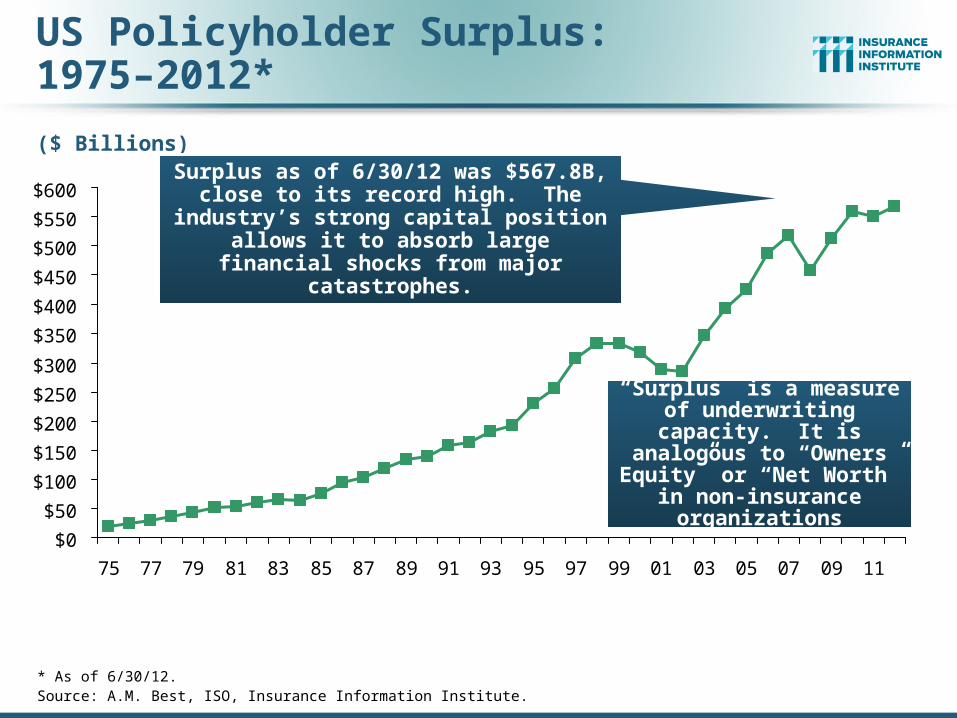
US Policyholder Surplus:1975–2012*
* As of 6/30/12.Source: A.M. Best, ISO, Insurance Information Institute.
“Surplus” is a measure of underwriting capacity. It is
analogous to “Owners Equity” or “Net Worth” in
non-insurance organizations
($ Billions)
Surplus as of 6/30/12 was $567.8B, close to its record high. The industry’s strong
capital position allows it to absorb large financial shocks from major catastrophes.

65
REINSURANCE MARKET CONDITIONS
Reinsurance Industry Was Able to Absorb Record Global Losses in 2011
and Restore Most Capacity by Late 2012
65

66
Reinsurer Share of Recent Significant Market Losses
Source: Insurance Information Institute from reinsurance share percentages provided in RAA, ABIR and CEA press release, Jan. 13, 2011.
Billions of 2011 Dollars
$0$5
$10$15$20$25$30$35$40
JapanEarthquake/
Tsunami (Mar2011)
New Zealand Earthquake (Feb
2011)
Thailand Floods(Aug - Nov 2011)
Chile Earthquake(Feb. 2010)
AustraliaCyclone/ Floods(Jan-Feb 2011)
Reinsurer SharePrimary Insurer Share
40% Reinsurance share of total insured loss
Reinsurers Paid a High Proportion of Insured Losses Arising from Major Catastrophic Events Around the World in Recent Years
$0.4$4.0
$22.5$9.5
$15.0
$3.5
$37.5
$13.0
$6.0
$10.0
$7.9
$8.3
$2.2$2.8
$5.0
73%60%
95%44%
66

67
Global Property Catastrophe Rate on Line Index, 1990—2012 (as of July 1)
15%
-3%
-13%
-8%
-20% -18% -1
1%
3%
14%
-11%
-6%
-9%
-16%
10%
-12%
-3%
7%
14%
76%
68%
25%
20%
0%
115
141
230
200184
147
121
152
255
233
195
215
184
196
133111
108
237
100
154
173
145
190
-40%
-20%
0%
20%
40%
60%
80%
100%
90 91 92 93 94 95 96 97 98 99 00 01 02 03 04 05 06 07 08 09 10 11 12
Ye
ar
Ov
er
Ye
ar
% C
ha
ng
e in
RO
L
0
50
100
150
200
250
300
Cu
mu
lativ
e R
ate
on
Lin
e (1
99
0=
10
0)
Year Over Year % Change
Cumulative Rate on Line Index
Sources: Guy Carpenter; Insurance Information Institute.
Property-Cat reinsurance pricing is up about 7% as of
7/1/12 but much more over the past 7-12 years—a cost that
must be reflected in LPI rates

Source: Guy Carpenter, GC Capital Ideas.com, February 28, 2012.
Historical Capital Levels of Guy Carpenter Reinsurance Composite, 1998—3Q11
68
Most excess reinsurance capacity was
removed from the market in 2011, but capacity bounced
back in 2012
PRICE IMPACTS
69
Escalating CAT Losses Must Be Reflected in the Rate
69
70
-5%
0%
5%
10%
15%
20%
25%
71 72 73 74 75 76 77 78 79 80 81 82 83 84 85 86 87 88 89 90 91 92 93 94 95 96 97 98 99 00 01 02 03 04 05 06 07 08 09 10 11 12
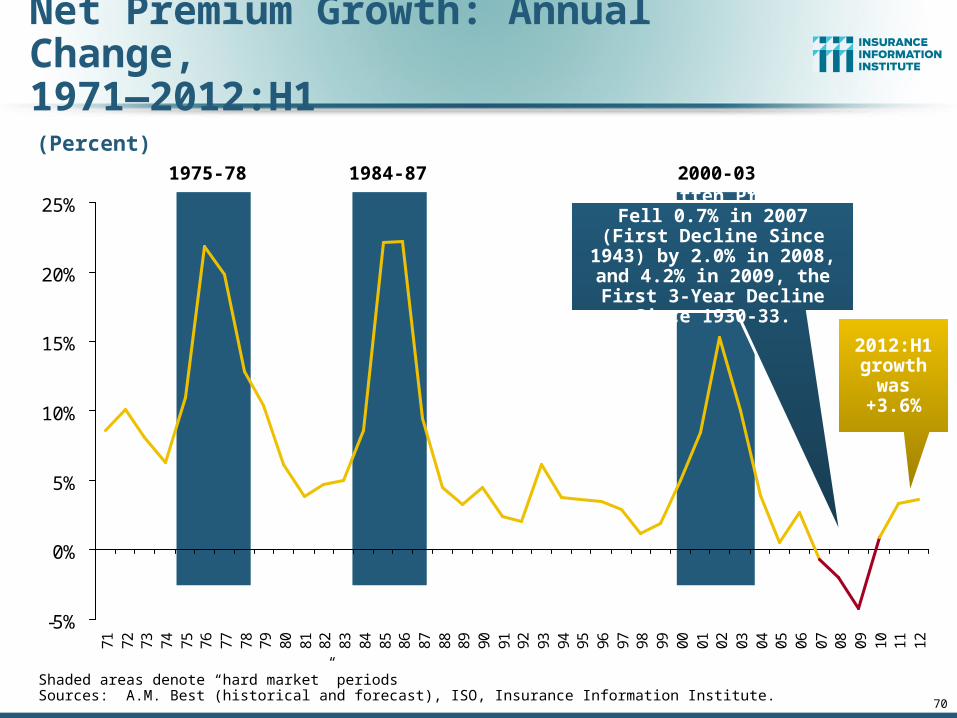
Net Premium Growth: Annual Change, 1971—2012:H1
(Percent)1975-78 1984-87 2000-03
Shaded areas denote “hard market” periodsSources: A.M. Best (historical and forecast), ISO, Insurance Information Institute.
Net Written Premiums Fell 0.7% in 2007 (First Decline
Since 1943) by 2.0% in 2008, and 4.2% in 2009, the First 3-Year Decline Since 1930-33.
2012:H1 growth
was +3.6%

71
Change in Commercial Rate Renewals, by Line: 2012:Q2
Source: Council of Insurance Agents and Brokers; Insurance Information Institute.
Percentage Change (%)
4.7%5.1%
7.2%
8.3%
0.6%
3.0%3.8% 3.9% 4.1% 4.3%
0.0%
1.0%
2.0%
3.0%
4.0%
5.0%
6.0%
7.0%
8.0%
9.0%
Su
rety
Co
mm
l Au
to
Um
bre
lla
Bu
sin
ess
Inte
rru
ptio
n
Ge
ne
ral
Lia
bili
ty
EP
L
D&
O
Co
nst
ruct
ion
Co
mm
erc
ial
Pro
pe
rty
Wo
rke
rsC
om
p
High CAT losses are driving commercial property insurance premiums higher

www.iii.org
Thank you for your timeand your attention!
Twitter: twitter.com/bob_hartwigDownload at www.iii.org/presentations
Insurance Information Institute Online:
72