catft(r) fischer-tropsch process presentation
TRANSCRIPT

The New CatFT® Process By
Dr. Thomas Holcombe President
Green Impact Fuels, LLC July 31, 2014
CatFT!!!!!!!! ! ! ! ! ! ! ! !
®

Fischer-‐Tropsch Challenges
• Heat management • Tight control of catalyst temperature
Fischer-‐Tropsch Challenges
• Heat management • Tight control of catalyst temperature • Scalability to small applicaLons • ProducLvity of cobalt catalyst • Reduced capital costs
New CatFT Process
• CatFT® addresses each of these challenges • U.S. patent 8,278,363 assigned to Green Impact Fuels, LLC
• US Air Force is interested in small, modular, mobile systems – and funded construcLon of the first CatFT pilot plant
• Novel geometry gave very promising results • Project received naLonal recogniLon award from ACEC

Novel Design of CatFT
Syngas
Boiling Water
Syngas + Inert Gas
Boiling Water
ConvenLonal Design CatFT Design
-‐ Thin catalyst coaLng -‐ Heat conducLon by fins -‐ Much lower gas velociLes
6
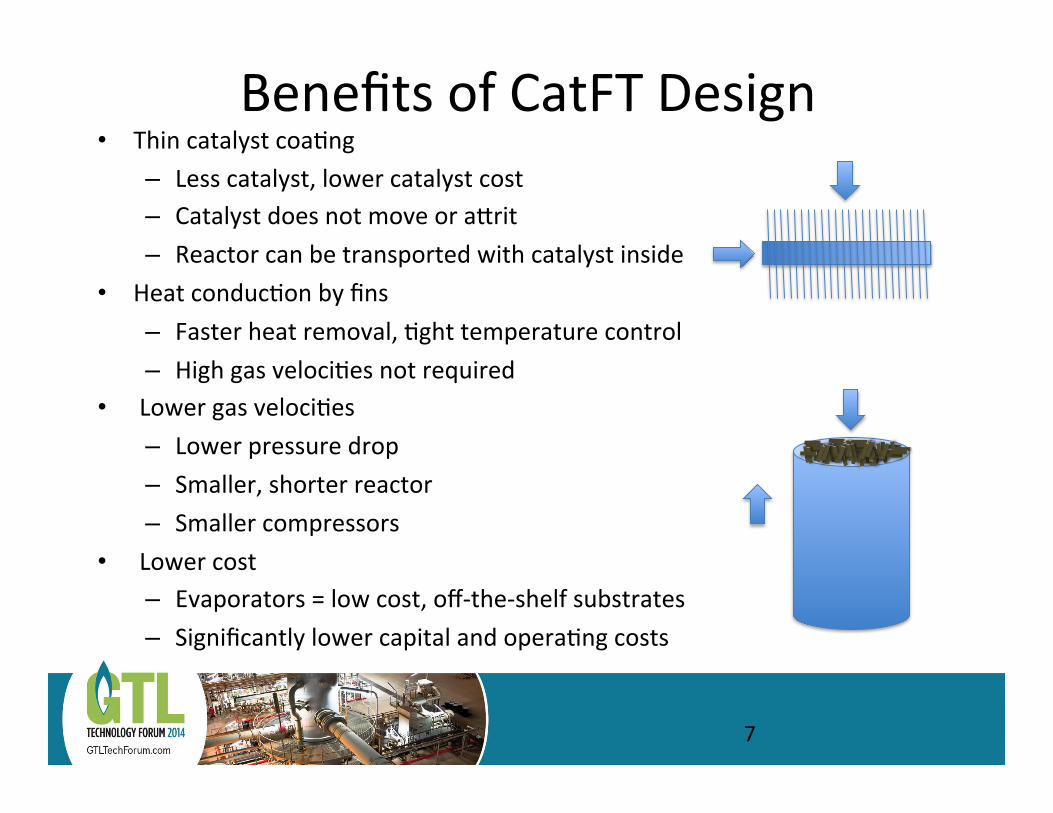
Benefits of CatFT Design • Thin catalyst coaLng
– Less catalyst, lower catalyst cost – Catalyst does not move or a[rit – Reactor can be transported with catalyst inside
• Heat conducLon by fins – Faster heat removal, Lght temperature control – High gas velociLes not required
• Lower gas velociLes – Lower pressure drop – Smaller, shorter reactor – Smaller compressors
• Lower cost – Evaporators = low cost, off-‐the-‐shelf substrates – Significantly lower capital and operaLng costs
7

Catalyst CoaLng of Substrates
• Well-‐established industrial processes are available for coaLng substrates with catalyst
• Various methods: spraying, vacuuming, dipping and passing under a “water fall”
• Used extensively to control emissions from engines, power plants, factories, etc.
• Examples of well-‐known companies: BASF, Johnson Ma[hey, Umicore

Coated Evaporator
9
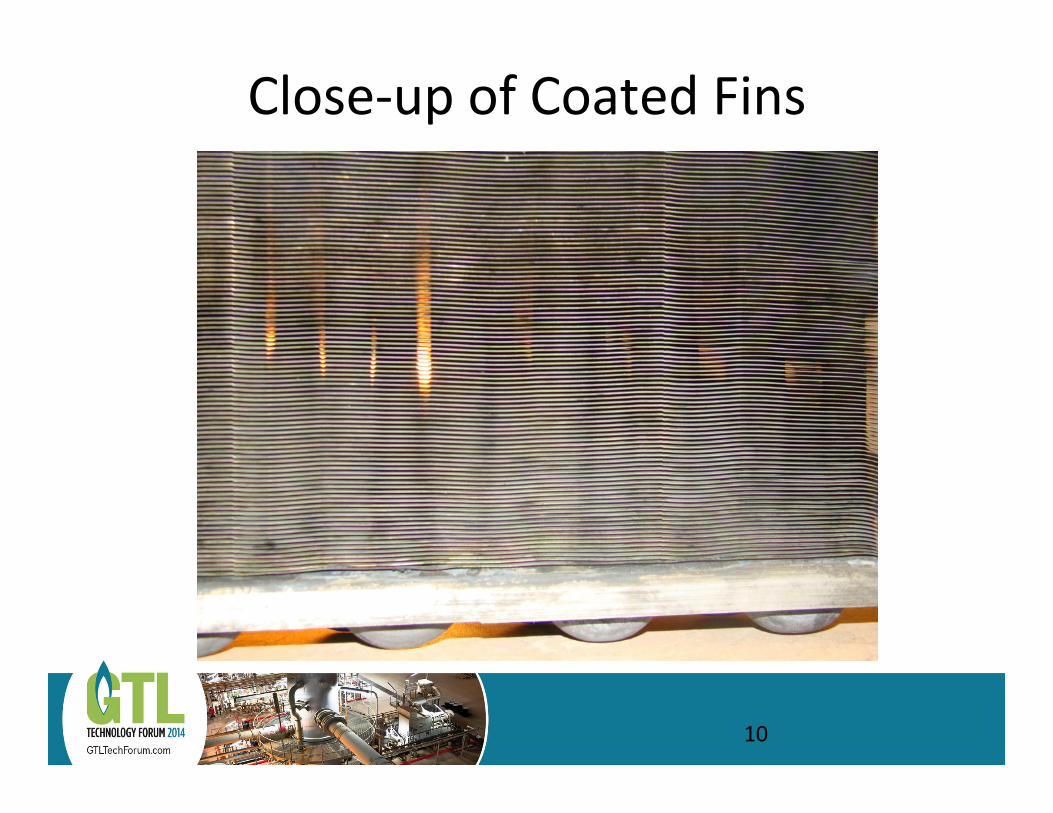
Close-‐up of Coated Fins
10

Catalyst Core Photos
11

Simplified CatFT Flow Diagram
12
Water Storage Vessel
FISCHER-TROPSCH BLOCK FLOW DIAGRAM
CONFIDENTIAL
CatFT Reactor
Boiling Water
Steam
Turbine
Pump
Cooling
Water
Cooler3-Phase Sepa- rator
Product Tank
Cooler
Heater
Syngas
Water
FT Product
Blower
Gas
Recycle
Vent
Heater
Heat
Excha-
nge
Power

Final Pilot Plant Photo

Pilot Plant Performance Performance as
Operated Performance with
gas Recycle
Syngas feed rate, lb/hr 19.5 19.1
Liquid hydrocarbons produced, BPD
0.39 0.50
CO conversion per pass, % 66.2 40.0
Total hydrocarbons produced, lbs/hr per lb of catalyst
0.48 0.60
14

Catalyst Core Scale-‐up
15

100 BPD Catalyst Core Layout
Large Small
Number 156 60
Dimensions (inches)
Height 40 40
Width 33.6 26.5
Thickness 1.8 1.8

CatFT vs. ConvenLonal Process
17
Catalyst thickness, micronsCatalyst productivity, lb/hr per lb of catalystReactor productivity, BPD per bbl of reactorMax. catalyst temperature variations, deg FSyngas velocity over catalyst surface, in/secReactor pressure drop, psiReactor length, feetPhysical attrition of catalystInert gas or liquid recycle added to feed?Removal of catalyst during transportation?
CatFT Process Fixed Bed ProcessConventional TubularThe New
20-30 15000.62 0.1-0.22-3 15 10+
10 100+1 50
6-10 36-50
No YesNo Yes
No Yes

Overall FT Block Flow Diagram
18
CatFT Process
FT Product
Hydro- treating
Hydro- processing
Distil- lation
Diesel & Naphtha
Recycle
Overall Process Block Flow Diagram
Syngas
Wax
Light Ends Recycle
Syngas Production
Natural Gas MSW
Biomass Biosolids
Etc.
Vent Recycle
Recycled Steam and
Water

Basis of CatFT Economics • 100 BPD C5+ paraffins produced • Syngas composiLon: 2.1/1 H2/CO raLo with 3% nitrogen, 5% CO2 and 4% CH4
• Syngas cost: $3.00/kscf • Shared post-‐treatment: diesel and naphtha separated (disLlled) from wax and hydrotreated
• Wax sold as final product • Budgetary capital costs from ICARUS or quotaLons • All equity model (no debt leverage)

100 BPD CatFT EsLmated Capital Costs
Case 100 BPD CatFT® Plant - All Equity ModelH2/CO feed rate 3.15 million SCF/day at 2.1/1 H2/COOn-stream factor 90 % Distillation &
Total CatFT HydrotreatingInitial Capital Costs $ $ $
ISBL with multiple plants 2014 base year 4,065,763 3,337,285 728,478Off-sites 15 % of ISBL 609,864 500,593 109,272Initial spare parts 2.0 % of fixed inv 93,513 76,758 16,755Startup and commissioning 5 % of ISBL 203,288 166,864 36,424Project development 50,000 41,041 8,959
Total 5,022,428 4,122,541 899,888

100 BPD CatFT EsLmated Cash Flow Product Sales Unit Values $/year $/year $/year
Diesel and naphtha 3.00 $/gal 2,445,219 2,445,219 0Wax 5.00 $/gal 2,823,521 2,823,521 0Total product sales 5,268,739 5,268,739 0
Cost of Goods SoldSyngas 3.00 $/kscf 3,105,810 3,105,810 0Power 8.0 cents/kwh (263,697) (274,210) 10,513Catalyst & chemicals 160,317 158,228 2,090Direct operating labor, man-yrs 80 k $/man-yr 160,000 131,332 28,668Contract maintenance 0.3 %/yr fixed inv 11,514 9,451 2,063Maintenance labor @ 0.4 %/yr fixed inv 15,352 12,601 2,751Control lab labor @ 5 % of oper labor 8,000 6,567 1,433Maintenance materials @ 1.0 %/yr fixed inv 38,379 31,502 6,876Equipment replacement @ 0.5 %/yr fixed inv 19,189 15,751 3,438Operating supplies @ 20 % of oper labor 32,000 26,266 5,734Plant overhead @ 60 % of oper labor 96,000 78,799 17,201Total cost of goods sold 3,382,863 3,302,097 80,766
Gross Profit 1,885,876SG&A @ 1.0 % of sales 52,687EBITDA 1,833,189Taxes and insurance @ 2.0 %/yr fixed inv 93,513Est. depreciation & amortization 502,243Operating income 1,237,433Est. depreciation & amortization 502,243First-year cash flow (before income tax) 1,739,676IRR to owners (before income tax) 30.1%

Conclusions • CatFT geometry offers major advantages over convenLonal processes: – Tight temperature control – Scalable to small applicaLons – High catalyst producLvity – Low capital cost
• Plants as small as 100 BPD can be profitable
Syngas
Boiling Water