cath lab essentials: ivus & oct different views of ... · pdf filepranav m. patel, md,...
TRANSCRIPT

Pranav M. Patel, MD, FACC, FSCAI Chief, Division of Cardiology
Director, Cardiac Cath Lab & CCU University of California, Irvine
Division of Cardiology
Cath Lab Essentials: IVUS & OCT
Different Views of Atherosclerosis

Normal vessel
Minimal CAD
CAD Progression
Artery can compensate for
up to 40% plaque volume
(lumen size remains constant)
Artery at maximum
expansion:
lumen narrows
Severe CAD
Moderate CAD
Glagov S et al, N Engl J Med, 1987.
Glagov Hypothesis and Patient
Type A Luminal obstruction in CAD occurs late
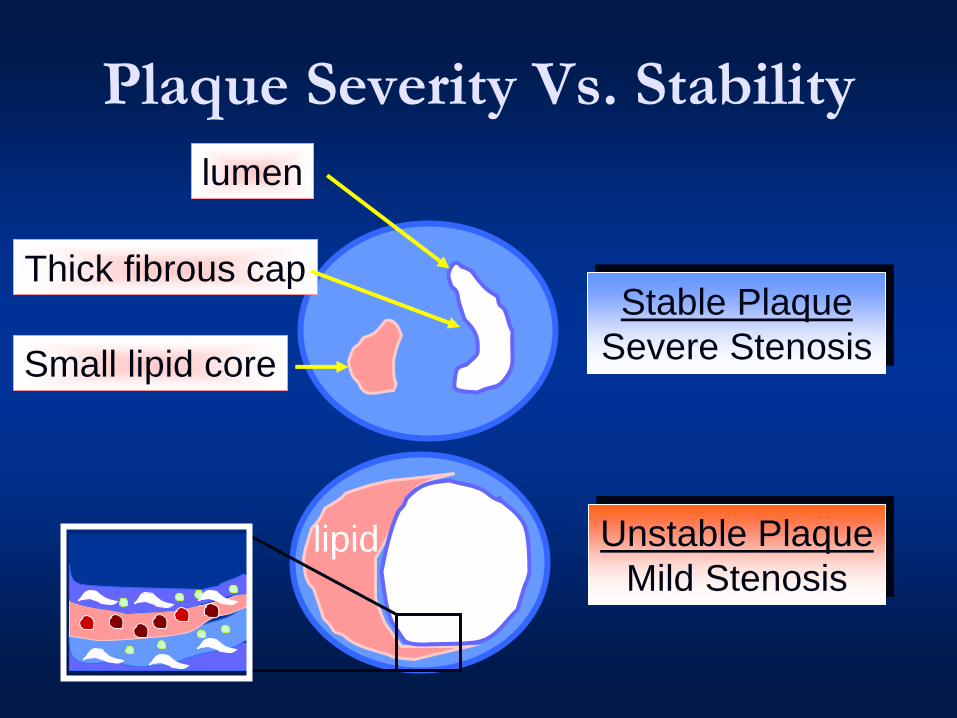
Plaque Severity Vs. Stability
lumen
Small lipid core
Stable Plaque
Severe Stenosis
Unstable Plaque
Mild Stenosis lumen lipid
Thick fibrous cap

Stable Plaque
lumen
small
lipid core
thick fibrous cap

Unstable Plaque
Ruptured Plaque with Thrombosis
thrombus
Large
lipid core
thin fibrous cap
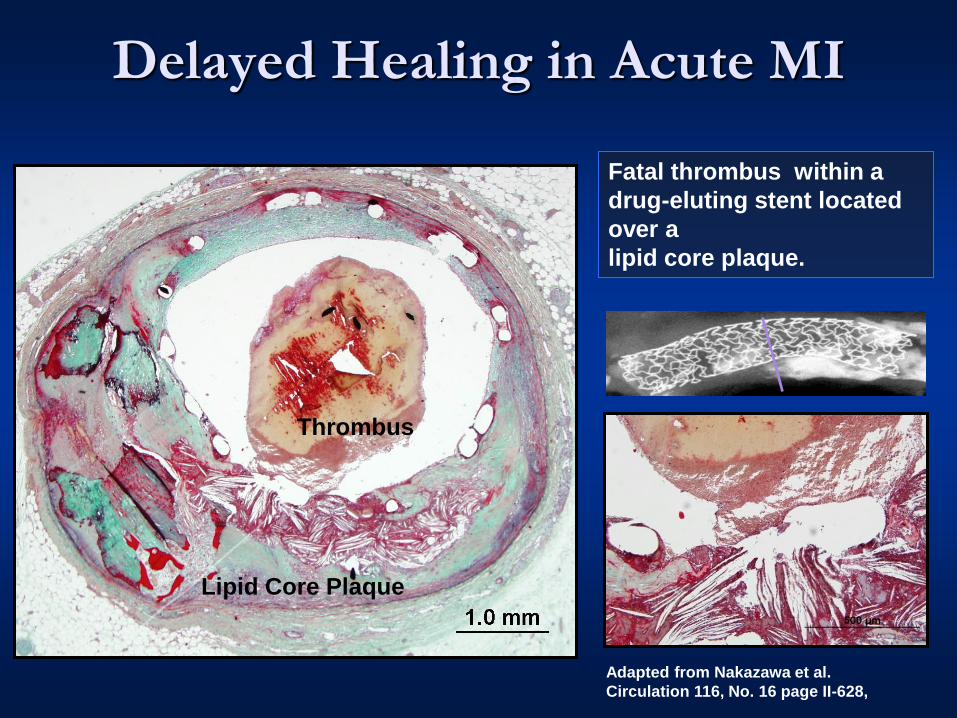
Lipid Core Plaque
Thrombus
Fatal thrombus within a
drug-eluting stent located
over a
lipid core plaque.
Adapted from Nakazawa et al.
Circulation 116, No. 16 page II-628,
Delayed Healing in Acute MI

Coronary Artery Disease

James E. Muller, MD
CEO, InfraReDx, Inc.

Coronary Calcium makes lesion and lumen diameter
difficult to assess
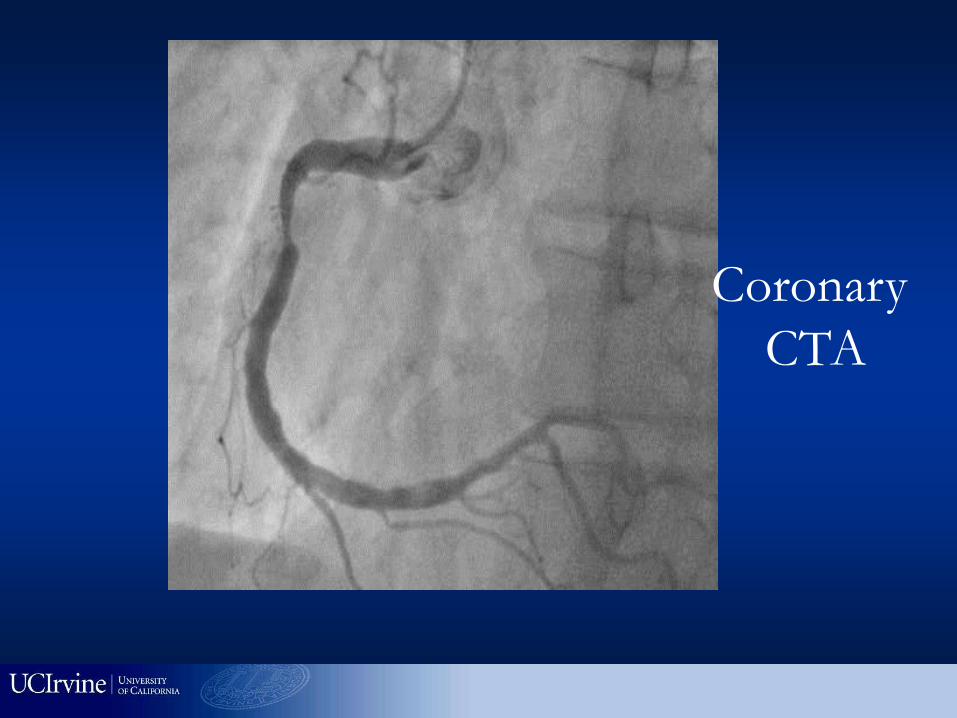
Coronary
CTA

CTA : Positive remodeling (+), Soft plaque (+),
Fibrous plaque (+), Calcification (-)
Motoyama et al. JACC 2007
LAD in ACS

Nissen. Circulation 103 (2001)
IVUS: vessel lumen

95% RCA s/p successful PCI; left system angiographically normal
Nissen. Am J Cardiol 87 (2001)
Diagnose concomitant undiagnosed
disease

“Stable” plaque
with thick fibrous
cap with small
lipid core
“Vulnerable”
plaque with thin
fibrous cap and
large lipid core
Potentially diagnose stable vs. vulnerable plaques
IVUS-derived TCFA:
(i) plaque burden > 40
(ii) the presence of
confluent necrotic core of
>10%, and
(iii) no evidence of an
overlying fibrous cap as
previously described by
Rodriguez-Granillo et al.
J Am Coll Cardiol
2005;46:2038–2042.
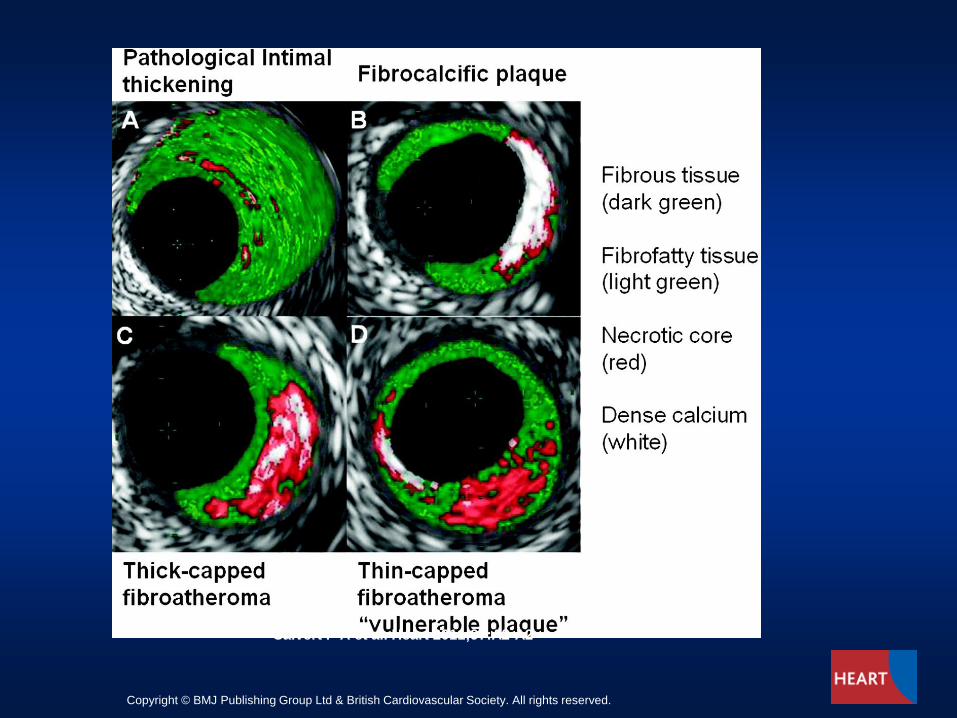
Calvert P A et al. Heart 2011;97:A2-A2
Copyright © BMJ Publishing Group Ltd & British Cardiovascular Society. All rights reserved.
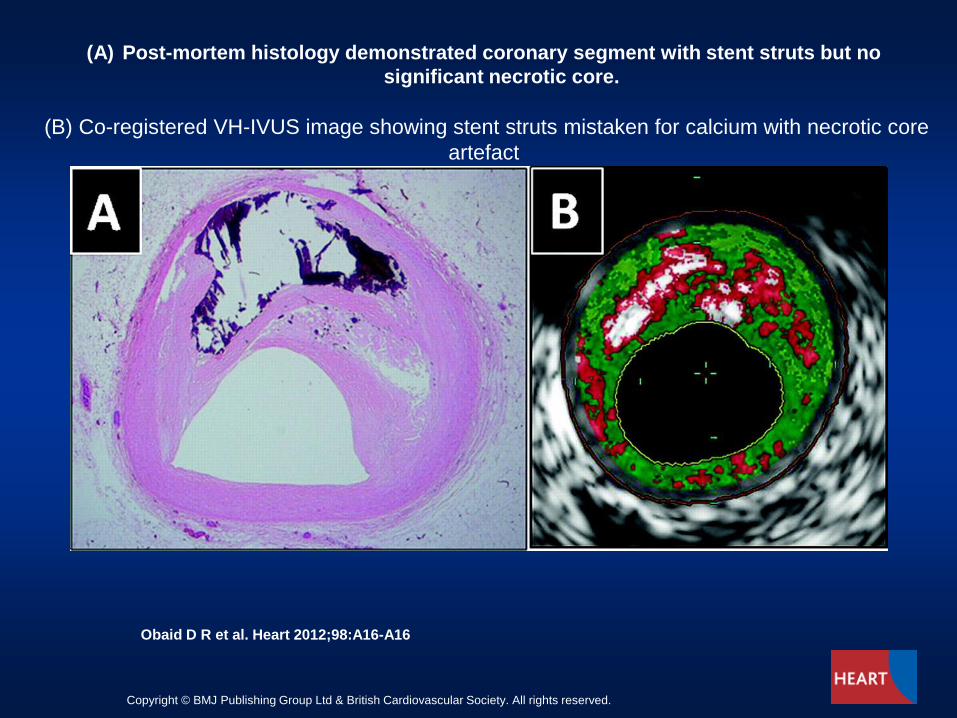
(A) Post-mortem histology demonstrated coronary segment with stent struts but no
significant necrotic core.
(B) Co-registered VH-IVUS image showing stent struts mistaken for calcium with necrotic core
artefact
Obaid D R et al. Heart 2012;98:A16-A16
Copyright © BMJ Publishing Group Ltd & British Cardiovascular Society. All rights reserved.
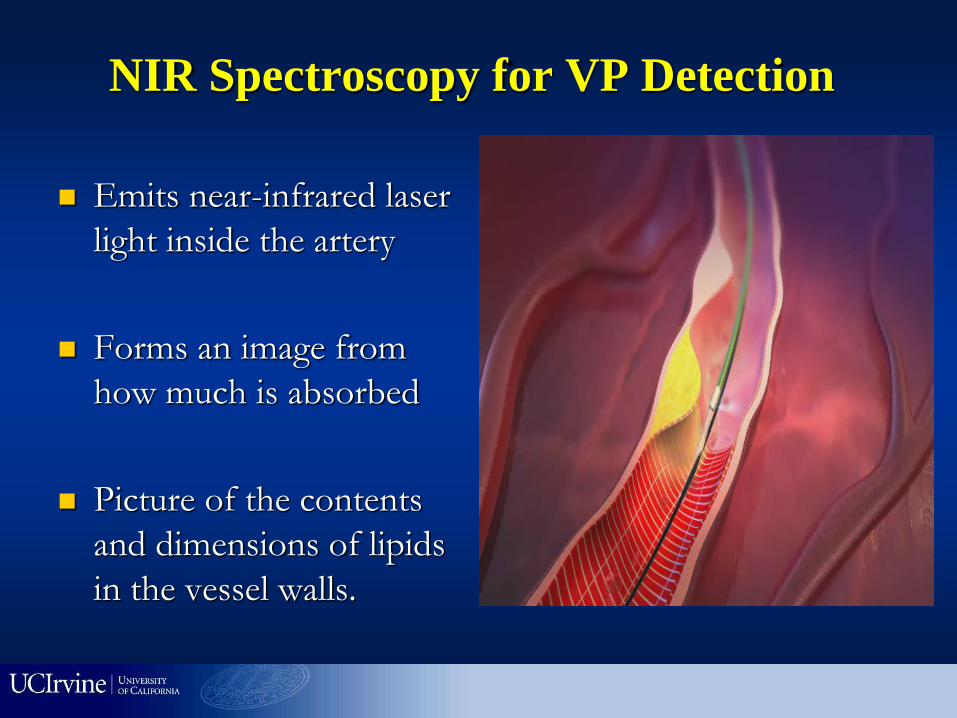
NIR Spectroscopy for VP Detection
Emits near-infrared laser
light inside the artery
Forms an image from
how much is absorbed
Picture of the contents
and dimensions of lipids
in the vessel walls.

Gardner, C. M. et al. J Am Coll Cardiol Img 2008;1:638-648
A NIRS Scan Correlates Well to Histologic Findings in Coronary Artery From an 85-Year-
Old Male With a History of MI

Gardner, C. M. et al. J Am Coll Cardiol Img 2008;1:638-648
A Chemogram From a 45-Year-Old Female Who Died of Anoxia

Clinical Case - What Stent
Length? 57 yr old male with stable
exertional angina

Post Stent
4.0 x 28mm Xience DES
STENT

James E. Muller, MD
CEO, InfraReDx, Inc.


NIRS-IVUS combination
NIRS imaging post
stenting revealed that
the lipid core,
represented by the
yellow on the
Chemogram, was no
longer present
Post-stenting
and no-reflow
Pre-stenting

Intravascular Ultrasound and Optical Coherence
Tomographic Imaging
IVUS Resolution = 150 microns
OCT Resolution = 10 microns

Figure 3. Complete tissue coverage
between the vessel lumen (dark area) and a
half-dozen stent struts (brightest objects) in
this OCT image demonstrate good healing.
(Image courtesy LightLab Imaging.)
Figure 2. OCT highlights in-stent
restenosis in a patient who has just
undergone balloon dilatation. (Image
courtesy LightLab Imaging.)
OCT

Image Orientation
Normal coronary artery
Uniform silhouette
3 layers visible in vessel wall
Data on file at LLI
Imaging catheter
Guidewire shadow
Adventitia
Media
Intima
3

Thin Cap Fibroatheroma
TCFA was defined as a plaque with fibrous cap <65μm thick.
The high resolution of OCT has an ability to identify thin-fibrous cap
clearly even if it is less than 100μm.
Giulio Guagliumi MD
Ospedali Riuniti di Bergamo, Italy

False True
Guidewire Location
False lumen
In pullback imaging,
false lumen diverges
from/joins the true
lumen
With OCT identify what
is the true vessel wall
6
Data on file at LLI

Measurements - Restenosis
Area calculations
% area stenosis
Minimum and maximum
diameter within area
Length calculations
% diameter stenosis
8
Data on file at LLI
Measurement of in-stent restenosis

Vessel Wall Damage
Edge dissection
A disruption of the vessel
luminal surface in the edge
region
Easy to interpret using
cross-sectional and longitudinal
views
10
Data on file at LLI
Image: Columbia Presbyterian Hospital

Neointimal Hyperplasia
In-stent restenosis
Thick layer between stent
struts and lumen
15
Data on file at LLI
Stent struts

Thrombosis
16
Data on file at LLI
Thrombus
Stent struts
Data on file at LLI

Thrombus – Red (Acute)
Thrombus – red
Absorbs near-infrared light
High backscatter on
surface due to signal
attenuation
Appears as a bright mass
Shadow (cannot see
behind it)
17
Data on file at LLI
Red thrombus Data on file at LLI

OCT Characteristics

OCT
Combined strengths of OCT and IVUS
IVUS

OCT
Combined strengths of OCT and IVUS
IVUS

Figure : Morphology of the patient's plaque with IVUS-derived,
thin-capped fibroatheroma
Ramcharitar S et al. (2009) First case of stenting of a vulnerable plaque in the SECRITT I trial—the
dawn of a new era?
Nat Rev Cardiol doi:10.1038/nrcardio.2009.34

Foam
cells
Calcified plaques
Lipid plaque
Two images are better than One
Integrated hybrid OCT/IVUS from Patel-Chen Labs at UCI
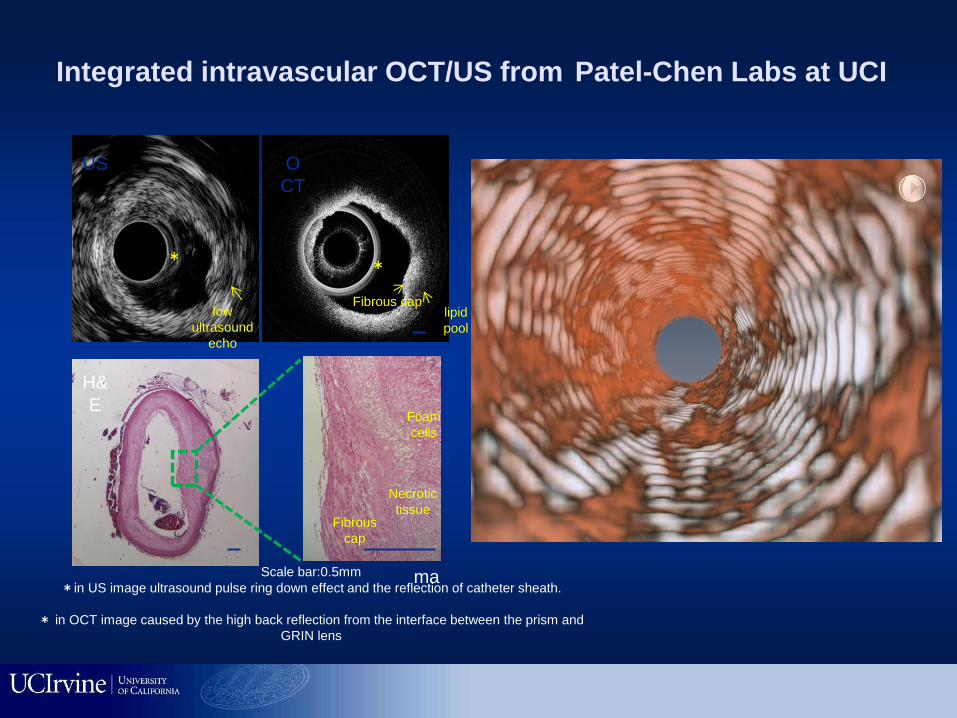
inti
ma
low
ultrasound
echo
*
lipid
pool
US O
CT
*
Fibrous cap
H&
E
Necrotic
tissue
Foam
cells
Fibrous
cap
Scale bar:0.5mm
*in US image ultrasound pulse ring down effect and the reflection of catheter sheath.
* in OCT image caused by the high back reflection from the interface between the prism and
GRIN lens
Integrated intravascular OCT/US from Patel-Chen Labs at UCI

Intravascular ultrasound (IVUS)
Optical coherence tomography (OCT)
IVUS: (full thickness of plaque) FD-OCT: (cap thickness)
Deep penetration
(5 mm)
No need for
blood clearance
Combined imaging
of Vulnerable Plaque
High resolution
(2-15 μm)
Shallow penetration
(1-2 mm)
Poor resolution
(50-300 μm)
OCT/IVUS: Ideal Combination
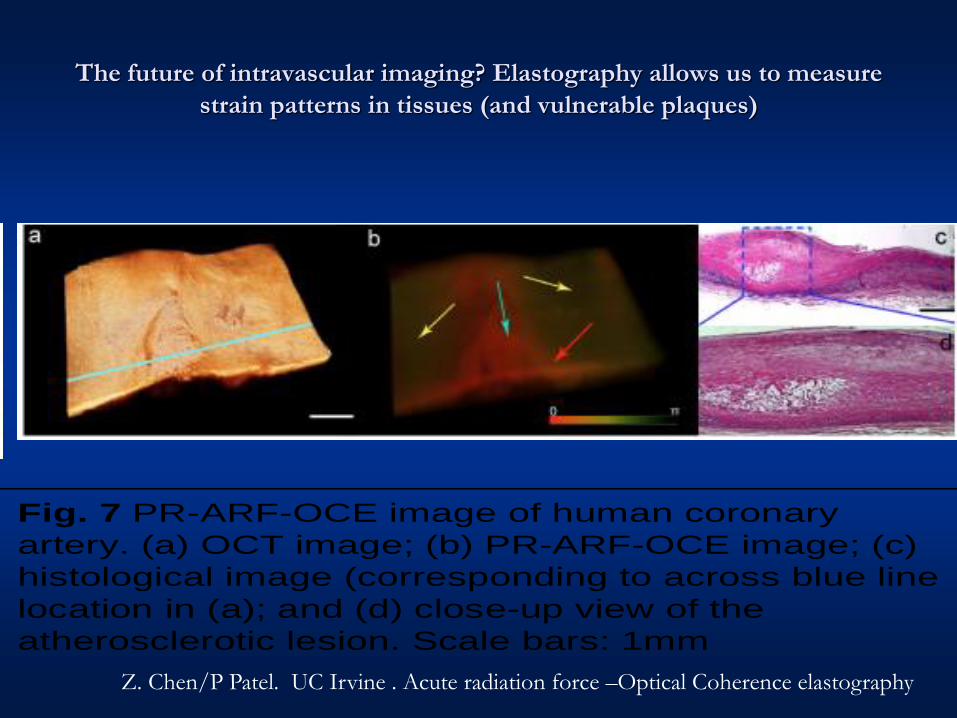
The future of intravascular imaging? Elastography allows us to measure
strain patterns in tissues (and vulnerable plaques)
image for the agarose film under ARF from an ultrasound transducer with an AM modulation of 500 Hz, is shown in Fig. 4b. The phase change amplitude averaged over depth is shown in Fig. 4c. The boundary (red arrow) between two sides of the phantom with different concentrations can be clearly visualized in Figs. 4b and 4c.
Fig. 4 (a) OCT intensity image of side-by-side agarose phantom; (b) OCE image with 500 Hz AM modulation ARF excitation; (c) phase amplitude
averaged over the depth of tissue. Red arrow indicates the boundary between two sides of 7% and 3.5% agarose film. Total length: 6 mm [73].
A linear relationship between the voltage applied to the ARF transducer and the phase shift measured is observed (Fig. 5). Since the ARF acting on both sides of the phantom was the same, the ratio of Young’s moduli between two sides can be quantified from the ratio of the measured phase shifts. The ratio of Young’s moduli between the 7% and 3.5% agarose phantom measured by phase shifts is 1:3.06, which is consistent with the value measured using a standard compression test (1:3.17). We also performed 3-D imaging of this phantom (Fig. 6) [73]. The OCT image in Fig. 6a shows no differentiation between two sides of the phantom with different stiffness. However, the 3-D PR-ARF-OCE image (Fig. 6b) clearly delineates the two materials with different stiffness. These preliminary results clearly indicate that PR-ARF-OCE image can be used to quantify mechanical properties of a tissue.
Fig. 5. Axial displacement
vs. pre-amplified voltage to the transducer
Fig. 6. (a) 3D OCT imaging of an agarose tissue mimicking
phantom; (b) PR-ARF-OCE image; (c) fused OCT and PR-ARF-OCE image. The phantom is excited with a 500 Hz square wave modulated ARF. Scale bar: 1 mm
Fig. 7 PR-ARF-OCE image of human coronary
artery. (a) OCT image; (b) PR-ARF-OCE image; (c)
histological image (corresponding to across blue line
location in (a); and (d) close-up view of the
atherosclerotic lesion. Scale bars: 1mm
To demonstrate the potential of this technology in imaging plaque, we have performed preliminary imaging of a section of atherosclerotic human coronary artery with PA-ARF-OCE (Fig. 7) [73]. An OCT intensity image (Fig. 7a) provides a general morphological view of the tissue with no obvious evidence of the presence of atherosclerosis. The region indicated by the white arrow in the ARF-OCE image (Fig. 7b) is characterized by less vibration and therefore represents less elastic and stiffer tissue, such as plaques. The strong vibration representing softer tissue is indicated by yellow arrows. The stiffer tissue, in this case atherosclerotic plaque, is clearly distinguished from the softer (usually normal) tissue area highlighted by brighter colors. This preliminary result clearly shows that PR-ARF-OCE can delineate diseased tissue from normal tissue and has the potential to quantitatively characterize tissue mechanical properties.
3C2 Research Method and Experiment
3C2.1. Design and develop integrated OCT/US/PR-ARF-OCE imaging probe (Aim 1)
(i) Develop US transducers using single crystal composites: A focused ring-shaped US transducer with a small center hole will be fabricated at the lab of Drs. Zhou and Shung at USC, an NIH US Transducer Resource Center. The PMN-PT single crystal composite will be used to fabricate transducers in the frequency range of 30-50 MHz because the composite materials can significantly improve device performance by increasing the effective electromechanical coupling coefficient (k33(eff)) up to 0.9 [92], which is the highest piezoelectric coupling coefficient, as well as reducing the effective dielectric constant and acoustic impedance. An increase in keff will result in greater transducer sensitivity and bandwidth for single crystal transducers. Decreases in the dielectric constant and acoustic impedance will also increase transducer sensitivity by improving impedance match to the electric and acoustic loads on the transducer, which are the most desirable for building miniature
Fig. 8. The schematic diagrams of the ring transducer with
inner hole diameter of 0.4 mm, and outer diameter of 1.0
mm and cross section of focused ring transducer
Z. Chen/P Patel. UC Irvine . Acute radiation force –Optical Coherence elastography

Thanks!
End – questions?