cautionary disclaimer
TRANSCRIPT

Cautionary Disclaimer
1
2
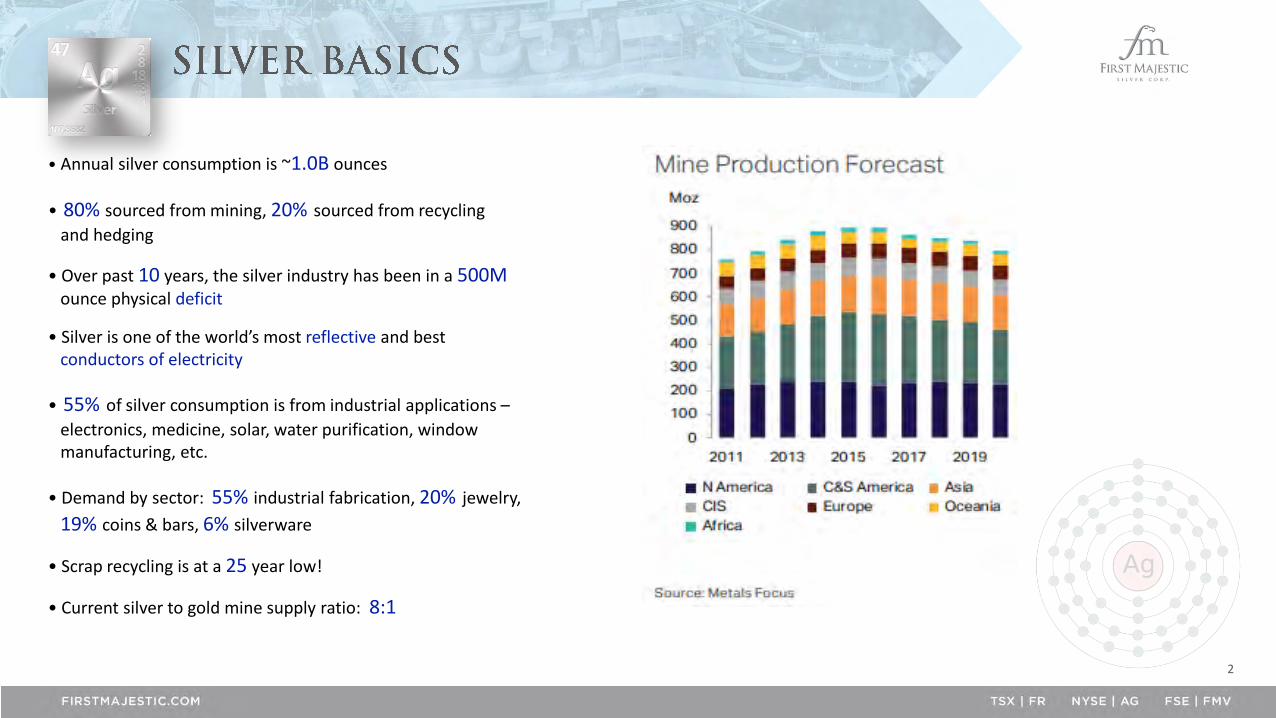
• Annual silver consumption is ~1.0B ounces
• 80% sourced from mining, 20% sourced from recycling
and hedging
• Over past 10 years, the silver industry has been in a 500Mounce physical deficit
• Silver is one of the world’s most reflective and best conductors of electricity
• 55% of silver consumption is from industrial applications –
electronics, medicine, solar, water purification, window manufacturing, etc.
• Demand by sector: 55% industrial fabrication, 20% jewelry,
19% coins & bars, 6% silverware
• Scrap recycling is at a 25 year low!
• Current silver to gold mine supply ratio: 8:1
3
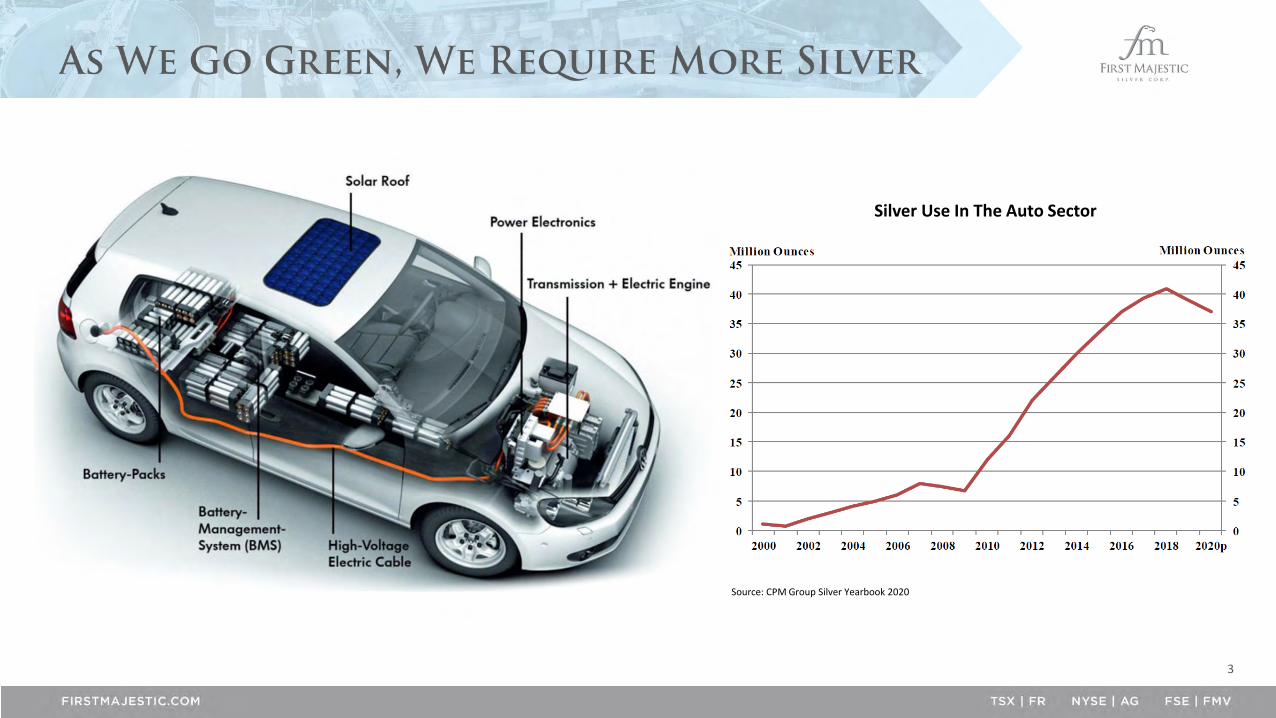
Silver Use In The Auto Sector
Source: CPM Group Silver Yearbook 2020

4
Solar energy is as an inexhaustiblefuel source that is pollution free. The technology is also versatile. Solar cells generate energy for satellites in Earth orbit and cabins deep in the Rocky Mountains as easily as they can power downtown buildings and cars.
• Solar carports are one of the most viable options for refueling EV’s
• Currently in use at a number of Walmart’s, Federal & State offices and colleges across the United States
• US Department of Energy’s National Renewable Energy Laboratory (NRLE) says about 8,000 solar carport stations would be needed to provide a minimum level of urban and rural coverage nationwide
Source: CPM Group Silver Yearbook 2020
Million Ounces Million Ounces
Annual Silver Demand for Photovoltaic Solar Panels

5
6
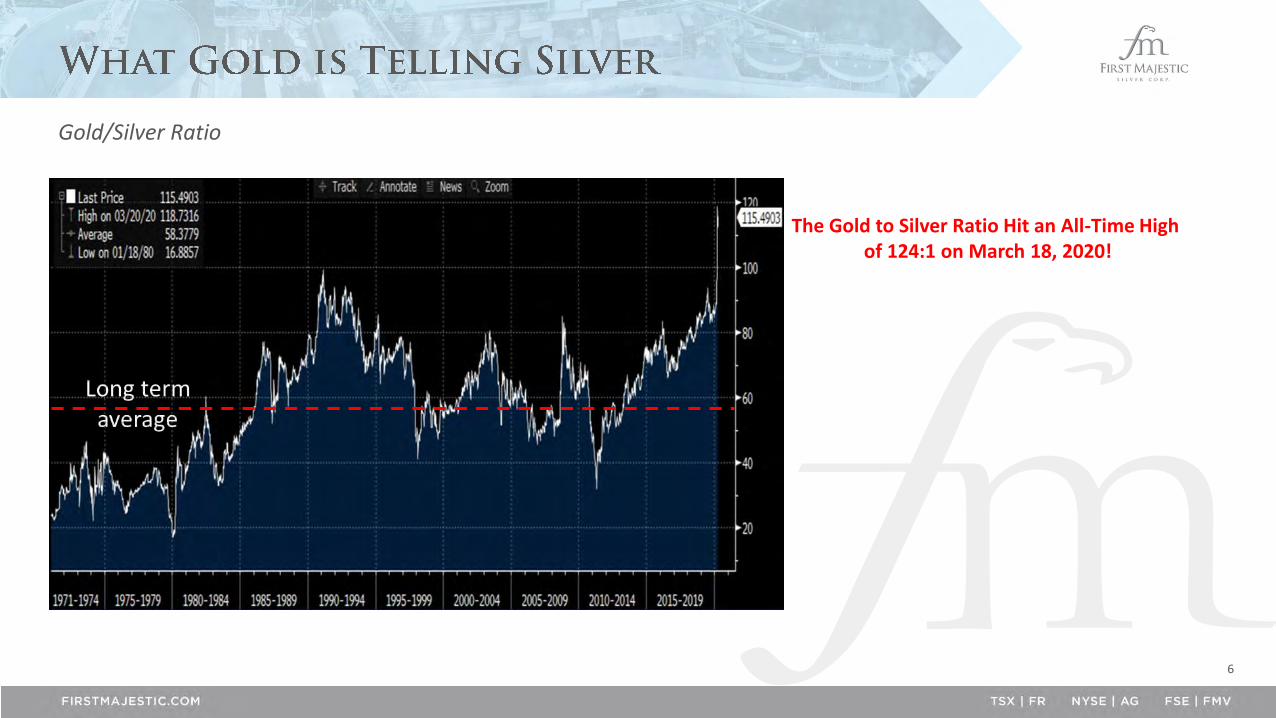
Gold/Silver Ratio
Long termaverage
The Gold to Silver Ratio Hit an All-Time High of 124:1 on March 18, 2020!
7
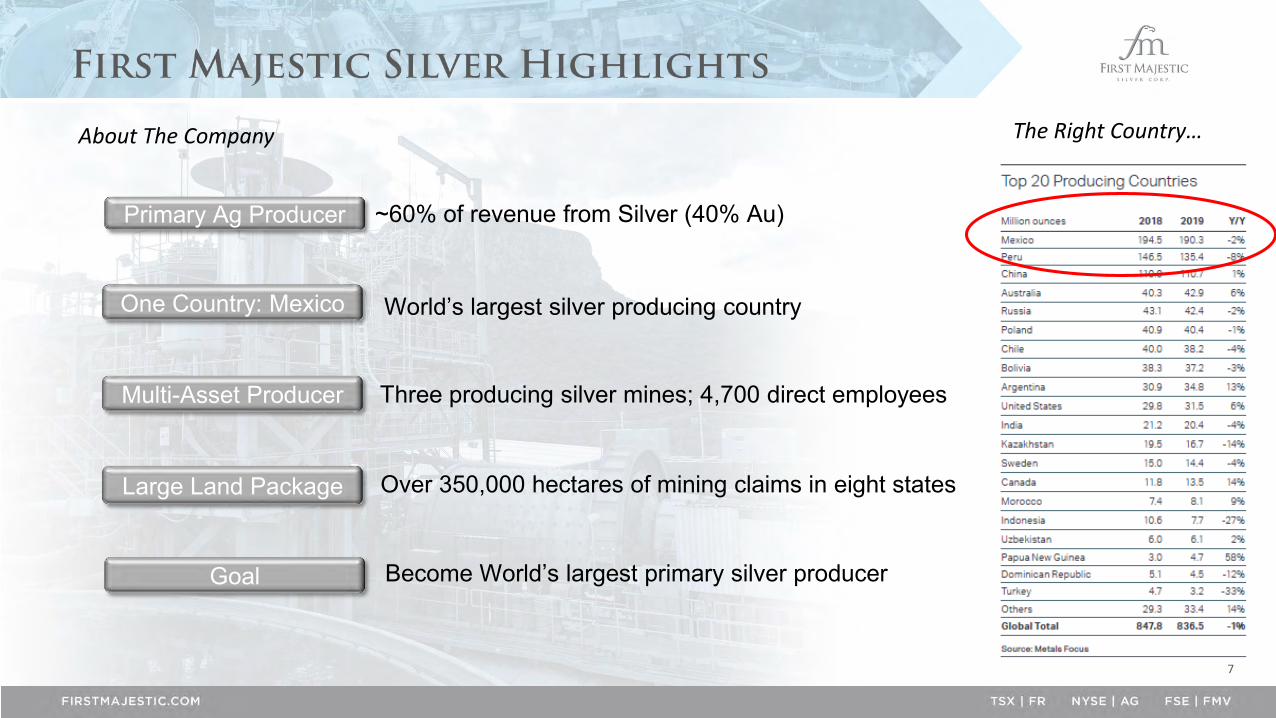
About The Company
~60% of revenue from Silver (40% Au)
World’s largest silver producing country
Three producing silver mines; 4,700 direct employeesMulti-Asset Producer
Primary Ag Producer
Over 350,000 hectares of mining claims in eight states
Become World’s largest primary silver producer
One Country: Mexico
Large Land Package
Goal
The Right Country…
8
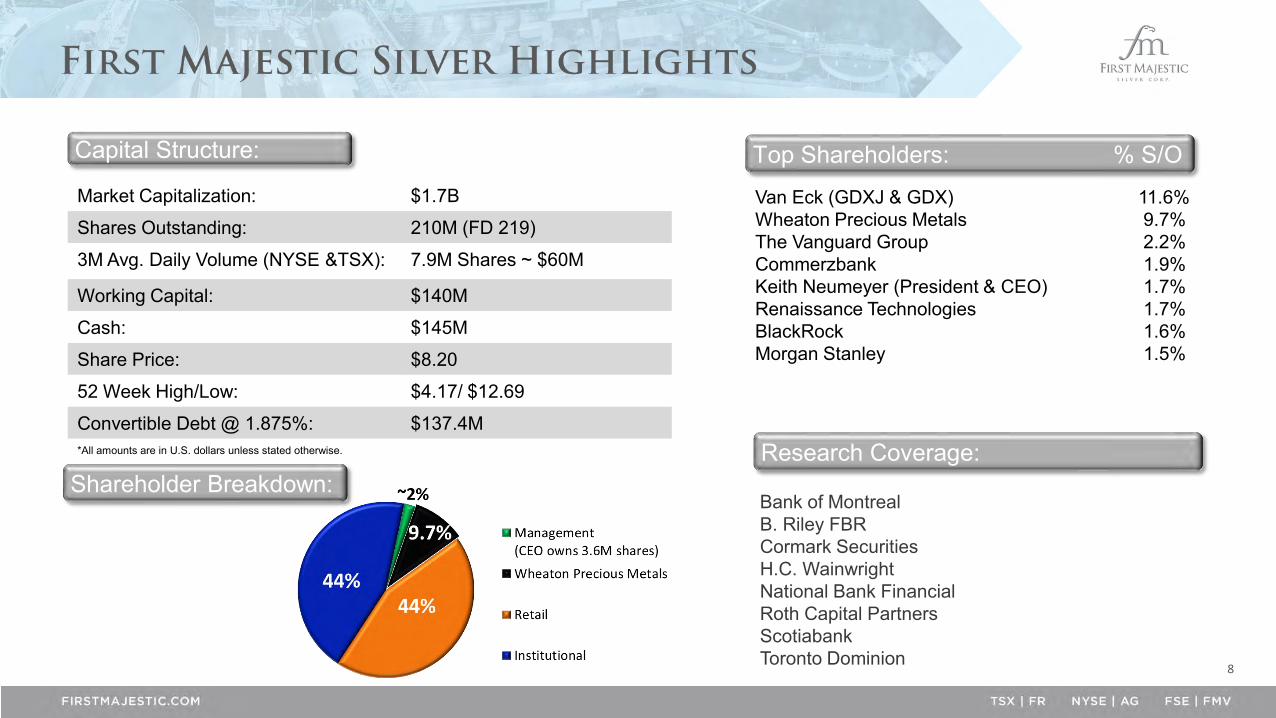
Shareholder Breakdown:
Market Capitalization: $1.7B
Shares Outstanding: 210M (FD 219)
3M Avg. Daily Volume (NYSE &TSX): 7.9M Shares ~ $60M
Working Capital: $140M
Cash: $145M
Share Price: $8.20
52 Week High/Low: $4.17/ $12.69
Convertible Debt @ 1.875%: $137.4M*All amounts are in U.S. dollars unless stated otherwise.
Van Eck (GDXJ & GDX) 11.6%Wheaton Precious Metals 9.7%The Vanguard Group 2.2%Commerzbank 1.9%Keith Neumeyer (President & CEO) 1.7%Renaissance Technologies 1.7%BlackRock 1.6%Morgan Stanley 1.5%
Top Shareholders: % S/OCapital Structure:
Research Coverage:
Bank of MontrealB. Riley FBRCormark SecuritiesH.C. WainwrightNational Bank FinancialRoth Capital PartnersScotiabankToronto Dominion
9
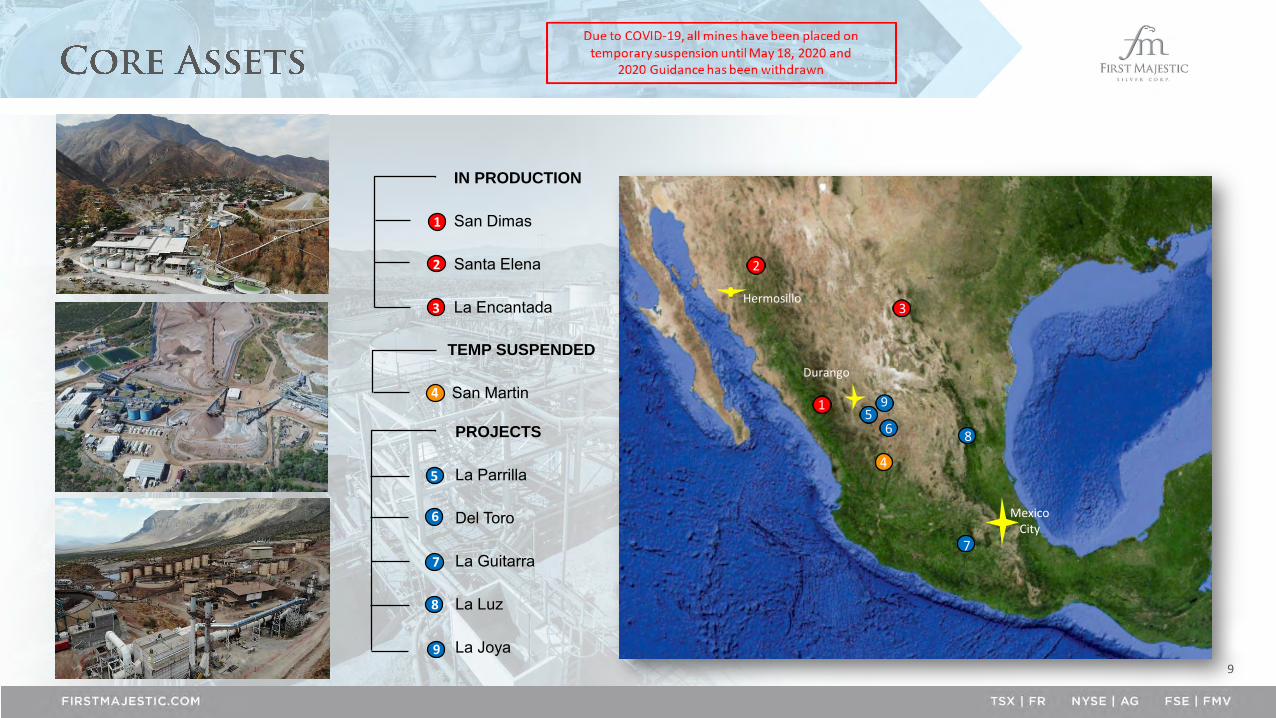
IN PRODUCTION
San Dimas
Santa Elena
La Encantada
4
3
2
1
8
8
Mexico City
PROJECTS
La Parrilla
Del Toro
La Guitarra
La Luz
La Joya
7
Durango
4
Hermosillo
TEMP SUSPENDED
San Martin
5
9
6
7
65
91
2
3

10
0
5
10
15
20
25
30
2009 2010 2011 2012 2013 2014 2015 2016 2017 2018 2019 2020E
Silver Ounces Only
Silv
er
Eq
v. O
un
ces
(M)

11
Mine Silver (Moz) Gold (Koz) Silver Eqv (Moz) Cash Costs ($) AISC ($)
San Dimas 6.5 – 7.2 81 – 90 13.4 – 14.9 2.47 – 3.62 8.28 – 10.10
Santa Elena 2.4 – 2.7 33 – 36 5.2 – 5.8 6.67 – 8.29 9.80 – 11.77
La Encantada 2.9 – 3.3 –– 2.9 – 3.3 12.27 – 13.29 14.96 – 16.29
Totals: 11.8 – 13.2 114 – 126 21.5 – 24.0 $5.76 – $6.97 $13.37 – $15.46
Certain amounts shown may not add exactly to the total amount due to rounding differences.
Consolidated AISC includes Corporate & Administrative cost estimates and non-cash costs of $2.61 to $2.90 per payable silver ounce
Metal price assumptions for calculating equivalents are: silver: $17.00/oz, gold: $1,450/oz
Currency exchange assumption for costs are: 19:1 MXN:USD
12
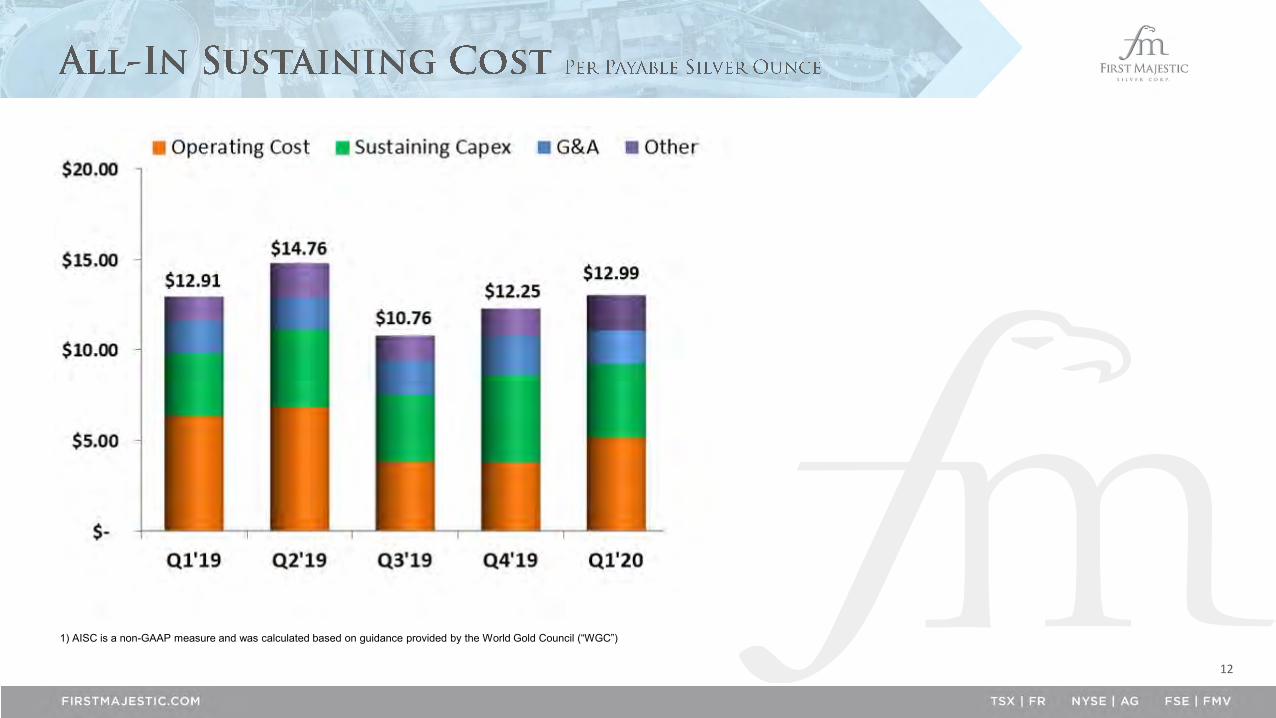
1) AISC is a non-GAAP measure and was calculated based on guidance provided by the World Gold Council (“WGC”)

13
$63M – U/G Development
$28M – Exploration
$33M – PP&E
$47M – Corporate Projects
$1
19
M
Exp
ansi
on
ary
$5
3M
Su
stai
nin
g
2020 CAPEX Include:
*Due to COVID–19, the Company is deferring a
substantial amount of discretionary capital
expenditures to maintain a strong balance sheet.
Furthermore, the Company expects to release an
updated 2020 production, cost and capital
investments guidance in July.
*
14
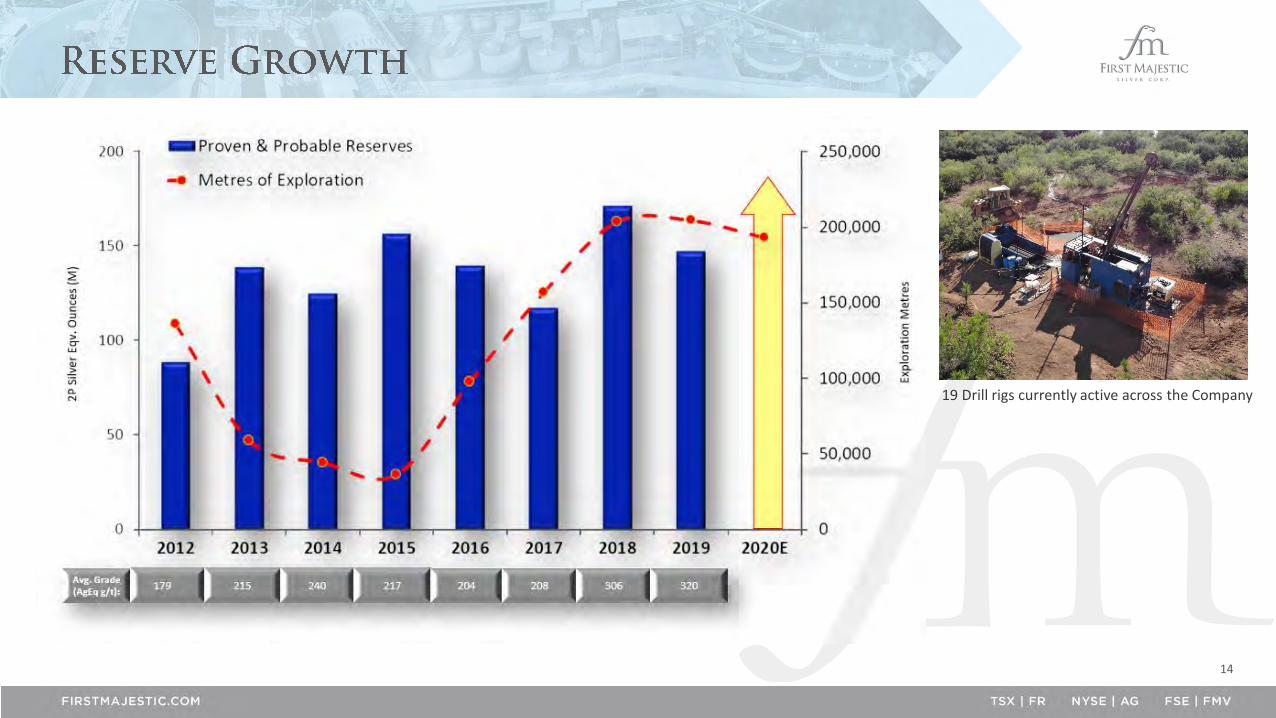
19 Drill rigs currently active across the Company
15
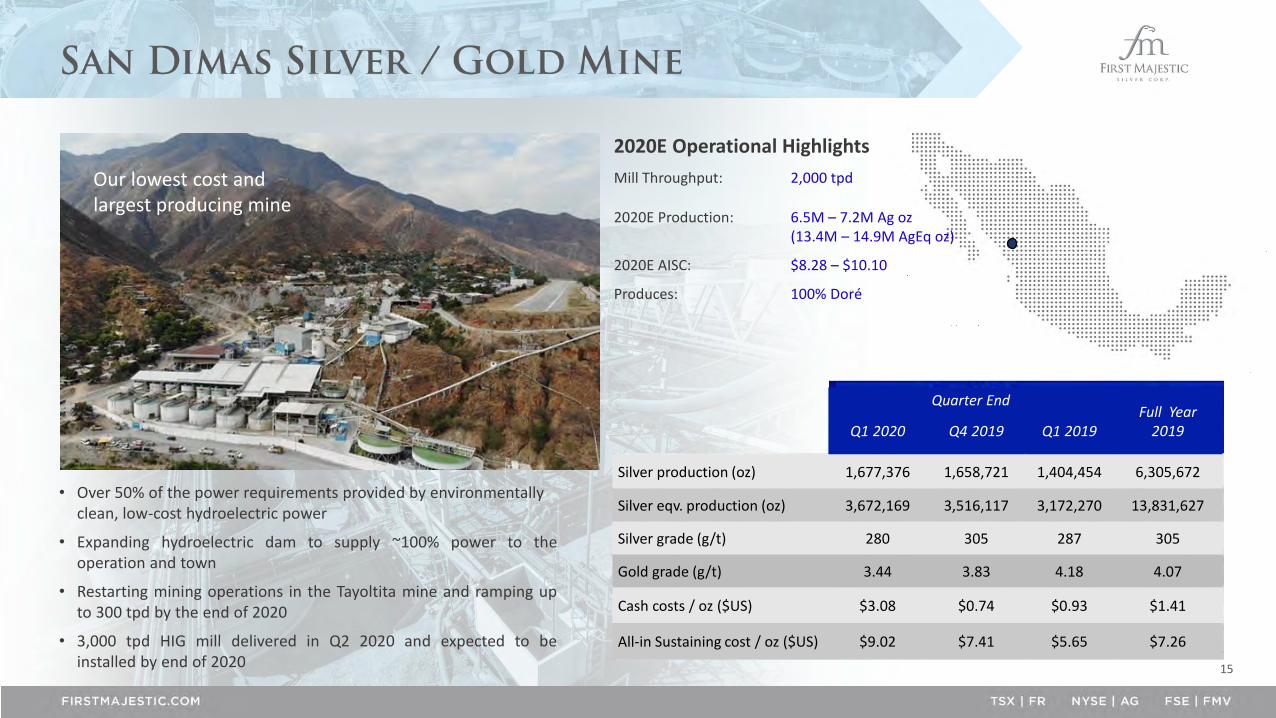
• Over 50% of the power requirements provided by environmentally clean, low-cost hydroelectric power
• Expanding hydroelectric dam to supply ~100% power to theoperation and town
• Restarting mining operations in the Tayoltita mine and ramping upto 300 tpd by the end of 2020
• 3,000 tpd HIG mill delivered in Q2 2020 and expected to beinstalled by end of 2020
Our lowest cost and largest producing mine
Quarter EndFull Year
2019Q1 2020 Q4 2019 Q1 2019
Silver production (oz) 1,677,376 1,658,721 1,404,454 6,305,672
Silver eqv. production (oz) 3,672,169 3,516,117 3,172,270 13,831,627
Silver grade (g/t) 280 305 287 305
Gold grade (g/t) 3.44 3.83 4.18 4.07
Cash costs / oz ($US) $3.08 $0.74 $0.93 $1.41
All-in Sustaining cost / oz ($US) $9.02 $7.41 $5.65 $7.26
2020E Operational Highlights
Mill Throughput: 2,000 tpd
2020E Production: 6.5M – 7.2M Ag oz(13.4M – 14.9M AgEq oz)
2020E AISC: $8.28 – $10.10
Produces: 100% Doré

16
Current mining areas
Restarting the Tayoltita mine in
early 2020
Processing mill
71,867 hectares
• First reported mining in the San Dimas district in 1757 – over 250 years ago
• Considered to be one of the most significant precious metal mining districts in Mexico
• Historic production estimated at 11M Au oz & 580M Ag oz
• Over 500 km of underground development
17
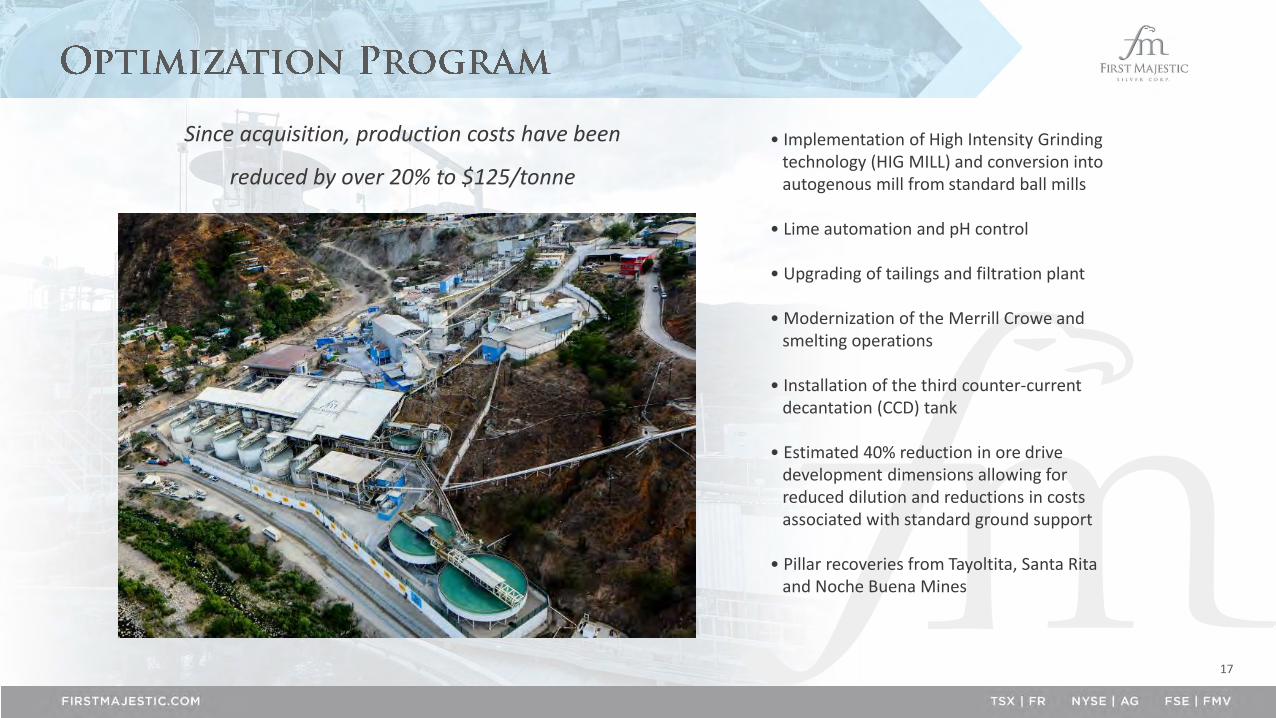
Since acquisition, production costs have been
reduced by over 20% to $125/tonne
• Implementation of High Intensity Grinding technology (HIG MILL) and conversion into autogenous mill from standard ball mills
• Lime automation and pH control
• Upgrading of tailings and filtration plant
• Modernization of the Merrill Crowe and smelting operations
• Installation of the third counter-current decantation (CCD) tank
• Estimated 40% reduction in ore drive development dimensions allowing for reduced dilution and reductions in costs associated with standard ground support
• Pillar recoveries from Tayoltita, Santa Rita and Noche Buena Mines
18
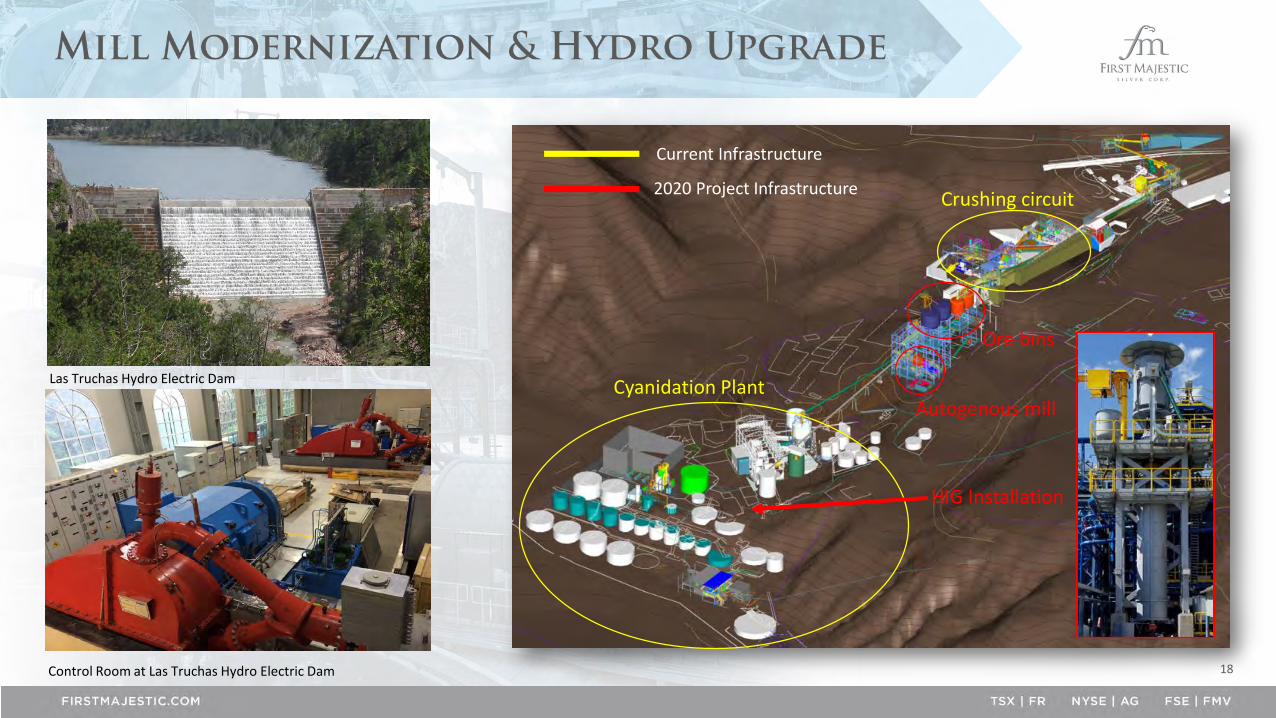
Cyanidation Plant
HIG Installation
Autogenous mill
Crushing circuit
Ore bins
Current Infrastructure
2020 Project Infrastructure
Las Truchas Hydro Electric Dam
Control Room at Las Truchas Hydro Electric Dam
19
20
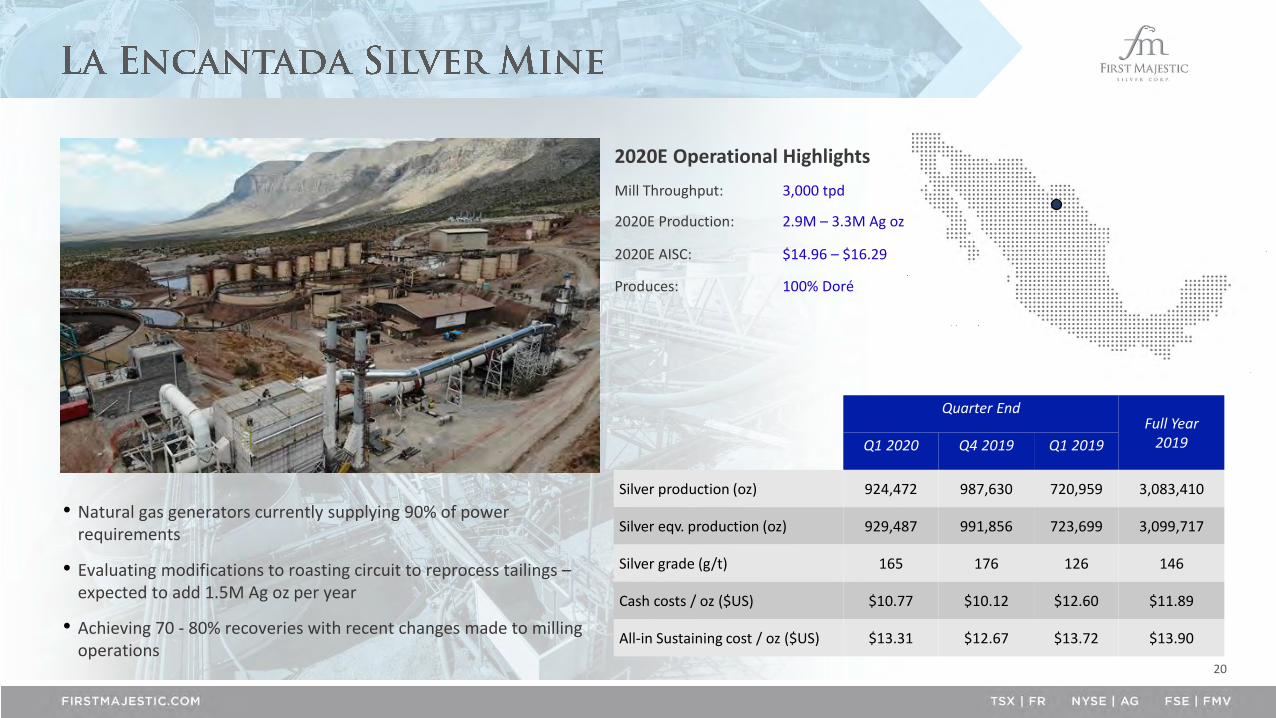
• Natural gas generators currently supplying 90% of power requirements
• Evaluating modifications to roasting circuit to reprocess tailings –expected to add 1.5M Ag oz per year
• Achieving 70 - 80% recoveries with recent changes made to milling operations
Quarter EndFull Year
2019Q1 2020 Q4 2019 Q1 2019
Silver production (oz) 924,472 987,630 720,959 3,083,410
Silver eqv. production (oz) 929,487 991,856 723,699 3,099,717
Silver grade (g/t) 165 176 126 146
Cash costs / oz ($US) $10.77 $10.12 $12.60 $11.89
All-in Sustaining cost / oz ($US) $13.31 $12.67 $13.72 $13.90
2020E Operational Highlights
Mill Throughput: 3,000 tpd
2020E Production: 2.9M – 3.3M Ag oz
2020E AISC: $14.96 – $16.29
Produces: 100% Doré
21
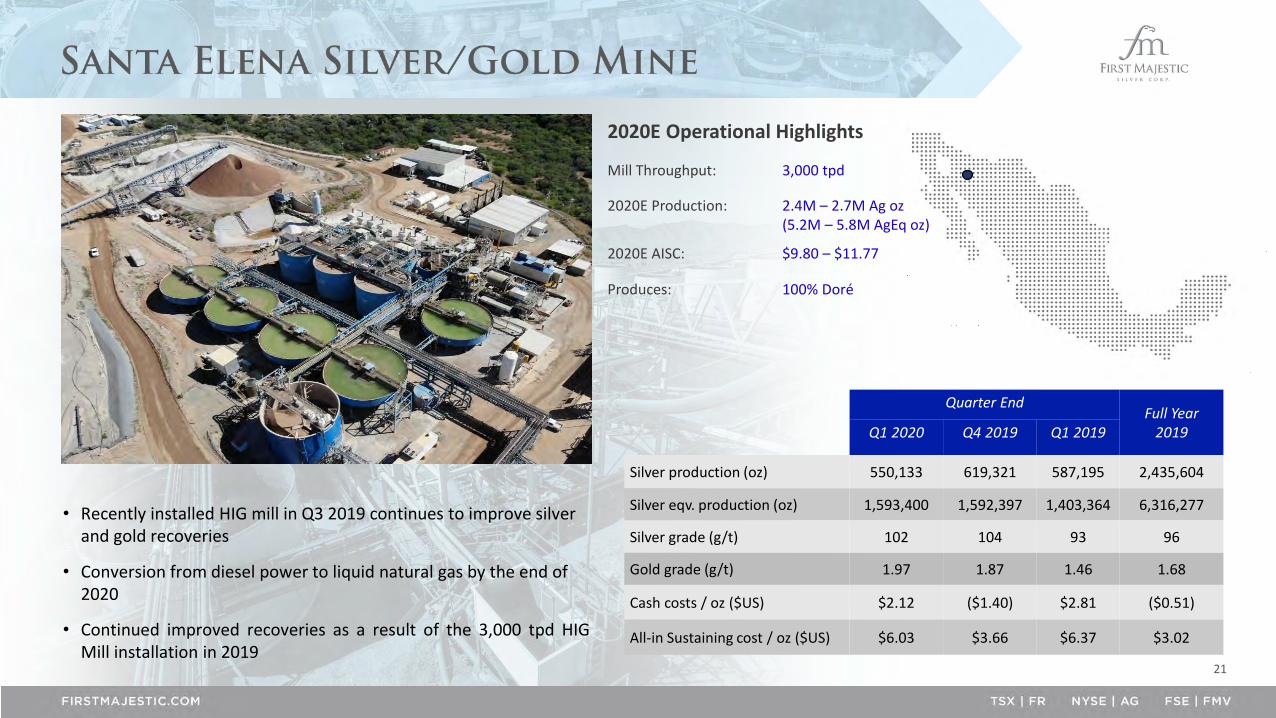
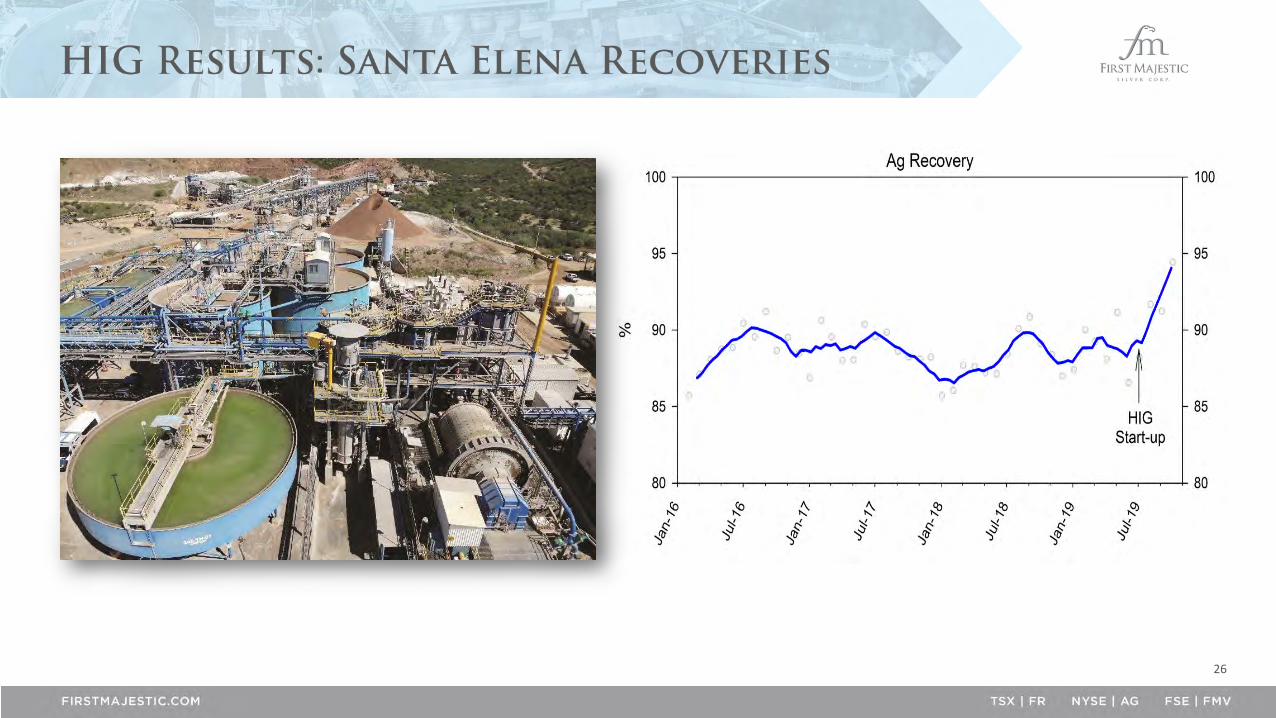
• Recently installed HIG mill in Q3 2019 continues to improve silver and gold recoveries
• Conversion from diesel power to liquid natural gas by the end of 2020
• Continued improved recoveries as a result of the 3,000 tpd HIGMill installation in 2019
Quarter EndFull Year
2019Q1 2020 Q4 2019 Q1 2019
Silver production (oz) 550,133 619,321 587,195 2,435,604
Silver eqv. production (oz) 1,593,400 1,592,397 1,403,364 6,316,277
Silver grade (g/t) 102 104 93 96
Gold grade (g/t) 1.97 1.87 1.46 1.68
Cash costs / oz ($US) $2.12 ($1.40) $2.81 ($0.51)
All-in Sustaining cost / oz ($US) $6.03 $3.66 $6.37 $3.02
2020E Operational Highlights
Mill Throughput: 3,000 tpd
2020E Production: 2.4M – 2.7M Ag oz(5.2M – 5.8M AgEq oz)
2020E AISC: $9.80 – $11.77
Produces: 100% Doré
22
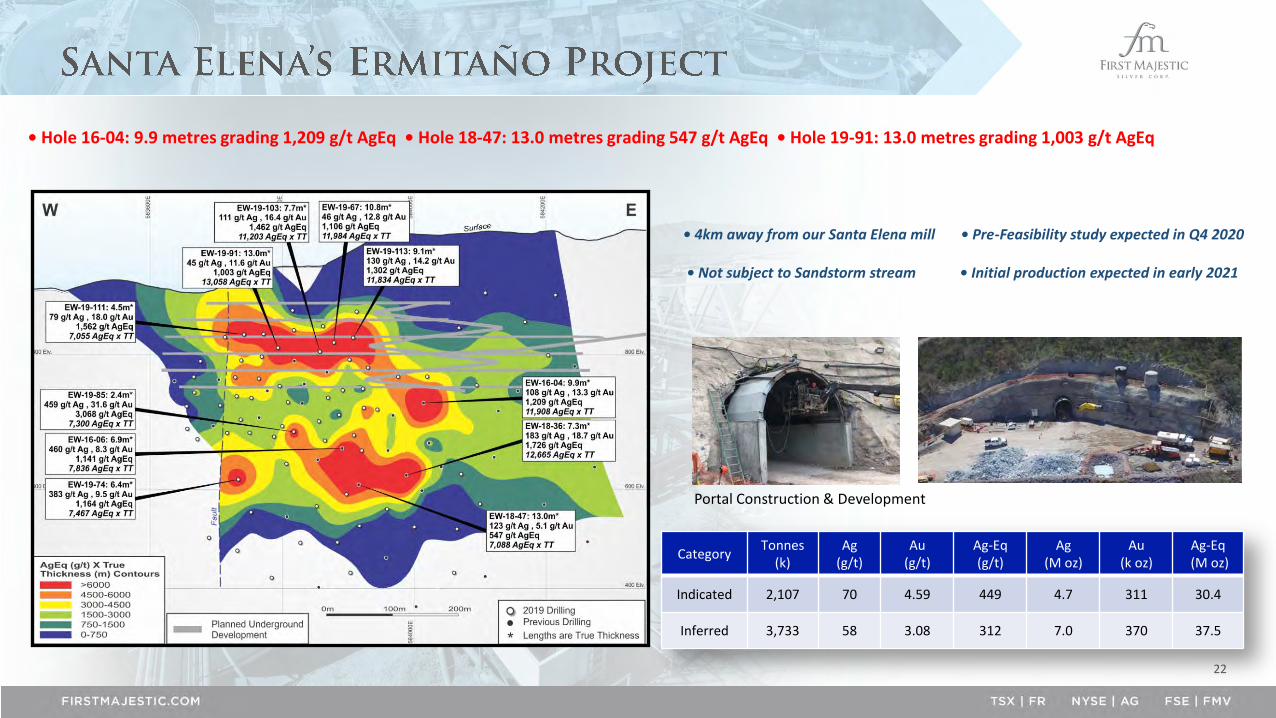
• Hole 16-04: 9.9 metres grading 1,209 g/t AgEq • Hole 18-47: 13.0 metres grading 547 g/t AgEq • Hole 19-91: 13.0 metres grading 1,003 g/t AgEq
• 4km away from our Santa Elena mill • Pre-Feasibility study expected in Q4 2020
• Not subject to Sandstorm stream • Initial production expected in early 2021
CategoryTonnes
(k)Ag
(g/t)Au
(g/t)Ag-Eq (g/t)
Ag (M oz)
Au (k oz)
Ag-Eq(M oz)
Indicated 2,107 70 4.59 449 4.7 311 30.4
Inferred 3,733 58 3.08 312 7.0 370 37.5
Portal Construction & Development

23
Exploration Upside
• Large land package of mining claims covering 102,244 hectares
• New discovery made at Ermitaño in late 2016
• Currently have three rigs drilling at Ermitaño and two rigs atSanta Elena
• Planning 45,500 metres of regional exploration drilling in 2020
Ermitaño Project68M AqEq oz
Santa Elena Silver/Gold Mine36M AqEq oz
Las Chispas
Vein Outcropping at the Ermitaño Project
24
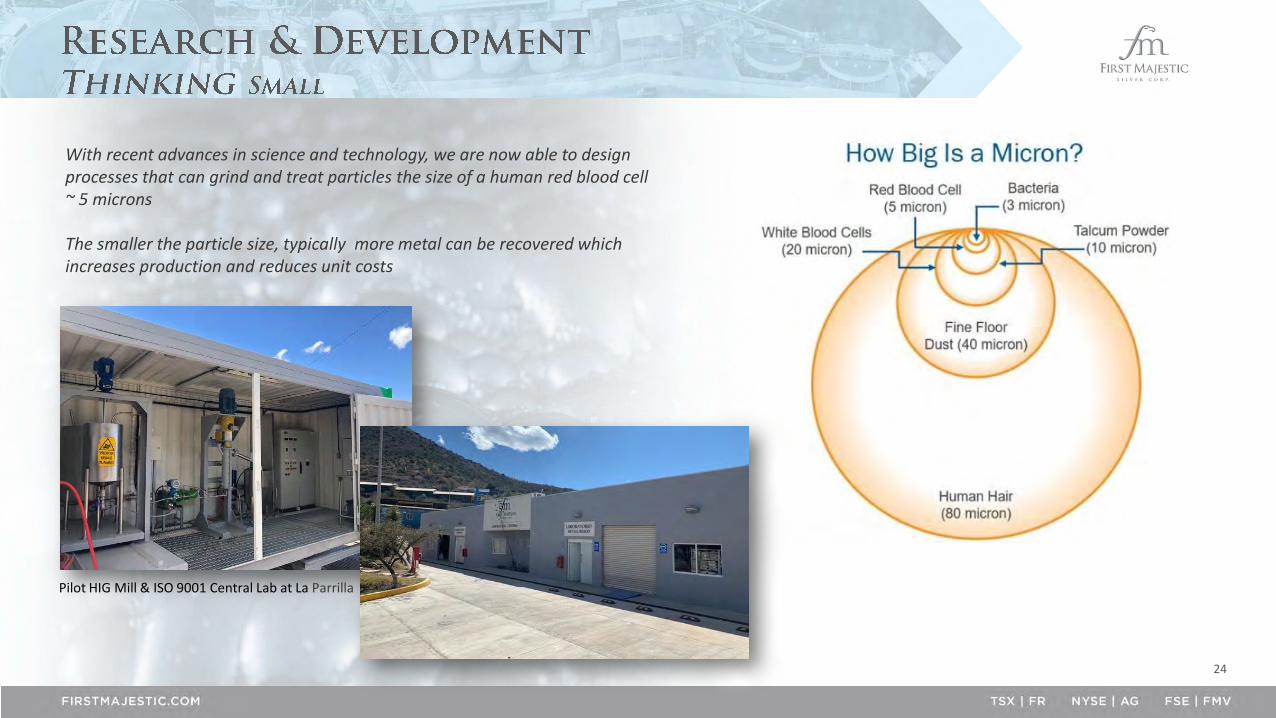
With recent advances in science and technology, we are now able to design processes that can grind and treat particles the size of a human red blood cell ~ 5 microns
The smaller the particle size, typically more metal can be recovered which increases production and reduces unit costs
Pilot HIG Mill & ISO 9001 Central Lab at La Parrilla
25
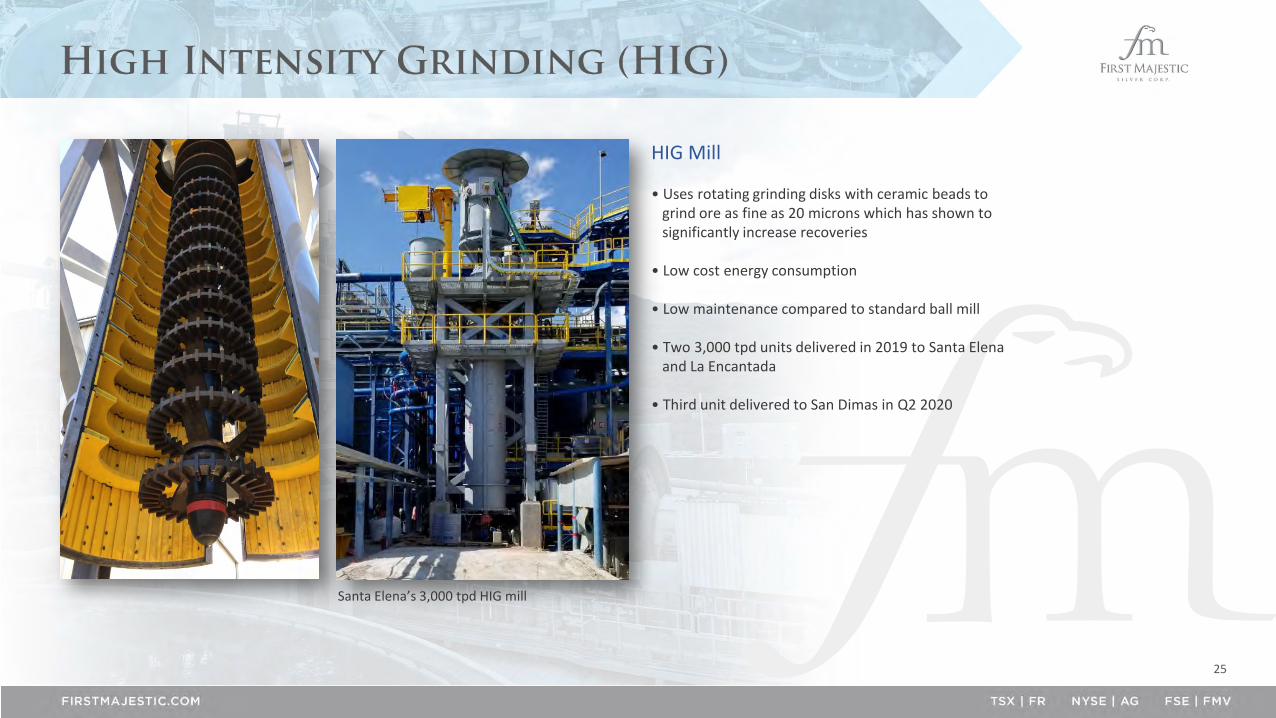
HIG Mill
• Uses rotating grinding disks with ceramic beads to grind ore as fine as 20 microns which has shown to significantly increase recoveries
• Low cost energy consumption
• Low maintenance compared to standard ball mill
• Two 3,000 tpd units delivered in 2019 to Santa Elena and La Encantada
• Third unit delivered to San Dimas in Q2 2020
Santa Elena’s 3,000 tpd HIG mill
26
27
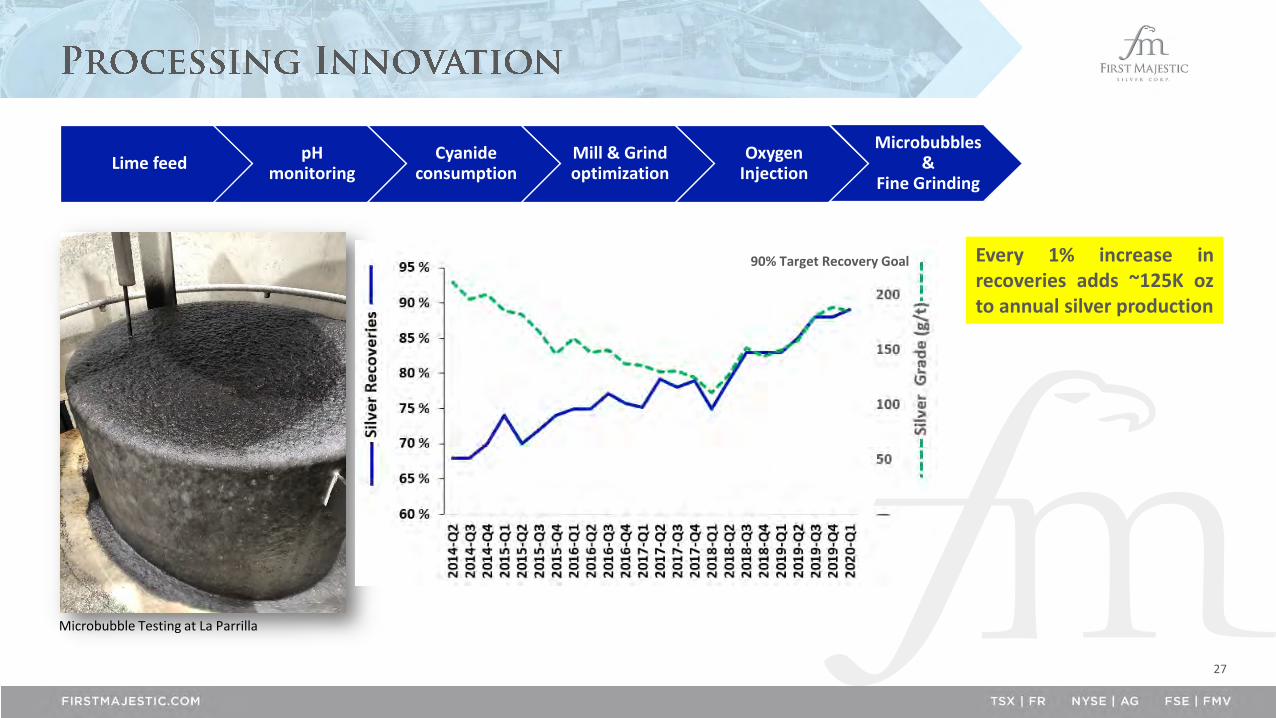
Lime feedpH
monitoringCyanide
consumptionMill & Grind optimization
Oxygen Injection
Microbubbles &
Fine Grinding
Every 1% increase inrecoveries adds ~125K ozto annual silver production
90% Target Recovery Goal
Microbubble Testing at La Parrilla
28
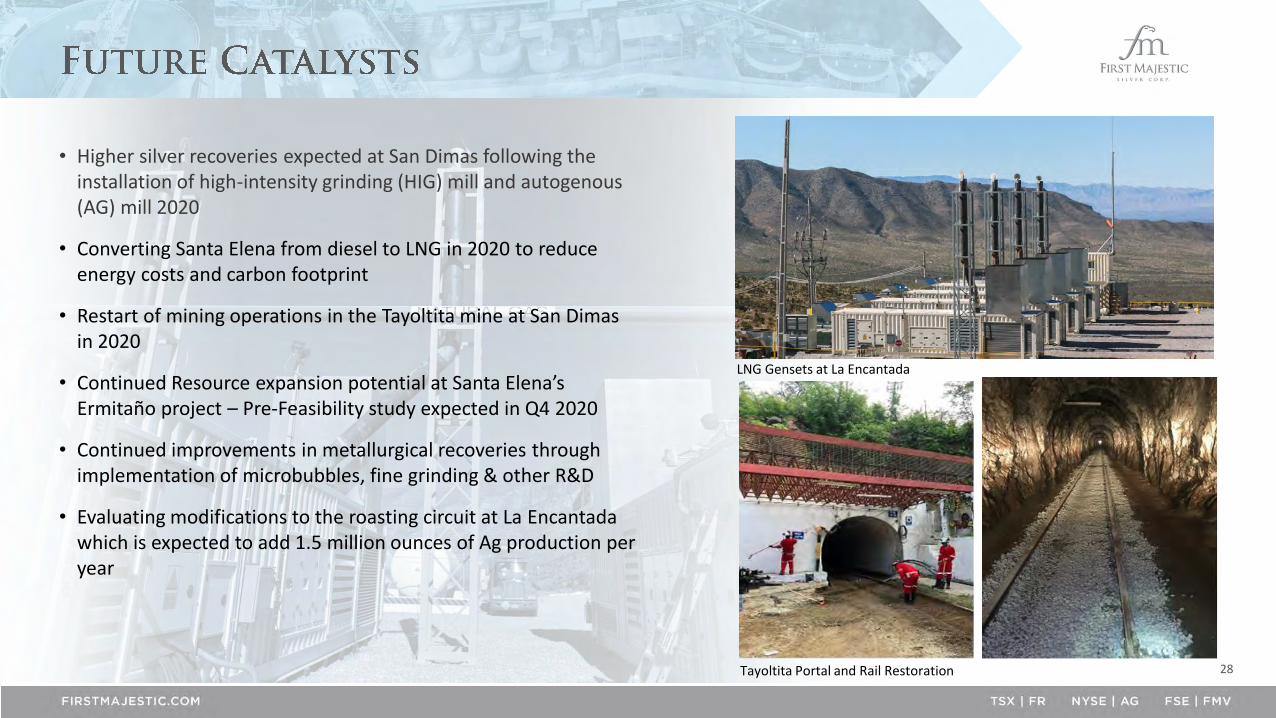
• Higher silver recoveries expected at San Dimas following the installation of high-intensity grinding (HIG) mill and autogenous (AG) mill 2020
• Converting Santa Elena from diesel to LNG in 2020 to reduce energy costs and carbon footprint
• Restart of mining operations in the Tayoltita mine at San Dimas in 2020
• Continued Resource expansion potential at Santa Elena’s Ermitaño project – Pre-Feasibility study expected in Q4 2020
• Continued improvements in metallurgical recoveries through implementation of microbubbles, fine grinding & other R&D
• Evaluating modifications to the roasting circuit at La Encantadawhich is expected to add 1.5 million ounces of Ag production per year
LNG Gensets at La Encantada
Tayoltita Portal and Rail Restoration

29
61%54%
47%40% 36% 34% 30% 27% 26%
15%0%
10%
20%
30%
40%
50%
60%
70%
80%
90%
100%
FirstMajestic
Silvercorp EndeavourSilver
Hochschild Fortuna Fresnillo Hecla PanAmerican
Coeur SSR Mining
Silver Gold Base Metals
Source: BMO SilverPages Report - April 17, 2020 2020 metal price assumptions: silver: $17.33/oz, gold: $1,654/oz, lead: $0.76/lb, zinc: $0.86/lb, copper: $2.33/lb
30
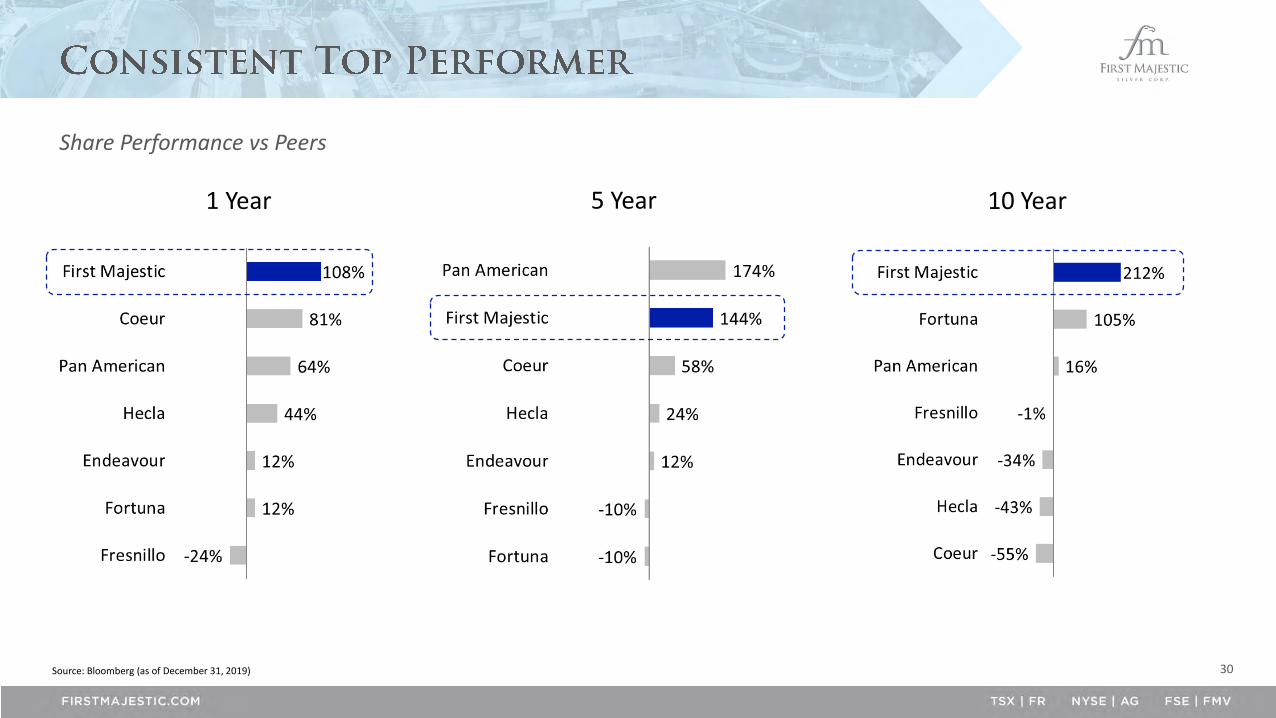
1 Year 5 Year 10 Year
Source: Bloomberg (as of December 31, 2019)
Share Performance vs Peers
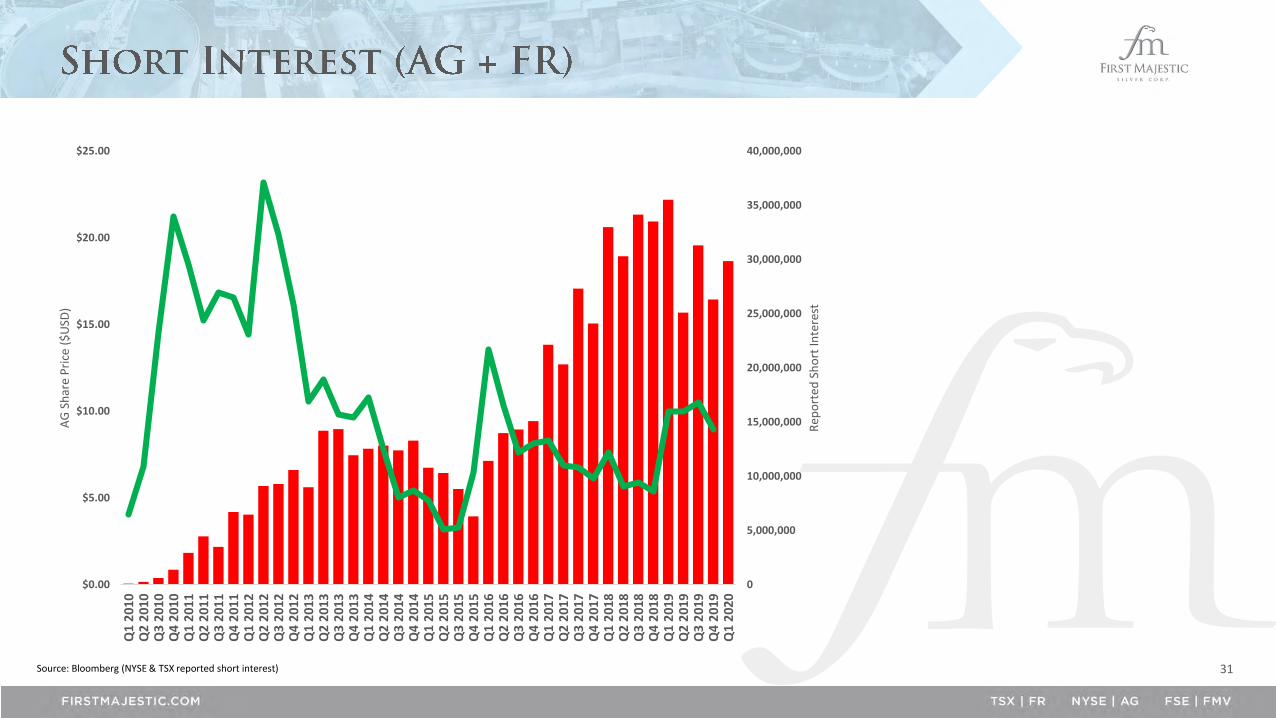
31Source: Bloomberg (NYSE & TSX reported short interest)
0
5,000,000
10,000,000
15,000,000
20,000,000
25,000,000
30,000,000
35,000,000
40,000,000
$0.00
$5.00
$10.00
$15.00
$20.00
$25.00
Q1
20
10Q
2 2
010
Q3
20
10Q
4 2
010
Q1
20
11Q
2 2
011
Q3
20
11Q
4 2
011
Q1
20
12Q
2 2
012
Q3
20
12Q
4 2
012
Q1
20
13Q
2 2
013
Q3
20
13Q
4 2
013
Q1
20
14Q
2 2
014
Q3
20
14Q
4 2
014
Q1
20
15Q
2 2
015
Q3
20
15Q
4 2
015
Q1
20
16Q
2 2
016
Q3
20
16Q
4 2
016
Q1
201
7Q
2 2
017
Q3
20
17Q
4 2
017
Q1
20
18Q
2 2
018
Q3
20
18Q
4 2
018
Q1
20
19Q
2 2
019
Q3
20
19Q
4 2
019
Q1
20
20
Rep
ort
ed S
ho
rt In
tere
st
AG
Sh
are
Pri
ce (
$U
SD)
32
Our Strategy…
> Continue to Acquire the Best Talent in Mexico
> Build through Development and Acquisitions
> Continued Investments in R&D
> Industry Leader in Innovation and Processing Technologies
> Become World’s Largest Primary Silver Producer

33
• Ongoing testing of new microbubble flotation columns in 2020
• Dual-circuit processing facility consisting of a 1,000 tpd cyanidation circuit and a 1,000 tpd flotation circuit
• Mining concessions consist of 69,748 hectares
• Operations were suspended in 2019
La ParrillaSilver Mine
Del ToroSilver Mine
San MartinSilver Mine
• Property consists of 70 mining claims covering 2,159 hectares
• 1,000 tpd flotation circuit capable of producing lead-silver and zinc concentrates
• Operations were suspended in 2020
• 100% Silver/Gold doré producer
• Property consists of 33 mining claims within 38,512 hectares
• Operations were suspended in 2019
Silver Gold Lead Zinc
24.2Moz
10Koz
114MIbs
66MIbs
ProductionSince 2005
Silver Gold Lead Zinc
10.2Moz 2K
oz
109MIbs
2MIbs
ProductionSince 2013
Silver Gold
18.5Moz 39K
oz
ProductionSince 2006
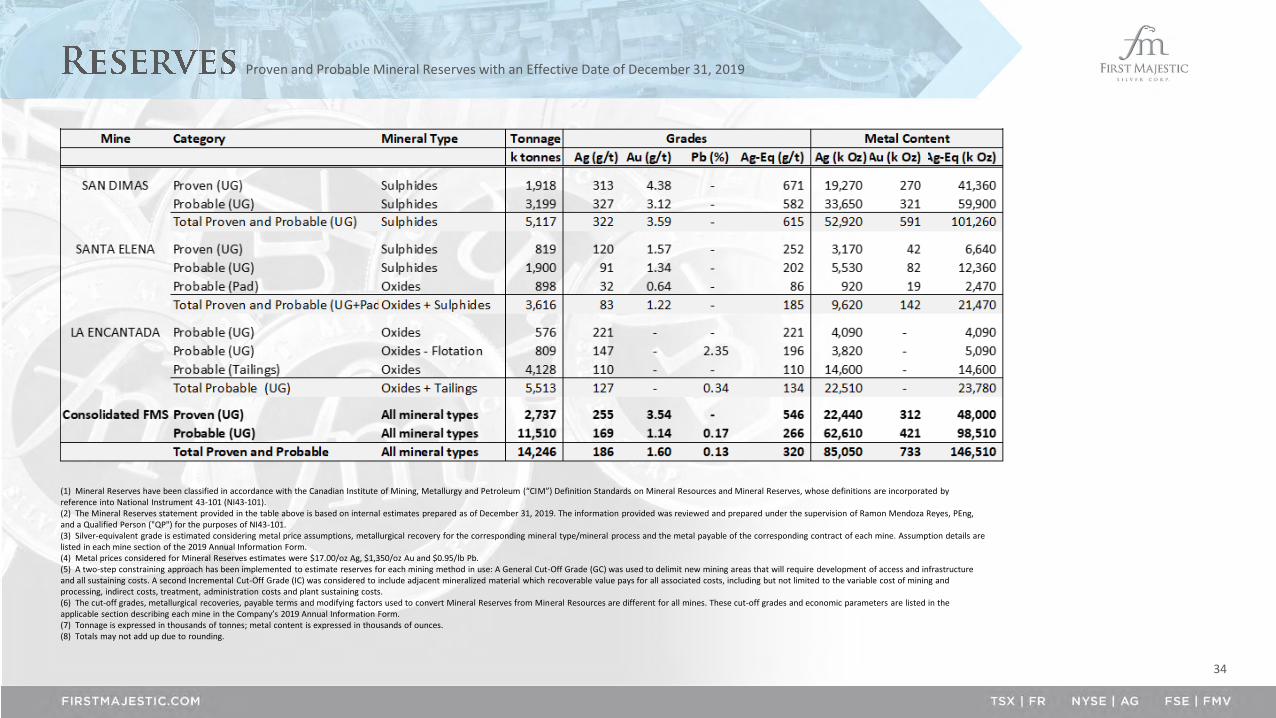
Proven and Probable Mineral Reserves with an Effective Date of December 31, 2019
34
(1) Mineral Reserves have been classified in accordance with the Canadian Institute of Mining, Metallurgy and Petroleum (“CIM”) Definition Standards on Mineral Resources and Mineral Reserves, whose definitions are incorporated by reference into National Instrument 43-101 (NI43-101).(2) The Mineral Reserves statement provided in the table above is based on internal estimates prepared as of December 31, 2019. The information provided was reviewed and prepared under the supervision of Ramon Mendoza Reyes, PEng, and a Qualified Person ("QP") for the purposes of NI43-101.(3) Silver-equivalent grade is estimated considering metal price assumptions, metallurgical recovery for the corresponding mineral type/mineral process and the metal payable of the corresponding contract of each mine. Assumption details are listed in each mine section of the 2019 Annual Information Form.(4) Metal prices considered for Mineral Reserves estimates were $17.00/oz Ag, $1,350/oz Au and $0.95/lb Pb.(5) A two-step constraining approach has been implemented to estimate reserves for each mining method in use: A General Cut-Off Grade (GC) was used to delimit new mining areas that will require development of access and infrastructure and all sustaining costs. A second Incremental Cut-Off Grade (IC) was considered to include adjacent mineralized material which recoverable value pays for all associated costs, including but not limited to the variable cost of mining and processing, indirect costs, treatment, administration costs and plant sustaining costs.(6) The cut-off grades, metallurgical recoveries, payable terms and modifying factors used to convert Mineral Reserves from Mineral Resources are different for all mines. These cut-off grades and economic parameters are listed in the applicable section describing each mine in the Company’s 2019 Annual Information Form.(7) Tonnage is expressed in thousands of tonnes; metal content is expressed in thousands of ounces.(8) Totals may not add up due to rounding.

Measured and indicated mineral resources with an effective date of December 31, 2019
35
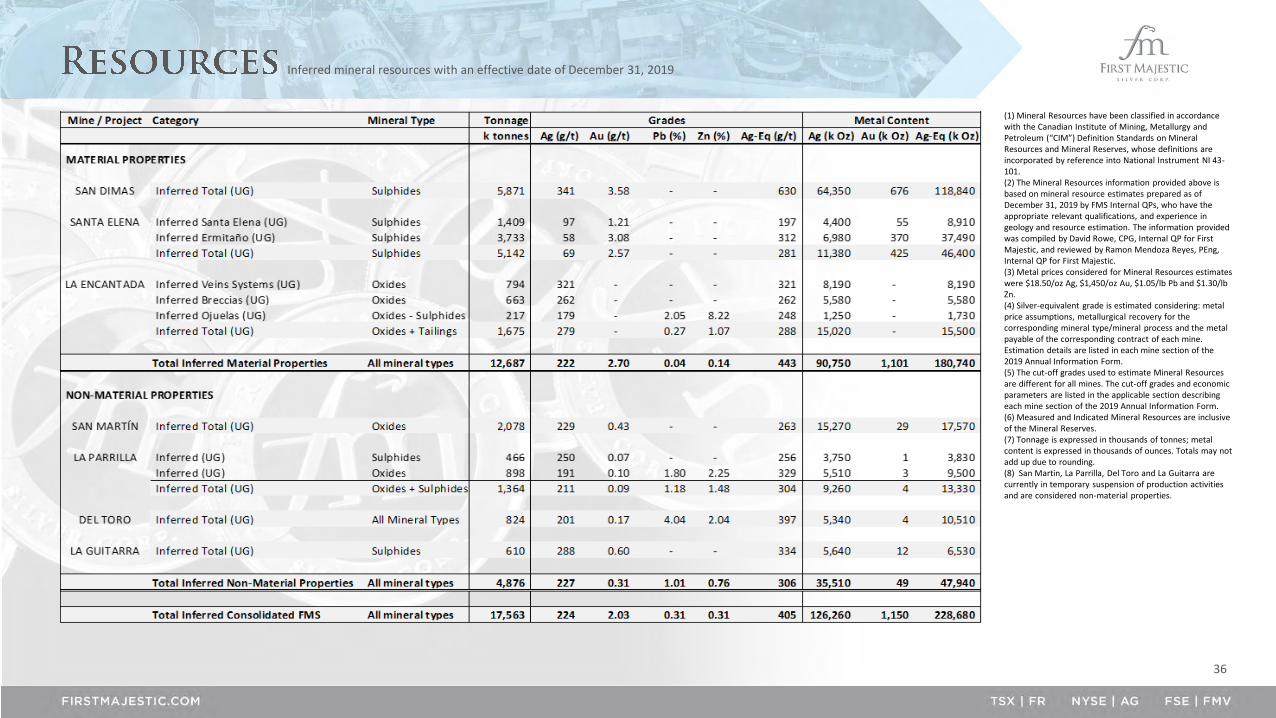
Inferred mineral resources with an effective date of December 31, 2019
36
(1) Mineral Resources have been classified in accordance with the Canadian Institute of Mining, Metallurgy and Petroleum (“CIM”) Definition Standards on Mineral Resources and Mineral Reserves, whose definitions are incorporated by reference into National Instrument NI 43-101.(2) The Mineral Resources information provided above is based on mineral resource estimates prepared as of December 31, 2019 by FMS Internal QPs, who have the appropriate relevant qualifications, and experience in geology and resource estimation. The information provided was compiled by David Rowe, CPG, Internal QP for First Majestic, and reviewed by Ramon Mendoza Reyes, PEng, Internal QP for First Majestic.(3) Metal prices considered for Mineral Resources estimates were $18.50/oz Ag, $1,450/oz Au, $1.05/lb Pb and $1.30/lbZn.(4) Silver-equivalent grade is estimated considering: metal price assumptions, metallurgical recovery for the corresponding mineral type/mineral process and the metal payable of the corresponding contract of each mine. Estimation details are listed in each mine section of the 2019 Annual Information Form.(5) The cut-off grades used to estimate Mineral Resources are different for all mines. The cut-off grades and economic parameters are listed in the applicable section describing each mine section of the 2019 Annual Information Form. (6) Measured and Indicated Mineral Resources are inclusive of the Mineral Reserves.(7) Tonnage is expressed in thousands of tonnes; metal content is expressed in thousands of ounces. Totals may not add up due to rounding.(8) San Martin, La Parrilla, Del Toro and La Guitarra are currently in temporary suspension of production activities and are considered non-material properties.

First Majestic Silver Corp.
1800 - 925 West Georgia Street
Vancouver, British Columbia, Canada
V6C3L2
Email: [email protected]
Tel: 604.688.3033
Fax: 604.639.8873
North American Toll-Free: 1.866.529.2807
Bullion Sales Email: [email protected]