cb insights asia-tech-investment-report
TRANSCRIPT
THE ASIA TECH INVESTMENT REPORTA comprehensive, data-driven look at technology investment trends, top deals,
active investors and strategic activity in Asia.
May 23, 2017
The technology market intelligence platform.
CB Insights software lets you predict, discuss, and
communicate emerging technology trends using data in ways that are beyond human cognition.
www.cbinsights.com 2
www.cbinsights.com 3See what other customers have to say at http://www.cbinsights.com/customer-love
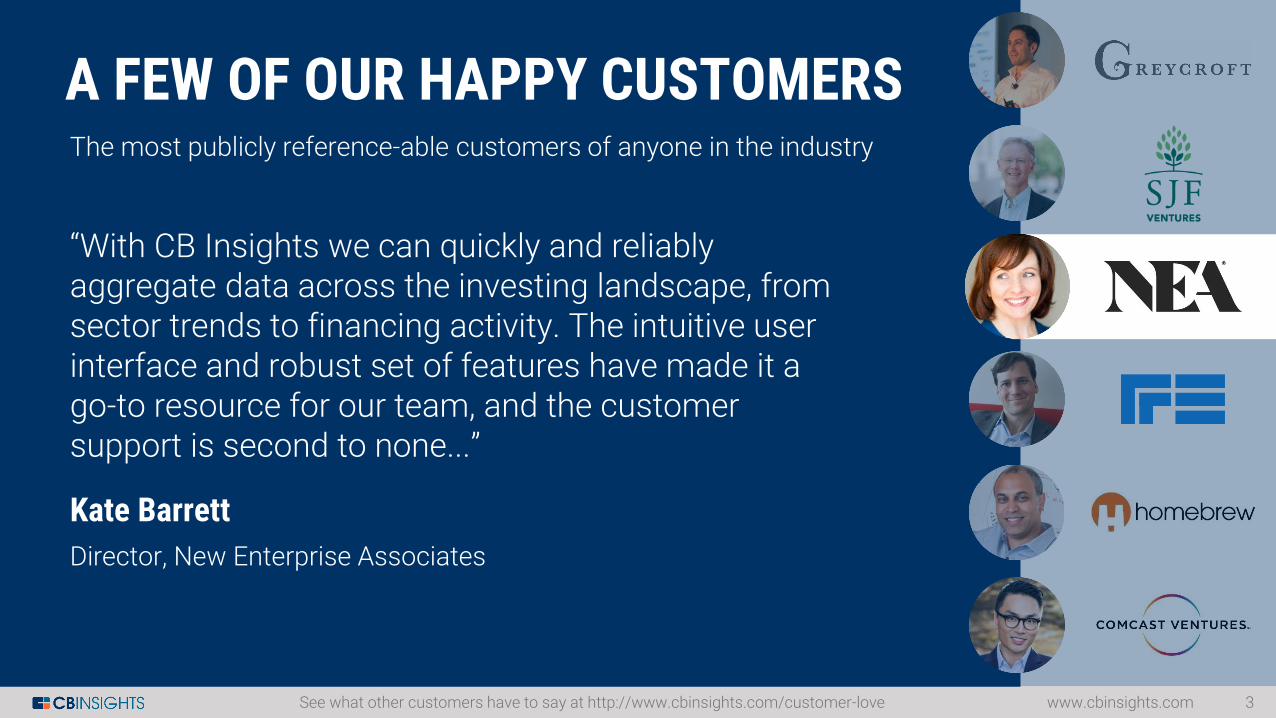
The most publicly reference-able customers of anyone in the industry
A FEW OF OUR HAPPY CUSTOMERS
Kate Barrett
Director, New Enterprise Associates
“With CB Insights we can quickly and reliably aggregate data across the investing landscape, from sector trends to financing activity. The intuitive user interface and robust set of features have made it a go-to resource for our team, and the customer support is second to none...”
www.cbinsights.com 4
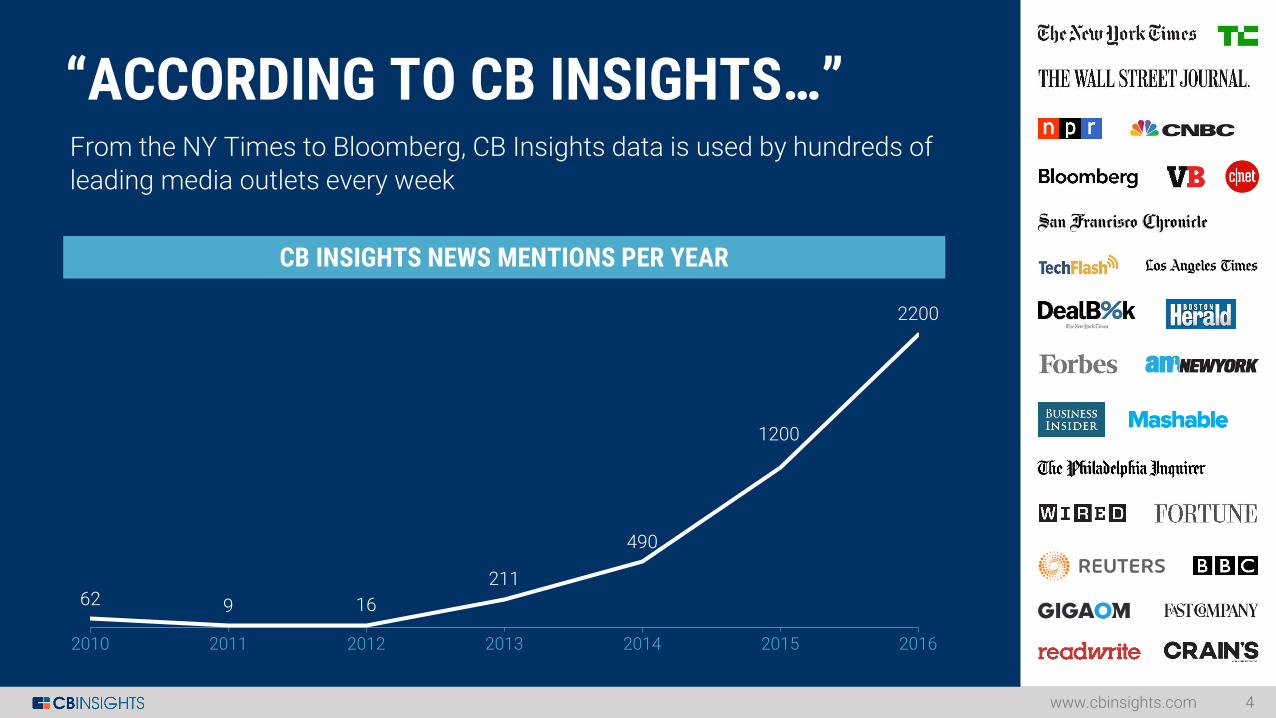
From the NY Times to Bloomberg, CB Insights data is used by hundreds of
leading media outlets every week
“ACCORDING TO CB INSIGHTS…”
CB INSIGHTS NEWS MENTIONS PER YEAR
62 9 16
211
490
1200
2200
2010 2011 2012 2013 2014 2015 2016
www.cbinsights.com 5
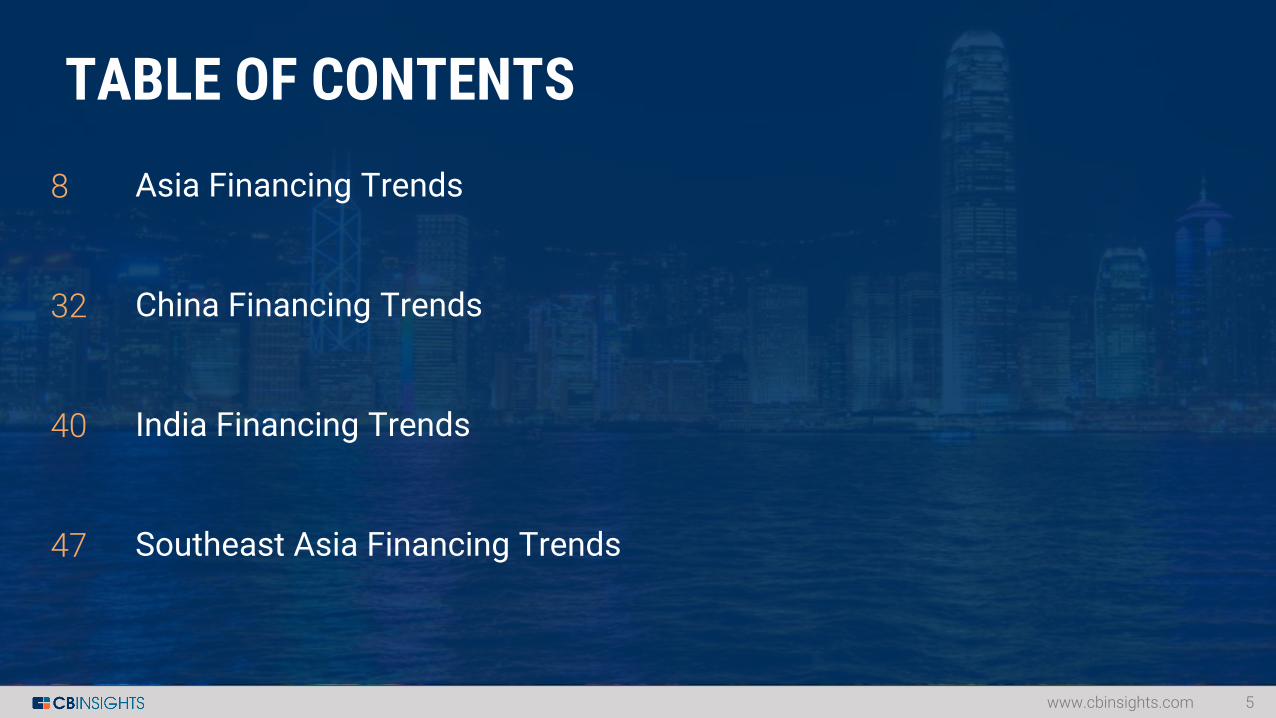
TABLE OF CONTENTS
Asia Financing Trends
China Financing Trends
India Financing Trends
Southeast Asia Financing Trends
8
32
40
47
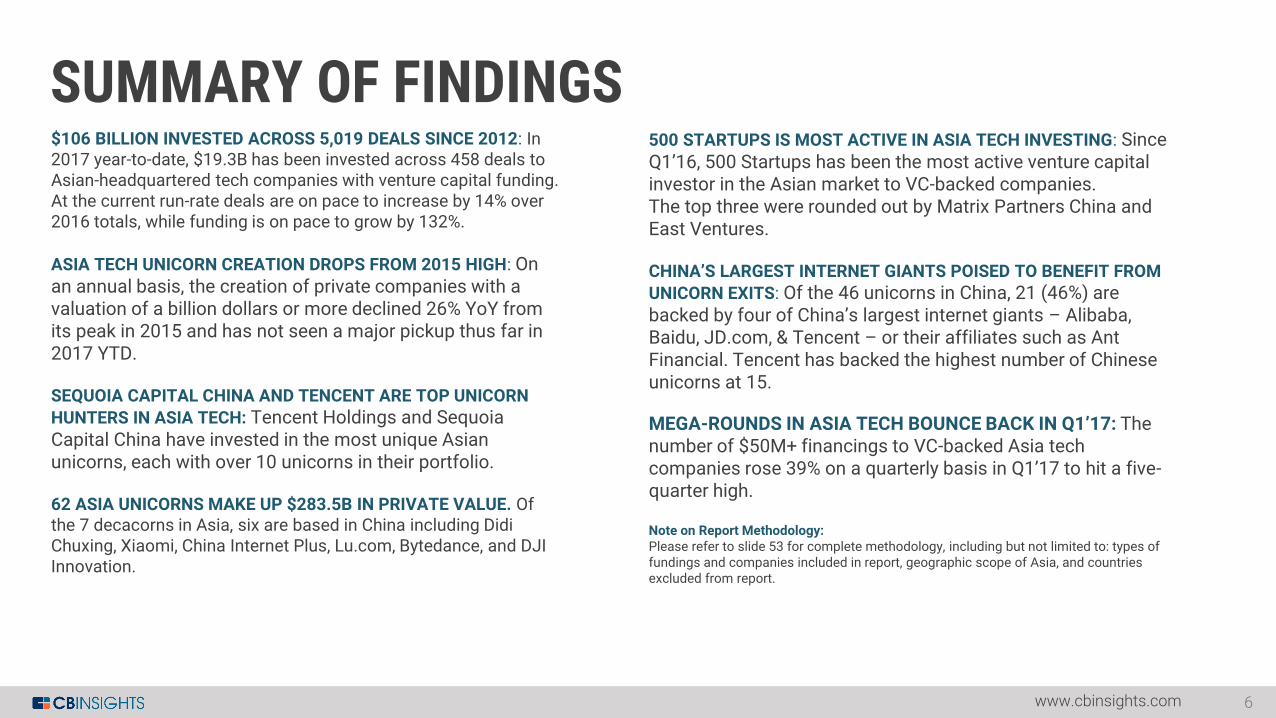
SUMMARY OF FINDINGS
6www.cbinsights.com
500 STARTUPS IS MOST ACTIVE IN ASIA TECH INVESTING: Since Q1’16, 500 Startups has been the most active venture capital investor in the Asian market to VC-backed companies. The top three were rounded out by Matrix Partners China and East Ventures.
CHINA’S LARGEST INTERNET GIANTS POISED TO BENEFIT FROM
UNICORN EXITS: Of the 46 unicorns in China, 21 (46%) are backed by four of China’s largest internet giants – Alibaba, Baidu, JD.com, & Tencent – or their affiliates such as Ant Financial. Tencent has backed the highest number of Chinese unicorns at 15.
MEGA-ROUNDS IN ASIA TECH BOUNCE BACK IN Q1’17: The number of $50M+ financings to VC-backed Asia tech companies rose 39% on a quarterly basis in Q1’17 to hit a five-quarter high.
Note on Report Methodology:Please refer to slide 53 for complete methodology, including but not limited to: types of fundings and companies included in report, geographic scope of Asia, and countries excluded from report.
$106 BILLION INVESTED ACROSS 5,019 DEALS SINCE 2012: In 2017 year-to-date, $19.3B has been invested across 458 deals to Asian-headquartered tech companies with venture capital funding. At the current run-rate deals are on pace to increase by 14% over 2016 totals, while funding is on pace to grow by 132%.
ASIA TECH UNICORN CREATION DROPS FROM 2015 HIGH: On an annual basis, the creation of private companies with a valuation of a billion dollars or more declined 26% YoY from its peak in 2015 and has not seen a major pickup thus far in 2017 YTD.
SEQUOIA CAPITAL CHINA AND TENCENT ARE TOP UNICORN
HUNTERS IN ASIA TECH: Tencent Holdings and Sequoia Capital China have invested in the most unique Asian unicorns, each with over 10 unicorns in their portfolio.
62 ASIA UNICORNS MAKE UP $283.5B IN PRIVATE VALUE. Of the 7 decacorns in Asia, six are based in China including Didi Chuxing, Xiaomi, China Internet Plus, Lu.com, Bytedance, and DJI Innovation.
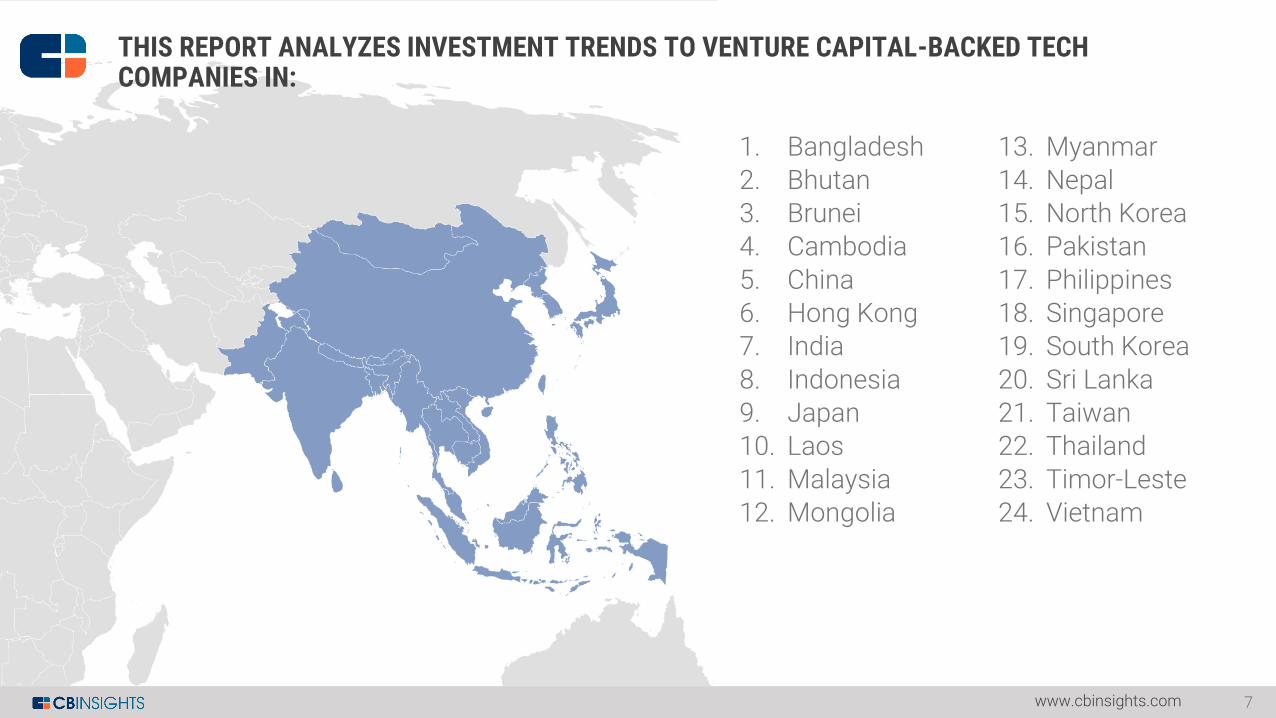
THIS REPORT ANALYZES INVESTMENT TRENDS TO VENTURE CAPITAL-BACKED TECH COMPANIES IN:
7www.cbinsights.com
1. Bangladesh
2. Bhutan3. Brunei4. Cambodia
5. China6. Hong Kong7. India
8. Indonesia9. Japan10. Laos
11. Malaysia12. Mongolia
13. Myanmar
14. Nepal15. North Korea16. Pakistan
17. Philippines18. Singapore19. South Korea
20. Sri Lanka21. Taiwan22. Thailand
23. Timor-Leste24. Vietnam
ASIATECH INVESTMENT TRENDS
www.cbinsights.com 8
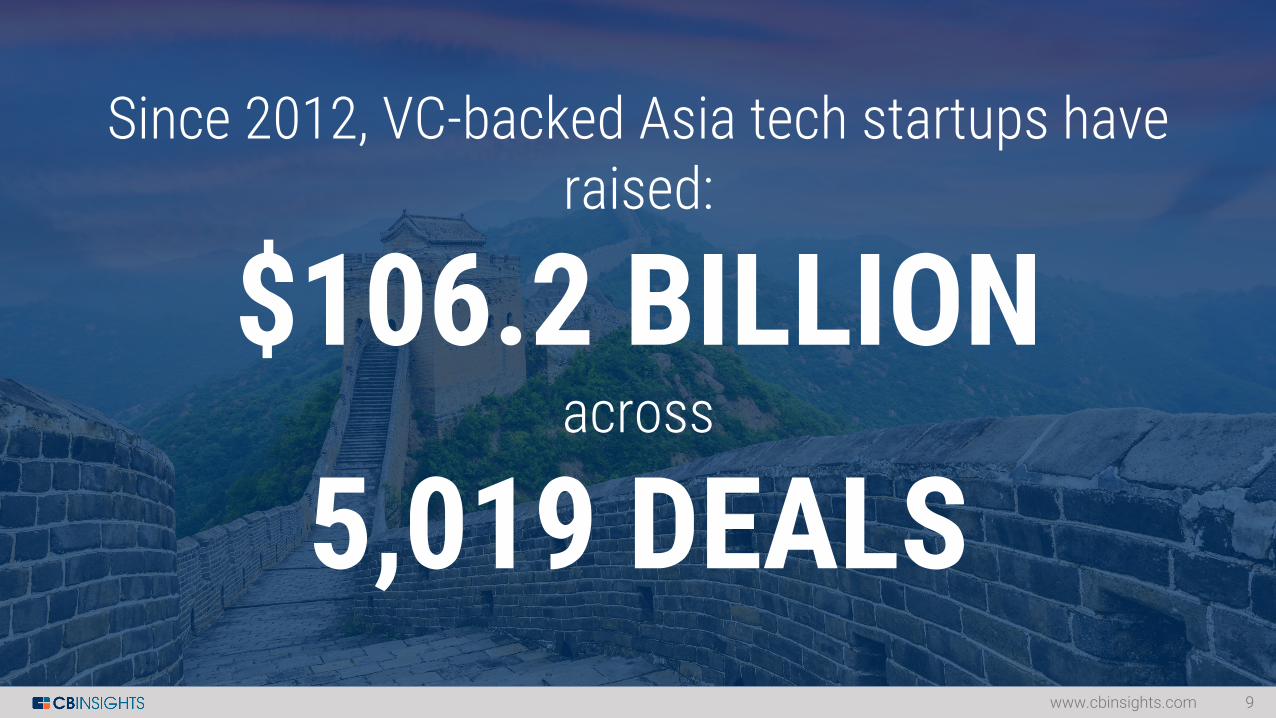
Since 2012, VC-backed Asia tech startups have raised:
$106.2 BILLIONacross
5,019 DEALSwww.cbinsights.com 9
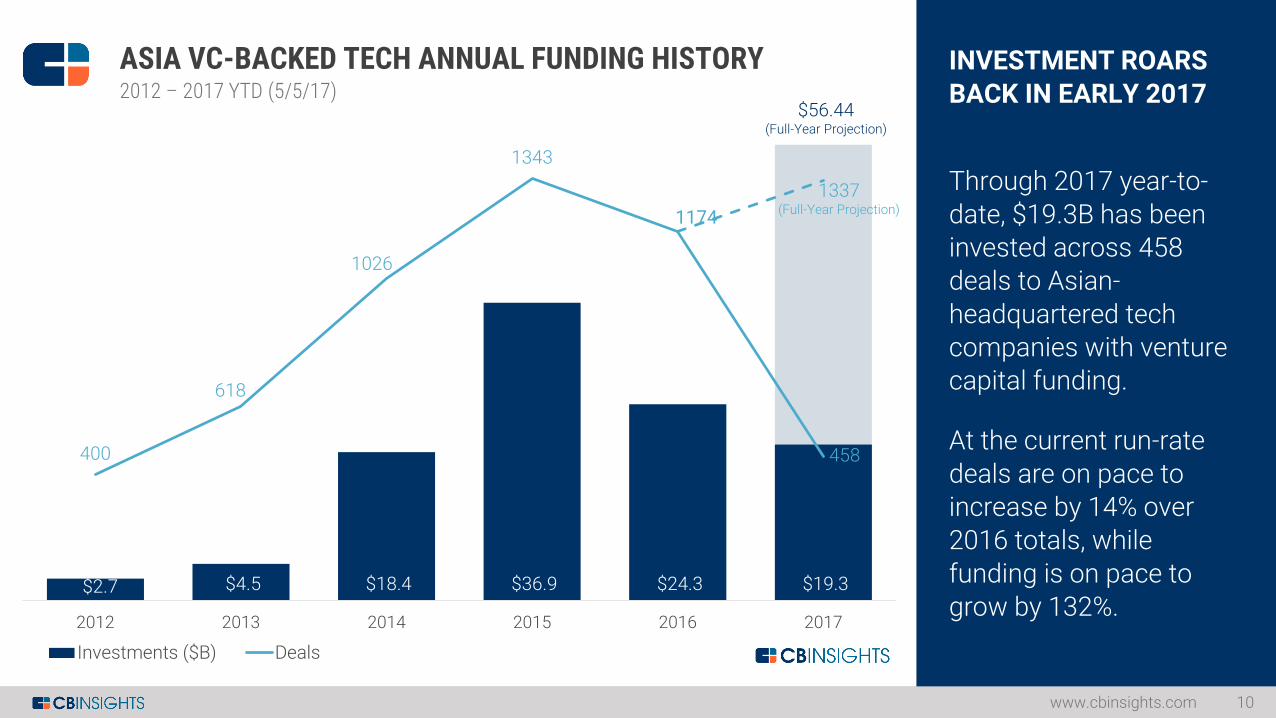
ASIA VC-BACKED TECH ANNUAL FUNDING HISTORY INVESTMENT ROARS
BACK IN EARLY 2017
Through 2017 year-to-
date, $19.3B has been invested across 458 deals to Asian-
headquartered tech companies with venture capital funding.
At the current run-rate
deals are on pace to increase by 14% over 2016 totals, while
funding is on pace to grow by 132%.
www.cbinsights.com 10
2012 – 2017 YTD (5/5/17)
$2.7 $4.5 $18.4 $36.9 $24.3 $19.3
400
618
1026
1343
1174
458
2012 2013 2014 2015 2016 2017
Investments ($B) Deals
$56.44(Full-Year Projection)
1337(Full-Year Projection)
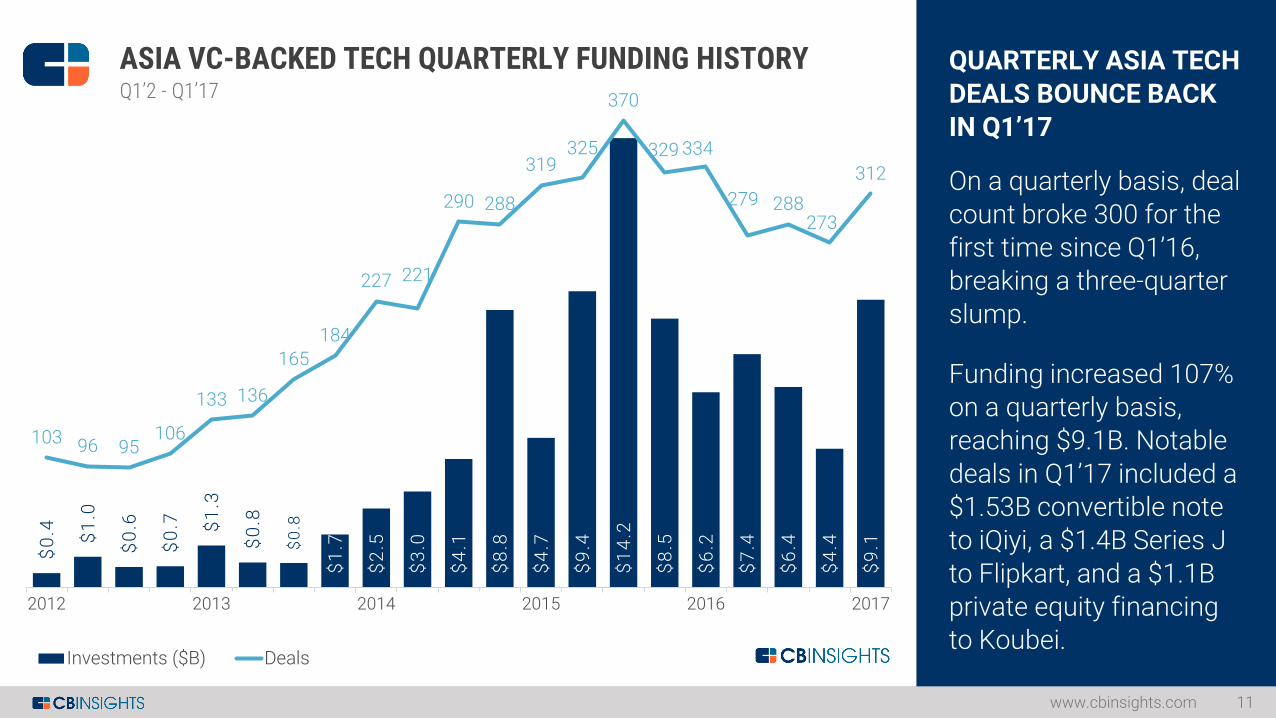
QUARTERLY ASIA TECH
DEALS BOUNCE BACK IN Q1’17
On a quarterly basis, deal
count broke 300 for the first time since Q1’16, breaking a three-quarter
slump.
Funding increased 107% on a quarterly basis, reaching $9.1B. Notable
deals in Q1’17 included a $1.53B convertible note to iQiyi, a $1.4B Series J
to Flipkart, and a $1.1B private equity financing to Koubei.
www.cbinsights.com 11
ASIA VC-BACKED TECH QUARTERLY FUNDING HISTORYQ1’2 - Q1’17
$0
.4
$1
.0
$0
.6
$0
.7
$1
.3
$0
.8
$0
.8
$1
.7
$2
.5
$3
.0
$4
.1
$8
.8
$4
.7
$9
.4
$1
4.2
$8
.5
$6
.2
$7
.4
$6
.4
$4
.4
$9
.1
103 96 95106
133 136
165
184
227 221
290 288
319325
370
329 334
279 288273
312
2012 2013 2014 2015 2016 2017
Investments ($B) Deals
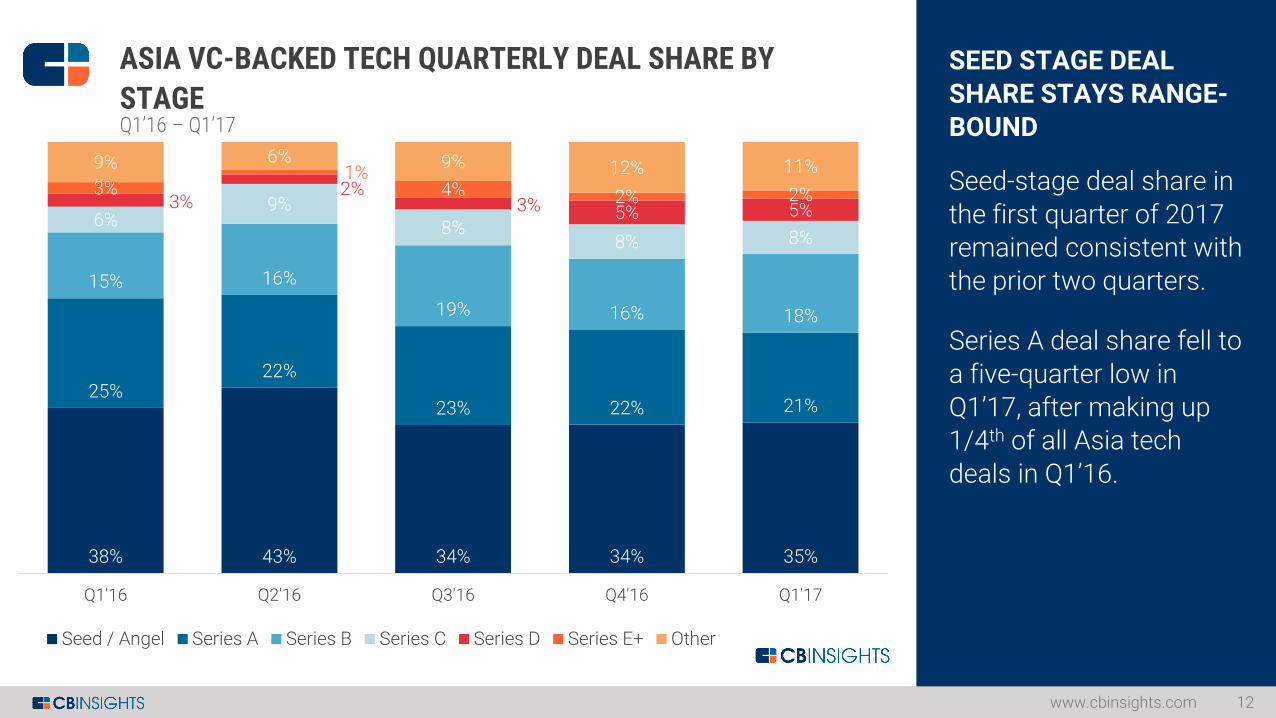
38% 43% 34% 34% 35%
25%22%
23% 22% 21%
15% 16%
19% 16% 18%
6%9%
8%8% 8%
3%2%
3% 5% 5%3%
1%4% 2% 2%
9% 6% 9% 12% 11%
Q1'16 Q2'16 Q3'16 Q4'16 Q1'17
Seed / Angel Series A Series B Series C Series D Series E+ Other
SEED STAGE DEAL
SHARE STAYS RANGE-BOUND
Seed-stage deal share in
the first quarter of 2017 remained consistent with the prior two quarters.
Series A deal share fell to
a five-quarter low in Q1’17, after making up 1/4th of all Asia tech
deals in Q1’16.
www.cbinsights.com 12
ASIA VC-BACKED TECH QUARTERLY DEAL SHARE BY
STAGEQ1’16 – Q1’17
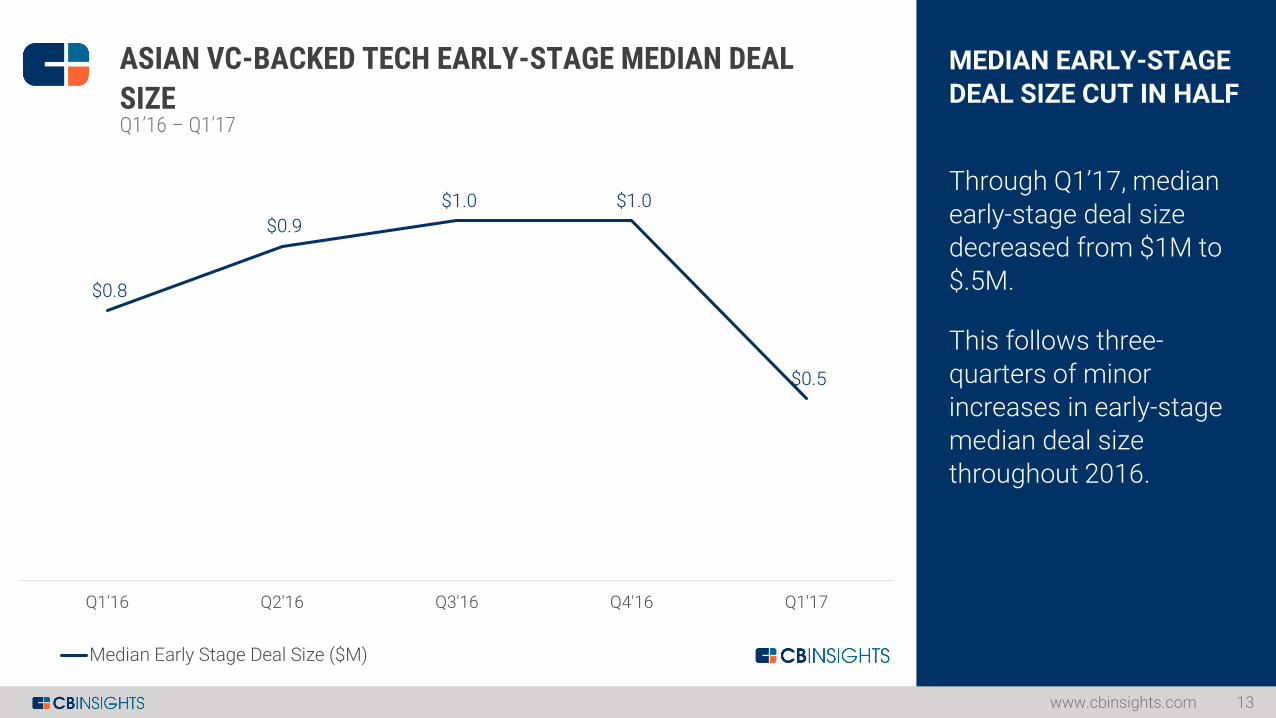
$0.8
$0.9
$1.0 $1.0
$0.5
Q1'16 Q2'16 Q3'16 Q4'16 Q1'17
Median Early Stage Deal Size ($M)
MEDIAN EARLY-STAGE
DEAL SIZE CUT IN HALF
Through Q1’17, median
early-stage deal size decreased from $1M to $.5M.
This follows three-
quarters of minor increases in early-stage median deal size
throughout 2016.
www.cbinsights.com 13
ASIAN VC-BACKED TECH EARLY-STAGE MEDIAN DEAL
SIZEQ1’16 – Q1’17
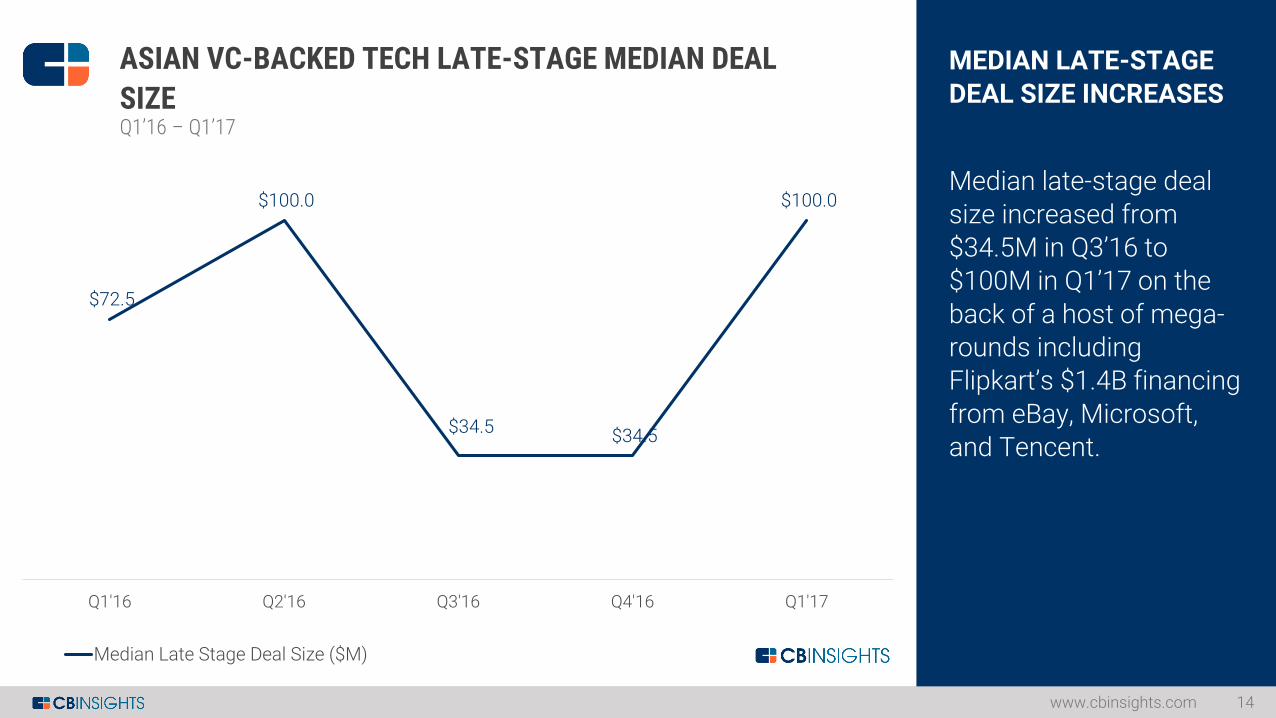
$72.5
$100.0
$34.5 $34.5
$100.0
Q1'16 Q2'16 Q3'16 Q4'16 Q1'17
Median Late Stage Deal Size ($M)
MEDIAN LATE-STAGE
DEAL SIZE INCREASES
Median late-stage deal
size increased from $34.5M in Q3’16 to $100M in Q1’17 on the
back of a host of mega-rounds including Flipkart’s $1.4B financing
from eBay, Microsoft, and Tencent.
www.cbinsights.com 14
ASIAN VC-BACKED TECH LATE-STAGE MEDIAN DEAL
SIZEQ1’16 – Q1’17
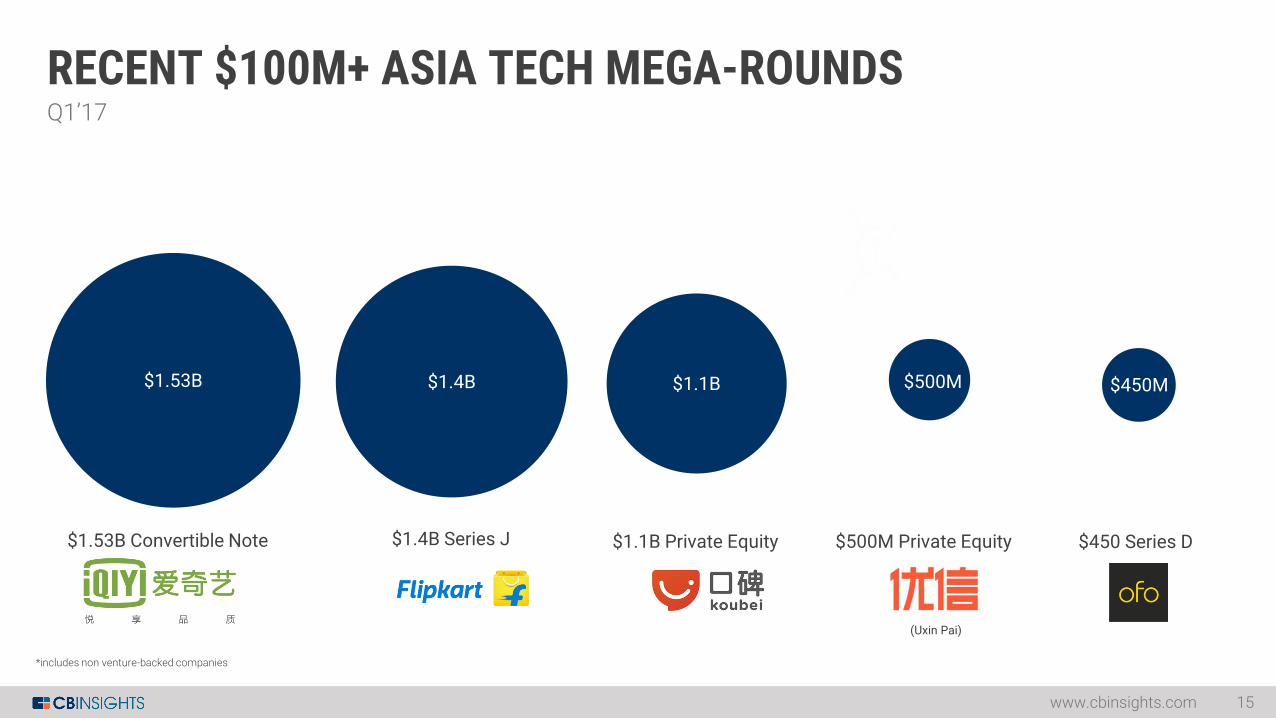
RECENT $100M+ ASIA TECH MEGA-ROUNDS
www.cbinsights.com 15
Q1’17
450Series D
$1.53B
$1.53B Convertible Note
$1.4B
$1.4B Series J
$1.1B
$1.1B Private Equity $500M Private Equity $450 Series D
(Uxin Pai)
$500M $450M
*includes non venture-backed companies
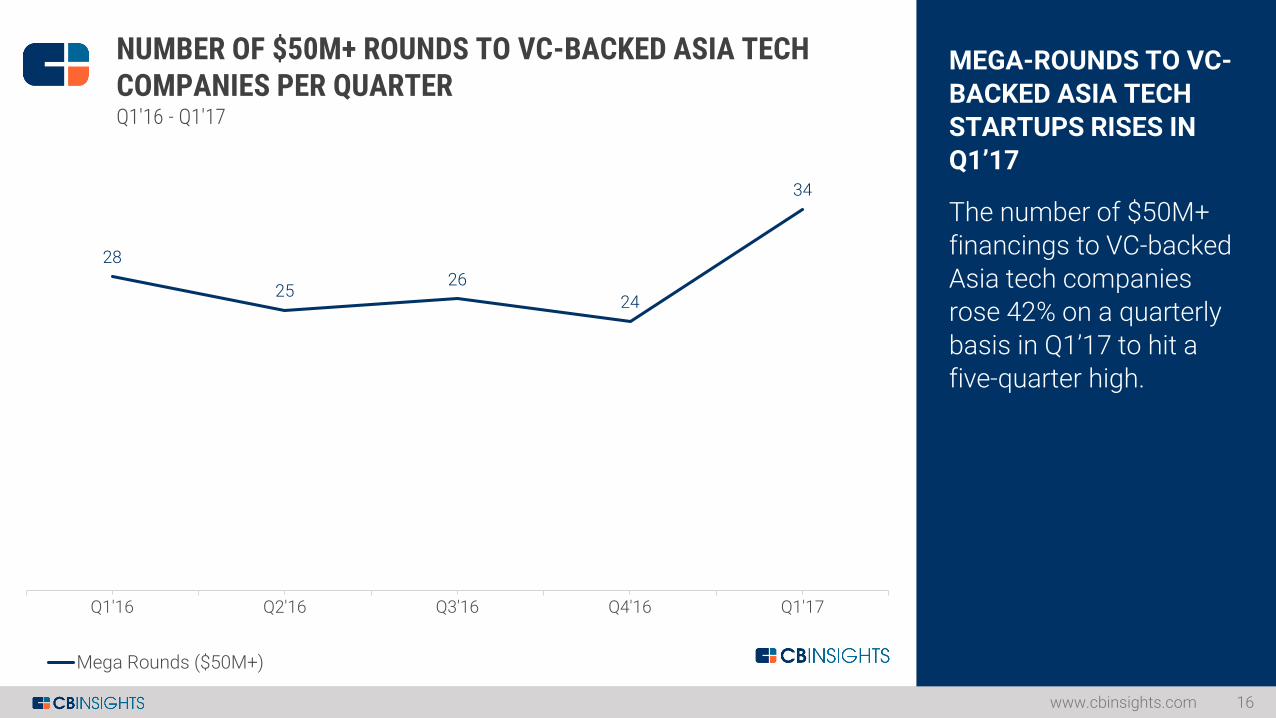
MEGA-ROUNDS TO VC-
BACKED ASIA TECH STARTUPS RISES IN Q1’17
The number of $50M+
financings to VC-backed Asia tech companies rose 42% on a quarterly
basis in Q1’17 to hit a five-quarter high.
www.cbinsights.com 16
28
2526
24
34
Q1'16 Q2'16 Q3'16 Q4'16 Q1'17
NUMBER OF $50M+ ROUNDS TO VC-BACKED ASIA TECH COMPANIES PER QUARTERQ1'16 - Q1'17
Mega Rounds ($50M+)
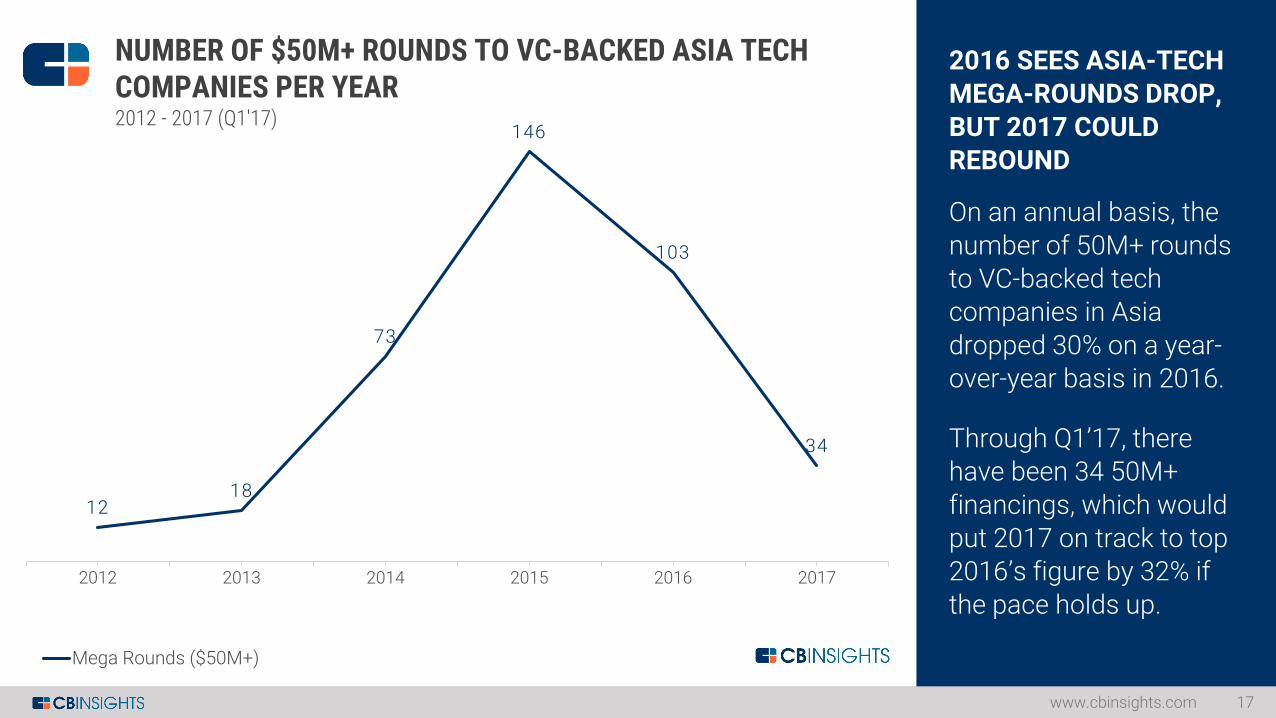
2016 SEES ASIA-TECH
MEGA-ROUNDS DROP, BUT 2017 COULD REBOUND
On an annual basis, the
number of 50M+ rounds to VC-backed tech companies in Asia
dropped 30% on a year-over-year basis in 2016.
Through Q1’17, there have been 34 50M+
financings, which would put 2017 on track to top 2016’s figure by 32% if
the pace holds up.
www.cbinsights.com 17
1218
73
146
103
34
2012 2013 2014 2015 2016 2017
NUMBER OF $50M+ ROUNDS TO VC-BACKED ASIA TECH COMPANIES PER YEAR2012 - 2017 (Q1'17)
Mega Rounds ($50M+)
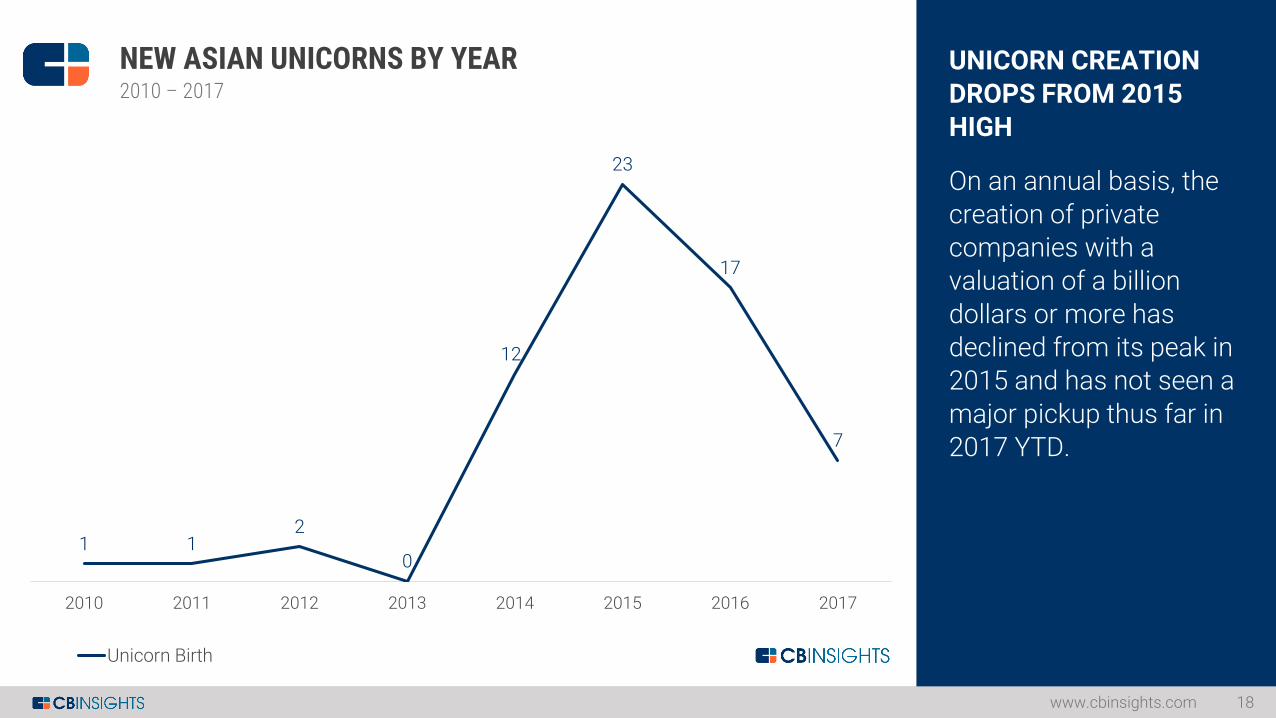
UNICORN CREATION
DROPS FROM 2015 HIGH
On an annual basis, the
creation of private companies with a valuation of a billion
dollars or more has declined from its peak in 2015 and has not seen a
major pickup thus far in 2017 YTD.
www.cbinsights.com 18
NEW ASIAN UNICORNS BY YEAR 2010 – 2017
1 12
0
12
23
17
7
2010 2011 2012 2013 2014 2015 2016 2017
Unicorn Birth
$5
0.0
$4
6.0
$2
0.0
$1
8.5
$1
1.6
$1
1.0
$1
0.0
$8
.0
$7
.0
$5
.9
$5
.8
$5
.0 $
4.6
$4
.5
$4
.0
$3
.8
$3
.5
$3
.0
$3
.0
$3
.0
$3
.0
$3
.0
$2
.9
$2
.0
$2
.0
$2
.0
$2
.0
$1
.8
$1
.6
$1
.5
$1
.5
$1
.4
$1
.4
$1
.2
$1
.1
$1
.0
$1
.0
$1
.0
$1
.0
$1
.0
$1
.0
$1
.0
$1
.0
$1
.0
$1
.0
$1
.0
$1
.0
$1
.0
$1
.0
$1
.0
$1
.0
$1
.0
$1
.0
$1
.0
$1
.0
$1
.0
$1
.0
$1
.0
$1
.0
$1
.0
$1
.0
$1
.0
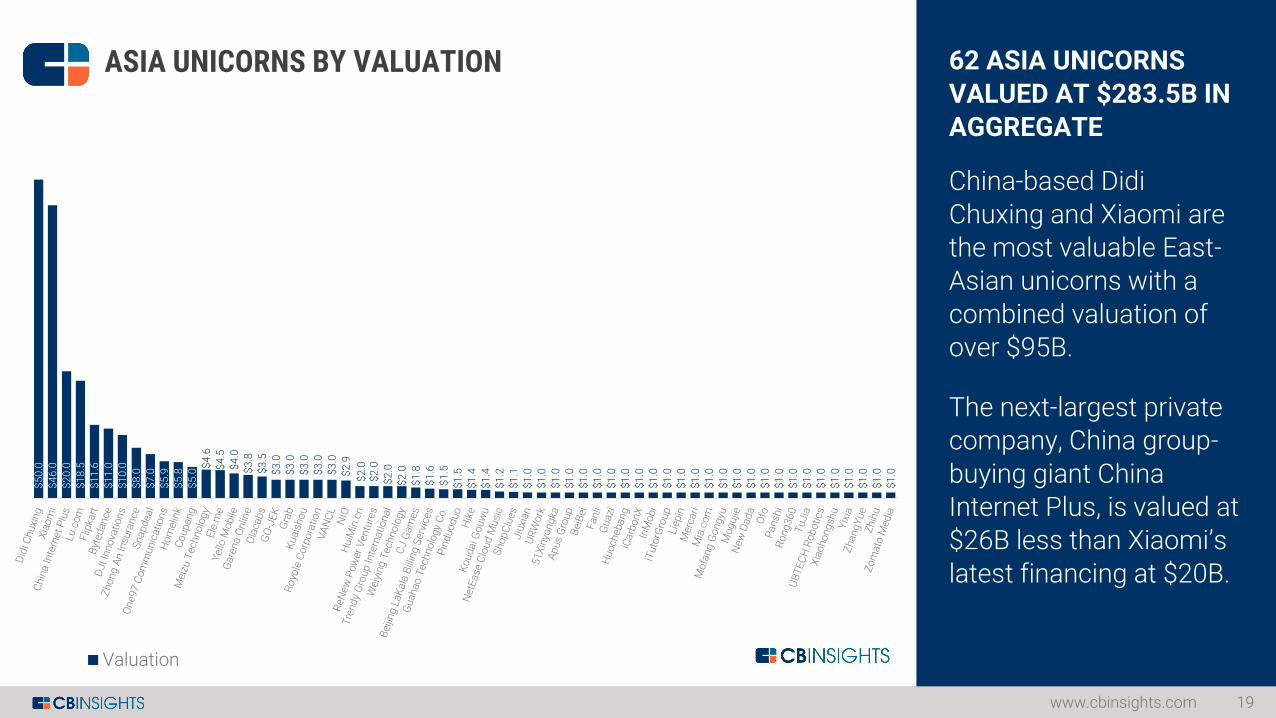
ASIA UNICORNS BY VALUATION
Valuation
62 ASIA UNICORNS
VALUED AT $283.5B IN AGGREGATE
China-based Didi
Chuxing and Xiaomi are the most valuable East-Asian unicorns with a
combined valuation of over $95B.
The next-largest private company, China group-
buying giant China Internet Plus, is valued at $26B less than Xiaomi’s
latest financing at $20B.
www.cbinsights.com 19
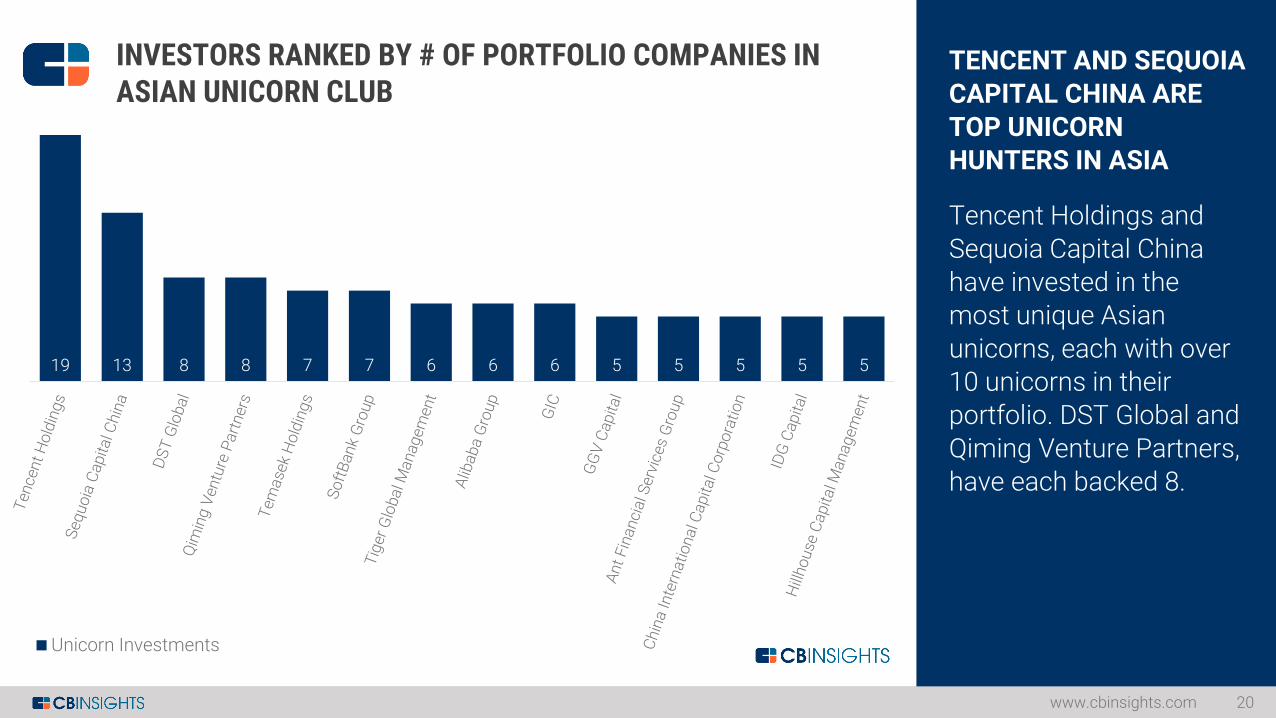
TENCENT AND SEQUOIA
CAPITAL CHINA ARE TOP UNICORN HUNTERS IN ASIA
Tencent Holdings and
Sequoia Capital China have invested in the most unique Asian
unicorns, each with over 10 unicorns in their portfolio. DST Global and
Qiming Venture Partners, have each backed 8.
www.cbinsights.com 20
19 13 8 8 7 7 6 6 6 5 5 5 5 5
INVESTORS RANKED BY # OF PORTFOLIO COMPANIES IN ASIAN UNICORN CLUB
Unicorn Investments
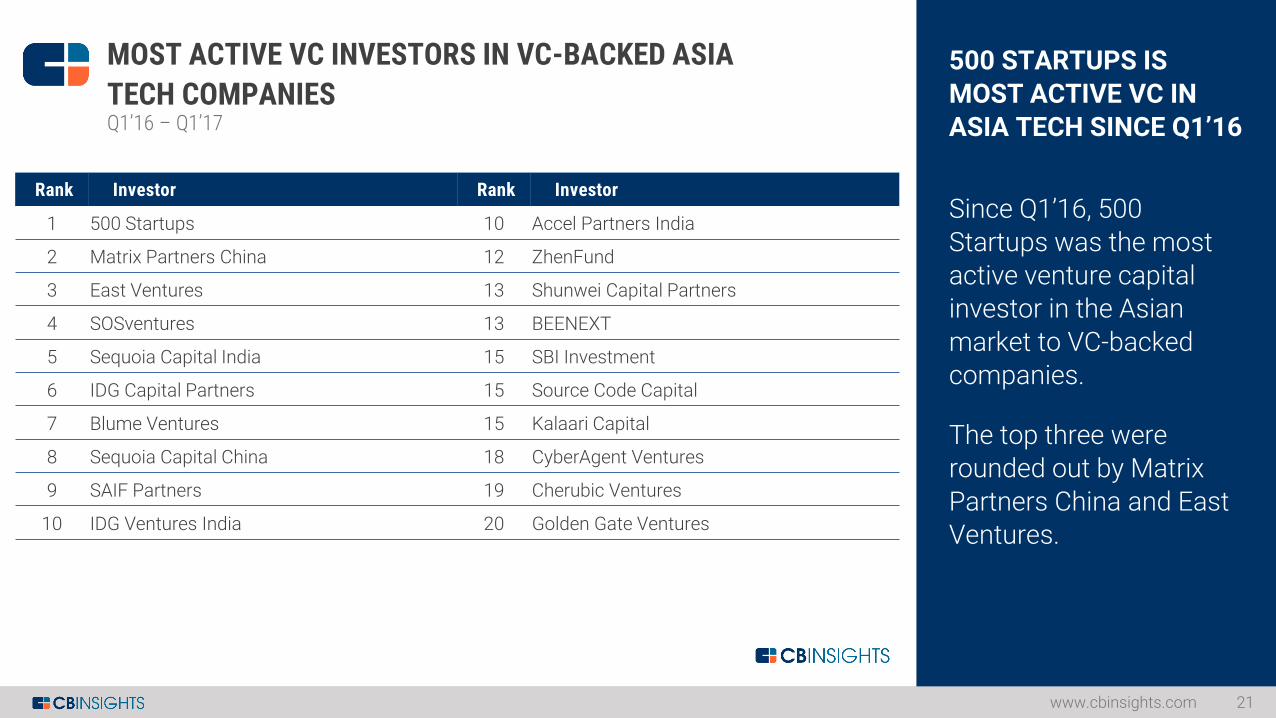
500 STARTUPS IS
MOST ACTIVE VC IN ASIA TECH SINCE Q1’16
Since Q1’16, 500
Startups was the most active venture capital investor in the Asian
market to VC-backed companies.
The top three were rounded out by Matrix
Partners China and East Ventures.
www.cbinsights.com 21
MOST ACTIVE VC INVESTORS IN VC-BACKED ASIA
TECH COMPANIESQ1’16 – Q1’17
Rank Investor Rank Investor
1 500 Startups 10 Accel Partners India
2 Matrix Partners China 12 ZhenFund
3 East Ventures 13 Shunwei Capital Partners
4 SOSventures 13 BEENEXT
5 Sequoia Capital India 15 SBI Investment
6 IDG Capital Partners 15 Source Code Capital
7 Blume Ventures 15 Kalaari Capital
8 Sequoia Capital China 18 CyberAgent Ventures
9 SAIF Partners 19 Cherubic Ventures
10 IDG Ventures India 20 Golden Gate Ventures
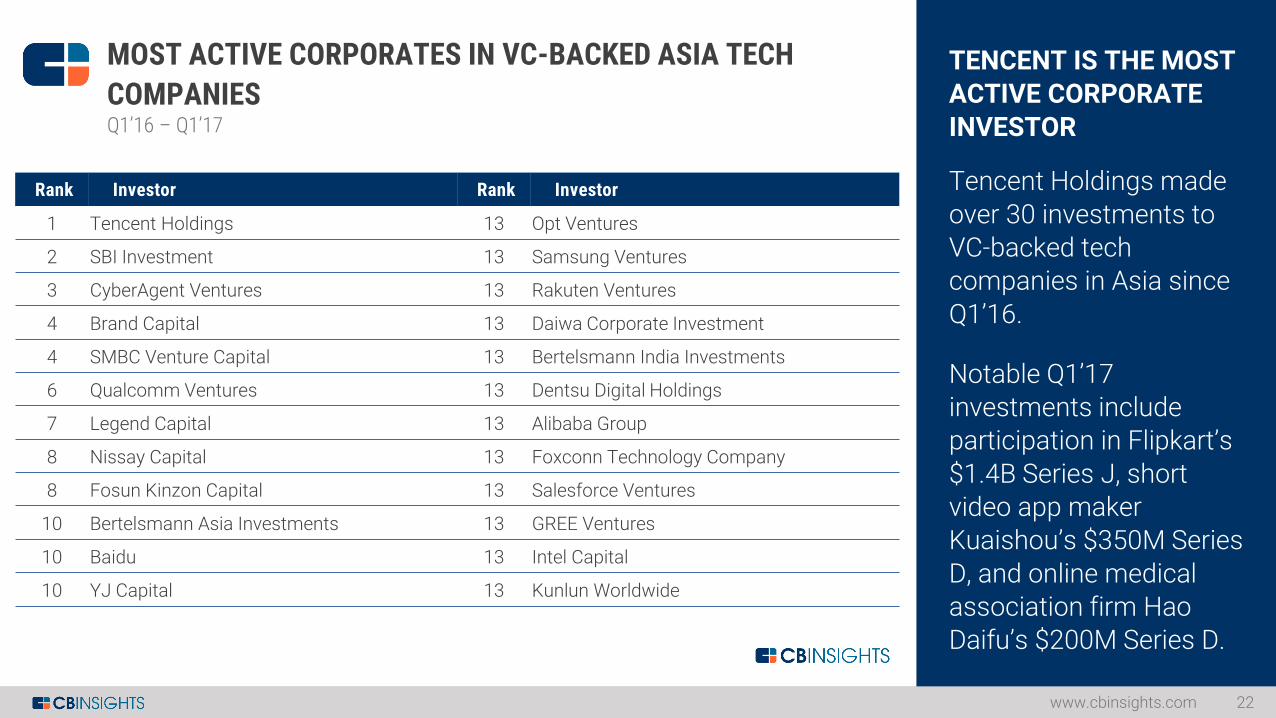
TENCENT IS THE MOST
ACTIVE CORPORATE INVESTOR
Tencent Holdings made
over 30 investments to VC-backed tech companies in Asia since
Q1’16.
Notable Q1’17 investments include participation in Flipkart’s
$1.4B Series J, short video app maker Kuaishou’s $350M Series
D, and online medical association firm Hao Daifu’s $200M Series D.
www.cbinsights.com 22
MOST ACTIVE CORPORATES IN VC-BACKED ASIA TECH
COMPANIESQ1’16 – Q1’17
Rank Investor Rank Investor
1 Tencent Holdings 13 Opt Ventures
2 SBI Investment 13 Samsung Ventures
3 CyberAgent Ventures 13 Rakuten Ventures
4 Brand Capital 13 Daiwa Corporate Investment
4 SMBC Venture Capital 13 Bertelsmann India Investments
6 Qualcomm Ventures 13 Dentsu Digital Holdings
7 Legend Capital 13 Alibaba Group
8 Nissay Capital 13 Foxconn Technology Company
8 Fosun Kinzon Capital 13 Salesforce Ventures
10 Bertelsmann Asia Investments 13 GREE Ventures
10 Baidu 13 Intel Capital
10 YJ Capital 13 Kunlun Worldwide
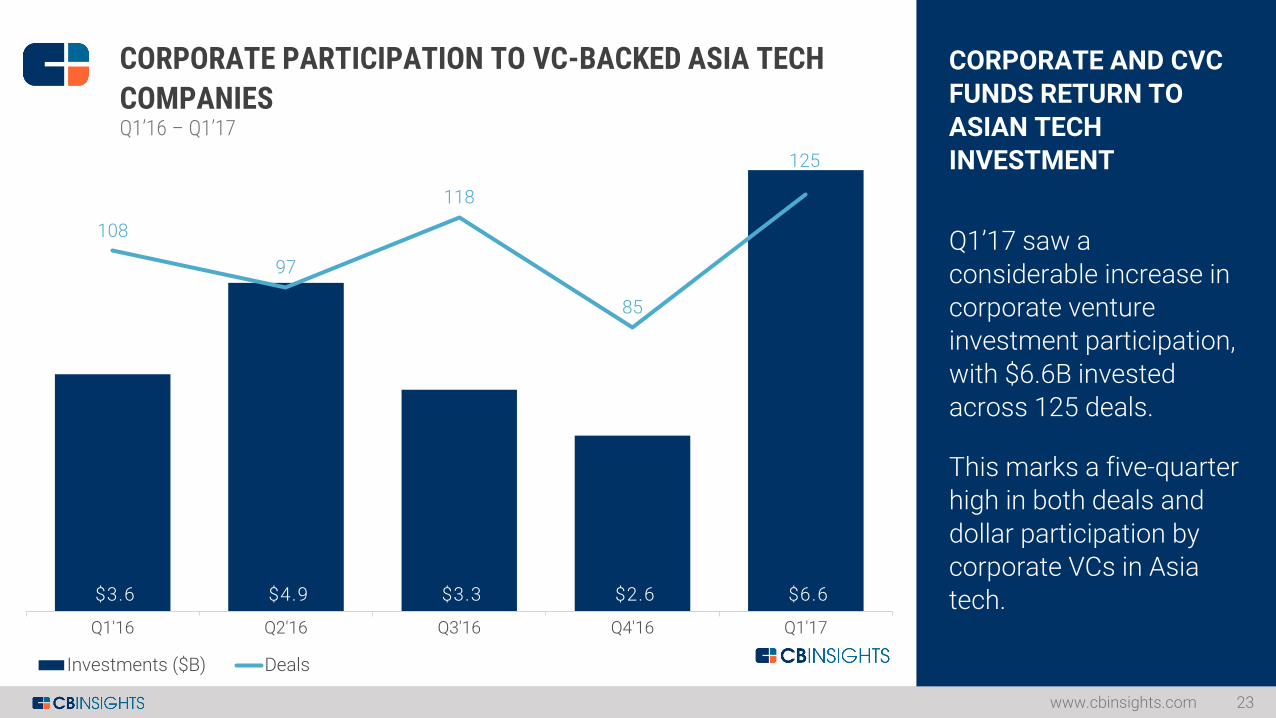
CORPORATE AND CVC
FUNDS RETURN TO ASIAN TECH INVESTMENT
Q1’17 saw a
considerable increase in corporate venture investment participation,
with $6.6B invested across 125 deals.
This marks a five-quarter high in both deals and
dollar participation by corporate VCs in Asia tech.
www.cbinsights.com 23
CORPORATE PARTICIPATION TO VC-BACKED ASIA TECH
COMPANIESQ1’16 – Q1’17
$3.6 $4.9 $3.3 $2.6 $6.6
108
97
118
85
125
Q1'16 Q2'16 Q3'16 Q4'16 Q1'17
Investments ($B) Deals
68% 65% 59% 69% 60%
32%35%
41%
31%
40%
Q1'16 Q2'16 Q3'16 Q4'16 Q1'17
Other Investors Corp / CVC Deal Participation
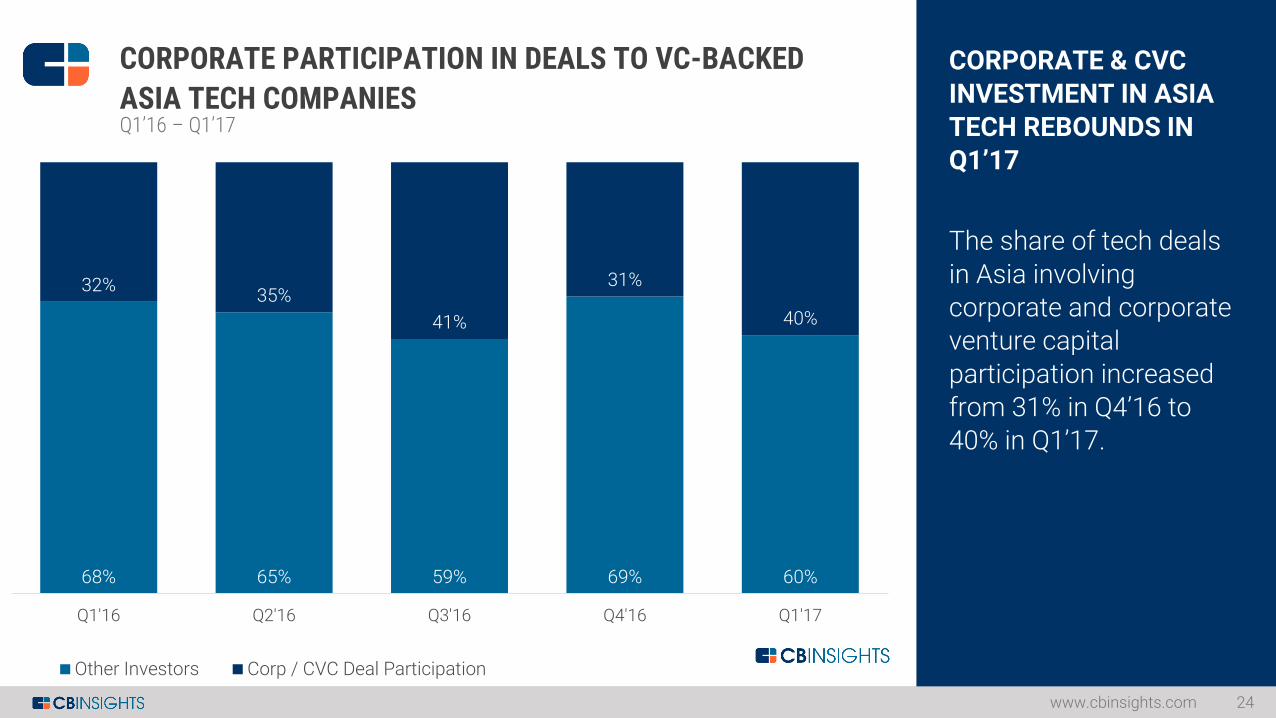
CORPORATE & CVC
INVESTMENT IN ASIATECH REBOUNDS IN Q1’17
The share of tech deals
in Asia involving corporate and corporate venture capital
participation increased from 31% in Q4’16 to 40% in Q1’17.
www.cbinsights.com 24
CORPORATE PARTICIPATION IN DEALS TO VC-BACKED
ASIA TECH COMPANIESQ1’16 – Q1’17
105
89
100
95
101
112
9192
98
89
65
4953
3138
Q1'16 Q2'16 Q3'16 Q4'16 Q1'17
China India Southeast Asia
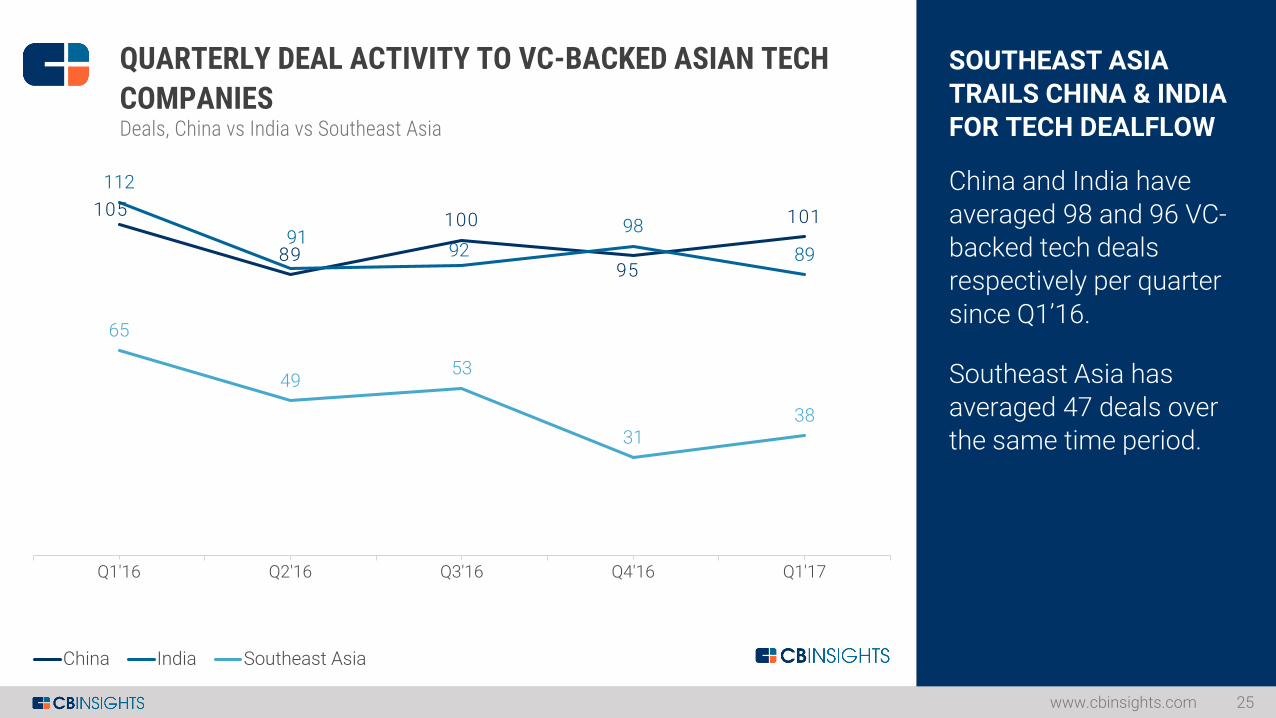
SOUTHEAST ASIA
TRAILS CHINA & INDIAFOR TECH DEALFLOW
China and India have
averaged 98 and 96 VC-backed tech deals respectively per quarter
since Q1’16.
Southeast Asia has averaged 47 deals over the same time period.
www.cbinsights.com 25
QUARTERLY DEAL ACTIVITY TO VC-BACKED ASIAN TECH
COMPANIESDeals, China vs India vs Southeast Asia
$4.3 $6.4 $3.8 $3.6 $6.0 $1.1 $0.5 $0.8 $0.4 $2.6 $0.3 $0.2
$1.5 $0.1 $0.2
Q1'16 Q2'16 Q3'16 Q4'16 Q1'17
China India Southeast Asia
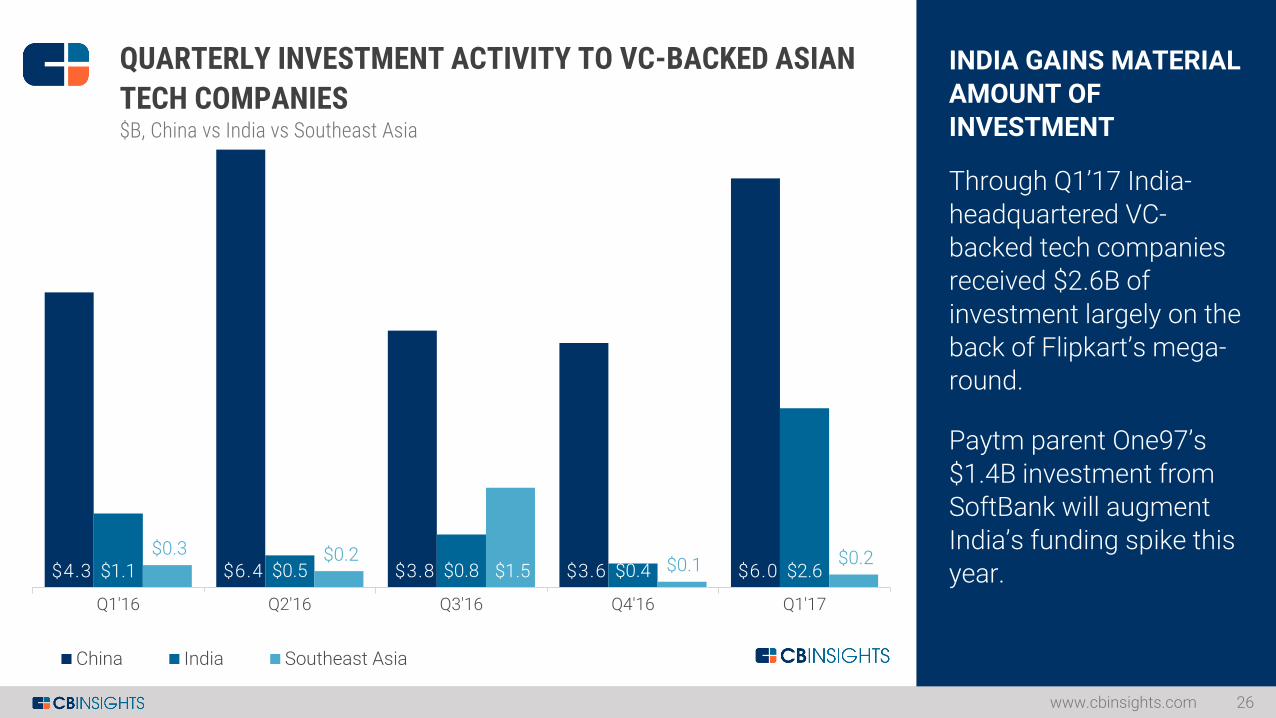
INDIA GAINS MATERIAL
AMOUNT OF INVESTMENT
Through Q1’17 India-
headquartered VC-backed tech companies received $2.6B of
investment largely on the back of Flipkart’s mega-round.
Paytm parent One97’s
$1.4B investment from SoftBank will augment India’s funding spike this
year.
www.cbinsights.com 26
QUARTERLY INVESTMENT ACTIVITY TO VC-BACKED ASIAN
TECH COMPANIES$B, China vs India vs Southeast Asia
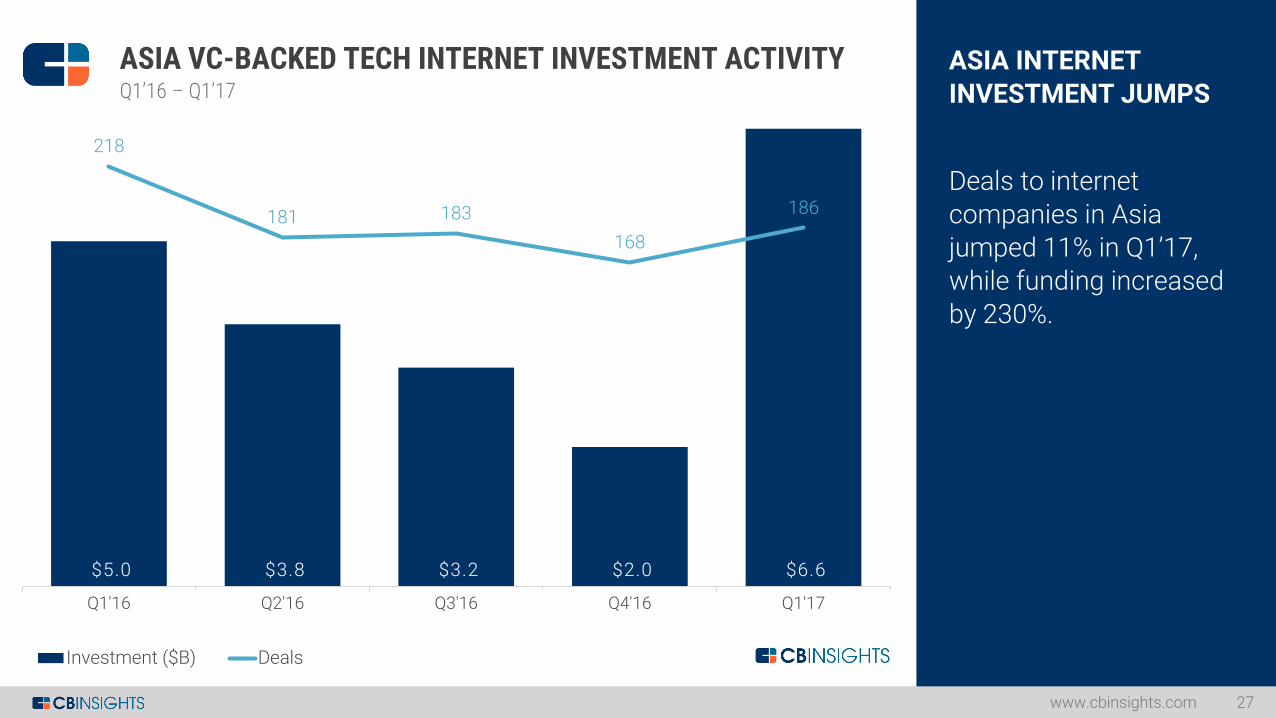
ASIA INTERNET
INVESTMENT JUMPS
Deals to internet
companies in Asia jumped 11% in Q1’17, while funding increased
by 230%.
www.cbinsights.com 27
ASIA VC-BACKED TECH INTERNET INVESTMENT ACTIVITYQ1’16 – Q1’17
$5.0 $3.8 $3.2 $2.0 $6.6
218
181 183
168
186
Q1'16 Q2'16 Q3'16 Q4'16 Q1'17
Investment ($B) Deals
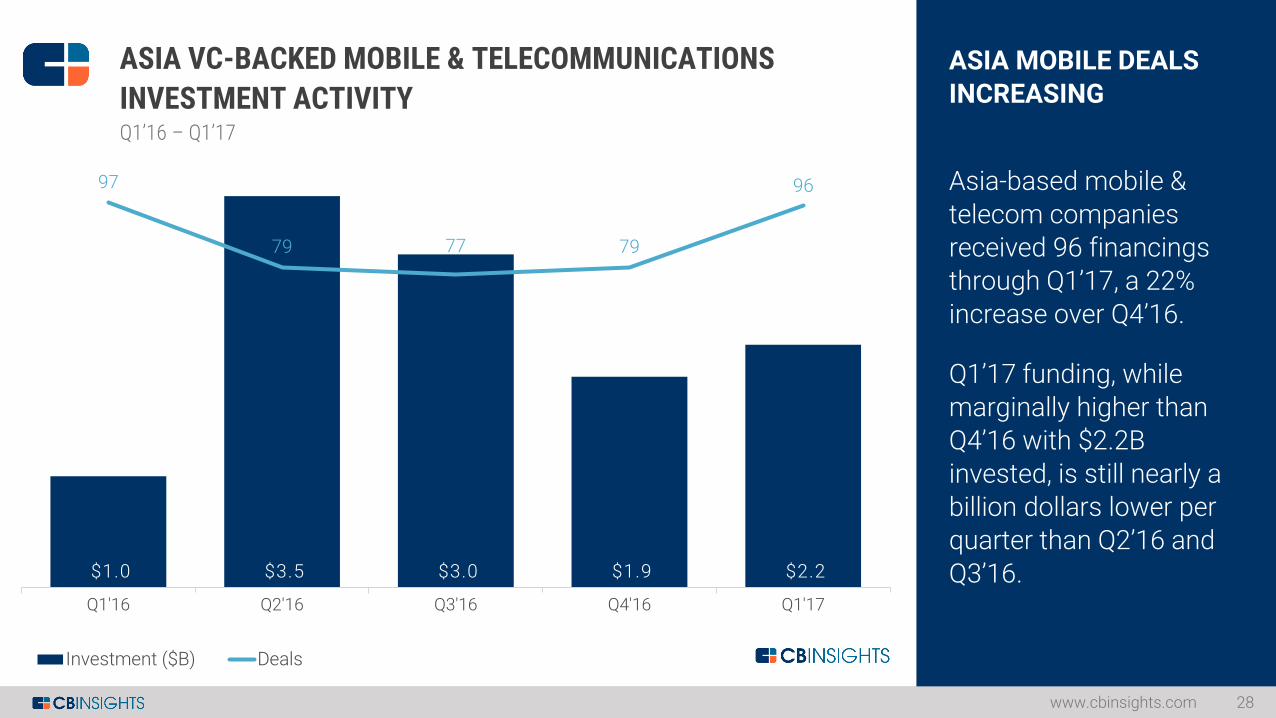
ASIA MOBILE DEALS
INCREASING
Asia-based mobile &
telecom companies received 96 financings through Q1’17, a 22%
increase over Q4’16.
Q1’17 funding, while marginally higher than Q4’16 with $2.2B
invested, is still nearly a billion dollars lower per quarter than Q2’16 and
Q3’16.
www.cbinsights.com 28
ASIA VC-BACKED MOBILE & TELECOMMUNICATIONS
INVESTMENT ACTIVITYQ1’16 – Q1’17
$1.0 $3.5 $3.0 $1.9 $2.2
97
79 77 79
96
Q1'16 Q2'16 Q3'16 Q4'16 Q1'17
Investment ($B) Deals
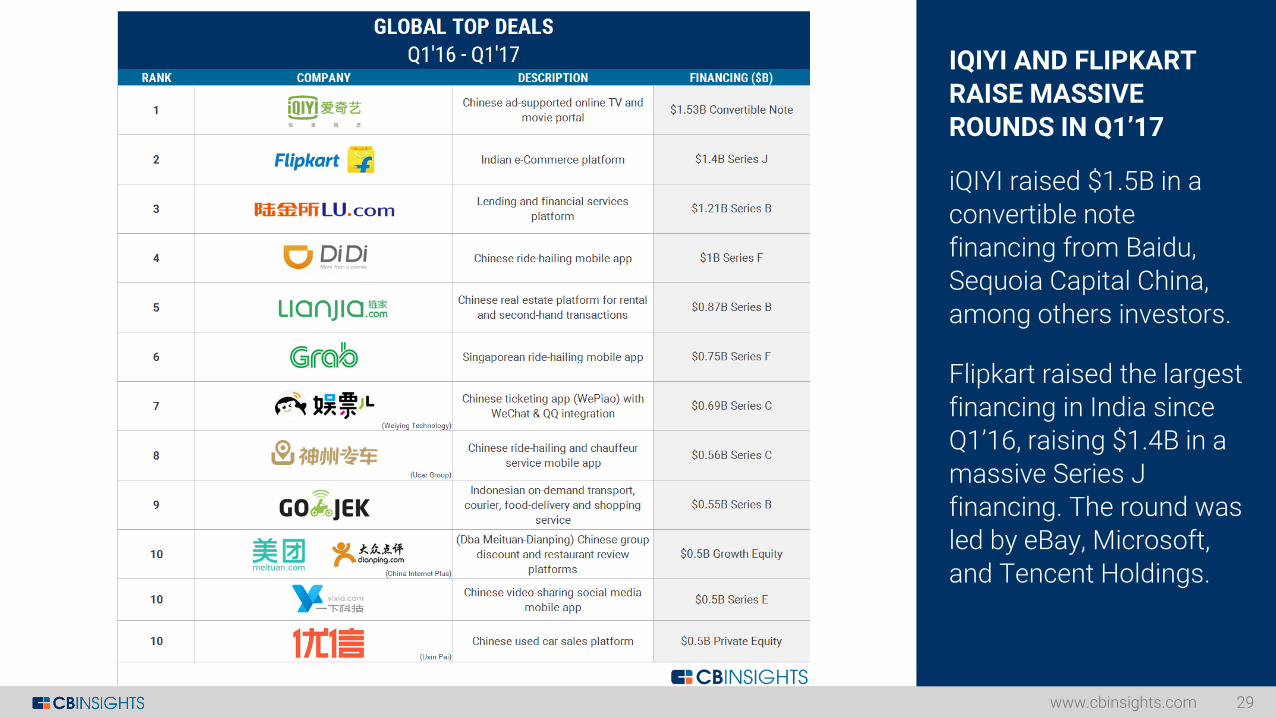
IQIYI AND FLIPKART
RAISE MASSIVE ROUNDS IN Q1’17
iQIYI raised $1.5B in a
convertible note financing from Baidu, Sequoia Capital China,
among others investors.
Flipkart raised the largest financing in India since Q1’16, raising $1.4B in a
massive Series J financing. The round was led by eBay, Microsoft,
and Tencent Holdings.
www.cbinsights.com 29
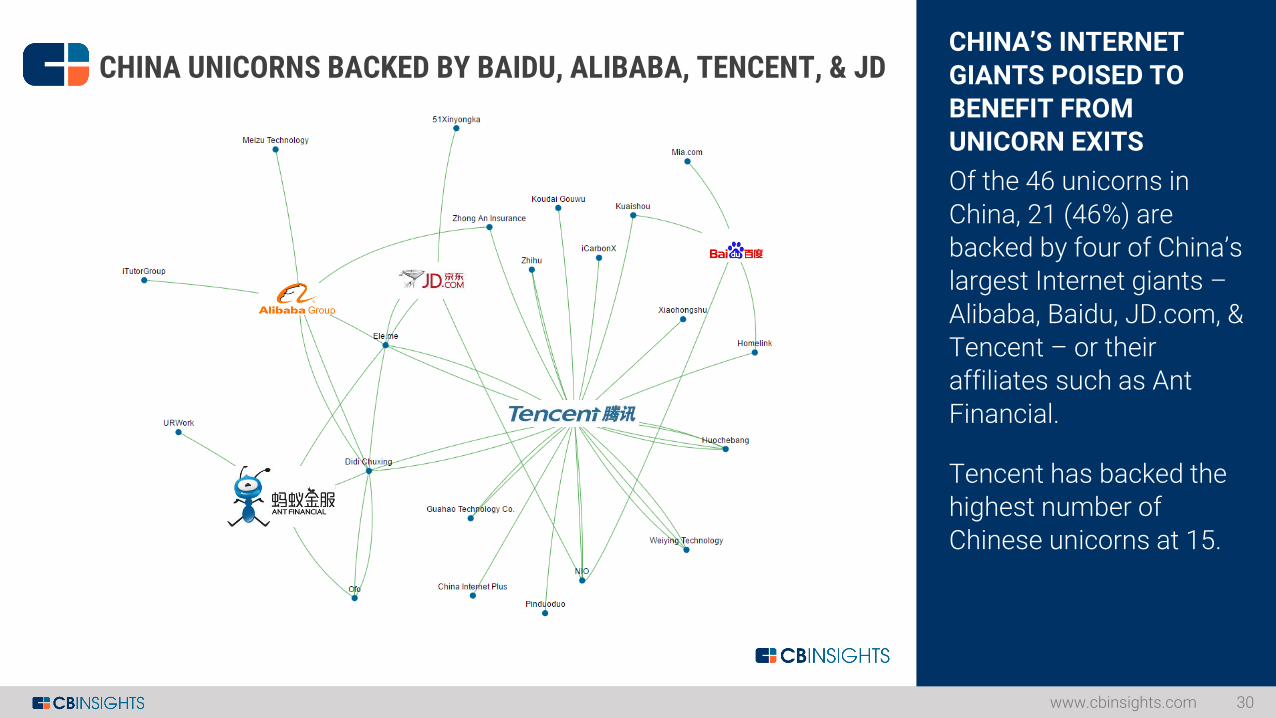
CHINA’S INTERNET
GIANTS POISED TO BENEFIT FROM UNICORN EXITS
Of the 46 unicorns in
China, 21 (46%) are backed by four of China’s largest Internet giants –
Alibaba, Baidu, JD.com, & Tencent – or their affiliates such as Ant
Financial.
Tencent has backed the highest number of Chinese unicorns at 15.
www.cbinsights.com 30
CHINA UNICORNS BACKED BY BAIDU, ALIBABA, TENCENT, & JD
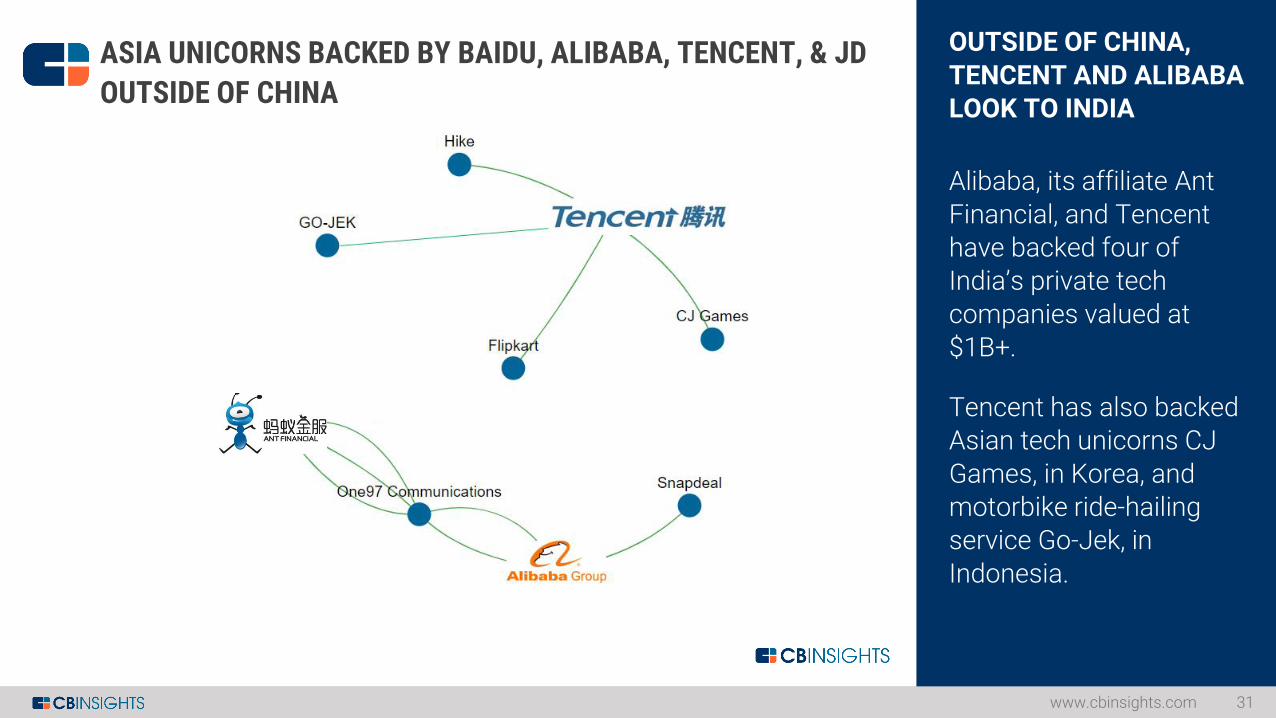
OUTSIDE OF CHINA,
TENCENT AND ALIBABA LOOK TO INDIA
Alibaba, its affiliate Ant
Financial, and Tencent have backed four of India’s private tech
companies valued at $1B+.
Tencent has also backed Asian tech unicorns CJ
Games, in Korea, and motorbike ride-hailing service Go-Jek, in
Indonesia.
www.cbinsights.com 31
ASIA UNICORNS BACKED BY BAIDU, ALIBABA, TENCENT, & JD
OUTSIDE OF CHINA
CHINAFINANCING TRENDS
www.cbinsights.com 32
$4.3 $6.4 $3.8 $3.6 $6.0
105
89
10095
101
Q1'16 Q2'16 Q3'16 Q4'16 Q1'17
Investments ($B) Deals
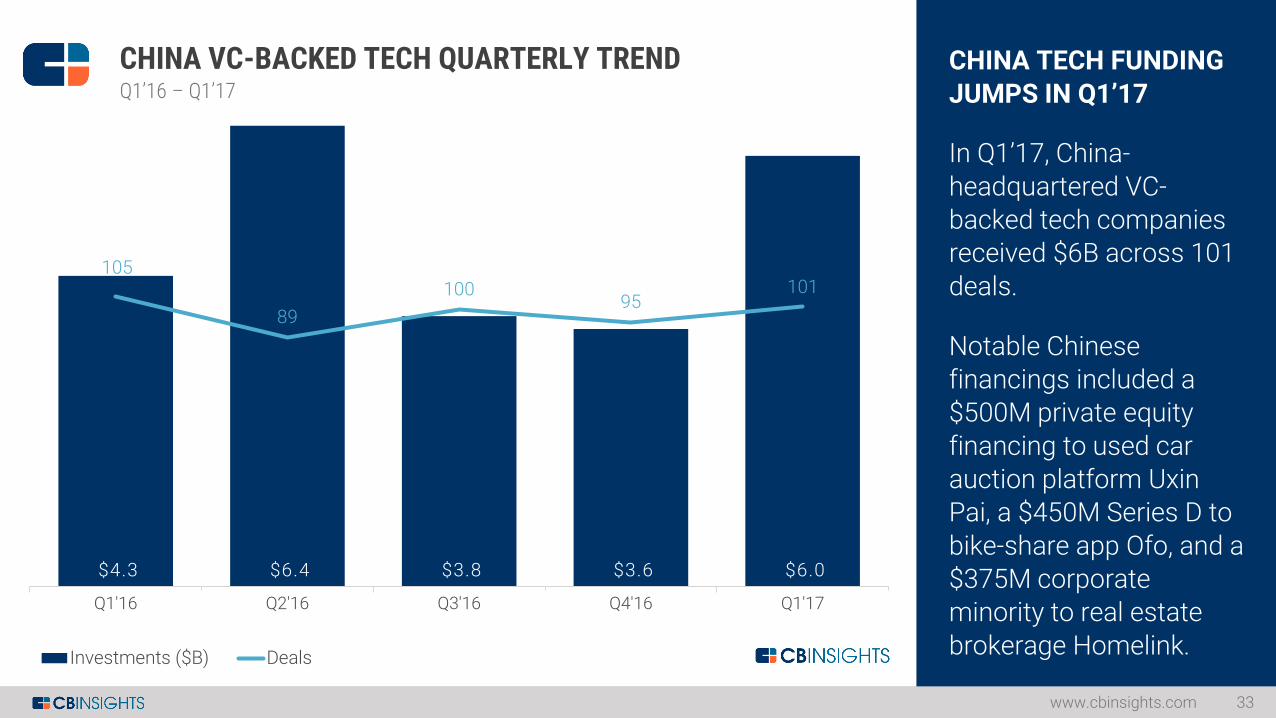
CHINA TECH FUNDING
JUMPS IN Q1’17
In Q1’17, China-
headquartered VC-backed tech companies received $6B across 101
deals.
Notable Chinese financings included a $500M private equity
financing to used car auction platform UxinPai, a $450M Series D to
bike-share app Ofo, and a $375M corporate minority to real estate
brokerage Homelink.
www.cbinsights.com 33
CHINA VC-BACKED TECH QUARTERLY TRENDQ1’16 – Q1’17
7% 11% 15% 13% 7%
32%27%
20%18%
26%
30% 27%26%
26% 29%
12%20%
18%15%
16%
5%
6%
3%
8%
13%
5%1%
3%3%
2%
10% 8%15% 17%
8%
Q1'16 Q2'16 Q3'16 Q4'16 Q1'17
Seed / Angel Series A Series B Series C Series D Series E+ Other
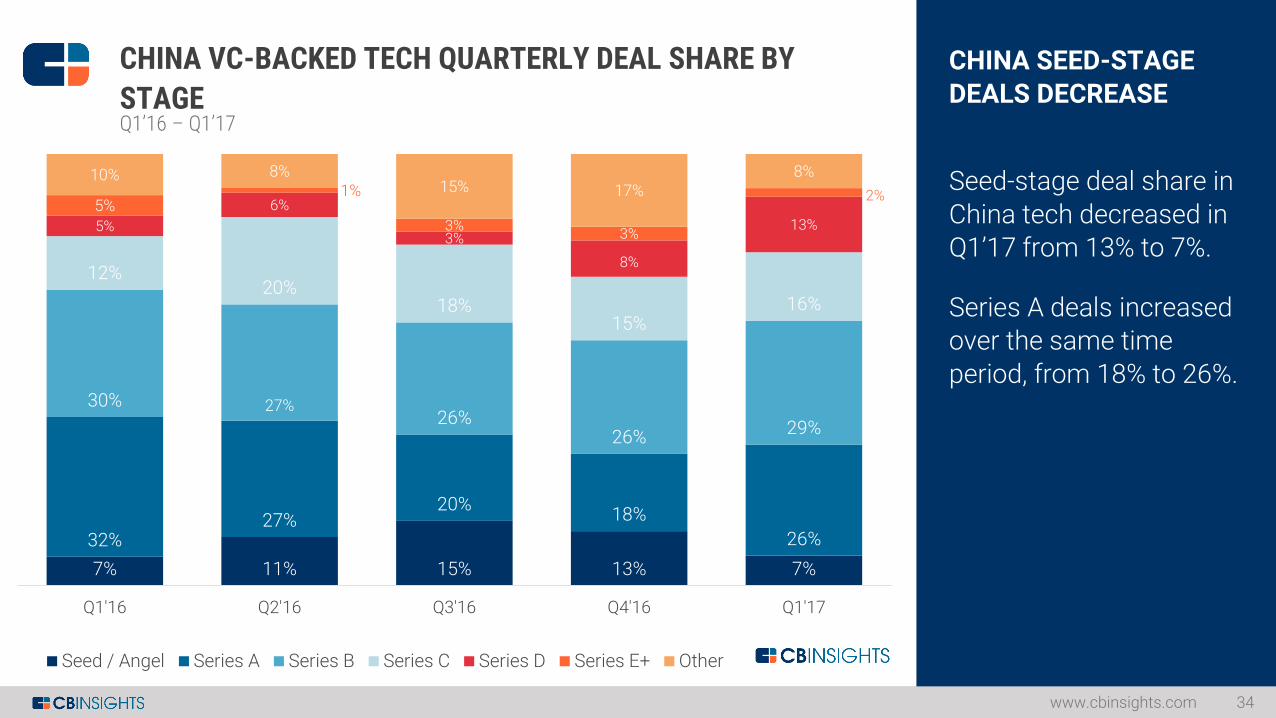
CHINA SEED-STAGE
DEALS DECREASE
Seed-stage deal share in
China tech decreased in Q1’17 from 13% to 7%.
Series A deals increased over the same time
period, from 18% to 26%.
www.cbinsights.com 34
CHINA VC-BACKED TECH QUARTERLY DEAL SHARE BY
STAGEQ1’16 – Q1’17
63% 58% 50% 52% 55%
30%34%
34% 32%31%
3% 3%
7% 6%6%
2% 2%
4% 4% 3%
2% 2%5% 6% 5%
Q1'16 Q2'16 Q3'16 Q4'16 Q1'17
Internet Mobile & TelecommunicationsSoftware (non-internet/mobile) Computer Hardware & ServicesElectronics
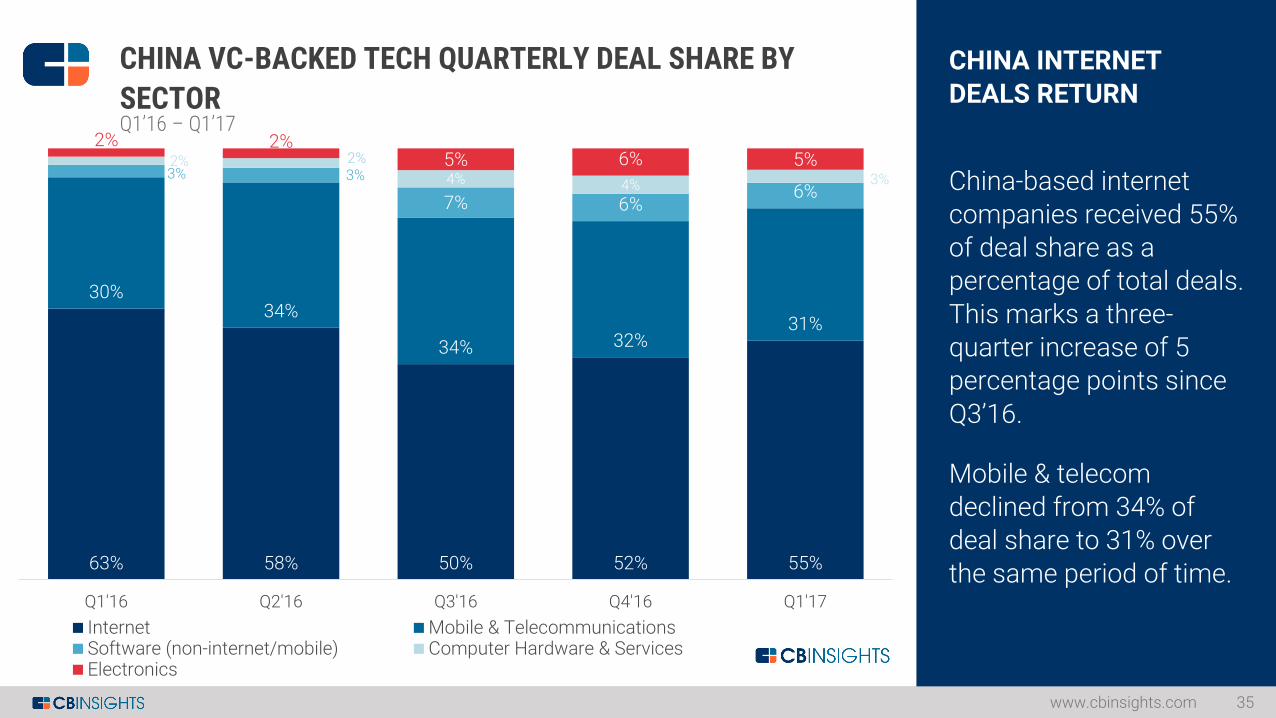
CHINA INTERNET
DEALS RETURN
China-based internet
companies received 55% of deal share as a percentage of total deals.
This marks a three-quarter increase of 5 percentage points since
Q3’16.
Mobile & telecom declined from 34% of deal share to 31% over
the same period of time.
www.cbinsights.com 35
CHINA VC-BACKED TECH QUARTERLY DEAL SHARE BY
SECTORQ1’16 – Q1’17
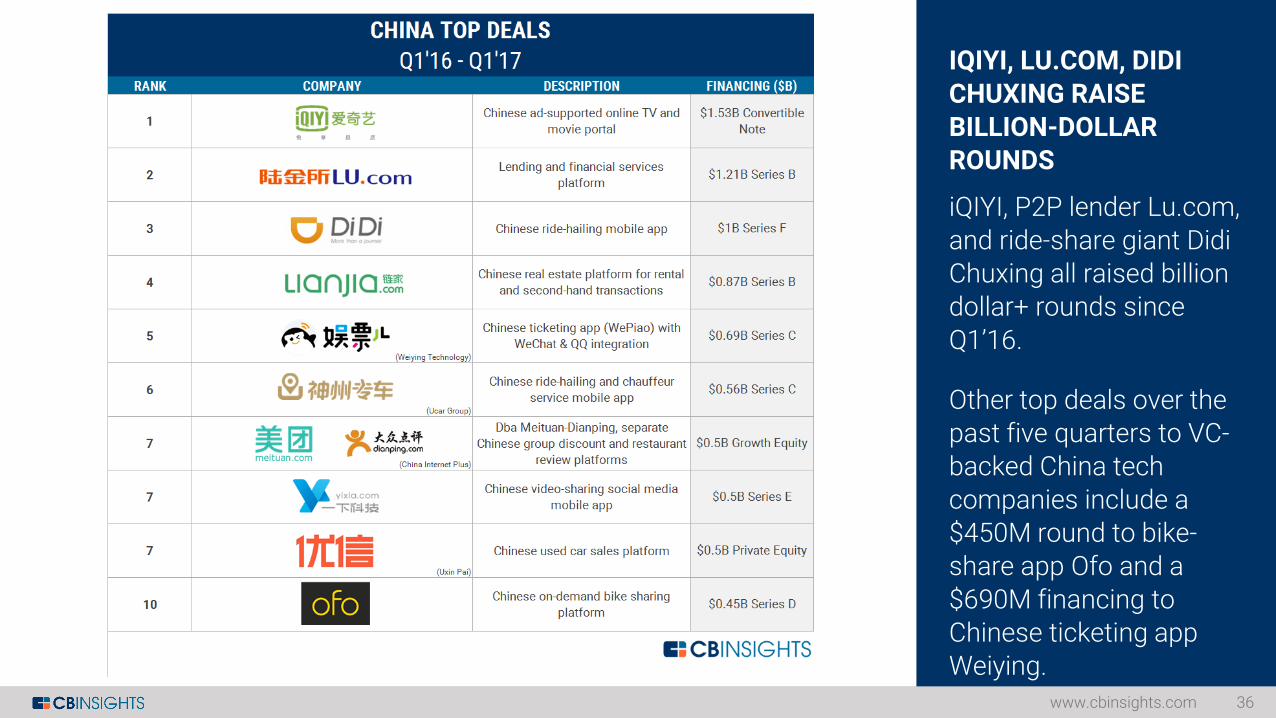
IQIYI, LU.COM, DIDI
CHUXING RAISE BILLION-DOLLAR ROUNDS
iQIYI, P2P lender Lu.com,
and ride-share giant DidiChuxing all raised billion dollar+ rounds since
Q1’16.
Other top deals over the past five quarters to VC-backed China tech
companies include a $450M round to bike-share app Ofo and a
$690M financing to Chinese ticketing app Weiying.
www.cbinsights.com 36
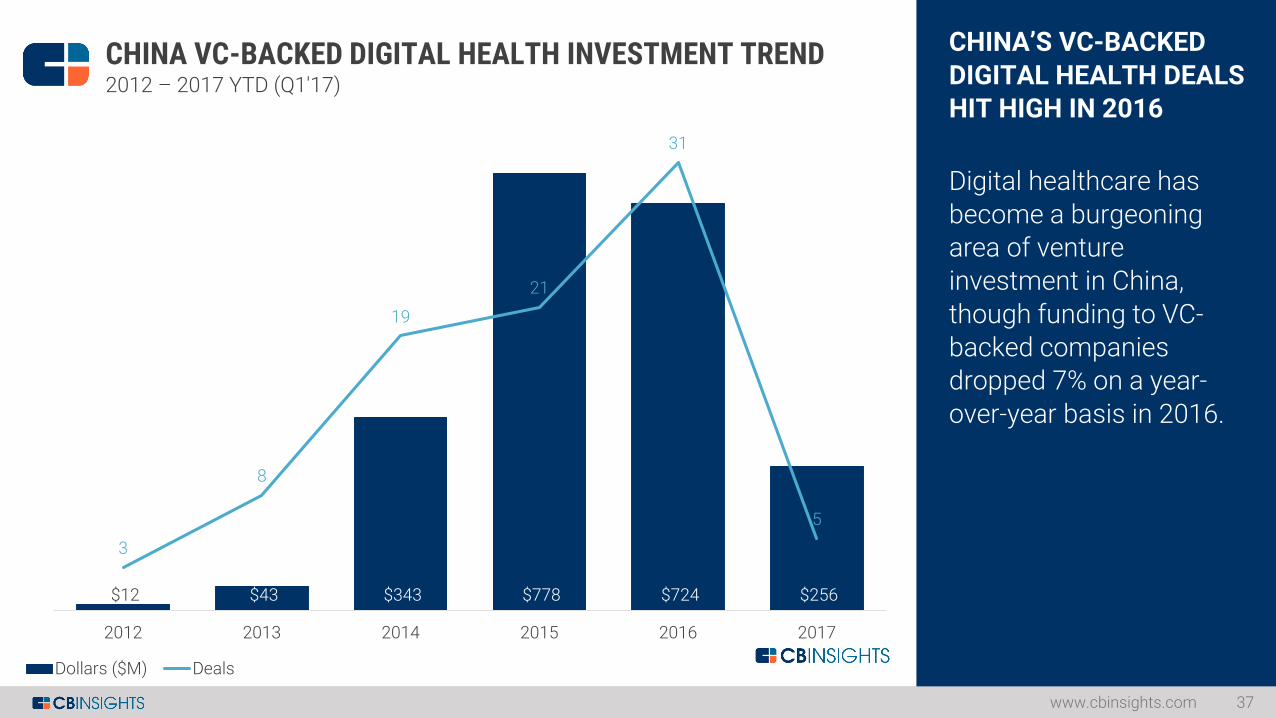
CHINA’S VC-BACKED
DIGITAL HEALTH DEALS HIT HIGH IN 2016
Digital healthcare has
become a burgeoning area of venture investment in China,
though funding to VC-backed companies dropped 7% on a year-
over-year basis in 2016.
www.cbinsights.com 37
$12 $43 $343 $778 $724 $256
3
8
19
21
31
5
0
5
10
15
20
25
30
35
$-
$100
$200
$300
$400
$500
$600
$700
$800
$900
2012 2013 2014 2015 2016 2017
CHINA VC-BACKED DIGITAL HEALTH INVESTMENT TREND2012 – 2017 YTD (Q1'17)
Dollars ($M) Deals
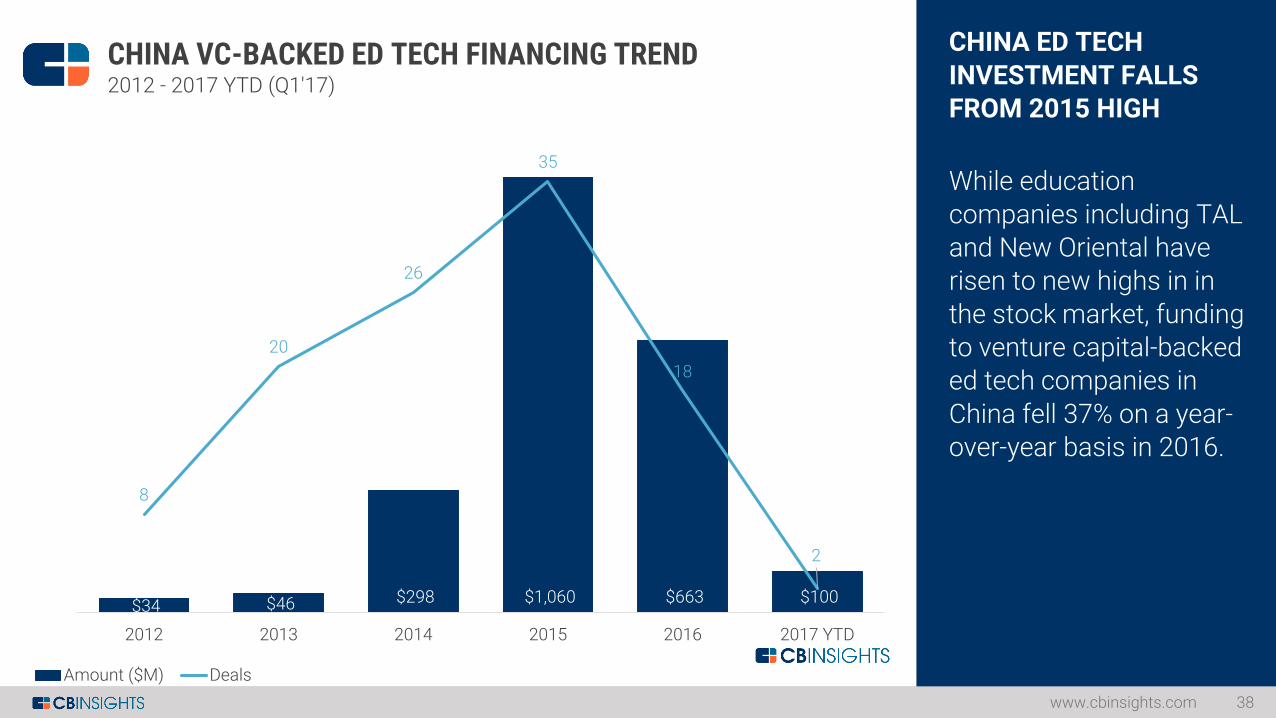
CHINA ED TECH
INVESTMENT FALLS FROM 2015 HIGH
While education
companies including TAL and New Oriental have risen to new highs in in
the stock market, funding to venture capital-backed ed tech companies in
China fell 37% on a year-over-year basis in 2016.
www.cbinsights.com 38
$34 $46 $298 $1,060 $663 $100
8
20
26
35
18
2
0
5
10
15
20
25
30
35
40
$-
$200
$400
$600
$800
$1,000
$1,200
2012 2013 2014 2015 2016 2017 YTD
CHINA VC-BACKED ED TECH FINANCING TREND2012 - 2017 YTD (Q1'17)
Amount ($M) Deals
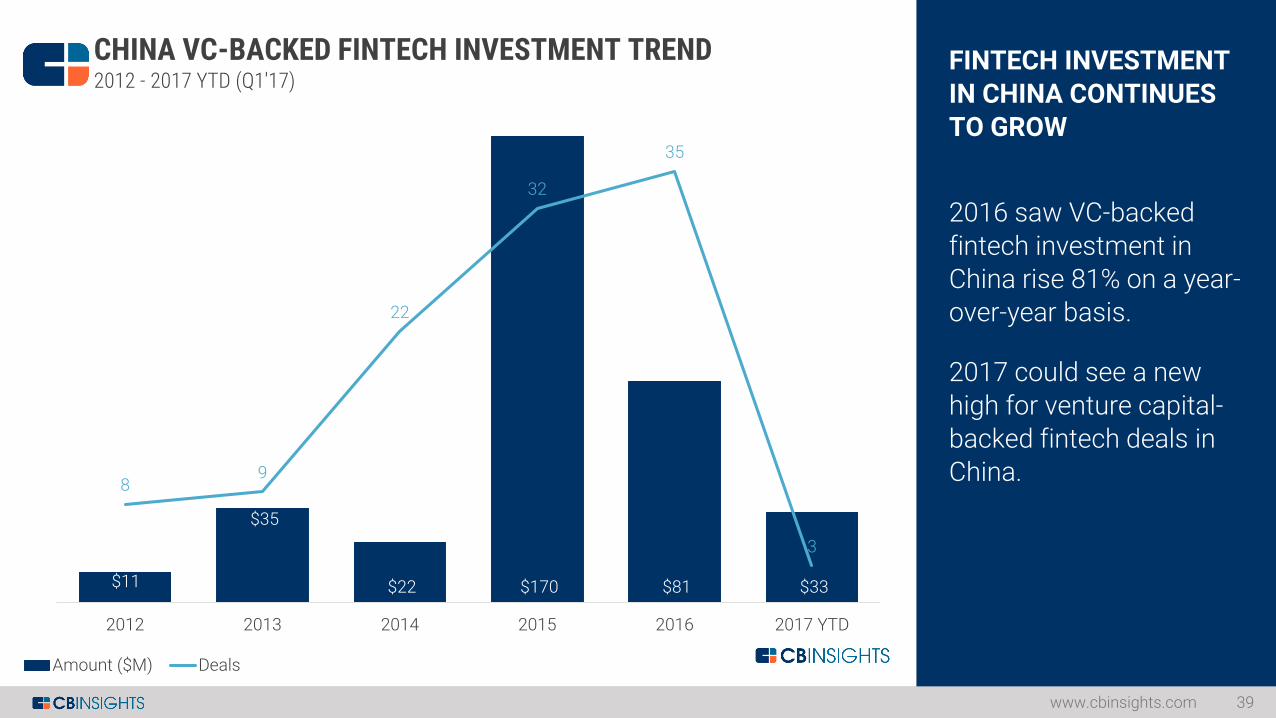
FINTECH INVESTMENT
IN CHINA CONTINUES TO GROW
2016 saw VC-backed
fintech investment in China rise 81% on a year-over-year basis.
2017 could see a new
high for venture capital-backed fintech deals in China.
www.cbinsights.com 39
$11
$35
$22 $170 $81 $33
89
22
32
35
3
0
5
10
15
20
25
30
35
40
$-
$20
$40
$60
$80
$100
$120
$140
$160
$180
2012 2013 2014 2015 2016 2017 YTD
CHINA VC-BACKED FINTECH INVESTMENT TREND2012 - 2017 YTD (Q1'17)
Amount ($M) Deals
INDIAFINANCING TRENDS
www.cbinsights.com 40
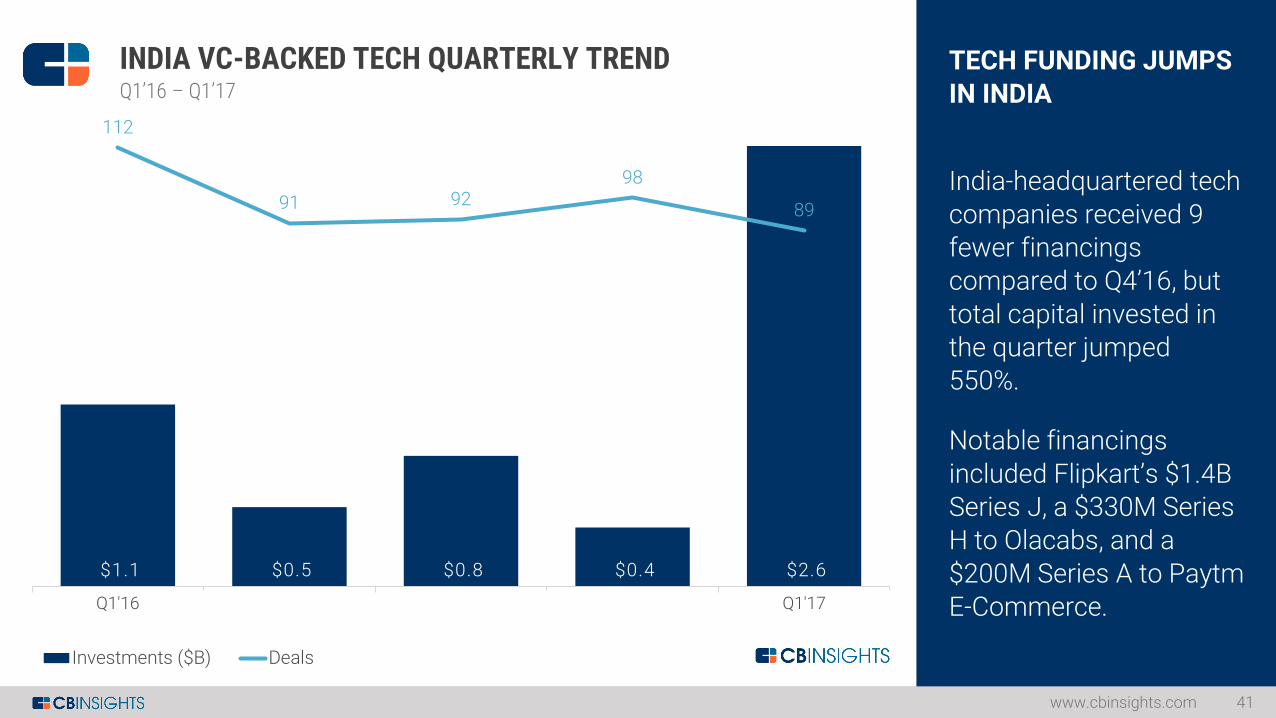
$1.1 $0.5 $0.8 $0.4 $2.6
112
91 9298
89
Q1'16 Q1'17
Investments ($B) Deals
TECH FUNDING JUMPS
IN INDIA
India-headquartered tech
companies received 9 fewer financings compared to Q4’16, but
total capital invested in the quarter jumped 550%.
Notable financings
included Flipkart’s $1.4B Series J, a $330M Series H to Olacabs, and a
$200M Series A to Paytm E-Commerce.
www.cbinsights.com 41
INDIA VC-BACKED TECH QUARTERLY TRENDQ1’16 – Q1’17
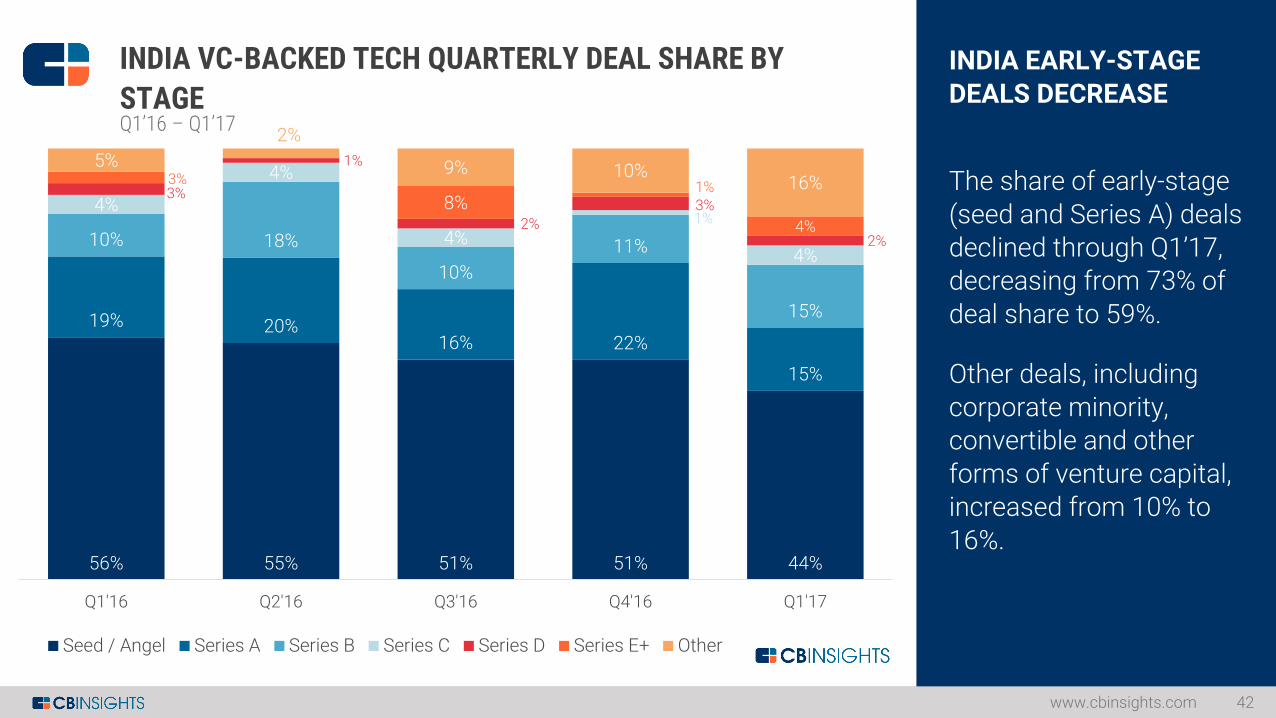
56% 55% 51% 51% 44%
19% 20%16% 22%
15%
10% 18%
10%
11%
15%
4%
4%
4%1%
4%
3%
1%
2%
3%
2%
3%
8%1%
4%
5%
2%
9% 10%16%
Q1'16 Q2'16 Q3'16 Q4'16 Q1'17
Seed / Angel Series A Series B Series C Series D Series E+ Other
INDIA EARLY-STAGE
DEALS DECREASE
The share of early-stage
(seed and Series A) deals declined through Q1’17, decreasing from 73% of
deal share to 59%.
Other deals, including corporate minority, convertible and other
forms of venture capital, increased from 10% to 16%.
www.cbinsights.com 42
INDIA VC-BACKED TECH QUARTERLY DEAL SHARE BY
STAGEQ1’16 – Q1’17
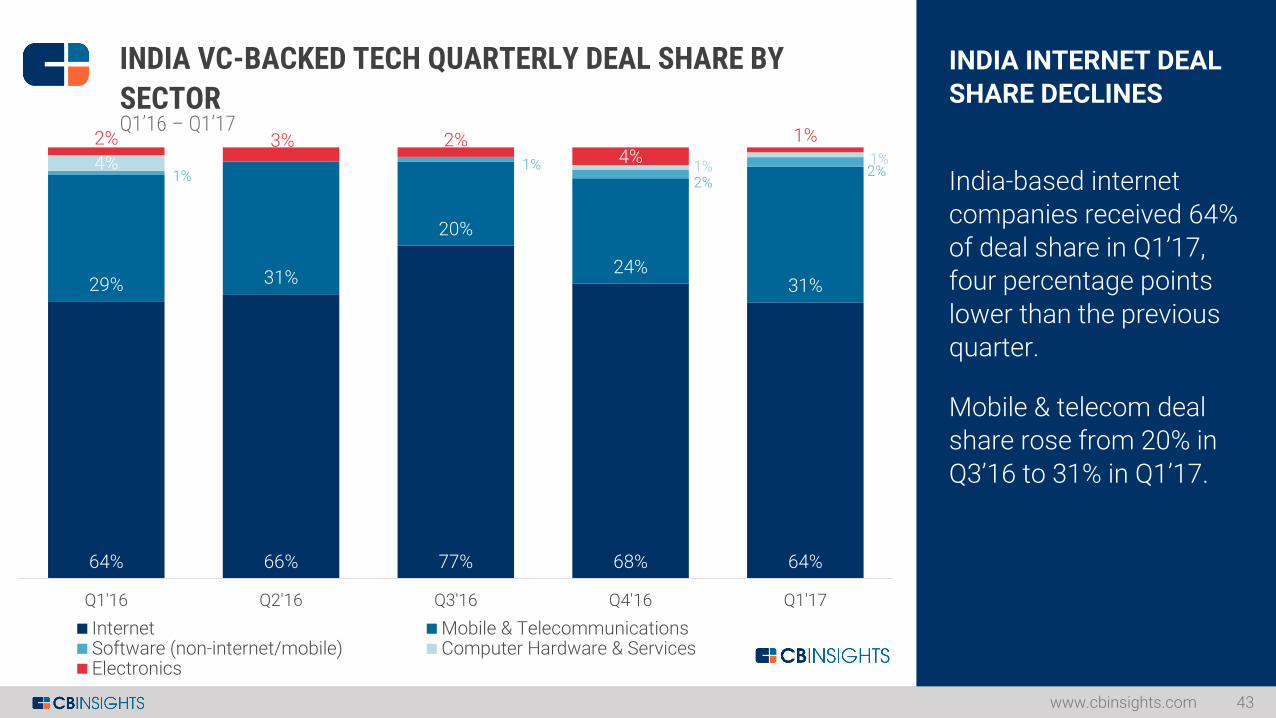
64% 66% 77% 68% 64%
29% 31%
20%
24%31%
1%1%
2%2%4% 1%1%
2% 3% 2%4%
1%
Q1'16 Q2'16 Q3'16 Q4'16 Q1'17
Internet Mobile & TelecommunicationsSoftware (non-internet/mobile) Computer Hardware & ServicesElectronics
INDIA INTERNET DEAL
SHARE DECLINES
India-based internet
companies received 64% of deal share in Q1’17, four percentage points
lower than the previous quarter.
Mobile & telecom deal share rose from 20% in
Q3’16 to 31% in Q1’17.
www.cbinsights.com 43
INDIA VC-BACKED TECH QUARTERLY DEAL SHARE BY
SECTORQ1’16 – Q1’17
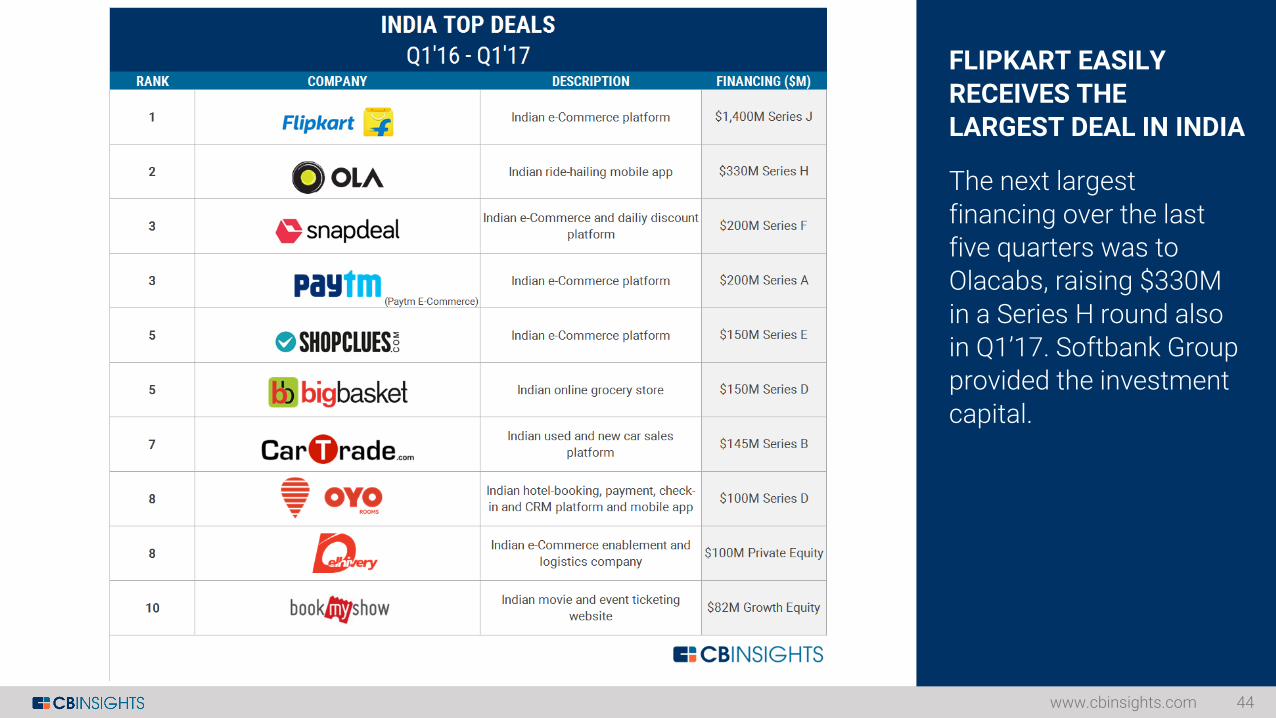
FLIPKART EASILY
RECEIVES THE LARGEST DEAL IN INDIA
The next largest
financing over the last five quarters was to Olacabs, raising $330M
in a Series H round also in Q1’17. Softbank Group provided the investment
capital.
www.cbinsights.com 44
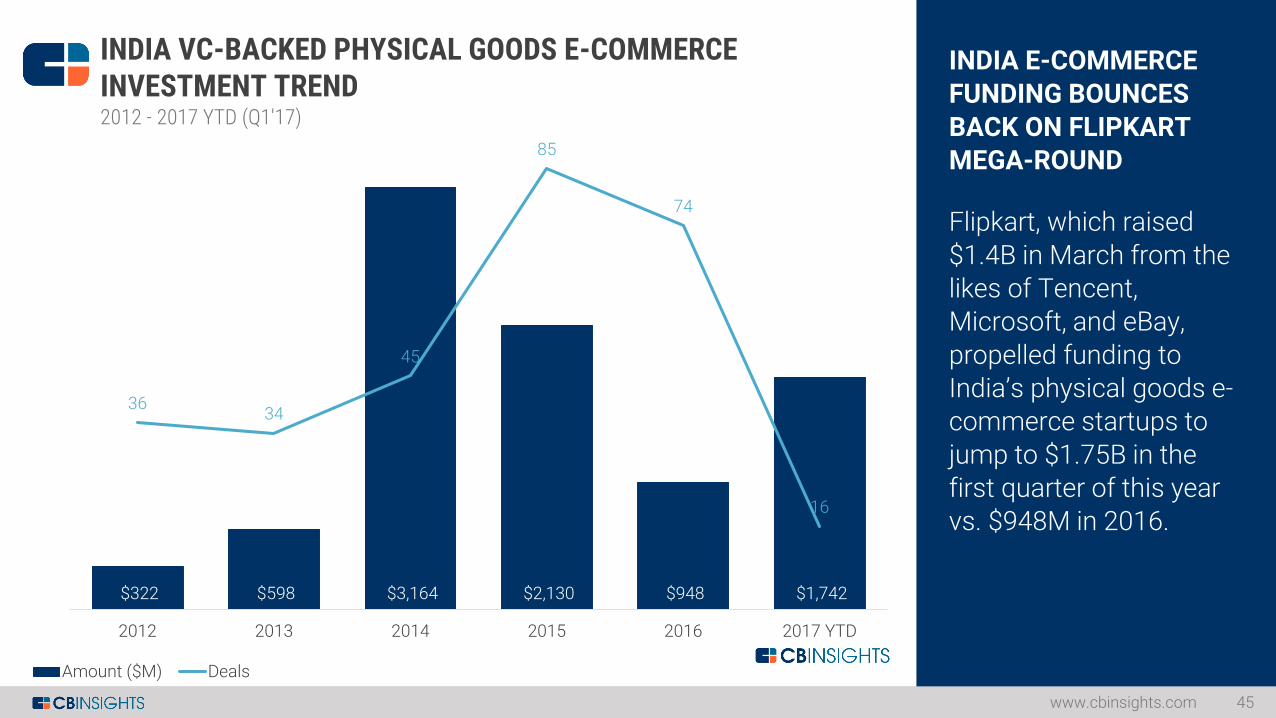
INDIA E-COMMERCE
FUNDING BOUNCES BACK ON FLIPKART MEGA-ROUND
Flipkart, which raised
$1.4B in March from the likes of Tencent, Microsoft, and eBay,
propelled funding to India’s physical goods e-commerce startups to
jump to $1.75B in the first quarter of this year vs. $948M in 2016.
www.cbinsights.com 45
$322 $598 $3,164 $2,130 $948 $1,742
3634
45
85
74
16
0
10
20
30
40
50
60
70
80
90
$-
$500
$1,000
$1,500
$2,000
$2,500
$3,000
$3,500
2012 2013 2014 2015 2016 2017 YTD
INDIA VC-BACKED PHYSICAL GOODS E-COMMERCE INVESTMENT TREND2012 - 2017 YTD (Q1'17)
Amount ($M) Deals

PAYTM PUSHES UP
FINTECH FUNDING IN INDIA
While VC-backed fintech
investment in India saw a lackluster Q1’17, Softbank’s $1.4B
investment into Paytm parent One97 Communications should
put 2017 on pace for a new high in Indian fintech funding.
www.cbinsights.com 46
$11 $35 $22 $170 $81 $33
89
22
3235
3
0
5
10
15
20
25
30
35
40
$-
$20
$40
$60
$80
$100
$120
$140
$160
$180
2012 2013 2014 2015 2016 2017 YTD
INDIA VC-BACKED FINTECH INVESTMENT TREND2012 - 2017 YTD (Q1'17)
Amount ($M) Deals

SOUTHEAST ASIAFINANCING TRENDS
www.cbinsights.com 47
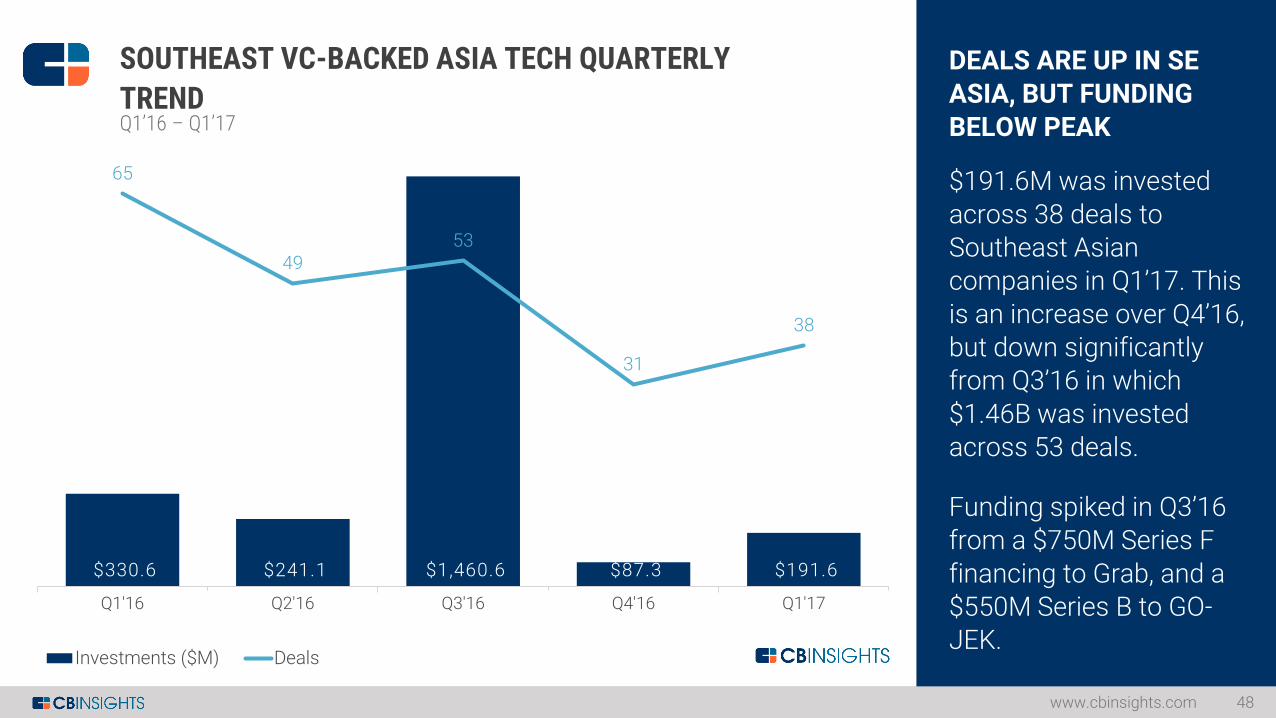
$330.6 $241.1 $1,460.6 $87.3 $191.6
65
4953
31
38
Q1'16 Q2'16 Q3'16 Q4'16 Q1'17
Investments ($M) Deals
DEALS ARE UP IN SE
ASIA, BUT FUNDING BELOW PEAK
$191.6M was invested
across 38 deals to Southeast Asian companies in Q1’17. This
is an increase over Q4’16, but down significantly from Q3’16 in which
$1.46B was invested across 53 deals.
Funding spiked in Q3’16 from a $750M Series F
financing to Grab, and a $550M Series B to GO-JEK.
www.cbinsights.com 48
SOUTHEAST VC-BACKED ASIA TECH QUARTERLY
TRENDQ1’16 – Q1’17
57% 65% 38% 52% 55%
26%
22%
32%
23%21%
6%4%
23% 3%
11%
2% 2%
6%
5%2%
6%
2% 2%9%4%
2%
10% 8%
Q1'16 Q2'16 Q3'16 Q4'16 Q1'17
Seed / Angel Series A Series B Series C Series D Series E+ Other
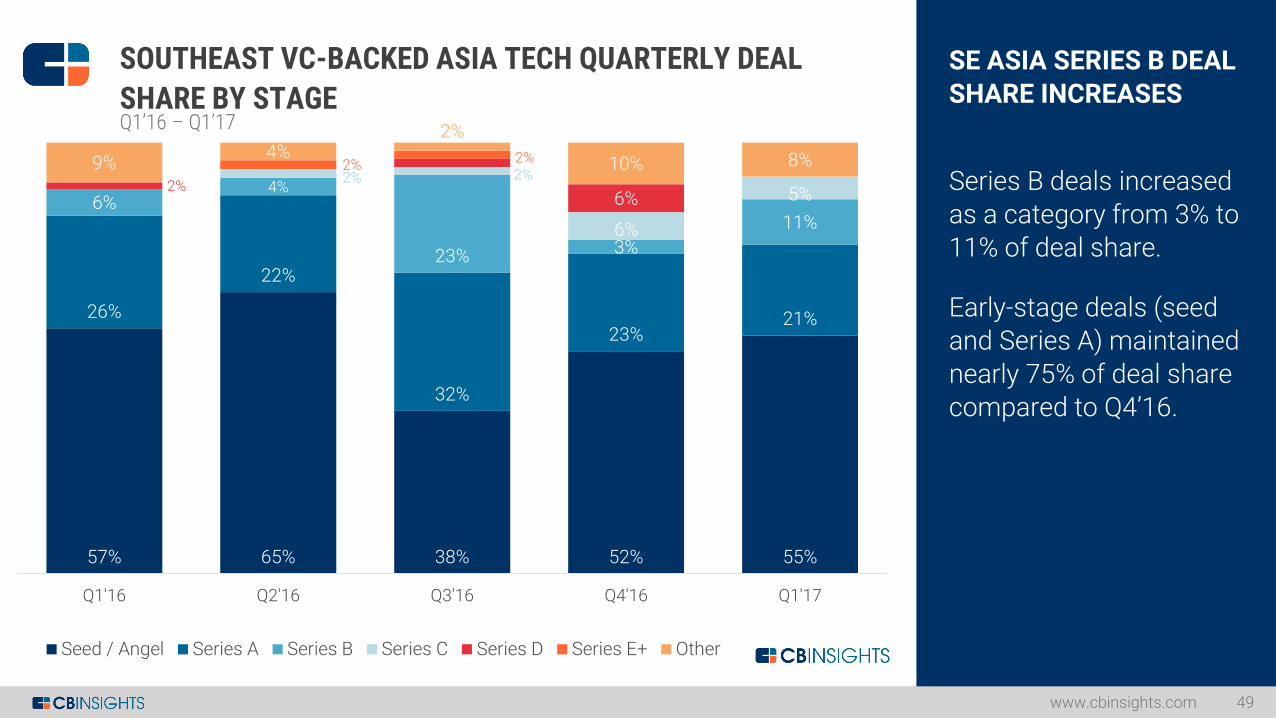
SE ASIA SERIES B DEAL
SHARE INCREASES
Series B deals increased
as a category from 3% to 11% of deal share.
Early-stage deals (seed and Series A) maintained
nearly 75% of deal share compared to Q4’16.
www.cbinsights.com 49
SOUTHEAST VC-BACKED ASIA TECH QUARTERLY DEAL
SHARE BY STAGEQ1’16 – Q1’17
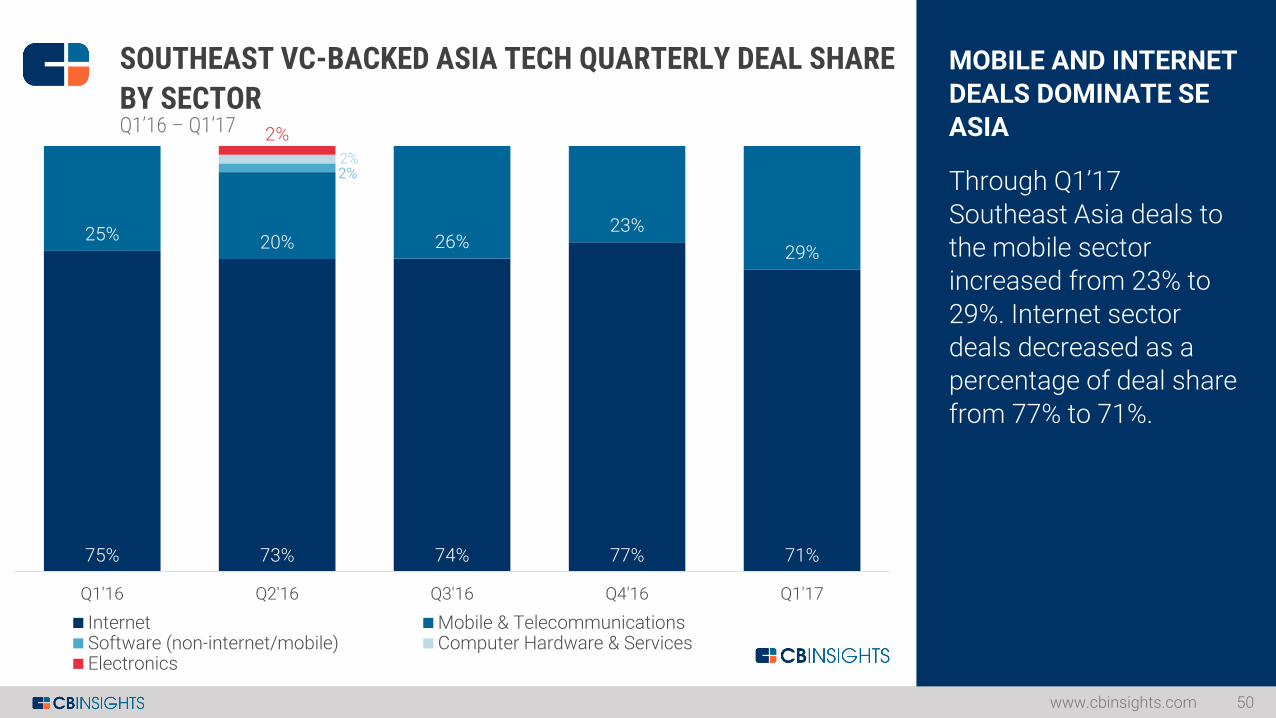
75% 73% 74% 77% 71%
25% 20% 26%23%
29%
0%
2%
0% 0% 0%
2%
2%
Q1'16 Q2'16 Q3'16 Q4'16 Q1'17
Internet Mobile & TelecommunicationsSoftware (non-internet/mobile) Computer Hardware & ServicesElectronics
MOBILE AND INTERNET
DEALS DOMINATE SE ASIA
Through Q1’17
Southeast Asia deals to the mobile sector increased from 23% to
29%. Internet sector deals decreased as a percentage of deal share
from 77% to 71%.
www.cbinsights.com 50
SOUTHEAST VC-BACKED ASIA TECH QUARTERLY DEAL SHARE
BY SECTORQ1’16 – Q1’17
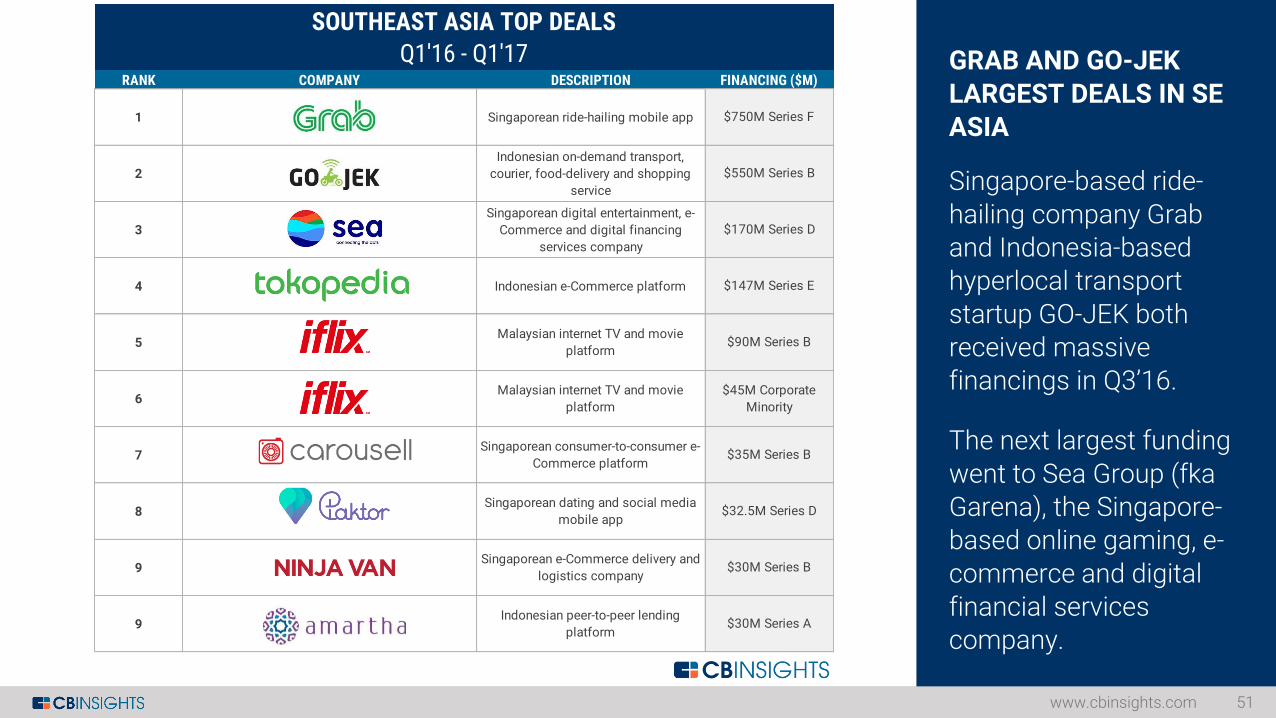
GRAB AND GO-JEK
LARGEST DEALS IN SE ASIA
Singapore-based ride-
hailing company Grab and Indonesia-based hyperlocal transport
startup GO-JEK both received massive financings in Q3’16.
The next largest funding
went to Sea Group (fkaGarena), the Singapore-based online gaming, e-
commerce and digital financial services company.
www.cbinsights.com 51
RANK DESCRIPTION
1 Singaporean ride-hailing mobile app
2
Indonesian on-demand transport,
courier, food-delivery and shopping
service
3
Singaporean digital entertainment, e-
Commerce and digital financing
services company
4 Indonesian e-Commerce platform
5Malaysian internet TV and movie
platform
6Malaysian internet TV and movie
platform
7Singaporean consumer-to-consumer e-
Commerce platform
8Singaporean dating and social media
mobile app
9Singaporean e-Commerce delivery and
logistics company
9Indonesian peer-to-peer lending
platform
$30M Series B
$30M Series A
$147M Series E
$90M Series B
$45M Corporate
Minority
$35M Series B
$32.5M Series D
SOUTHEAST ASIA TOP DEALS
Q1'16 - Q1'17FINANCING ($M)
$750M Series F
$550M Series B
$170M Series D
COMPANY
SOUTHEAST ASIA
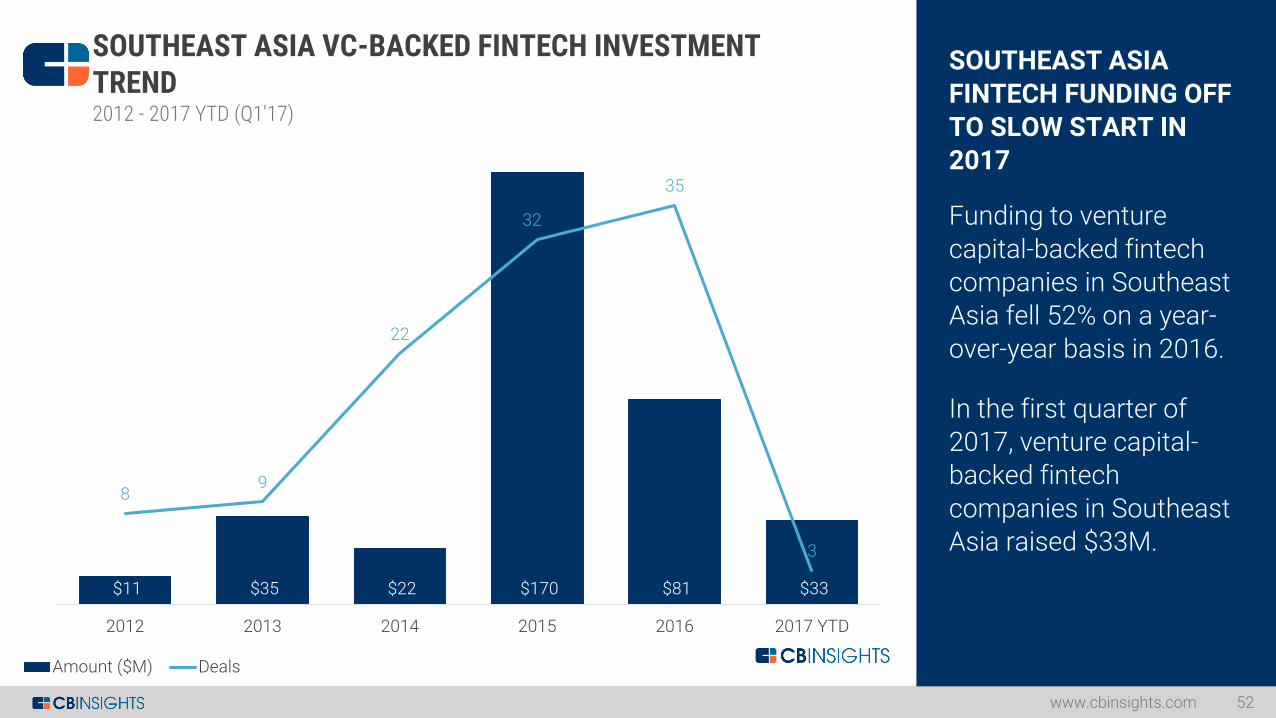
FINTECH FUNDING OFF TO SLOW START IN 2017
Funding to venture
capital-backed fintech companies in Southeast Asia fell 52% on a year-
over-year basis in 2016.
In the first quarter of 2017, venture capital-backed fintech
companies in Southeast Asia raised $33M.
www.cbinsights.com 52
$11 $35 $22 $170 $81 $33
89
22
32
35
3
0
5
10
15
20
25
30
35
40
$-
$20
$40
$60
$80
$100
$120
$140
$160
$180
2012 2013 2014 2015 2016 2017 YTD
SOUTHEAST ASIA VC-BACKED FINTECH INVESTMENT TREND2012 - 2017 YTD (Q1'17)
Amount ($M) Deals
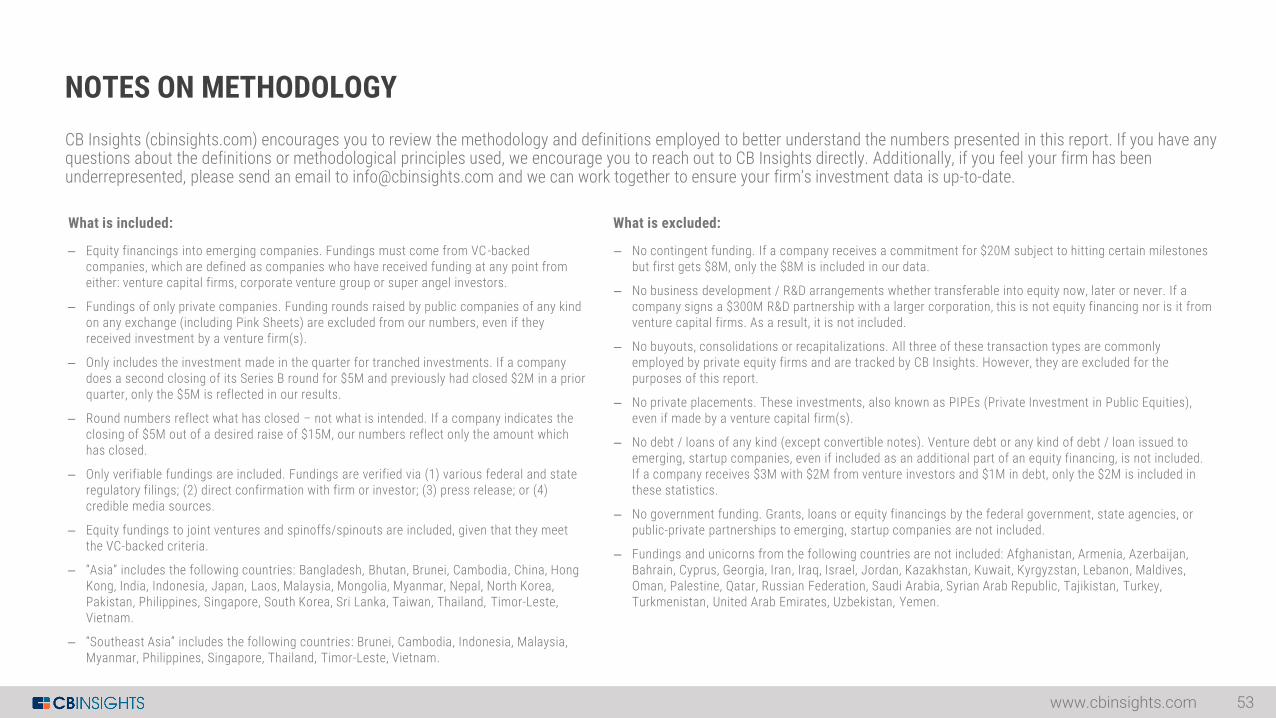
CB Insights (cbinsights.com) encourages you to review the methodology and definitions employed to better understand the numbers presented in this report. If you have any questions about the definitions or methodological principles used, we encourage you to reach out to CB Insights directly. Additionally, if you feel your firm has been underrepresented, please send an email to [email protected] and we can work together to ensure your firm’s investment data is up-to-date.
NOTES ON METHODOLOGY
www.cbinsights.com 53
What is included: What is excluded:
– Equity financings into emerging companies. Fundings must come from VC-backed companies, which are defined as companies who have received funding at any point from either: venture capital firms, corporate venture group or super angel investors.
– Fundings of only private companies. Funding rounds raised by public companies of any kind on any exchange (including Pink Sheets) are excluded from our numbers, even if they received investment by a venture firm(s).
– Only includes the investment made in the quarter for tranched investments. If a company does a second closing of its Series B round for $5M and previously had closed $2M in a prior quarter, only the $5M is reflected in our results.
– Round numbers reflect what has closed – not what is intended. If a company indicates the closing of $5M out of a desired raise of $15M, our numbers reflect only the amount which has closed.
– Only verifiable fundings are included. Fundings are verified via (1) various federal and state regulatory filings; (2) direct confirmation with firm or investor; (3) press release; or (4) credible media sources.
– Equity fundings to joint ventures and spinoffs/spinouts are included, given that they meet the VC-backed criteria.
– “Asia” includes the following countries: Bangladesh, Bhutan, Brunei, Cambodia, China, Hong Kong, India, Indonesia, Japan, Laos, Malaysia, Mongolia, Myanmar, Nepal, North Korea, Pakistan, Philippines, Singapore, South Korea, Sri Lanka, Taiwan, Thailand, Timor-Leste, Vietnam.
– “Southeast Asia” includes the following countries: Brunei, Cambodia, Indonesia, Malaysia, Myanmar, Philippines, Singapore, Thailand, Timor-Leste, Vietnam.
– No contingent funding. If a company receives a commitment for $20M subject to hitting certain milestones but first gets $8M, only the $8M is included in our data.
– No business development / R&D arrangements whether transferable into equity now, later or never. If a company signs a $300M R&D partnership with a larger corporation, this is not equity financing nor is it from venture capital firms. As a result, it is not included.
– No buyouts, consolidations or recapitalizations. All three of these transaction types are commonly employed by private equity firms and are tracked by CB Insights. However, they are excluded for the purposes of this report.
– No private placements. These investments, also known as PIPEs (Private Investment in Public Equities), even if made by a venture capital firm(s).
– No debt / loans of any kind (except convertible notes). Venture debt or any kind of debt / loan issued to emerging, startup companies, even if included as an additional part of an equity financing, is not included. If a company receives $3M with $2M from venture investors and $1M in debt, only the $2M is included in these statistics.
– No government funding. Grants, loans or equity financings by the federal government, state agencies, or public-private partnerships to emerging, startup companies are not included.
– Fundings and unicorns from the following countries are not included: Afghanistan, Armenia, Azerbaijan, Bahrain, Cyprus, Georgia, Iran, Iraq, Israel, Jordan, Kazakhstan, Kuwait, Kyrgyzstan, Lebanon, Maldives, Oman, Palestine, Qatar, Russian Federation, Saudi Arabia, Syrian Arab Republic, Tajikistan, Turkey, Turkmenistan, United Arab Emirates, Uzbekistan, Yemen.