cb(1)578/07-08(01) - legislative council of hong kong · cb(1)578/07-08(01) independent analysis...
TRANSCRIPT

CB(1)578/07-08(01)


Independent Analysis and Reporting of the
Public Viewing Exercise for the Tamar Development Project
Final Report
Public Policy Research Institute The Hong Kong Polytechnic University
June 2007
Annex A

Table of Contents 1. INTRODUCTION ...............................................................................................................1
1.1 BACKGROUND OF THE TAMAR DEVELOPMENT PROJECT ....................................1 1.2 SELECTION PROCESS .......................................................................................................1 1.3 THE PUBLIC VIEWING EXERCISE..................................................................................1 1.4 OBJECTIVES OF THE CONSULTANCY ..........................................................................2 1.5 THE CONSULTANCY TEAM.............................................................................................3 1.6 MODUS OPERANDI............................................................................................................3 1.7 SCOPE OF SERVICES.........................................................................................................3 1.8 SCHEMATIC REPRESENTATION OF THE CONSULTANCY.......................................4
2. QUANTITATIVE DATA ANALYSIS...............................................................................5 2.1 COMMENT CARDS.............................................................................................................5 2.2 EXIT POLLS .......................................................................................................................10 2.3 TELEPHONE POLLS .........................................................................................................11 2.4 QUANTITATIVE DATA ANALYSIS SUMMARY .........................................................23
3. QUALITATIVE DATA ANALYSIS ...............................................................................24 3.1 SOURCES OF QUALITATIVE DATA .............................................................................24 3.2 ANALYTICAL FRAMEWORK FOR OPEN-ENDED QUESTIONS AND WRITTEN
SUBMISSIONS...................................................................................................................24 3.3 DATA ANALYSIS ON WRITTEN SUBMISSIONS AND OPEN-ENDED QUESTIONS
.............................................................................................................................................32 3.4 QUALITATIVE DATA ANALYSIS SUMMARY............................................................56
4. ANALYSIS OF THE KEY POINTS................................................................................60 4.1 METHODOLOGICAL CONSIDERATIONS ....................................................................60 4.2 ISSUES OF GREATEST CONCERN ................................................................................62 4.3 THE FOUR DESIGNS ........................................................................................................62 4.4 HIGH LEVEL OF PUBLIC INTEREST ............................................................................64
5. SUMMARY AND CONCLUSIONS ................................................................................65 5.1 SUMMARY OF FINDINGS...............................................................................................65 5.2 CONCLUSION....................................................................................................................66
APPENDICES ....................................................................................................................................67 Appendix 1 Composition and Organisation Structure of the Consultancy Team................................68 Appendix 2 Quantitative Results of the Comment Cards....................................................................70 Appendix 3 Exit Poll Results...............................................................................................................80 Appendix 4 Telephone Poll Results...................................................................................................101 Appendix 5 Frequency Counts of Comments from Comment Cards & Written Submissions .........120 Appendix 6 Sample of Blank Comment Card ...................................................................................137 Appendix 7 Sample of Exit Poll Questionnaire.................................................................................141 Appendix 8 Sample of Telephone Poll Questionnaire.......................................................................143 Figure 1: Schematic Representation of the Consultancy.......................................................................4 Figure 3.1 :Analytical Framework.......................................................................................................25 Figure 3.2: Analytical Framework on the Tamar Development Project..............................................26 Figure 3.3: Illustration of Data Processing Steps…………………………………………………….29 Figure 3.4: Distribution of Comments (arranged by themes) on Tamar Development Project Based
on Frequency Counts (in text units).............................................................................................30 Figure 3.5: Distribution of Comments (top 15 categories) on Tamar Development Project Based on
Frequency Counts (in text units)..................................................................................................31

Table 3.1: Number of Positive Comments on Individual Designs by Themes....................................58 Table 3.2: Number of Negative Comments on Individual Designs by Themes ..................................59 Table 4.1: Characteristics of Respondents from Various Data Sets:...................................................61 Table 4.2: Mean Score Results of the Exit Polls .................................................................................63 Table 4.3: Mean Score of Each Design for Each Question (Comment Card Data Set) ......................63 Table 4.4: Positive and Negative Comment Counts for the Four Designs ..........................................64 Table 2.1.1 (a) Visual attractiveness....................................................................................................71 Table 2.1.2 (b) Symbol of Hong Kong as Asia’s world city ...............................................................72 Table 2.1.3 (c) Image befitting the Central Government Complex and the Legislative Council
Complex.......................................................................................................................................73 Table 2.1.4 (d) Impact on cityscape and waterfront environment .......................................................74 Table 2.1.5 (e) Green features and environmental friendliness...........................................................75 Table 2.1.6 (f) Public open space ........................................................................................................76 Table 2.1.7 (g) Connectivity of the Tamar site and surrounding areas ...............................................77 Table 2.1.8 Mean scores for each design for each question. ...............................................................78 Table 2.1.9 Age....................................................................................................................................79 Table 2.1.10 Gender.............................................................................................................................79 Table 2.1.11 Area of Residence...........................................................................................................79 Table 3.1.1 Visual attractiveness .........................................................................................................81 Table 3.1.2 Image befitting the Central Government Complex and the Legislative Council Complex
.....................................................................................................................................................82 Table 3.1.3 Impact on cityscape and waterfront environment.............................................................83 Table 3.1.4 Age....................................................................................................................................84 Table 3.1.5 Gender...............................................................................................................................84 Table 3.1.6 Area of residence ..............................................................................................................84 Table 3.2.1 Visual attractiveness .........................................................................................................85 Table 3.2.2 Image befitting the Central Government Complex and the Legislative Council Complex
.....................................................................................................................................................86 Table 3.2.3 Impact on cityscape and waterfront environment.............................................................87 Table 3.2.4 Age....................................................................................................................................88 Table 3.2.5 Gender...............................................................................................................................88 Table 3.2.6 Area of residence ..............................................................................................................88 Table 3.3.1 Visual attractiveness .........................................................................................................89 Table 3.3.2 Image befitting the Central Government Complex and the Legislative Council Complex
.....................................................................................................................................................90 Table 3.3.3 Impact on cityscape and waterfront environment.............................................................91 Table 3.3.4 Age....................................................................................................................................92 Table 3.3.5 Gender...............................................................................................................................92 Table 3.3.6 Area of residence ..............................................................................................................92 Table 3.4.1 Visual attractiveness .........................................................................................................93 Table 3.4.2 Image befitting the Central Government Complex and the Legislative Council Complex
.....................................................................................................................................................94 Table 3.4.3 Impact on cityscape and waterfront environment.............................................................95 Table 3.4.4 Age....................................................................................................................................96 Table 3.4.5 Gender...............................................................................................................................96 Table 3.4.6 Area of residence ..............................................................................................................96 Table 3.5.1 Visual attractiveness .........................................................................................................97

Table 3.5.2 Image befitting the Central Government Complex and the Legislative Council Complex.....................................................................................................................................................98
Table 3.5.3 Impact on cityscape and waterfront environment.............................................................99 Table 3.5.4 Age..................................................................................................................................100 Table 3.5.5 Gender.............................................................................................................................100 Table 3.5.6 Area of residence ............................................................................................................100 Table 4.1.1 [v4] Do you know that the Government is holding a public exhibition of “Design
Proposals for the Tamar Development Project”? ......................................................................102 Table 4.1.2 [v5] (If answered “yes” in v4) Do you know how many design proposals in total?......102 Table 4.1.3 [v6] (If answered “yes” in v4) How do you know about the exhibition of “Design
Proposals for the Tamar Development Project”? (Interviewers: Please do not read out the answers, respondent can choose more than one answer; please prompt: any other channel?)..103
Table 4.1.4 [v7] In terms of “visual attractiveness”, which design(s) do you think is/are comparatively better in the four design proposals? (Interviewers: respondent can choose more than one answer; please prompt: any other design?) .................................................................104
Table 4.1.5 [v8] In terms of “image befitting the Central Government Complex and the Legislative Council Complex”, which design(s) do you think is/are comparatively better in the four design proposals? (Interviewers: respondent can choose more than one answer; please prompt: any other design?).............................................................................................................................104
Table 4.1.6 [v9] In terms of “impact on cityscape and waterfront environment”, which design(s) do you think is/are comparatively better in the four design proposals? (Interviewers: respondent can choose more than one answer; please prompt: any other design?) .....................................105
Table 4.1.7 [v10] Overall speaking, which design(s) do you think is/are comparatively better in the four design proposals? (Interviewers: respondent can choose more than one answer; please prompt: any other design?) ........................................................................................................105
Table 4.1.8 [v11] Would you please tell me the reason(s) why you select this/these design proposal(s)?................................................................................................................................106
Table 4.1.9 [v12] Have you seen all the showpieces in the public exhibition, including 18 exhibition boards, introductory videos, and design models? ......................................................................107
Table 4.1.10 [v13] Are you satisfied or dissatisfied with the public exhibition of “Design Proposals for the Tamar Development Project”? .......................................................................................108
Table 4.1.11 [v15] Gender of the respondent ....................................................................................109 Table 4.1.12 [v16] What is your age?................................................................................................109 Table 4.1.13 [v17] In which area are you living?..............................................................................109 Table 4.1.14 [v18] Are you currently working or non-working? ......................................................109 Table 4.1.15 [v19] Are you a…? .......................................................................................................110 Table 4.1.16 [v20] What is your current position? ............................................................................110 Table 4.2.1 [v4] Do you know that the Government is holding a public exhibition of “Design
Proposals for the Tamar Development Project”? ......................................................................111 Table 4.2.2 [v5] (If answered “yes” in v4) Do you know how many design proposals in total?......111 Table 4.2.3 [v6] (If answered “yes” in v4) How do you know about the exhibition of “Design
Proposals for the Tamar Development Project”? (Interviewers: Please do not read out the answers, respondent can choose more than one answer; please prompt: any other channel?)..112
Table 4.2.4 [v7] In terms of “visual attractiveness”, which design(s) do you think is/are comparatively better in the four design proposals? (Interviewers: respondent can choose more than one answer; please prompt: any other design?) .................................................................113
Table 4.2.5 [v8] In terms of “image befitting the Central Government Complex and the Legislative Council Complex”, which design(s) do you think is/are comparatively better in the four design proposals? (Interviewers: respondent can choose more than one answer; please prompt: any other design?).............................................................................................................................113

Table 4.2.6 [v9] In terms of “impact on cityscape and waterfront environment”, which design(s) do you think is/are comparatively better in the four design proposals? (Interviewers: respondent can choose more than one answer; please prompt: any other design?) .....................................114
Table 4.2.7 [v10] Overall speaking, which design(s) do you think is/are comparatively better in the four design proposals? (Interviewers: respondent can choose more than one answer; please prompt: any other design?) ........................................................................................................114
Table 4.2.8 [v11] Would you please tell me the reason(s) why you select this/these design proposal(s)?................................................................................................................................115
Table 4.2.9 [v12] Have you seen all the showpieces in the public exhibition, including 18 exhibition boards, introductory videos, and design models? ......................................................................116
Table 4.2.10 [v13] Are you satisfied or dissatisfied with the public exhibition of “Design Proposals for the Tamar Development Project”? .......................................................................................117
Table 4.2.11 [v15] Gender of the respondent ....................................................................................118 Table 4.2.12 [v16] What is your age?................................................................................................118 Table 4.2.13 [v17] In which area are you living?..............................................................................118 Table 4.2.14 [v18] Are you currently working or non-working? ......................................................118 Table 4.2.15 [v19] Are you a…? .......................................................................................................119 Table 4.2.16 [v20] What is your current position? ............................................................................119 Table 5.1: Frequency Count of Qualitative Data...............................................................................121 Table 5.2 Four Designs Ranking by Comments ................................................................................122 Table 5.3 Visual attractiveness ..........................................................................................................123 Table 5.4 Symbol of Hong Kong as Asia’s world city......................................................................124 Table 5.5 Image befitting the Central Government Complex and the Legislative Council Complex
...................................................................................................................................................125 Table 5.6 Impact on cityscape and waterfront environment..............................................................126 Table 5.7 Green features and environment friendliness ....................................................................127 Table 5.8 Public open space ..............................................................................................................129 Table 5.9 Connectivity of the Tamar site and surrounding areas ......................................................131 Table 5.10 Comments on certain unique features..............................................................................132 Table 5.11 Feng Shui concerns..........................................................................................................133 Table 5.12 Overall preference ...........................................................................................................134 Table 5.13 Cost factor (estimate/perception).....................................................................................135 Table 5.14 Public consultation process……......................................................................................136 Table 5.15 Other overall comments……………………………………………………………...... 136

Chapter 1: Introduction
1
1. INTRODUCTION
In July 2006, the Hong Kong Special Administrative Region Government (the Government) commissioned the Public Policy Research Institute (PPRI) of The Hong Kong Polytechnic University (the University) to carry out a Consultancy on “Independent Analysis and Reporting of the Public Viewing Exercise for the Tamar Development Project”. This Report presents the findings of this Public Viewing Exercise and includes: (1) a summary of the views expressed on the 14,091 Comment Cards and Written Submissions collected up to 27 May 2007, (2) a summary of the results of four Exit Polls conducted during the periods 1-8 April, 16-24 April, 1-9 May and 15-23 May 2007, and (3) a summary of the results of two Telephone Polls conducted during the periods 22 April to 1 May 2007 and 11 to 18 May 2007. With the consent of the four tenderers, views expressed at the Legislative Council Commission meeting held on 1 June 2007 are also included in the analysis.
1.1 BACKGROUND OF THE TAMAR DEVELOPMENT PROJECT 1.1.1 A Central Government Complex (CGC) and a Legislative Council (LegCo) Complex,
together with at least two hectares of open space, are to be developed on the 4.2-hectare Tamar site in Central District, Hong Kong Island.
1.1.2 In April 2002, the Government announced a plan to develop Tamar as Hong Kong’s prime
civic core. The project obtained support from the LegCo Panel on Planning, Lands and Works and the Public Works Subcommittee in April and May 2003 respectively, but was shelved later that year in view of the impact of the SARS outbreak. With improvement in the economy and to public finances, the Government announced in October 2005 a re-launch of the Tamar Development Project.
1.1.3 The scope of the re-launched project covers the proposed CGC, LegCo Complex, open
space and other ancillary facilities. In order to develop Tamar as Hong Kong’s prime civic core, the design is required to project Hong Kong’s position as a cosmopolitan city and Asia’s world city. It should be responsive to the urban fabric of Central District as well as the natural context of the waterfront setting and the backdrop of Victoria Peak. The distinct identities of the CGC and LegCo Complex should be duly reflected, taking into account their respective constitutional roles. The project should also provide a long-term solution to the office-space shortage facing the Government Secretariat and LegCo. The project is envisaged to commence in 2007, for completion in 2010.
1.2 SELECTION PROCESS
A Special Selection Board, chaired by the Chief Secretary for Administration, Mr. Rafael Hui, will assess the tenders according to a number of criteria, including planning, sustainability, environmental, functional, technical, price, design and aesthetic aspects. Board Members include Mrs. Rita Fan, Ms. Miriam Lau, Professor David Lung, Mr. Alan Lai and Mrs Rita Lau.
1.3 THE PUBLIC VIEWING EXERCISE 1.3.1 In view of the uniqueness and significance of the Tamar project, the Government organised
a Public Viewing Exercise during the tender evaluation stage to provide an opportunity for

Chapter 1: Introduction
the public to comment on the tender design proposals before final selection by the Special Selection Board. The Public Viewing Exercise is part of the tender exercise and the integrity and fairness of the tender process have to be safeguarded.
1.3.2 The Special Selection Board is the sole authority for assessing the tenders and deciding on
the contract award. Public views were sought only on the design and aesthetic aspects of the tender design proposals.
1.3.3 The Public Viewing Exercise on the Tamar Development Project was launched in March
2007. The Government organised an exhibition (staged at two separate venues) on the four tenderers’ design proposals for the Tamar Development Project. The first one was staged at a Hong Kong Island venue (Deck Level, High Block, Queensway Government Offices) from 28 March to 24 April 2007. The second one was staged at a Kowloon venue (Thematic Exhibition Gallery, Hong Kong Heritage Discovery Centre, Kowloon Park) from 28 April to 27 May 2007.
1.3.4 Comment Cards were distributed at the exhibition venues for visitors to complete and deposit into collection boxes before leaving. Alternatively, Comment Cards could be submitted online (via computers at the exhibition venues or via the internet), or by fax or post. Information on the four design proposals was also available on the Government Website, where members of the public could complete Comment Cards online after viewing. The public could also send in Written Submissions to the Government, where they would be processed by designated Government staff and delivered to PPRI for analysis.
1.4 OBJECTIVES OF THE CONSULTANCY
1.4.1 This Consultancy aims to analyse public opinion regarding the Tamar Development Project collected during the Public Viewing Exercise period (28 March to 27 May 2007) and to provide independent analyses and technical advice to the Government regarding such public opinion.
1.4.2 The Consultancy can be divided into two major parts: (see Figure 1)
Part 1: Quantitative Analysis of the views received during the Public Viewing Exercise period on the four Tamar Development Project design proposals; and Part 2: Qualitative Analysis of the views received during the Public Viewing Exercise period on the four Tamar Development Project design proposals.
1.4.3 Under Part 1, The Consultancy Team analysed the views received from:
(a) responses to the close-ended questions in the Comment Cards; and (b) responses to four Exit Polls and two Telephone Polls.
1.4.4 Under Part 2, The Consultancy Team assessed the views received from:
(a) responses to the open-ended questions on the Comment Cards; and (b) other Written Submissions received by the Government.
2

Chapter 1: Introduction
1.5 THE CONSULTANCY TEAM 1.5.1 In July 2006, the Government invited proposals for consultancy services to conduct an
independent analysis and reporting of the Public Viewing Exercise for the Tamar Development Project.
1.5.2 Following established tendering and selection procedures, the PPRI was appointed by the Government. The Consultancy Team was led by Professor Lee Ngok, Coordinator of PPRI, and Professor Peter Yuen, Professor of the Department of Management & Marketing. Other members included Professor Edwin Chan, Dr. Hanqin Qiu Zhang, Dr. Yuen Kwok Keung, Mr. Derek Gould, Mr. Steven Li, Ms. Joan Li, Ms. Edith Choy and Ms. Jessie Huang. (For the composition and organization structure of the PPRI consultancy team, see Appendix 1).
1.6 MODUS OPERANDI 1.6.1 The PPRI operates with total academic independence. On completing the Consultancy, the
PPRI submitted its report directly to the Government.
1.6.2 All members of the PPRI declared that they had no conflict of interest in undertaking this Consultancy service. The analyses, findings, and interpretation of the findings contained in this Report are the views of the PPRI, and are not necessarily those of the University or the Government.
1.7 SCOPE OF SERVICES
Under this Consultancy, the PPRI was required to conduct an analysis of public views contained on Comment Cards collected during the Public Viewing Exercise, and all Written Submissions, letters, faxes and emails sent to the Government during the Public Viewing Exercise period as well as views expressed at the Legislative Council Commission meeting held on 1 June 2007.
3

Chapter 1: Introduction
1.8 SCHEMATIC REPRESENTATION OF THE CONSULTANCY Figure 1 shows schematically the components and process of the Consultancy.
Quantitative Analysis
o Responses to the close-ended questions in the Comment Cards
o Exit Polls
o Telephone Polls
Summary of public views
o Responses to the open-ended questions in the Comment Cards
o Other Written Submissions
Qualitative Analysis
Figure 1: Schematic Representation of the Consultancy
4

Chapter 2: Quantitative Data Analysis
5
2. QUANTITATIVE DATA ANALYSIS
This Chapter presents the methodology and results of three data collection exercises: (a) responses to the close-ended questions in the Comment Cards; (b) four Exit Polls; and (c) two Telephone Polls.
2.1 COMMENT CARDS The Government organised an exhibition (staged at two separate venues) on the four tenderers’ design proposals for the Tamar Development Project. The first one was staged at a Hong Kong Island venue (Deck Level, High Block, Queensway Government Offices) from 28 March to 24 April 2007. The second one was staged at a Kowloon venue (Thematic Exhibition Gallery, Hong Kong Heritage Discovery Centre, Kowloon Park) from 28 April to 27 May 2007. Comment Cards were distributed at these exhibition venues for visitors to complete and deposit into collection boxes before leaving. Alternatively, Comment Cards could be submitted online (via computers at the exhibition venues or via the internet), or by fax or post. Information on the four design proposals was also available on the Government’s website, where members of the public could complete Comment Cards online after viewing. The Comment Card contains seven close-ended questions inviting the public to grade the various aspects of the designs. There are two open-ended questions where the public can express their opinions on each individual design or give other opinions. A blank Comment Card is shown in Appendix 6. Comment Cards from collection boxes at the exhibition venues, via the internet, by fax, and post were all counted, dated, and numbered by designated Government staff before delivery to PPRI.
2.1.1 Comment Cards Received
Comment Cards were collected during the Public Viewing Exercise period (28 March to 27 May 2007). A total of 14,055 valid Comment Cards was received by 27 May 2007 which was the end date of the Public Viewing Exercise period. Of these:
10,939 were from the exhibition venues, 3,011 were electronic versions via the internet, 89 were by fax, and 16 were by mail.
A total of 31,472 persons went to the Exhibitions. On average, 35% of the visitors filled out a Comment Card at the venue. There were 72,962 visits to the Government’s Tamar Development Project webpage.

Chapter 2: Quantitative Data Analysis
A weekly breakdown of Comment Cards received is shown below.
Date Received at the venue
Received via internet
Received by fax
Received by mail Total
1st week (28/03 – 03/04)
2,287 1,029 1 3 3,320
2nd week (04/04 – 10/04)
1,597 620 0 1 2,218
3rd week (11/04 – 17/04)
1,175 371 0 1 1,547
4th week (18/04 – 24/04)
1,127 314 0 0 1,441
5th week (25/04 – 01/05)
1,257 223 0 2 1,482
6th week (02/05 – 08/05)
1,041 112 1 1 1,155
7th week (09/05 – 15/05)
967 121 0 2 1,090
8th week (16/05 – 22/05)
577 120 0 4 701
9th week (23/05 – 27/05)
911 101 87 2 1,101
Total (28/03 – 27/05)
10,939 3,011 89 16 14,055
Each Comment Card included a section requesting the respondent to supply some demographic information. Around 90% of the respondents filled out this section wholly or in part.
6

Chapter 2: Quantitative Data Analysis
2.1.2 Invalidated Comment Cards Another 74,094 Comment Cards received via the internet were deemed invalid by the
Consultancy Team and were excluded from the analysis. The following paragraphs describe the chain of events and the criteria associated with the invalidation process. The Consultancy Team was alerted to a sudden and dramatic upsurge in the number of Comment Cards received through the internet in early May. It was discovered that a total of 72,893 returns (five of which from this same IP address are deemed valid because they do not satisfy the criteria for invalidating Comment Cards) was sent in from one IP address. These responses are all similar in favouring the design of one tenderer and the IP address in question was found to be allocated to one of the tenderers’ joint venture associate companies. In response, the Government issued an advisory letter to all four tenderers reminding them of the strict provisions laid down in the tender document governing their activities during the tender period. Another letter was sent to the tenderer concerned to demand an explanation. The tenderer concerned subsequently replied categorically confirming that the returns were sent without any authorisation from the joint venture company or its associate company and that it had not taken any action to prejudice or influence the public viewing exercise. It also stated that it had no wish to rely upon these Comment Cards in support of its tender. A report was made on the case to the Hong Kong Police Force, which immediately started an investigation. Based on the criteria described below, the above-mentioned 72,888 Comment Cards (together with another 1,206 Comment Cards) have been invalidated and excluded from the analysis. A batch of Comment Cards is deemed invalid if they satisfied any four of the following five conditions:
1. IP Address: the batch bears the same IP address; 2. Date and Time: the batch is sent within one hour of each other on the same day; 3. Profile Data: the profile data are either identical or almost identical 4. Response to Close-ended Questions: the responses to the close-ended questions are
identical or 90% similar; and 5. Response to Open-ended Questions: the responses to the open-ended questions are
either identical or repeated in a fixed pattern. A single Comment Card is also deemed invalid if the responses to the open-ended questions contained material of a commercial, promotional or obscene nature.
2.1.3 Methodology (Close-ended Questions)
Data collected from the close-ended questions on the Comment Cards were coded by a team of staff. The coded versions were then audited by a different team.
Summary statistics for the answers for each question for all respondents were computed and presented in tabular and graphic forms.
7

Chapter 2: Quantitative Data Analysis
A summary is presented below. The full results and a demographic profile of the respondents from each data set are presented in Appendix 2.
2.1.4 Results
Mean scores for each design for each question
4 = Excellent, 3 = Good, 2 = Fair, 1 = Unsatisfactory
(a) Visual attractiveness
Design A Design B Design C Design D
Mean score1 2.96 2.07 2.31 3.10
Number of responses 12,798 12,265 12,268 13,062
(b) Symbol of Hong Kong as Asia’s world city
Design A Design B Design C Design D
Mean score 2.85 2.01 2.34 3.13
Number of responses 12,555 12,086 12,111 12,932
(c) Image befitting the CGC and the LegCo Complex
Design A Design B Design C Design D
Mean score 2.87 2.21 2.33 2.94
Number of responses 12,483 12,001 12,052 12,810
(d) Impact on cityscape and waterfront environment
Design A Design B Design C Design D
Mean score 2.9313 2.40 2.38 2.9328
Number of responses 12,323 11,867 11,853 12,646
(e) Green features and environmental friendliness
Design A Design B Design C Design D
Mean score 3.02 2.67 2.58 2.81
Number of responses 12,302 11,913 11,855 12,558
1 The score for each design given by respondents ranges from 4 to 1 (i.e. 4 = Excellent, 3 = Good, 2 = Fair, 1 =
Unsatisfactory). The mean score for each design is computed by multiplying the score for each design by the number of respondents who give that score and divided by the total number of respondents.
8

Chapter 2: Quantitative Data Analysis
(f) Public open space
Design A Design B Design C Design D
Mean score 3.00 2.62 2.53 2.98
Number of responses 12,258 11,870 11,799 12,593
(g) Connectivity of the Tamar site and surrounding areas
Design A Design B Design C Design D
Mean score 2.90 2.51 2.52 2.91
Number of responses 12,182 11,769 11,753 12,525
2.1.5 Summary of Results The results from the Comment Cards indicate that:
• Design D ranks first on five themes (visual attractiveness, symbol of Hong Kong as
Asia’s world city, image befitting the CGC and LegCo Complex, impact on cityscape and waterfront environment, and connectivity of the Tamar site and surrounding areas), and ranks second on two themes (green features and environmental friendliness, and public open space);
• Design A ranks first on two themes (green features and environmental friendliness, and public open space), and ranks second on the other five themes (visual attractiveness, symbol of Hong Kong as Asia’s world city, image befitting the CGC and LegCo Complex, impact on cityscape and waterfront environment, and connectivity of the Tamar site and surrounding areas);
• Design C ranks third on four themes (visual attractiveness, symbol of Hong Kong as Asia’s world city, image befitting the CGC and LegCo Complex, and connectivity of the Tamar site and surrounding areas); and ranks fourth on three themes (impact on cityscape and waterfront environment, green features and environmental friendliness, and public open space); and
• Design B ranks third on three themes (impact on cityscape and waterfront environment, green features and environmental friendliness, and public open space), and ranks fourth on four themes (visual attractiveness, symbol of Hong Kong as Asia’s world city, image befitting the CGC and Legislative Council Complex, and connectivity of the Tamar site and surrounding areas).
The overall rank order of the designs from all valid Comment Cards is: D, A, C, B, assuming equal weighting of the seven themes.
9

Chapter 2: Quantitative Data Analysis
2.2 EXIT POLLS 2.2.1 Methodology
The Consultancy Team conducted face-to-face interviews with randomly-selected visitors at the exhibition venues. These Exit Polls are intended to verify the results obtained from the submitted Comment Cards, given that the method for collecting Comment Cards is vulnerable to manipulation. Systematic Random Sampling was employed to select visitors leaving the venues after they had finished viewing the exhibitions. Since it was considered excessive to ask Exit Poll respondents all seven of the questions on the Comment Card, the Consultancy Team constructed a short version of the questionnaire containing what it considered were the three key Comment Card questions (visual attractiveness, image befitting the CGC and LegCo Complex, and impact on cityscape and waterfront environment). The questionnaire was finalized before any Comment Card results were analysed.
Four Exit Polls were conducted during 1-8 April, 16-24 April, 1-9 May, and 15-23 May. A pilot poll was conducted on 31 March. The dates of the polls were not made public in advance. The interviewees were selected on a randomised basis according to a pre-determined rule. During the first poll, 1,255 visitors were successfully interviewed with a response rate of 57.9%. The second poll successfully interviewed 1,171 visitors, with a response rate of 86.6%. The third poll successfully interviewed 1,889 visitors, with a response rate of 68.5%. The fourth poll successfully interviewed 997 visitors, with a response rate of 67%. The full results and a profile of the respondents are shown in Appendix 3.
2.2.2 Results
Mean score for each question 4 = Excellent, 3 = Good, 2 = Fair, 1 = Unsatisfactory
Visual attractiveness
Design A Design B Design C Design D
Mean score 2.85 2.15 2.35 3.00
Number of responses 5,284 5,264 5,264 5,281
10

Chapter 2: Quantitative Data Analysis
Image befitting the CGC and the LegCo Complex
Design A Design B Design C Design D
Mean score 2.73 2.18 2.28 2.79
Number of responses 5,160 5,141 5,149 5,166
Impact on cityscape and waterfront environment
Design A Design B Design C Design D
Mean score 2.84 2.40 2.36 2.87
Number of responses 5,216 5,192 5,189 5,216
2.2.3 Summary of Results
The results of the Exit Polls indicate:
• Design D ranks first on three themes (visual attractiveness, image befitting the CGC and Legislative Council Complex, and impact on cityscape and waterfront environment).
• Design A ranks second on three themes (visual attractiveness, image befitting the CGC and Legislative Council Complex, and impact on cityscape and waterfront environment);
• Design C ranks third on two themes (visual attractiveness, and image befitting the CGC and Legislative Council Complex); and ranks fourth on one theme (impact on cityscape and waterfront environment); and
• Design B ranks third on one theme (impact on cityscape and waterfront environment) and ranks fourth on two themes (visual attractiveness, and image befitting the CGC and Legislative Council Complex).
The overall rank order of the designs from the four Exit Polls is: D, A, C, B, assuming equal weighting of the three themes.
2.3 TELEPHONE POLLS
An important component of this Consultancy is to collect views from Hong Kong residents on the Tamar Development Project through Telephone Polls. The first Telephone Poll was conducted during the period 22 April - 1 May. The second Telephone Poll was conducted during the period 11-18 May. This section summarises the aggregated results of the close-ended questions from the two Telephone Polls. The results of each poll are shown in Appendix 4.
2.3.1 The objectives of the Telephone Polls are:
• To assess public awareness of the Tamar Development Project; • To triangulate the results of the Comment Cards and Exit Polls; and
11

Chapter 2: Quantitative Data Analysis
• To assess public opinion on important issues relating to the Tamar Development Project identified in the Qualitative Data but not covered in the Comment Cards.
Based on the above-mentioned objectives, the Questionnaire for the first and second Telephone Polls was developed by PPRI Consultants in consultation with the Government. A sample of the Questionnaire is shown in Appendix 8.
2.3.2 Sampling Methods, Sample and Response Rate The survey covered Hong Kong land-based households having a residential telephone line. Random sampling of telephone numbers from the latest Residential Telephone Directory (English Version) published by PCCW was employed for sample selection. Telephone interviewers dialed the numbers assigned automatically by the telephone interviewing computer program (WinCATI for Windows). At least six attempts were made for every selected number. A standardized protocol was applied to verify that the dialed telephone number was associated with a household, and that there was at least one household resident who was eligible for the survey, one member (aged 18 or over) sampled by the Kish grid method within each selected household was interviewed. 1,512 persons were interviewed successfully in the First Poll with a co-operation rate of 68.7%. 1,542 persons were interviewed successfully in the Second Poll with a co-operation rate of 76.4%. The margin of error was +/- 2.52% at 95% confidence level. Details of the successful and unsuccessful interviews are shown below:
Frequency
Category 1st phone poll 2nd phone poll
Respondent cooperates (I) 1,512 1,542
Mid-way termination (P) 40 48
Refusal (R) 650 428
Non-Target (No eligible respondent or not sure with/without respondent age 18 or above)(NE)
788 917
Not available right now/appointment is made for interview on another date C(NC)
1,005 1,129
Other non-interviewed telephone lines (including strange tone/no tone/ password required/non-residential line/fax/incorrect telephone number/no answer) (NI)
4,154 4,521
Total telephone number dialled 8,149 8,585
12

Chapter 2: Quantitative Data Analysis
Applying Groves(1989)2’s Contact Rate and Co-operation Rate, the results are as follows:
1st phone poll 2nd phone poll
Contact Rate 86.3% 85.3%
Co-operation Rate 68.7% 76.4%
2.3.3 Results
The aggregated results of the two Telephone Polls are presented below. The results of each individual poll are shown in Appendix 4. Knowledge about the “Design Proposals for the Tamar Development Project”
[v4] Do you know that the Government is holding a public exhibition of “Design Proposals for the Tamar Development Project”?
Frequency Percentage Yes 1256 41.13 No/Never heard about it 1776 58.15 Don't remember/No opinion 22 0.72 Total 3054 100.00
Yes41.13%
No/Never heard about it
58.15%
Don't remember/No
opinion0.72%
Yes
No/Never heard about it
Don't remember/Noopinion
2 Groves, R. (1989). Survey Errors and Survey Costs. John Wiley & Sons, pp.144-145.
Contact Rate = (I+P+R+NI)/(I+P+R+NI+NC), Cooperation rate = I/(I+P+R).
13

Chapter 2: Quantitative Data Analysis
[v5] (If answered “yes” in v4) Do you know how many design proposals in total?
Frequency Percentage One 5 0.40 Two 19 1.51 Three 229 18.25 Four or above 282 22.47 Don't know/No opinion 720 57.37 Total 1255 100.00 99.92 Refuse to answer 1 0.08 Grand Total 1256 100.00
Three18.25%
Don't know/No opinion57.37%
One0.40%
Two1.51%
Four or above22.47%
One
Two
Three
Four or above
Don't know/Noopinion
14

Chapter 2: Quantitative Data Analysis
[v6] (If answered “yes” in v4) How do you know about the exhibition of “Design Proposals for the Tamar Development Project”? (Interviewers: Please do not read out the answers, respondent can choose more than one answer; please prompt: any other channel?)
Frequency Percentage Visit the exhibition 13 0.90 Internet 41 2.84 News Report 1100 76.18 Commentary 169 11.70 Heard from family members/relatives/friends/schoolmates/colleagues 59 4.09 Others 62 4.29 Total 1444 100.00 No. of Respondents 1233 98.17 Not sure/Don’t remember 21 1.67 Refuse to answer 2 0.16 Grand Total 1256 100.00
0
200
400
600
800
1000
1200
Visi
t the
exh
ibiti
on
Inte
rnet
New
s Rep
ort
Com
men
tary
Hea
rd fr
om fa
mily
mem
bers
/rela
tives
/frie
nds/s
choo
lmat
es/c
olle
ague
s
Oth
ers
Freq
uenc
y
15

Chapter 2: Quantitative Data Analysis
Preferred Design
[v7] In terms of “visual attractiveness”, which design(s) do you think is/are comparatively better in the four design proposals? (Interviewers: respondent can choose more than one answer; please prompt: any other design?)
Frequency Percentage Design A 66 18.86 Design B 74 21.14 Design C 82 23.43 Design D 128 36.57 Total 350 100.00 No. of respondents 316 25.16 Not sure/Don’t remember 933 74.28 Refuse to answer 7 0.56 Grand Total 1256 100.00
0
20
40
60
80
100
120
140
Design A Design B Design C Design D
Freq
uenc
y
16

Chapter 2: Quantitative Data Analysis
[v8] In terms of “image befitting the CGC and the Legislative Council Complex”, which design(s) do you think is/are comparatively better in the four design proposals? (Interviewers: respondent can choose more than one answer; please prompt: any other design?)
Frequency Percentage Design A 85 25.91 Design B 84 25.61 Design C 83 25.30 Design D 76 23.17 Total 328 100.00 No. of respondents 304 24.20 Not sure/Don’t remember 946 75.32 Refuse to answer 6 0.48 Grand Total 1256 100.00
0
20
40
60
80
100
120
140
Design A Design B Design C Design D
Freq
uenc
y
17

Chapter 2: Quantitative Data Analysis
[v9] In terms of “impact on cityscape and waterfront environment”, which design(s) do you think is/are comparatively better in the four design proposals? (Interviewers: respondent can choose more than one answer; please prompt: any other design?)
Frequency Percentage Design A 64 18.13 Design B 92 26.06 Design C 80 22.66 Design D 117 33.14 Total 353 100.00 No. of respondents 322 25.64 Not sure/Don’t remember 926 73.73 Refuse to answer 8 0.64 Grand Total 1256 100.00
0
20
40
60
80
100
120
140
Design A Design B Design C Design D
Freq
uenc
y
18

Chapter 2: Quantitative Data Analysis
[v10] Overall speaking, which design(s) do you think is/are comparatively better in the four design proposals? (Interviewers: respondent can choose more than one answer; please prompt: any other design?)
Frequency Percentage Design A 79 21.41 Design B 88 23.85 Design C 79 21.41 Design D 123 33.33 Total 369 100.00 No. of respondents 336 26.75 Not sure/Don’t remember 915 72.85 Refuse to answer 5 0.40 Grand Total 1256 100.00
0
20
40
60
80
100
120
140
Design A Design B Design C Design D
Freq
uenc
y
19

Chapter 2: Quantitative Data Analysis
[v11] Would you please tell me the reason(s) why you select this/these design proposal(s)?
Frequency Percentage Respondents who gave a reason 390 31.05 No particular reason, by personal feeling or impression 97 7.72 Cannot remember other design proposals 256 20.38 Have not seen the designs 513 40.84 Total 1256 100.00
Cannot remember other design
proposals20.38%
Have not seen the designs40.84%
Respondents who gave a reason
31.05%
No particular reason, by
personal feeling or impression
7.72%
20

Chapter 2: Quantitative Data Analysis
Public Exhibition
[v12] Have you seen all the showpieces in the public exhibition, including 18 exhibition boards, introductory videos, and design models?
Frequency Percentage Yes, I have seen all the show pieces 19 1.55 No, just some of the showpieces 97 7.91 No, I have never seen any showpiece before 1110 90.54 Total 1226 100.00 97.61 Not sure/Don’t remember 28 2.23 Refuse to answer 2 0.16 Grand Total 1256 100.00
No, I have never seen any
showpiece before90.54%
Yes, I have seen all the show
pieces1.55%
No, just some of the showpieces
7.91%Yes, I haveseen all theshow pieces
No, just someof theshowpieces
No, I havenever seen anyshowpiecebefore
21

Chapter 2: Quantitative Data Analysis
[v13] Are you satisfied or dissatisfied with the public exhibition of “Design Proposals for the Tamar Development Project”?
Frequency Percentage Very satisfactory 44 5.99 Satisfactory 356 48.50 Neither satisfied nor dissatisfied 249 33.92 Unsatisfactory 66 8.99 Very unsatisfactory 19 2.59 Total 734 100.00 58.44 Not sure/Don’t remember 514 40.92 Refuse to answer 8 0.64 Grand Total 1256 100.00
Neither satisfied nor dissatisfied
33.92%
Unsatisfactory8.99%
Very unsatisfactory
2.59%
Very satisfactory5.99%
Satisfactory48.50%
Verysatisfactory
Satisfactory
Neither satisfiednor dissatisfied
Unsatisfactory
Veryunsatisfactory
The profile of the respondents is shown in Appendix 4.
22

Chapter 2: Quantitative Data Analysis
2.3.4 Summary of Results from Telephone Polls The result of the two Telephone Polls show: • While about 40% of the respondents are aware of the Tamar Development Project,
more than three quarters of them do not know the exact number of design proposals. • The majority of those who know about the Project obtained their information from
news reports (76%). Less than 2% have read all of the exhibition materials, and only around 8% have read part of them.
• Regarding “visual attractiveness” of the four designs, the ranking is: D, C, B, A
Regarding “image befitting CGC and LegCo Complex”, the ranking is: A, B, C, D
Regarding “the impact on cityscape”, the ranking is: D, B, C, A
Regarding “the overall design”, the ranking is: D, B, A / C#
• The majority are satisfied with the exhibition.
2.4 QUANTITATIVE DATA ANALYSIS SUMMARY
The overall ranking of the Proposals from the various data sets is shown in the following Table:
Comment Cards (responses to close-ended questions)
Exit Polls Phone Polls
D, A, C, B D, A, C, B D, B, A / C#
The overall result of the Exit Polls corroborates those of the Comment Cards. When the results of the selected individual themes are examined, the results of the Exit Polls also corroborate all the three selected themes – visual attractiveness and image befitting the CGC and LegCo Complex and the impact on cityscape and waterfront environment theme. The results from the Phone Polls do not exactly corroborate the overall ranking of the Design Proposals from the collected Comment Cards and Exit Polls. They do not corroborate the ranking of the designs on the selected themes either. However, all three data collection exercises show that Design D leads in the three data sets (responses to the close-ended questions of the Comment Cards, Exit Polls and Phone Polls).
# Design A and Design C are tied in rank order.
23

Chapter 3: Qualitative Data Analysis
24
3. QUALITATIVE DATA ANALYSIS
3.1 SOURCES OF QUALITATIVE DATA The data came from the following sources:
Open-ended questions on the Comment Cards (received at the exhibition venues, via internet, fax and by post); and
Written Submissions (received via fax, email and by post).
A total of 14,055 Comment Cards (of which 6,084 contain written comments and 7,971 are without comments) was received as at 27 May 2007. These Comment Cards were collected from a number of sources: collection boxes at exhibition venues; electronic versions submitted via computers at the exhibition venues or via internet; and by fax and by mail. A total of 37 Written Submissions was also received. Five organizations (Central & Western District Board, Rehabilitation Alliance Hong Kong, Hong Kong Federation of Women, the Hong Kong Institute of Planners and the Legislative Council Commission) sent in Written Submissions. The Legislative Council Commission held a meeting on 1 June 2007. The Government informed the four tenderers, and with their consent, views expressed at this meeting (1 June 2007) are also considered as a Written Submission.
3.2 ANALYTICAL FRAMEWORK FOR OPEN-ENDED QUESTIONS AND WRITTEN SUBMISSIONS 3.2.1 Development of the Analytical Framework
A Grounded Theory approach3 is adopted for the analysis of Qualitative Data.
All Comment Cards and Written Submissions were screened by data entry staff. Written Submissions and Comment Cards with written comments were included for qualitative analysis, with comments being transcribed and coded into “text units” – a sentence or a group of sentences expressing a particular view. The transcripts were content analysed by two research staff separately in a double-blind manner. Based on the comments received, an analytical framework consisting of themes, categories, and sub-categories was developed (see Figure 3.1 and Figure 3.2). The framework was revised several times in order to reflect a comprehensive coverage of all the views expressed. A computer software, NUDIST (Non-numerical Unstructured Data Indexing Searching and Theorizing) was applied to organise and analyse data.
3A method of inquiry in which the observed data are allowed to influence the structure and process of
the study.

Chapter 3: Qualitative Data Analysis
25
Figure 3.1 :Analytical Framework
Tamar Development Project
Visual Attractiveness
Symbol of Hong Kong as Asia's world
city
Image befitting the Central
Government Complex and the
Legislative Council Complex
Impact on cityscape and
waterfront environment
Green features and
environmental friendliness
Public open space
Connectivity of the Tamar site and
surrounding areas
Comments on certain unique
features Feng Shui
concerns Overall preference
Cost Factor (estimate
/perception)
Public consultation process
Other overall comments
o Design aesthetics
o Scale and
proportion of the development (feeling of bulkiness, congestion etc.)
o Iconic
landmark o Relationship
between attractiveness and functionality
o Originality and
copycat concerns (resembling other types of buildings), etc.
o Avant-garde
and post-modern feel
o Reflection on
Hong Kong as a cosmopolitan dynamic and contemporary city
o Identity of
Hong Kong’s uniqueness and its history
o Test of time
(life-cycle, durability of image etc.)
o Reflection on the
distinct identities and roles of the Government headquarters
o Reflection on the
distinct identities and roles of Legislative Council
o Harmony and
integration of CGC and LegCo Complex
o Visual impact of
the project in relation to the ridgeline
o Impact on the
cityscape and neighbouring buildings
o Impact on
waterfront environment
o Proposed
energy conservation measures
o Air flow around
the area
o Sustainability concepts
o Use of glass
panels and its concerns
o Impact on
pollution (visual, light pollution etc.)
o Presence of
trees, plants & lawns (size and design etc.)
o Environmental
friendliness
o Landscaping
design o Public
accessibility into CGC and LegCo Complex within Tamar
o Design/issue of
the waterfront promenade
o Meeting the
needs of the public
o Demonstration
areas and their design
o Distance
between government and people
o Security
concerns o Water features
o Interconnectivity
with surrounding areas and the waterfront (linking roads, bridges, publictransport etc.)
o Comments on
unique features
o Feng Shui
concerns
o Overall
preference
o Cost of
construction o Cost of
maintenance o Hidden costs o Technical
details (office space, use of electricity etc.)
o Availability
of background information
o Commenda
ble process o Fake
consultation o Areas to
improve (someone toexplain exhibits, more votingboxes)
o How to make
the best of public money
o All designs are
unacceptable o Fairness
concerns: nameof consortiums exposed and itsimpact
o Business
reputation of bidders
o Economic
impact: provision of jobs
o Taste: good or
bad o Choices: not
enough o Possibility of
combining models
o Other possible
uses of Tamar site
o Inclusion of
promenade design: for or against
o Design of
exhibition venue and exhibits

Chapter 3: Qualitative Data Analysis
26
Figure 3.2: Analytical Framework on the Tamar Development Project Themes, Categories, Sub-categories 1. Visual attractiveness
1.1 design aesthetics 1.2 scale and proportion of the development (feeling of bulkiness,
congestion etc.) 1.3 iconic landmark 1.4 relationship between attractiveness and functionality 1.5 originality and copycat concerns (resembling other types of building) 1.6 avant-garde and post-modern feel 1.7 others
2. Symbol of Hong Kong as Asia's world city
2.1 reflection on Hong Kong as a cosmopolitan, dynamic and contemporary city
2.2 identity of Hong Kong’s uniqueness and its history 2.3 test of time (life-cycle, durability of image etc.) 2.4 others
3. Image befitting the Central Government Complex and the Legislative
Council Complex 3.1 reflection on the distinct identities and roles of the Government
headquarter 3.2 reflection on the distinct identities and roles of LegCo 3.3 harmony and integration of CGC and LegCo buildings 3.4 others
4. Impact on cityscape and waterfront environment
4.1 visual impact of the project in relation to the ridgeline 4.2 impact on the cityscape and neighbouring buildings 4.3 impact on waterfront environment 4.4 others

Chapter 3: Qualitative Data Analysis
5. Green features and environmental friendliness
5.1 proposed energy conservation measures 5.2 air flow around the area 5.3 sustainability concepts 5.4 use of glass panels and its concerns 5.5 impact on pollution (visual, light pollution etc.) 5.6 presence of trees, plants, lawns: size and design 5.7 environmental friendliness 5.8 others
6. Public open space
6.1 landscaping design 6.2 public accessibility to CGC and LegCo buildings within Tamar 6.3 design/issue of the waterfront promenade 6.4 meeting the needs of the public 6.5 demonstration areas and their design 6.6 distance between Government and people 6.7 security concerns 6.8 water features 6.9 others
7. Connectivity of the Tamar site and surrounding areas
7.1 interconnectivity with surrounding areas and the waterfront (linking roads, bridges, public transport etc.)
7.2 others 8. Comments on certain unique features
8.1 comments on unique features 8.2 others
9. Feng Shui concerns
9.1 Feng Shui concerns 9.2 others
10. Overall preference
10.1 overall preference 10.2 others
27

Chapter 3: Qualitative Data Analysis
11. Cost Factor (estimate/perception)
11.1 cost of construction 11.2 cost of maintenance 11.3 other hidden costs 11.4 other technical details (office space, use of electricity etc.) 11.5 others
12. Public consultation process
12.1 availability of background information 12.2 commendable process 12.3 fake consultation 12.4 areas to improve (someone to explain exhibits, more voting boxes,
exhibition models not to scale etc.) 12.5 others
13. Other overall comments
13.1 how to make the best of public money 13.2 all designs are unacceptable 13.3 fairness concerns: name of consortiums exposed and its impact 13.4 business reputation of bidders 13.5 economic impact: provision of jobs 13.6 taste
13.6.1 good 13.6.2 bad
13.7 choices: not enough 13.8 possibility of combining models 13.9 other possible uses of Tamar site 13.10 inclusion of promenade design
13.10.1 for 13.10.2 against
13.11 design of exhibition venue and exhibits 13.12 others
28

Chapter 3: Qualitative Data Analysis
29
3.2.2 Data Processing: Themes, Categories and Subcategories All comments were initially categorized under the seven broad themes as described in the Comment Card: visual attractiveness, symbol of Hong Kong as Asia’s world city, image befitting the CGC and the LegCo Complex, impact on cityscape and waterfront environment, green features and environmental friendliness, public open space, and connectivity of the Tamar site and surrounding areas. Three other themes were added to the Analytical Framework in light of the public responses to the four individual designs. These three themes are: comments on certain unique features, Feng Shui concerns, and overall preference. Categories and sub-categories under each of the themes were created based on the comments expressed by the respondents. There are also three themes which are not relevant to the ten themes above: cost factor, public consultation process, and other overall comments. Altogether there are 13 themes in the present Analytical Framework. A brief version of the Analytical Framework is illustrated in Figure 3.1 above, with all themes, categories and sub-categories shown in Figure 3.2. Under the first 11 themes (i.e. visual attractiveness, symbol of Hong Kong as Asia’s world city, image befitting the CGC and the LegCo Complex, impact on cityscape and waterfront environment, green features and environmental friendliness, public open space and connectivity of the Tamar site and surrounding areas, comments on certain unique features, Feng Shui concerns, overall preference, and estimate/perception of cost factor), categories were set up on the basis of whether the comments were “positive”, “negative” or “others” relating to that category. “General” comments were often suggestions for improvement or some miscellaneous items. Figure 3.3 illustrates the data processing steps.
Design A
Design B
Design C
Design D
Positive
Negative
Gener Figure 3.3: Illustration of Data Processing Steps al C
omm
ent
Visual attractiveness
Theme 2
Theme 3
Theme 4
Theme 5
Theme 6
Theme 7
Theme 8
Theme 9
Theme 10
Theme 12
Theme 11
Theme 13
Design aesthetics
Iconic landmark
Scale and proportion of the developm
ent
Relationship betw
een attractiveness and functionality
Originality and
copycat concerns
Avant-garde and post-m
odern feel
Others
Illustration of Data Processing Steps

Chapter 3: Qualitative Data Analysis
3.2.3 Frequency Counts Figure 3.4 shows, in descending order, the number of comments (in text units) arranged by source for each of the themes in the Analytical Framework.
0100
0200
0300
0400
0500
0600
0700
0800
0900
0100
00110
00
Visual attractiveness
Green features andenvironmental friendliness
Overall preferences
Public open space
Comments on certainunique features
Image befit ting the CentralGovernment Complex and
the LegCo Complex
Symbol of Hong Kong asAsia's world city
Impact on cityscape andwaterfront environment
Other overall comments
Public consultation process
Cost factor
Connectivity of the Tamarsite and surrounding areas
Feng Shui concerns
Them
es
Frequency Count
Electronic CommentCardsComment Cards receivedat the Exhibiton VenueWritten Submissions
Phone Polls
Figure 3.4: Distribution of Comments (arranged by themes) on Tamar Development Project
Based on Frequency Counts (in text units)
30

Chapter 3: Qualitative Data Analysis
Figure 3.5 shows, in descending order, the number of comments (in text units) of the top 15 categories in the Analytical Framework.
0100
0200
0300
0400
0500
0
Design aesthetics
Overall preference
Iconic landmark
Originality and copycat concerns
Presence of trees, plants, lawns: size and design
Comments on certain unique features
Scale and proportion
Reflection on the distinct identities and roles ofGovernment headquaters
Reflection on Hong Kong as a cosmopolitan, dynamicand contemporary city
Impact on the cityscape and neighbouring buildings
Landscaping design
Air flow around the area
Identity of Hong Kong's uniqueness and its history
Relationship between attractiveness and functionality
Avant-garde and post modern feel
Cat
egor
ies
Frequency Count
Electronic CommentCardsComment Cards receivedat the Exhibiton VenueWritten Submissions
Phone Polls
Figure 3.5: Distribution of Comments (top 15 categories) on Tamar Development Project
Based on Frequency Counts (in text units)
31

Chapter 3: Qualitative Data Analysis
3.3 DATA ANALYSIS ON WRITTEN SUBMISSIONS AND OPEN-ENDED QUESTIONS For open-ended questions, a total of 25,037 text units contained in Written Submissions and Comment Cards was analysed. Detailed frequency count tables of the views expressed by respondents under the 13 themes are presented in Appendix 5. A summary of frequency counts on these themes and their salient points are given below:
3.3.1 Visual attractiveness
On “visual attractiveness”, a total of 10,756 comments (in text units) on the four designs was received. The three most frequently mentioned issues relate to “design aesthetics” (42.51%),”iconic landmark” (19.80%), and “originality and copy cat concerns” (14.48%). Comments on these three issues account for 76.79% of all the views expressed (Table 5.3 of Appendix 5). On “design aesthetics” (4,572 text units): Design A received most positive comments (793 text units or 17.34%). Characteristically, respondents described the design as graceful and possessing character. Design C received most negative comments (808 text units or 17.67%). Characteristically, respondents described the design as being too messy and abstract. On “iconic landmark” (2,130 text units): Design D received most positive comments (272 text units or 12.77%). Characteristically, respondents described the design as a masterpiece able to unify man and heaven. Design B received most negative comments (1,044 text units or 49.01%). Characteristically, respondents described the design as lacking in any iconic feel. On “originality and copy cat concerns” (1,558 text units): Design D received most positive comments (141 text units or 9.05%). Characteristically, respondents described the design as the most artistic, modern and integrated design. Design A received most negative comments (558 text units or 35.82%). Characteristically, respondents described the design as a copycat of Beijing’s CCTV building. A summary of the salient points for each of the four designs is presented below:
32

Chapter 3: Qualitative Data Analysis
Positive Comments Negative Comments Other Comments
Design A
• the design is graceful and full of character
• the style is most aerodynamic
• the design is simple and iconic
• it is most innovative and creative
• it brings out the concept of an open Government
• the notion of the portal is particularly good
• the design is messy and too abstract
• it is out of place and not attractive
• it is a castle in the air • it is just a copycat of
Beijing’s CCTV building or the Arche de la Defense in Paris
• the grey colour looks too depressing, too dark and dim
• the design is too boring and even hideous
• should add a pier outside the waterfront
• the LegCo building should be made bigger
• buildings should be smaller
• land utilization can be improved
Design B
• the design is most human, attractive and approachable
• it is most practical and natural
• it is simple and unostentatious
• it brings out the concept of open and transparent Government
• the buildings look as firm as Donald Tsang
• the design is too plain and not outstanding
• the design lacks any iconic feel
• it is non-descript and lacking in character
• it looks like a shopping mall, a go-down or just another office building
• the profile is too low • it is too conservative
and not artistic
• the flag-pole should be moved to the centre
• outward design most simple but has least environmental impact
• buildings can be made taller
• can have more special design
Design C
• it is the most avant-garde design of all
• the design is very creative and beautiful
• it gives visual pleasantness and is very attractive at night
• the design is most dynamic and representative of Hong Kong
• it is most impressive and smooth
• it brings out a great
• the slanting and triangulated form is absolutely unacceptable
• it is too strange and horrible
• the design produces a sense of instability, feeling like a disaster after an earthquake
• it is like a museum, an industrial mega-structure, a super prison etc.
• the main gate of CGC should be facing the harbour
• design looks good but may be better if facing the harbour
• beautiful design but too tall
• frontal perspective just common and special effects can only be seen sideways
33

Chapter 3: Qualitative Data Analysis
visual attractiveness • the design is hideous: it looks like tombstones
• it is too edgy and ostentatious
Design D
• it is the most artistic, modern and integrated design
• it combines both a modern and an oriental feel
• it is a masterpiece which unifies man and heaven
• the design is most iconic and outstanding
• it looks safe and comfortable: it suits the Chinese style
• it is most eye-catching and elegant
• it is a totally nonsense design with too many gimmicks
• it is a bit too cheesy for anyone with a bit of cultural exposure and taste
• the design is connected to the 1960s Susie Wong cliche or a Gweilo interpretation of HK
• it is more like a casino• it has too much
makeup: the beach is not necessary and the egg is not appealing
• it is crass symbolism: just another Chinatown
• LegCo should have more window area
• should delete the circular walkway
• the two major blocks could be slightly reduced in size to allow more space between the two blocks
• should add more greenery to harmonize the design
3.3.2 Symbol of Hong Kong as Asia's world city
On “symbol of Hong Kong as Asia's world city”, a total of 1,372 comments on the four designs was received. The three most frequently mentioned issues relate to “reflection on Hong Kong as a cosmopolitan, dynamic and contemporary city” (54.37%), “identity of Hong Kong’s uniqueness and its history” (40.74%), and “test of time” (4.37%). Comments on these three issues account for 99.48% of all the views expressed (Table 5.4 of Appendix 5). On “reflection on Hong Kong as a cosmopolitan, dynamic and contemporary city” (746 text units): Design D received most positive comments (410 text units or 54.96%). Characteristically, respondents described the design as the idyllic design especially for Hong Kong as an international city. Design D also received most negative comments (66 text units or 8.85%). Characteristically, respondents described the design as showing only a shallow understanding of Hong Kong’s culture. On “identity of Hong Kong’s uniqueness and its history” (559 text units): Design D received most positive comments (207 text units or 37.03%). Characteristically, respondents described the design as helpful to make Hong Kong famous and its people proud. Design A received most negative comments (81 text units or 14.49%).
34

Chapter 3: Qualitative Data Analysis
Characteristically, respondents described the design as being outdated and unrepresentative of Hong Kong. On “test of time” (60 text units): Design A received most positive comments (8 text units or 13.33%). Characteristically, respondents described the design as being ageless and will be able to stand the test of time. Design C received most negative comments (11 text units or 18.33%). Characteristically, respondents described the design as not being able to face the test of time. A summary of the salient points for each of the four designs is presented below:
Positive Comments Negative Comments Other Comments
Design A
• the design brings out HK’s leading role in Asia
• it is certainly identifying HK as an international city
• it brings out HK as an open and dynamic city
• the design is simple and ageless: it is going to last forever
• it has made good use of architectural language to make HK stand tall in Asia
• its most aerodynamic design brings out the uniqueness of HK
• the design cannot show HK as an energetic Asian city
• it does not have a HK feeling
• the design is too rigid and lacking a local colour
• the design is not going to be sustainable
• the public may be at a loss as to what it is all about
• the design is very boring: how can it bring out HK in the world?
• it can show HK character but is a bit old fashioned
Design B
• the design is simple and modern
• it brings out the international status of HK
• it is suitable for HK’s image in Asia and the world
• it symbolises the firmness of HK as an international financial centre
• its human friendly design enhances HK’s international character
• its practicality helps to
• it does not have its own style and lacks HK characteristics
• the design is not at all symbolic of metropolitan HK
• the buildings disappear into the forest of nearby buildings
• the design is not a good image for HK
• it looks like a factory: it will be a laughing stock to the rest of the world
• it lacks character and cannot measure up to
• better if more designs are added to the buildings
35

Chapter 3: Qualitative Data Analysis
stand the test of time international standards
Design C
• the design has the most international character
• it is full of modern and contemporary feel
• it works towards representing a strong modern city image of HK
• it puts HK on the map of the world
• its “star war” design is most international in character
• its dynamic design matches the dynamism of HK
• the design is not compatible with HK’s image as an international financial centre
• HK will be a joke of the world if this design is accepted
• it is just a show-off piece
• too fancy design does not suit the taste of HK
• it is just wrong to equate ugliness with beauty
• it is just a super-prison and will make HK a laughing stock in the world
• the design is very creative but the concept seems a bit outdated now
Design D
• the design certainly can enhance HK identity and history
• it boldly shows the Hong Kong spirit
• the idyllic design specially for HK as an international city
• the design will make HK famous and the people will be proud of it
• its ground-breaking design will enhance HK’s importance in the world
• its modernity plus oriental feel symbolises the uniqueness of HK
• the design only shows a shallow understanding of Chinese / HK culture
• the design represents something totally outdated
• the sail boat concept bears no link to modern HK
• it cannot face the test of time
• it connects more to the Susie Wong cliche of the 1960s
• it is a misleading and Gweilo interpretation of HK
• it is full of Chinese cultural style
• More lights could be installed
3.3.3 Image befitting the Central Government Complex and the LegCo Complex
On “image befitting the CGC and the LegCo Complex”, a total of 1,442 comments on the four designs was received. The three most frequently-mentioned issues relate to “reflection on the distinct identities and roles of Government headquarters” (68.93%), “reflection on
36

Chapter 3: Qualitative Data Analysis
the distinct identities and roles of LegCo” (17.20%), and “harmony and integration of CGC and LegCo buildings” (13.25%). Comments on the three issues account for 99.38% of all the views expressed (Table 5.5 of Appendix 5). On “reflection on the distinct identities and roles of Government headquarters” (994 text units): Design A received most positive comments (127 text units or 12.78%). Characteristically, respondents described the design as being the most solemn of all the designs. Design C received most negative comments (234 text units or 23.54%). Characteristically, respondents described the design’s triangulated form as not suitable for a modern and open Government. On “reflection on the distinct identities and roles of LegCo” (248 text units): Design A received most positive comments (31 text units or 12.50%). Characteristically, respondents described the design as being able to represent the prestige of the LegCo. Design D received most negative comments (43 text units or 17.34%). Characteristically, respondents described the design as a jazzy one but the Civil Service was not part of the entertainment industry. On “harmony and integration of CGC and LegCo buildings” (191 text units): Design A received most positive comments (34 text units or 17.80%). Characteristically, respondents described the design as being able to enhance the prestige of both the LegCo and the CGC. Design D received most negative comments (34 text units or 17.80%). Characteristically, respondents described the design as blatant and that literal symbolism was not suitable for a Government Complex. A summary of the salient points for each of the four designs is presented below:
Positive Comments Negative Comments Other Comments
Design A
• the design has established the concept of a good and open Government
• it can represent and enhance the prestige of Government and LegCo
• it shows the Government is firmly in control, but yet open and transparent
• this is the most solemn design among the four
• its solemnity will enhance the prestige of the Government
• it will help maintain stability in HK and
• it lacks a proper balance and, is not suitable for Government’s image
• the design gives a feeling of instability
• LegCo design evokes a feeling of coldness
• the Chief Executive’s office too small and evokes a feeling of imbalance
• it will bring political discord to HK
• such design is not suitable for Government buildings
• better if the “gate” is designed in a more symmetric way
• LegCo building should be made bigger and grander
37

Chapter 3: Qualitative Data Analysis
harmonious relations between Government and LegCo
Design B
• though comparatively conservative, its design is not flamboyant and befits the image of the Government
• the design gives a clear identity to LegCo and CGC, symbolizing social stability
• it looks more like a place for work than a show-off place for the happy few
• its functional design will meet Government operation and delivers a sense of strength and practicality
• its design is most in keeping with Government buildings
• its practicality matters most to Government and LegCo
• the design is just too common: not proper for the Government
• it cannot show the political importance of CGC or the solemn status of LegCo
• it gives an impression of commercial buildings rather than Government premises
• it is just like a replica of the City Hall or the Arts Centre
• its conservative character will not help HK’s political modernization
• its design is just not commendable for Government buildings
• the design enhances people’s awareness of public affairs
Design C
• the design symbolises strong governance
• a great symbol for HK and its Government’s authority
• carries an air of austerity and authority
• a bold attempt with an iconic design: good for strong governance
• HK needs more inventiveness in politics and architecture: this design serves this purpose
• it looks like a commercial building more than a Government headquarters
• there is no separate identity for LegCo and CGC
• Government buildings should not be slanting, symbolizing that the Government is “irregular”
• triangulated form is not related to the open concept of a modern Government
• Government buildings should not be too
• the moat has Chinese characteristics
38

Chapter 3: Qualitative Data Analysis
weird: it is just not suitable
• it is a total mismatch for Government and LegCo buildings
Design D
• Government/LegCo in the same boat design: good
• the design brings out openness of Government and LegCo
• the design produces a good first impression: Government building feel
• it shows a harmonious relationship between the public and Government
• its man-heaven unity design will help stabilize politics in HK
• it has a monumental character suitable for Government buildings
• the LegCo building is not matching other buildings
• CE’s office on top floor implies superiority over people
• the design is jazzy but the Civil Service is not part of the entertainment industry
• the blatant and literal symbolism is not suitable for a Government complex
• it is totally unrelated to Government function
• it has just too many gimmicks: just like what the Government is doing now
• it is OK to have the sail boat concept
• LegCo building should be made more transparent
3.3.4 Impact on cityscape and waterfront environment
On “impact on cityscape and waterfront environment”, a total of 981 comments on the four designs was received. The three most frequently-mentioned issues relate to “impact on the cityscape and neighbouring buildings” (75.03%), “impact on waterfront environment” (17.94%), and “visual impact of the project in relation to the ridgeline” (6.32%). Comments on these three issues account for 99.29% of all the views expressed (Table 5.6 of Appendix 5). On “impact on the cityscape and neighbouring buildings” (736 text units): Design A received most positive comments (106 text units or 14.40%). Characteristically, respondents described the design as blending well with the cityscape. Design D received most negative comments (209 text units or 28.40%). Characteristically, respondents described the design as not matching the surroundings. On “impact on waterfront environment” (176 text units): Design D received most positive comments (29 text units each or 16.48%). Characteristically, respondents described it as having good consideration for the harbour view. Design D also received most negative comments (44 text units or 25.00%).
39

Chapter 3: Qualitative Data Analysis
Characteristically, respondents described the design as blocking the view of Victoria Harbour. On “visual impact of the project in relation to the ridgeline” (62 text units): Design B received most positive comments (9 text units or 14.52%). Characteristically, respondents described the design’s relatively low buildings to be least disruptive to the ridgeline. Design C received most negative comments (8 text units or 12.90%). Characteristically, respondents described the design as intriguing and not fitting Hong Kong’s skyline. A summary of the salient points for each of the four designs is presented below:
Positive Comments Negative Comments Other Comments
Design A
• it blends very well with the waterfront environment
• it will bring harmony to the region
• it is most suitable for the cityscape
• its open design adds delight to the whole Admiralty-Central district
• the promenade design is poor
• the tall buildings will disturb the skyline
• it will block the view of other buildings
• it is an out-of-place style
• more leisure ground should be added in the middle
Design B
• it fits well without making other buildings look basic
• an unostentatious design which fits well with the surroundings
• low buildings: least disruptive to the ridgeline
• it has an environmental feeling which is good to the whole Admiralty district
• the buildings block the harbour view
• its overall impact to the district will be negative
• its buildings are jammed together and will bring a disunity to the rest of the district
• overall impression: ugliness and no good to Admiralty
• not clear how heaven-earth-people concept blend together
Design C
• the design cares about the ridgeline of Taipingshan and the Victoria harbour
• it preserves their view of the harbour for the buildings behind Tamar
• the building seems unique and would add
• the buildings are too bulky and the harbour view is often blocked
• there is little integration with the surroundings
• the design is intriguing and does not fit HK’s skyline
• a “screening wall”
• the orientation of the buildings can be improved
40

Chapter 3: Qualitative Data Analysis
on to HK skyline • overall design matches
well with the harbour front of HK island
building: blocks the cityscape
Design D
• the design is great for HK’s skyline
• there is good consideration for the ridgeline and harbour view
• it is fitting well with surrounding buildings
• visitors will enjoy the Tamar project from across the harbour
• its man-heaven unity design brings harmony to the waterfront
• the design is holistic and good for the whole Admiralty-Central district
• the building complex does not match the surroundings or there is not much thought about it
• it certainly blocks the views from Gloucester Road
• weak consideration of the ridgeline matter
• the skybridge is blocking the harbour view
• it is too congested and will not be good for Admiralty
• it is a totally nonsense design for the harbour front
• don’t want the waterfront to be “privatized” by marine clubs
3.3.5 Green features and environmental friendliness
On “green features and environmental friendliness”, a total of 3,126 comments on the four designs was received. The three most frequently-mentioned issues relate to “presence of trees, plants and lawns (size and design etc.)” (47.82%), “air flow around the area” (18.46%), and “environmental friendliness” (13.92%). Comments on the three issues account for 80.20% of all the views expressed (Table 5.7 of Appendix 5). On “presence of trees, plants and lawns” (1,495 text units): Design B received most positive comments (244 text units or 16.32%). Characteristically, respondents described the design as the most environmentally-friendly design which has integrated solar panels, renewable energy garden, sky gardens and green gardens on the roof. Design B also received most negative comments (185 text units or 12.37%). Characteristically, respondents described the design’s buildings and greenery as having no sense of integration. On “air flow around the area” (577 text units): Design A received most positive comments (158 text units or 27.38%). Characteristically, respondents described the design as able to produce a good ventilation system for the area. Design D received most negative comments (204 text units or 35.36%). Characteristically, respondents described the design as failing to take into account of the natural flow of fresh air to the inner areas of Admiralty.
41

Chapter 3: Qualitative Data Analysis
On “environmental friendliness” (435 text units): Design A received most positive comments (103 text units or 23.68%). Characteristically, respondents described the design as one which gives people a comfortable and environmental feeling. Design D received most negative comments (34 text units or 7.82%). Characteristically, respondents thought the design lacked consideration for environmental issues, such as using too much reflective glass. A summary of the salient points for each of the four designs is presented below:
Positive Comments Negative Comments Other Comments
Design A
• the design shows good energy-saving measures like the use of natural lighting and the different orientation of buildings
• the green lane under the Gateway gives comfort to people
• it produces an open, pleasant-looking image and the design is good for air flow
• the rain collection system helps in gathering water for watering plants and flushing
• it gives an environmental feeling
• people will be most comfortable in the green design
• “T” block would not have air flow effectively through it from the front side
• the use of reflecting glass will heat up Tamar site
• pollution is greater for this design
• the lawn design is impractical: it will end up as a waste land because of the heavy pedestrian flow
• the “hole” brings dangerous onshore wind during typhoon season
• not human-friendly in summer time
• green platform should be shaded
• space for public enjoyment should be more prominent
• should add more sunlight panels on the rooftop
• should have more trees
Design B
• the design is most environmental, humane and approachable
• it is easier to build and it provides good air circulation
• the design includes more environmental features and greenery in open space and promenade
• gives a bit of natural feeling in the urban
• the glass structure will push up the electricity bill
• the buildings and the greenery have no sense of integration
• LegCo gets too much sunlight causing rapid ageing of materials inside
• there are too many trees which will block the valuable harbour
• very environmental but the buildings are too short
42

Chapter 3: Qualitative Data Analysis
area providing comfort to people
• its low-key profile is a delight to the environment
• it is environmental because it is cheaper to build and to maintain
view • it has wasted a lot of
office space making it less environmental
• excessive use of glazing is worrying
Design C
• it is the most environmentally friendly design which has incorporated solar panels, renewable energy garden, sky gardens and green gardens on the roof
• the design makes use of lots of natural light
• the massive green open space and good air ventilation are welcomed
• the green areas appear more natural in character and more user friendly
• people will appreciate its environmental considerations
• the building blocks the west-east air flow and view
• the edgy structures would use up a lot of energy for lighting, maintenance and air conditioning
• extensive use of glass wall makes it difficult to save energy
• there are not enough efforts made on greening the site
• it is too bulky and will be an environmental disaster
• the edgy structures will not be environmentally friendly
• best design but the orientation should be reconsidered
• very environmental but the external appearance is not appealing
Design D
• the design makes good use of renewable energy to generate electricity for some of the buildings
• the design fulfils the requirement for saving energy
• there are tons of green space in this design
• the design brings comfort to people using and visiting it
• its man-heaven unity concept has the best environmental
• its west facing orientation is not environmental : it is going to use up more electricity
• it shows a lack of consideration for environmental issues, such as using too much reflective glass
• it fails totally to take into account the natural flow of fresh air to the inner areas of Admiralty
• the very tacky and inefficient main
• the distance between the main blocks should be extended to reduce “wall screen” effect
43

Chapter 3: Qualitative Data Analysis
consideration • it has the least impact
on pollution
building will require more energy
• people will feel pressurized in this design
3.3.6 Public open space
For “public open space”, a total of 1,785 comments on the four designs was received. The three most frequently-mentioned issues relate to “landscaping design” (35.41%), “meeting the needs of the public” (25.10%), and “design/issues of the waterfront promenade” (15.07%). Comments on these three issues account for 75.58% of all the views expressed (Table 5.8 of Appendix 5). On “landscaping design” (632 text units): Design B received most positive comments (101 text units or 15.98%). Characteristically, respondents described the design as the best landscape: lots of trees and greenery bringing freshness to the waterfront. Design A received most negative comments (64 text units or 10.13%). Characteristically, respondents described the landscaping design as perhaps a bit too domineering. On “meeting the needs of the public” (448 text units): Design A received most positive comments (68 text units or 15.18%). Characteristically, respondents described the design as being able to give people a proper park for outdoor activities. Designs A and D received most negative comments (29 text units or 6.47% each). Characteristically, respondents described design A as not having a feeling of proper open space for the benefit of the people. Respondents described design D as lacking a demonstration and gathering area. On “design/issues of the waterfront promenade” (269 text units): Design D received most positive comments (71 text units or 26.39%). Characteristically, respondents described the design’s promenade as highly commendable. Design D also received most negative comments (37 text units or 13.75%). Characteristically, respondents described the design of the waterfront promenade as too arbitrary. A summary of the salient points for each of the four designs is presented below:
Positive Comments Negative Comments Other Comments
Design A
• it reserves a large enough landscape area for the public
• it is great idea to integrate the public and Government by sharing the open space
• the design provides well-planned open
• the design will pose security problems
• it is perhaps a bit too domineering for the outside space and makes too much impact on the skyline
• the lawn area is too big• there is no feeling of
• best feeling of openness, but a bit wasteful of space
• the joining lanes should be made wider
• more harbour view cafes should be added
• should provide more seats and resting places
44

Chapter 3: Qualitative Data Analysis
space • this is going to be an
attractive space to invite people to visit and linger, a good sense of public gathering space
• its open design provides more open space for the public
• the public will enjoy going to Tamar
proper open space for the benefit of the people
• its grey colour will drive away people
• its bombastic design is not human-friendly
for public
Design B
• the open space design is the best among all the designs
• the design has the best landscape: lots of trees and greenery, brings freshness to the waterfront
• it produces simple and harmonious co-existence with the surroundings
• it gives people a proper park to enjoy outdoor activities in the heart of HK
• it is the most human-friendly design for the people
• there is no real civic space at all
• public may get lost with so many trees around
• the public park area looks really too simple and sterile
• the idea of creating an oasis is good but it is not realistic enough
• its unattractive design will drive away people
• it has no demonstration area
• should add a hanging garden
• should bring Queen’s Pier to the promenade
• should add a public square
• better if the demonstration area is made bigger
Design C
• it is most accessible to the public
• setting buildings to one side and creating a large open space is clever and smart
• the open area and landscaping design are good
• gardens and promenade have good greenery images
• its creative design allows the people to gather here
• the design gives a feeling of crowdedness and congestion
• the open leisure grounds are too small
• too much landscape area and too many buildings combined together intensively
• the greenery does not look very user-friendly
• its edginess will drive away people
• excellent design, but more open space preferred
45

Chapter 3: Qualitative Data Analysis
• it brings people closer to the Government
Design D
• the promenade design is very good
• it has massive open space
• the idea of opening up some of the internal space to the public is excellent
• enough consideration for public use of this site
• its man-heaven unity design allows enough public open space for people
• the design best meets the needs of the people
• the design is too tight and it should have provided more public space
• it is lacking in coherence between buildings and landscaping
• the design of waterfront promenade is too arbitrary
• there is a lack of demonstration and gathering area
• it is too crammed: how does it meet the needs of the people?
• overall, it is too congested for people to gather
• should improve the design of the garden
• should add more leisure grounds
• should add a big performance ground
3.3.7 Connectivity of the Tamar site and surrounding areas
For “connectivity of the Tamar site and surrounding areas”, a total of 295 comments on the four designs was received. The three most frequently-mentioned issues relate to “positive comments” (38.44%), “negative comments” (31.63%), and “other comments” (29.93%). Comments on the three issues account for 99.66% of all the views expressed (Table 5.9 of Appendix 5). On “connectivity of the Tamar site and surrounding areas” (294 text units): Design A received most positive comments (67 text units or 22.79%). Characteristically, respondents described the design as having a good linkage with Admiralty. Design D received most negative comments (36 text units or 12.24%). Characteristically, respondents described the design as blocking access to the waterfront. A summary of the salient points for each of the four designs is presented below:
Positive Comments Negative Comments Other Comments
Design A
• it gives direct access from Admiralty to the waterfront
• it conveys a connection right through the site to the harbour which none
• have not considered linkage and public transport to facilitate people
• linking paths should not just pass through the central areas
46

Chapter 3: Qualitative Data Analysis
of the other designs can do
• the design gives the best use of the site to allow vista from Gloucester Road
• the design has good linkage with Admiralty
Design B
• good linkage with Admiralty
• the roads circling the building will block the pedestrian flow from MTR to Tamar
• the disposition seems to block people from approaching the waterfront
• buildings lumped together are blocking access between Admiralty and waterfront
• should consider more on this matter
Design C
• reduces the distance between waterfront and Admiralty
• the buildings are unwelcoming in terms of accessibility
• the design does not connect Tamar to the surrounding area
• should link up with MTR
Design D
• the design provides good connectivity
• it is a good idea to have a promenade linking with the Wanchai HK Exhibition Centre
• there is good linkage to the surrounding areas
• the linkages are not accessible
• the design blocks access to the waterfront
• needs more details on the connectivity to the surrounding areas
• better to have a covered pathway to provide a pedestrian/cycle link between Wanchai and Central
3.3.8 Comments on certain unique features
For comments on certain unique features in the four designs, a total of 1,463 comments was received. The three most frequently-mentioned issues relate to “negative comments” (51.89%), “positive comments” (28.66%), and “other comments” (19.45%). Comments on these three issues account for 99.45% of all the views expressed (Table 5.10 of Appendix 5).
47

Chapter 3: Qualitative Data Analysis
A summary of the salient points for each of the four designs is presented below:
Positive Comments Negative Comments Other Comments
Design A
• the archway is very interesting
• the concept of the gateway is very suitable
• the huge gate is very monumental
• the Chief Executive office is like a container
• the image of the gate is a bit oppressive and too serious
• the “door” is too weak • the archway is like a
“7” which is no good according to Chinese tradition
• the empty hole lets away money
• improvements can be made to this design
Design B
• simplicity is a virtue • its functionality is most
commendable • its low-key profile
symbolises “small Government”
• the civil servants working there will appreciate this design
• the design is too common with no special features
• should improve on the colour of the buildings
Design C
• avant-garde is its trademark
• the star wars design is most commendable for HK to move forward
• slanting design is totally unacceptable
• the orientation of buildings is most disastrous
• it would be better if the height is reduced
Design D
• the sky-bridge concept is excellent
• the sail concept is very inspirational
• the “pearl” design is very appealing
• the yacht and pearl combination is very popular among the Chinese
• the unique Feng Shui consideration is the trademark of this
• the screen design is very bad and the sail concept is outdated
• the man-made beach is totally of no use
• the egg concept is not appealing: people don’t know the purpose of the egg
• should not have the fish pond in the centre of public area
• the sail does not
• the size of the pearl should be reconsidered
48

Chapter 3: Qualitative Data Analysis
design • its man-heaven unity
design is most commendable
represent HK • the artificial beach is
too expensive to build and maintain
• too much care about Feng Shui is outdated
• junk means junk
3.3.9 Feng Shui concerns
For comments on “Feng Shui concerns”, a total of 116 comments on the four designs was received. The three most frequently-mentioned issues relate to “negative comments” (62.93%), “positive comments” (20.69%), and “other comments” (16.38%). Comments on these three issues account for all of the views expressed (Table 5.11 of Appendix 5). A summary of the salient points for each of the four designs is presented below:
Positive Comments Negative Comments Other Comments
Design A
• it is unique and Feng Shui friendly
• it is poor Feng Shui: it will be a burden to taxpayer
• the design is like “7” which is no good according to Chinese tradition
• a lot of people will complain about bad Feng Shui because good wind and water will escape through the “big hole” into the harbour
• poor Feng Shui: it might lead to over-budget and safety issue
• its Feng Shui consideration can be further improved
Design B
• using Feng Shui in the building is very appealing to HK people
• the Feng Shui concept is good as it can really contribute to HK’s prosperity
• don’t like the Feng Shui concept: creates a feeling of superstition
• Feng Shui gives people the idea of old and unrealistic thinking
• can improve its Feng Shui if certain features are added
Design C
• its post-modern design is Feng Shui friendly
• the designer has not consider the Feng Shui theory that “everyone
• its edginess can be improved
49

Chapter 3: Qualitative Data Analysis
should stand straight and stick on the floor properly”
• like a brick on the waterfront: blocking Feng Shui
• like tombstones: bad in terms of Feng Shui
Design D
• good Feng Shui consideration
• its Feng Shui design makes people safe and comfortable
• it is most in line with Chinese Feng Shui
• its man-heaven unity concept is most suited to Feng Shui
• what a stupid idea, how can you make it look like a JUNK!
• the idea of the junk is outdated
• it is a fail mark in terms of Feng Shui
• it is overcrowded: bad for Feng Shui
• it will be better if Design A and Design D are combined
3.3.10 Overall preference
Respondents gave their overall preference to individual designs and a total of 2,424 comments was received. The three most frequently-mentioned issues relate to, “positive comments” (70.74%), “negative comments” (21.18%) and “other comments” (8.07%). Comments on these three issues account for 99.13% of all the views expressed (Table 5.12 of Appendix 5). A summary of the salient points for each of the four designs is presented below:
Positive Comments Negative Comments Other Comments
Design A
• design A is an excellent product
• design A is the clear winner
• design A is by far the most impressive
• it is completely unsatisfactory
• if design A is chosen, HK will be notorious for illegal copying of designs
• the design can be improved
Design B
• overall performance: design B is the best
• design B has simple forms, neat layout and beautiful open space landscaping
• it is the worst of all • the design is very
boring
• the design can be improved
Design C
• design C is the most outstanding design of
• this is the worst design among all
• the edginess should be moderated
50

Chapter 3: Qualitative Data Analysis
the four
• there is no justification for such kind of buildings
Design D
• the best of the best • only design D is my
choice • everything matches in
harmony
• it is associated with poor quality
• it is the worst design of the lot
• the design should be improved further
3.3.11 Cost factor (estimate/perception)
Respondents gave their own estimate or perception on the cost factor for individual designs and a total of 301 comments was received. The three most frequently-mentioned issues relate to “cost of construction” (46.51%), “other technical matters” (37.54%), and “cost of maintenance” (14.95%). Comments on the three issues account for 99.00% of all the views expressed (Table 5.13 of Appendix 5). A summary of the salient points for each of the four designs is presented below:
Positive Comments Negative Comments Other Comments
Design A
• it is the cost-effective design
• the construction cost will be very high
• future maintenance cost will be very expensive
• it is a waste of space
• the lawn is good but what about the maintenance cost?
• builder should ensure the roof and upper floors are stable enough
Design B
• it is more competitive in construction cost
• it is cheaper to build and maintain
• the design has its advantages: low cost, short construction period, good engineering idea
• the electricity bill will be very high
• costs should be made known to the public
Design C
• its environmental design will reduce maintenance costs
• its cost effectiveness is in doubt
• it looks like a very expensive and inefficient building
• should consider the electricity level to see if meets environmental requirements
Design D
• it is a cost-effective design
• it is very expensive and inefficient
• its investment costs a
• the concept is good but don’t know if works or not
51

Chapter 3: Qualitative Data Analysis
massive amount • most pricey one to
build and maintain
3.3.12 Public consultation process
Respondents gave their own views on the Tamar public consultation process and a total of 341 comments was received. The three most frequently mentioned issues relate to “areas to improve” (53.08%), “availability of background information” (31.38%), and “commendable process” (9.68%). Comments on the three issues account for 94.14% of all the views expressed (Table 5.14 of Appendix 5). A summary of the salient points is presented below:
• there should be more disclosure of information • the demonstration area should be expanded • why is the exhibition venue so hidden away? • there are more security staff than visitors • the exhibition site not accessible enough • need to have someone to explain • Comment Card does not have enough space for writing comments • it is a brave approach to listen to public opinion • good opportunity to allow us to fulfil our dreams • it is more a public relations tactic
3.3.13 Other overall comments
Respondents gave their own views on other issues as they saw fit and a total of 635 comments was received. The three most frequently-mentioned issues relate to “others” (25.67%), “possibility of combining models” (24.09%), and “all designs are unacceptable” (11.97%). Comments on the three issues account for 61.73% of all the views expressed (Table 5.15 of Appendix 5). A summary of the salient points is presented below:
• should consider the difficulty of actually building such designs • a blue sky is what we should get • should encourage citizen participation • should consider light pollution • should consider colour of the buildings • there should be no excessive grandeur • should consider space for future development • the project is wasting public assets • should not have a fish pond exclusively for the Chief Executive • more voting boxes needed • should consider the bidders’ “business reputation” • no need to have more tall buildings • models not to scale • there should be other choices to consider
52

Chapter 3: Qualitative Data Analysis
• promenade should be included in the Tamar design • all designs have too much commercial feel • lacking a public square • public buildings should not be ostentatious • moat (water feature): wrong • should not waste public money • the project is a symbol of extravagance • possibility of combining different design models? • Tamar site should be used for a library with a grand harbour view • should provide more data: cost and life cycle analysis • all designs should provide zero carbon emission • should cancel the project • the designs are all rubbish • the inclusion of promenade in design models: misleading • don’t waste the sea view like the Cultural Centre • no more buildings at this site • should not only go for the lowest bid • display box lighting should be adjusted • should reserve the land for sale • exhibition is quite good • Government buildings should be low-key • should use local architects • “small” Government using expensive land • should have a big tent outside LegCo for people to listen to debates • should have enough facilities and assistance to the disabled • promenade should have a bicycle lane • there should be a more classic style designs to choose • should exhibit a more civic character • should use traditional Chinese-style building design • don’t pay too much attention to citizens’ questionnaire • should be relocated to Western Kowloon site • none of the designs show public parking space • future CGC should not be barricaded like the present one • should be built as quickly as possible • this selection process will form no part in the tendering selection process • should welcome participation of amateur designers • should have a public square for flag raising • should consider keeping the pandas here • we don’t need new icon for this city • don’t demolish the current LegCo • public green space will not be enjoyed by HK citizens but, filled by overseas helpers • why no open competition • site boundary is not defined • should add jogging lane • all the designs are too proud • traffic and pedestrian linking networks are inadequate • Donald Tsang is not interested in public opinion anyway
53

Chapter 3: Qualitative Data Analysis
• should not care about money: should attain perfection • should have fishing spot and dogs’ garden • should have more facilities for children • if design D wins, it goes to show how important it is for a contractor to have the
backing of the PRC Government • has any technical assessment been carried out? • having a festival market or retail space at the waterfront is not a good idea • the best design is to leave our harbour intact without reclamation • the use of symbolised physical form to “represent” HK in this project is very
dangerous • never let the developers ruin our ridgeline like IFC has • need a low-profile but smart Government • don’t put Government offices in Tamar but make it build a public entertainment
stadium or coliseum • should learn from Sydney’s example to get social coherence and interaction with
community • should visit Esplanade Redevelopment plan at Cairns • don’t try to design an architecture out of Feng Shui: there is a reason why Chinese
do not have a world class architect • what makes HK unique is “east meets west”: none of the designs portrays it • should have some chairs so that TV viewers may feel more comfortable • if possible, let world famous architects help in finalizing the selected design • should keep the buildings low • independent accessibility consultant should be engaged on the project • all unacceptable because they don’t have a Chinese flavour • there should be no high rise on Tamar site • CGC should not be on waterfront • introduction of more water features can soften the environment • should speed up construction lest problems arise • can’t comment because interior design details not known • should take care of interior design regarding computer trunk line, flood control,
crowd control lest CGC functions be paralyzed • design of external wall of building: to avoid further renovation work in future and
only carry out repair work if required • various facilities inside building suggested • should add a parade ground • a red-light district should be established near Government headquarters • all rooftops should have total greenery cover • hope Government studies public opinion carefully • why not build it in New Territories • interior design should add more colonial colour • super-luxurious club for Government • contractors will have a fat share of profit • the Comment Card is too long • only wants to show authoritativeness • soulless • no need to have more buildings on waterfront • should combine the advantages of A and D
54

Chapter 3: Qualitative Data Analysis
• have not considered impact of the PLA pier • should establish more smoking areas • design and build is not the right procurement method • life-cycle costing not shown • comment collection not transparent • inclusion of waterfront promenade is misleading • relationship with surrounding buildings not shown • learn from the mistakes of the HK Central Library • adopt UV resistant material on all roofs • some designs are hideous • should add a justice icon there • buildings should have an air of respectability and dignity • should consider the building complex as the capital of HK • symbolic value and memorial space • Tamar site is not a park and necessary security consideration needed • should not let security guards disturb people’s viewing of the models • all designs are too lavish • should build the Government headquarters in Western district • where is the helipad? • decision should be made by popular vote • as architects, we should look at ideas and concepts, rather than technical factors • the schemes look like student designs • our Government should have no identity in terms of architectural form • signpost leading to exhibition venue inadequate • will there be a viewing gallery? • can more windows be opened? • reduction of peak demand of electrical load • can changes be made to the design before and after the award of contract? • barrier free access for the handicapped • how far would LegCo members’ view be taken into consideration? • tender prices are confidential information • there is a misconception that area for public to express views be regarded as a
demonstration zone • LegCo library should be made accessible to public use • multi-purpose function hall should be open to public use • building and electrical materials are above normal standard and cost more • there should be wireless-fidelity facilities • dining facilities in future LegCo precincts • there should be new arrangements for public touring new LegCo • special attention should be given to ergonomics in designing and purchasing chairs
used in LegCo • too many lifts • it is a regret that the Administration refuses to attend Legislative Council
Commission meeting • a working group should be set up to facilitate the exchange of views with
Government in the course of implementing the project • size of open space for public enjoyment
55

Chapter 3: Qualitative Data Analysis
• height of concerned buildings • energy-saving measures (design, building materials, natural ventilation etc.) • amount of electricity to be used • environmental friendly measures (green rooftops, waste sorting and recycling
measures etc.) • water-saving measures (waste water recycling, storm-water collection etc.) • ventilation impact assessment • noise impact assessment • guided tours in public buildings (public gallery, information gallery etc.) • visibility across the harbour • closed-circuit television and design of restricted areas • water features • possibility of altering design proposals
3.4 QUALITATIVE DATA ANALYSIS SUMMARY Based on the grounded theory and supported by the NUDIST software, PPRI created an analytical framework comprising themes, categories and sub-categories to organise the raw data. Assessments and evaluations of all the Qualitative Data were conducted. The 13 themes are summarised in descending order in terms of public attention (i.e. comments in text units) and they are:
1. Visual Attractiveness (10,756 text units). 2. Green Features and Environmental Friendliness (3,126 text units).
3. Overall Preference (2,424 text units).
4. Public Open Space (1,785 text units).
5. Comments on Certain Unique Features (1,463 text units).
6. Image Befitting the CGC and the LegCo Complex (1,442 text units).
7. Symbol of Hong Kong as Asia’s World City (1,372 text units).
8. Impact on Cityscape and Waterfront Environment (981 text units).
9. Other Overall Comments (635 text units). 10. Public Consultation Process (341 text units).
11. Cost Factor (Estimate/Perception) (301 text units).
12. Connectivity of the Tamar Site and Surrounding Areas. (295 text units).
13. Feng Shui Concerns (116 text units).
56

Chapter 3: Qualitative Data Analysis
Within the above 13 most concerned themes/issues, the general public also gave their positive and negative views on the four designs except for two themes (“public consultation process” and “other overall comments”) which were not related to public assessment of the four designs (see Table 5.2 in Appendix 5). The ranking of the positive and negative comments of the remaining 11 themes is tabulated in Tables 3.1 and 3.2. For Visual Attractiveness, Design A is the most preferred design with 13.56% of the positive comments, followed by Design D (11.51%), Design C (5.37%), and Design B (3.17%). Design B is the least preferred design with 20.94% of the negative comments followed by Design C (15.94%), Design A (11.78%), and Design D (10.69%). For Green Features and Environmental Friendliness, Design A is the most preferred design and received 17.88% of the positive comments, followed by Design B (12.48%), Design C (8.48%), and Design D (4.64%). Design D is the least preferred design with 14.04% of the negative comments followed by Design B (10.01%), Design C (6.14%), and Design A (6.05%). For Overall Preference, Design D is the most preferred design and received 28.75% of the positive comments, followed by design A (24.22%), Design C (9.41%), and Design B (7.51%). Design B is the least preferred design with 7.14% of the negative comments followed by Design C (6.56%), Design D (4.00%), and Design A (3.26%). For Public Open Space, Design D is the most preferred design and received 13.56% of the positive comments, followed by Design B (10.76%), Design A (9.58%) and Design C (3.81%). Design D is the least preferred design with 8.91% of the negative comments followed by Design A (8.40%), Design B (6.50%), and Design C (5.04%). For Comments on Certain Unique Features, Design D is the most preferred design and received 15.38% of the positive comments, followed by Design A (6.90%), Design C (4.44%), and Design B (1.71%). Design D is the least preferred design with 23.17% of the negative comments followed by Design C (15.86%), Design A (8.48%), and Design B (3.42%). For Image Befitting the Central Government Complex and the LegCo Complex, Design A is the most preferred design and received 13.31% of the positive comments, followed by Design B (8.04%), Design D (4.99%), and Design C (3.19%). Design C is the least preferred design with 20.18% of the negative comments followed by Design D (15.81%), Design B (14.36%), and Design A (11.23%). For Symbol of Hong Kong as Asia’s World City, Design D is the most preferred design and received 45.34% of the positive comments, followed by Design A (10.35%), Design C (4.66%), and Design B (1.90%). Design B is the least preferred design with 9.55% of the negative comments followed by Design A (7.94%), Design D (7.87%), and Design C (6.41%). For Impact on Cityscape and Waterfront Environment, Design A is the most preferred design with 12.44% of the positive comments, followed by Design D (9.38%), Design B (8.56%), and Design C (6.12%). Design D is the least preferred design with 26.50% of the negative comments followed by Design C (15.80%), Design A (9.89%), and Design B (3.36%).
57

Chapter 3: Qualitative Data Analysis
For Cost Factor (Estimate/Perception), Design B received the most positive comments among the four designs (6.64%) and followed by Design A (1.33%), Design C (1.33%), and Design D (1.33%). Design A is the least preferred design with 21.59% of the negative comments followed by Design D (13.62%), Design C (10.63%), and Design B (4.65%). For Connectivity of the Tamar Site and Surrounding Areas, Design A is the most preferred design and received 22.71% of the positive comments, followed by Design D (7.12%), Design C (4.41%), and Design B (3.73%). Design D is the least preferred design with 12.20% of the negative comments followed by Design B (6.10%), Design C (5.76%), and Design A (5.42%). For Feng Shui Concerns, Design B is the most preferred design with 9.48% of the positive comments, followed by Design D (6.90%), Design A (2.59%), and Design C (1.72%). Design A is the least preferred design with 32.76% of the negative comments followed by Design C (12.93%), Design B (8.62%), and Design D (7.76%).
Table 3.1: Number of Positive Comments on Individual Designs by Themes Themes Positive Comments on
Individual Designs General
Comments Total
1 Visual attractiveness A (1458) D (1238) C (578) B (341) G (18) 3633
2 Overall preference D (697) A (587) C (228) B (182) G (6) 1700
3 Green features and environmental friendliness A (559) B (390) C (265) D (145) G (17) 1376
4 Symbol of HK as Asia's world city D (622) A (142) C (64) B (26) G (11) 865
5 Public open space D (242) B (192) A (171) C (68) G (16) 689
6 Image befitting the Central Government Complex and the LegCo Complex A (192) B (116) D (72) C (46) G (5) 431
7 Comments on certain unique features D (225) A (101) C (65) B (25) G (1) 417
8 Impact on cityscape and waterfront environment A (122) D (92) B (84) C (60) G (2) 360
9 Connectivity of the Tamar site and surrounding areas A (67) D (21) C (13) B (11) G (1) 113
10 Cost factor B (20) A (4) C (4) D (4) G (3) 35
11 Feng Shui concerns B (11) D (8) A (3) C (2) G (0) 24
Based on the above data, it can be concluded that Design A leads in the respondents’ positive comments (3404), followed by Design D (3366), Design B (1398) and Design C (1393). Among the 11 themes of most concern to the general public, Design A received most positive comments on five themes, followed by Design D (4 out of 11), Design B (2 out of 11) and Design C (0 out of 11). The table above provides the distribution of the four designs by positive comments.
58

Chapter 3: Qualitative Data Analysis
Table 3.2: Number of Negative Comments on Individual Designs by Themes Themes Negative Comments on
Individual Designs General
Comments Total
1 Visual attractiveness B (2252) C (1714) A (1267) D (1150) G (40) 6423
2 Green features and environmental friendliness D (439) B (313) C (192) A (189) G (51) 1184
3 Image befitting the Central Government Complex and the LegCo Complex C (291) D (228) B (207) A (162) G (19) 907
4 Comments on certain unique features D (339) C (232) A (124) B (50) G (10) 755
5 Public open space D (159) A (150) B (116) C (90) G (34) 549
6 Impact on cityscape and waterfront environment D (260) C (155) A (97) B (33) G (2) 547
7 Overall preference B (173) C (159) D (97) A (79) G (1) 509
8 Symbol of HK as Asia's world city B (131) A (109) D (108) C (88) G (15) 451
9 Cost factor A (65) D (41) C (32) B (14) G (5) 157
10 Connectivity of the Tamar site and surrounding areas D (36) B (18) C (17) A (16) G (6) 93
11 Feng Shui concerns A (38) C (15) B (10) D (9) G (1) 73
Based also on the above data, it can be concluded that Design B leads in the respondents’ negative comments (3317), followed by Design C (2985), Design D (2866) and Design A (2296). Among the themes of most concern to the general public, Design D received most negative comments on five themes, followed by Design B (3 out of 11), Design A (2 out of 11) and Design C (1 out of 11). The table above provides the ranking of the four designs by negative comments.
59

Chapter 4: Analysis of the key points
60
4. ANALYSIS OF THE KEY POINTS This Chapter integrates the findings from the previous Chapters. Some methodological considerations are also discussed.
4.1 METHODOLOGICAL CONSIDERATIONS This Consultancy seeks to assess, summarise, and compare the views obtained from (1) responses to close-ended questions of the Comment Cards, (2) Exit Polls, (3) Telephone Polls, (4) written comments from Comment Cards, and (5) Written Submissions. This Chapter first describes how the results from different data sets are to be viewed. The issue of the weighting of the different types of data is also discussed.
4.1.1 Weighting of Data Generally speaking, since data from Telephone Polls (1) reflect the opinion of the general public, (2) are collected in an unbiased manner, and (3) can be demonstrated to be statistically reliable and valid, it is often argued that greater weight should be assigned to them. Moreover, from a public policy perspective, opinions of the general public deserve the utmost attention. On the other hand, members of the public are passive respondents and often not well informed about the issues involved. In this particular instance, more than three quarters of the Telephone Poll respondents did not know the exact number of design proposals being considered, and less than 2% had studied all of the relevant materials. Hence, their opinions must also be viewed in this light. Furthermore, there are serious limitations as to what can be asked in a telephone interview. The opinions of interested citizens, who took the time and effort to gain an understanding of the issues and took the trouble to proactively submit their views, deserve special attention. The data from Comment Cards and Written Submissions capture the opinions of this group. The collection process, however, is susceptible to manipulation. Returns of this nature can easily be orchestrated or even created by interested parties. Furthermore, statistical reliability or validity cannot be demonstrated from data collected through such a process. Exit Polls selected over 5,000 respondents on a randomised basis, and all of the respondents had the benefit of having seen the exhibition materials immediately before answering the questions. The time and date of the Exit Polls were not announced in advance, and hence, it would be difficult for interested parties to manipulate the exercise. It is, therefore, reasonable to give greater weighting to the Exit Poll data. For the Telephone Poll respondents, the effective sample size for the questions regarding the Designs ranges from 328 to 369 and the remainder (over 2,600) gave “not sure/don’t remember” answer to those questions. The passage of time and the fact that the majority of the respondents gained knowledge about the project from the media only might also have affected the reliability of the responses of those who answered the question.

Chapter 4: Analysis of the key points
4.1.2 Profile of the Respondents
The profile of the respondents should be taken into consideration when interpreting the results. The selected characteristics of the respondents from the different data sets are shown below: Table 4.1: Characteristics of Respondents from Various Data Sets:
Data Source/ Respondent Characteristics
Comment Cards
Exit Polls
Phone Polls
Male Gender 61% 60% 40% Age > 61 6% 15% 21% HK Island Residence 35% 29% 19% Kowloon 30% 34% 33% NT / Islands 34% 34% 48%
The profile of the respondents is somewhat similar for the Comment Cards and Exit Polls – there are more male than female; the majority are of working age, and about one-third reside on Hong Kong Island. Compared to the Comment Card and Exit Poll respondents, the Phone Polls have more female respondents, with fewer residing on Hong Kong Island. The two groups of respondents are not quite the same. Generally speaking, the Comment Card and Exit Poll respondents comprise mainly working persons, and persons interested in the project. The Telephone Poll respondents are randomly selected from households with a fixed line telephone, and their views reflect those of the general population.
4.1.3 Highlights This Chapter highlights views with the following characteristics: • High frequency count/high percentage/high mean score from Exit Poll and Telephone
Poll responses;
• High frequency count/high percentage/high mean score from responses from close-ended questions on Comment Cards; and
• High frequency count and high percentage in terms of number of text units from Qualitative Data from Comment Cards and Written Submissions.
It must be pointed out that, unlike the Exit Polls and Telephone Polls in which subjects were selected in a randomised manner, frequency counts and percentages from Comment Cards and Written Submissions must be interpreted with great caution, as no statistical inferences can be made with this data. A high percentage of opinion in favour of or against a certain design from these sources does not necessarily suggest that a similar high percentage exists in the general population. To claim that a similar percentage exists in the general population on the basis of this data would normally require the convergence of at least one other set of such data. This Study seeks to triangulate the findings using different sources of data wherever possible.
61

Chapter 4: Analysis of the key points
4.2 ISSUES OF GREATEST CONCERN The distribution of comments from the Qualitative Data indicates different levels of concern shown by the public on relevant issues. It would be reasonable to attach higher weighting to issues of the greatest concern to the public. Qualitative Analysis of text data indicates that the “Visual Attractiveness” theme is of the greatest concern, with a total of over 10,000 text units of comments, followed by the “Green Features and Environmental Friendliness” theme with over 3,000 text units of comments. In contrast, the “Connectivity of the Tamar Site to Surrounding Areas” theme received only around 300 text units of comments. The rest of the four themes received between roughly 1,000 to 2,000 text units of comments. It would be reasonable to give a higher weighting to the “Visual Attractiveness” theme, and, to a lesser extent, the “Green Features and Environmental Friendliness” theme. Even though the Comment Card does not contain any question on the overall rating of the designs, there were more than 2,000 text units of comments regarding respondents’ overall preference, making this theme rank third in terms of frequency count of comments.
Categories (under the various themes) receiving over 400 comments in text units include: Design aesthetics (4,572 text units) Overall preference (2,403 text units) Iconic landmark (2,130 text units) Originality and “copycat” concerns (1,558 text units) Presence of trees, plants, lawns: size and design (1,495 text units) Comments on certain unique features (1,455 text units) Scale and proportion (1,423 text units) Reflection on the distinct identities and roles of Government headquarters (994 text
units) Reflection on Hong Kong as a cosmopolitan, dynamic and contemporary city (746
text units) Impact on the cityscape and neighbouring buildings (736 text units) Landscaping design (632 text units) Air flow around the area (577 text units) Identity of Hong Kong's uniqueness and its history (559 text units) Relationship between attractiveness and functionality (543 text units) Avant-garde and post-modern feel (492 text units) Meeting the needs of the public (448 text units) Environmental friendliness (435 text units)
4.3 THE FOUR DESIGNS On the basis of the Quantitative Data Analysis, Design D leads in three data sets (responses to close-ended questions of Comment Cards, Exit Polls, and Telephone Polls). Designs D and A appear to be more popular than Designs C and B on almost all of the selected attributes. (See Table 4.2).
62

Chapter 4: Analysis of the key points
The overall rank order of the designs from the collected Comment Cards (responses to close-ended questions) is: D, A, C, B. This rank order is corroborated by the Exit Polls (D, A, C, B). The overall rank order of the designs from the Telephone Polls is: D, B, A / C. Table 4.2: Mean Score Results of the Exit Polls
Design
Mean score for question
a
Mean score for question
c
Mean score for question
d
Total mean score
Grand mean score
A 2.85 2.73 2.84 8.42 2.81
B 2.15 2.18 2.40 6.73 2.24
C 2.35 2.28 2.36 6.99 2.33
D 3.00 2.79 2.87 8.66 2.89
In terms of Exit Poll results, the total mean scores of Designs A, B, C, D are respectively 8.42, 6.73, 6.99 and 8.66. Design D is ahead of Design A by 1.41%. If more weight is given to the Exit Polls because of the reasons mentioned in 4.1.1, Design D is the preferred scheme. If “Visual Attractiveness” is given more weight in the results of the collected Comment Cards, the Exit Polls and the Telephone Polls due to the intensity of public views, Design D is still preferred. It should be pointed out that the total mean score from the Comment Cards for Design A is 20.53 and for Design D is 20.80, and that the difference is 0.27, which is less than one percentage point. The lead of Design D over Design A should therefore be considered marginal. (See Table 4.3).
Table 4.3: Mean Score of Each Design for Each Question (Comment Card Data Set)
Design
Mean score for question
a
Mean score for question
b
Mean score for question
c
Mean score for question
d
Mean score for question
e
Mean score for question
f
Mean score for question
g
Total mean score
Grand mean score
A 2.96 2.85 2.87 2.93 3.02 3.00 2.90 20.53 2.93
B 2.07 2.01 2.21 2.40 2.67 2.62 2.51 16.49 2.36
C 2.31 2.34 2.33 2.38 2.58 2.53 2.52 16.99 2.43
D 3.10 3.13 2.94 2.93 2.81 2.98 2.91 20.80 2.97
When Qualitative Data is taken into consideration, the preferred scheme is not so straight-forward. Design A and Design D received respectively 3,404 and 3,366 positive comments. The difference is 38 comments or less than 1%. Hence Design A is marginally ahead of Design D in terms of positive comments. Design D and Design A received respectively 2,866 and 2,296 negative comments. The difference is 570 comments. Design D is 11% ahead of Design A in terms of negative comments.
63

Chapter 4: Analysis of the key points
From the Qualitative Data, when both positive and negative comments are taken into consideration, Design A appears to be preferred over Design D (see Table 4.4). Table 4.4: Positive and Negative Comment Counts for the Four Designs
Design A B C D
Positive Comment Counts
3,404 1,398 1,393 3,366
Negative Comment Counts
2,296 3,317 2,985 2,866
While the results of the Quantitative and Qualitative Data Analyses do not converge, Design D is ahead of Design A on the first three of the five data sets (responses to close-ended questions of Comment Cards, Exit Polls, Telephone Polls, Positive Written Comments, and Negative Written Comments).
4.4 HIGH LEVEL OF PUBLIC INTEREST The interest level of the public on the project is high, judging from the number of visitors to the exhibition, to the website, the number of Comment Cards received, and the results of the Telephone Polls. This Consultancy shows that the two greatest concerns the public has regarding the design proposals relate to “Visual Attractiveness” and “Green Features and Environmental Friendliness”, and many are keen to provide their opinions on which design is most preferred. The majority are satisfied with the Exhibition of the Design Proposals.
64

Chapter 5: Summary and conclusions
65
5. SUMMARY AND CONCLUSIONS
5.1 SUMMARY OF FINDINGS 5.1.1 This Consultancy shows that the interest level of the public on the project is high, judging
from the number of visitors to the exhibition, to the website, the number of Comment Cards received, and the results of the Telephone Polls.
5.1.2 The greatest concern the public has regarding the design proposals relate to “Visual
Attractiveness” and “Green Features and Environmental Friendliness”, and many are keen to provide their opinions on which design is preferred.
5.1.3 On the basis of the Quantitative Data Analysis, Design D leads in all three data sets
(responses to close-ended questions of Comment Cards, Exit Polls, and Telephone Polls). Designs D and A appear to be more popular than Designs C and B on almost all of the selected attributes.
5.1.4 The overall rank order of the designs from the collected Comment Cards (responses to
close-ended questions) is: D, A, C, B. This rank order is corroborated by the Exit Polls (D, A, C, B). The overall rank order of the designs from the Telephone Polls is: D, B, A / C.
5.1.5 In terms of Exit Poll results, the total mean scores of Designs A, B, C, D are respectively 8.42, 6.73, 6.99 and 8.66. Design D is ahead of Design A by 1.41%. If more weight is given to the Exit Polls because of the reasons mentioned in 4.1.1, Design D is the preferred scheme. If “Visual Attractiveness” is given more weight in the results of the collected Comment Cards, the Exit Polls and the Telephone Polls due to the intensity of public views, Design D is still preferred. However, the lead of Design D over Design A is marginal.
5.1.6 It should be pointed out that the total mean score from the Comment Cards for Design A is
20.53 and for Design D is 20.80, and that the difference is 0.27, which is less than one percentage point. The lead of Design D over Design A should therefore be considered marginal.
5.1.7 When Qualitative Data are taken into consideration, the preferred scheme is not so straight-
forward. Design A and Design D received respectively 3,404 and 3,366 positive comments. The difference is 38 comments or less than 1%. Hence Design A is marginally ahead of Design D in terms of positive comments. Design D and Design A received respectively 2,866 and 2,296 negative comments. The difference is 570 comments. Design D is 11% ahead of Design A in terms of negative comments.
5.1.8 From the Qualitative Data, when both positive and negative comments are taken into
consideration, Design A appears to be preferred over Design D. 5.1.9 While the results of the Quantitative and Qualitative Data Analyses do not converge,
Design D is ahead of Design A on the first three of the five data sets (responses to close-ended questions of Comment Cards, Exit Polls, Telephone Polls, Positive Written Comments, and Negative Written Comments).

Chapter 5: Summary and conclusions
5.2 CONCLUSION 5.2.1 The following Table summarises the results of the various data sets.
Comment Cards (responses to close-end questions)
Exit Polls Phone Polls Positive Written Comment Counts
Negative Written Comment Counts*
D, A, C, B D, A, C, B D, B, A / C# A, D, B, C B, C, D, A *The number of negative comment counts is arranged in a descending order. # Design A and Design C are tied in rank order.
Taking into account the various sources of Quantitative and Qualitative Data, their limitations, and the greater weighting which can arguably be given to Exit Polls, it can be concluded that Design D is narrowly ahead of Design A, with Design B and Design C lagging behind by a substantial margin.
66

67
APPENDICES

Appendix 1
Appendix 1
Composition and Organisation Structure of the
Consultancy Team
68

Appendix 1
Composition and Organisation Structure of the Consultancy Team The Consultancy Team Professor Lee Ngok (Leader): Co-ordinator, PPRI. Professor Peter P.M. Yuen: Principal Investigator of Heath and Welfare, PPRI and Professor in Management. Professor Edwin H.W. Chan: Professor in Building and Real Estate. Dr. Hanqin Zhang: Associate Professor in Hotel and Tourism Management. Dr. Kwok Keung Yuen: Project Fellow, PPRI. Mr. Derek Gould: Honorary Fellow, PPRI Mr. Steven H.T. Li: Project Fellow, CAST. Miss Joan W.L. Li: Assistant Officer, PPRI. Miss Edith S.Y. Choy: Assistant Officer, PPRI. Miss Jessie Huang: Research Assistant, Department of Management and Marketing Organisational Structure of Consultancy Team Professor Lee Ngok co-ordinates the work of the Quantitative and Qualitative Teams and ensures the smooth running of the Consultancy. Professor Peter Yuen heads the Quantitative Team and is responsible for overseeing data collection and data analysis. Professor Edwin Chan provides expertise advice on technical matters regarding building and development issues, and on design of the Comment Card, Information Leaflet, and Analytical Framework for Qualitative Data analysis. He is not involved in data analysis and data interpretation. Dr. Hanqin Zhang and Dr. Kwok Keung Yuen head the Qualitative Team and are responsible for overseeing qualitative analysis. Mr. Derek Gould is responsible for editing this Report and for ensuring stylistic consistency. Mr. Steven Li supervises and organises the Exit Polls and telephone polls Miss Joan Li, Miss Edith Choy and Miss Jessie Huang are responsible for overseeing data entry, coding Qualitative Data by using NUDIST and assist Professor Lee in co-ordinating the work of the two Teams. The Organisational Structure of the Consultancy Team is shown below:
Prof. Edwin CHAN
Prof. Peter YUEN Dr. Kwok Keung YUEN Dr. Hanqin ZHANG
Miss Joan LI Miss Edith CHOY Miss Jessie HUANG
Mr. Derek GOULD
Mr. Steven LI
Qualitative Analysis
Prof. LEE Ngok
Quantitative Analysis
69

Appendix 2
70
Appendix 2
Quantitative Results of the Comment Cards

Appendix 2
71
Table 2.1.1 (a) Visual attractiveness (N∗= 14055)
Design Excellent Good Fair Unsatisfactory Total Missing / Invalid
Fr
eque
ncy
Perc
enta
ge
Freq
uenc
y
Perc
enta
ge
Freq
uenc
y
Perc
enta
ge
Freq
uenc
y
Perc
enta
ge
Freq
uenc
y
Perc
enta
ge
Freq
uenc
y
Perc
enta
ge
A 4467 34.90% 4629 36.17% 2423 18.93% 1279 9.99% 12798 100.00% 1257 8.94%
B 907 7.40% 2647 21.58% 5087 41.48% 3624 29.55% 12265 100.00% 1790 12.74%
C 1379 11.24% 3795 30.93% 4352 35.47% 2742 22.35% 12268 100.00% 1787 12.71%
D 5938 45.46% 3858 29.54% 1940 14.85% 1326 10.15% 13062 100.00% 993 7.07%
0%
20%
40%
60%
80%
100%
Design A Design B Design C Design D
Design
Per
cent
age Excellent
Good FairUnsatisfactory
∗ “N” means “number of responses”.

Appendix 2
Table 2.1.2 (b) Symbol of Hong Kong as Asia’s world city (N = 14055)
Design Excellent Good Fair Unsatisfactory Total Missing / Invalid
Fr
eque
ncy
Perc
enta
ge
Freq
uenc
y
Perc
enta
ge
Freq
uenc
y
Perc
enta
ge
Freq
uenc
y
Perc
enta
ge
Freq
uenc
y
Perc
enta
ge
Freq
uenc
y
Perc
enta
ge
A 3833 30.53% 4437 35.34% 2821 22.47% 1464 11.66% 12555 100.00% 1500 10.67%
B 781 6.46% 2497 20.66% 4878 40.36% 3930 32.52% 12086 100.00% 1969 14.01%
C 1524 12.58% 3719 30.71% 4209 34.75% 2659 21.96% 12111 100.00% 1944 13.83%
D 6041 46.71% 3750 29.00% 1872 14.48% 1269 9.81% 12932 100.00% 1123 7.99%
0%
20%
40%
60%
80%
100%
Design A Design B Design C Design D
Design
Perc
enta
ge
ExcellentGood FairUnsatisfactory
72

Appendix 2
Table 2.1.3 (c) Image befitting the Central Government Complex and the Legislative Council Complex (N = 14055)
Design Excellent Good Fair Unsatisfactory Total Missing / Invalid
Fr
eque
ncy
Perc
enta
ge
Freq
uenc
y
Perc
enta
ge
Freq
uenc
y
Perc
enta
ge
Freq
uenc
y
Perc
enta
ge
Freq
uenc
y
Perc
enta
ge
Freq
uenc
y
Perc
enta
ge
A 3801 30.45% 4633 37.11% 2716 21.76% 1333 10.68% 12,483 100.00% 1572 11.18%
B 1169 9.74% 3203 26.69% 4614 38.45% 3015 25.12% 12001 100.00% 2054 14.61%
C 1399 11.61% 3756 31.16% 4297 35.65% 2600 21.57% 12052 100.00% 2003 14.25%
D 4687 36.59% 4192 32.72% 2464 19.23% 1467 11.45% 12810 100.00% 1245 8.86%
0%
20%
40%
60%
80%
100%
Design A Design B Design C Design D
Design
Perc
enta
ge
ExcellentGood FairUnsatisfactory
73

Appendix 2
Table 2.1.4 (d) Impact on cityscape and waterfront environment (N = 14055)
Design Excellent Good Fair Unsatisfactory Total Missing / Invalid
Fr
eque
ncy
Perc
enta
ge
Freq
uenc
y
Perc
enta
ge
Freq
uenc
y
Perc
enta
ge
Freq
uenc
y
Perc
enta
ge
Freq
uenc
y
Perc
enta
ge
Freq
uenc
y
Perc
enta
ge
A 4058 32.93% 4587 37.22% 2451 19.89% 1227 9.96% 12323 100.00% 1732 12.32%
B 1516 12.77% 3905 32.91% 4288 36.13% 2158 18.18% 11867 100.00% 2188 15.57%
C 1425 12.02% 3962 33.43% 4102 34.61% 2364 19.94% 11853 100.00% 2202 15.67%
D 4775 37.76% 3913 30.94% 2291 18.12% 1667 13.18% 12646 100.00% 1409 10.02%
0%
20%
40%
60%
80%
100%
Design A Design B Design C Design D
Design
Perc
enta
ge
ExcellentGood FairUnsatisfactory
74

Appendix 2
Table 2.1.5 (e) Green features and environmental friendliness (N = 14055)
Design Excellent Good Fair Unsatisfactory Total Missing / Invalid
Fr
eque
ncy
Perc
enta
ge
Freq
uenc
y
Perc
enta
ge
Freq
uenc
y
Perc
enta
ge
Freq
uenc
y
Perc
enta
ge
Freq
uenc
y
Perc
enta
ge
Freq
uenc
y
Perc
enta
ge
A 4309 35.03% 4855 39.47% 2257 18.35% 881 7.16% 12302 100.00% 1753 12.47%
B 2379 19.97% 4616 38.75% 3467 29.10% 1451 12.18% 11913 100.00% 2142 15.24%
C 1911 16.12% 4637 39.11% 3694 31.16% 1613 13.61% 11855 100.00% 2200 15.65%
D 3623 28.85% 4478 35.66% 2879 22.93% 1578 12.57% 12558 100.00% 1497 10.65%
0%
20%
40%
60%
80%
100%
Design A Design B Design C Design D
Design
Per
cent
age Excellent
Good FairUnsatisfactory
75

Appendix 2
Table 2.1.6 (f) Public open space (N = 14055)
Design Excellent Good Fair Unsatisfactory Total Missing / Invalid
Fr
eque
ncy
Perc
enta
ge
Freq
uenc
y
Perc
enta
ge
Freq
uenc
y
Perc
enta
ge
Freq
uenc
y
Perc
enta
ge
Freq
uenc
y
Perc
enta
ge
Freq
uenc
y
Perc
enta
ge
A 4115 33.57% 4912 40.07% 2310 18.84% 921 7.51% 12258 100.00% 1797 12.79%
B 1973 16.62% 4878 41.10% 3562 30.01% 1457 12.27% 11870 100.00% 2185 15.55%
C 1525 12.92% 4809 40.76% 3907 33.11% 1558 13.20% 11799 100.00% 2256 16.05%
D 4644 36.88% 4307 34.20% 2386 18.95% 1256 9.97% 12593 100.00% 1462 10.40%
0%
20%
40%
60%
80%
100%
Design A Design B Design C Design D
Design
Perc
enta
ge
ExcellentGood FairUnsatisfactory
76

Appendix 2
Table 2.1.7 (g) Connectivity of the Tamar site and surrounding areas (N = 14055)
Design Excellent Good Fair Unsatisfactory Total Missing / Invalid
Fr
eque
ncy
Perc
enta
ge
Freq
uenc
y
Perc
enta
ge
Freq
uenc
y
Perc
enta
ge
Freq
uenc
y
Perc
enta
ge
Freq
uenc
y
Perc
enta
ge
Freq
uenc
y
Perc
enta
ge
A 3191 26.19% 5449 44.73% 2665 21.88% 877 7.20% 12182 100.00% 1873 13.33%
B 1202 10.21% 5012 42.59% 4086 34.72% 1469 12.48% 11769 100.00% 2286 16.26%
C 1287 10.95% 5004 42.58% 3972 33.80% 1490 12.68% 11753 100.00% 2302 16.38%
D 3827 30.55% 4923 39.31% 2591 20.69% 1184 9.45% 12525 100.00% 1530 10.89%
0%
20%
40%
60%
80%
100%
Design A Design B Design C Design D
Design
Perc
enta
ge
ExcellentGood FairUnsatisfactory
77

Appendix 2
Table 2.1.8 Mean scores for each design for each question.
Question Design a b c d e f g
A 2.96 2.85 2.87 2.93 3.02 3.00 2.90
B 2.07 2.01 2.21 2.40 2.67 2.62 2.51
C 2.31 2.34 2.33 2.38 2.58 2.53 2.52
D 3.10 3.13 2.94 2.93 2.81 2.98 2.91
0.00
0.50
1.00
1.50
2.00
2.50
3.00
3.50
a b c d e f g
Question
Mea
n sc
ore Design A
Design BDesign CDesign D
78
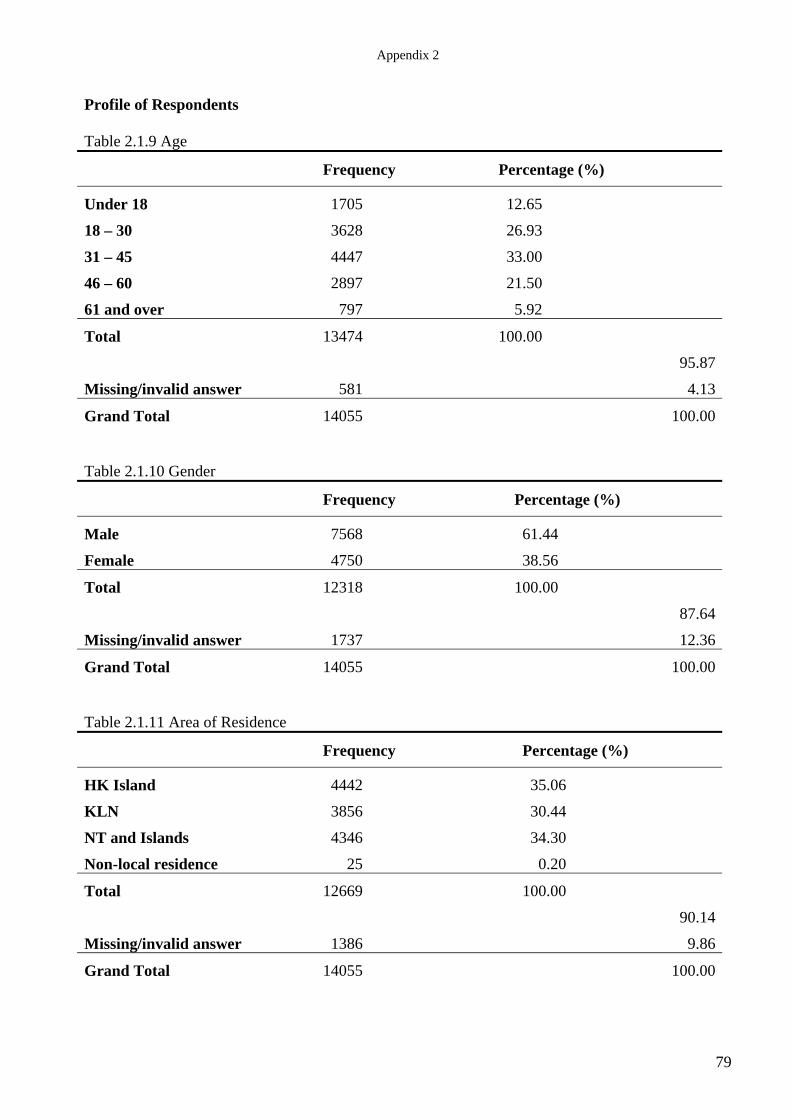
Appendix 2
79
Profile of Respondents Table 2.1.9 Age
Frequency Percentage (%)
Under 18 1705 12.65
18 – 30 3628 26.93
31 – 45 4447 33.00
46 – 60 2897 21.50
61 and over 797 5.92
Total 13474 100.00
95.87
Missing/invalid answer 581 4.13
Grand Total 14055 100.00 Table 2.1.10 Gender
Frequency Percentage (%)
Male 7568 61.44
Female 4750 38.56
Total 12318 100.00
87.64
Missing/invalid answer 1737 12.36
Grand Total 14055 100.00 Table 2.1.11 Area of Residence
Frequency Percentage (%)
HK Island 4442 35.06
KLN 3856 30.44
NT and Islands 4346 34.30
Non-local residence 25 0.20
Total 12669 100.00
90.14
Missing/invalid answer 1386 9.86
Grand Total 14055 100.00

Appendix 3
Appendix 3
Exit Poll Results
80
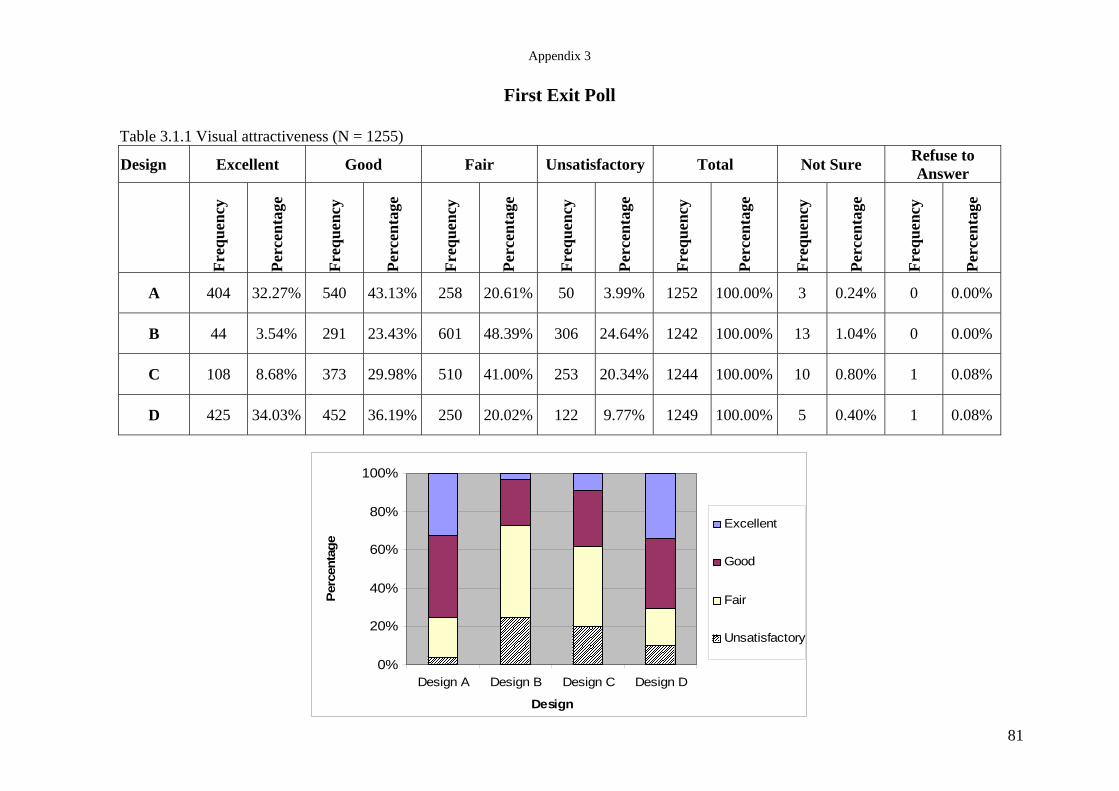
Appendix 3
81
First Exit Poll
Table 3.1.1 Visual attractiveness (N = 1255)
Design Excellent Good Fair Unsatisfactory Total Not Sure Refuse to Answer
Fr
eque
ncy
Perc
enta
ge
Freq
uenc
y
Perc
enta
ge
Freq
uenc
y
Perc
enta
ge
Freq
uenc
y
Perc
enta
ge
Freq
uenc
y
Perc
enta
ge
Freq
uenc
y
Perc
enta
ge
Freq
uenc
y
Perc
enta
ge
A 404 32.27% 540 43.13% 258 20.61% 50 3.99% 1252 100.00% 3 0.24% 0 0.00%
B 44 3.54% 291 23.43% 601 48.39% 306 24.64% 1242 100.00% 13 1.04% 0 0.00%
C 108 8.68% 373 29.98% 510 41.00% 253 20.34% 1244 100.00% 10 0.80% 1 0.08%
D 425 34.03% 452 36.19% 250 20.02% 122 9.77% 1249 100.00% 5 0.40% 1 0.08%
0%
20%
40%
60%
80%
100%
Design A Design B Design C Design D
Design
Per
cent
age
Excellent
Good
Fair
Unsatisfactory

Appendix 3
Table 3.1.2 Image befitting the Central Government Complex and the Legislative Council Complex (N = 1255)
Design Excellent Good Fair Unsatisfactory Total Not Sure Refuse to Answer
Freq
uenc
y
Perc
enta
ge
Freq
uenc
y
Perc
enta
ge
Freq
uenc
y
Perc
enta
ge
Freq
uenc
y
Perc
enta
ge
Freq
uenc
y
Perc
enta
ge
Freq
uenc
y
Perc
enta
ge
Freq
uenc
y
Perc
enta
ge
A 315 25.65% 529 43.08% 317 25.81% 67 5.46% 1228 100.00% 27 2.15% 0 0.00%
B 65 5.33% 325 26.64% 546 44.75% 284 23.28% 1220 100.00% 35 2.79% 0 0.00%
C 101 8.24% 357 29.14% 492 40.16% 275 22.45% 1225 100.00% 30 2.39% 0 0.00%
D 300 24.37% 467 37.94% 317 25.75% 147 11.94% 1231 100.00% 24 1.91% 0 0.00%
0%
20%
40%
60%
80%
100%
Design A Design B Design C Design D
Design
Per
cent
age
Excellent
Good
Fair
Unsatisfactory
82

Appendix 3
Table 3.1.3 Impact on cityscape and waterfront environment (N = 1255)
Design Excellent Good Fair Unsatisfactory Total Not Sure Refuse to Answer
Freq
uenc
y
Perc
enta
ge
Freq
uenc
y
Perc
enta
ge
Freq
uenc
y
Perc
enta
ge
Freq
uenc
y
Perc
enta
ge
Freq
uenc
y
Perc
enta
ge
Freq
uenc
y
Perc
enta
ge
Freq
uenc
y
Perc
enta
ge
A 381 30.80% 534 43.17% 263 21.26% 59 4.77% 1237 100.00% 18 1.43% 0 0.00%
B 116 9.43% 413 33.58% 519 42.20% 182 14.80% 1230 100.00% 25 1.99% 0 0.00%
C 93 7.57% 432 35.15% 501 40.76% 203 16.52% 1229 100.00% 26 2.07% 0 0.00%
D 344 27.85% 434 35.14% 311 25.18% 146 11.82% 1235 100.00% 20 1.59% 0 0.00%
0%
20%
40%
60%
80%
100%
Design A Design B Design C Design D
Design
Per
cent
age
Excellent
Good
Fair
Unsatisfactory
83

Appendix 3
84
Profile of Respondents Table 3.1.4 Age
Frequency Percentage (%)
Under 18 151 12.08
18 – 30 196 15.68
31 – 45 436 34.88
46 – 60 341 27.28
61 and over 126 10.08
Total 1250 100.00
99.60
Refuse to Answer 5 4.00
Grand Total 1255 100.00 Table 3.1.5 Gender
Frequency Percentage (%)
Male 764 60.88
Female 491 39.12
Total 1255 100.00
Table 3.1.6 Area of residence
Frequency Percentage (%)
HK Island 593 47.40
KLN 303 24.22
NT and Islands 344 27.50
Non-local residence 11 0.88
Total 1251 100.00
99.68
Refuse to answer 4 0.32
Grand Total 1255 100.00

Appendix 3
85
Second Exit Poll
Table 3.2.1 Visual attractiveness (N = 1171)
Design Excellent Good Fair Unsatisfactory Total Not Sure Refuse to Answer
Fr
eque
ncy
Perc
enta
ge
Freq
uenc
y
Perc
enta
ge
Freq
uenc
y
Perc
enta
ge
Freq
uenc
y
Perc
enta
ge
Freq
uenc
y
Perc
enta
ge
Freq
uenc
y
Perc
enta
ge
Freq
uenc
y
Perc
enta
ge
A 315 27.06% 540 46.39% 236 20.27% 73 6.27% 1164 100.00% 7 0.60% 0 0.00%
B 43 3.71% 257 22.19% 591 51.04% 267 23.06% 1158 100.00% 13 1.11% 0 0.00%
C 91 7.86% 405 34.97% 424 36.61% 238 20.55% 1158 100.00% 12 1.02% 1 0.09%
D 399 34.28% 432 37.11% 226 19.42% 107 9.19% 1164 100.00% 6 0.51% 1 0.09%
0%
20%
40%
60%
80%
100%
Design A Design B Design C Design D
Design
Per
cent
age
Excellent
Good
Fair
Unsatisfactory

Appendix 3
Table 3.2.2 Image befitting the Central Government Complex and the Legislative Council Complex (N = 1171)
Design Excellent Good Fair Unsatisfactory Total Not Sure Refuse to Answer
Freq
uenc
y
Perc
enta
ge
Freq
uenc
y
Perc
enta
ge
Freq
uenc
y
Perc
enta
ge
Freq
uenc
y
Perc
enta
ge
Freq
uenc
y
Perc
enta
ge
Freq
uenc
y
Perc
enta
ge
Freq
uenc
y
Perc
enta
ge
A 278 24.32% 487 42.61% 268 23.45% 110 9.62% 1143 100.00% 25 2.13% 3 0.26%
B 51 4.49% 263 23.15% 563 49.56% 259 22.80% 1136 100.00% 32 2.73% 3 0.26%
C 77 6.78% 325 28.61% 472 41.55% 262 23.06% 1136 100.00% 32 2.73% 3 0.26%
D 259 22.64% 470 41.08% 298 26.05% 117 10.23% 1144 100.00% 24 2.05% 3 0.26%
0%
20%
40%
60%
80%
100%
Design A Design B Design C Design D
Design
Perc
enta
ge
Excellent
Good
Fair
Unsatisfactory
86

Appendix 3
Table 3.2.3 Impact on cityscape and waterfront environment (N = 1171)
Design Excellent Good Fair Unsatisfactory Total Not Sure Refuse to Answer
Freq
uenc
y
Perc
enta
ge
Freq
uenc
y
Perc
enta
ge
Freq
uenc
y
Perc
enta
ge
Freq
uenc
y
Perc
enta
ge
Freq
uenc
y
Perc
enta
ge
Freq
uenc
y
Perc
enta
ge
Freq
uenc
y
Perc
enta
ge
A 306 26.66% 506 44.08% 262 22.82% 74 6.45% 1148 100.00% 18 1.54% 5 0.43%
B 93 8.16% 384 33.68% 485 42.54% 178 15.61% 1140 100.00% 25 2.13% 6 0.51%
C 92 8.07% 381 33.42% 438 38.42% 229 20.09% 1140 100.00% 27 2.31% 4 0.34%
D 308 26.78% 441 38.35% 270 23.48% 131 11.39% 1150 100.00% 18 1.54% 3 0.26%
0%
20%
40%
60%
80%
100%
Design A Design B Design C Design D
Design
Per
cent
age
Excellent
Good
Fair
Unsatisfactory
87
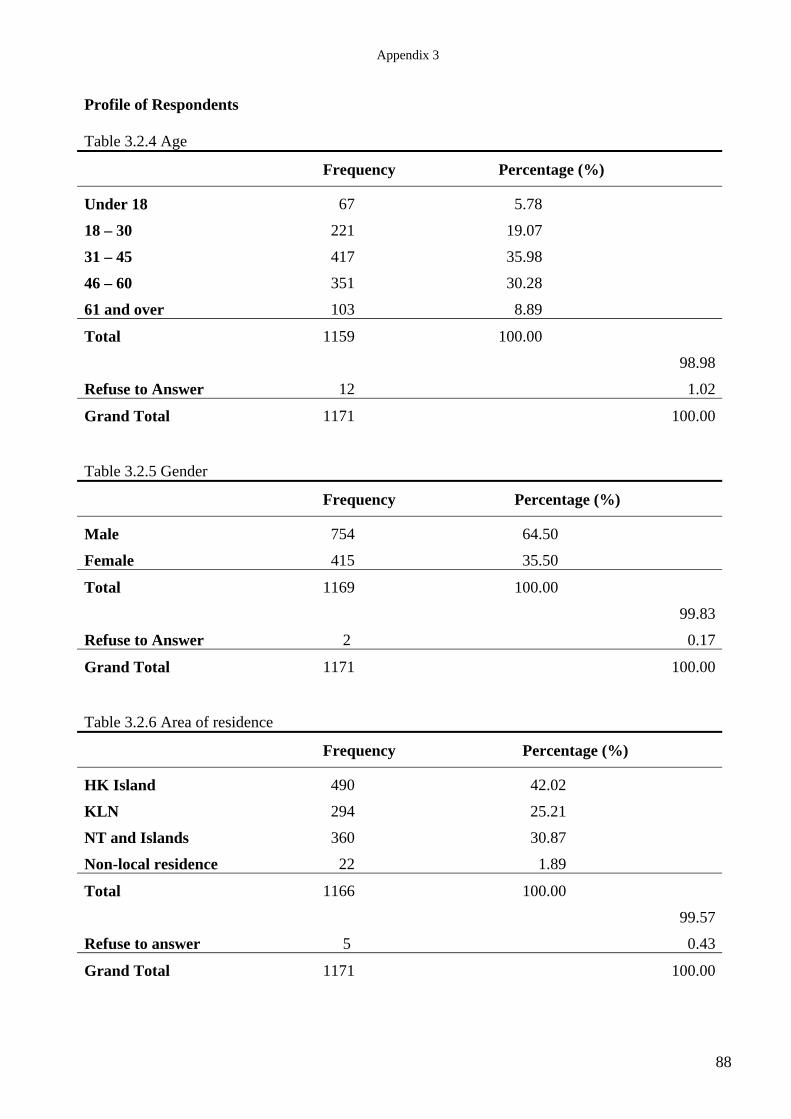
Appendix 3
88
Profile of Respondents Table 3.2.4 Age
Frequency Percentage (%)
Under 18 67 5.78
18 – 30 221 19.07
31 – 45 417 35.98
46 – 60 351 30.28
61 and over 103 8.89
Total 1159 100.00
98.98
Refuse to Answer 12 1.02
Grand Total 1171 100.00 Table 3.2.5 Gender
Frequency Percentage (%)
Male 754 64.50
Female 415 35.50
Total 1169 100.00
99.83
Refuse to Answer 2 0.17
Grand Total 1171 100.00 Table 3.2.6 Area of residence
Frequency Percentage (%)
HK Island 490 42.02
KLN 294 25.21
NT and Islands 360 30.87
Non-local residence 22 1.89
Total 1166 100.00
99.57
Refuse to answer 5 0.43
Grand Total 1171 100.00

Appendix 3
89
Third Exit Poll
Table 3.3.1 Visual attractiveness (N = 1889)
Design Excellent Good Fair Unsatisfactory Total Not Sure Refuse to Answer
Fr
eque
ncy
Perc
enta
ge
Freq
uenc
y
Perc
enta
ge
Freq
uenc
y
Perc
enta
ge
Freq
uenc
y
Perc
enta
ge
Freq
uenc
y
Perc
enta
ge
Freq
uenc
y
Perc
enta
ge
Freq
uenc
y
Perc
enta
ge
A 384 20.41% 786 41.79% 519 27.59% 192 10.21% 1881 100.00% 8 0.42% 0 0.00%
B 120 6.39% 465 24.76% 919 48.94% 374 19.91% 1878 100.00% 11 0.58% 0 0.00%
C 215 11.46% 626 33.37% 656 34.97% 379 20.20% 1876 100.00% 12 0.64% 1 0.05%
D 721 38.33% 641 34.08% 359 19.09% 160 8.51% 1881 100.00% 8 0.42% 0 0.00%
0%
20%
40%
60%
80%
100%
Design A Design B Design C Design D
Design
Perc
enta
ge
Excellent
Good
Fair
Unsatisfactory

Appendix 3
Table 3.3.2 Image befitting the Central Government Complex and the Legislative Council Complex (N = 1889)
Design Excellent Good Fair Unsatisfactory Total Not Sure Refuse to Answer
Freq
uenc
y
Perc
enta
ge
Freq
uenc
y
Perc
enta
ge
Freq
uenc
y
Perc
enta
ge
Freq
uenc
y
Perc
enta
ge
Freq
uenc
y
Perc
enta
ge
Freq
uenc
y
Perc
enta
ge
Freq
uenc
y
Perc
enta
ge
A 359 19.61% 675 36.87% 529 28.89% 268 14.64% 1831 100.00% 57 3.02% 1 0.05%
B 122 6.67% 493 26.94% 834 45.57% 381 20.82% 1830 100.00% 59 3.12% 0 0.00%
C 206 11.25% 542 29.60% 671 36.65% 412 22.50% 1831 100.00% 58 3.07% 0 0.00%
D 516 28.15% 657 35.84% 442 24.11% 218 11.89% 1833 100.00% 56 2.96% 0 0.00%
0%
20%
40%
60%
80%
100%
Design A Design B Design C Design D
Design
Per
cent
age
Excellent
Good
Fair
Unsatisfactory
90

Appendix 3
Table 3.3.3 Impact on cityscape and waterfront environment (N = 1889)
Design Excellent Good Fair Unsatisfactory Total Not Sure Refuse to Answer
Freq
uenc
y
Perc
enta
ge
Freq
uenc
y
Perc
enta
ge
Freq
uenc
y
Perc
enta
ge
Freq
uenc
y
Perc
enta
ge
Freq
uenc
y
Perc
enta
ge
Freq
uenc
y
Perc
enta
ge
Freq
uenc
y
Perc
enta
ge
A 427 22.98% 740 39.83% 495 26.64% 196 10.55% 1858 100.00% 29 1.54% 2 0.11%
B 172 9.29% 642 34.68% 767 41.44% 270 14.59% 1851 100.00% 34 1.80% 4 0.21%
C 198 10.72% 639 34.60% 681 36.87% 329 17.81% 1847 100.00% 40 2.12% 2 0.11%
D 606 32.69% 679 36.62% 389 20.98% 180 9.71% 1854 100.00% 31 1.64% 4 0.21%
0%
20%
40%
60%
80%
100%
Design A Design B Design C Design D
Design
Per
cent
age
Excellent
Good
Fair
Unsatisfactory
91

Appendix 3
92
Profile of Respondents Table 3.3.4 Age
Frequency Percentage (%)
Under 18 196 10.43
18 – 30 308 16.39
31 – 45 500 26.61
46 – 60 538 28.63
61 and over 337 17.94
Total 1879 100.00
99.47
Refuse to Answer 10 0.53
Grand Total 1889 100.00 Table 3.3.5 Gender
Frequency Percentage (%)
Male 1112 58.93
Female 775 41.07
Total 1887 100.00
99.89
Refuse to Answer 2 0.11
Grand Total 1889 100.00
Table 3.3.6 Area of residence
Frequency Percentage (%)
HK Island 273 15.14
KLN 809 44.87
NT and Islands 687 38.10
Non-local residence 34 1.89
Total 1803 100.00
95.45
Refuse to answer 86 4.55
Grand Total 1889 100.00

Appendix 3
93
Fourth Exit Poll
Table 3.4.1 Visual attractiveness (N = 997)
Design Excellent Good Fair Unsatisfactory Total Not Sure Refuse to Answer
Fr
eque
ncy
Perc
enta
ge
Freq
uenc
y
Perc
enta
ge
Freq
uenc
y
Perc
enta
ge
Freq
uenc
y
Perc
enta
ge
Freq
uenc
y
Perc
enta
ge
Freq
uenc
y
Perc
enta
ge
Freq
uenc
y
Perc
enta
ge
A 211 21.38% 400 40.53% 264 26.75% 112 11.35% 987 100.00% 10 1.00% 0 0.00%
B 102 10.34% 298 30.22% 419 42.49% 167 16.94% 986 100.00% 11 1.10% 0 0.00%
C 125 12.68% 368 37.32% 342 34.69% 151 15.31% 986 100.00% 11 1.10% 0 0.00%
D 400 40.53% 347 35.16% 163 16.51% 77 7.80% 987 100.00% 10 1.00% 0 0.00%
0%
20%
40%
60%
80%
100%
Design A Design B Design C Design D
Design
Perc
enta
ge
Excellent
Good
Fair
Unsatisfactory

Appendix 3
Table 3.4.2 Image befitting the Central Government Complex and the Legislative Council Complex (N = 997)
Design Excellent Good Fair Unsatisfactory Total Not Sure Refuse to Answer
Freq
uenc
y
Perc
enta
ge
Freq
uenc
y
Perc
enta
ge
Freq
uenc
y
Perc
enta
ge
Freq
uenc
y
Perc
enta
ge
Freq
uenc
y
Perc
enta
ge
Freq
uenc
y
Perc
enta
ge
Freq
uenc
y
Perc
enta
ge
A 191 19.94% 357 37.27% 279 29.12% 131 13.67% 958 100.00% 38 3.81% 1 0.10%
B 99 10.37% 268 28.06% 418 43.77% 170 17.80% 955 100.00% 41 4.11% 1 0.10%
C 122 12.75% 319 33.33% 341 35.63% 175 18.29% 957 100.00% 39 3.91% 1 0.10%
D 275 28.71% 374 39.04% 211 22.03% 98 10.23% 958 100.00% 38 3.81% 1 0.10%
0%
20%
40%
60%
80%
100%
Design A Design B Design C Design D
Design
Per
cent
age
Excellent
Good
Fair
Unsatisfactory
94

Appendix 3
Table 3.4.3 Impact on cityscape and waterfront environment (N = 997)
Design Excellent Good Fair Unsatisfactory Total Not Sure Refuse to Answer
Freq
uenc
y
Perc
enta
ge
Freq
uenc
y
Perc
enta
ge
Freq
uenc
y
Perc
enta
ge
Freq
uenc
y
Perc
enta
ge
Freq
uenc
y
Perc
enta
ge
Freq
uenc
y
Perc
enta
ge
Freq
uenc
y
Perc
enta
ge
A 213 21.89% 380 39.05% 264 27.13% 116 11.92% 973 100.00% 23 2.31% 1 0.10%
B 127 13.08% 356 36.66% 362 37.28% 126 12.98% 971 100.00% 25 2.51% 1 0.10%
C 105 10.79% 374 38.44% 326 33.50% 168 17.27% 973 100.00% 23 2.31% 1 0.10%
D 333 34.08% 344 35.21% 208 21.29% 92 9.42% 977 100.00% 19 1.91% 1 0.10%
0%
20%
40%
60%
80%
100%
Design A Design B Design C Design D
Design
Per
cent
age
Excellent
Good
Fair
Unsatisfactory
95

Appendix 3
96
Profile of Respondents Table 3.4.4 Age
Frequency Percentage (%)
Under 18 90 9.03
18 – 30 181 18.15
31 – 45 221 22.17
46 – 60 267 26.78
61 and over 238 23.87
Total 997 100.00
100.00
Refuse to Answer 0 0.00
Grand Total 997 100.00 Table 3.4.5 Gender
Frequency Percentage (%)
Male 537 53.97
Female 458 46.03
Total 995 100.00
99.80
Refuse to Answer 2 0.20
Grand Total 997 100.00
Table 3.4.6 Area of residence
Frequency Percentage (%)
HK Island 145 14.62
KLN 376 37.90
NT and Islands 387 39.01
Non-local residence 84 8.47
Total 992 100.00
99.50
Refuse to answer 5 0.50
Grand Total 997 100.00

Appendix 3
97
Combination of Results of the Four Exit Polls
Table 3.5.1 Visual attractiveness (N = 5312)
Design Excellent Good Fair Unsatisfactory Total Not Sure Refuse to Answer
Fr
eque
ncy
Perc
enta
ge
Freq
uenc
y
Perc
enta
ge
Freq
uenc
y
Perc
enta
ge
Freq
uenc
y
Perc
enta
ge
Freq
uenc
y
Perc
enta
ge
Freq
uenc
y
Perc
enta
ge
Freq
uenc
y
Perc
enta
ge
A 1314 24.87% 2266 42.88% 1277 24.17% 427 8.08% 5284 100.00% 28 0.53% 0 0.00%
B 309 5.87% 1311 24.91% 2530 48.06% 1114 21.16% 5264 100.00% 48 0.90% 0 0.00%
C 539 10.24% 1772 33.66% 1932 36.70% 1021 19.40% 5264 100.00% 45 0.85% 3 0.06%
D 1945 36.83% 1872 35.45% 998 18.90% 466 8.82% 5281 100.00% 29 0.55% 2 0.04%
0%
20%
40%
60%
80%
100%
Design A Design B Design C Design D
Design
Perc
enta
ge
Excellent
Good
Fair
Unsatisfactory

Appendix 3
Table 3.5.2 Image befitting the Central Government Complex and the Legislative Council Complex (N = 5312)
Design Excellent Good Fair Unsatisfactory Total Not Sure Refuse to Answer
Freq
uenc
y
Perc
enta
ge
Freq
uenc
y
Perc
enta
ge
Freq
uenc
y
Perc
enta
ge
Freq
uenc
y
Perc
enta
ge
Freq
uenc
y
Perc
enta
ge
Freq
uenc
y
Perc
enta
ge
Freq
uenc
y
Perc
enta
ge
A 1143 22.15% 2048 39.69% 1393 27.00% 576 11.16% 5160 100.00% 147 2.77% 5 0.09%
B 337 6.56% 1349 26.24% 2361 45.92% 1094 21.28% 5141 100.00% 167 3.14% 4 0.08%
C 506 9.83% 1543 29.97% 1976 38.38% 1124 21.83% 5149 100.00% 159 2.99% 4 0.08%
D 1350 26.13% 1968 38.10% 1268 24.55% 580 11.23% 5166 100.00% 142 2.67% 4 0.08%
0%
20%
40%
60%
80%
100%
Design A Design B Design C Design D
Design
Perc
enta
ge
Excellent
Good
Fair
Unsatisfactory
98

Appendix 3
Table 3.5.3 Impact on cityscape and waterfront environment (N = 5312)
Design Excellent Good Fair Unsatisfactory Total Not Sure Refuse to Answer
Freq
uenc
y
Perc
enta
ge
Freq
uenc
y
Perc
enta
ge
Freq
uenc
y
Perc
enta
ge
Freq
uenc
y
Perc
enta
ge
Freq
uenc
y
Perc
enta
ge
Freq
uenc
y
Perc
enta
ge
Freq
uenc
y
Perc
enta
ge
A 1327 25.44% 2160 41.41% 1284 24.62% 445 8.53% 5216 100.00% 88 1.66% 8 0.15%
B 508 9.78% 1795 34.57% 2133 41.08% 756 14.56% 5192 100.00% 109 2.05% 11 0.21%
C 488 9.40% 1826 35.19% 1946 37.50% 929 17.90% 5189 100.00% 116 2.18% 7 0.13%
D 1591 30.50% 1898 36.39% 1178 22.58% 549 10.53% 5216 100.00% 88 1.66% 8 0.15%
0%
20%
40%
60%
80%
100%
Design A Design B Design C Design D
Design
Per
cent
age
Excellent
Good
Fair
Unsatisfactory
99

Appendix 3
100
Profile of Respondents Table 3.5.4 Age
Frequency Percentage (%)
Under 18 504 9.54
18 – 30 906 17.14
31 – 45 1574 29.78
46 – 60 1497 28.33
61 and over 804 15.21
Total 5285 100.00
99.49
Refuse to Answer 27 0.51
Grand Total 5312 100.00 Table 3.5.5 Gender
Frequency Percentage (%)
Male 3167 59.69
Female 2139 40.31
Total 5306 100.00
99.89
Refuse to Answer 6 0.11
Grand Total 5312 100.00
Table 3.5.6 Area of residence
Frequency Percentage (%)
HK Island 1501 28.80
KLN 1782 34.19
NT and Islands 1778 34.11
Non-local residence 151 2.90
Total 5212 100.00
98.12
Refuse to answer 100 1.88
Grand Total 5312 100.00

Appendix 4
Appendix 4
Telephone Poll Results
101

Appendix 4
First Telephone Poll Knowledge about the “Design Proposals for the Tamar Development Project” Table 4.1.1 [v4] Do you know that the Government is holding a public exhibition of “Design Proposals for the Tamar Development Project”?
Frequency Percentage Yes 616 40.74 No/Never heard about it 888 58.73 Don't remember/No opinion 8 0.53 Total 1512 100.00
Yes40.74%
No/Never heard about it
58.73%
Don't remember/No
opinion0.53% Yes
No/Never heardabout it
Don't remember/Noopinion
Table 4.1.2 [v5] (If answered “yes” in v4) Do you know how many design proposals in total?
Frequency Percentage One 2 0.33 Two 7 1.14 Three 118 19.19 Four or above 160 26.02 Don't know/No opinion 328 53.33 Total 615 100.00 99.84 Refuse to answer 1 0.16 Grand Total 616 100.00
Three19.19%
Four or above26.02%
Don't know/No opinion53.33%
Two1.14%
One0.33% One
Two
Three
Four or above
Don't know/Noopinion
102

Appendix 4
Table 4.1.3 [v6] (If answered “yes” in v4) How do you know about the exhibition of “Design Proposals for the Tamar Development Project”? (Interviewers: Please do not read out the answers, respondent can choose more than one answer; please prompt: any other channel?)
Frequency Percentage Visit the exhibition 5 0.70 Internet 24 3.35 News Report 534 74.58 Commentary 87 12.15 Heard from family members/relatives/friends/schoolmates/colleagues 33 4.61 Others 33 4.61 Total 716 100.00 No. of Respondents 604 98.05 Not sure/Don’t remember 10 1.62 Refuse to answer 2 0.32 Grand Total 616 100.00
0
100
200
300
400
500
600
Visi
t the
exh
ibiti
on
Inte
rnet
New
s Rep
ort
Com
men
tary
Hea
rd fr
om fa
mily
mem
bers
/rela
tives
/frie
nds/s
choo
lmat
es/c
olle
ague
s
Oth
ers
Freq
uenc
y
103

Appendix 4
Preferred Design Table 4.1.4 [v7] In terms of “visual attractiveness”, which design(s) do you think is/are comparatively better in the four design proposals? (Interviewers: respondent can choose more than one answer; please prompt: any other design?)
Frequency Percentage Design A 36 22.22 Design B 35 21.60 Design C 29 17.90 Design D 62 38.27 Total 162 100.00 No. of respondents 138 22.40 Not sure/Don’t remember 477 77.44 Refuse to answer 1 0.16 Grand Total 616 100.00
0
10
20
30
40
50
60
70
Design A Design B Design C Design D
Freq
uenc
y
Table 4.1.5 [v8] In terms of “image befitting the Central Government Complex and the Legislative Council Complex”, which design(s) do you think is/are comparatively better in the four design proposals? (Interviewers: respondent can choose more than one answer; please prompt: any other design?)
Frequency Percentage Design A 48 36.36 Design B 32 24.24 Design C 22 16.67 Design D 30 22.73 Total 132 100.00 No. of respondents 121 19.64 Not sure/Don’t remember 493 80.03 Refuse to answer 2 0.32 Grand Total 616 100.00
104
0
10
20
30
40
50
60
70
Design A Design B Design C Design D
Freq
uenc
y

Appendix 4
Table 4.1.6 [v9] In terms of “impact on cityscape and waterfront environment”, which design(s) do you think is/are comparatively better in the four design proposals? (Interviewers: respondent can choose more than one answer; please prompt: any other design?)
Frequency Percentage Design A 36 22.78 Design B 42 26.58 Design C 24 15.19 Design D 56 35.44 Total 158 100.00 No. of respondents 137 22.24 Not sure/Don’t remember 477 77.44 Refuse to answer 2 0.32 Grand Total 616 100.00
0
10
20
30
40
50
60
70
Design A Design B Design C Design D
Freq
uenc
y
Table 4.1.7 [v10] Overall speaking, which design(s) do you think is/are comparatively better in the four design proposals? (Interviewers: respondent can choose more than one answer; please prompt: any other design?)
Frequency Percentage Design A 56 29.32 Design B 38 19.90 Design C 36 18.85 Design D 61 31.94 Total 191 100.00 No. of respondents 168 27.27 Not sure/Don’t remember 447 72.56 Refuse to answer 1 0.16 Grand Total 616 100.00
0
10
20
30
40
50
60
70
Design A Design B Design C Design D
Freq
uenc
y
105

Appendix 4
Table 4.1.8 [v11] Would you please tell me the reason(s) why you select this/these design proposal(s)?
Frequency Percentage Respondents who gave a reason 141 22.89 No particular reason, by personal feeling or impression 35 5.68 Cannot remember other design proposals 131 21.27 Have not seen the designs 309 50.16 Total 616 100.00
Cannot remember other design
proposals21.27%
Have not seen the designs50.16%
Respondents who gave a reason
22.89%
No particular reason, by
personal feeling or impression
5.68%
106

Appendix 4
Public Exhibition Table 4.1.9 [v12] Have you seen all the showpieces in the public exhibition, including 18 exhibition boards, introductory videos, and design models?
Frequency Percentage Yes, I have seen all the show pieces 10 1.66 No, just some of the showpieces 44 7.31 No, I have never seen any showpiece before 548 91.03 Total 602 100.00 97.73 Not sure/Don’t remember 14 2.27 Refuse to answer 0 0.00 Grand Total 616 100.00
No, I have never seen any
showpiece before91.03%
Yes, I have seen all the show
pieces1.66%
No, just some of the showpieces
7.31% Yes, I haveseen all theshow pieces
No, just someof theshowpieces
No, I havenever seen anyshowpiecebefore
107

Appendix 4
Table 4.1.10 [v13] Are you satisfied or dissatisfied with the public exhibition of “Design Proposals for the Tamar Development Project”?
Frequency Percentage Very satisfactory 21 6.52 Satisfactory 164 50.93 Neither satisfied nor dissatisfied 104 32.30 Unsatisfactory 24 7.45 Very unsatisfactory 9 2.80 Total 322 100.00 52.27 Not sure/Don’t remember 290 47.08 Refuse to answer 4 0.65 Grand Total 616 100.00
Neither satisfied nor dissatisfied
32.30%
Unsatisfactory7.45%
Very unsatisfactory
2.80%
Very satisfactory6.52%
Satisfactory50.93%
Verysatisfactory
Satisfactory
Neither satisfiednor dissatisfied
Unsatisfactory
Veryunsatisfactory
108

Appendix 4
109
Profile of Respondents Including all respondents (n=1512) Table 4.1.11 [v15] Gender of the respondent
Frequency Percentage Male 644 42.59 Female 868 57.41 Total 1512 100.00 100.00 Refuse to answer 0 0.00 Grand Total 1512 100.00
Table 4.1.12 [v16] What is your age?
Frequency Percentage 18-30 345 22.95 31-45 438 29.14 46-60 423 28.14 61 or above 297 19.76 Total 1503 100.00 99.40 Refuse to answer 9 0.60 Grand Total 1512 100.00
Table 4.1.13 [v17] In which area are you living?
Frequency Percentage Hong Kong Island 291 19.39 Kowloon 504 33.58 NT and Islands 701 46.70 Non-local resident 5 0.33 Total 1501 100.00 99.27 Refuse to answer 11 0.73 Grand Total 1512 100.00
Table 4.1.14 [v18] Are you currently working or non-working?
Frequency Percentage Yes 753 49.80 No 759 50.20 Total 1512 100.00 100.00 Refuse to answer 0 0.00 Grand Total 1512 100.00

Appendix 4
110
Including respondents who are not working. (n=759) Table 4.1.15 [v19] Are you a…?
Frequency Percentage Student 140 18.49 Housekeeper 252 33.29 Retired 300 39.63 Unemployed 61 8.06 Others 4 0.53 Total 757 100.00 99.74 Refuse to answer 2 0.26 Grand Total 759 100.00
Including respondents who are working. (n=753) Table 4.1.16 [v20] What is your current position?
Frequency Percentage Managers and Administrators 103 14.19 Professionals 93 12.81 Associate Professionals 87 11.98 Clerks 171 23.55 Service and Shop Sales Workers 121 16.67 Craft and Related Workers 53 7.30 Plant and Machine Operators and Assemblers 36 4.96 Elementary Occupations 62 8.54 Total 726 100.00 96.41 Refuse to answer 27 3.59 Grand Total 753 100.00

Appendix 4
111
Second Telephone Poll Knowledge about the “Design Proposals for the Tamar Development Project” Table 4.2.1 [v4] Do you know that the Government is holding a public exhibition of “Design Proposals for the Tamar Development Project”?
Frequency Percentage Yes 640 41.50 No/Never heard about it 888 57.59 Don't remember/No opinion 14 0.91 Total 1542 100.00
Yes41.50%
No/Never heard about it
57.59%
Don't remember/No
opinion0.91%
Yes
No/Never heardabout it
Don'tremember/Noopinion
Table 4.2.2 [v5] (If answered “yes” in v4) Do you know how many design proposals in total?
Frequency Percentage One 3 0.47 Two 12 1.88 Three 111 17.34 Four 111 17.34 Five or above 11 1.72 Don't know/No opinion 392 61.25 Total 640 100.00 100.00 Refuse to answer 0 0.00 Grand Total 640 100.00
Three17.34%
Four17.34%
Five or above1.72%
Don't know/No opinion61.25%
Two1.88%
One0.47%
One
Two
Three
Four
Five or above
Don't know/Noopinion

Appendix 4
Table 4.2.3 [v6] (If answered “yes” in v4) How do you know about the exhibition of “Design Proposals for the Tamar Development Project”? (Interviewers: Please do not read out the answers, respondent can choose more than one answer; please prompt: any other channel?)
Frequency Percentage Visit the exhibition 8 1.10 Internet 17 2.34 News Report 566 77.75 Commentary 82 11.26 Heard from family members/relatives/friends/schoolmates/colleagues 26 3.57 Others 29 3.98 Total 728 100.00 No. of Respondents 629 98.28 Not sure/Don’t remember 11 1.72 Refuse to answer 0 0.00 Grand Total 640 100.00
0
100
200
300
400
500
600
Visi
t the
exh
ibiti
on
Inte
rnet
New
s Rep
ort
Com
men
tary
Hea
rd fr
om fa
mily
mem
bers
/rela
tives
/frie
nds/s
choo
lmat
es/c
olle
ague
s
Oth
ers
Freq
uenc
y
112

Appendix 4
Preferred Design Table 4.2.4 [v7] In terms of “visual attractiveness”, which design(s) do you think is/are comparatively better in the four design proposals? (Interviewers: respondent can choose more than one answer; please prompt: any other design?)
Frequency Percentage Design A 30 15.96 Design B 39 20.74 Design C 53 28.19 Design D 66 35.11 Total 188 100.00 No. of respondents 178 27.81 Not sure/Don’t remember 456 71.25 Refuse to answer 6 0.94 Grand Total 640 100.00
0
10
20
30
40
50
60
70
Design A Design B Design C Design D
Freq
uenc
y
Table 4.2.5 [v8] In terms of “image befitting the Central Government Complex and the Legislative Council Complex”, which design(s) do you think is/are comparatively better in the four design proposals? (Interviewers: respondent can choose more than one answer; please prompt: any other design?)
Frequency Percentage Design A 37 18.88 Design B 52 26.53 Design C 61 31.12 Design D 46 23.47 Total 196 100.00 No. of respondents 183 28.59 Not sure/Don’t remember 453 70.78 Refuse to answer 4 0.63 Grand Total 640 100.00
113
0
10
20
30
40
50
60
70
Design A Design B Design C Design D
Freq
uenc
y

Appendix 4
Table 4.2.6 [v9] In terms of “impact on cityscape and waterfront environment”, which design(s) do you think is/are comparatively better in the four design proposals? (Interviewers: respondent can choose more than one answer; please prompt: any other design?)
Frequency Percentage Design A 28 14.36 Design B 50 25.64 Design C 56 28.72 Design D 61 31.28 Total 195 100.00 No. of respondents 185 28.91 Not sure/Don’t remember 449 70.16 Refuse to answer 6 0.94 Grand Total 640 100.00
0
10
20
30
40
50
60
70
Design A Design B Design C Design D
Freq
uenc
y
Table 4.2.7 [v10] Overall speaking, which design(s) do you think is/are comparatively better in the four design proposals? (Interviewers: respondent can choose more than one answer; please prompt: any other design?)
Frequency Percentage Design A 23 12.92 Design B 50 28.09 Design C 43 24.16 Design D 62 34.83 Total 178 100.00 No. of respondents 168 26.25 Not sure/Don’t remember 468 73.13 Refuse to answer 4 0.63 Grand Total 640 100.00
0
10
20
30
40
50
60
70
Design A Design B Design C Design D
Freq
uenc
y
114

Appendix 4
Table 4.2.8 [v11] Would you please tell me the reason(s) why you select this/these design proposal(s)?
Frequency Percentage Respondents who gave a reason 249 38.91 No particular reason, by personal feeling or impression 62 9.69 Cannot remember other design proposals 125 19.53 Have not seen the designs 204 31.88 Total 640 100.00
Cannot remember other design
proposals19.53%
Have not seen the designs31.88%
Respondents who gave a reason
38.91%
No particular reason, by
personal feeling or impression
9.69%
115

Appendix 4
Public Exhibition Table 4.2.9 [v12] Have you seen all the showpieces in the public exhibition, including 18 exhibition boards, introductory videos, and design models?
Frequency Percentage Yes, I have seen all the show pieces 9 1.44 No, just some of the showpieces 53 8.49 No, I have never seen any showpiece before 562 90.06 Total 624 100.00 97.50 Not sure/Don’t remember 14 2.19 Refuse to answer 2 0.31 Grand Total 640 100.00
No, I have never seen any
showpiece before90.06%
Yes, I have seen all the show
pieces1.44%
No, just some of the showpieces
8.49%Yes, I haveseen all theshow pieces
No, just someof theshowpieces
No, I havenever seen anyshowpiecebefore
116

Appendix 4
Table 4.2.10 [v13] Are you satisfied or dissatisfied with the public exhibition of “Design Proposals for the Tamar Development Project”?
Frequency Percentage Very satisfactory 23 5.58 Satisfactory 192 46.60 Neither satisfied nor dissatisfied 145 35.19 Unsatisfactory 42 10.19 Very unsatisfactory 10 2.43 Total 412 100.00 64.38 Not sure/Don’t remember 224 35.00 Refuse to answer 4 0.63 Grand Total 640 100.00
Neither satisfied nor dissatisfied
35.19%
Unsatisfactory10.19%
Very unsatisfactory
2.43%
Very satisfactory5.58%
Satisfactory46.60%
Verysatisfactory
Satisfactory
Neither satisfiednor dissatisfied
Unsatisfactory
Veryunsatisfactory
117

Appendix 4
118
Profile of Respondents Including all respondents (n=1542) Table 4.2.11 [v15] Gender of the respondent
Frequency Percentage Male 590 38.26 Female 952 61.74 Total 1542 100.00 100.00 Refuse to answer 0 0.00 Grand Total 1542 100.00
Table 4.2.12 [v16] What is your age?
Frequency Percentage 18-30 365 23.92 31-45 394 25.82 46-60 441 28.90 61 or above 326 21.36 Total 1526 100.00 98.96 Refuse to answer 16 1.04 Grand Total 1542 100.00
Table 4.2.13 [v17] In which area are you living?
Frequency Percentage Hong Kong Island 287 18.71 Kowloon 496 32.33 NT and Islands 747 48.70 Non-local resident 4 0.26 Total 1534 100.00 99.48 Refuse to answer 8 0.52 Grand Total 1542 100.00
Table 4.2.14 [v18] Are you currently working or non-working?
Frequency Percentage Yes 649 42.09 No 893 57.91 Total 1542 100.00 100.00 Refuse to answer 0 0.00 Grand Total 1542 100.00

Appendix 4
119
Including respondents who are not working (n=893) Table 4.2.15 [v19] Are you a…?
Frequency Percentage Student 139 15.60 Housekeeper 362 40.63 Retired 319 35.80 Unemployed 69 7.74 Others 2 0.22 Total 891 100.00 99.78 Refuse to answer 2 0.22 Grand Total 893 100.00
Including respondents who are working (n=649) Table 4.2.16 [v20] What is your current position?
Frequency PercentageManagers and Administrators 91 14.75Professionals 69 11.18Associate Professionals 72 11.67Clerks 158 25.61Service and Shop Sales Workers 98 15.88Agriculture, Animal Husbandry and Forestry Workers and Fishermen 1 0.16Craft and Realted Workers 56 9.08Plant and Machine Operators and Assemblers 21 3.40Elementary Occupations 51 8.27Total 617 100.00 95.07Refuse to answer 32 4.93Grand Total 649 100.00

Appendix 5
120
Appendix 5
Frequency Counts of Comments from Comment
Cards & Written Submissions

Appendix 5
121
Table 5.1: Frequency Count of Qualitative Data
E-Comment CardsComment Cards received at the
Exhibition Venue
Written Submissions Phone Polls Total
Visual attractiveness 2559 8005 45 147 10756
Green features and environmental friendliness 796 2253 30 47 3126
Overall preferences 844 1559 18 3 2424
Public open space 475 1230 44 36 1785
Comments on certain unique features 285 1162 6 10 1463
Image befitting the Central Government Complex and the Legislative Council Complex
485 942 10 5 1442
Symbol of Hong Kong as Asia's world city 452 879 5 36 1372
Impact on cityscape and waterfront environment 307 649 13 12 981
Other overall comments 151 435 18 31 635
Public consultation process 42 142 10 147 341
Cost factor 94 198 7 2 301
Connectivity of the Tamar site and surrounding areas
79 207 8 1 295
Feng Shui concerns 28 86 1 1 116

Appendix 5
122
Freq
uenc
y
Perc
enta
ge
Freq
uenc
y
Perc
enta
ge
Freq
uenc
y
Perc
enta
ge
Freq
uenc
y
Perc
enta
ge
Freq
uenc
y
Perc
enta
ge
Freq
uenc
y
Perc
enta
ge
Freq
uenc
y
Perc
enta
ge
1. Visual attractiveness 10756 100.00%positive 1458 13.56% 341 3.17% 578 5.37% 1238 11.51% 18 0.17% 3633 33.78%
negative 1267 11.78% 2252 20.94% 1714 15.94% 1150 10.69% 40 0.37% 6423 59.72%other comment 153 1.42% 139 1.29% 136 1.26% 106 0.99% 128 1.19% 662 6.15%
Others 38 0.35%2. Green features and environmentalfriendliness 3126 100.00%
positive 559 17.88% 390 12.48% 265 8.48% 145 4.64% 17 0.54% 1376 44.02% negative 189 6.05% 313 10.01% 192 6.14% 439 14.04% 51 1.63% 1184 37.88%
other comment 110 3.52% 52 1.66% 49 1.57% 102 3.26% 243 7.77% 556 17.79%Others 10 0.32%
3. Overall preference 2424 100.00%positive 587 24.22% 182 7.51% 228 9.41% 697 28.75% 6 0.25% 1700 70.13%
negative 79 3.26% 173 7.14% 159 6.56% 97 4.00% 1 0.04% 509 21.00%other comment 40 1.65% 56 2.31% 59 2.43% 35 1.44% 4 0.17% 194 8.00%
4. Public
5. Commfeatures
6. Image bGovernmeCom
Table 5.2 Four Designs Ranking by Comments
p
Others 21 0.87% open space 1785 100.00%
positive 171 9.58% 192 10.76% 68 3.81% 242 13.56% 16 0.90% 689 38.60% negative 150 8.40% 116 6.50% 90 5.04% 159 8.91% 34 1.90% 549 30.76%
other comment 91 5.10% 34 1.90% 33 1.85% 63 3.53% 247 13.84% 468 26.22%Others 79 4.43%
ents on certain unique 1463 100.00%
positive 101 6.90% 25 1.71% 65 4.44% 225 15.38% 1 0.07% 417 28.50% negative 124 8.48% 50 3.42% 232 15.86% 339 23.17% 10 0.68% 755 51.61%
other comment 65 4.44% 14 0.96% 56 3.83% 102 6.97% 46 3.14% 283 19.34%Others 8 0.55%
efitting the Centralnt Complex and the LegCo
lex
7. Symbworld cit
1442 100.00%
positive 192 13.31% 116 8.04% 46 3.19% 72 4.99% 5 0.35% 431 29.89% negative 162 11.23% 207 14.36% 291 20.18% 228 15.81% 19 1.32% 907 62.90%
other comment 12 0.83% 7 0.49% 3 0.21% 6 0.42% 67 4.65% 95 6.59%Others 9 0.62%
ol of Hong Kong as Asia'sy 1372 100.00%
positive 142 10.35% 26 1.90% 64 4.66% 622 45.34% 11 0.80% 865 63.05% negative 109 7.94% 131 9.55% 88 6.41% 108 7.87% 15 1.09% 451 32.87%
other comment 3 0.22% 4 0.29% 2 0.15% 3 0.22% 37 2.70% 49 3.57%Others 7 0.51%
n cityscape and waterfrontnt 981 100.00%
positive 122 12.44% 84 8.56% 60 6.12% 92 9.38% 2 0.20% 360 36.70% negative 97 9.89% 33 3.36% 155 15.80% 260 26.50% 2 0.20% 547 55.76%
other comment 10 1.02% 3 0.31% 3 0.31% 4 0.41% 47 4.79% 67 6.83%Others 7 0.71%
overall comments 635 100.00%Total 635 100.00%
ic consultation process 341 100.00%
Total 341 100.00%actor 301 100.00%
positive 4 1.33% 20 6.64% 4 1.33% 4 1.33% 3 1.00% 35 11.63% negative 65 21.59% 14 4.65% 32 10.63% 41 13.62% 5 1.66% 157 52.16%
other comment 28 9.30% 0 0.00% 5 1.66% 8 2.66% 66 21.93% 107 35.55%Others 2 0.66%
ectivity of the Tamar site andg areas 295 100.00%
positive 67 22.71% 11 3.73% 13 4.41% 21 7.12% 1 0.34% 113 38.31% negative 16 5.42% 18 6.10% 17 5.76% 36 12.20% 6 2.03% 93 31.53%
other comment 19 6.44% 2 0.68% 5 1.69% 9 3.05% 53 17.97% 88 29.83%Others 1 0.34%
i concerns 116 100.00%positive 3 2.59% 11 9.48% 2 1.72% 8 6.90% 0 0.00% 24 20.69%
negative 38 32.76% 10 8.62% 15 12.93% 9 7.76% 1 0.86% 73 62.93%other comment 3 2.59% 6 5.17% 0 0.00% 2 1.72% 8 6.90% 19 16.38%
Others 0 0.00%
8. Impact oenvironme
9. Other
10. Publ
11. Cost f
12. Connsurroundin
13. Feng Shu
A B CAll Comment Cards
D General Total Grand Total

Appendix 5
123
Table 5.3 Visual attractiveness Comments (from all sources) A B C D General Total Grand Total
Freq
uenc
y
Perc
enta
ge
Freq
uenc
y
Perc
enta
ge
Freq
uenc
y
Perc
enta
ge
Freq
uenc
y
Perc
enta
ge
Freq
uenc
y
Perc
enta
ge
Freq
uenc
y
Perc
enta
ge
Freq
uenc
y
Perc
enta
ge
1. Visual attractiveness 10756 100.00% 1.1 Design aesthetics 4572 42.51%
positive 793 17.34% 180 3.94% 289 6.32% 667 14.59% 12 0.26% 1941 42.45% negative 382 8.36% 686 15.00% 808 17.67% 330 7.22% 7 0.15% 2213 48.40%
other comment 109 2.38% 106 2.32% 100 2.19% 65 1.42% 38 0.83% 418 9.14% 1.2 Scale and proportion 1423 13.23%
positive 63 4.43% 32 2.25% 15 1.05% 33 2.32% 1 0.07% 144 10.12% negative 107 7.52% 153 10.75% 478 33.59% 453 31.83% 9 0.63% 1200 84.33%
other comment 12 0.84% 11 0.77% 13 0.91% 22 1.55% 21 1.48% 79 5.55% 1.3 Iconic landmark 2130 19.80%
positive 243 11.41% 15 0.70% 70 3.29% 272 12.77% 2 0.09% 602 28.26% negative 96 4.51% 1044 49.01% 221 10.38% 95 4.46% 13 0.61% 1469 68.97%
other comment 6 0.28% 11 0.52% 8 0.38% 8 0.38% 26 1.22% 59 2.77% 1.4 Relationship between attractiveness and functionality 543 5.05%
positive 66 12.15% 91 16.76% 41 7.55% 40 7.37% 1 0.18% 239 44.01% negative 110 20.26% 53 9.76% 45 8.29% 48 8.84% 3 0.55% 259 47.70%
other comment 6 1.10% 9 1.66% 5 0.92% 2 0.37% 23 4.24% 45 8.29% 1.5 Originality and copy cat concerns 1558 14.48%
positive 134 8.60% 14 0.90% 70 4.49% 141 9.05% 0 0.00% 359 23.04% negative 558 35.82% 266 17.07% 140 8.99% 183 11.75% 8 0.51% 1155 74.13%
other comment 18 1.16% 1 0.06% 7 0.45% 4 0.26% 14 0.90% 44 2.82% 1.6 Avant-garde and post modern feel 492 4.57%
positive 159 32.32% 9 1.83% 93 18.90% 85 17.28% 2 0.41% 348 70.73% negative 14 2.85% 50 10.16% 22 4.47% 41 8.33% 0 0.00% 127 25.81%
other comment 2 0.41% 1 0.20% 3 0.61% 5 1.02% 6 1.22% 17 3.46% 1.7 Others 7 18.42% 9 23.68% 10 26.32% 7 18.42% 5 13.16% 38 100.00% 38 0.35%

Appendix 5
Table 5.4 Symbol of Hong Kong as Asia’s world city Comments (from all sources) A B C D General Total Grand Total
Freq
uenc
y
Perc
enta
ge
Freq
uenc
y
Perc
enta
ge
Freq
uenc
y
Perc
enta
ge
Freq
uenc
y
Perc
enta
ge
Freq
uenc
y
Perc
enta
ge
Freq
uenc
y
Perc
enta
ge
Freq
uenc
y
Perc
enta
ge
2. Symbol of HK as Asia’s world city 1372 100.00%
2.1 Reflection on Hong Kong as a cosmopolitan, dynamic and contemporary city
746 54.37%
positive 98 13.14% 5 0.67% 34 4.56% 410 54.96% 2 0.27% 549 73.59% negative 20 2.68% 61 8.18% 27 3.62% 66 8.85% 5 0.67% 179 23.99%
other comment 0 0.00% 3 0.40% 0 0.00% 2 0.27% 13 1.74% 18 2.41% 2.2 Identity of Hong Kong’s uniqueness and its history 559 40.74%
positive 36 6.44% 15 2.68% 27 4.83% 207 37.03% 7 1.25% 292 52.24% negative 81 14.49% 65 11.63% 50 8.94% 34 6.08% 10 1.79% 240 42.93%
other comment 3 0.54% 1 0.18% 2 0.36% 1 0.18% 20 3.58% 27 4.83% 2.3 Test of time 60 4.37%
positive 8 13.33% 6 10.00% 3 5.00% 5 8.33% 2 3.33% 24 40.00% negative 8 13.33% 5 8.33% 11 18.33% 8 13.33% 0 0.00% 32 53.33%
other comment 0 0.00% 0 0.00% 0 0.00% 0 0.00% 4 6.67% 4 6.67% 2.4 Others 1 14.29% 2 28.57% 0 0.00% 3 42.86% 1 14.29% 7 100.00% 7 0.51%
124

Appendix 5
Table 5.5 Image befitting the Central Government Complex and the Legislative Council Complex Comments (from all sources) A B C D General Total Grand Total
Freq
uenc
y
Perc
enta
ge
Freq
uenc
y
Perc
enta
ge
Freq
uenc
y
Perc
enta
ge
Freq
uenc
y
Perc
enta
ge
Freq
uenc
y
Perc
enta
ge
Freq
uenc
y
Perc
enta
ge
Freq
uenc
y
Perc
enta
ge
3. Image befitting the Central Government Complex and the Legislative Council Complex
1442 100.00%
3.1 Reflection on the distinct identities and roles of the Government headquarters
994 68.93%
positive 127 12.78% 77 7.75% 30 3.02% 43 4.33% 1 0.10% 278 27.97% negative 96 9.66% 150 15.09% 234 23.54% 151 15.19% 14 1.41% 645 64.89%
other comment 8 0.80% 5 0.50% 3 0.30% 2 0.20% 53 5.33% 71 7.14% 3.2 Reflection on the distinct identities and roles of LegCo 248 17.20%
positive 31 12.50% 30 12.10% 12 4.84% 19 7.66% 1 0.40% 93 37.50% negative 36 14.52% 24 9.68% 27 10.89% 43 17.34% 4 1.61% 134 54.03%
other comment 3 1.21% 1 0.40% 0 0.00% 4 1.61% 13 5.24% 21 8.47% 3.3 Harmony and integration of CGC and LegCo Complex 191 13.25%
positive 34 17.80% 9 4.71% 4 2.09% 10 5.24% 3 1.57% 60 31.41% negative 30 15.71% 33 17.28% 30 15.71% 34 17.80% 1 0.52% 128 67.02%
other comment 1 0.52% 1 0.52% 0 0.00% 0 0.00% 1 0.52% 3 1.57%
3.4 Others 2 22.22% 3 33.33% 2 22.22% 1 11.11% 1 11.11% 9 100.00% 9 0.62%
125

Appendix 5
Table 5.6 Impact on cityscape and waterfront environment Comments (from all sources) A B C D General Total Grand Total
Freq
uenc
y
Perc
enta
ge
Freq
uenc
y
Perc
enta
ge
Freq
uenc
y
Perc
enta
ge
Freq
uenc
y
Perc
enta
ge
Freq
uenc
y
Perc
enta
ge
Freq
uenc
y
Perc
enta
ge
Freq
uenc
y
Perc
enta
ge
4. Impact on cityscape and waterfront environment 981 100.00%
4.1 Visual impact of the project in relation to the ridgeline 62 6.32%
positive 5 8.06% 9 14.52% 8 12.90% 6 9.68% 0 0.00% 28 45.16% negative 4 6.45% 2 3.23% 8 12.90% 7 11.29% 0 0.00% 21 33.87%
other comment 1 1.61% 0 0.00% 1 1.61% 0 0.00% 11 17.74% 13 20.97%
4.2 Impact on the cityscape and neighbouring buildings 736 75.03%
positive 106 14.40% 66 8.97% 43 5.84% 57 7.74% 2 0.27% 274 37.23% negative 81 11.01% 23 3.13% 114 15.49% 209 28.40% 2 0.27% 429 58.29%
other comment 6 0.82% 2 0.27% 0 0.00% 2 0.27% 23 3.13% 33 4.48% 4.3 Impact on waterfront environment 176 17.94%
positive 11 6.25% 9 5.11% 9 5.11% 29 16.48% 0 0.00% 58 32.95% negative 12 6.82% 8 4.55% 33 18.75% 44 25.00% 0 0.00% 97 55.11%
other comment 3 1.70% 1 0.57% 2 1.14% 2 1.14% 13 7.39% 21 11.93%
4.4 Others 2 28.57% 3 42.86% 0 0.00% 2 28.57% 0 0.00% 7 100.00% 7 0.71%
126

Appendix 5
Table 5.7 Green features and environment friendliness Comments (from all sources) A B C D General Total Grand Total
Freq
uenc
y
Perc
enta
ge
Freq
uenc
y
Perc
enta
ge
Freq
uenc
y
Perc
enta
ge
Freq
uenc
y
Perc
enta
ge
Freq
uenc
y
Perc
enta
ge
Freq
uenc
y
Perc
enta
ge
Freq
uenc
y
Perc
enta
ge
5. Green features and environmental friendliness 3126 100.00%
5.1 Proposed energy conservation measures 296 9.47%
positive 44 14.86% 18 6.08% 53 17.91% 10 3.38% 2 0.68% 127 42.91% negative 13 4.39% 8 2.70% 25 8.45% 23 7.77% 9 3.04% 78 26.35%
other comment 8 2.70% 5 1.69% 11 3.72% 20 6.76% 47 15.88% 91 30.74% 5.2 Air flow around the area 577 18.46%
positive 158 27.38% 14 2.43% 39 6.76% 24 4.16% 0 0.00% 235 40.73% negative 12 2.08% 14 2.43% 60 10.40% 204 35.36% 5 0.87% 295 51.13%
other comment 4 0.69% 1 0.17% 9 1.56% 13 2.25% 20 3.47% 47 8.15% 5.3 Sustainability concepts 46 1.47%
positive 5 10.87% 4 8.70% 8 17.39% 3 6.52% 1 2.17% 21 45.65% negative 2 4.35% 2 4.35% 2 4.35% 4 8.70% 1 2.17% 11 23.91%
other comment 4 8.70% 0 0.00% 0 0.00% 0 0.00% 10 21.74% 14 30.43% 5.4 Use of glass panels and its concerns 226 7.23%
positive 4 1.77% 31 13.72% 8 3.54% 5 2.21% 0 0.00% 48 21.24% negative 5 2.21% 86 38.05% 24 10.62% 18 7.96% 22 9.73% 155 68.58%
other comment 2 0.88% 3 1.33% 2 0.88% 3 1.33% 13 5.75% 23 10.18%
5.5 Impact on pollution 41 1.31%
positive 2 4.88% 2 4.88% 1 2.44% 0 0.00% 0 0.00% 5 12.20% negative 1 2.44% 3 7.32% 5 12.20% 12 29.27% 2 4.88% 23 56.10%
other comment 2 4.88% 0 0.00% 0 0.00% 1 2.44% 10 24.39% 13 31.71% 5.6 Presence of trees, plants, lawns: size and design 1495 47.82%
positive 243 16.25% 244 16.32% 93 6.22% 80 5.35% 10 0.67% 670 44.82% negative 147 9.83% 185 12.37% 56 3.75% 144 9.63% 8 0.54% 540 36.12%
other comment 86 5.75% 39 2.61% 22 1.47% 52 3.48% 86 5.75% 285 19.06% 5.7 Environmental friendliness 435 13.92%
127

Appendix 5
positive 103 23.68% 77 17.70% 63 14.48% 23 5.29% 4 0.92% 270 62.07% negative 9 2.07% 15 3.45% 20 4.60% 34 7.82% 4 0.92% 82 18.85%
other comment 4 0.92% 4 0.92% 5 1.15% 13 2.99% 57 13.10% 83 19.08% 5.8 Others 2 0.46% 0 0.00% 1 0.23% 2 0.46% 5 1.15% 10 2.30% 10 0.32%
128

Appendix 5
Table 5.8 Public open space Comments (from all sources) A B C D General Total Grand Total
Freq
uenc
y
Perc
enta
ge
Freq
uenc
y
Perc
enta
ge
Freq
uenc
y
Perc
enta
ge
Freq
uenc
y
Perc
enta
ge
Freq
uenc
y
Perc
enta
ge
Freq
uenc
y
Perc
enta
ge
Freq
uenc
y
Perc
enta
ge
6. Public open space 1785 100.00% 6.1 Landscaping design 632 35.41%
positive 54 8.54% 101 15.98% 24 3.80% 98 15.51% 3 0.47% 280 44.30% negative 64 10.13% 52 8.23% 36 5.70% 62 9.81% 7 1.11% 221 34.97%
other comment 32 5.06% 11 1.74% 11 1.74% 27 4.27% 50 7.91% 131 20.73% 6.2 Public accessibility into CGC and LegCo Complex within Tamar 59 3.31%
positive 7 11.86% 4 6.78% 2 3.39% 1 1.69% 0 0.00% 14 23.73% negative 8 13.56% 6 10.17% 6 10.17% 7 11.86% 0 0.00% 27 45.76%
other comment 4 6.78% 0 0.00% 2 3.39% 2 3.39% 10 16.95% 18 30.51% 6.3 Design/issues of the waterfront promenade 269 15.07%
positive 22 8.18% 20 7.43% 7 2.60% 71 26.39% 1 0.37% 121 44.98% negative 22 8.18% 6 2.23% 13 4.83% 37 13.75% 2 0.74% 80 29.74%
other comment 5 1.86% 2 0.74% 5 1.86% 10 3.72% 46 17.10% 68 25.28%
6.4 Meeting the needs of the public 448 25.10%
positive 68 15.18% 40 8.93% 26 5.80% 44 9.82% 8 1.79% 186 41.52% negative 29 6.47% 28 6.25% 17 3.79% 29 6.47% 12 2.68% 115 25.67%
other comment 27 6.03% 10 2.23% 11 2.46% 17 3.79% 82 18.30% 147 32.81% 6.5 Demonstration areas and their design 55 3.08%
positive 1 1.82% 1 1.82% 0 0.00% 3 5.45% 0 0.00% 5 9.09% negative 4 7.27% 2 3.64% 0 0.00% 1 1.82% 2 3.64% 9 16.36%
other comment 4 7.27% 2 3.64% 1 1.82% 1 1.82% 33 60.00% 41 74.55% 6.6 Distance between Government and people 52 2.91%
positive 18 34.62% 3 5.77% 1 1.92% 6 11.54% 1 1.92% 29 55.77% negative 1 1.92% 3 5.77% 7 13.46% 3 5.77% 4 7.69% 18 34.62%
other comment 1 1.92% 0 0.00% 0 0.00% 0 0.00% 4 7.69% 5 9.62%
129

Appendix 5
6.7 Security concerns 56 3.14%
positive 1 1.79% 2 3.57% 1 1.79% 1 1.79% 2 3.57% 7 12.50% negative 12 21.43% 10 17.86% 2 3.57% 1 1.79% 2 3.57% 27 48.21%
other comment 5 8.93% 1 1.79% 2 3.57% 2 3.57% 12 21.43% 22 39.29% 6.8 Water features 135 7.56%
positive 0 0.00% 21 15.56% 7 5.19% 18 13.33% 1 0.74% 47 34.81% negative 10 7.41% 9 6.67% 9 6.67% 19 14.07% 5 3.70% 52 38.52%
other comment 13 9.63% 8 5.93% 1 0.74% 4 2.96% 10 7.41% 36 26.67% 6.9 Others 20 25.32% 13 16.46% 7 8.86% 17 21.52% 22 27.85% 79 100.00% 79 4.43%
130

Appendix 5
Table 5.9 Connectivity of the Tamar site and surrounding areas Comments (from all sources) A B C D General Total Grand Total
Freq
uenc
y
Perc
enta
ge
Freq
uenc
y
Perc
enta
ge
Freq
uenc
y
Perc
enta
ge
Freq
uenc
y
Perc
enta
ge
Freq
uenc
y
Perc
enta
ge
Freq
uenc
y
Perc
enta
ge
Freq
uenc
y
Perc
enta
ge
7. Connectivity of the Tamar site and surrounding areas 295 100.00%
7.1 Interconnectivity with surround areas and the waterfront 294 99.66%
positive 67 22.79% 11 3.74% 13 4.42% 21 7.14% 1 0.34% 113 38.44% negative 16 5.44% 18 6.12% 17 5.78% 36 12.24% 6 2.04% 93 31.63%
other comment 19 6.46% 2 0.68% 5 1.70% 9 3.06% 53 18.03% 88 29.93% 7.2 Others 1 100.00% 0 0.00% 0 0.00% 0 0.00% 0 0.00% 1 100.00% 1 0.34%
131

Appendix 5
Table 5.10 Comments on certain unique features Comments (from all sources) A B C D General Total Grand Total
Freq
uenc
y
Perc
enta
ge
Freq
uenc
y
Perc
enta
ge
Freq
uenc
y
Perc
enta
ge
Freq
uenc
y
Perc
enta
ge
Freq
uenc
y
Perc
enta
ge
Freq
uenc
y
Perc
enta
ge
Freq
uenc
y
Perc
enta
ge
8. Comments on certain unique features 1463 100.00%
8.1 Comments on certain unique features 1455 99.45%
positive 101 6.94% 25 1.72% 65 4.47% 225 15.46% 1 0.07% 417 28.66% negative 124 8.52% 50 3.44% 232 15.95% 339 23.30% 10 0.69% 755 51.89%
other comment 65 4.47% 14 0.96% 56 3.85% 102 7.01% 46 3.16% 283 19.45% 8.2 Others 3 37.50% 0 0.00% 1 12.50% 3 37.50% 1 12.50% 8 100.00% 8 0.55%
132

Appendix 5
Table 5.11 Feng Shui concerns Comments (from all sources) A B C D General Total Grand Total
Freq
uenc
y
Perc
enta
ge
Freq
uenc
y
Perc
enta
ge
Freq
uenc
y
Perc
enta
ge
Freq
uenc
y
Perc
enta
ge
Freq
uenc
y
Perc
enta
ge
Freq
uenc
y
Perc
enta
ge
Freq
uenc
y
Perc
enta
ge
9. Feng Shui concerns 116 100.00% 9.1 Feng Shui concerns 116 100.00%
positive 3 2.59% 11 9.48% 2 1.72% 8 6.90% 0 0.00% 24 20.69% negative 38 32.76% 10 8.62% 15 12.93% 9 7.76% 1 0.86% 73 62.93%
other comment 3 2.59% 6 5.17% 0 0.00% 2 1.72% 8 6.90% 19 16.38% 9.2 Others 0 0.00% 0 0.00% 0 0.00% 0 0.00% 0 0.00% 0 0.00% 0 0.00%
133

Appendix 5
Table 5.12 Overall preference Comments (from all sources) A B C D General Total Grand Total
Freq
uenc
y
Perc
enta
ge
Freq
uenc
y
Perc
enta
ge
Freq
uenc
y
Perc
enta
ge
Freq
uenc
y
Perc
enta
ge
Freq
uenc
y
Perc
enta
ge
Freq
uenc
y
Perc
enta
ge
Freq
uenc
y
Perc
enta
ge
10. Overall preference 2424 100.00% 10.1 Overall preference 2403 99.13%
positive 587 24.43% 182 7.57% 228 9.49% 697 29.01% 6 0.25% 1700 70.74% negative 79 3.29% 173 7.20% 159 6.62% 97 4.04% 1 0.04% 509 21.18%
other comment 40 1.66% 56 2.33% 59 2.46% 35 1.46% 4 0.17% 194 8.07% 10.2 Others 8 38.10% 1 4.76% 2 9.52% 3 14.29% 7 33.33% 21 100.00% 21 0.87%
134

Appendix 5
Table 5.13 Cost factor (estimate/perception) Comments (from all sources) A B C D General Total Grand Total
Freq
uenc
y
Perc
enta
ge
Freq
uenc
y
Perc
enta
ge
Freq
uenc
y
Perc
enta
ge
Freq
uenc
y
Perc
enta
ge
Freq
uenc
y
Perc
enta
ge
Freq
uenc
y
Perc
enta
ge
Freq
uenc
y
Perc
enta
ge
11. Cost factor 301 100.00% 11.1 Cost of construction 140 46.51%
positive 2 1.43% 12 8.57% 0 0.00% 3 2.14% 0 0.00% 17 12.14% negative 20 14.29% 4 2.86% 15 10.71% 26 18.57% 2 1.43% 67 47.86%
other comment 7 5.00% 0 0.00% 0 0.00% 6 4.29% 43 30.71% 56 40.00% 11.2 Cost of maintenance 45 14.95%
positive 1 2.22% 2 4.44% 0 0.00% 0 0.00% 3 6.67% 6 13.33% negative 7 15.56% 3 6.67% 7 15.56% 7 15.56% 1 2.22% 25 55.56%
other comment 1 2.22% 0 0.00% 1 2.22% 0 0.00% 12 26.67% 14 31.11% 11.3 Other hidden costs 1 0.33%
positive 0 0.00% 0 0.00% 0 0.00% 0 0.00% 0 0.00% 0 0.00% negative 0 0.00% 1 100.00% 0 0.00% 0 0.00% 0 0.00% 1 100.00%
other comment 0 0.00% 0 0.00% 0 0.00% 0 0.00% 0 0.00% 0 0.00% 11.4 Other technical matters 113 37.54%
positive 1 0.88% 6 5.31% 4 3.54% 1 0.88% 0 0.00% 12 10.62% negative 38 33.63% 6 5.31% 10 8.85% 8 7.08% 2 1.77% 64 56.64%
other comment 20 17.70% 0 0.00% 4 3.54% 2 1.77% 11 9.73% 37 32.74% 11.5 Others 0 0.00% 0 0.00% 0 0.00% 0 0.00% 2 100.00% 2 100.00% 2 0.66%
135

Appendix 5
Table 5.14 Public consultation process Table 5.15 Other overall comments
Comments (from all sources)
Freq
uenc
y
Perc
enta
ge
Tota
l
12. Public consultation process 34112.1 Availability of background information 107 31.38%
12.2 Commendable process 33 9.68%12.3 Fake consultation 18 5.28%12.4 Areas to improve 181 53.08%12.5 Others 2 0.59%
Comments (from all sources)
Freq
uenc
y
Perc
enta
ge
Tota
l
13 Other overall comments 635
13.1 How to make the best of public money 35 5.51%
13.2 All designs are unacceptable 76 11.97%
13.3 Fairness concerns: name of consortiums exposed and its impact
1 0.16%
13.4 Business reputation of bidders 7 1.10%
13.5 Economic impact: provision of jobs 6 0.94%
13.6 Taste 0 0.00% 13.6.1 Good taste 0 0.00% 13.6.2 Bad taste 1 0.16%
13.7 Choices: not enough 57 8.98%
13.8 Possibility of combining models 153 24.09%
13.9 Other possible uses of Tamar site 57 8.98%
13.10 Inclusion of promenade design 0 0.00%
13.10.1 For 10 1.57% 13.10.2 Against 37 5.83%
13.11 Design of exhibition venue and exhibits
32 5.04%
13.12 Others 163 25.67%
136

Appendix 6
137
Appendix 6
Sample of Blank Comment Card

Appendix 6
138

Appendix 6
139

Appendix 6
140

Appendix 7
141
Appendix 7
Sample of Exit Poll Questionnaire

Appendix 7
The Hong Kong Polytechnic University Survey on Design Proposals for the Tamar Development Project
Staff Only: Supervisor︰____________Case ID︰_____________ Date︰____/_____/_______
Interviewer ID : 1-3 Questionnaire ID : 4 -7
Date : YY/MM/DD 8-13
Time : HH:MM 14-17 Venue : 18-19 01 QGO 02 KP
Refusal Person : Male 20-21 Female 22-23
Interviewer, please read:
“Sir/Madam, we are now conducting a survey on Design Proposals for the Tamar Development Project and would like to do a short interview with you. Please be assured that the information you provide will be kept strictly confidential. Thank you for your co-operation.” “Please indicate your rating of the following design and aesthetic aspects of the proposals submitted by the four tenderers for the Tamar project. Some relevant considerations are suggested under each aspect for your reference.”
Excellent Good Fair Unsatisfactory Not sure
Design A* 4 3 2 1 0
Design B* 4 3 2 1 0
Design C* 4 3 2 1 0
(a) Visual attractiveness (You may consider, for instance, design aesthetics, the scale and proportion of the development, and whether it will be an iconic landmark.)
Design D* 4 3 2 1 0
Design A* 4 3 2 1 0
Design B* 4 3 2 1 0
Design C* 4 3 2 1 0
(c) Image befitting the Central Government Complex and the Legislative Council Complex (You may consider, for instance, whether the design reflects the distinct identities and important roles of the Government headquarters and the Legislative Council, and whether it is harmonious and integrative.)
Design D* 4 3 2 1 0
Design A* 4 3 2 1 0 (d)
Design B* 4 3 2 1 0
Impact on cityscape and waterfront environment
Design C* 4 3 2 1 0
(You may consider, for instance, the visual impact of the project in relation to the ridgeline and whether it enhances the cityscape and waterfront environment.)
Design D* 4 3 2 1 0
Profile of respondent: Provision of the information below will help the Government determine the profile of respondents as a group.
(a) Age: 1. under 18 2. 18-30 3. 31-45 4. 46-60 5. 61and over 6. Refuse to answer
(b) Sex: 1. Male 2. Female 3. Refuse to answer
(c) Area of residence: 1. HK Island 2. Kowloon 3. NT & Islands 4. Refuse to answer (d) Industry (please specific) : (e) Occupation (please specific) :
Thank You!
142

Appendix 8
Appendix 8
Sample of Telephone Poll Questionnaire
143

Appendix 8
The Hong Kong Polytechnic University Department of Applied Social Sciences
Centre for Social Policy Studies
Survey on Design Proposals for the Tamar Development Project
May 2007
Procedure A: Self Introduction
“Hello, is this telephone number XXXX XXXX? (Interviewer: if you have dialled the wrong number please say: “Sorry, I think I’ve dialled the wrong number. Bye-bye.” Then please try to dial the correct number at once.) ” “I am a telephone interviewer from the Centre for Social Policy Studies at the Hong Kong Polytechnic University. We are now conducting an opinion survey on “Design Proposals for the Tamar Development Project” and would like to do a short interview with you. Please be assured that the information you provide will be kept strictly confidential. Thank you for your co-operation. The eligible respondents of this survey are Hong Kong citizens aged 18 or above. I would like to know how many household members are aged 18 or above? ” Responses: Situation 1. Respondent cooperates ------------------------------------------------------------>[Procedure B] Situation 2. Cut-at-once/ Refusal/ Mid-way termination ------------------------------------>[End] Situation 3. Invalid Numbers (Strange tone/ No Tone) -------------------------------------->[End] Situation 4. Non-Target (No eligible respondent/ Fax/ Non-Residential Line) ---------->[End] Situation 5. No Answer/ Answering Machine/ Not available right now /Busy Line ---->[Retry]
1st Attempt
2nd Attempt
3rd Attempt
4th Attempt
5th Attempt
6th Attempt
Interview/ Attempt History:
Interview/ Attempt date and time:
Interview/ Attempt Result:
[v1] Telephone Number: ______________
[v2] Case ID: _______________
Procedure B: Sample Selection 【If there is more than one eligible respondents in the same household, please use the Random Generator with the Kish Grid method to randomly select one of the eligible respondents to conduct the survey.】 [v3] According to the sampling result, we have selected the __ oldest member of your household as respondent, would you mind if I invite this household member to conduct the survey now? 1 □ I am [Start questionnaire, go to Procedure C] [If necessary, please read the survey introduction again] 2 □ Not convenient right now [Must be confirmed] [Confirmation or Make appointment: _______] [End
interview] [Record down] 3 □ Not here right now [Make appointment:_______ ] [End interview] [Record Down]
144
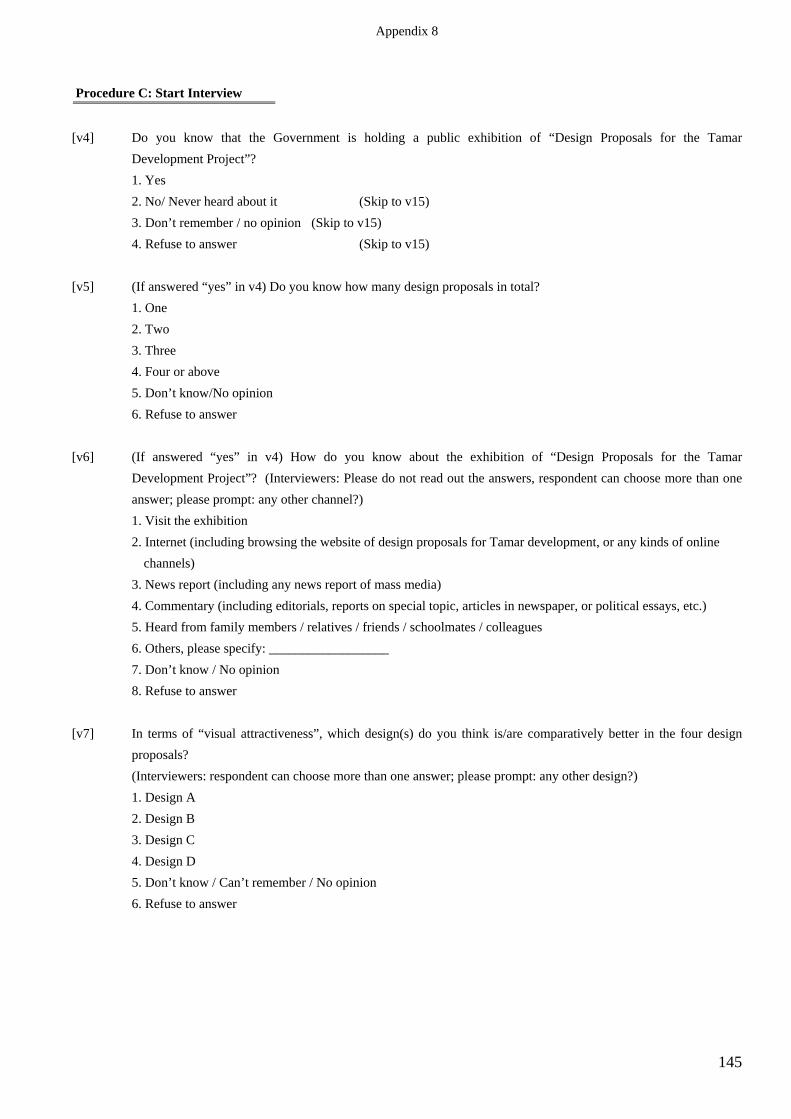
Appendix 8
145
Procedure C: Start Interview
[v4] Do you know that the Government is holding a public exhibition of “Design Proposals for the Tamar
Development Project”? 1. Yes 2. No/ Never heard about it (Skip to v15) 3. Don’t remember / no opinion (Skip to v15) 4. Refuse to answer (Skip to v15)
[v5] (If answered “yes” in v4) Do you know how many design proposals in total?
1. One 2. Two 3. Three 4. Four or above 5. Don’t know/No opinion 6. Refuse to answer
[v6] (If answered “yes” in v4) How do you know about the exhibition of “Design Proposals for the Tamar
Development Project”? (Interviewers: Please do not read out the answers, respondent can choose more than one answer; please prompt: any other channel?) 1. Visit the exhibition 2. Internet (including browsing the website of design proposals for Tamar development, or any kinds of online channels) 3. News report (including any news report of mass media) 4. Commentary (including editorials, reports on special topic, articles in newspaper, or political essays, etc.)
5. Heard from family members / relatives / friends / schoolmates / colleagues 6. Others, please specify: __________________
7. Don’t know / No opinion 8. Refuse to answer
[v7] In terms of “visual attractiveness”, which design(s) do you think is/are comparatively better in the four design
proposals? (Interviewers: respondent can choose more than one answer; please prompt: any other design?) 1. Design A 2. Design B 3. Design C 4. Design D 5. Don’t know / Can’t remember / No opinion 6. Refuse to answer

Appendix 8
146
[v8] In terms of “image befitting the Central Government Complex and the Legislative Council Complex”, which
design(s) do you think is/are comparatively better in the four design proposals? (Interviewers: respondent can choose more than one answer; please prompt: any other design?) 1. Design A 2. Design B 3. Design C 4. Design D 5. Don’t know / Can’t remember / No opinion 6. Refuse to answer
[v9] In terms of “impact on cityscape and waterfront environment”, which design(s) do you think is/are comparatively
better in the four design proposals? (Interviewers: respondent can choose more than one answer; please prompt: any other design?) 1. Design A 2. Design B 3. Design C 4. Design D 5. Don’t know / Can’t remember / No opinion 6. Refuse to answer
[v10] Overall speaking, which design(s) do you think is/are comparatively better in the four design proposals?
(Interviewers: respondent can choose more than one answer; please prompt: any other design?) 1. Design A 2. Design B 3. Design C 4. Design D 5. Don’t know / Can’t remember / No opinion 6. Refuse to answer
[v11] Would you please tell me the reason(s) of why you select this/these design proposal(s)?
Interviewers please record the answers: Design A - Reason: ______________________________________________________ Design B - Reason: ______________________________________________________ Design C - Reason: ______________________________________________________ Design D - Reason: ______________________________________________________ (Press 1 to the next question) 2. No particular reason, by personal feeling or impression 3. Cannot remember other design proposals 4. Refuse to answer

Appendix 8
147
[v12] Have you seen all the showpieces in the public exhibition, including 18 exhibition boards, introductory videos, and design models? 1. Yes, I have seen all the showpieces 2. No, just some of the showpieces 3. No, I have never seen any showpiece before 4. Don’t know / No opinion 5. Refuse to answer
[v13] Are you satisfied or dissatisfied with the public exhibition of “Design Proposals for the Tamar Development
Project”? 1. Very satisfied 2. Satisfied 3. Neither satisfied nor dissatisfied 4. Dissatisfied 5. Very dissatisfied 6. Don’t know / No opinion 7. Refuse to answer
[v14] Do you have any other comment about the pubic exhibition?
1. Yes, please record: ______________________________________________________________________ 2. No 3. Don’t know / No opinion 4. Refuse to answer
[v15] Sex of the respondent: (written down by the interviewer)
1. Male 2. Female
[v16] What is your age? (According to the last birthday)
1. 18-30 2. 31-45 3. 46-60 4. 61 or above 5. Refuse to answer
[v17] In which area are you living?
1. Hong Kong Island 2. Kowloon 3. NT and Island 4. Non-local resident 5. Refuse to answer

Appendix 8
148
[v18] Are you currently working or non-working?
1. Yes (Skip to V19) 2. No
[v19] Are you a ….?
1. Student 4. Unemployed 2. Home-maker 5. Others, please specify: ___________ End interview 3. Retired person 6. Refuse to answer
[v20] What is your current position?
01 Managers and administrators 06 Skilled agricultural / fishery workers 02 Professionals 07 Craft and related workers 03 Associate professionals 08 Plant and machine operators and assemblers 04 Clerks 09 Elementary occupations 05 Service workers and shop sales workers 10 Refuse to answer
(Mr.___________/ Miss__________) Thank you for your co-operation. Goodbye.
-- End of Questionnaire --

Independent Analysis and Reporting of the
Public Viewing Exercise for the Tamar Development Project
Executive Summary
Public Policy Research Institute The Hong Kong Polytechnic University
June 2007

Executive Summary
1
INTRODUCTION In July 2006, the Hong Kong Special Administrative Region Government (the Government) commissioned the Public Policy Research Institute (PPRI) of The Hong Kong Polytechnic University (the University) to carry out a Consultancy on “Independent Analysis and Reporting of the Public Viewing Exercise for the Tamar Development Project”. This Report presents the findings of this Public Viewing Exercise and includes: (1) a summary of the views expressed on the 14,091 Comment Cards and Written Submissions collected up to 27 May 2007, (2) a summary of the results of four Exit Polls conducted during the periods 1-8 April, 16-24 April, 1-9 May and 15-23 May 2007, and (3) a summary of the results of two Telephone Polls conducted during the periods 22 April to 1 May 2007 and 11 to 18 May 2007. With the consent of the four tenderers, views expressed at the Legislative Council Commission meeting held on 1 June 2007 are also included in the analysis.
BACKGROUND OF THE TAMAR DEVELOPMENT PROJECT A Central Government Complex (CGC) and a Legislative Council (LegCo) Complex, together with at least two hectares of open space, are to be developed on the 4.2-hectare Tamar site in Central District, Hong Kong Island. In April 2002, the Government announced a plan to develop Tamar as Hong Kong’s prime civic core. The project obtained support from the LegCo Panel on Planning, Lands and Works and the Public Works Subcommittee in April and May 2003 respectively, but was shelved later that year in view of the impact of the SARS outbreak. With improvement in the economy and to public finances, the Government announced in October 2005 a re-launch of the Tamar Development Project. The scope of the re-launched project covers the proposed CGC, LegCo Complex, open space and other ancillary facilities. In order to develop Tamar as Hong Kong’s prime civic core, the design is required to project Hong Kong’s position as a cosmopolitan city and Asia’s world city. It should be responsive to the urban fabric of Central District as well as the natural context of the waterfront setting and the backdrop of Victoria Peak. The distinct identities of the CGC and LegCo Complex should be duly reflected, taking into account their respective constitutional roles. The project should also provide a long-term solution to the office-space shortage facing the Government Secretariat and LegCo. The project is envisaged to commence in 2007, for completion in 2010. SELECTION PROCESS A Special Selection Board, chaired by the Chief Secretary for Administration, Mr. Rafael Hui, will assess the tenders according to a number of criteria, including planning, sustainability, environmental, functional, technical, price, design and aesthetic aspects. Board Members include Mrs. Rita Fan, Ms. Miriam Lau, Professor David Lung, Mr. Alan Lai and Mrs Rita Lau.
Executive Summary
THE PUBLIC VIEWING EXERCISE The Public Viewing Exercise on the Tamar Development Project was launched in March 2007. The Government organised an exhibition (staged at two separate venues) on the four tenderers’ design proposals for the Tamar Development Project. The first one was staged at a Hong Kong Island venue (Deck Level, High Block, Queensway Government Offices) from 28 March to 24 April 2007. The second one was staged at a Kowloon venue (Thematic Exhibition Gallery, Hong Kong Heritage Discovery Centre, Kowloon Park) from 28 April to 27 May 2007.
Comment Cards were distributed at the exhibition venues for visitors to complete and deposit into collection boxes before leaving. Alternatively, Comment Cards could be submitted online (via computers at the exhibition venues or via the internet), or by fax or post. Information on the four design proposals was also available on the Government Website, where members of the public could complete Comment Cards online after viewing. The public could also send in Written Submissions to the Government, where they would be processed by designated Government staff and delivered to PPRI for analysis.
THE CONSULTANCY AND ITS OBJECTIVES This Consultancy aims to analyse public opinion regarding the Tamar Development Project collected during the Public Viewing Exercise period (28 March to 27 May 2007) and to provide independent analyses and technical advice to the Government regarding such public opinion.
The Consultancy can be divided into two major parts: (see Figure 1) Part 1: Quantitative Analysis of the views received during the Public Viewing Exercise period on the four Tamar Development Project design proposals; and Part 2: Qualitative Analysis of the views received during the Public Viewing Exercise period on the four Tamar Development Project design proposals.
2

Executive Summary
SCHEMATIC REPRESENTATION OF THIS CONSULTANCY Figure 1 shows schematically components and the process of this Consultancy:
Quantitative Analysis
o Responses to the close-ended questions on the Comment Cards
o Exit Polls
o Telephone Polls
Summary of public views
o Responses to the open-ended questions on the Comment Cards
o Other Written Submissions
Qualitative Analysis
Figure 1: Schematic Representation of the Consultancy PART 1: QUANTITATIVE DATA ANALYSIS The Quantitative Data came from three sources: • responses to the close-ended questions on the Comment Cards; • four Exit Polls; and • two Telephone Polls.
A total of 14,055 Comment Cards were received by 27 May 2007. Of these:
• 10,939 were from the exhibition venues, • 3,011 were electronic versions via the internet, • 89 were by fax, and • 16 were by mail.
3

Executive Summary
COMMENT CARDS A total of 74,094 Comment Cards received via the internet was invalidated by the Consultancy Team using established criteria. A total of 31,472 persons went to the Exhibitions. On average, 35% of the visitors filled out a Comment Card at the venue. There were 72,962 visits to the Government’s Tamar Development Project webpage. The Comment Card contains seven close-ended questions, the results of which are shown below:
Mean scores for each design for each question 4 = Excellent, 3 = Good, 2 = Fair, 1 = Unsatisfactory (a) Visual attractiveness
Design A Design B Design C Design D
Mean score1 2.96 2.07 2.31 3.10
Number of responses 12,798 12,265 12,268 13,062
(b) Symbol of Hong Kong as Asia’s world city
Design A Design B Design C Design D
Mean score 2.85 2.01 2.34 3.13
Number of responses 12,555 12,086 12,111 12,932
(c) Image befitting the CGC and the LegCo Complex
Design A Design B Design C Design D
Mean score 2.87 2.21 2.33 2.94
Number of responses 12,483 12,001 12,052 12,810
1The score for each design given by respondents ranges from 4 to 1 (i.e. 4 = Excellent, 3 = Good, 2 =
Fair, 1 = Unsatisfactory). The mean score for each design is computed by multiplying the score for each design by the number of respondents who give that score and divided by the total number of respondents.
4

Executive Summary
(d) Impact on cityscape and waterfront environment
Design A Design B Design C Design D
Mean score 2.9313 2.40 2.38 2.9328
Number of responses 12,323 11,867 11,853 12,646
(e) Green features and environmental friendliness
Design A Design B Design C Design D
Mean score 3.02 2.67 2.58 2.81
Number of responses 12,302 11,913 11,855 12,558
(f) Public open space
Design A Design B Design C Design D
Mean score 3.00 2.62 2.53 2.98
Number of responses 12,258 11,870 11,799 12,593
(g) Connectivity of the Tamar site and surrounding areas
Design A Design B Design C Design D
Mean score 2.90 2.51 2.52 2.91
Number of responses 12,182 11,769 11,753 12,525
The results from the Comment Cards indicate that:
• Design D ranks first on five themes (visual attractiveness, symbol of Hong
Kong as Asia’s world city, image befitting the CGC and LegCo Complex, impact on cityscape and waterfront environment, and connectivity of the Tamar site and surrounding areas), and ranks second on two themes (green features and environmental friendliness, and public open space);
• Design A ranks first on two themes (green features and environmental friendliness, and public open space), and ranks second on the other five themes (visual attractiveness, symbol of Hong Kong as Asia’s world city, image befitting the CGC and LegCo Complex, impact on cityscape and waterfront environment, and connectivity of the Tamar site and surrounding areas);
• Design C ranks third on four themes (visual attractiveness, symbol of Hong Kong as Asia’s world city, image befitting the CGC and LegCo
5

Executive Summary
Complex, and connectivity of the Tamar site and surrounding areas); and ranks fourth on three themes (impact on cityscape and waterfront environment, green features and environmental friendliness, and public open space); and
• Design B ranks third on three themes (impact on cityscape and waterfront environment, green features and environmental friendliness, and public open space), and ranks fourth on four themes (visual attractiveness, symbol of Hong Kong as Asia’s world city, image befitting the CGC and Legislative Council Complex, and connectivity of the Tamar site and surrounding areas).
The overall rank order of the designs from all valid Comment Cards is: D, A, C, B, assuming equal weighting of the seven themes.
EXIT POLLS The Consultancy Team conducted face-to-face interviews with randomly-selected visitors at the exhibition venues. These Exit Polls are intended to verify the results obtained from the submitted Comment Cards, given that the method for collecting Comment Cards is vulnerable to manipulation. Systematic Random Sampling was employed to select visitors leaving the venues after they had finished viewing the exhibitions. Since it was considered excessive to ask Exit Poll respondents all seven of the questions on the Comment Card, the Consultancy Team constructed a short version of the questionnaire containing what it considered were the three key Comment Card questions (visual attractiveness, image befitting the CGC and LegCo Complex, and impact on cityscape and waterfront environment). The questionnaire was finalized before any Comment Card results were analysed. Four Exit Polls were conducted during 1-8 April, 16-24 April, 1-9 May, and 15-23 May. A pilot poll was conducted on 31 March. The dates of the polls were not made public in advance. The interviewees were selected on a randomised basis according to a pre-determined rule. During the first poll, 1,255 visitors were successfully interviewed with a response rate of 57.9%. The second poll successfully interviewed 1,171 visitors, with a response rate of 86.6%. The third poll successfully interviewed 1,889 visitors, with a response rate of 68.5%. The fourth poll successfully interviewed 997 visitors, with a response rate of 67%. The aggregated results of the Exit Polls are shown below:
6

Executive Summary
Mean score for each question
4 = Excellent, 3 = Good, 2 = Fair, 1 = Unsatisfactory Visual attractiveness
Design A Design B Design C Design D
Mean score 2.85 2.15 2.35 3.00
Number of responses 5,284 5,264 5,264 5,281
Image befitting the CGC and the LegCo Complex
Design A Design B Design C Design D
Mean score 2.73 2.18 2.28 2.79
Number of responses 5,160 5,141 5,149 5,166
Impact on cityscape and waterfront environment
Design A Design B Design C Design D
Mean score 2.84 2.40 2.36 2.87
Number of responses 5,216 5,192 5,189 5,216
The results of the Exit Polls indicate:
• Design D ranks first on three themes (visual attractiveness, image befitting the CGC and Legislative Council Complex, and impact on cityscape and waterfront environment);
• Design A ranks second on three themes (visual attractiveness, image befitting the CGC and Legislative Council Complex, and impact on cityscape and waterfront environment);
• Design C ranks third on two themes (visual attractiveness, and image befitting the CGC and Legislative Council Complex); and ranks fourth on one theme (impact on cityscape and waterfront environment); and
• Design B ranks third on one theme (impact on cityscape and waterfront environment) and ranks fourth on two themes (visual attractiveness, and image befitting the CGC and Legislative Council Complex).
The overall rank order of the designs from the four Exit Polls is: D, A, C, B, assuming equal weighting of the three themes.
7

Executive Summary
TELEPHONE POLLS The first Telephone Poll was conducted during the period 22 April - 1 May. The second Telephone Poll was conducted during the period 11-18 May. This section summarises the aggregated results of the close-ended questions from the two Telephone Polls.
The objectives of the Telephone Polls are:
• To assess public awareness of the Tamar Development Project; • To triangulate the results of the Comment Cards and Exit Polls; and • To assess public opinion on important issues relating to the Tamar Development
Project identified in the Qualitative Data but not covered on the Comment Cards.
1,512 persons were interviewed successfully in the First Poll with a co-operation rate of 68.7%. 1,542 persons were interviewed successfully in the Second Poll with a co-operation rate of 76.4%. The margin of error was +/- 2.52% at 95% confidence level. Separate results from the Telephone Polls show: • While about 40% of the respondents are aware of the Tamar Development Project,
more than three quarters of them do not know the exact number of design proposals.
• The majority of those who know about the Project obtained their information from
news reports (76%). Less than 2% have read all of the exhibition materials, and only around 8% have read part of them.
• Regarding “visual attractiveness” of the four designs, the ranking is D, C, B, A.
Regarding “image befitting CGC and LegCo Complex”, the ranking is A, B, C, D. Regarding “the impact on cityscape”, the ranking is D, B, C, A. Regarding “the overall design”, the ranking is D, B, A / C#.
• The majority are satisfied with the exhibition.
QUANTITATIVE DATA ANALYSIS SUMMARY The overall ranking of the Design Proposals from the various Quantitative Data sets is shown in the following Table:
Comment Cards (responses to close-end questions)
Exit Polls Phone Polls
D, A, C, B D, A, C, B D, B, A / C#
# Design A and Design C are tied in rank order.
8
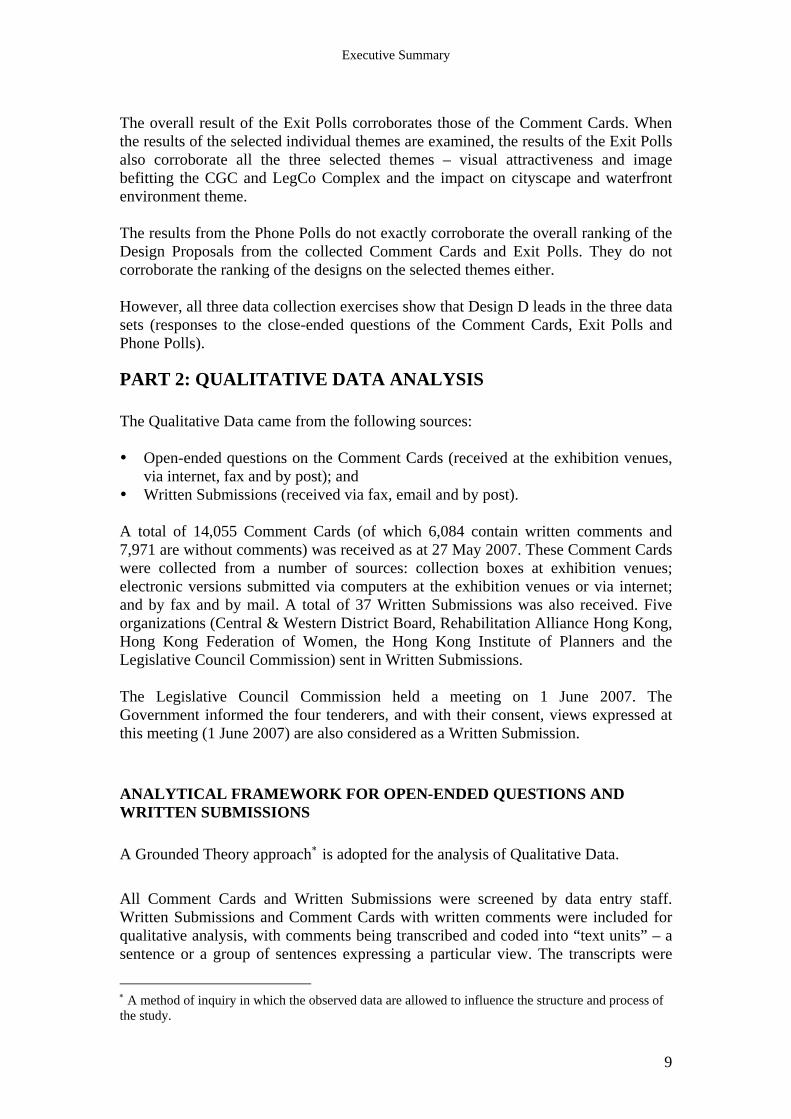
Executive Summary
The overall result of the Exit Polls corroborates those of the Comment Cards. When the results of the selected individual themes are examined, the results of the Exit Polls also corroborate all the three selected themes – visual attractiveness and image befitting the CGC and LegCo Complex and the impact on cityscape and waterfront environment theme. The results from the Phone Polls do not exactly corroborate the overall ranking of the Design Proposals from the collected Comment Cards and Exit Polls. They do not corroborate the ranking of the designs on the selected themes either.
However, all three data collection exercises show that Design D leads in the three data sets (responses to the close-ended questions of the Comment Cards, Exit Polls and Phone Polls).
PART 2: QUALITATIVE DATA ANALYSIS The Qualitative Data came from the following sources: Open-ended questions on the Comment Cards (received at the exhibition venues,
via internet, fax and by post); and Written Submissions (received via fax, email and by post).
A total of 14,055 Comment Cards (of which 6,084 contain written comments and 7,971 are without comments) was received as at 27 May 2007. These Comment Cards were collected from a number of sources: collection boxes at exhibition venues; electronic versions submitted via computers at the exhibition venues or via internet; and by fax and by mail. A total of 37 Written Submissions was also received. Five organizations (Central & Western District Board, Rehabilitation Alliance Hong Kong, Hong Kong Federation of Women, the Hong Kong Institute of Planners and the Legislative Council Commission) sent in Written Submissions. The Legislative Council Commission held a meeting on 1 June 2007. The Government informed the four tenderers, and with their consent, views expressed at this meeting (1 June 2007) are also considered as a Written Submission.
ANALYTICAL FRAMEWORK FOR OPEN-ENDED QUESTIONS AND WRITTEN SUBMISSIONS A Grounded Theory approach∗ is adopted for the analysis of Qualitative Data.
All Comment Cards and Written Submissions were screened by data entry staff. Written Submissions and Comment Cards with written comments were included for qualitative analysis, with comments being transcribed and coded into “text units” – a sentence or a group of sentences expressing a particular view. The transcripts were
∗ A method of inquiry in which the observed data are allowed to influence the structure and process of the study.
9
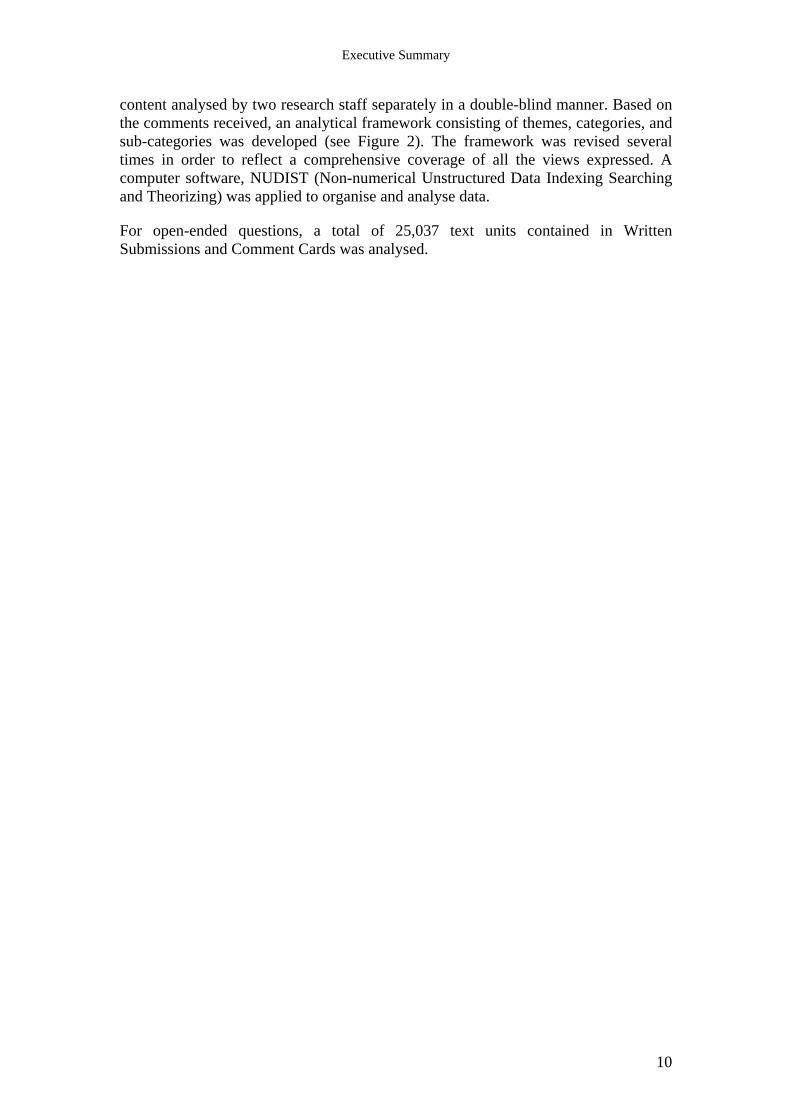
Executive Summary
content analysed by two research staff separately in a double-blind manner. Based on the comments received, an analytical framework consisting of themes, categories, and sub-categories was developed (see Figure 2). The framework was revised several times in order to reflect a comprehensive coverage of all the views expressed. A computer software, NUDIST (Non-numerical Unstructured Data Indexing Searching and Theorizing) was applied to organise and analyse data.
For open-ended questions, a total of 25,037 text units contained in Written Submissions and Comment Cards was analysed.
10
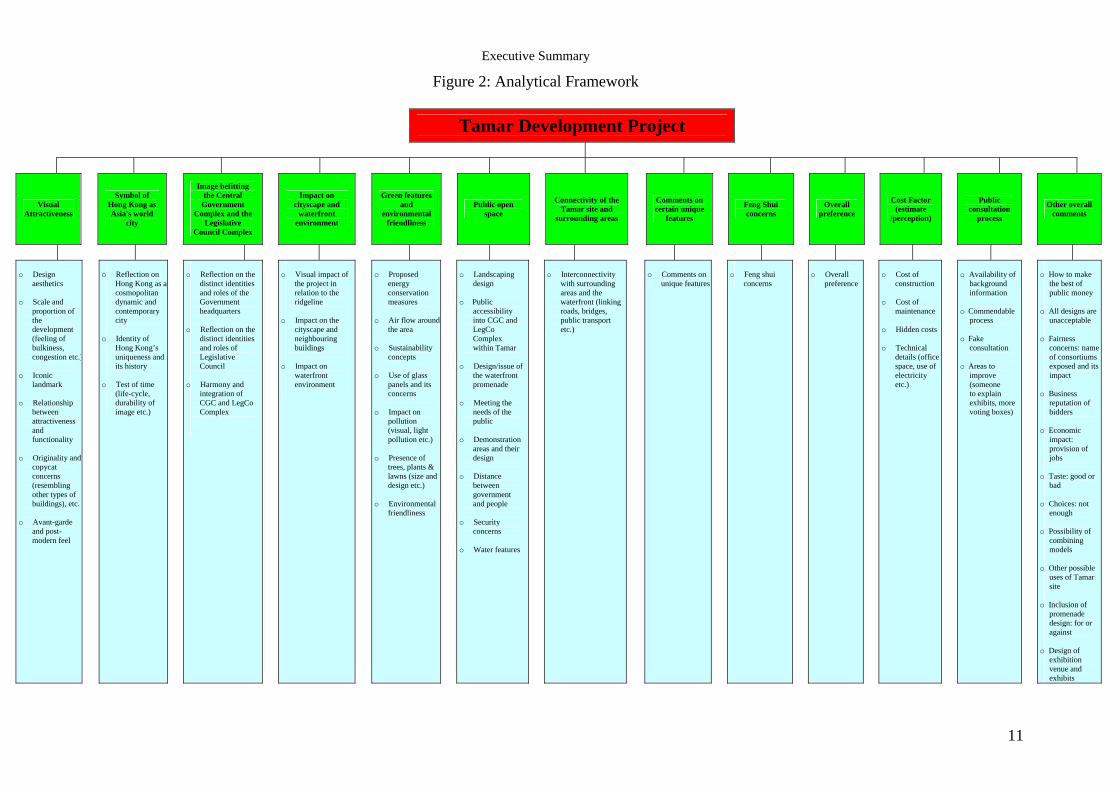
Executive Summary
11
Figure 2: Analytical Framework
Tamar Development Project
Visual Attractiveness
Symbol of Hong Kong as Asia's world
city
Image befitting the Central
Government Complex and the
Legislative Council Complex
Impact on cityscape and
waterfront environment
Green features and
environmental friendliness
Public open space
Connectivity of the Tamar site and
surrounding areas
Comments on certain unique
features Feng Shui
concerns Overall preference
Cost Factor (estimate
/perception)
Public consultation
process Other overall
comments
o Design aesthetics
o Scale and
proportion of the development (feeling of bulkiness, congestion etc.)
o Iconic
landmark o Relationship
between attractiveness and functionality
o Originality and
copycat concerns (resembling other types of buildings), etc.
o Avant-garde
and post-modern feel
o Reflection on
Hong Kong as a cosmopolitan dynamic and contemporary city
o Identity of
Hong Kong’s uniqueness and its history
o Test of time
(life-cycle, durability of image etc.)
o Reflection on the
distinct identities and roles of the Government headquarters
o Reflection on the
distinct identities and roles of Legislative Council
o Harmony and
integration of CGC and LegCo Complex
o Visual impact of
the project in relation to the ridgeline
o Impact on the
cityscape and neighbouring buildings
o Impact on
waterfront environment
o Proposed
energy conservation measures
o Air flow around
the area
o Sustainability concepts
o Use of glass
panels and its concerns
o Impact on
pollution (visual, light pollution etc.)
o Presence of
trees, plants & lawns (size and design etc.)
o Environmental
friendliness
o Landscaping
design o Public
accessibility into CGC and LegCo Complex within Tamar
o Design/issue of
the waterfront promenade
o Meeting the
needs of the public
o Demonstration
areas and their design
o Distance
between government and people
o Security
concerns o Water features
o Interconnectivity
with surrounding areas and the waterfront (linking roads, bridges, public transport etc.)
o Comments on
unique features
o Feng shui
concerns
o Overall
preference
o Cost of
construction o Cost of
maintenance o Hidden costs o Technical
details (office space, use of electricity etc.)
o Availability of
background information
o Commendable
process o Fake
consultation o Areas to
improve (someone to explain exhibits, more voting boxes)
o How to make
the best of public money
o All designs are
unacceptable o Fairness
concerns: name of consortiums exposed and its impact
o Business
reputation of bidders
o Economic
impact: provision of jobs
o Taste: good or
bad o Choices: not
enough o Possibility of
combining models
o Other possible
uses of Tamar site
o Inclusion of
promenade design: for or against
o Design of
exhibition venue and exhibits

Executive Summary
12
Themes Positive Comments on Individual Designs
General Comments Total
1 Visual attractiveness A (1458) D (1238) C (578) B (341) G (18) 3633
2 Overall preference D (697) A (587) C (228) B (182) G (6) 1700
3 Green features and environmental friendliness A (559) B (390) C (265) D (145) G (17) 1376
4 Symbol of HK as Asia's world city D (622) A (142) C (64) B (26) G (11) 865
5 Public open space D (242) B (192) A (171) C (68) G (16) 689
6 Image befitting the Central Government Complex and the LegCo Complex A (192) B (116) D (72) C (46) G (5) 431
7 Comments on certain unique features D (225) A (101) C (65) B (25) G (1) 417
8 Impact on cityscape and waterfront environment A (122) D (92) B (84) C (60) G (2) 360
9 Connectivity of the Tamar site and surrounding areas A (67) D (21) C (13) B (11) G (1) 113
10 Cost factor B (20) A (4) C (4) D (4) G (3) 35
11 Feng Shui concerns B (11) D (8) A (3) C (2) G (0) 24
QUALITATIVE DATA ANALYSIS SUMMARY
The 13 themes are summarised in descending order in terms of public attention (i.e. comments in text units) and they are:
• Visual Attractiveness (10,756 text units). • Green Features and Environmental Friendliness (3,126 text units). • Overall Preference (2,424 text units). • Public Open Space (1,785 text units). • Comments on Certain Unique Features (1,463 text units). • Image Befitting the CGC and the LegCo Complex (1,442 text units). • Symbol of Hong Kong as Asia’s World City (1,372 text units). • Impact on Cityscape and Waterfront Environment (981 text units). • Other Overall Comments (635 text units). • Public Consultation Process (341 text units). • Cost Factor (Estimate/Perception) (301 text units). • Connectivity of the Tamar Site and Surrounding Areas. (295 text units). • Feng Shui Concerns (116 text units).
Within the above 13 most concerned themes/issues, the general public also gave their positive and negative views on the four designs except for two themes (“public consultation process” and “other overall comments”) which were not related to public assessment of the four designs. The ranking of the positive and negative comments of the remaining 11 themes is tabulated below:
Number of Positive Comments on Individual Designs by Themes

Executive Summary
Based on the above data, it can be concluded that Design A leads in the respondents’ positive comments (3404), followed by Design D (3366), Design B (1398) and Design C (1393). Among the 11 themes of most concern to the general public, Design A received most positive comments on five themes, followed by Design D (4 out of 11), Design B (2 out of 11) and Design C (0 out of 11). The table above provides the distribution of the four designs by positive comments.
Number of Negative Comments on Individual Designs by Themes
Themes Negative Comments on Individual Designs
General Comments Total
1 Visual attractiveness B (2252) C (1714) A (1267) D (1150) G (40) 6423
2 Green features and environmental friendliness D (439) B (313) C (192) A (189) G (51) 1184
3 Image befitting the Central Government Complex and the LegCo Complex C (291) D (228) B (207) A (162) G (19) 907
4 Comments on certain unique features D (339) C (232) A (124) B (50) G (10) 755
5 Public open space D (159) A (150) B (116) C (90) G (34) 549
6 Impact on cityscape and waterfront environment D (260) C (155) A (97) B (33) G (2) 547
7 Overall preference B (173) C (159) D (97) A (79) G (1) 509
8 Symbol of HK as Asia's world city B (131) A (109) D (108) C (88) G (15) 451
9 Cost factor A (65) D (41) C (32) B (14) G (5) 157
10 Connectivity of the Tamar site and surrounding areas D (36) B (18) C (17) A (16) G (6) 93
11 Feng Shui concerns A (38) C (15) B (10) D (9) G (1) 73
Based also on the above data, it can be concluded that Design B leads in the respondents’ negative comments (3317), followed by Design C (2985), Design D (2866) and Design A (2296). Among the themes of most concern to the general public, Design D received most negative comments on five themes, followed by Design B (3 out of 11), Design A (2 out of 11) and Design C (1 out of 11).
ANALYSIS OF THE KEY POINTS AND METHODOLOLGICAL CONSIDERATIONS Generally speaking, since data from Telephone Polls (1) reflect the opinion of the general public, (2) are collected in an unbiased manner, and (3) can be demonstrated to be statistically reliable and valid, it is often argued that greater weight should be assigned to them. Moreover, from a public policy perspective, opinions of the general public deserve the utmost attention. On the other hand, members of the public are passive respondents and often not well informed about the issues involved. In this particular instance, more than three quarters of the Telephone Poll respondents did not know the exact number of design proposals being considered, and less than 2% had studied all of the relevant materials. Hence, their opinions must also be viewed in this light. Furthermore, there are serious limitations as to what can be asked in a telephone interview.
13

Executive Summary
The opinions of interested citizens, who took the time and effort to gain an understanding of the issues and took the trouble to proactively submit their views, deserve special attention. The data from Comment Cards and Written Submissions capture the opinions of this group. The collection process, however, is susceptible to manipulation. Returns of this nature can easily be orchestrated or even created by interested parties. Furthermore, statistical reliability or validity cannot be demonstrated from data collected through such a process. Exit Polls selected over 5,000 respondents on a randomised basis, and all of the respondents had the benefit of having seen the exhibition materials immediately before answering the questions. The time and date of the Exit Polls were not announced in advance, and hence, it would be difficult for interested parties to manipulate the exercise. It is, therefore, reasonable to give greater weighting to the Exit Poll data.
For the Telephone Poll respondents, the effective sample size for the questions regarding the Designs ranges from 328 to 369 and the remainder (over 2,600) gave “not sure/don’t remember” answer to those questions. The passage of time and the fact that the majority of the respondents gained knowledge about the project from the media only might also have affected the reliability of the responses of those who answered the question. It must be pointed out that, unlike the Exit Polls and Telephone Polls in which subjects were selected in a randomised manner, frequency counts and percentages from Comment Cards and Written Submissions must be interpreted with great caution, as no statistical inferences can be made with this data. A high percentage of opinion in favour or against a certain design from these sources does not necessarily suggest that a similar high percentage exists in the general population. To claim that a similar percentage exists in the general population on the basis of this data would normally require the convergence of at least one other set of such data. Key points with the following characteristics are given special consideration: • High frequency count/high percentage/high mean score from Exit Poll and
Telephone Poll responses;
• High frequency count/high percentage/high mean score from responses from close-ended questions on Comment Cards; and
• High frequency count and high percentage in terms of number of text units from Qualitative Data from Comment Cards and Written Submissions.
ISSUES OF GREATEST CONCERN Qualitative Analysis of text data indicates that the “Visual Attractiveness” theme is of the greatest concern, with a total of over 10,000 text units of comments, followed by the “Green Features and Environmental Friendliness” theme with over 3,000 text units of comments. In contrast, the “Connectivity of the Tamar Site to Surrounding Areas” theme received only around 300 text units of comments. The rest of the four themes received between roughly 1,000 to 2,000 text units of comments. It would be
14

Executive Summary
reasonable to give a higher weighting to the “Visual Attractiveness” theme, and, to a lesser extent, the “Green Features and Environmental Friendliness” theme.
Even though the Comment Card does not contain any question on the overall rating of the designs, there were more than 2,000 text units of comments regarding respondents’ overall preference, making this theme rank third in terms of frequency count of comments. Categories (under the various themes) receiving over 400 comments in text units include:
Design aesthetics (4,572 text units) Overall preference (2,403 text units) Iconic landmark (2,130 text units) Originality and “copycat” concerns (1,558 text units) Presence of trees, plants, lawns: size and design (1,495 text units) Comments on certain unique features (1,455 text units) Scale and proportion (1,423 text units) Reflection on the distinct identities and roles of Government headquarters (994
text units) Reflection on Hong Kong as a cosmopolitan, dynamic and contemporary city (746
text units) Impact on the cityscape and neighbouring buildings (736 text units) Landscaping design (632 text units) Air flow around the area (577 text units) Identity of Hong Kong's uniqueness and its history (559 text units) Relationship between attractiveness and functionality (543 text units) Avant-garde and post-modern feel (492 text units) Meeting the needs of the public (448 text units) Environmental friendliness (435 text units)
THE FOUR DESIGNS
On the basis of the Quantitative Data Analysis, Design D leads in three data sets (responses to close-ended questions of Comment Cards, Exit Polls, and Telephone Polls). Designs D and A appear to be more popular than Designs C and B on almost all of the selected attributes. The overall rank order of the designs from the collected Comment Cards (responses to close-ended questions) is: D, A, C, B. This rank order is corroborated by the Exit Polls (D, A, C, B). The overall rank order of the designs from the Telephone Polls is: D, B, A / C. In terms of Exit Poll results, the total mean scores of Designs A, B, C, D are respectively 8.42, 6.73, 6.99 and 8.66. Design D is ahead of Design A by 1.41%. If more weight is given to the Exit Polls because of the reasons mentioned on p.13 and 14, Design D is the preferred scheme. If “Visual Attractiveness” is given more weight in the results of the collected Comment Cards, the Exit Polls and the Telephone Polls due to the intensity of public views, Design D is still preferred.
15

Executive Summary
16
It should be pointed out that the total mean score from the Comment Cards for Design A is 20.53 and for Design D is 20.80, and that the difference is 0.27, which is less than one percentage point. The lead of Design D over Design A should therefore be considered marginal. When Qualitative Data are taken into consideration, the preferred scheme is not so straight-forward. Design A and Design D received respectively 3,404 and 3,366 positive comments. The difference is 38 comments or less than 1%. Hence Design A is marginally ahead of Design D in terms of positive comments. Design D and Design A received respectively 2,866 and 2,296 negative comments. The difference is 570 comments. Design D is 11% ahead of Design A in terms of negative comments. From the Qualitative Data, when both positive and negative comments are taken into consideration, Design A appears to be preferred over Design D. While the results of the Quantitative and Qualitative Data Analyses do not converge, Design D is ahead of Design A on the first three of the five data sets (responses to close-ended questions of Comment Cards, Exit Polls, Telephone Polls, Positive Written Comments, and Negative Written Comments).
SUMMARY OF FINDINGS AND CONCLUSIONS This Consultancy shows that the interest level of the public on the project is high, judging from the number of visitors to the exhibition, to the website, the number of Comment Cards received, and the results of the Telephone Polls. The greatest concern the public has regarding the design proposals relate to “Visual Attractiveness” and “Green Features and Environmental Friendliness”, and many are keen to provide their opinions on which design is preferred. The following Table summarises the results of the various data sets.
Comment Cards (responses to close-end questions)
Exit Polls Phone Polls Positive Written Comment Counts
Negative Written Comment Counts*
D, A, C, B D, A, C, B D, B, A / C# A, D, B, C B, C, D, A *The number of negative comment counts is arranged in a descending order. # Design A and Design C are tied in rank order.
Taking into account the various sources of Quantitative and Qualitative Data, their limitations, and the greater weighting which can arguably be given to Exit Polls, it can be concluded that Design D is narrowly ahead of Design A, with Design C and Design B lagging behind by a substantial margin.

Annex B

Annex C


Annex D


Annex E

公眾穿梭草坡上
往海濱長廊
往金鐘
從草坡到立法會綜合大樓(低座)
Pedestrian Circulation 行人網絡
從草坡到政府總部辦公大樓
從草坡到政府總部
從草坡到立法會綜合大樓(高座)
to LegCo Complex
從草坡到政府總部(低座)