cba annual report 2019 - commbank
TRANSCRIPT

Financial report
109

112
113
114
Strategic Financial Risk Corporate Directors’ Financial Other report performance management governance report report information
Contents
Contents
Income statements
Statements of comprehensive income
Balance sheets
Statements of changes in equity
Statements of cash fows
Notes to the fnancial statements
1. Overview 1.1 General information, basis of accounting, changes in accounting policies 119
2. Our performance 2.1 Net interest income 130
2.2 Average balances and related interest 132
2.3 Other operating income 137
2.4 Operating expenses 139
2.5 Income tax expense 141
2.6 Earnings per share 144
2.7 Financial reporting by segments 145
3. Our lending activities 3.1 Loans, bills discounted and other receivables 149
3.2 Provisions for impairment 153
4. Our deposits and funding activities 4.1 Deposits and other public borrowings 160
4.2 Liabilities at fair value through income statement 161
4.3 Debt issues 162
4.4 Securitisation, covered bonds and transferred assets 164
5. Our investing, trading and other banking activities 5.1 Cash and liquid assets 166
5.2 Assets at fair value through income statement 167
5.3 Derivative fnancial instruments and hedge accounting 168
5.4 Investment securities 179
6. Other assets 6.1 Intangible assets 181
6.2 Other assets 184
7. Other liabilities 7.1 Other provisions 185
7.2 Bills payable and other liabilities 190
110 Commonwealth Bank of Australia Annual Report 2019
115
117
119
119
130
149
160
166
181
185

191 8. Our capital, equity and reserves 8.1 Capital adequacy 191
8.2 Loan capital 192
8.3 Shareholders’ equity 194
8.4 Dividends 199
9. Risk management 9.1 Risk management framework 202
9.2 Credit risk 205
9.3 Market risk 226
9.4 Liquidity and funding risk 228
9.5 Disclosures about fair values 232
9.6 Collateral arrangements 241
9.7 Offsetting fnancial assets and fnancial liabilities 242
10. Employee benefts 10.1 Share-based payments
10.2 Retirement beneft obligations 248
10.3 Key management personnel
11. Group structure 11.1 Investments in subsidiaries and other entities 253
11.2 Related party disclosures
11.3 Discontinued operations
12. Other 264 12.1 Contingent liabilities, contingent assets and commitments arising from the banking business 264
12.2 Lease commitments
12.3 Notes to the statements of cash fows
12.4 Remuneration of auditors
12.5 Future accounting developments
12.6 Accounting policies applicable for comparative periods
12.7 Subsequent events
Directors’ declaration
Independent auditor’s report
Other information
201
246 246
251
253
259
260
265
266
267
268
269
271
272
273
285
111

Strategic Financial Risk Corporate Directors’ Financial Other report performance management governance report report information
Income statements
For the year ended 30 June 2019
Group (1) (2) (3) Bank (2) (3)
30 Jun 19 30 Jun 18 30 Jun 17 30 Jun 19 30 Jun 18Note $M $M $M $M $M
Interest income:
Effective interest income 2.1 34,089 33,643 32,705 32,960 32,531
Other 2.1 499 501 490 499 465
Interest expense 2.1 (16,468) (15,802) (15,649) (17,405) (16,585)
Net interest income 18,120 18,342 17,546 16,054 16,411
Other banking income 2.3 4,994 5,423 5,721 6,044 7,365
Net banking operating income 23,114 23,765 23,267 22,098 23,776
Net funds management operating income 2.3 1,073 1,124 1,038 - -
Net insurance operating income 2.3 150 241 178 - -Total net operating income before impairment and operating expenses 24,337 25,130 24,483 22,098 23,776
Loan impairment expense 3.2 (1,201) (1,079) (1,095) (1,058) (963)
Operating expenses 2.4 (11,373) (11,029) (10,133) (10,633) (10,703)
Net profit before income tax 11,763 13,022 13,255 10,407 12,110
Income tax expense 2.5 (3,391) (3,952) (3,784) (2,624) (3,235)
Net profit after income tax from continuing operations 8,372 9,070 9,471 7,783 8,875
Non-controlling interests in net profit after income tax from continuing operations (12) (13) (13) - -
Net profit attributable to equity holders of the Bank from continuing operations 8,360 9,057 9,458 7,783 8,875
Net profit after tax from discontinued operations 218 278 481 - -Non-controlling interests in net profit after income tax from discontinued operations (7) (6) (11) - -
Net profit attributable to equity holders of the Bank 8,571 9,329 9,928 7,783 8,875
The above Income Statements should be read in conjunction with the accompanying notes.
Earnings per share for profit attributable to equity holders of the Bank during the year:
30 Jun 19 30 Jun 18 30 Jun 17
Basic 473. 7 518. 8 549. 9
Diluted 457. 5 503. 2 532. 9
Earnings per share:
Basic 485. 6 534. 3 577. 3
Diluted 468. 6 517. 7 558. 8
Earnings per share from continuing operations: (1)
Cents per share
Group
(1) Information has been restated and presented on a continuing operations basis. For details on the Group’s discontinued operations refer to Note 11.3. (2) Comparative information has been restated to conform to presentation in the current year. (3) Current year amounts reflect the adoption of AASB 9 ‘Financial Instruments’ and AASB 15 ‘Revenue from contracts with customers’ on 1 July 2018. As permitted by
AASB 9 and AASB 15 comparative information has not been restated. For details on the adoption of AASB 9 and AASB 15 refer to Note 1.1.
112 Commonwealth Bank of Australia Annual Report 2019

For the year ended 30 June 2019
Group (1) (2) Bank (2)
30 Jun 19 30 Jun 18 30 Jun 17 30 Jun 19 30 Jun 18$M $M $M $M $M
Net profit after income tax for the period from continuing operations 8,372 9,070 9,471 7,783 8,875
Other comprehensive income/(expense):
Items that may be reclassified subsequently to profit/(loss):
Foreign currency translation reserve net of tax 457 (12) (256) 214 53
Gains/(losses) on cash flow hedging instruments net of tax 947 (53) (577) 1,003 4Gains/(losses) on debt investment securities at fair value through other comprehensive income net of tax 103 - - (5) -
Losses on available-for-sale investments net of tax - (68) (52) - (34)
Total of items that may be reclassified 1,507 (133) (885) 1,212 23
Items that will not be reclassified to profit/(loss):Actuarial (losses)/gains from defined benefit superannuation plans net of tax (49) 161 175 (50) 159
Losses on liabilities at fair value due to changes in own credit risk net of tax - (2) (3) - (2)
Losses on equity investment securities at fair value through other comprehensive income net of tax (6) - - (1) -
Revaluation of properties net of tax 34 31 23 33 29
Total of items that will not be reclassified (21) 190 195 (18) 186
Other comprehensive income/(expense) net of income tax from continuing operations 1,486 57 (690) 1,194 209
Total comprehensive income for the period from continuing operations 9,858 9,127 8,781 8,977 9,084
Net profit after income tax for the period from discontinued operations 218 278 481 - -
Other comprehensive income/(expense) for the period from discontinued operations net of income tax (3) 14 (6) (29) - -
Total comprehensive income for the period 10,090 9,399 9,233 8,977 9,084
Total comprehensive income for the period is attributable to:
Equity holders of the Bank 10,071 9,380 9,209 8,977 9,084
Non-controlling interests 19 19 24 - -
Total comprehensive income net of tax 10,090 9,399 9,233 8,977 9,084
(1) Information has been restated and presented on a continuing operations basis. For details on the Group’s discontinued operations refer to Note 11.3. (2) Current year amounts reflect the adoption of AASB 9 ‘Financial Instruments’ and AASB 15 ‘Revenue from contracts with customers’ on 1 July 2018. As permitted by
AASB 9 and AASB 15 comparative information has not been restated. For details on the adoption of AASB 9 and AASB 15 refer to Note 1.1. (3) Includes $7 million gain on foreign currency translation net of tax (30 June 2018: $3 million gain; 30 June 2017: $29 million loss) and $7 million gain on revaluation of
debt investment securities measured at fair value through other comprehensive income net of tax. The year ended 30 June 2018 includes $9 million loss on revaluation of available-for-sale investments net of tax.
The above Statements of Comprehensive Income should be read in conjunction with the accompanying notes.
30 Jun 19 30 Jun 18 30 Jun 17Note
Ordinary shares 8.4 431 431 429
Dividends per share attributable to shareholders of the Bank:Cents per share
Group
113

Strategic Financial Risk Corporate Directors’ Financial Other report performance management governance report report information
Balance sheets
As at 30 June 2019
Group (1) (2) (3) Bank (1) (3)
30 Jun 19 30 Jun 18 30 Jun 19 30 Jun 18Assets Note $M $M $M $M Cash and liquid assets 5.1 29,387 36,417 26,912 33,581Receivables due from other financial institutions 8,093 9,222 7,334 8,376Assets at fair value through Income Statement:
Trading 5.2 32,506 32,254 32,476 29,993Insurance 5.2 - 372 - -Other 5.2 1,171 258 652 -
Derivative assets 5.3 25,215 32,133 24,311 30,885Investment securities: At amortised cost 5.4 7,355 - 7,349 - At fair value through other comprehensive income 5.4 78,912 - 73,212 -Available-for-sale investments 5.4 - 82,240 - 77,731Loans, bills discounted and other receivables 3.1 755,141 743,365 660,476 656,650Bank acceptances of customers 32 379 32 379Shares in and loans to controlled entities 11.2 - - 120,193 118,252Property, plant and equipment 2,383 2,576 1,389 1,460Investments in associates and joint ventures 11.1 3,001 2,842 1,017 1,118Intangible assets 6.1 7,965 9,090 4,317 4,466Deferred tax assets 2.5 1,675 1,439 1,570 1,430Other assets 6.2 7,115 6,924 5,910 6,212Assets held for sale 11.3 16,551 15,654 1 19Total assets 976,502 975,165 967,151 970,552
LiabilitiesDeposits and other public borrowings 4.1 636,040 622,234 573,851 566,200Payables due to other financial institutions 23,370 20,899 22,618 20,014Liabilities at fair value through Income Statement 4.2 8,520 10,247 7,961 9,106Derivative liabilities 5.3 22,777 28,472 26,654 30,871Bank acceptances 32 379 32 379Due to controlled entities - - 105,774 105,327Current tax liabilities 326 952 129 796Other provisions 7.1 2,751 1,860 2,337 1,561Insurance policy liabilities - 451 - -Debt issues 4.3 163,990 172,294 131,062 139,984Bills payable and other liabilities 7.2 10,285 11,625 9,040 10,145Liabilities held for sale 11.3 15,796 14,900 - -
883,887 884,313 879,458 884,383Loan capital 8.2 22,966 22,992 22,569 22,249Total liabilities 906,853 907,305 902,027 906,632Net assets 69,649 67,860 65,124 63,920
Shareholders' EquityOrdinary share capital 8.3 38,020 37,270 38,212 37,533Reserves 8.3 3,092 1,676 3,813 2,568Retained profits 8.3 28,482 28,360 23,099 23,819
Shareholders' Equity attributable to equity holders of the Bank 69,594 67,306 65,124 63,920
Non-controlling interests 11.1 55 554 - -Total Shareholders' Equity 69,649 67,860 65,124 63,920
(1) Comparative information has been restated to conform to presentation in the current year. (2) Current year balances have been impacted by the announced sale of CFSGAM, PT Commonwealth Life, Count Financial and completed sales of Sovereign and
TymeDigital SA. For details on the Group’s discontinued operations, refer to Note 11.3. (3) Current year balances reflect the adoption of AASB 9 ‘Financial Instruments’ and AASB 15 ‘Revenue from contracts with customers’ on 1 July 2018. As permitted by
AASB 9 and AASB 15 comparative information has not been restated. For details on the adoption of AASB 9 and AASB 15 refer to Note 1.1.
The above Balance Sheets should be read in conjunction with the accompanying notes.
114 Commonwealth Bank of Australia Annual Report 2019

For the year ended 30 June 2019
GroupOrdinary Non- Total
share Retained controlling Shareholders'capital Reserves profits Total interests Equity
$M $M $M $M $M $MAs at 30 June 2017 34,971 1,869 26,274 63,114 546 63,660Net profit after income tax from continuing operations (1) - - 9,057 9,057 13 9,070Net profit after income tax from discontinued operations (1) - - 272 272 6 278Net other comprehensive income from continuing operations (1) - (102) 159 57 - 57Net other comprehensive income from discontinued operations (1) - (6) - (6) - (6)Total comprehensive income for the period - (108) 9,488 9,380 19 9,399
Dividends paid on ordinary shares - - (7,484) (7,484) - (7,484)Dividend reinvestment plan (net of issue costs) 2,105 - - 2,105 - 2,105
Issue of shares (net of issue costs) 164 - - 164 - 164Share-based payments - (19) - (19) - (19)Purchase of treasury shares (95) - - (95) - (95)Sale and vesting of treasury shares 125 - - 125 - 125
Other changes - (66) 82 16 (11) 5As at 30 June 2018 37,270 1,676 28,360 67,306 554 67,860Change on adoption of new accounting standards (3) - - (955) (955) - (955)
Restated opening balance 37,270 1,676 27,405 66,351 554 66,905Net profit after income tax from continuing operations - - 8,360 8,360 12 8,372
Net profit after income tax from discontinued operations - - 211 211 7 218
Net other comprehensive income from continuing operations - 1,535 (49) 1,486 - 1,486
Net other comprehensive income from discontinued operations - 14 - 14 - 14
Total comprehensive income for the period - 1,549 8,522 10,071 19 10,090Transactions with Equity holders in their capacity as Equity holders: (2)
Dividends paid on ordinary shares - - (7,606) (7,606) - (7,606)Dividend reinvestment plan (net of issue costs) 748 - - 748 - 748
Issue of shares (net of issue costs) - - - - - -Share-based payments - 16 - 16 - 16Purchase of treasury shares (93) - - (93) - (93)Sale and vesting of treasury shares 95 - - 95 - 95
Other changes - (149) 161 12 (518) (506)As at 30 June 2019 38,020 3,092 28,482 69,594 55 69,649
Transactions with Equity holders in their capacity as Equity holders: (2)
(1) Information has been restated to reflect reclassification of CFSGAM and PT Commonwealth Life as discontinued operations during the current year. (2) Current year and prior year include discontinued operations. (3) The Group adopted AASB 9 ‘Financial Instruments’ and AASB 15 ‘Revenue from contracts with customers’ on 1 July 2018. The carrying amounts of assets and
liabilities impacted by the adoption were adjusted through opening retained profits and reserves on 1 July 2018 as if the Group has always applied the new requirements. As permitted by AASB 9 and AASB 15, comparative information has not been restated. For details on the adoption of AASB 9 and AASB 15, refer to Note 1.1.
The above Statements of Changes in Equity should be read in conjunction with the accompanying notes.
115

Strategic Financial Risk Corporate Directors’ Financial Other report performance management governance report report information
Statements of changes in equity
For the year ended 30 June 2019
BankOrdinary Total
share Retained Shareholders'capital Reserves profits Equity
$M $M $M $MAs at 30 June 2017 35,262 2,556 22,256 60,074
Net profit after income tax from continuing operations - - 8,875 8,875
Net other comprehensive income from continuing operations - 52 157 209
- 52 9,032 9,084
Dividends paid on ordinary shares - - (7,484) (7,484)
2,107 - - 2,107
Issue of shares (net of issue costs) 164 - - 164
Share-based payments - (25) - (25)
Other changes - (15) 15 -
As at 30 June 2018 37,533 2,568 23,819 63,920
- - (868) (868)
Restated opening balance 37,533 2,568 22,951 63,052
- - 7,783 7,783
- 1,244 (50) 1,194
Total comprehensive income for the period - 1,244 7,733 8,977
Dividends paid on ordinary shares - - (7,606) (7,606)
Dividend reinvestment plan (net of issue costs) 748 - - 748
Issue of shares (net of issue costs) - - - -
Share-based payments - 22 - 22
Purchase of treasury shares (69) - - (69)
Other changes - (21) 21 -
As at 30 June 2019 38,212 3,813 23,099 65,124
Net other comprehensive income from continuing operations
Transactions with Equity holders in their capacity as Equity holders:
Dividend reinvestment plan (net of issue costs)
Total comprehensive income for the period
Net profit after income tax from continuing operations
Transactions with Equity holders in their capacity as Equity holders:
Change on adoption of new accounting standards (1)
(1) The Bank adopted AASB 9 ‘Financial Instruments’ and AASB 15 ‘Revenue from contracts with customers’ on 1 July 2018. The carrying amounts of assets and liabilities impacted by the adoption were adjusted through opening retained profits and reserves on 1 July 2018 as if the Bank has always applied the new requirements. As permitted by AASB 9 and AASB 15, comparative information has not been restated. For details on the adoption of AASB 9 and AASB 15 refer to Note 1.1.
The above Statements of Changes in Equity should be read in conjunction with the accompanying notes.
116 Commonwealth Bank of Australia Annual Report 2019

For the year ended 30 June 2019
Group (1) (2) Bank (1) (2)
30 Jun 19 30 Jun 18 30 Jun 17 30 Jun 19 30 Jun 18Note $M $M $M $M $M
Cash flows from operating activitiesInterest received 34,757 35,801 33,536 32,366 34,679Interest paid (15,695) (15,356) (15,006) (16,743) (16,100)Other operating income received 5,808 6,181 5,556 3,971 4,217Expenses paid (10,784) (10,340) (9,763) (9,693) (8,739)Income taxes paid (4,878) (4,791) (3,976) (4,453) (3,892)Net inflows from assets at fair value through Income Statement (excluding life insurance) 2,482 5,270 4,220 6,915 7,185
Net inflows/(outflows) from liabilities at fair value through Income Statement:
Insurance:Investment income 340 225 186 - -
Premiums received (3) 2,414 3,241 3,366 - -
Policy payments and commission expense (3) (3,061) (3,453) (3,854) - -Other liabilities at fair value through Income Statement 126 (208) 156 (410) 12Cash flows from operating activities before changes in operating assets and liabilities 11,509 16,570 14,421 11,953 17,362
Changes in operating assets and liabilities arising from cash flow movementsMovement in investment securities:
Purchases (41,925) - - (39,020) -Proceeds 43,239 - - 39,556 -
Movement in available-for-sale investments:Purchases - (51,783) (54,608) - (50,501)Proceeds - 52,832 49,392 - 51,673
Net increase in loans, bills discounted and other receivables (9,465) (16,105) (38,744) (4,585) (10,420)Net decrease in receivables due from other financial institutions and regulatory authorities 1,345 884 1,100 1,210 583
Net decrease/(increase) in securities purchased under agreements to resell 930 9,258 (13,993) 933 9,723
Insurance business:Purchase of insurance assets at fair value through Income Statement (1,383) (1,594) (1,789) - -
Proceeds from sale/maturity of insurance assets at fair value through Income Statement 2,512 2,671 3,152 - -
Net decrease/(increase) in other assets 525 (11) (174) 524 (35)Net increase/(decrease) in deposits and other public borrowings 4,891 (876) 39,821 1,949 (4,984)Net increase/(decrease) in payables due to other financial institutions 2,154 (8,279) 666 2,319 (8,451)
Net increase/(decrease) in securities sold under agreements to repurchase 4,402 (1,574) (853) 4,408 (1,695)
Net (decrease)/increase in other liabilities (648) (884) 802 (137) (1,664)Changes in operating assets and liabilities arising from cash flow movements 6,577 (15,461) (15,228) 7,157 (15,771)
Net cash provided by/(used in) operating activities 12.3 (a) 18,086 1,109 (807) 19,110 1,591
(1) It should be noted that the Group does not use these accounting Statements of Cash Flows in the internal management of its liquidity positions. (2) Includes discontinued operations. For the cash flows from discontinued operations refer to Note 11.3. (3) Represents gross premiums and policy payments before splitting between policyholders and shareholders.
117

Strategic Financial Risk Corporate Directors’ Financial Other report performance management governance report report information
Statements of cash flows
For the year ended 30 June 2019
Group (1) (2) Bank (1) (2)
30 Jun 19 30 Jun 18 30 Jun 17 30 Jun 19 30 Jun 18Note $M $M $M $M $M
Cash flows from investing activities
Cash inflows/(outflows) from acquisitions - 26 (31) - -Net proceeds from disposal of entities and businesses (net of cash disposals) 1,259 - 1 - -
Dividends received 141 68 94 1,473 2,085
Net amounts received from controlled entities (3) - - - (1,906) (2,993)
151 155 381 89 42
Purchases of property, plant and equipment (326) (477) (602) (271) (321)Net cash flows from sales/(acquisitions) of associates/joint ventures 72 (271) (25) 29 -
Net purchase of intangible assets (314) (503) (495) (597) (405)
Net cash (used in)/provided by investing activities 983 (1,002) (677) (1,183) (1,592)
Cash flows from financing activities
(6,853) (5,366) (6,084) (6,853) (5,364)
Redemption of other equity instruments (net of costs) (505) - - - -
Proceeds from issuance of debt securities 56,448 68,273 94,560 46,685 57,708
Redemption of issued debt securities (73,747) (67,809) (81,758) (63,343) (56,692)
Purchase of treasury shares (93) (95) (92) (69) -
Sale of treasury shares 22 55 34 - -
Issue of loan capital 1,579 4,445 3,757 1,571 4,436
Redemption of loan capital (2,637) (464) - (2,263) (467)
Proceeds from issuance of shares (net of issue costs) - - (6) - -
Other 47 27 61 (70) 36
Net cash (used in)/provided by financing activities (25,739) (934) 10,472 (24,342) (343)
Net (decrease)/increase in cash and cash equivalents (6,670) (827) 8,988 (6,415) (344)
675 715 (318) 598 746
Cash and cash equivalents at beginning of year 23,005 23,117 14,447 21,351 20,949
Cash and cash equivalents at end of year 12.3 (b) 17,010 23,005 23,117 15,534 21,351
Effect of foreign exchange rates on cash and cash equivalents
Dividends paid (excluding Dividend Reinvestment Plan)
Proceeds from sale of property, plant and equipment
(1) It should be noted that the Group does not use these accounting Statements of Cash Flows in the internal management of its liquidity positions. (2) Includes discontinued operations. For the cash flows from discontinued operations refer to Note 11.3. (3) Amounts received from and paid to controlled entities are presented in line with how they are managed and settled.
The above Statements of Cash Flows should be read in conjunction with the accompanying notes.
118 Commonwealth Bank of Australia Annual Report 2019

General information
The Financial Report of the Commonwealth Bank of Australia (the Bank) and the Bank and its subsidiaries (the Group) for the year ended 30 June 2019, was approved and authorised for issue by the Board of Directors on 7 August 2019. The Directors have the power to amend and reissue the Financial Statements.
The Bank is a for-profit entity incorporated and domiciled in Australia. It is a company limited by shares that are publicly traded on the Australian Securities Exchange. The registered office is Ground Floor, Tower 1, 201 Sussex Street, Sydney, NSW 2000, Australia.
The Financial Report includes the consolidated and standalone financial statements of the Group and the Bank, respectively. Notes accompanying the Financial Statements and the Independent Auditor’s Report form part of the Financial Report.
On 21 September 2017, the Group entered into an agreement to sell 100% of its life insurance businesses in Australia (CommInsure Life) and New Zealand (Sovereign) to AIA Group Limited (AIA). The sale of Sovereign completed on 2 July 2018. The sale of CommInsure Life remains subject to completion of the transfer of the Group’s stake in BoCommLife Insurance Company Limited (BoCommLife) out of CommInsure Life and its associated Chinese regulatory approvals.
The Group and AIA remain fully committed to completing the CommInsure Life transaction. The Group and AIA are also well progressed in exploring an alternative path to complete the CommInsure Life transaction prior to the transfer of the Group’s stake in BoCommLife. The alternative path is expected to be subject only to Australian regulatory approvals. The Group expects to be able to provide further details of this alternative path by the end of the first quarter of the financial year 2020, if the sale of BoCommLife has not substantially progressed in that timeframe.
On 23 May 2018, the Group announced the sale of its 37.5% equity interest in BoCommLife to Mitsui Sumitomo Insurance Co. Ltd (MSI). The sale of BoCommLife is subject to Chinese regulatory approvals and is the final condition precedent for the sale of CommInsure Life. The sale of BoCommLife is expected to be completed in the second half of the calendar year 2019.
On 25 June 2018, the Group announced its intention to demerge its wealth management and mortgage broking businesses, and undertake a strategic review of its general insurance business, including a potential sale. On 14 March 2019, the Group announced suspension of its preparation for the demerger in order to focus on the implementation of Royal Commission recommendations, refunding customers and remediating past issues.
On 23 October 2018, the Group announced the sale of its 80% interest in its Indonesian life insurance business, PT Commonwealth Life (PTCL), to FWD Group (FWD). As part of the sale, CBA’s Indonesian banking subsidiary, PT Bank Commonwealth (PTBC), will enter into a 15 year life insurance distribution partnership with FWD. The sale is subject to regulatory approvals in Indonesia and is now expected to complete in the second half of calendar year 2019.
On 31 October 2018, the Group announced the sale of Colonial First State Global Asset Management (CFSGAM) to Mitsubishi UFJ Trust and Banking Corporation (MUTB). The sale completed on 2 August 2019.
On 1 November 2018, the Group completed the sale of Commonwealth Bank of South Africa (Holding Company) Limited (TymeDigital SA) to the minority shareholder, African Rainbow Capital (ARC).
On 13 June 2019, the Group announced the sale of its 100% interest in Count Financial Limited (Count Financial) to CountPlus Limited (CountPlus). Completion is expected to occur in October 2019.
CommInsure Life, Sovereign, BoCommLife, CFSGAM, PTCL and TymeDigital SA have been classified as discontinued operations in the Group’s financial statements for the year ended 30 June 2019. The assets and liabilities of Count Financial are classified as held for sale as at 30 June 2019.
There have been no other significant changes in the nature of the principal activities of the Group during the year.
Basis of accounting
The Financial Report: is a general purpose financial report; has been prepared in accordance with the Australian
Accounting interpretations adopted by the Australian Accounting Standards Board (AASB) and International Financial Reporting Standards (IFRSs) as issued by the International Accounting Standards Board;
has been prepared in accordance with the requirements of the Corporations Act 2001 (Cth);
is presented in Australian dollars, which is the Bank’s functional and presentation currency, with all values rounded to the nearest million dollars ($M) in accordance with ASIC Corporations Instrument 2016/191 unless otherwise indicated;
includes foreign currency transactions that are translated into the functional currency, using the exchange rates prevailing at the date of each transaction;
has been prepared on a going concern basis using a historical cost basis, except for certain assets and liabilities (including derivative instruments) measured at fair value;
presents assets and liabilities on the face of the Balance Sheets in decreasing order of liquidity;
where required, presents restated comparative information for consistency with the current year’s presentation in the Financial Report;
contains accounting policies that have been consistently applied to all periods presented, unless otherwise stated.
119

Strategic Financial Risk Corporate Directors’ Financial Other report performance management governance report report information
Notes to the financial statements
Change in comparatives
Discontinued operations
The financial results of businesses reclassified as discontinued operations are excluded from the results of the continuing operations and are presented as a single line item ‘Net profit/(loss) after tax from discontinued operations’ in the Income Statement, and ‘Other comprehensive income/(expense) from discontinued operations’ in the Statement of Comprehensive Income.
The Income Statements and Statements of Comprehensive Income for comparative periods are also restated. Assets and liabilities of discontinued operations subject to disposal have been presented on the Balance Sheet separately as assets and liabilities held for sale. The Balance Sheet is not restated when a business is reclassified as a discontinued operation.
Re-segmentation
In line with the Group’s commitment to becoming a simpler, better bank, a number of changes to the Group’s operating model have been made during the year:
The General Insurance business has been placed under strategic review and moved to be part of Retail Banking Services, while the review is underway;
The Small Business banking segment has been transferred out of Retail Banking Services to Business and Private Banking in order to consolidate the Group’s business banking operations; and
Bankwest and Commonwealth Financial Planning have been consolidated into Retail Banking Services, aligning all retail businesses within one division.
The comparative information has been restated.
Change in accounting policies
AASB 9 ‘Financial Instruments’ The Group adopted AASB 9 Classification and Measurement, and Impairment requirements and amendments in AASB 2017-6 related to prepayment features on 1 July 2018. The Group has elected an accounting policy choice in AASB 9 to retain AASB 139 hedge accounting requirements. The Group can commence applying AASB 9 hedging at the beginning of any future reporting period.
AASB 9 Classification and Measurement and Impairment requirements have been applied on a retrospective basis. The Group has adjusted the carrying amounts of financial instruments impacted by the adoption of AASB 9 through opening retained profits and reserves on 1 July 2018 as if it has always applied the new requirements. As permitted by AASB 9, the Group has not restated the comparative period financial statements.
The key changes to the Group’s accounting policies and resultant impacts from the adoption of AASB 9 are described below.
Impairment AASB 9 introduced an expected credit loss (ECL) impairment model which differs significantly from the incurred loss approach under AASB 139. The ECL model is forward looking and does not require evidence of an actual loss event for impairment provisions to be recognised.
The implementation of AASB 9 required management to make a number of judgements and assumptions and has had a significant
impact on the Group’s impairment provisioning methodology. A description of the key components of the Group’s AASB 9 impairment methodology is provided below.
Expected credit loss (ECL) model The ECL model applies to all financial assets measured at amortised cost, debt securities measured at fair value through other comprehensive income, lease receivables, loan commitments and financial guarantee contracts not measured at fair value through profit or loss (FVTPL). The model uses a three-stage approach to recognition of expected credit losses. Financial assets migrate through these stages based on changes in credit risk since origination:
Stage 1 – 12 months ECL – Performing loans On origination, financial assets recognise an impairment provision equivalent to 12 months ECL. 12 months ECL is the credit losses expected to arise from defaults occurring over the next 12 months.
Stage 2 – Lifetime ECL – Performing loans that have experienced a significant increase in credit risk (SICR) Financial assets that have experienced a SICR since origination are transferred to Stage 2 and recognise an impairment provision equivalent to lifetime ECL. Lifetime ECL is the credit losses expected to arise from defaults occurring over the remaining life of financial assets. If credit quality improves in a subsequent period such that the increase in credit risk since origination is no longer considered significant the exposure is reclassified to Stage 1 and the impairment provision reverts to 12 months ECL.
Stage 3 – Lifetime ECL – Non-performing Loans Financial assets in default recognise a provision equivalent to lifetime ECL. This includes assets that are considered credit impaired as well as assets that are considered to be in default but are not credit impaired.
Credit losses for financial assets in Stage 1 and Stage 2 are assessed for impairment collectively, whilst those in Stage 3 are subjected to either collective or individual assessment of expected credit losses.
Interest revenue is recognised on gross carrying amounts for financial assets in Stage 1 and Stage 2, and gross carrying value net of impairment provisions for financial assets in Stage 3.
Significant increase in credit risk (SICR) SICR is assessed by comparing the risk of default occurring over the expected life of the financial asset at reporting date to the corresponding risk of default at origination. The Group considers all available qualitative and quantitative information that is relevant to assessing SICR.
For non-retail portfolios, such as the corporate risk rated portfolio and the asset finance portfolio, the risk of default is defined using the existing Risk Rated Probability of Default (PD) Masterscale. The PD Masterscale is used in internal credit risk management and includes 23 risk grades that are assigned at a customer level using rating tools reflecting customer specific financial and non-financial information and management’s experienced credit judgement. Internal credit risk ratings are updated regularly on the basis of the most recent financial and non-financial information.
120 Commonwealth Bank of Australia Annual Report 2019

AASB 9 ‘Financial Instruments’ (continued)
Significant increase in credit risk (SICR) (continued) The Group has developed a Retail Masterscale for use in the ECL measurement on personal loans, credit cards, home loans and SME retail portfolios. The Retail Masterscale has 15 risk grades that are assigned to retail accounts based on their credit quality scores determined through a credit quality scorecard. Risk grades for retail exposures are updated monthly as credit quality scorecards are recalculated based on new behavioural information.
For significant portfolios, the primary indicator of SICR is a significant deterioration in an exposure’s internal credit rating grade between origination and reporting date. Application of the primary SICR indicator uses a sliding threshold such that an exposure with a higher credit quality at origination would need to experience a more significant downgrade compared to a lower credit quality exposure before SICR is triggered. The level of downgrade required to trigger SICR for each origination grade have been defined for each significant portfolio.
The assessment of significant increase in credit risk includes the impact of forward looking adjustments for emerging risks at an industry, geographic location or a particular portfolio segment level, which are calculated by stressing an exposure’s internal credit rating grade at the reporting date. This accounts for approximately 65% of Stage 2 exposures for the Group and the Bank as at 30 June 2019.
The Group also uses secondary SICR indicators as backstops in combination with the primary SICR indicator, including:
Arrears status; A retail exposure entering a financial hardship status; and A non-retail exposure’s referral to Group Credit Structuring.
For a number of small portfolios, which are not considered significant individually or in combination, the Group applies simplified provisioning approaches that differ from the description above. 30 days past due is used as a primary indicator of SICR on exposures in these portfolios.
Definition of default, credit impaired assets and write-offs
The definition of default used in measuring ECL is aligned to the definition used for internal credit risk management purposes across all portfolios. This definition is also in line with the regulatory definition of default. Default occurs when there are indicators that a debtor is unlikely to meet contractual credit obligations to the Group in full, or the exposure is 90 days past due.
Facilities are classified as credit impaired where there is doubt as to whether the full amounts due, including interest and other payments, will be received in a timely manner. Loans are written off when there is no reasonable expectation of recovery.
ECL measurement ECL is a probability weighted expected credit loss estimated by evaluating a range of possible outcomes and taking into account the time value of money, past events, current conditions and forecasts of future economic conditions.
The Group uses the following AASB 9 collective provisioning models in calculating ECL:
Retail lending: Personal Loans model, Credit Cards model, Home Loans model, Retail SME model;
Non-retail lending: Corporate Risk rated model, Asset Finance model.
For each significant portfolio ECL is calculated as a product of the following credit risk factors at a facility level:
Probability of default (PD): The likelihood that a debtor will be unable to pay its obligations in full without having to take actions such as realising on security or that the debtor will become 90 days overdue on obligation or contractual commitment;
Exposure at default (EAD): Expected balance sheet exposure at default. The Group generally calculates EAD as the higher of the drawn balance and total credit limit, except for the credit cards portfolio, for which EAD calculation also takes into account the probability of unused limits being drawn down; and
Loss given default (LGD): The amount that is not expected to be recovered following default.
Secured retail exposures with expected loss in excess of $20,000 and defaulted non-retail exposures that are not well secured are assessed for impairment through an Individually Assessed Provisions (IAP) process. Impairment provisions on these exposures are calculated directly as the difference between the defaulted asset’s carrying value and the present value of expected future cash flows including cash flows from realisation of collateral, where applicable.
Forward-looking information
Credit risk factors of PD and LGD used in ECL calculation are point-in-time estimates based on current conditions and adjusted to include the impact of multiple probability-weighted future forecast economic scenarios.
Forward looking PD and LGD factors are modelled for each significant portfolio based on macro-economic factors that are most closely correlated with credit losses in the relevant portfolios. Each of the four scenarios (refer below) includes a forecast of relevant macro-economic variables which differ by portfolio:
Retail portfolios: Cash rate, unemployment rate, GDP per capita and House price index.
Non-retail lending: Unemployment rate, business investment index, ASX 200 and the AUD/USD exchange rate.
New Zealand equivalents of a subset of the above macro-economic variables are used for retail credit exposures originated in New Zealand.
The Group uses the following four alternative macro-economic scenarios to reflect an unbiased probability-weighted range of possible future outcomes in estimating ECL:
Central scenario: This scenario considers the Group’s base case assumptions used in business planning and forecasting. This scenario considers continued growth in GDP per capita, investment, the share market and the labour market supported by exchange rates and interest rate reductions over the short term. House prices see further modest declines from currently observed levels;
121

Strategic Financial Risk Corporate Directors’ Financial Other report performance management governance report report information
Notes to the financial statements
AASB 9 ‘Financial Instruments’ (continued)
Forward-looking information (continued)
Upside and Downside scenarios: These scenarios are set relative to the Central scenario and based on macro-economic conditions which would lead to the lowest/highest impairment losses expected over an approximate 10 year economic cycle. Under the Upside scenario the economy strengthens from current state where several metrics, including house prices, return to above average growth and the central bank increases interest rates in the next year. The Downside scenario represents a deterioration from current state where the economy observes moderate declines across most metrics, including further house prices declines, as well as additional decreases in official interest rates; and
Severe Downside scenario: This scenario has been included to account for a potentially severe impact of less likely, extremely adverse macro-economic conditions which would lead to the highest impairment losses expected over a longer horizon such as a 30 year economic cycle. Under this scenario the economy sees a significant deterioration from current state. The scenario contemplates a breakdown in typical economic relationships reflected by significant declines in GDP per capita, investment, house prices and the share market as well as increases in unemployment, interest rates and exchange rates.
Weights are assigned to each scenario based on management’s best estimate of the proportion of potential future loss events that each scenario represents. The same economic scenarios and probability weights apply across all portfolios. The Group’s assessment of SICR also incorporates the impact of multiple probability-weighted future forecast economic scenarios on exposures’ internal risk grades using the same four forecast macro-economic scenarios as described above.
In estimating impairment provisions on individually significant defaulted exposures, the Group generally applies conservative assumptions in estimating recovery cash flows. Incorporating multiple forecast economic scenarios in estimates is not expected to significantly effect the level of impairment provisions on these credit exposures.
Lifetime of an exposure
For exposures in Stage 2 and Stage 3 impairment provisions are determined as a lifetime expected loss. The Group uses a range of approaches to estimate expected lives of financial instruments subject to ECL requirements:
Non-revolving products in corporate portfolios: Expected life is determined as a maximum contractual period over which the Group is exposed to credit risk;
Non-revolving retail products: For fixed term products such as personal loans and home loans, expected life is determined using behavioural term analysis and does not exceed the maximum contractual period; and
Revolving products in corporate and retail portfolios: For revolving products that include both a loan and an undrawn commitment, such as credit cards and corporate lines of credit, the Group’s contractual ability to cancel the undrawn limits and demand repayments does not limit the exposure to
credit losses to the contractual notice period. For such products, ECL is measured over the behavioural life.
Incorporation of experienced credit judgement Management exercises credit judgement in assessing if an exposure has experienced SICR and in determining the amount of impairment provisions at each reporting date. Where applicable, model adjustments are made to incorporate reasonable and supportable information about known or expected risks that have not been considered in the modelling process. This includes but is not limited to information about emerging risks at an industry, geographical location or a particular portfolio segment level.
Governance
The Group’s Loan Loss Provisioning Committee (LLPC) is responsible for approving forecast economic scenarios and their associated weights. In addition, LLPC is responsible for approving all model adjustments including those required to account for situations where all relevant information has not been considered in the modelling process. The Group’s provisions for impairment, loan impairment expense and any areas of judgement are reported to the Group’s Board Audit Committee.
Classification and measurement Under AASB 9, the classification and subsequent measurement of financial assets depends on:
the business model within which the financial assets are managed; and
the contractual cash flow characteristics of the asset, that is, whether the cash flows represent ‘solely payments of principal and interest’ (SPPI).
Business model assessment The business model reflects how the Group manages financial assets in order to generate returns. This is assessed at the level which best reflects the manner in which risk and returns are managed, and information is provided to management. The factors considered in determining the business model include:
how the financial assets’ performance is evaluated and reported to management;
how the risks within the portfolio are assessed and managed; and
the frequency, volume, timing for past sales, sales expectations in future periods, and the reasons for such sales.
Assessment of whether contractual cash flows meet the SPPI test In making the assessment of whether the contractual cash flows have SPPI characteristics, the Group considers whether the cash flows represent solely the payment of principal and interest. Principal is the fair value of the financial asset on initial recognition. Interest typically comprises compensation for the time value of money, credit risk and other basic lending costs, such as liquidity risk and administrative costs. Where the contractual terms include exposure to risk or volatility that is inconsistent with a basic lending arrangement, the cash flows would not be considered to be SPPI and the assets would be measured at fair value through profit or loss.
122 Commonwealth Bank of Australia Annual Report 2019

AASB 9 ‘Financial Instruments’ (continued)
Assessment of whether contractual cash flows meet the SPPI test (continued) In making the assessment, the Group considers contingent events that would change the amount and timing of cash flows, prepayment and extension terms, leverage features, terms that limit the Group’s claim to cash flows from specified assets (e.g. non-recourse asset arrangements), and features that modify consideration of the time value of money.
The Group is required to differentiate between financial asset debt instruments and financial asset equity instruments.
Financial assets – debt instruments
There are three classification models for financial asset debt instruments under AASB 9:
Amortised cost – Financial assets are classified within this measurement category if they are held within a portfolio whose primary objective is the collection of contractual cash flows, where the contractual cash flows on the instrument are SPPI, and that are not designated at fair value through profit or loss.
Fair value through other comprehensive income (FVOCI) – This classification applies to financial assets which meet the SPPI test, and are held within a portfolio whose objectives include both the collection of contractual cash flows and the selling of financial assets. These financial assets are subsequently measured at fair value with movements in the fair value recognised in other comprehensive income, with the exception of interest income, ECL and foreign exchange gains and losses that are recognised within profit or loss. When the financial asset is derecognised, the cumulative gain or loss previously recognised in other comprehensive income is reclassified to the income statement.
Fair value through profit or loss (FVTPL) – Financial assets that do not meet the criteria for classification as amortised cost or FVOCI are measured at FVTPL. The Group may also irrevocably designate financial assets that would otherwise meet the requirements to be measured at amortised cost or at FVOCI, as at FVTPL, if doing so would eliminate or significantly reduce an accounting mismatch that would otherwise arise.
Financial assets – equity instruments
AASB 9 requires equity instruments to be measured at FVTPL but permits non-traded equity investments to be designated at FVOCI on an instrument by instrument basis. Gains or losses are not reclassified from other comprehensive income to profit or loss on disposal of the investment. However, the gains or losses may be reclassified within equity. These instruments are not subject to impairment assessment.
Financial liabilities
The Group adopted the AASB 9 requirement to recognise changes in the fair value of financial liabilities designated at fair value through the Income Statement that are attributable to changes in own credit risk in other comprehensive income on 1 January 2014. There were no other changes to the classification and measurement of financial liabilities as a result of adoption of AASB 9.
Refer to Note 12.6 for the accounting policies that applied to financial instruments for comparative periods.
AASB 15 ‘Revenue from contracts with customers’ On 1 July 2018, the Group adopted AASB 15 ‘Revenue from Contracts with Customers’, replacing the previous standard, AASB 118 ‘Revenue’. Under AASB 118, revenue was recognised when risks and rewards transferred from the seller to the buyer. AASB 15 has introduced a single, principle-based five-step recognition and measurement model for revenue recognition. The five steps are:
1. Identify the contract with a customer; 2. Identify the separate performance obligations; 3. Determine the transaction price; 4. Allocate the transaction price to each performance obligation
identified in Step 2; and 5. Recognise revenue when a performance obligation is
satisfied.
Where there is variable consideration in calculating a transaction price, revenue will only be recognised if it is highly probable that a significant revenue reversal will not subsequently occur. AASB 15 applies to contracts with customers except for revenue arising from items such as financial instruments, insurance contracts and leases.
The Group has used the modified retrospective approach in adopting AASB 15 which recognises the cumulative effect of initial application through opening retained earnings as at 1 July 2018. The Group has not restated the comparative period financial statements. The modified retrospective approach applied to contracts not completed at 30 June 2018.
The significant changes to the Group as a result of adopting AASB 15 are:
Trail commissions: Certain trail commission income and expenses that were previously recognised over time by the Group, are recognised at the start of a contract when the performance obligation has been met. This has resulted in the Group recognising the net present value of expected future trail commission income and expenses. For investment referral services, the Group is unable to forecast the trail commission revenue in line with the highly probable test in AASB 15. Therefore trail commission revenue and expenses on investment referral balances are recognised when received or paid; and
Upfront fees: Certain fees in relation to lending, lease and guarantees arrangements are no longer recognised upfront but when the performance obligation to the customer is delivered, which is generally over the life of these contractual arrangements. Where the performance obligation is the Group providing a loan, lease arrangement or guarantee over a contractual period, these fees previously recognised upfront are amortised over the expected life of the contracts. This has also resulted in a reclassification of the fees from other banking income to interest income.
Refer to Note 12.6 for the accounting policies that applied to revenue recognition for comparative periods.
123

Impa
cts
of a
dopt
ing
AASB
9 a
nd A
ASB
15
The
tabl
es b
elow
sum
mar
ise
the
adju
stm
ents
aris
ing
on a
dopt
ion
of A
ASB
9 an
d AA
SB 1
5. T
he a
djus
tmen
ts h
ave
been
reco
gnis
ed a
gain
st th
e G
roup
’s a
nd th
e Ba
nk’s
ope
ning
reta
ined
pro
fits
and
rese
rves
as
at 1
Jul
y 20
18.
Grou
pAA
SB 9
Impa
irmen
tNZ
DCe
rtific
ates
Trail
Upfro
nt30
Jun
18of
Dep
osit
Com
miss
ion
Fees
1 Jul
18As
sets
$M
$M
$M
$M
$M
$M
$M
$M
$M
$M
Asse
ts at
fair
value
thro
ugh
Inco
me
Stat
emen
t32
,884
-(2
,148
)23
565
--
--
31,03
6De
rivat
ive a
sset
s32
,133
--
-(5
6)-
--
-32
,077
Avail
able-
for-s
ale in
vestm
ents
82,24
0(7
8,14
5)(3
,797
)(2
98)
--
--
--
Inve
stmen
t sec
uritie
s
At a
mor
tised
cost
-7,
121
--
--
--
-7,1
21
At fa
ir va
lue th
roug
h OC
I-
71,0
205,
945
63-
--
--
77,02
8Lo
ans,
bills
disco
unte
d an
d ot
her r
eceiv
ables
743,3
65-
--
(10)
-(9
68)
-(1
51)
742,2
36In
tang
ible
asse
ts9,0
90-
--
--
-(7
2)-
9,018
Defe
rred
tax a
sset
s1,4
391
--
--
299
6472
1,875
Othe
r ass
ets
6,924
--
--
-(1
0)35
1(8
)7,2
57Ot
her f
inanc
ial a
nd n
on-fi
nanc
ial a
sset
s67
,090
--
--
--
--
67,09
0To
tal a
sset
s 97
5,165
(3)
--
(1)
-(6
79)
343
(87)
974,7
38Li
abili
ties
Depo
sits a
nd o
ther
pub
lic b
orro
wing
s62
2,234
--
--
1,14
1-
--
623,3
75Lia
bilitie
s at f
air va
lue th
roug
h In
com
e St
atem
ent
10,24
7-
--
-(1
,141
)-
--
9,106
Deriv
ative
liabil
ities
28,47
2-
--
(1)
--
--
28,47
1De
ferre
d ta
x liab
ilities
--
--
--
210
2(3
)10
1Ot
her p
rovis
ions
1,860
--
--
-87
--
1,947
Bills
pay
able
and
othe
r liab
ilities
11
,625
--
--
--
223
118
11,96
6Ot
her f
inanc
ial a
nd n
on-fi
nanc
ial lia
bilitie
s23
2,867
--
--
--
--
232,8
67To
tal l
iabili
ties
907,3
05-
--
(1)
-89
325
115
907,8
33Sh
areh
olde
rs' E
quity
Shar
e ca
pital
37,27
0-
--
--
--
-37
,270
Rese
rves
1,676
(3)
--
--
3-
-1,6
76Re
taine
d pr
ofits
28
,360
--
--
-(7
71)
18(2
02)
27,40
5No
n-co
ntro
lling
inter
est
554
--
--
--
--
554
Tota
l Sha
reho
lder
s' eq
uity
67,86
0(3
)-
--
-(7
68)
18(2
02)
66,90
5
AASB
9 Cl
assif
icatio
n an
d M
easu
rem
ent
AASB
15 R
even
ue
High
Qua
lity
Liqu
id A
sset
s(H
QLAs
)
NZD
Liqu
id A
sset
s No
n-Tr
aded
Eq
uitie
s
Loan
s with
Em
bedd
ed
Feat
ures

Im
pact
s of
ado
ptin
g AA
SB 9
and
AAS
B 1
5 (c
ontin
ued)
Bank
AASB
9 Im
pairm
ent
Trail
Upfro
nt30
Jun
18Co
mm
issio
nFe
es1 J
ul 18
Asse
ts$M
$M
$M
$M
$M
$M
$M
$M
As
sets
at fa
ir va
lue th
roug
h In
com
e St
atem
ent
29,99
3-
-65
--
-30
,058
Deriv
ative
ass
ets
30,88
5-
-(5
6)-
--
30,82
9Av
ailab
le-fo
r-sale
inve
stmen
ts77
,731
(77,
686)
(45)
--
--
-In
vestm
ent s
ecur
ities:
At
am
ortis
ed co
st-
7,12
1-
--
--
7,121
At
fair
value
thro
ugh
OCI
-70
,561
45-
--
-70
,606
Loan
s, bil
ls dis
coun
ted
and
othe
r rec
eivab
les65
6,650
--
(10)
(895
)-
(134
)65
5,611
Shar
es in
and
loan
s to
cont
rolle
d en
tities
118,2
52-
--
(23)
--
118,2
29De
ferre
d ta
x ass
ets
1,430
1-
-27
9-
741,7
84Ot
her a
sset
s6,2
12-
--
(7)
91-
6,296
Othe
r fina
ncial
and
non
-fina
ncial
ass
ets
49,39
9-
--
--
-49
,399
Tota
l ass
ets
970,5
52(3
)-
(1)
(646
)91
(60)
969,9
33Li
abili
ties
Deriv
ative
liabil
ities
30,87
1-
-(1
)-
--
30,87
0Du
e to
cont
rolle
d en
tities
105,3
27-
--
--
1610
5,343
Defe
rred
tax l
iabilit
ies-
--
--
27-
27Ot
her p
rovis
ions
1,561
--
-84
--
1,645
Bills
pay
able
and
othe
r liab
ilities
10
,145
--
--
-12
410
,269
Othe
r fina
ncial
and
non
-fina
ncial
liabil
ities
758,7
28-
--
--
-75
8,728
Tota
l liab
ilitie
s90
6,632
--
(1)
8427
140
906,8
82Sh
areh
olde
rs' E
quity
Shar
e ca
pital
37,53
3-
--
--
-37
,533
Rese
rves
2,568
(3)
--
2-
-2,5
67Re
taine
d pr
ofits
23
,819
--
-(7
32)
64(2
00)
22,95
1To
tal S
hare
hold
ers'
equi
ty63
,920
(3)
--
(730
)64
(200
)63
,051
High
Qua
lity L
iqui
d As
sets
(HQL
As)
Non-
Trad
ed
Equi
ties
Loan
s with
Em
bedd
ed F
eatu
res
AASB
9 Cl
assif
icatio
n an
d M
easu
rem
ent
AASB
15 R
even
ue

Strategic Financial Risk Corporate Directors’ Financial Other report performance management governance report report information
Notes to the financial statements
Adoption of AASB 9 classification and measurement High Quality Liquid Assets (HQLA): under AASB 139, $78,145 million of the Group’s HQLA were included in Available-for-Sale investments (Bank: $77,686 million). $7,121 million of the Group’s HQLA (Bank: $7,121 million) previously included in Available-for-Sale assets were held within the business model held to collect and have been reclassified to Investment securities at amortised cost under AASB 9. These financial assets have been restated to amortised cost and $4 million of unrealised gains (before tax) previously recognised by the Group (Bank: $4 million unrealised gain) in the Available-for-Sale revaluation reserve have been reversed against the carrying value of the assets on 1 July 2018. This also led to a reversal of the deferred tax previously recognised in relation to unrealised gains on these securities through reserves. The Group’s deferred tax asset has increased by $1 million (Bank: $1 million increase) and the reserves have decreased by $3 million (Bank: $3 million decrease).
$71,020 million of the Group’s HQLA (Bank: $70,561 million) previously included in Available-for-Sale assets were held within the business model held to collect and sell and have been reclassified to Investment securities at FVOCI under AASB 9. The reclassification did not have an impact on retained profits or reserves.
The fair value of HQLA reclassified from Available-for-Sale Investments to Investment Securities at amortised cost on adoption of AASB 9 and held as at 30 June 2019 was $5,316 million. The fair value loss that would have been recognised on these securities in Other comprehensive Income as at 30 June 2019 was $9 million.
NZD liquid assets: under AASB 139, $3,797 million of the Group’s NZD liquid assets were included in Available-for-Sale investments with the remaining $2,148 million measured at FVTPL. These financial assets were held within the business model held to collect and sell and have been reclassified to Investment securities at FVOCI under AASB 9. The reclassification did not have a material impact on retained profits or reserves.
As at 30 June 2019, the Group did not hold any of the NZD liquid assets reclassified from Assets at FVTPL to Investment securities at FVOCI on adoption of AASB 9. The average interest rate on these instruments on 1 July 2018 was 1.91% and the interest income recognised for the year ended 30 June 2019 was $7 million.
Non-traded equity instruments: the Group had $298 million of non-traded equity instruments included in Available-for-sale investment under AASB 139 (Bank: $45 million). One of the Group’s equity securities of $235 million was reclassified to Assets at FVTPL under AASB 9. The Group’s remaining $63 million (Bank: $45 million) of equity securities have been
reclassified to Investment securities at FVOCI under AASB 9. The reclassifications did not have a material impact on retained profits or reserves.
Loans with embedded derivatives: the Group and the Bank issued loans with embedded derivative features. Under AASB 139, the embedded derivatives were bifurcated and accounted for as standalone derivatives at FVTPL; the host loan contracts were measured at amortised cost and included in Loans, bills discounted and other receivables on the Balance sheet. The contractual cash flows on these instruments are not solely payments of principal and interest and they have been reclassified to Assets at FVTPL together with the related embedded derivative features. The reclassification did not have an impact on retained profits.
NZD Certificate of Deposits (CD): Under AASB 9, $1,141 million of the Group’s NZD CDs have been reclassified from liabilities at FVTPL to liabilities at amortised cost, as the CDs are not held for trading. The reclassification did not have a material impact on retained profits or reserves.
As at 30 June 2019, the Group did not hold any of NZD CDs reclassified from liabilities at FVTPL to liabilities at amortised cost on adoption of AASB 9. The average interest rate on these instruments on 1 July 2018 was 2.0% and the interest expense recognised for the year ended 30 June 2019 was $3 million.
Adoption of AASB 9 Impairment The adoption of AASB 9 impairment requirements resulted in a $1,058 million increase in the Group’s collective provisions (Bank: $1,004 million increase). This includes $968 million for loans, bills discounted and other receivables, $87 million for off-balance sheet instruments (recognised in other provisions), $3 million for investment securities at FVOCI (recognised in reserves) (Bank: $895 million for loans, bills discounted and other receivables, $23 million for loans to controlled entities, $84 million for off-balance sheet instruments and $2 million for investment securities at FVOCI). In addition, the Group recognised a $10 million provision in relation to non-lending assets that are not in scope of AASB 9 collective provisioning models (Bank: $7 million). The transition resulted in a $299 million increase in the Group’s deferred tax assets (Bank: $279 million increase), a $2 million increase in deferred tax liabilities (Bank: nil) and a corresponding $771 million decrease in retained profits (Bank: $732 million decrease) as at 1 July 2018.
The increase in impairment provisions was mostly driven by the AASB 9 requirement to hold provisions equivalent to lifetime expected losses for all loans that have experienced a significant increase in credit risk since origination and the impact of forward looking factors on expected credit losses estimates.
126 Commonwealth Bank of Australia Annual Report 2019

Adoption of AASB 9 Impairment (continued) The following tables provide a reconciliation between provisions for impairment under AASB 139 as at 30 June 2018 and provisions for impairment determined in accordance with AASB 9 on 1 July 2018 for the Group and the Bank:
Group
Financial assets under AASB 9
Previous measurement
category under AASB 139
Provision for impairment
under AASB 139
Remeasure-ment
Impairment provision under
AASB 9
Investment securities:
At amortised cost Available-for-sale - - -
At fair value through other comprehensive income (1) Available-for-sale - 3 3
Loans, bills discounted and other receivables (2) Amortised cost 3,605 968 4,573
Financial guarantees and other off-balance sheet items 28 87 115
Total 3,633 1,058 4,691
(1) Impairment losses in relation to Investment securities at fair value through Other Comprehensive Income are recognised in Other Comprehensive Income and are not included in total impairment provisions.
(2) Under AASB 9, Loans, bills discounted and other receivables are measured at amortised cost.
Bank
Financial assets under AASB 9
Previous measurement
category under AASB 139
Provision for impairment
under AASB 139
Remeasure-ment
Impairment provision under
AASB 9
Investment securities:
At amortised cost Available-for-sale - - -
At fair value through other comprehensive income (1) Available-for-sale - 2 2
Loans, bills discounted and other receivables (2) Amortised cost 3,261 895 4,156
Loans to controlled entities (2) Amortised cost - 23 23
Financial guarantees and other off-balance sheet items 28 84 112
Total 3,289 1,004 4,293
(1) Impairment losses in relation to Investment securities at fair value through Other Comprehensive Income are recognised in Other Comprehensive Income and are not included in total impairment provisions.
(2) Under AASB 9, Loans, bills discounted and other receivables, and Loans to controlled entities are measured at amortised cost.
127

Strategic Financial Risk Corporate Directors’ Financial Other report performance management governance report report information
Notes to the financial statements
Adoption of AASB 9 Impairment (continued) The table below presents the Group’s total impairment provisions on lending assets by ECL stage as at 1 July 2018.
Group1 Jul 18
Stage 1 Stage 2 Stage 3 Stage 312 months ECL Lifetime ECL Lifetime ECL Lifetime ECL
Portfolio (1)Collectively
assessed Collectively
assessed Collectively
assessed Individually
assessedRetail
Secured lending 206 410 113 253 982
Unsecured lending 525 847 233 3 1,608
Total retail 731 1,257 346 256 2,590
Non-retailCorporate and business lending, bank and sovereign entities (2) 145 1,268 74 614 2,101
Total 876 2,525 420 870 4,691
Impairment provisions, $M
Total
(1) Exposures subject to impairment provisions include drawn balances, undrawn credit commitments, financial guarantees and debt securities classified at fair value through OCI.
(2) Stage 1 provision includes $3 million ECL in relation to investment securities at fair value through OCI.
The table below presents the Bank’s total impairment provisions on lending assets (excluding loans to controlled entities) by ECL stage as at 1 July 2018.
Bank1 Jul 18
Stage 1 Stage 2 Stage 3 Stage 312 months ECL Lifetime ECL Lifetime ECL Lifetime ECL
Portfolio (1) (2)Collectively
assessed Collectively
assessed Collectively
assessed Individually
assessedRetail
Secured lending 174 372 105 236 887
Unsecured lending 482 818 219 3 1,522
Total retail 656 1,190 324 239 2,409
Non-retailCorporate and business lending, bank and sovereign entities (3) 129 1,123 69 540 1,861
Total 785 2,313 393 779 4,270
Impairment provisions, $M
Total
(1) Exposures subject to impairment provisions include drawn balances, undrawn credit commitments, financial guarantees and debt securities classified at fair value through OCI.
(2) Impairment provisions exclude $23 million recognised in relation to the Bank’s loans to controlled entities. (3) Stage 1 provision includes $2 million ECL in relation to investment securities at fair value through OCI.
128 Commonwealth Bank of Australia Annual Report 2019

Adoption of AASB 15
Trail Commission: The Group’s Other assets and Bills payable and other liabilities have increased by $351 million and $223 million, respectively, to reflect the recognition of trail commission receivable and payable across various arrangements across the Group (Bank: $91 million increase in Other Assets). This reflects the upfront recognition of certain future trail commission income and expenses when a performance obligation has been met, such as when a new customer is introduced into a product. This change also led to a $72 million decrease in the Group’s goodwill on the acquisition of Aussie Home Loans, a $64 million and $102 million increase in deferred tax assets and deferred tax liabilities, respectively (Bank: $27 million increase in deferred tax liability). The impact of this change on the Group’s retained profits as at 1 July 2018 was an increase of $18 million (Bank: an increase of $64 million).
Upfront fees: Upfront fees in relation to lending and guarantee arrangements are no longer recognised upfront. Instead, income is recognised over the life of the contractual arrangements. Establishment fees on financing facilities are deferred on the Group’s and the Bank’s Balance Sheets in Loans, bills discounted and other receivables, and amortised to interest income over the expected life of the loan in accordance with AASB 9. From 1 July 2018, this has also resulted in a reclassification of income from other banking income to interest income. In addition, other annual fees are deferred on the Balance Sheet in Bills payable and other liabilities when received and recognised in other banking income on a straight-line basis throughout the year. The impact for the Group as at 1 July 2018 includes a reduction in Loans, bills discounted and other receivables of $151 million (Bank: $134 million reduction), a reduction in Other assets of $8 million (Bank: $ nil), and an increase in Bills payable and other liabilities of $118 million (Bank: $124 million increase). It has also led to a $16 million increase in the Bank’s balances Due to controlled entities. The deferral of upfront fees from existing customer contracts resulted in a one-off increase in the Group’s deferred tax assets of $72 million (Bank: $74 million) and a decrease in deferred tax liabilities of $3 million (Bank: $ nil). The impact of this change on the Group’s retained profits as at 1 July 2018 was a reduction of $202 million (Bank: $200 million).
129

Strategic report
Financial performance
Risk management
Corporate governance
Directors’ report
Financial report
Other information
Notes to the financial statements
The Group earns its returns from providing a broad range of banking and wealth management products and services to retail and wholesale customers in Australia, New Zealand and other jurisdictions.
Lending and deposit taking are the Group’s primary business activities with net interest income being the main contributor to the Group’s results. Net interest income is derived from the difference between interest earned on lending and investment assets and interest incurred on customer deposits and wholesale debt raised to fund these assets.
The Group further generates income from lending fees and commissions, general insurance products and trading activities. It also incurs costs associated with running the business such as staff, occupancy and technology related expenses.
The Performance section provides details of the main contributors to the Group’s returns and analysis of its financial performance by business segments and geographical regions.
Group (1) (2) (3) Bank (2) (3)
30 Jun 19 30 Jun 18 30 Jun 17 30 Jun 19 30 Jun 18$M $M $M $M $M
Interest Income
Effective interest income:
Loans and bills discounted 31,449 31,315 30,628 27,744 27,861
Other financial institutions 181 140 149 171 121
Cash and liquid assets 572 459 321 528 427
Investment securities:
At amortised cost 199 - - 199 -
At fair value through Other Comprehensive Income 1,688 - - 1,559 -
Available-for-sale investments - 1,729 1,607 - 1,639
Controlled entities - - - 2,759 2,483
Total effective interest income 34,089 33,643 32,705 32,960 32,531
Other:
Assets at fair value through Income Statement 499 501 490 499 465
Total interest income 34,588 34,144 33,195 33,459 32,996
Interest Expense
Deposits 9,948 9,843 10,409 8,394 8,380
Other financial institutions 464 418 300 435 379
Liabilities at fair value through Income Statement 172 167 102 162 142
Debt issues 4,563 4,169 4,159 3,625 3,286
Loan capital 951 836 679 917 801
Bank levy 370 369 - 370 369
Controlled entities - - - 3,502 3,228
Total interest expense 16,468 15,802 15,649 17,405 16,585
Net interest income 18,120 18,342 17,546 16,054 16,411
(1) Information has been restated and presented on a continuing operations basis. (2) Information has been restated to conform to presentation in the current year. (3) Current year amounts reflect the adoption of AASB 9 ‘Financial Instruments’ and AASB 15 ‘Revenue from contracts with customers’ on 1 July 2018. As permitted by
AASB 9 and AASB 15 comparative information has not been restated. For details on the adoption of AASB 9 and AASB 15 refer to Note 1.1.
130 Commonwealth Bank of Australia Annual Report 2019

Interest income and interest expense on financial assets and liabilities are measured using the effective interest rate method. The effective interest rate method calculates the amortised cost of a financial instrument, such as a loan, deposit or issued debt instrument, and allocates the interest income or interest expense over the expected life of the financial instrument.
Interest income is recognised on gross carrying amounts for financial assets in Stage 1 and Stage 2, and gross carrying amounts net of impairment provisions for financial assets in Stage 3.
Fees, transaction costs and issue costs integral to the financial assets and liabilities are capitalised and included in the interest recognised over the expected life of the instrument. This includes fees for providing a loan or a lease arrangement.
Interest income on finance leases is recognised progressively over the life of the lease, consistent with the outstanding investment and unearned income balance.
Interest expense also includes payments made under a liquidity facility arrangement with the Reserve Bank of Australia, the Major Bank Levy (Bank Levy) expense and other financing charges.
131
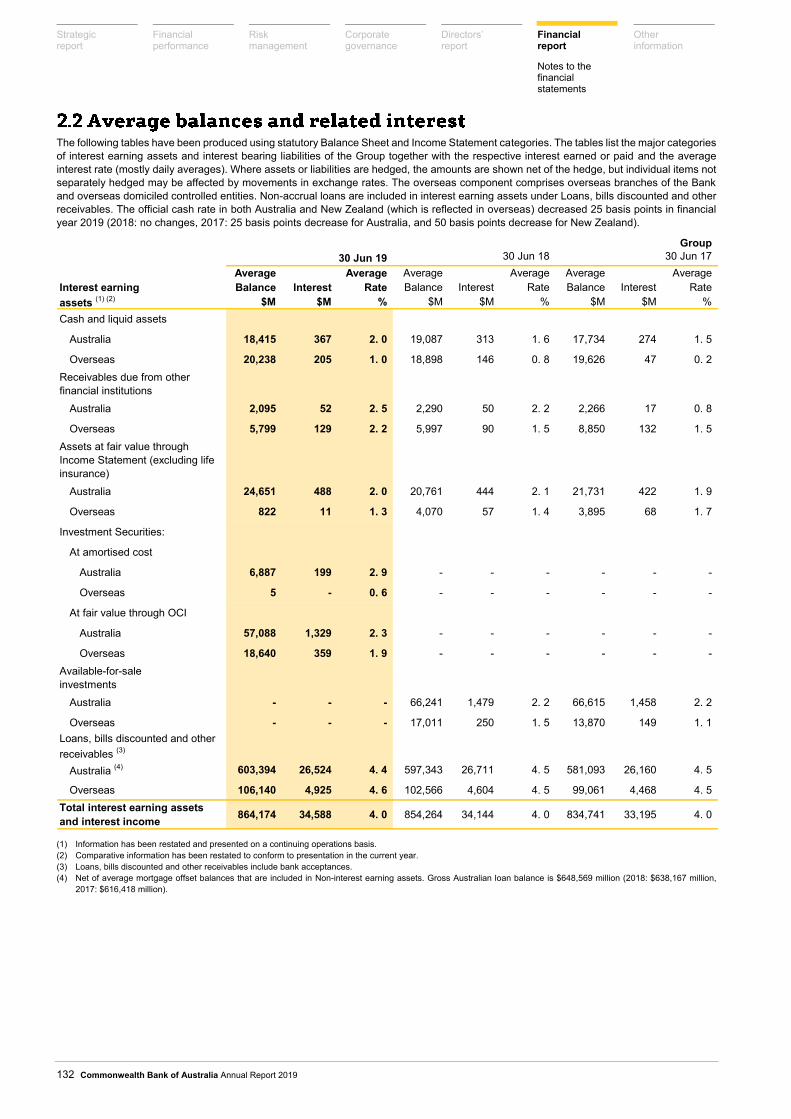
Strategic Financial Risk Corporate Directors’ Financial Other report performance management governance report report information
Notes to the financial statements
The following tables have been produced using statutory Balance Sheet and Income Statement categories. The tables list the major categories of interest earning assets and interest bearing liabilities of the Group together with the respective interest earned or paid and the average interest rate (mostly daily averages). Where assets or liabilities are hedged, the amounts are shown net of the hedge, but individual items not separately hedged may be affected by movements in exchange rates. The overseas component comprises overseas branches of the Bank and overseas domiciled controlled entities. Non-accrual loans are included in interest earning assets under Loans, bills discounted and other receivables. The official cash rate in both Australia and New Zealand (which is reflected in overseas) decreased 25 basis points in financial year 2019 (2018: no changes, 2017: 25 basis points decrease for Australia, and 50 basis points decrease for New Zealand).
Group
Average Average Average Average Average AverageInterest earning Balance Interest Rate Balance Interest Rate Balance Interest Rateassets (1) (2) $M $M % $M $M % $M $M %Cash and liquid assets
Australia 18,415 367 2. 0 19,087 313 1. 6 17,734 274 1. 5
Overseas 20,238 205 1. 0 18,898 146 0. 8 19,626 47 0. 2Receivables due from other financial institutions
Australia 2,095 52 2. 5 2,290 50 2. 2 2,266 17 0. 8
Overseas 5,799 129 2. 2 5,997 90 1. 5 8,850 132 1. 5Assets at fair value through Income Statement (excluding life insurance)
Australia 24,651 488 2. 0 20,761 444 2. 1 21,731 422 1. 9
Overseas 822 11 1. 3 4,070 57 1. 4 3,895 68 1. 7
Investment Securities:
At amortised cost
Australia 6,887 199 2. 9 - - - - - -
Overseas 5 - 0. 6 - - - - - -
At fair value through OCI
Australia 57,088 1,329 2. 3 - - - - - -
Overseas 18,640 359 1. 9 - - - - - -Available-for-sale investments
Australia - - - 66,241 1,479 2. 2 66,615 1,458 2. 2
Overseas - - - 17,011 250 1. 5 13,870 149 1. 1Loans, bills discounted and other receivables (3)
Australia (4) 603,394 26,524 4. 4 597,343 26,711 4. 5 581,093 26,160 4. 5
Overseas 106,140 4,925 4. 6 102,566 4,604 4. 5 99,061 4,468 4. 5Total interest earning assets and interest income 864,174 34,588 4. 0 854,264 34,144 4. 0 834,741 33,195 4. 0
30 Jun 19 30 Jun 18 30 Jun 17
(1) Information has been restated and presented on a continuing operations basis. (2) Comparative information has been restated to conform to presentation in the current year. (3) Loans, bills discounted and other receivables include bank acceptances. (4) Net of average mortgage offset balances that are included in Non-interest earning assets. Gross Australian loan balance is $648,569 million (2018: $638,167 million,
2017: $616,418 million).
132 Commonwealth Bank of Australia Annual Report 2019

Group30 Jun 19 30 Jun 18 30 Jun 17Average Average AverageBalance Balance Balance
Non-interest earning assets $M $M $M
Assets at fair value through Income Statement - Insurance (1)
Australia - - 12,105
Overseas - 377 2,477
Property, plant and equipment
Australia (2) 2,208 2,344 3,743
Overseas 244 252 289
Other assets
Australia (2) (3) 86,413 95,521 108,931
Overseas 10,175 11,924 13,774
Provisions for impairment
Australia (4,026) (3,203) (3,303)
Overseas (599) (466) (424)
Total non-interest earning assets 94,415 106,749 137,592
Assets held for sale
Australia 15,128 13,046 -
Overseas 1,829 2,228 -
Total assets 975,546 976,287 972,333
Percentage of total assets applicable to overseas operations (%) 16. 7 16. 7 16. 6
(1) As at 30 June 2019, Insurance assets of CommInsure Life and PT Commonwealth Life are presented as assets held for sale. As at 30 June 2018, Insurance assets of CommInsure Life and Sovereign are presented as assets held for sale.
(2) Comparative information has been restated to conform to presentation in the current year. (3) Includes average mortgage offset balances.
133

Strategic Financial Risk Corporate Directors’ Financial Other report performance management governance report report information
Notes to the financial statements
Group
Average Average Average Average Average AverageInterest bearing Balance Interest Rate Balance Interest Rate Balance Interest Rateliabilities (1) (2) $M $M % $M $M % $M $M %Time deposits
Australia (3) 203,750 5,164 2. 5 203,694 5,038 2. 5 207,501 5,535 2. 7
Overseas 53,836 1,746 3. 2 51,291 1,532 3. 0 48,461 1,357 2. 8
Savings deposits
Australia (3) 144,686 1,588 1. 1 146,346 1,812 1. 2 147,705 2,059 1. 4
Overseas 14,335 167 1. 2 14,414 205 1. 4 16,136 313 1. 9
Other demand deposits
Australia 114,193 1,151 1. 0 112,195 1,120 1. 0 103,193 987 1. 0
Overseas 8,765 132 1. 5 8,136 136 1. 7 8,154 158 1. 9Payables due to other financial institutions
Australia 8,852 221 2. 5 10,292 196 1. 9 11,098 158 1. 4
Overseas 12,709 243 1. 9 16,648 222 1. 3 19,235 142 0. 7Liabilities at fair value through Income Statement
Australia 9,372 162 1. 7 7,557 141 1. 9 7,049 63 0. 9
Overseas 1,054 10 0. 9 1,332 26 2. 0 1,467 39 2. 7
Debt issues (4)
Australia 140,447 3,846 2. 7 138,666 3,463 2. 5 136,614 3,323 2. 4
Overseas 26,676 717 2. 7 28,450 706 2. 5 32,307 836 2. 6
Loan capital
Australia 15,655 668 4. 3 13,788 556 4. 0 11,239 447 4. 0
Overseas 6,785 283 4. 2 6,774 280 4. 1 5,453 232 4. 3
Bank levy
Australia - 370 - - 369 - - - -
Overseas - - - - - - - - -Total interest bearing liabilities and interest expense 761,115 16,468 2. 2 759,583 15,802 2. 1 755,612 15,649 2. 1
30 Jun 19 30 Jun 18 30 Jun 17
(1) Information has been restated and presented on a continuing operations basis. (2) Comparative information has been restated to conform to presentation in the current year. (3) Net of average mortgage offset balances that are included in Non-interest bearing liabilities. (4) Debt issues include bank acceptances.
134 Commonwealth Bank of Australia Annual Report 2019

Group30 Jun 19 30 Jun 18 30 Jun 17Average Average AverageBalance Balance Balance
Non-interest bearing liabilities $M $M $M
Australia (1) 91,316 83,949 72,303
Overseas 4,897 4,193 3,671
Insurance policy liabilities
Australia - - 11,190
Overseas - 466 1,368
Other liabilities
Australia 25,532 37,250 53,418
Overseas 9,430 10,255 12,796
131,175 136,113 154,746
Australia 13,855 13,413 -
Overseas 1,025 1,308 -
Total liabilities 907,170 910,417 910,358
Shareholders' Equity 68,376 65,870 61,975
975,546 976,287 972,333
15. 4 15. 7 16. 4
Total liabilities and Shareholders' EquityTotal liabilities applicable to overseas operations (%)
Total non-interest bearing liabilities
Deposits not bearing interest
Liabilities held for sale
(1) Includes average mortgage offset balance.
135
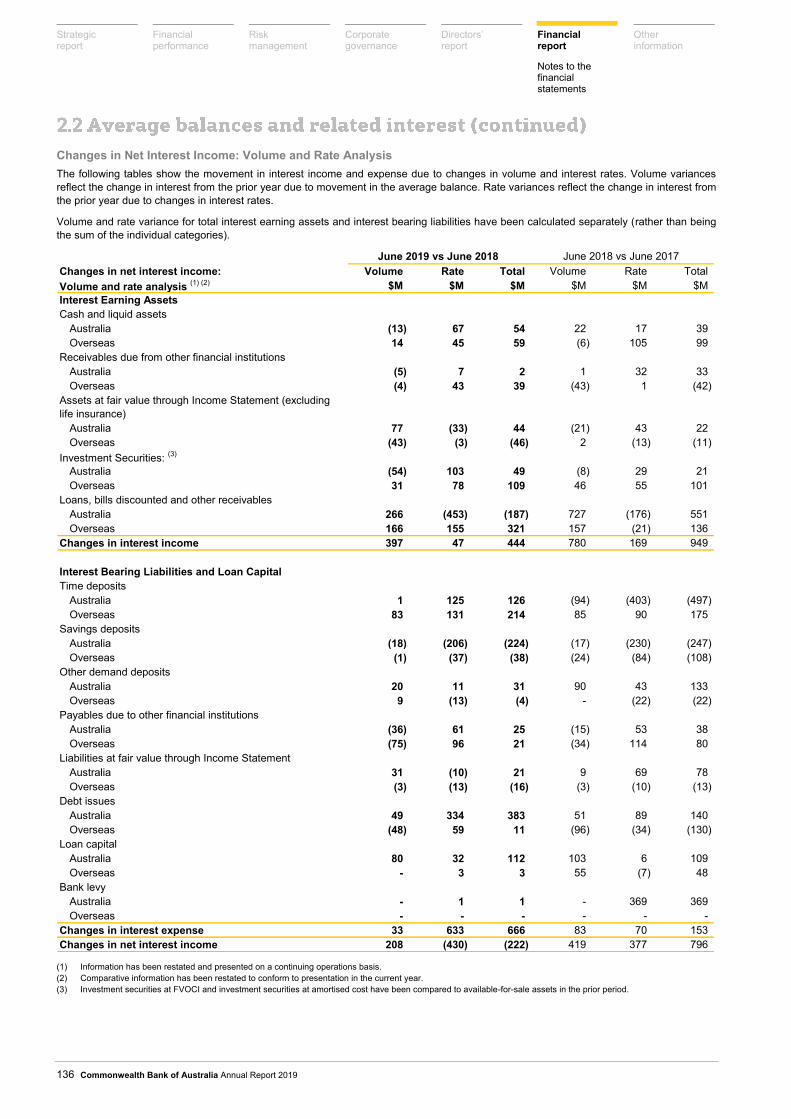
Strategic Financial Risk Corporate Directors’ Financial Other report performance management governance report report information
Notes to the financial statements
Changes in Net Interest Income: Volume and Rate Analysis
The following tables show the movement in interest income and expense due to changes in volume and interest rates. Volume variances reflect the change in interest from the prior year due to movement in the average balance. Rate variances reflect the change in interest from the prior year due to changes in interest rates.
Volume and rate variance for total interest earning assets and interest bearing liabilities have been calculated separately (rather than being the sum of the individual categories).
Changes in net interest income: Volume Rate Total Volume Rate TotalVolume and rate analysis (1) (2) $M $M $M $M $M $MInterest Earning AssetsCash and liquid assets
Australia (13) 67 54 22 17 39Overseas 14 45 59 (6) 105 99
Receivables due from other financial institutionsAustralia (5) 7 2 1 32 33Overseas (4) 43 39 (43) 1 (42)
Assets at fair value through Income Statement (excluding life insurance)
Australia 77 (33) 44 (21) 43 22Overseas (43) (3) (46) 2 (13) (11)
Investment Securities: (3)
Australia (54) 103 49 (8) 29 21Overseas 31 78 109 46 55 101
Loans, bills discounted and other receivablesAustralia 266 (453) (187) 727 (176) 551Overseas 166 155 321 157 (21) 136
Changes in interest income 397 47 444 780 169 949
Interest Bearing Liabilities and Loan CapitalTime deposits
Australia 1 125 126 (94) (403) (497)Overseas 83 131 214 85 90 175
Savings depositsAustralia (18) (206) (224) (17) (230) (247)Overseas (1) (37) (38) (24) (84) (108)
Other demand depositsAustralia 20 11 31 90 43 133Overseas 9 (13) (4) - (22) (22)
Payables due to other financial institutionsAustralia (36) 61 25 (15) 53 38Overseas (75) 96 21 (34) 114 80
Liabilities at fair value through Income StatementAustralia 31 (10) 21 9 69 78Overseas (3) (13) (16) (3) (10) (13)
Debt issuesAustralia 49 334 383 51 89 140Overseas (48) 59 11 (96) (34) (130)
Loan capitalAustralia 80 32 112 103 6 109Overseas - 3 3 55 (7) 48
Bank levyAustralia - 1 1 - 369 369Overseas - - - - - -
Changes in interest expense 33 633 666 83 70 153Changes in net interest income 208 (430) (222) 419 377 796
June 2019 vs June 2018 June 2018 vs June 2017
(1) Information has been restated and presented on a continuing operations basis. (2) Comparative information has been restated to conform to presentation in the current year. (3) Investment securities at FVOCI and investment securities at amortised cost have been compared to available-for-sale assets in the prior period.
136 Commonwealth Bank of Australia Annual Report 2019

Group (1) (2) Bank (2)
30 Jun 19 30 Jun 18 30 Jun 17 30 Jun 19 30 Jun 18
$M $M $M $M $M
Other Banking Income
Lending fees 992 1,109 1,078 926 1,032
Commissions 2,673 2,712 2,601 2,277 2,363
Trading income 974 1,025 1,149 874 916
Net gain/(loss) on non-trading financial instruments (3) (113) 58 433 (205) 71
Net gain/(loss) on sale of property, plant and equipment (9) (17) 6 (11) (17)
Net gain from hedging ineffectiveness 13 12 62 16 -
Dividends - Controlled entities - - - 1,229 2,029
Dividends - Other 5 10 10 122 56Share of profit from associates and joint ventures net of impairment 296 317 270 27 (7)
Other (4) 163 197 112 789 922
Total other banking income (5) 4,994 5,423 5,721 6,044 7,365
Net Funds Management Operating Income
Funds management income 1,233 1,259 1,200 - -
Claims, policyholder liability and commission expense (160) (135) (162) - -
Net funds management operating income 1,073 1,124 1,038 - -
Net Insurance Operating Income
Premiums from insurance contracts 682 687 643 - -
Investment revenue 5 4 4 - -
Claims, policyholder liability and commission expense from insurance contracts (537) (450) (469) - -
Net insurance operating income 150 241 178 - -
Total other operating income 6,217 6,788 6,937 6,044 7,365
(1) Information has been restated and presented on a continuing operations basis. (2) Current year amounts reflect the adoption of AASB 15 ‘Revenue from contracts with customers’ on 1 July 2018. As permitted by AASB 15 comparative information has
not been restated. For details on the adoption of AASB 15 refer to Note 1.1. (3) Inclusive of non-trading derivatives that are held for risk management purposes. (4) Includes depreciation of $72 million in relation to assets held for lease by the Group (30 June 2018: $74 million, 30 June 2017: $88 million). Includes depreciation of $8
million in relation to assets held for lease by the Bank (30 June 2018: $9 million). (5) The year ended 30 June 2019 includes $280 million income from the consolidation of AHL Holdings Pty Ltd (trading as Aussie Home Loans) and eChoice (30 June 2018:
$233 million).
Group Bank30 Jun 19 30 Jun 18 30 Jun 17 30 Jun 19 30 Jun 18
$M $M $M $M $M
Net hedging ineffectiveness comprises:
Gain/(loss) on fair value hedges:
Hedging instruments 567 (757) 841 (614) (759)
Hedged items (558) 765 (799) 624 763
Cash flow and net investment hedge ineffectiveness 4 4 20 6 (4)
Net hedging ineffectiveness 13 12 62 16 -
137

Strategic report
Financial performance
Risk management
Corporate governance
Directors’ report
Financial report
Other information
Notes to the financial statements
Lending fees and commission income include:
Facility fees earned for managing and administering credit and other facilities for customers. These fees are generally charged to the customer on a monthly or annual basis and are recognised as revenue over the service period. Annual fees are deferred on Balance Sheet in Bills payable and other liabilities and recognised on a straight line basis over the year. Transaction based fees are charged and recognised at the time of the transaction.
Commitment fees and upfront fees in relation to lending, lease and guarantee arrangements are deferred and recognised over the life of the contractual arrangements. Commitment fees to originate a loan that is unlikely to be drawn down are charged upfront to the customer and are recognised when the commitment is issued.
Establishment fees on financing facilities are deferred and amortised to interest income over the expected life of the loan and are not recognised in Other banking income.
Fee income earned for providing advisory or arrangement services, placement and underwriting services. These fees are recognised and charged when the related service is completed which is typically at the time of the transaction.
Trail commissions are recognised at the start of a contract when the performance obligation has been met, typically when a customer is introduced to a new product. The Group recognises the net present value of expected future trail commission income. For investment referral services, the Group is unable to forecast the trail commission revenue in line with the highly probable test in AASB 15. Therefore, trail commission revenue on investment referral balances are recognised when received or paid.
Trading income represents both realised and unrealised gains and losses from changes in the fair value of trading assets, liabilities and derivatives, which are recognised in the period in which they arise.
Net gain/(loss) on non-trading financial instruments includes realised gains and losses from non-trading financial assets and liabilities (i.e. investment securities in the year ended 30 June 2019; available-for-sale securities in the years ended 30 June 2018 and 2017), as well as realised and unrealised gains and losses on non-trading derivatives that are held for risk management purposes.
Net gain/(loss) on the disposal of property, plant and equipment is the difference between proceeds received and its carrying value.
Net hedging ineffectiveness is measured on fair value, cash flow and net investment hedges.
Dividends received on non-trading equity investments are recognised on the ex-dividend date or when the right to receive payment is established.
Funds management operating income includes fees earned where the Group acts as the Responsible Entity, Trustee or Manager for a number of wholesale, superannuation, and investment funds or trusts. Fund management services are a single performance obligation and fees are recognised over the service period. Management fees are calculated and deducted from the funds on a monthly basis. Performance fees are deemed to be a variable component of the fund management service and only recognised when it is highly probable that a significant reversal of the fees will not occur.
General insurance premiums received and receivable are recognised as revenue when they are earned, based on actuarial assessment of the likely pattern in which risk will emerge. The portion not yet earned based on the pattern assessment is recognised as an unearned premium liability. Claims are recognised as an expense when the liability is established.
The Group equity accounts for its share of the profits or losses of associate or joint venture investments, net of impairment recognised. Dividends received are recognised as a reduction of the investment carrying amount.
Other income includes rental income on operating leases which are recognised on a straight line basis over the lease term. This is offset by depreciation and impairment expense on the associated operating lease assets held by the Group.
Other income also includes the impact of foreign currency revaluations for foreign currency monetary assets and liabilities. These assets and liabilities are retranslated at the spot rate at balance date. Exchange differences arising upon settling or translating monetary items at different rates to those at which they were initially recognised or previously reported, are recognised in the Income Statement.
Critical accounting judgements and estimates
The amount of trail commission revenue is dependent on assumptions about the behavioural life of the underlying transaction generating the commission. Trail commission income is only recognised to the extent it is highly probable it will not reverse in future periods.
138 Commonwealth Bank of Australia Annual Report 2019
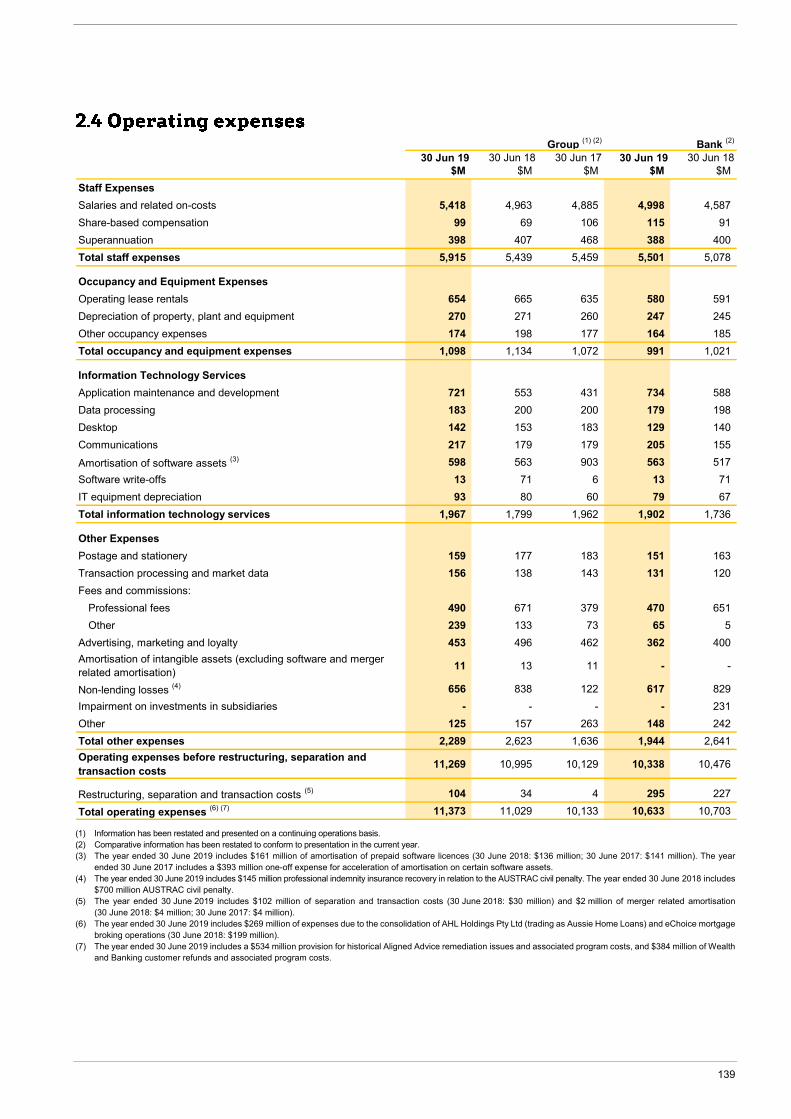
Group (1) (2) Bank (2)
30 Jun 19 30 Jun 18 30 Jun 17 30 Jun 19 30 Jun 18$M $M $M $M $M
Staff ExpensesSalaries and related on-costs 5,418 4,963 4,885 4,998 4,587Share-based compensation 99 69 106 115 91Superannuation 398 407 468 388 400Total staff expenses 5,915 5,439 5,459 5,501 5,078
Occupancy and Equipment ExpensesOperating lease rentals 654 665 635 580 591Depreciation of property, plant and equipment 270 271 260 247 245Other occupancy expenses 174 198 177 164 185Total occupancy and equipment expenses 1,098 1,134 1,072 991 1,021
Information Technology ServicesApplication maintenance and development 721 553 431 734 588Data processing 183 200 200 179 198Desktop 142 153 183 129 140Communications 217 179 179 205 155
Amortisation of software assets (3) 598 563 903 563 517Software write-offs 13 71 6 13 71IT equipment depreciation 93 80 60 79 67Total information technology services 1,967 1,799 1,962 1,902 1,736
Other ExpensesPostage and stationery 159 177 183 151 163Transaction processing and market data 156 138 143 131 120Fees and commissions:
Professional fees 490 671 379 470 651Other 239 133 73 65 5
Advertising, marketing and loyalty 453 496 462 362 400Amortisation of intangible assets (excluding software and merger related amortisation) 11 13 11 - -
Non-lending losses (4) 656 838 122 617 829Impairment on investments in subsidiaries - - - - 231Other 125 157 263 148 242Total other expenses 2,289 2,623 1,636 1,944 2,641Operating expenses before restructuring, separation and transaction costs 11,269 10,995 10,129 10,338 10,476
Restructuring, separation and transaction costs (5) 104 34 4 295 227
Total operating expenses (6) (7) 11,373 11,029 10,133 10,633 10,703
(1) Information has been restated and presented on a continuing operations basis. (2) Comparative information has been restated to conform to presentation in the current year. (3) The year ended 30 June 2019 includes $161 million of amortisation of prepaid software licences (30 June 2018: $136 million; 30 June 2017: $141 million). The year
ended 30 June 2017 includes a $393 million one-off expense for acceleration of amortisation on certain software assets. (4) The year ended 30 June 2019 includes $145 million professional indemnity insurance recovery in relation to the AUSTRAC civil penalty. The year ended 30 June 2018 includes
$700 million AUSTRAC civil penalty. (5) The year ended 30 June 2019 includes $102 million of separation and transaction costs (30 June 2018: $30 million) and $2 million of merger related amortisation
(30 June 2018: $4 million; 30 June 2017: $4 million). (6) The year ended 30 June 2019 includes $269 million of expenses due to the consolidation of AHL Holdings Pty Ltd (trading as Aussie Home Loans) and eChoice mortgage
broking operations (30 June 2018: $199 million). (7) The year ended 30 June 2019 includes a $534 million provision for historical Aligned Advice remediation issues and associated program costs, and $384 million of Wealth
and Banking customer refunds and associated program costs.
139

Strategic report
Financial performance
Risk management
Corporate governance
Directors’ report
Financial report
Other information
Notes to the financial statements
Salaries and related on-costs include annual leave, long service leave, employee incentives and relevant taxes. Staff expenses are recognised over the period the employee renders the service. Long service leave is discounted to present value using assumptions relating to staff departures, leave utilisation and future salary.
Share-based compensation includes both payments which may be cash or equity settled. Cash settled share-based remuneration is recognised as a liability and re-measured to fair value until settled. The changes in fair value are recognised as staff expenses. Equity settled remuneration is fair valued at the grant date and amortised to staff expenses over the vesting period, with a corresponding increase in the employee compensation reserve.
Superannuation expense includes expenses relating to defined contribution and defined benefit superannuation plans. Defined contribution expense is recognised in the period the service is provided, whilst the defined benefit expense, which measures current and past service costs is determined by an actuarial calculation.
Occupancy and equipment expenses include depreciation which is calculated using the straight line method over the asset’s estimated useful life and operating lease rentals which are recognised on a straight line basis over the lease term.
IT services expenses are recognised as incurred unless they qualify for capitalisation as computer software due to the expenditure generating probable future economic benefits. If capitalised, the computer software is subsequently amortised over its estimated useful life. The Group assesses at each Balance Sheet date useful lives and residual values and whether there is any objective evidence of impairment. If an asset’s carrying value is greater than its recoverable amount, the carrying amount is written down immediately to its recoverable amount.
Other expenses are recognised as the relevant service is rendered. Operating expenses related to provisions are recognised for present obligations arising from past events where a payment to settle the obligation is probable and can be reliably estimated.
Critical accounting judgements and estimates
Actuarial valuations of the Group’s defined benefit superannuation plans’ obligations are dependent on a series of assumptions set out in Note 10.2 including inflation rates, discount rates and salary growth rates. Changes in these assumptions impact the fair value of the plans’ obligations, assets, superannuation expense and actuarial gains and losses recognised in Other Comprehensive Income.
140 Commonwealth Bank of Australia Annual Report 2019

The income tax expense for the year is determined from the profit before income tax as follows:
Group (1) Bank30 Jun 19 30 Jun 18 30 Jun 17 30 Jun 19 30 Jun 18
$M $M $M $M $MProfit before income tax 11,763 13,022 13,255 10,407 12,110
Prima facie income tax at 30% 3,529 3,907 3,977 3,122 3,633Effect of amounts which are non-deductible/(assessable) in calculating taxable income:Taxation offsets and other dividend adjustments - (7) (11) (365) (612)
Tax losses not previously brought to account - - (56) - -
Offshore tax rate differential (40) (36) (46) (8) (9)
Offshore banking unit (32) (39) (42) (32) (38)
Effect of changes in tax rates 1 15 3 1 15
Income tax (over)/under provided in previous years (101) (70) (70) (105) (69)
Non-deductible expense provision (2) - 210 - - 210
Other 34 (28) 29 11 105
Total income tax expense 3,391 3,952 3,784 2,624 3,235
Effective tax rate (%) 28. 8 30. 3 28. 5 25. 2 26. 7
(1) Information has been restated and presented on a continuing operations basis. (2) Relates to the AUSTRAC civil penalty, which is non-deductible for tax purposes.
Group (1) Bank Income tax expense attributable to profit from 30 Jun 19 30 Jun 18 30 Jun 17 30 Jun 19 30 Jun 18ordinary activities $M $M $M $M $M Australia
Current tax expense 3,238 3,916 3,687 2,755 3,312
Deferred tax benefit (380) (416) (292) (256) (157)
Total Australia 2,858 3,500 3,395 2,499 3,155
Overseas
Current tax expense 452 937 359 87 77
Deferred tax expense/(benefit) 81 (485) 30 38 3
Total Overseas 533 452 389 125 80Income Tax Expense attributable to profit from ordinary activities 3,391 3,952 3,784 2,624 3,235
(1) Information has been restated and presented on a continuing operations basis.
141

Strategic Financial Risk Corporate Directors’ Financial Other report performance management governance report report information
Notes to the financial statements
Group Bank30 Jun 19 30 Jun 18 30 Jun 17 30 Jun 19 30 Jun 18
$M $M $M $M $MDeferred tax asset balances comprise temporary differences attributable to:Amounts recognised in the Income Statement and opening retained profits: (1)
Provision for employee benefits 425 452 493 398 391Provisions for impairment on loans, bills discounted and other receivables 1,345 991 1,032 1,230 913
Other provisions not tax deductible until expense incurred 497 221 201 331 154
Defined benefit superannuation plan 357 339 320 357 339Unearned income 250 267 228 250 267Other 312 296 225 308 273
Total amount recognised in the Income Statement and opening retained profits (1) 3,186 2,566 2,499 2,874 2,337
Amounts recognised directly in Other Comprehensive Income:
Cash flow hedge reserve 142 114 123 19 11Other reserves 41 22 12 46 28
Total amount recognised directly in Other Comprehensive Income 183 136 135 65 39
Total deferred tax assets (before set off) 3,369 2,702 2,634 2,939 2,376Set off to tax (1,694) (1,263) (1,728) (1,369) (946)Net deferred tax assets 1,675 1,439 906 1,570 1,430
Deferred tax liability balances comprise temporary differences attributable to:Amounts recognised in the Income Statement and opening retained profits: (1)
Lease financing 162 200 235 91 100Intangible assets 56 56 64 56 56Financial instruments 3 30 179 13 10Insurance - - 485 - -Investments in associates 148 131 122 - -Other 118 83 246 38 39
Total amount recognised in the Income Statement and opening retained profits (1) 487 500 1,331 198 205
Amounts recognised directly in Other Comprehensive Income:
Revaluation of properties 82 81 76 84 80Foreign currency translation reserve 36 18 8 - -Cash flow hedge reserve 481 48 70 479 45Defined benefit superannuation plan 487 498 445 487 498Investment securities revaluation reserve 121 - - 121 -Available-for-sale investments reserve - 118 130 - 118
Total amount recognised directly in Other Comprehensive Income 1,207 763 729 1,171 741
Total deferred tax liabilities (before set off) 1,694 1,263 2,060 1,369 946
Set off to tax (1,694) (1,263) (1,728) (1,369) (946)
Net deferred tax liabilities - - 332 - -
(1) The adoption of AASB 9 and AASB 15 on 1 July 2018 resulted in an increase in the Group’s deferred tax asset of $435 million (Bank: $353 million) and an increase in the Group’s deferred tax liability of $101 million (Bank: $27 million) recognised through opening retained profits. As permitted by AASB 9 and AASB 15, comparative information has not been restated. For details on the adoption of AASB 9 and AASB 15, refer to Note 1.1.
142 Commonwealth Bank of Australia Annual Report 2019

Deferred tax assets have not been recognised in respect of the following items because it is not considered probable that future taxable profit will be available against which they can be realised:
Group Bank 30 Jun 19 30 Jun 18 30 Jun 17 30 Jun 19 30 Jun 18
Deferred tax assets not taken to account $M $M $M $M $M Tax losses and other temporary differences on revenue account that:
Expire under current legislation - - 52 - -
Do not expire under current legislation - 47 29 - -
Total - 47 81 - -
Tax Consolidation
The Bank has recognised a tax consolidation contribution to the wholly-owned tax consolidated entity of $98 million (2018: $98 million).
The amount receivable by the Bank under the tax funding agreement was $320 million as at 30 June 2019 (2018: $283 million receivable). This balance is included in ‘Other assets’ in the Bank’s separate Balance Sheet.
Income tax on the profit or loss for the period comprises current and deferred tax.
Current tax is the expected tax payable on the taxable income for the year, using tax rates enacted at the Balance Sheet date, and any adjustment to tax payable in respect of previous years.
Deferred tax is calculated using the Balance Sheet method where temporary differences are identified by comparing the carrying amounts of assets and liabilities for financial reporting purposes to their tax bases.
The amount of deferred tax recognised is based on the expected manner of realisation or settlement of the carrying amount of assets and liabilities (i.e. through use or through sale), using tax rates which are expected to apply when the deferred tax asset is realised or the deferred tax liability is settled.
A deferred tax asset is only recognised to the extent that it is probable that future taxable profits will be available for it to be used against. Deferred tax assets and liabilities are offset where they relate to income tax levied by the same taxation authority on either the same taxable entity or different taxable entities within the same taxable group.
The Bank and its wholly owned Australian Subsidiaries elected to be treated as a single entity “the tax consolidated group” under the tax consolidation regime from 1 July 2002. The members of the tax consolidated group have entered into tax funding and tax sharing agreements, which set out the funding obligations and members.
Any current tax liabilities / assets and deferred tax assets from unused tax losses from subsidiaries in the tax consolidated group are recognised by the Bank legal entity and funded in line with the tax funding arrangement.
The measurement and disclosure of deferred tax assets and liabilities have been performed on a modified stand-alone basis under UIG 1052 ‘Tax Consolidation Accounting’.
Critical accounting judgements and estimates
Provisions for taxation require significant judgement with respect to outcomes that are uncertain. For such uncertainties, the Group has estimated the tax provisions based on the expected outcomes.
143

Strategic Financial Risk Corporate Directors’ Financial Other report performance management governance report report information
Notes to the financial statements
Group (3)
30 Jun 19 30 Jun 18 30 Jun 17
Earnings per ordinary share (1)
Earnings per share from continuing operations: (2)
Basic 473. 7 518. 8 549. 9
Diluted 457. 5 503. 2 532. 9
Earnings per share:
Basic 485. 6 534. 3 577. 3
Diluted 468. 6 517. 7 558. 8
Cents per Share
(1) EPS calculations are based on actual amounts prior to rounding to the nearest million. (2) The information has been restated and presented on a continuing operations basis. (3) The difference between earnings per share from continuing operations and earnings per share represents earnings per share from discontinued operations.
Group 30 Jun 19 30 Jun 18 30 Jun 17
$M $M $M Profit after income tax from continuing operations 8,372 9,070 9,471
Less: Other equity instrument dividends - - -
Less: Non-controlling interests (12) (13) (13)
Continuing operations earnings used in calculation of basic earnings per share 8,360 9,057 9,458
Add: Profit impact of assumed conversions of loan capital 323 267 218
Continuing operations earnings used in calculation of fully diluted earnings per share 8,683 9,324 9,676
Reconciliation of earnings used in calculation of earnings per share
Continuing operations earnings used in calculation of basic earnings per share 8,360 9,057 9,458
Discontinued operations earnings used in calculation of basic earnings per share 211 272 470
Earnings used in calculation of basic earnings per share 8,571 9,329 9,928
Add: Profit impact of assumed conversions of loan capital 323 267 218
Earnings used in calculation of fully diluted earnings per share 8,894 9,596 10,146
Reconciliation of earnings from continuing operations used in calculation of earnings per share (1)
(1) Comparative information has been restated to reflect the impact of discontinued operations.
30 Jun 19 30 Jun 18 30 Jun 17$M $M $M
Weighted average number of ordinary shares used in the calculation of basic earnings per share 1,765 1,746 1,720
Effect of dilutive securities - executive share plans and convertible loan capital instruments 132 106 96
1,897 1,852 1,816Weighted average number of ordinary shares used in the calculation of fully diluted earnings per share
Number of Shares
Basic earnings per share (EPS) amounts are calculated by dividing the net profit for the year attributable to ordinary equity holders of the Bank by the weighted average number of ordinary shares on issue during the year, adjusted for any bonus element included in ordinary shares issued and excluding treasury shares held.
Diluted EPS is basic EPS adjusted for the impact of all securities on issue that can convert to CBA ordinary shares and would dilute basic EPS on conversion. It is calculated by dividing net profit attributable to ordinary equity holders of the Bank (after adding back interest on the convertible redeemable loan capital instruments) by the weighted average number of ordinary shares issued during the year (as calculated under basic earnings per share adjusted for the effects of dilutive convertible non-cumulative redeemable loan capital instruments and shares issuable under executive share plans).
144 Commonwealth Bank of Australia Annual Report 2019

The principal activities of the Group are carried out in the business segments below. These segments are based on the distribution channels through which the customer relationship is being managed.
During the year, the Group announced the sale of its global asset management business, CFSGAM, and Indonesian life insurance operation, PTCL. The Group’s business segment performance has been updated and presented on a continuing operations basis to exclude these businesses, which are disclosed as discontinued operations.
During the year, the Group also made a number of structural changes to its operating segments. This includes merging Bankwest with Retail Banking Services, transferring Commonwealth Financial Planning and General Insurance businesses from Wealth Management to Retail Banking Services and migrating Small Business banking customers from Retail Banking Services to Business and Private Banking. In addition, refinements have been made to the allocation of support units and other costs. These changes have not impacted the Group’s net profit, but have resulted in changes to the presentation of the Income Statement and the Balance Sheet of the affected segments.
The primary sources of revenue are interest and fee income (Retail Banking Services, Business and Private Banking, Institutional Banking and Markets, New Zealand and International Financial Services (IFS)) and insurance premium and funds management income (Wealth Management, New Zealand and IFS).
Revenues and expenses occurring between segments are subject to transfer pricing arrangements. All intra-group transactions are eliminated on consolidation.
Business segments are managed on the basis of net profit after income tax (“cash basis”). Management uses “cash basis” to assess performance and it provides the basis for the determination of the Bank’s dividends. The “cash basis” presents the Group’s underlying operating results, excluding a number of items that introduce volatility and/or one-off distortions of the Group’s current period performance. These items, such as hedging and IFRS volatility, are calculated consistently year on year and do not discriminate between positive and negative adjustments.
(i) Retail Banking Services
Retail Banking Services provides home loan, consumer finance and retail deposit products and servicing to all Retail Banking Services’ customers. Retail Banking Services also includes the Group’s General Insurance business in Australia, which is under strategic review and Commonwealth Financial Planning.
(ii) Business and Private Banking
Business and Private Banking provides specialised banking services to relationship managed business and agribusiness customers, private banking to high net worth individuals, margin lending and trading through CommSec, and retail banking products and servicing to non-relationship managed small business customers.
(iii) Institutional Banking and Markets
Institutional Banking and Markets services the Group’s major corporate, institutional and government clients using a relationship management model based on industry expertise and insights. The client offering includes debt raising, financial and commodities price risk management and transactional banking capabilities. Institutional Banking and Markets has international operations in London, New York, Japan, Singapore, Malta, Hong Kong, New Zealand, Beijing and Shanghai.
(iv) Wealth Management Wealth Management includes Platform Administration and Financial Advice. CFSGAM (including operations in Asia and Europe) and CommInsure Life have been presented as discontinued operations.
(v) New Zealand
New Zealand includes Banking and Funds Management businesses operating in New Zealand (excluding Institutional Banking and Markets). The sale of New Zealand life insurance business, Sovereign, was completed on 2 July 2018.
(vi) IFS and Corporate Centre
The following parts of the business are included in IFS and Corporate Centre:
International Financial Services includes the Indonesian retail and business banking operations, and associate investments in China and Vietnam. It does not include the Business and Private Banking, Institutional Banking and Markets and CFSGAM businesses in Asia;
Indonesian life insurance operation, PTCL, has been presented as a discontinued operation;
The sale of TymeDigital SA was completed on 1 November 2018. It has been presented as a discontinued operation.
Corporate Centre includes the results of unallocated Group support functions such as Investor Relations, Group Strategy, Secretariat and Treasury; and
Group wide elimination entries arising on consolidation, centrally raised provisions and other unallocated revenue and expenses.
145

30 J
un 1
9Re
tail
Busi
ness
In
stitu
tiona
lIF
S an
dBa
nkin
gan
d Pr
ivat
eBa
nkin
g an
dW
ealth
New
Corp
orat
eSe
rvic
esBa
nkin
gM
arke
tsM
anag
emen
tZe
alan
dCe
ntre
Tota
l$M
$M$M
$M$M
$M$M
Net
inte
rest
inco
me
9,34
25,
123
1,37
1-
1,89
638
818
,120
Oth
er b
anki
ng in
com
e:C
omm
issi
ons
1,38
378
118
1-
301
272,
673
Lend
ing
fees
197
391
344
-60
-99
2Tr
adin
g an
d ot
her i
ncom
e15
827
854
8-
8133
81,
403
Tota
l oth
er b
anki
ng in
com
e1,
738
1,45
01,
073
-44
236
55,
068
Tota
l ban
king
inco
me
11,0
806,
573
2,44
4-
2,33
875
323
,188
Fund
s m
anag
emen
t inc
ome
96-
-86
213
0(1
6)1,
072
Insu
ranc
e in
com
e14
9-
--
-(2
)14
7To
tal o
pera
ting
inco
me
11,3
256,
573
2,44
486
22,
468
735
24,4
07In
vest
men
t exp
erie
nce (1
)15
--
17-
(28)
4
Tota
l net
ope
ratin
g in
com
e be
fore
impa
irmen
t and
ope
ratin
g ex
pens
es11
,340
6,57
32,
444
879
2,46
870
724
,411
Ope
ratin
g ex
pens
es(4
,533
)(2
,409
)(1
,043
)(6
45)
(912
)(1
,727
)(1
1,26
9)Lo
an im
pairm
ent e
xpen
se(6
93)
(362
)(1
7)-
(102
)(2
7)(1
,201
)Ne
t pro
fit b
efor
e in
com
e ta
x6,
114
3,80
21,
384
234
1,45
4(1
,047
)11
,941
Inco
me
tax
(exp
ense
)/ben
efit
(1,8
47)
(1,1
44)
(313
)(7
4)(4
04)
345
(3,4
37)
Non
-con
trollin
g in
tere
sts
--
--
-(1
2)(1
2)Ne
t pro
fit a
fter t
ax fr
om c
ontin
uing
ope
ratio
ns -
"cas
h ba
sis"
4,
267
2,65
81,
071
160
1,05
0(7
14)
8,49
2N
et p
rofit
afte
r tax
from
dis
cont
inue
d op
erat
ions
--
-25
3-
(39)
214
Net p
rofit
afte
r tax
- "c
ash
basi
s" (2
)4,
267
2,65
81,
071
413
1,05
0(7
53)
8,70
6(L
oss)
/gai
n on
dis
posa
l and
acq
uisi
tion
of e
ntiti
es n
et o
f tra
nsac
tion
cost
s-
-13
(240
)17
9(1
3)(6
1)H
edgi
ng a
nd IF
RS
vola
tility
--
--
(48)
(31)
(79)
Oth
er n
on-c
ash
item
s(1
)-
-6
--
5Ne
t pro
fit a
fter t
ax -
"sta
tuto
ry b
asis
"4,
266
2,65
81,
084
179
1,18
1(7
97)
8,57
1
Addi
tiona
l inf
orm
atio
nAm
ortis
atio
n an
d de
prec
iatio
n(2
01)
(162
)(3
8)(2
0)(8
0)(4
73)
(974
)
Bala
nce
Shee
tTo
tal a
sset
s41
2,60
817
4,85
214
8,19
721
,093
94,3
2012
5,43
297
6,50
2To
tal l
iabi
litie
s27
3,60
314
0,54
115
0,20
925
,297
88,4
6622
8,73
790
6,85
3
(1)
Inve
stm
ent e
xper
ienc
e is
pre
sent
ed o
n a
pre-
tax
basi
s.
(2)
This
bal
ance
exc
lude
s no
n-ca
sh it
ems,
incl
udin
g $7
9 m
illion
unr
ealis
ed lo
sses
rela
ting
to h
edgi
ng a
nd IF
RS
vola
tility
, $82
milli
on tr
ansa
ctio
n an
d se
para
tion
cost
s as
soci
ated
with
the
disp
osal
of C
omm
Insu
re L
ife, $
71 m
illion
tran
sact
ion
and
sepa
ratio
n co
sts
asso
ciat
ed w
ith th
e di
spos
al o
f CFS
GAM
, $54
milli
on s
epar
atio
n co
sts
for N
ewC
o, $
33 m
illion
impa
irmen
t los
s an
d tra
nsac
tion
cost
s as
soci
ated
with
the
disp
osal
of C
ount
, $22
milli
on lo
ss in
clud
ing
trans
actio
n an
d se
para
tion
cost
s as
soci
ated
with
the
disp
osal
of T
ymeD
igita
l SA,
par
tly o
ffset
by
a $1
35 m
illion
gai
n ne
t of t
rans
actio
n an
d se
para
tion
cost
s as
soci
ated
with
the
disp
osal
of S
over
eign
and
$66
milli
on n
et g
ain
on a
cqui
sitio
n an
d di
spos
als
of o
ther
bu
sine
sses
, and
$1
milli
on e
xpen
se o
f Ban
kwes
t non
-cas
h ite
ms
and
a $6
milli
on g
ain
due
to tr
easu
ry s
hare
s va
luat
ion
adju
stm
ent.

30 J
un 1
8 (1
)
Reta
ilBu
sine
ssIn
stitu
tiona
lIF
S an
dBa
nkin
gan
d Pr
ivat
eBa
nkin
g an
dW
ealth
New
Corp
orat
eSe
rvic
esBa
nkin
gM
arke
tsM
anag
emen
tZe
alan
dCe
ntre
Tota
l$M
$M$M
$M$M
$M$M
Net
inte
rest
inco
me
9,64
55,
115
1,43
4-
1,76
038
818
,342
Oth
er b
anki
ng in
com
e:C
omm
issi
ons
1,39
382
020
1-
285
122,
711
Lend
ing
fees
268
355
434
-55
(3)
1,10
9Tr
adin
g an
d ot
her i
ncom
e16
625
060
2-
7530
21,
395
Tota
l oth
er b
anki
ng in
com
e1,
827
1,42
51,
237
-41
531
15,
215
Tota
l ban
king
inco
me
11,4
726,
540
2,67
1-
2,17
569
923
,557
Fund
s m
anag
emen
t inc
ome
169
--
841
112
(3)
1,11
9In
sura
nce
inco
me
242
--
--
(4)
238
Tota
l ope
ratin
g in
com
e11
,883
6,54
02,
671
841
2,28
769
224
,914
Inve
stm
ent e
xper
ienc
e (2)
8-
-10
-(1
0)8
Tota
l net
ope
ratin
g in
com
e be
fore
impa
irmen
t and
ope
ratin
g ex
pens
es11
,891
6,54
02,
671
851
2,28
768
224
,922
Ope
ratin
g ex
pens
es(4
,349
)(2
,230
)(1
,067
)(4
90)
(860
)(1
,999
)(1
0,99
5)Lo
an im
pairm
ent e
xpen
se(6
52)
(247
)(8
0)-
(74)
(26)
(1,0
79)
Net p
rofit
bef
ore
inco
me
tax
6,89
04,
063
1,52
436
11,
353
(1,3
43)
12,8
48In
com
e ta
x (e
xpen
se)/b
enef
it(2
,067
)(1
,218
)(3
54)
(106
)(3
78)
203
(3,9
20)
Non
-con
trollin
g in
tere
sts
--
--
-(1
3)(1
3)Ne
t pro
fit a
fter t
ax fr
om c
ontin
uing
ope
ratio
ns -
"cas
h ba
sis"
4,
823
2,84
51,
170
255
975
(1,1
53)
8,91
5N
et p
rofit
afte
r tax
from
dis
cont
inue
d op
erat
ions
--
-45
296
(51)
497
Net p
rofit
afte
r tax
- "c
ash
basi
s" (3
)4,
823
2,84
51,
170
707
1,07
1(1
,204
)9,
412
(Los
s)/g
ain
on d
ispo
sal a
nd a
cqui
sitio
n of
ent
ities
net
of t
rans
actio
n co
sts
58-
-(1
39)
(18)
(84)
(183
)H
edgi
ng a
nd IF
RS
vola
tility
--
--
8714
101
Oth
er n
on-c
ash
item
s(3
)-
-2
--
(1)
Net p
rofit
afte
r tax
- "s
tatu
tory
bas
is"
4,87
82,
845
1,17
057
01,
140
(1,2
74)
9,32
9
Addi
tiona
l inf
orm
atio
nAm
ortis
atio
n an
d de
prec
iatio
n(1
69)
(165
)(4
5)(1
8)(7
7)(4
57)
(931
)
Bala
nce
Shee
tTo
tal a
sset
s39
7,98
617
4,63
516
2,12
519
,459
90,0
2213
0,93
897
5,16
5To
tal l
iabi
litie
s26
8,40
013
6,60
315
3,64
424
,455
82,9
7624
1,22
790
7,30
5
(1)
Com
para
tive
info
rmat
ion
has
been
rest
ated
to c
onfo
rm to
pre
sent
atio
n in
the
curre
nt y
ear a
nd to
refle
ct a
num
ber o
f stru
ctur
al c
hang
es to
ope
ratin
g se
gmen
ts.
(2)
Inve
stm
ent e
xper
ienc
e is
pre
sent
ed o
n a
pre-
tax
basi
s.
(3)
This
bal
ance
exc
lude
s no
n-ca
sh it
ems,
incl
udin
g $1
01 m
illion
unr
ealis
ed g
ains
rel
atin
g to
hed
ging
and
IFR
S vo
latil
ity, $
118
milli
on tr
ansa
ctio
n an
d se
para
tion
cost
s as
soci
ated
with
the
disp
osal
of C
omm
Insu
re L
ife, $
91 m
illion
im
pairm
ent d
ue to
the
recl
assi
ficat
ion
of T
ymeD
igita
l SA
as d
isco
ntin
ued
oper
atio
n, $
21 m
illion
dem
erge
r cos
ts fo
r New
Co,
$18
milli
on tr
ansa
ctio
n an
d se
para
tion
cost
s as
soci
ated
with
the
disp
osal
of S
over
eign
, par
tly o
ffset
by
$58
milli
on g
ain
reco
gnis
ed o
n ac
quis
ition
of A
HL
and
$7 m
illion
net
gai
n on
acq
uisi
tion
and
disp
osal
s of
oth
er b
usin
esse
s; a
nd $
3 m
illion
exp
ense
of B
ankw
est n
on-c
ash
item
s an
d a
$2 m
illion
gai
n du
e to
trea
sury
sha
res
valu
atio
n ad
just
men
t.

Strategic Financial Risk Corporate Directors’ Financial Other report performance management governance report report information
Notes to the financial statements
Group (1)
30 Jun 19 30 Jun 18 30 Jun 17Financial performance and position $M % $M % $M %Income
Australia 20,994 86. 3 21,837 86. 9 21,321 87. 1
New Zealand 2,444 10. 0 2,297 9. 1 2,231 9. 1
Other locations (2) 899 3. 7 996 4. 0 931 3. 8
Total Income 24,337 100. 0 25,130 100. 0 24,483 100. 0
Non-Current Assets
Australia 12,453 93. 2 13,473 93. 3 15,301 91. 8
New Zealand 635 4. 8 581 4. 0 1,045 6. 2
Other locations (2) 261 2. 0 387 2. 7 329 2. 0
Total non-current assets (3) 13,349 100. 0 14,441 100. 0 16,675 100. 0
(1) Information has been restated and presented on a continuing operations basis. For details on the Group’s discontinued operations refer to Note 11.3. (2) Other locations include: United Kingdom, United States, Japan, Singapore, Malta, Hong Kong, Indonesia, China and Vietnam. Comparative periods also includes South
Africa. (3) Non-current assets include Property, plant and equipment, Investments in associates and joint ventures, and Intangibles.
The geographical segment represents the location in which the transaction was recognised.
Operating segments are reported based on the Group’s organisational and management structures. Senior management review the Group’s internal reporting based around these segments, in order to assess performance and allocate resources.
All transactions between segments are conducted on an arm’s length basis, with inter-segment revenue and costs being eliminated in “Other”.
148 Commonwealth Bank of Australia Annual Report 2019

Lending is the Group’s primary business activity, generating most of its net interest income and lending fees. The Group satisfies customers’ needs for borrowed funds by providing a broad range of lending products in Australia, New Zealand and other jurisdictions. As a result of its lending activities the Group assumes credit risk arising from the potential that borrowers will fail to meet their obligations in accordance with agreed lending terms.
This section provides details of the Group’s lending portfolio by type of product and geographical regions, analysis of the credit quality of the Group’s lending portfolio and the related impairment provisions.
Group Bank30 Jun 19 30 Jun 18 30 Jun 19 30 Jun 18
Note $M $M $M $MAustralia
Overdrafts 26,297 25,217 26,297 25,217
Home loans (1) (2) 467,361 451,367 459,690 444,186
Credit card outstandings 11,271 11,877 11,271 11,877
Lease financing 4,410 4,318 3,532 3,268
Bills discounted (3) 1,955 4,280 1,955 4,280
Term loans and other lending 141,695 147,028 141,679 147,009
Total Australia 652,989 644,087 644,424 635,837
Overseas
Overdrafts 1,842 1,657 306 281
Home loans (1) 55,581 50,298 341 397
Credit card outstandings 1,069 993 - -
Lease financing 8 25 1 4
Term loans and other lending 49,492 50,969 20,662 24,348
Total overseas 107,992 103,942 21,310 25,030
Gross loans, bills discounted and other receivables 760,981 748,029 665,734 660,867
Less
Provisions for Loan Impairment: (4) 3.2
Collective provision (3,820) (2,735) (3,455) (2,482)
Individually assessed provisions (895) (870) (801) (779)
Unearned income:
Term loans (739) (692) (730) (692)
Lease financing (386) (367) (272) (264)
(5,840) (4,664) (5,258) (4,217)
Net loans, bills discounted and other receivables 755,141 743,365 660,476 656,650
(1) Home loans balance includes residential mortgages that have been assigned to securitisation vehicles and covered bond trusts. Further detail on these residential mortgages is disclosed in Note 4.4.
(2) These balances are presented gross of mortgage offset balances as required under accounting standards. (3) On adoption of AASB 9 on 1 July 2018, bills discounted were reclassified from the trading category under AASB 139 to the amortised cost category under AASB 9 as the
bills no longer meet the definition of a trading asset and they are held under the business model to collect. The reclassification did not have an impact on the Group’s retained profits. As permitted by AASB 9, comparative information has not been restated.
(4) The adoption of AASB 9 impairment requirements on 1 July 2018 resulted in $968 million increase in the Group’s collective provisions on loans, bills discounted and other receivables (Bank: $895 million) and $87 million increase in collective provisions for off-balance sheet instruments (Bank: $84 million). As permitted by AASB 9, comparative information has not been restated. For details on the adoption of AASB 9 refer to Note 1.1.
149

Strategic Financial Risk Corporate Directors’ Financial Other report performance management governance report report information
Notes to the financial statements
Based on behavioural terms and current market conditions, the amounts expected to be recovered within 12 months of the Balance Sheet date are $185,208 million (2018: $175,826 million) for the Group, and $167,316 million (2018: $159,688 million) for the Bank.
Finance lease receivables
The Group and the Bank provide finance leases to a broad range of clients to support financing needs in acquiring transportation assets such as trains, aircraft, ships and major production and manufacturing equipment.
Finance lease receivables are included within Loans, bills discounted and other receivables to customers.
Group 30 Jun 19 30 Jun 18
Gross Present Value Gross Present Value Investment in of Minimum Investment in of Minimum
Finance Lease Unearned Lease Payment Finance Lease Unearned Lease Payment Receivable Income Receivable Receivable Income Receivable
$M $M $M $M $M $M Not later than one year 1,586 (167) 1,419 1,706 (162) 1,544
One year to five years 2,656 (207) 2,449 2,455 (190) 2,265
Over five years 176 (12) 164 182 (15) 167
4,418 (386) 4,032 4,343 (367) 3,976
Bank 30 Jun 19 30 Jun 18
Gross Present Value Gross Present Value Investment in of Minimum Investment in of Minimum Finance Lease Unearned Lease Payment Finance Lease Unearned Lease Payment
Receivable Income Receivable Receivable Income Receivable $M $M $M $M $M $M
Not later than one year 1,284 (118) 1,166 1,248 (116) 1,132
One year to five years 2,084 (143) 1,941 1,864 (135) 1,729
Over five years 165 (11) 154 160 (13) 147
3,533 (272) 3,261 3,272 (264) 3,008
Loans, bills discounted and other receivables include overdrafts, home loans, credit card and other personal lending, term loans, and discounted bills. These financial assets are held within a business model whose objective is to hold financial assets in order to collect contractual cash flows. The contractual cash flows on these financial assets comprise the payment of principal and interest only. These instruments are accordingly measured at amortised cost.
Loans, bills discounted and other receivables are recognised on settlement date, when funding is advanced to the borrowers. They are initially recognised at their fair value plus directly attributable transaction costs such as broker fees. Subsequent to initial recognition, they are measured at amortised cost using the effective interest rate method and are presented net of provisions for impairment. For the accounting policy for provisions for impairment, refer to Note 3.2. For information on the Group’s management of credit risk, refer to Note 9.2.
Finance leases, where the Group acts as lessor, are also included in Loans, bills discounted and other receivables. Finance leases are those where substantially all the risks and rewards of the lease asset have been transferred to the lessee. Lease receivables are recognised at an amount equal to the net investment in the lease. Finance lease income reflects a constant periodic return on this net investment and is recognised within interest income in the Income Statement.
Critical accounting judgements and estimates
When applying this effective interest method the Group has estimated the behavioural term of each loan portfolio by reference to historical prepayment rates and the contractual maturity.
150 Commonwealth Bank of Australia Annual Report 2019

Contractual maturity tables
Group
Maturing 1 Maturing MaturingYear Between 1 After
or Less and 5 Years 5 Years TotalIndustry (1) $M $M $M $MAustralia
Sovereign 14,139 2,117 506 16,762
Agriculture 3,647 5,273 371 9,291
Bank and other financial 5,470 3,046 159 8,675
Home loans 11,859 51,092 404,410 467,361
Construction 1,381 1,494 363 3,238
Other personal 6,848 12,978 1,682 21,508
Asset financing 3,065 4,757 125 7,947
Other commercial and industrial 41,763 66,223 10,221 118,207
Total Australia 88,172 146,980 417,837 652,989
Overseas
Sovereign 446 982 8 1,436
Agriculture 3,201 5,874 1,392 10,467
Bank and other financial 2,253 4,295 89 6,637
Home loans 3,155 709 51,717 55,581
Construction 295 164 242 701
Other personal 1,264 378 282 1,924
Asset financing 22 191 203 416
Other commercial and industrial 9,119 14,780 6,931 30,830
Total overseas 19,755 27,373 60,864 107,992
Gross loans, bills discounted and other receivables 107,927 174,353 478,701 760,981
Maturity Period at 30 June 2019
(1) The industry split has been prepared in line with industry exposures in Note 9.2.
Maturing 1 Maturing MaturingYear Between 1 After
or Less and 5 Years 5 Years TotalInterest rate $M $M $M $MAustralia 74,978 128,798 332,678 536,454
Overseas 18,408 21,952 11,767 52,127
Total variable interest rates 93,386 150,750 344,445 588,581
Australia 13,194 18,182 85,159 116,535
Overseas 1,347 5,421 49,097 55,865
Total fixed interest rates 14,541 23,603 134,256 172,400
Gross loans, bills discounted and other receivables 107,927 174,353 478,701 760,981
151

Strategic report
Financial performance
Risk management
Corporate governance
Directors’ report
Financial report
Other information
Notes to the financial statements
Group
Maturing 1 Maturing MaturingYear Between 1 After
or Less and 5 Years 5 Years TotalIndustry (1) $M $M $M $MAustralia
Sovereign 13,745 2,490 588 16,823
Agriculture 3,589 5,078 331 8,998
Bank and other financial 6,805 5,818 328 12,951
Home loans 9,861 41,930 399,576 451,367
Construction 1,223 1,465 340 3,028
Other personal 7,663 13,976 2,019 23,658
Asset financing 3,188 5,263 130 8,581
Other commercial and industrial 42,482 65,382 10,817 118,681
Total Australia 88,556 141,402 414,129 644,087
Overseas
Sovereign 1,023 466 82 1,571
Agriculture 2,533 5,371 2,026 9,930
Bank and other financial 3,684 3,206 185 7,075
Home loans 3,202 657 46,439 50,298
Construction 273 148 217 638
Other personal 1,190 333 321 1,844
Asset financing 23 173 261 457
Other commercial and industrial 7,954 17,153 7,022 32,129
Total overseas 19,882 27,507 56,553 103,942
Gross loans, bills discounted and other receivables 108,438 168,909 470,682 748,029
Maturity Period at 30 June 2018
(1) The industry split has been prepared in line with industry exposures in Note 9.2.
Maturing 1 Maturing MaturingYear Between 1 After
or Less and 5 Years 5 Years TotalInterest rate $M $M $M $MAustralia 73,612 122,146 328,864 524,622
Overseas 18,035 22,730 13,235 54,000
Total variable interest rates 91,647 144,876 342,099 578,622
Australia 14,944 19,256 85,265 119,465
Overseas 1,847 4,777 43,318 49,942
Total fixed interest rates 16,791 24,033 128,583 169,407
Gross loans, bills discounted and other receivables 108,438 168,909 470,682 748,029
152 Commonwealth Bank of Australia Annual Report 2019

Group Bank30 Jun 19 30 Jun 18 30 Jun 17 30 Jun 19 30 Jun 18
Provisions for impairment losses $M $M $M $M $MCollective provision
Opening balance 2,763 2,747 2,818 2,510 2,482
Change on adoption of AASB 9 (1) 1,055 - - 979 -
Net collective provision funding 724 716 617 629 646
Impairment losses written off (901) (871) (894) (818) (789)
Impairment losses recovered 206 201 210 191 182
Other 57 (30) (4) 46 (11)
Closing balance 3,904 2,763 2,747 3,537 2,510
Individually assessed provisions
Opening balance 870 980 944 779 897
Net new and increased individual provisioning 619 625 670 556 559
Write-back of provisions no longer required (142) (262) (192) (127) (242)
Discount unwind to interest income (23) (25) (31) (23) (25)
Impairment losses written off (500) (548) (454) (446) (473)
Other 71 100 43 62 63
Closing balance 895 870 980 801 779
Total provisions for impairment losses 4,799 3,633 3,727 4,338 3,289
Less: Off Balance Sheet provisions (84) (28) (34) (82) (28)
Total provisions for loan impairment 4,715 3,605 3,693 4,256 3,261
(1) The adoption of AASB 9 impairment requirements on 1 July 2018 resulted in $968 million increase in the Group’s collective provisions on loans, bills discounted and other receivables (Bank: $895 million) and $87 million increase in collective provisions for off-balance sheet instruments (Bank: $84 million). As permitted by AASB 9, comparative information has not been restated. For details on the adoption of AASB 9 refer to Note 1.1.
Of the total $1,401 million loans written-off by the Group during the year ended 30 June 2019, $424 million remain subject to enforcement activity. Of the total $1,264 million loans written-off by the Bank during the year ended 30 June 2019, $394 million remain subject to enforcement activity.
Group Bank30 Jun 19 30 Jun 18 30 Jun 17 30 Jun 19 30 Jun 18
Provision ratios % % % % %Total provisions for impaired assets as a % of gross impaired assets (1) 32. 77 33. 60 36. 05 35. 36 37. 18
Total provisions for impairment losses as a % of gross loans and acceptances 0. 63 0. 49 0. 51 0. 65 0. 50
(1) Gross impaired assets include non-performing facilities, restructured facilities and unsecured retail managed facilities 90 days or more past due. For impaired assets classification refer to Note 9.2.
Group Bank 30 Jun 19 30 Jun 18 30 Jun 17 30 Jun 19 30 Jun 18
Loan impairment expense $M $M $M $M $M Net collective provision funding 724 716 617 629 646
Net new and increased individual provisioning 619 625 670 556 559
Write-back of individually assessed provisions (142) (262) (192) (127) (242)
Total loan impairment expense 1,201 1,079 1,095 1,058 963
153

Strategic Financial Risk Corporate Directors’ Financial Other report performance management governance report report information
Notes to the financial statements
Movement in provisions for impairment and credit exposures by ECL stage
The tables below provide movements in the Group’s and the Bank’s impairment provisions and credit exposures by ECL stage for the year ended 30 June 2019.
Movements in provisions for impairment in the tables below are attributable to the following items:
Net transfers between stages: net movements in provisions for impairment due to transfers of credit exposures between Stage 1, Stage 2 and Stage 3 prior to re-measurement between 12-month and lifetime ECL.
Net re-measurement on transfers between stages: net movements in provisions for impairment due to re-measurement between 12 month ECL and lifetime ECL as a result of transfers between stages.
Impact of transfers between 12 months and lifetime ECL: a total of net transfers between stages and net re-measurement on transfers between stages.
Net financial assets originated: net movements in provisions for impairment due to financial assets originated as well as exposure changes for existing credit exposures due to maturities, repayments or credit limit changes as well as changes in foreign exchange rates.
Movements in existing IAP including write-backs: net movements in existing Individually Assessed Provisions (IAP) excluding movements to or from collective provisions and write-offs.
Write-offs: decreases in the provisions for impairment due to the de-recognition of loans when there is no reasonable expectation of recovery.
Movement due to risk parameter and other changes: movements in provisions for impairment due to changes in credit risk parameters, forward looking economic scenarios or other assumptions as well as other changes in underlying credit quality that do not lead to transfers between Stage 1, Stage 2 and Stage 3.
Movements in credit exposures in the tables below are attributable to the following items:
Net transfers between stages and financial assets originated: net movements in credit exposures due to transfers between Stage 1, Stage 2 and Stage 3 and due to financial assets originated as well as changes in existing credit exposures due to maturities, repayments or credit limit changes as well as changes in foreign exchange rates.
Write-offs: the de-recognition of credit exposures when there is no reasonable expectation of recovery.
Group (1)
30 Jun 19Stage 1 Stage 2 Stage 3 Stage 3
Collectively Collectively Collectively IndividuallyAssessed Assessed Assessed Assessed Total
$M $M $M $M $MProvisions for impairment losses (2)
Opening balance 873 2,525 420 870 4,688
Net transfers between stages 700 (833) 14 119 -
Net re-measurement on transfers between stages (1,072) 1,596 568 - 1,092
Impact of transfers between 12 months and lifetime ECL (372) 763 582 119 1,092
Net financial assets originated 341 (999) (77) - (735)
Movements in existing IAP including write-backs - - - 406 406
Write-offs - - (901) (500) (1,401)
Movements due to risk parameter and other changes 63 230 456 - 749
Closing balance 905 2,519 480 895 4,799
Credit exposures (2) (3)
Opening balance 709,231 190,688 4,017 2,020 905,956 Net transfers between stages and financial assets originated 38,727 (26,418) 1,490 698 14,497
Write-offs - - (901) (500) (1,401)
Closing balance 747,958 164,270 4,606 2,218 919,052
(1) Refer to Note 9.2 for further analysis of provisions for impairment and credit exposures. (2) Movements in credit exposures exclude Cash and liquid assets and Receivables from other financial institutions. Movements in provisions for impairment losses include
provisions in relation to these financial assets. As at 30 June 2019, collective provisions in Stage 1 include $9 million in relation to these financial assets. (3) The assessment of significant increase in credit risk includes the impact of forward looking adjustments for emerging risk at an industry, geographical location or a
particular portfolio segment level, which are calculated by stressing an exposure’s internal credit rating grade at the reporting date. This accounts for approximately 65% of Stage 2 credit exposures for the Group as at 30 June 2019.
154 Commonwealth Bank of Australia Annual Report 2019

Movement in provisions for impairment and credit exposures by ECL stage (continued)
Bank (1)
30 Jun 19Stage 1 Stage 2 Stage 3 Stage 3
Collectively Collectively Collectively IndividuallyAssessed Assessed Assessed Assessed Total
$M $M $M $M $MProvisions for impairment losses (2)
Opening balance 783 2,313 393 779 4,268
Net transfers between stages 692 (832) 23 117 -
Net re-measurement on transfers between stages (1,037) 1,562 528 - 1,053
Impact of transfers between 12 months and lifetime ECL (345) 730 551 117 1,053
Net financial assets originated 323 (981) (40) - (698)
Movements in existing IAP including write-backs - - - 351 351
Write-offs - - (818) (446) (1,264)
Movements due to risk parameter and other changes 40 231 357 - 628
Closing balance 801 2,293 443 801 4,338
Credit exposures (2) (3)
Opening balance 631,044 170,870 3,746 1,578 807,238 Net transfers between stages and financial assets originated 30,762 (26,871) 1,241 681 5,813
Write-offs - - (818) (446) (1,264)
Closing balance 661,806 143,999 4,169 1,813 811,787
(1) Refer to Note 9.2 for further analysis of provisions for impairment and credit exposures. (2) Movements in credit exposures exclude cash and liquid assets and receivables from other financial institutions. Movements in provisions for impairment losses include
provisions in relation to these financial assets. As at 30 June 2019, collective provisions in Stage 1 include $9 million in relation these financial assets. (3) The assessment of significant increase in credit risk includes the impact of forward looking adjustments for emerging risk at an industry, geographical location or a
particular portfolio segment level, which are calculated by stressing an exposure’s internal credit rating grade at the reporting date. This accounts for approximately 65% of Stage 2 credit exposures for the Bank as at 30 June 2019.
Movements in provisions for impairment during the year were due to the following:
A net increase in the Group’s Stage 1 credit exposures of $38,727 million (Bank: $30,762 million) driven by home loans portfolio growth, partly offset by net transfers from Stage 1 to Stage 2 and Stage 3 reflecting increases in corporate troublesome assets, heightened consumer finance arrears and forward looking adjustments.
A net reduction in the Group’s Stage 2 credit exposures of $26,418 million (Bank: $26,871 million) mainly driven by corporate portfolio optimisation, partly offset by net transfers to Stage 2, mainly from Stage 1 reflecting increases in corporate troublesome assets, heightened consumer finance arrears and forward looking adjustments. The impact of forward looking adjustments accounts for approximately 65% of the Group’s and the Bank’s Stage 2 credit exposures.
A net increase in the Group’s Stage 3 credit exposures of $787 million (Bank: $658 million) driven by net transfers to Stage 3 from Stage 1 and Stage 2 reflecting increases in corporate troublesome assets and impaired home loans, partly offset by write-offs.
155

Strategic Financial Risk Corporate Directors’ Financial Other report performance management governance report report information
Notes to the financial statements
Sensitivity of provisions for impairment to changes in forward looking assumptions
As described in Note 1.1, the Group applies four alternative macro-economic scenarios (Central, Upside, Downside and Severe Downside scenarios) to reflect unbiased probability-weighted range of possible future outcomes in estimating ECL.
Assuming 100% weighting on the Central scenario and holding all other assumptions (including forward looking adjustments) constant the Group’s provisions for impairment would be approximately $3,639 million (Bank: $3,290 million) compared to $4,799 million (Bank: $4,338 million) provisions for impairment recognised as at 30 June 2019.
Assuming 100% weighting on the Downside Scenario and holding all other assumptions (including forward looking adjustments) constant the Group’s total provisions for impairment would be approximately $4,802 million (Bank: $4,338 million).
By providing loans to customers, the Group bears the risk that the future circumstances of customers might change, including their ability to repay their loans in part or in full. While the Group’s credit and responsible lending policies aim to minimise this risk, there will always be instances where the Group will not receive the full amount owed and hence a provision for impaired loans will be necessary.
On 1 July 2018, the Group adopted the AASB 9 impairment requirements, which resulted in the implementation of an expected credit loss impairment model. As a result, from 1 July 2018 provisions are recognised in accordance with the AASB 9 expected credit loss approach. The details of the Group’s accounting policies and critical accounting judgements and estimates involved in calculating AASB 9 impairment provisions for the year ended 30 June 2019 are provided in Note 1.1.
156 Commonwealth Bank of Australia Annual Report 2019

Group Individually assessed provisions by 30 Jun 19 30 Jun 18 30 Jun 17 30 Jun 16 30 Jun 15industry classification $M $M $M $M $M Australia
Sovereign - - - - -
Agriculture 51 56 47 42 133
Bank and other financial 14 16 27 29 36
Home loans 246 236 249 193 148
Construction 76 21 25 25 20
Other personal 3 6 9 7 10
Asset financing 10 16 18 28 28
Other commercial and industrial 369 343 442 483 400
Total Australia 769 694 817 807 775
Overseas
Sovereign - - - - -
Agriculture 46 25 25 23 14
Bank and other financial - - - 4 -
Home loans 4 5 4 6 10
Construction - 1 1 8 1
Other personal 3 - - 1 -
Asset financing - - 10 10 10
Other commercial and industrial 73 145 123 85 77
Total overseas 126 176 163 137 112
Total individually assessed provisions 895 870 980 944 887
157

Strategic report
Financial performance
Risk management
Corporate governance
Directors’ report
Financial report
Other information
Notes to the financial statements
Group 30 Jun 19 30 Jun 18 30 Jun 17 30 Jun 16 30 Jun 15
Loans written off by industry classification $M $M $M $M $M Australia
Sovereign - - - - -
Agriculture 59 28 17 84 65
Bank and other financial 1 3 1 10 36
Home loans 134 126 115 82 72
Construction 44 13 16 11 14
Other personal 787 764 792 747 686
Asset financing 17 23 41 54 45
Other commercial and industrial 126 179 210 249 404
Total Australia 1,168 1,136 1,192 1,237 1,322
Overseas
Sovereign - - - - -
Agriculture 2 3 15 7 3
Bank and other financial 5 5 5 - 69
Home loans 2 2 4 7 8
Construction 2 1 8 - -
Other personal 70 65 60 54 42
Asset financing - - - - -
Other commercial and industrial 152 207 64 112 35
Total overseas 233 283 156 180 157
Gross loans written off 1,401 1,419 1,348 1,417 1,479
Less recovery of amounts previously written off:
Australia 190 187 194 211 165
Overseas 16 14 16 14 11
Total amounts recovered 206 201 210 225 176
Net loans written off 1,195 1,218 1,138 1,192 1,303
158 Commonwealth Bank of Australia Annual Report 2019

Group30 Jun 19 30 Jun 18 30 Jun 17 30 Jun 16 30 Jun 15
Loans recovered by industry classification $M $M $M $M $M Australia
Sovereign - - - - -
Agriculture - - - 1 -
Bank and other financial - 1 1 27 9
Home loans 4 2 3 3 3
Construction 1 - 1 1 -
Other personal 169 165 170 154 125
Asset financing 2 5 7 4 4
Other commercial and industrial 14 14 12 21 24
Total Australia 190 187 194 211 165
Overseas
Sovereign - - - - -
Agriculture - - - - -
Bank and other financial - - - 1 -
Home loans 1 1 1 1 1
Construction - 1 1 - -
Other personal 11 10 11 10 10
Asset financing - - - - -
Other commercial and industrial 4 2 3 2 -
Total overseas 16 14 16 14 11
Total loans recovered 206 201 210 225 176
159

Strategic report
Financial performance
Risk management
Corporate governance
Directors’ report
Financial report
Other information
Notes to the financial statements
Stable and well diversified funding sources are critical to the Group’s ability to fund its lending and investing activities and support growing its business.
Our main sources of funding include customer deposits and term funds raised in domestic and offshore wholesale markets via issuing debt securities and loan capital. The Group also relies on repurchase agreements as a source of short-term wholesale funding. Refer to Note 9.4 for the Group’s management of liquidity and funding risk.
Group (1) Bank 30 Jun 19 30 Jun 18 30 Jun 19 30 Jun 18
$M $M $M $M AustraliaCertificates of deposit 30,924 31,405 33,331 33,496Term deposits 148,313 149,924 148,491 150,086On-demand and short-term deposits 308,299 300,607 308,338 300,768Deposits not bearing interest 49,274 46,082 49,245 46,058Securities sold under agreements to repurchase 19,099 14,696 19,215 14,806Total Australia 555,909 542,714 558,620 545,214
OverseasCertificates of deposit 12,144 8,509 8,818 6,069Term deposits 39,147 43,896 5,869 13,707On-demand and short-term deposits 23,491 22,640 481 1,154Deposits not bearing interest 5,349 4,475 63 56Total overseas 80,131 79,520 15,231 20,986Total external deposits and other public borrowings 636,040 622,234 573,851 566,200
(1) Current year balances reflect the adoption of AASB 9 ‘Financial Instruments’ on 1 July 2018. As permitted by AASB 9, comparative information has not been restated. For details on adoption of AASB 9, refer to Note 1.1.
The majority of the amounts are due to be settled within 12 months of the Balance Sheet date.
The contractual maturity profile of Certificates of deposit and Term deposits are shown in the table below:
Group
Maturing Maturing Maturing MaturingThree Between Between Six after
Months or Three and and Twelve TwelveLess Six Months Months Months Total
$M $M $M $M $MAustraliaCertificates of deposit (1) 14,674 13,182 1,232 1,836 30,924Term deposits 92,825 39,389 13,835 2,264 148,313Total Australia 107,499 52,571 15,067 4,100 179,237
OverseasCertificates of deposit (1) 5,938 3,156 3,005 45 12,144Term deposits 17,820 13,129 6,127 2,071 39,147Total overseas 23,758 16,285 9,132 2,116 51,291
Total certificates of deposits and term deposits 131,257 68,856 24,199 6,216 230,528
At 30 June 2019
(1) All certificates of deposit issued by the Group are for amounts greater than $100,000.
160 Commonwealth Bank of Australia Annual Report 2019

Group
Maturing Maturing Maturing MaturingThree Between Between Six after
Months or Three and and Twelve TwelveLess Six Months Months Months Total
$M $M $M $M $MAustraliaCertificates of deposit (1) 15,321 9,286 2,351 4,447 31,405Term deposits 83,431 25,576 32,222 8,695 149,924Total Australia 98,752 34,862 34,573 13,142 181,329
OverseasCertificates of deposit (1) 3,425 2,441 2,601 42 8,509Term deposits 22,758 10,033 7,901 3,204 43,896Total overseas 26,183 12,474 10,502 3,246 52,405
Total certificates of deposits and term deposits 124,935 47,336 45,075 16,388 233,734
At 30 June 2018
(1) All certificates of deposit issued by the Group are for amounts greater than $100,000.
Deposits from customers include certificates of deposit, term deposits, savings deposits, other demand deposits and debentures. Deposits are initially recognised at their fair value less directly attributable transaction costs. Subsequent to initial recognition, they are measured at amortised cost. Interest incurred is recognised within Net Interest Income using the effective interest method.
Securities sold under repurchase agreements are retained in the Financial Statements where substantially all the risks and rewards of ownership remain with the Group. A liability for the agreed repurchase amount is recognised within deposits and other public borrowings.
Group Bank 30 Jun 19 30 Jun 18 30 Jun 19 30 Jun 18
$M $M $M $MDeposits and other borrowings (1) 6,217 8,124 6,217 7,118Debt instruments 714 399 155 264Trading liabilities 1,589 1,724 1,589 1,724Total liabilities at fair value through Income Statement 8,520 10,247 7,961 9,106
(1) Current period balances reflect the adoption of AASB 9 ‘Financial Instruments’ on 1 July 2018. As permitted by AASB 9, comparative information has not been restated. For details on adoption of AASB 9, refer to Note 1.1.
As at 30 June 2019, $5,201 million of the Group’s total liabilities at fair value through Income Statement (Bank: $4,642 million) are expected to be settled within 12 months of the Balance Sheet date. As at 30 June 2018, the majority of the Group’s and the Bank’s liabilities at fair value through Income Statement were expected to be settled within 12 months.
The amount that would be contractually required to be paid at maturity to the holders of the financial liabilities designated at fair value through Income Statement for the Group is $8,524 million (2018: $10,093 million) and for the Bank is $7,960 million (2018: $8,949 million).
The Group designates certain liabilities at fair value through the Income Statement on origination when doing so eliminates or reduces an accounting mismatch, or where the liabilities contain embedded derivatives which must otherwise be separated and carried at fair value. Trading liabilities are incurred principally for the purpose of repurchasing or settling in the near term.
Subsequent to initial recognition, these liabilities are measured at fair value. Changes in fair value (except those due to changes in credit risk) are recognised in Other Banking Income. Changes in fair value relating to the Group’s own credit risk are recognised in Other Comprehensive Income. Interest incurred is recognised within Net Interest Income using the effective interest method.
161

Strategic Financial Risk Corporate Directors’ Financial Other report performance management governance report report information
Notes to the financial statements
Group Bank30 Jun 19 30 Jun 18 30 Jun 19 30 Jun 18
Note $M $M $M $MMedium-term notes 98,342 99,579 84,014 87,474
Commercial paper 20,158 26,868 17,596 23,922
Securitisation notes 4.4 12,177 13,089 - -
Covered bonds 4.4 33,313 32,758 29,452 28,588
Total debt issues (1) 163,990 172,294 131,062 139,984
Short Term Debt Issues by currency
USD 20,147 27,008 17,585 24,061
AUD 10 1,009 10 1,009
GBP 3,470 2,949 3,470 2,949
Other currencies 227 335 227 335
Total short term debt issues 23,854 31,301 21,292 28,354
Long Term Debt Issues by currency (2)
USD 48,293 51,472 43,802 48,017
EUR 36,172 33,057 28,601 26,842
AUD 37,909 35,066 24,770 20,875
GBP 3,653 4,701 2,510 3,614
NZD 3,596 3,954 834 1,028
JPY 2,115 3,505 1,989 3,390
Other currencies 8,331 9,175 7,197 7,801
Offshore loans (all JPY) 67 63 67 63
Total long term debt issues 140,136 140,993 109,770 111,630
Maturity Distribution of Debt Issues (3)
Less than twelve months 50,095 59,980 42,993 50,994
Greater than twelve months 113,895 112,314 88,069 88,990
Total debt issues 163,990 172,294 131,062 139,984
(1) Debt issues include unrealised movements of $8,994 million in 2019 predominantly due to foreign exchange gains and losses. (2) Long-term debt disclosed relates to debt issues which have a maturity at inception of greater than 12 months. (3) Represents the remaining contractual maturity of the underlying instrument.
The Group’s long-term debt issues include notes issued under the: USD70 billion Euro Medium Term Note Program; the USD50 billion US Medium Term Note Program; USD30 billion Covered Bond Program; Unlimited Domestic Debt Program; Unlimited ASB Domestic Medium Term Note Program; USD25 billion CBA New York Branch Medium Term Note Program; EUR7 billion ASB Covered Bond Program; USD10 billion ASB US Medium Term Note Program and other applicable debt documentation. Notes issued under debt programs are both fixed and variable rate. Interest rate risk associated with the notes is incorporated within the Bank’s interest rate risk framework. The Bank, from time to time, as part of its balance sheet management, may consider opportunities to repurchase outstanding long-term debt pursuant to open-market purchases or other means. Such repurchases help manage the Bank’s debt maturity profile, overall funding costs and assist in meeting regulatory changes and requirements.
162 Commonwealth Bank of Australia Annual Report 2019

Group30 Jun 19 30 Jun 18 30 Jun 17
Short term borrowings by Commercial paper program (1)
Total
Outstanding at year end (2) 20,158 26,868 28,800
Maximum amount outstanding at any month end 24,557 32,336 33,779
Average amount outstanding 21,592 30,007 29,226
US Commercial Paper Program
Outstanding at year end (2) 20,120 26,792 28,393
Maximum amount outstanding at any month end 24,481 32,127 31,460
Average amount outstanding 21,494 29,887 27,593
Weighted average interest rate on:
Average amount outstanding 2. 6% 1. 8% 1. 2%
Outstanding at year end 2. 7% 2. 3% 1. 5%
Euro Commercial Paper Program
Outstanding at year end (2) 38 76 407
Maximum amount outstanding at any month end 163 219 2,789
Average amount outstanding 98 120 1,633
Weighted average interest rate on:
Average amount outstanding 2. 2% 1. 5% 1. 0%
Outstanding at year end 2. 7% 2. 2% 1. 2%
$M (except where indicated)
(1) Short-term borrowings include callable medium term notes of $3,696 million (2018: $4,433 million) which have been excluded from the table above. (2) The amount outstanding at year end is measured at amortised cost.
As At As AtExchange rates utilised (1) Currency 30 Jun 19 30 Jun 18
AUD 1.00 = USD 0. 7013 0. 7387
EUR 0. 6170 0. 6350
GBP 0. 5533 0. 5635
NZD 1. 0460 1. 0909
JPY 75. 6460 81. 7215
(1) End of day, Sydney time.
Guarantee arrangement
Guarantee under the Commonwealth Bank Sale Act Historically, the due payment of all monies payable by the Bank was guaranteed by the Commonwealth of Australia under section 117 of the Commonwealth Banks Act 1959 (as amended) at 30 June 1996. With the sale of the Commonwealth’s shareholding in the Bank this guarantee has been progressively phased out under transitional arrangements found in the Commonwealth Bank Sale Act 1995.
Demand deposits are no longer guaranteed by the Commonwealth under this guarantee. However, debt issues payable by the Bank under a contract entered into prior to 19 July 1996 remain guaranteed until maturity.
163

Strategic report
Financial performance
Risk management
Corporate governance
Directors’ report
Financial report
Other information
Notes to the financial statements
Debt issues include short and long-term debt issues of the Group and consist of commercial paper, securitisation notes, covered bonds and medium term notes.
Debt issues are initially measured at fair value and subsequently measured at amortised cost.
Premiums, discounts and associated issue expenses are recognised in the Income Statement using the effective interest method from the date of issue, to ensure the carrying value of securities equals their redemption value by maturity date. Interest is recognised in the Income Statement using the effective interest method. Any profits or losses arising from redemption prior to maturity are taken to the Income Statement in the period in which they are realised.
The Group hedges interest rate and foreign currency rate risk on certain debt issues. When fair value hedge accounting is applied to fixed rate debt issues, the carrying values are adjusted for changes in fair value related to the hedged risks.
The Group enters into transactions in the normal course of business that transfers financial assets to counterparties or to Special Purpose Vehicles (SPVs). Transferred financial assets that do not qualify for de-recognition are typically associated with repurchase agreements and our covered bonds and securitisation programs. The underlying assets remain on the Group’s Balance Sheet.
At the Balance Sheet date, transferred financial assets that did not qualify for de-recognition and their associated liabilities are as follows:
Group
30 Jun 19 30 Jun 18 30 Jun 19 30 Jun 18 30 Jun 19 30 Jun 18$M $M $M $M $M $M
Carrying amount of transferred assets 19,129 14,696 39,129 37,012 13,521 14,661
Carrying amount of associated liabilities 19,099 14,696 33,313 32,758 12,177 13,089For those liabilities that have recourse only to the transferred assets:
Fair value of transferred assets 13,524 14,667
Fair value of associated liabilities 12,177 13,089
Net position 1,347 1,578
RepurchaseAgreements Covered Bonds Securitisation (1)
Bank
30 Jun 19 30 Jun 18 30 Jun 19 30 Jun 18 30 Jun 19 30 Jun 18$M $M $M $M $M $M
Carrying amount of transferred assets 19,245 14,806 34,160 32,210 70,274 71,136
Carrying amount of associated liabilities 19,215 14,806 29,452 28,588 69,800 70,484For those liabilities that have recourse only to the transferred assets:
Fair value of transferred assets 70,281 71,155
Fair value of associated liabilities 69,800 70,484
Net position 481 671
RepurchaseAgreements Covered Bonds Securitisation (2)
(1) Securitisation liabilities of the Group include RMBS notes issued by securitisation SPVs and held by external investors. (2) Securitisation liabilities of the Bank include borrowings from securitisation SPVs, including the SPVs that issue only internally held notes for repurchase with central
banks, recognised on transfer of residential mortgages by the Bank. The carrying amount of associated liabilities from securitisation SPVs is recorded under loans due to controlled entities.
164 Commonwealth Bank of Australia Annual Report 2019

Repurchase Agreements
Securities sold under agreement to repurchase are retained on the Balance Sheet when substantially all the risks and rewards of ownership remain with the Group, and the counterparty liability is included separately on the Balance Sheet when cash consideration is received.
Securitisation Programs
The Group pools and equitably assigns residential mortgages as securities to investors through a series of wholly controlled securitisation vehicles. Where the Bank and ASB retain substantially all of the risks and rewards associated with the mortgages, the Bank and ASB continue to recognise the mortgages on their Balance Sheets. The Group is entitled to any residual income of the securitisation programs after all payments due to investors have been met. The investors have recourse only to the pool of mortgages in the SPV they have invested in.
Covered Bonds Programs
To complement existing wholesale funding sources, the Group has established two global covered bond programs for the Bank and ASB. Certain residential mortgages have been assigned to SPV’s associated with covered bond programs to provide security on the payments to investors. Similarly to securitisation programs, the Group is entitled to any residual income after all payments due to covered bond investors have been met. As the Bank and ASB retain substantially all of the risks and rewards associated with the mortgages, the Bank and ASB continue to recognise the mortgages on their Balance Sheets. The covered investors have dual recourse to the Bank and the covered pool assets.
Critical accounting judgements and estimates
The Group exercises judgement at inception and periodically thereafter, to assess whether a structured entity should be consolidated based on the Bank’s power over the relevant activities of the entity and the significance of its exposure to variable returns of the structured entity. Such assessments are predominantly required for the Group’s securitisation programs, and structured transactions such as covered bond programs.
165

Strategic report
Financial performance
Risk management
Corporate governance
Directors’ report
Financial report
Other information
Notes to the financial statements
In addition to loans, the Group holds other assets to support its activities. Cash and liquid assets, receivables due from other financial institutions, trading assets and investment securities are held for liquidity purposes, to generate returns and to meet customer demand. The mix and nature of assets is driven by multiple factors including the Board’s risk appetite, regulatory requirements, customer demand and the generation of shareholder returns.
The Group also transacts derivatives to meet customer demand and to manage its financial risks (interest rate, foreign currency, commodity and credit risks).
Refer to Note 9.1 for additional information relating to the Group’s approach to managing financial risks through the use of derivatives.
Group (1) Bank (1)
30 Jun 19 30 Jun 18 30 Jun 19 30 Jun 18$M $M $M $M
Notes, coins, cash at banks and money at short call 16,655 22,897 15,534 21,351
Securities purchased under agreements to resell 12,732 13,520 11,378 12,230
Total cash and liquid assets 29,387 36,417 26,912 33,581
(1) Comparative information has been restated to conform to presentation in the current year.
Cash and liquid assets include cash at branches, cash at banks, nostro balances, money at call with an original maturity of three months or less and securities purchased under agreements to resell. Cash and liquid assets are initially recognised at fair value and subsequently measured at amortised cost. Interest is recognised in the Income Statement using the effective interest method.
Securities, including bonds and equities, purchased under agreements to resell are not recognised in the Financial Statements where substantially all the risks and rewards of ownership remain with the counterparty. An asset for the agreed resale amount by the counterparty is recognised within Cash and liquid assets.
166 Commonwealth Bank of Australia Annual Report 2019

Group (1) Bank (1)
30 Jun 19 30 Jun 18 30 Jun 19 30 Jun 18Assets at Fair Value through Income Statement $M $M $M $M Trading
Government bonds, notes and securities 21,955 18,078 21,949 16,923
Corporate/financial institution bonds, notes and securities 3,264 6,108 3,264 5,112
Shares and equity investments 29 116 5 6
Commodities 7,258 7,952 7,258 7,952
Total trading assets 32,506 32,254 32,476 29,993
Insurance (2)
Investments backing life risk contracts - 21 - -
Investments backing life investment contracts - 351 - -
Total life insurance investment assets - 372 - -
Other
Government securities 81 49 - -
Receivables due from other corporate/financial institutions 434 209 235 -
Shares and equity investments 238 - - -
Other lending 418 - 417 -
Total other assets at fair value through Income Statement 1,171 258 652 -
Total assets at fair value through Income Statement 33,677 32,884 33,128 29,993
Maturity Distribution of assets at fair value through income statement
Less than twelve months 33,450 32,247 32,947 29,724
More than twelve months 227 637 181 269
Total assets at fair value through Income Statement 33,677 32,884 33,128 29,993
(1) Current year balances reflect the adoption of AASB 9 ‘Financial Instruments’ on 1 July 2018. As permitted by AASB 9, comparative information has not been restated. For details on the adoption of AASB 9, refer to Note 1.1.
(2) Life insurance assets have been reclassified to assets held for sale following the announced sale of PT Commonwealth Life.
These assets are categorised as assets held for trading, insurance assets and other investments. Trading assets are those acquired for the purpose of selling or repurchasing in the near term. Insurance assets are investments that back life insurance and life investment contracts. Other assets are those that are designated at fair value through Income Statement at inception. Subsequent to initial recognition, financial assets are measured at fair value with changes in fair value recognised in Other Banking Income.
167

Strategic Financial Risk Corporate Directors’ Financial Other report performance management governance report report information
Notes to the financial statements
Derivatives are classified as “Held for Trading” or “Held for Hedging”. Held for Trading derivatives are contracts entered into in order to meet customers’ needs, to undertake market making and positioning activities, or for risk management purposes that do not qualify for hedge accounting. Held for Hedging derivatives are instruments held for risk management purposes, which meet the criteria for hedge accounting. Derivative financial instruments are contracts whose values are derived from one or more underlying prices, indexes or other variables.
The fair value of derivative financial instruments is set out in the following tables:
Group (1)
30 Jun 19 30 Jun 18Fair Value Fair Value Fair Value Fair Value
Asset Liability Asset LiabilityDerivatives assets and liabilities $M $M $M $MHeld for trading
Foreign exchange rate related contracts:
Forwards 5,404 (5,492) 8,118 (7,961)
Swaps 4,078 (7,327) 7,457 (8,505)
Options 349 (346) 462 (415)
Total foreign exchange rate related contracts 9,831 (13,165) 16,037 (16,881)
Interest rate related contracts:
Swaps 6,978 (3,758) 4,834 (3,458)
Futures 46 (132) 6 (57)
Options 554 (463) 531 (736)
Total interest rate related contracts 7,578 (4,353) 5,371 (4,251)
Credit related swaps 21 (49) 46 (65)
Equity related contracts:
Swaps 10 (26) 12 (40)
Options 1 (3) 1 (5)
Total equity related contracts 11 (29) 13 (45)
Commodity related contracts:
Swaps 207 (193) 397 (386)
Options 57 (76) 146 (85)
Total commodity related contracts 264 (269) 543 (471)
Identified embedded derivatives 160 (60) 229 (58)
Total derivative assets/(liabilities) held for trading 17,865 (17,925) 22,239 (21,771)
(1) Comparative information has been restated to conform to presentation in the current year.
Held for trading derivatives are expected to be recovered or due to be settled within 12 months of the Balance Sheet date.
168 Commonwealth Bank of Australia Annual Report 2019

Group (1)
30 Jun 19 30 Jun 18Fair Value Fair Value Fair Value Fair Value
Asset Liability Asset Liability$M $M $M $M
Fair value hedges
Foreign exchange rate related swaps 5,089 (2,384) 6,538 (3,783)
Interest rate related swaps 379 (1,440) 278 (1,672)
Total fair value hedges 5,468 (3,824) 6,816 (5,455)
Cash flow hedges
Foreign exchange rate related swaps 1,470 (643) 2,335 (744)
Interest rate related swaps 411 (365) 734 (493)
Commodity price related swaps - (5) - -
Total cash flow hedges 1,881 (1,013) 3,069 (1,237)
Net investment hedges
Foreign exchange rate related forwards 1 (15) 9 (9)
Total net investment hedges 1 (15) 9 (9)
Total derivative assets/(liabilities) held for hedging 7,350 (4,852) 9,894 (6,701)
(1) Comparative information has been restated to conform to presentation in the current year.
The majority of hedging derivatives are expected to be recovered or due to be settled more than 12 months after the Balance Sheet date.
169

Strategic Financial Risk Corporate Directors’ Financial Other report performance management governance report report information
Notes to the financial statements
Bank (1)
30 Jun 19 30 Jun 18Fair Value Fair Value Fair Value Fair Value
Asset Liability Asset LiabilityDerivatives assets and liabilities $M $M $M $MHeld for trading
Foreign exchange rate related contracts:
Forwards 5,392 (5,465) 8,081 (7,937)
Swaps 5,036 (8,161) 8,291 (9,197)
Options 348 (345) 460 (413)
Derivatives held with controlled entities 41 (2,015) 16 (1,734)
Total foreign exchange rate related contracts 10,817 (15,986) 16,848 (19,281)
Interest rate related contracts:
Swaps 6,735 (3,653) 4,610 (3,226)
Futures 47 (132) 6 (57)
Options 554 (463) 531 (736)
Derivatives held with controlled entities 16 (91) 73 (87)
Total interest rate related contracts 7,352 (4,339) 5,220 (4,106)
Credit related swaps 21 (49) 46 (65)
Equity related contracts:
Swaps 10 (26) 12 (40)
Options 1 (3) 1 (5)
Total equity related contracts 11 (29) 13 (45)
Commodity related contracts:
Swaps 207 (193) 397 (386)
Options 57 (76) 146 (85)
Total commodity related contracts 264 (269) 543 (471)
Identified embedded derivatives 160 (60) 229 (58)
Total derivative assets/(liabilities) held for trading 18,625 (20,732) 22,899 (24,026)
(1) Comparative information has been restated to conform to presentation in the current year.
Held for trading derivatives are expected to be recovered or due to be settled within 12 months of the Balance Sheet date.
170 Commonwealth Bank of Australia Annual Report 2019

Bank (1)
30 Jun 19 30 Jun 18Fair Value Fair Value Fair Value Fair Value
Asset Liability Asset Liability$M $M $M $M
Fair value hedges
Foreign exchange rate related contracts:
Swaps 3,707 (1,670) 5,087 (3,052)
Derivatives held with controlled entities - (1,948) 35 (1,365)
Total foreign exchange rate related contracts 3,707 (3,618) 5,122 (4,417)
Interest rate related contracts:
Swaps 333 (1,393) 213 (1,477)
Derivatives held with controlled entities - (68) 13 (27)
Total interest rate related contracts 333 (1,461) 226 (1,504)
Total fair value hedges 4,040 (5,079) 5,348 (5,921)
Cash flow hedges
Foreign exchange rate related contracts:
Swaps 1,329 (471) 2,011 (586)
Derivatives held with controlled entities - (97) 16 (30)
Total foreign exchange rate related contracts 1,329 (568) 2,027 (616)
Interest rate related contracts:
Swaps 316 (255) 602 (299)
Derivatives held with controlled entities - - - -
Total interest rate related contracts 316 (255) 602 (299)
Commodity price related contracts:
Swaps - (5) - -
Total commodity price related contracts - (5) - -
Total cash flow hedges 1,645 (828) 2,629 (915)
Net investment hedges
Foreign exchange rate related forward contracts 1 (15) 9 (9)
Total net investment hedges 1 (15) 9 (9)
Total derivative assets/(liabilities) held for hedging 5,686 (5,922) 7,986 (6,845)
(1) Comparative information has been restated to conform to presentation in the current year.
The majority of hedging derivatives are expected to be recovered or due to be settled more than 12 months after the Balance Sheet date.
171

Strategic report
Financial performance
Risk management
Corporate governance
Directors’ report
Financial report
Other information
Notes to the financial statements
The table below shows the deferred gains and losses, which are expected to be transferred to the Income Statement in the period which the hedge forecast transaction takes place:
Group BankTotal Total
30 Jun 19 30 Jun 18 30 Jun 19 30 Jun 18$M $M $M $M
Within 6 months 47 (39) 57 (33)
6 months - 1 year (103) 29 (32) 38
1 - 2 years (340) 16 (215) 68
2 - 5 years 1,476 (131) 1,516 (25)
After 5 years 53 (95) 207 57
Net deferred gains/(losses) 1,133 (220) 1,533 105
Derivatives transacted for hedging purposes
Derivatives are initially measured at fair value. Subsequent to initial recognition, gains or losses on derivatives are recognised in the Income Statement, unless they are entered into for hedging purposes and designated into a cash flow hedge.
Hedging strategy and hedge accounting
The Group risk management strategy (refer notes 9.1 and 9.3) is to manage market risks within risk limits to minimise profit and capital volatility. The use of derivative and other hedging instruments for hedging purposes gives rise to potential volatility in the Income Statement because of mismatches in the accounting treatment between derivative and other hedging instruments and the underlying exposures being hedged. The Group’s and the Bank’s objective is to reduce volatility in the Income Statement by applying hedge accounting.
Fair value hedges
Fair value hedges are used by the Group to manage exposure to changes in the fair value of an asset, liability or unrecognised firm commitments, predominantly associated with investment securities, debt issues and loan capital. Changes in fair values can arise from fluctuations in interest or foreign exchange rates. The Group principally uses interest rate swaps, cross currency swaps and futures to protect against such fluctuations.
Changes in the value of fair value hedges are recognised in the Income Statement, together with changes in the fair value of the hedged asset or liability that are attributable to the hedged risk. All gains and losses associated with the ineffective portion of fair value hedge relationships are recognised immediately as ‘Other Banking Income’ in the Income Statement.
If the hedge relationship no longer meets the criteria for hedge accounting, it is discontinued. For fair value hedges of interest rate risk, the fair value adjustment to the hedged item is amortised to the Income Statement from the date of discontinuation over the period to maturity of the previously designated hedge relationship using the effective interest method. If the hedged item is sold or repaid, the unamortised fair value adjustment is recognised immediately in the Income Statement.
Cash flow hedges
Cash flow hedges are used by the Group to manage exposure to variability in future cash flows, which could affect profit or loss and may result from fluctuations in interest and exchange rates or in commodity prices on financial assets, financial liabilities or highly probable forecast transactions, predominantly associated with floating rate domestic loans and deposits. The Group principally uses interest rate swaps, cross currency swaps, futures and equity related swaps to protect against such fluctuations.
Changes in fair value associated with the effective portion of a cash flow hedge are recognised through Other Comprehensive Income in the Cash Flow Hedge Reserve within equity. Ineffective portions are recognised immediately in the Income Statement. Amounts deferred in equity are transferred to the Income Statement in the period in which the hedged forecast transaction takes place.
When a hedging instrument expires or is sold, terminated or exercised, or when the hedge no longer meets the criteria for hedge accounting, any cumulative gain or loss existing in equity at that time remains in equity and is reclassified to profit or loss in the period in which the hedged item affects profit or loss. When a forecast transaction is no longer expected to occur, the cumulative gain or loss that was reported in equity is recycled immediately to the Income Statement. Where it is appropriate, non-derivative financial assets and liabilities are also designated as hedging instruments in cash flow hedge relationships.
172 Commonwealth Bank of Australia Annual Report 2019

Derivatives transacted for hedging purposes (continued)
Net investment hedges
The Group holds investments in foreign operations, where changes in net assets resulting from changes in foreign currency rates are recognised in foreign currency translation reserve and results in volatility in shareholders’ equity. To protect against the foreign currency risk, the Group enters into foreign currency forwards that are designated as hedging instruments in net investment hedges. Gains and losses on derivative contracts relating to the effective portion of the net investment hedge are recognised in the foreign currency translation reserve in equity. Ineffective portions are recognised immediately in the Income Statement. Gains and losses accumulated in equity are included in the Income Statement when the foreign subsidiary or branch is disposed of.
Risk components
In some hedging relationships, the Group and the Bank designate risk components of hedged items as follows:
Benchmark interest rate risk as a component of interest rate risk, such as the Bank Bill Benchmark Rate component; and Spot exchange rate risk as a component of foreign currency risk for foreign currency financial assets and liabilities.
Hedging the benchmark interest rate risk or spot exchange rate risk components results in other risks, such as credit risk and liquidity risk, being excluded from the hedge accounting relationship.
Economic relationships and hedge effectiveness
The Group performs both prospective and retrospective tests to determine the economic relationship between the hedged item and the hedging instrument, and to assess hedge effectiveness. At inception of the hedge relationship, prospective testing is performed on a matched terms basis. This test checks that the critical terms are matched between the hedging instrument and the hedged item. At the same time a hedging ratio is established by matching the notional of the derivatives with the principal of the portfolio or financial instruments being hedged, in most cases the ratio is 100%. Retrospective testing for each reporting period uses a regression model, which compares the change in the fair value of the hedged item and the change in the fair value of the hedging instrument. For a hedge to be deemed effective, the change in fair values should be within 80 to 125% of each other. Should the result fall outside this range the hedge would be deemed ineffective and recognised immediately through the income statement in line with each hedge relationship policy above.
Sources of hedge ineffectiveness affecting hedge accounting are:
Differences in discounting between the hedged item and the hedging instrument. Collateralised derivatives are discounted using Overnight Indexed Swaps (OIS) discount curves, which are not applied to the hedged item;
Change in the credit risk of the hedging instrument; and Mismatches between the contractual terms of the hedged item and the hedging instrument.
No other sources of hedge ineffectiveness have arisen during the year.
Embedded derivatives
In certain instances, a derivative may be embedded within a host contract. It is accounted for separately as a stand-alone derivative at fair value, where:
the host contract is not carried at fair value through the Income Statement; and the economic characteristics and risks of the embedded derivative are not closely related to the host contract.
173

Strategic Financial Risk Corporate Directors’ Financial Other report performance management governance report report information
Notes to the financial statements
Hedging instruments
The following table provides details of the Group’s and the Bank’s hedging instruments by the type of hedge relationship in which they are designated and the type of risk being hedged.
Group Bank30 Jun 19 30 Jun 19
Fair Value Fair Value Fair Value Fair ValueDerivative Derivative Derivative Derivative
Notional Assets Liability Notional Assets Liability$M $M $M $M $M $M
Fair value hedges
Interest rate 112,725 379 (1,440) 98,365 333 (1,461)
Foreign exchange 709 7 (6) - - -
Interest rate and foreign exchange 59,070 5,082 (2,378) 55,587 3,707 (3,618)
Total fair value hedges 172,504 5,468 (3,824) 153,952 4,040 (5,079)
Cash flow hedges
Interest rate 529,431 411 (365) 481,685 316 (255)
Foreign exchange 19,400 1,470 (643) 16,835 1,329 (568)
Commodity price 80 - (5) 80 - (5)
Total cash flow hedges 548,911 1,881 (1,013) 498,600 1,645 (828)
Net investment hedges
Foreign exchange 481 1 (15) 481 1 (15)
Total net investment hedges 481 1 (15) 481 1 (15)
Total hedging instrument assets/(liabilities) 721,896 7,350 (4,852) 653,033 5,686 (5,922)
In addition to derivative instruments used to hedge foreign currency risk, the Group and the Bank designate debt issues as hedging instruments of certain foreign exchange risk exposures. The carrying value of debt issues designated as cash flow hedging instruments as at 30 June 2019 was $949 million with average maturity of 4 years for the Group and $62 million with average maturity of 1 year for the Bank.
174 Commonwealth Bank of Australia Annual Report 2019

Hedging instruments (continued) The table below provides maturity analysis of expected notional values of the Group’s hedging instruments by the type of hedge relationship in which they are designated and the type of risk being hedged:
Group30 Jun 19
Due within Due from 1 Due beyond1 year to 5 years 5 years Total
$M $M $M $MFair value hedges Interest rate 16,714 45,248 50,763 112,725
Foreign exchange 709 - - 709
Interest rate and foreign exchange 12,575 29,577 16,918 59,070
Interest rate 338,071 185,963 5,397 529,431
Foreign exchange 12,867 4,722 2,292 19,881
Commodity price 5 23 52 80
Cash flow hedges and net investment hedges
Notional Amounts
Hedged Risk
The weighted average fixed interest rate of interest rate swaps hedging interest rate risk is 2.00%. The major currency pairs of cross currency swaps designated in hedge relationships are receive USD / pay AUD and receive EUR / pay USD with weighted average foreign currencies rates of: AUD/USD 0.85 and USD/EUR 0.82.
The table below provides maturity analysis of expected notional values of the Bank’s hedging instruments by the type of hedge relationship in which they are designated and the type of risk being hedged:
Bank30 Jun 19
Due within Due from 1 Due beyond1 year to 5 years 5 years Total
$M $M $M $MFair value hedges Interest rate 14,685 36,050 47,630 98,365
Foreign exchange - - - -
Interest rate and foreign exchange 10,649 29,850 15,088 55,587
Interest rate 316,484 160,217 4,984 481,685
Foreign exchange 10,436 4,588 2,292 17,316
Commodity price 5 23 52 80
Cash flow hedges and net investment hedges
Notional Amounts
Hedged Risk
The weighted average fixed interest rate of interest rate swaps hedging interest rate risk is 2.00%. The major currencies of cross currency swaps designated in hedge relationships are receive USD / pay AUD and receive EUR / pay USD with weighted average foreign currencies rate: AUD/USD 0.84 and USD/EUR 0.83.
175

Strategic Financial Risk Corporate Directors’ Financial Other report performance management governance report report information
Notes to the financial statements
Hedged items in fair value hedges
The table below provides details of the Group’s and the Bank’s hedged items designated in fair value hedge relationships by the type of risk being hedged:
Group Bank30 Jun 19 30 Jun 19
Carrying CarryingAmount Amount
Hedged Items Hedged Risk $M $M $M $MInvestment securities at fair value through other comprehensive income Interest rate 44,493 4,438 40,064 4,425
Investment securities at fair value through other comprehensive income
Interest rate and foreign exchange 10,130 201 10,130 201
Loans, bills discounted and other receivables Interest rate 2,136 63 57 57
Shares in and loans to controlled entities Interest rate - - 1,533 65
Shares in and loans to controlled entities Interest rate and foreign exchange - - 19,690 853
Deposits and other public borrowings Interest rate 557 7 557 7
Deposits and other public borrowings Interest rate and foreign exchange 49 5 49 5
Assets held for sale Foreign exchange 1,161 49 - -
Debt issues Interest rate 26,319 746 17,713 573
Debt issues Interest rate and foreign exchange 63,566 2,155 47,585 1,368
Loan capital interest bearing Interest rate 5,974 326 5,582 316
Loan capital interest bearing Interest rate and foreign exchange 9,443 192 9,443 193
Fair Value Adjustment (1) (2)
Fair Value Adjustment (1) (2)
(1) Represents the accumulated amount of the fair value adjustment included in the carrying amount. Positive amounts represent increases in the carrying amount of the asset or liability. The cumulative amount that is related to ceased hedge relationships where the risk being hedged was interest rate and foreign exchange risk is nil.
(2) Changes in fair value of the hedged item used as a basis to determine effectiveness. The changes in fair value of the hedged items are recognised in Other Banking Income.
176 Commonwealth Bank of Australia Annual Report 2019

Hedge items in cash flow hedges and net investment hedges
The table below provides details of the Group’s and the Bank’s hedged items designated in cash flow and net investment hedge relationships by the type of risk being hedged:
Group Bank30 Jun 19 30 Jun 19
Cash Flow Foreign Cash ForeignHedge Currency Flow Currency
Reserve (1) Translation Hedge TranslationReserve (2) Reserve (1) Reserve (2)
Hedged Items Hedged Risk $M $M $M $M
Cash Flow HedgesInvestment securities at fair value through other comprehensive income Foreign exchange 15 - 15 -
Loans, bills discounted and other receivables Interest rate 4,085 - 3,834 -
Shares in and loans to controlled entities Interest rate - - 3 -
Shares in and loans to controlled entities Foreign exchange - - 68 -
Deposits and other public borrowings Interest rate (2,741) - (2,447) -
Debt issues Interest rate (7) - (6) -
Debt issues Foreign exchange (117) - 76 -
Loan capital interest bearing Interest rate and Foreign exchange 7 - 7 -
Highly probable forecast transactions Foreign exchange (92) - - -
Highly probable forecast transactions Commodity price (17) - (17) -
Net Investment Hedges
Foreign Operations Foreign exchange - (33) - (33)
Total 1,133 (33) 1,533 (33)
(1) Represents the accumulated effective amount of the hedging instrument deferred to Cash Flow Hedge Reserve. The cumulative amount related to ceased hedge relationships where the risk being hedged was interest rate and foreign exchange risk is a loss of $13 million for the Group and the Bank. A cumulative loss of $1 million related to ceased hedge relationships was amortised to Income Statement during the period.
(2) Represents the accumulated effective amount of the hedging instrument deferred to Foreign Currency Translation Reserve. The cumulative amount related to ceased hedge relationships where the risk being hedged was foreign exchange risk is nil.
177

Strategic Financial Risk Corporate Directors’ Financial Other report performance management governance report report information
Notes to the financial statements
Hedge effectiveness The table below details effectiveness of the Group’s and the Bank’s hedges by the type of hedge relationship and the type of risk being hedged:
Group Bank30 Jun 19 30 Jun 19
Change in Change in Hedge Change in Change in Hedge Value of Value of Ineffectiveness Value of Value of IneffectivenessHedged Hedging recognised in Hedged Hedging recognised in
Item (1) Instrument Income Item (1) Instrument Incomestatement (2) statement (2)
$M $M $M $M $M $MFair value hedges
Interest rate 1,257 (1,269) (12) 1,384 (1,397) (13)
Foreign exchange 49 (49) - - - -
Interest rate and Foreign exchange (1,864) 1,885 21 (760) 783 23
Total fair value hedges (558) 567 9 624 (614) 10
Cash flow hedges and net investment hedgesInterest rate (1,279) 1,283 4 (1,302) 1,308 6
Foreign exchange (51) 51 - (101) 101 -
Commodity prices (5) 5 - (5) 5 -
Total cash flow hedges and net investment hedges
(1,335) 1,339 4 (1,408) 1,414 6
(1) Changes in value of hedged item for fair value hedges is recognised in Other Banking Income. Changes in value of the hedged item for cash flow hedges is only used as basis for recognising ineffectiveness and represents the lower of the change in the hedged item and the hedging instrument. During the year, the unrealised gains deferred to the Cash flow hedge reserve were $1,355 million for the Group and $1,428 million for the Bank, and a loss recognised in the Net investment hedge reserve was $20 million for the Group and the Bank.
(2) Hedge ineffectiveness is recognised in Other Banking Income.
178 Commonwealth Bank of Australia Annual Report 2019

Group (1) Bank (1)
30 Jun 19 30 Jun 18 30 Jun 19 30 Jun 18$M $M $M $M
Investment securities at fair value through OCI
Government bonds, notes and securities 50,560 - 48,454 -
Corporate/financial institution bonds, notes and securities 18,075 - 16,407 -
Shares and equity investments 67 - 45 -
Covered bonds, mortgage backed securities and SSA (2) 10,210 - 8,306 -
Total investment securities at fair value through OCI 78,912 - 73,212 -
Investment securities at amortised cost
Government bonds, notes and securities 6 - - -
Covered bonds, mortgage backed securities and SSA (2) 7,349 - 7,349 -
Total investment securities at amortised cost 7,355 - 7,349 -
Total investment securities 86,267 - 80,561 -
Available-for-Sale Investments (AASB 139)
Government bonds, notes and securities - 46,363 - 44,701
Corporate/financial institution bonds, notes and securities - 21,372 - 20,356
Shares and equity investments - 298 - 45
Covered bonds, mortgage backed securities and SSA (2) - 14,207 - 12,629
Total available-for-sale investments (AASB 139) - 82,240 - 77,731
(1) Current year balances reflect the adoption of AASB 9 ‘Financial Instruments’ on 1 July 2018. As permitted by AASB 9, comparative information has not been restated. (2) Supranational, Sovereign and Agency Securities (SSA).
As at 30 June 2019, Investment Securities at Fair Value through OCI expected to be recovered within 12 months of the Balance Sheet date were $10,409 million (2018: $14,772 million) for the Group, and $8,639 million (2018: $13,478 million) for the Bank. As at 30 June 2019, Investment Securities at Amortised Cost amounts expected to be recovered within 12 months of the Balance Sheet date were $1,622 million (2018: Nil) for the Group and the Bank. As at 30 June 2018, Available for Sale investments expected to be recovered within 12 months of the Balance Sheet date were $14,772 million for the Group, and $13,478 million for the Bank.
179

Strategic report
Financial performance
Risk management
Corporate governance
Directors’ report
Financial report
Other information
Notes to the financial statements
Group
Non-Maturing Total
$M % $M % $M % $M % $M $M
3,712 1. 99 16,221 1. 46 24,978 1. 70 5,649 2. 77 - 50,560
4,805 1. 59 12,934 2. 58 336 2. 52 - - - 18,075
Shares and equity investments - - - - - - - - 67 67
1,849 1. 92 6,349 1. 72 1,340 1. 78 672 3. 34 - 10,210
10,366 35,504 26,654 6,321 67 78,912
6 0. 66 - - - - - - - 6
- - 22 2. 72 256 2. 39 7,071 2. 32 - 7,349
6 22 256 7,071 - 7,355
10,372 - 35,526 - 26,910 - 13,392 - 67 86,267
10 orMaturity Period at 30 June 2019
0 to 1 Year 1 to 5 Years 5 to 10 Years more Years
Government bonds, notes and securities
Total investment securities at fair value through OCI
Investment securities at fair value through OCI
Investment securities at amortised cost
Total investment securities
Corporate/financial institution bonds, notes and securities
Covered bonds, mortgage backed securities and SSA
Government bonds, notes and securities
Covered bonds, mortgage backed securities and SSATotal investment securities at amortised cost
Investment securities primarily include public debt securities held as part of the Group’s liquidity portfolio.
Investment securities at Fair Value through OCI (FVOCI)
Debt securities
This category includes debt securities held within the business model whose objective is achieved by both collecting contractual cash flows and selling the assets. The contractual cash flows on these financial assets comprise payments of principal and interest only. These securities are initially recognised at their fair value plus directly attributable transaction costs. Subsequent to initial recognition, they are measured at fair value through Other Comprehensive Income.
Interest income and foreign exchange gains and losses on these securities are recognised in the Income Statement. The securities are assessed for impairment using the expected credit loss approach described in Note 1.1. Impairment is recognised in the Loan Impairment Expense line in the Income Statement.
When FVOCI debt securities are derecognised, the cumulative gain or loss recognised in Other Comprehensive Income is reclassified to the Other Banking Income line in the Income Statement.
Equity securities
This category also includes non-traded equity instruments designated at fair value through Other Comprehensive Income. Fair value gains and losses and foreign exchange gains and losses on these equity instruments are recognised in Other Comprehensive Income and are not reclassified to the Income Statement on derecognition.
Investment securities at amortised cost This category includes debt securities held within the business model whose objective is to hold financial assets in order to collect contractual cash flows. The contractual cash flows on these financial assets comprise the payment of principal and interest only. These securities are initially recognised at their fair value plus directly attributable transaction costs. Subsequent to initial recognition, they are measured at amortised cost using the effective interest rate method and are presented net of provisions for impairment. For the accounting policy for provisions for impairment, refer to Note 1.1.
180 Commonwealth Bank of Australia Annual Report 2019

The Group’s other assets comprise assets not included in its lending, investing, trading and other banking activities. Other Assets include property, plant and equipment held for use and for lease through our asset finance businesses. Other assets also include software, brand names and goodwill. These assets support the Group’s business activities.
Group (1) Bank (1)
30 Jun 19 30 Jun 18 30 Jun 19 30 Jun 18$M $M $M $M
Goodwill
Purchased goodwill at cost 5,974 6,941 2,522 2,522
Closing balance 5,974 6,941 2,522 2,522
Computer Software Costs
Cost 4,837 4,633 4,396 4,122
Accumulated amortisation (3,125) (2,814) (2,842) (2,440)
Closing balance 1,712 1,819 1,554 1,682
Brand Names (2)
Cost 203 206 186 186
Accumulated amortisation (2) (1) - -
Closing balance 201 205 186 186
Other Intangibles (3)
Cost 351 342 219 192
Accumulated amortisation (273) (217) (164) (116)
Closing balance 78 125 55 76
Total Intangible assets 7,965 9,090 4,317 4,466
(1) Comparative information has been restated to conform to presentation in the current year. (2) Brand names predominantly represent the value of royalty costs foregone by the Group through acquiring the Bankwest brand name. The royalty costs that would have
been incurred by an entity using the Bankwest brand name are based on an annual percentage of income generated by Bankwest. The Bankwest brand name has an indefinite useful life as there is no foreseeable limit to the period over which the brand name is expected to generate cash flows. This balance also includes the Aussie Home Loans brand name ($16 million) which has an indefinite useful life. They are not subject to amortisation, but require annual impairment testing. No impairment was required this period. The Count Financial brand name of $3 million was impaired during the year ended 30 June 2019.
(3) Other intangibles include the value of customer and credit card relationships acquired from Bankwest and Aussie Home Loans. This value represents future net income generated from the relationships that existed at Balance Sheet date. The assets have a useful life of between 6 and 10 years based on the attrition rates of customers. Other intangibles also include prepaid software licences with a net book value of $54 million (30 June 2018: $67 million). Customer relationship intangibles in relation to Count Financial of $13 million were impaired during the year ended 30 June 2019.
Impairment tests for goodwill and intangible assets with indefinite lives
To assess whether goodwill and other assets with indefinite useful lives are impaired, the carrying amount of a cash-generating unit or a group of cash-generating units are compared to the recoverable amount. The recoverable amount is determined based on fair value less cost to sell, primarily using an earnings multiple applicable to that type of business. The category of this fair value is Level 3 as defined in Note 9.5.
Earnings multiples relating to the Group‘s Banking cash-generating units are sourced from publicly available data associated with Australian businesses displaying similar characteristics to those cash-generating units, and are applied to current earnings. The key assumption is the Price-Earnings (P/E) multiple observed for these businesses, which for the Banking businesses were in the range of 11.6x – 12.0x (2018: 10.9x – 11.2x). The goodwill allocated to the Wealth Management and IFS cash-generating units is not significant.
181

Strategic Financial Risk Corporate Directors’ Financial Other report performance management governance report report information
Notes to the financial statements
Goodwill allocation to cash generating units
Group (1)
30 Jun 19 30 Jun 18$M $M
Retail Banking Services 3,744 3,841
Business and Private Banking 1,271 1,271
Wealth Management 679 1,551
New Zealand 269 258
IFS and Other 11 20
Total 5,974 6,941
(1) Comparative information has been restated to conform to presentation in the current year.
Reconciliation of the carrying amounts of Intangible Assets is set out below:
Group (1) Bank (1)
30 Jun 19 30 Jun 18 30 Jun 19 30 Jun 18$M $M $M $M
Goodwill
Opening balance 6,941 7,872 2,522 2,522
Additions - 446 - -
Transfers/disposals/other adjustments (2) (967) (1,377) - -
Closing balance 5,974 6,941 2,522 2,522
Computer Software Costs
Opening balance 1,819 1,934 1,682 1,735
Additions (3) 343 486 287 399
Amortisation and write-offs (4) (450) (553) (415) (452)
Reclassification to assets held for sale - (48) - -
Closing balance 1,712 1,819 1,554 1,682
Brand Names
Opening balance 205 189 186 186
Additions - 16 - -
Impairment (5) (4) - - -
Closing balance 201 205 186 186
Other Intangibles
Opening balance 125 100 76 77
Additions 140 178 142 139
Amortisation and impairment (6) (187) (153) (163) (140)
Closing balance 78 125 55 76
(1) Comparative information has been restated to conform to presentation in the current year. (2) Includes reclassifications to assets held for sale and foreign currency revaluation. (3) Primarily relates to internal development costs. (4) Includes amounts associated with discontinued operations. (5) The Count Financial brand name of $3 million was impaired during the year ended 30 June 2019. (6) Customer relationship intangibles in relation to Count Financial of $13 million were impaired during the year ended 30 June 2019.
182 Commonwealth Bank of Australia Annual Report 2019

Intangible assets are identifiable non-monetary assets without physical substance. They are recognised only if it is probable the asset will generate future benefits for the Group. Those assets with an indefinite useful life are tested for impairment annually. All intangible assets must be tested for impairment when there is an indication that its carrying amount may be greater than its recoverable amount.
Goodwill Goodwill arises on the acquisition of an entity and represents the excess of the consideration paid over the fair value of the net assets and liabilities acquired. Goodwill is tested for impairment annually through allocation to a group of Cash Generating Units (CGUs). The CGUs’ recoverable amount is then compared to the carrying amount of the CGUs including goodwill and an impairment is recognised for any excess carrying value.
Computer software costs
Certain internal and external costs directly incurred in acquiring and developing software, net of specific project related grants, are capitalised and amortised over the estimated useful life on a straight line basis. The majority of software projects are amortised over two to five years. The Group’s core banking software is amortised over ten years. Software maintenance is expensed as incurred.
Brand names
Brand names acquired in a business combination include Aussie Home Loans, Bankwest and Count Financial Limited and these were initially recognised at fair value. Aussie Home Loans and Bankwest brand names are assessed as having an indefinite useful life as there is no foreseeable limit to the period over which the brand names are expected to generate cash flows. Count Financial brand name has been fully impaired during the year. The remaining brand names are amortised over their useful life.
Other intangibles
Other intangibles predominantly comprise customer relationships. Customer relationships acquired as part of a business combination are initially measured at fair value. They are subsequently measured at cost less accumulated amortisation and any impairment losses. Amortisation is calculated based on the timing of projected cash flows associated with those relationships.
Critical accounting judgements and estimates
Goodwill is allocated to CGUs whose recoverable amount is calculated for the purpose of impairment testing. The recoverable amount calculation relies primarily on publicly available earnings multiples, which are disclosed on page 181.
183

Strategic Financial Risk Corporate Directors’ Financial Other report performance management governance report report information
Notes to the financial statements
Group (1) (2) Bank (1) (2)
30 Jun 19 30 Jun 18 30 Jun 19 30 Jun 18Note $M $M $M $M
Accrued interest receivable 2,421 2,377 2,577 3,114
Accrued fees/reimbursements receivable (3) 1,117 1,255 258 205
Securities sold not delivered 1,893 1,823 1,323 1,398
Intragroup current tax receivable - - 320 283
Current tax assets 624 24 609 3
Prepayments 291 253 190 143
Defined benefit superannuation plan surplus 10.2 462 581 462 581
Other 307 611 171 485
Total other assets 7,115 6,924 5,910 6,212
(1) Comparative information has been restated to conform to presentation in the current year. (2) Current period balances reflect the adoption of AASB 15 ‘Revenue from Contracts with Customers’ on 1 July 2018. As permitted by AASB 15 comparative information
has not been restated. For details on adoption of AASB 15 refer to Note 1.1. (3) Accrued fees/reimbursements receivable as at 30 June 2019 include trail commission receivable of $442 million for the Group.
Except for the defined benefits superannuation plan surplus, the majority of the above amounts are expected to be recovered within 12 months of the Balance Sheet date.
Other assets include interest and fee receivables, current tax assets, prepayments receivables on unsettled trades and the surplus within defined benefit plans. Interest receivables are recognised on an accruals basis, fees and reimbursements receivable are recognised once the service is provided and trade date accounted securities sold not delivered are recognised between trade execution and final settlement. The remaining other assets are recognised on an accruals or service performed basis and amortised over the period in which the economic benefits from these assets are received. Further defined benefit plan details are provided in Note 10.2.
184 Commonwealth Bank of Australia Annual Report 2019

Other liabilities primarily represent provisions recognised, interest payable, fees and bills payable and unsettled trades. Other provisions principally cover annual leave and long service leave employee entitlements as well as general insurance claims, provisions for customer remediation, compliance and regulation programs and litigations. Also, it includes provision for impairment losses on financial guarantees and other off-balance sheet instruments issued by the Group. They do not relate to individually assessed provisions or collective provisions recognised on impaired financial assets of the Group (such as impaired home loans).
Certain provisions involve significant judgement to determine the likely outcome of events as well as a reliable estimate of the outflow. Where future events are uncertain or where the outflow cannot be reliably determined, these are disclosed as contingent liabilities. Contingent liabilities are not recognised in the Group’s Balance Sheet but disclosed in Note 12.1.
Commentary on certain other provisions and contingent liabilities are given in Note 7.1.
Group (1) Bank (1)
30 Jun 19 30 Jun 18 30 Jun 19 30 Jun 18Note $M $M $M $M
Employee entitlements 958 880 906 839
General insurance claims 292 219 - -
Customer remediation 959 162 901 134
Dividends 8.4 119 113 119 113
Compliance and regulation 213 283 213 283
Off-balance sheet instruments (2) 84 28 82 28
Other 126 175 116 164
Total other provisions 2,751 1,860 2,337 1,561
(1) Comparative information has been restated to conform to presentation in the current year. (2) The adoption of AASB 9 impairment requirements on 1 July 2018 resulted in an $87 million increase in the Group’s collective provisions for off-balance sheet instruments
(Bank: $84 million). As permitted by AASB 9, comparative information has not been restated. For details on the adoption of AASB 9 refer to Note 1.1.
Maturity distribution of other provisions
Group (1) Bank (1)
30 Jun 19 30 Jun 18 30 Jun 19 30 Jun 18$M $M $M $M
Less than twelve months 2,284 1,606 1,825 1,352
More than twelve months 467 254 512 209
Total other provisions 2,751 1,860 2,337 1,561
(1) Comparative information has been restated to conform to presentation in the current year.
185

Strategic Financial Risk Corporate Directors’ Financial Other report performance management governance report report information
Notes to the financial statements
Group (1) Bank (1)
30 Jun 19 30 Jun 18 30 Jun 19 30 Jun 18Reconciliation $M $M $M $MGeneral insurance claims:Opening balance 219 273 - -Additional provisions 637 530 - -Amounts utilised during the year (564) (584) - -Closing balance 292 219 - -
Customer remediation:Opening balance 162 202 134 194
Additional provisions (2) 963 162 903 135Amounts utilised during the year (166) (157) (136) (162)Release of provision - (45) - (33)Closing balance 959 162 901 134
Compliance and regulation:Opening balance 283 69 283 69
Additional provisions (3) 125 389 125 389Amounts utilised during the year (188) (175) (188) (175)Release of provision (7) - (7) -Closing balance 213 283 213 283
Off-balance sheet instruments:Opening balance 28 25 28 25
Changes on adoption of AASB 9 (4) 87 - 84 -Additional provisions - 3 - 3Release of provision (31) - (30) -Closing balance 84 28 82 28
Other:Opening balance 175 264 164 227Additional provisions 57 135 49 93Amounts utilised during the year (100) (131) (97) (113)Release of provision - (56) - (43)Reclassification to liabilities held for sale (6) (37) - -Closing balance 126 175 116 164
(1) Comparative information has been restated to conform to presentation in the current year. (2) Customer remediation includes provisions recognised during the current year for Aligned Advice, Banking and other Wealth Management remediation including related
program costs. (3) Compliance and regulation includes additional provisions recognised during the current year for Financial Crimes Compliance Program of Action, ASIC investigation,
Better Risk Outcomes Program (BROP) and litigation related costs. (4) The adoption of AASB 9 impairment requirements on 1 July 2018 resulted in an $87 million increase in the Group’s collective provisions for off-balance sheet instruments
(Bank: $84 million). As permitted by AASB 9, comparative information has not been restated. For details on the adoption of AASB 9 refer to Note 1.1.
General insurance claims
This provision is to cover future claims on general insurance contracts that have been incurred but not reported. The provision will be realised upon settlement of claims whose maturities were uncertain at the reporting date.
Customer remediation
This provision covers customer remediation costs and related program costs.
Compliance and regulation
This provision relates to project and other administrative costs associated with certain compliance and regulatory programs of the Group.
186 Commonwealth Bank of Australia Annual Report 2019

Other provisions
Other provisions include provisions for redundancy and restructuring costs, self-insurance provisions, make-good provisions in relation to property leases, and provisions for certain other costs.
Provisions for employee entitlements (such as long service leave, annual leave and other employee benefits) This provision is calculated based on expected payments. Where the payments are expected to be more than one year in the future, these provisions factor in the expected period of service by employees, as well as salary increases. These future obligations are discounted using a market observable rate.
Provisions are recognised for present obligations arising from past events where a payment to settle the obligation is probable and can be reliably estimated. Where the effect of the time value of money is material, the amount of the provision is measured as the present value of expenditures required to settle the obligation, based on a market observable rate.
Critical accounting judgements and estimates
Provisions are held in respect of a range of future obligations, some of which involve significant judgement about the likely outcome of various events and estimated future cash flows.
Customer remediation
Provisions for customer remediation require significant levels of estimation and judgement. The amount raised depends on a number of different assumptions, such as the number of years impacted, the forecast refund rate and the average cost per case. The Group is committed to comprehensively and efficiently addressing the full range of remediation issues impacting customers of the Banking and Wealth Management businesses. Significant resources have been committed to a comprehensive program of work, to ensure that all issues are identified and addressed.
Aligned Advice remediation
During the current year, the Group raised a provision for Aligned Advice remediation issues and program costs, including ongoing service fees charged where no service was provided. Aligned advisors are not employed by the Group but are representatives authorised to provide financial advice under the licences of the Group’s subsidiaries, Financial Wisdom Limited, Count Financial Limited and Commonwealth Financial Planning Limited (Pathways only). As at 30 June 2019, the Group holds a provision of $534 million in relation to Aligned Advice remediation. This includes $251 million for customer fee refunds, $123 million for interest on fees subject to refunds and $160 million for costs to implement the remediation program.
The Group’s estimate of the proportion of fees to be refunded is based on sample testing and assumes a refund rate of 24%. This compares to a refund rate of 22% which was paid for our salaried advisors. An increase/(decrease) in the failure rate by 1% would result in an increase/(decrease) in the provision of approximately $15 million.
The Group is finalising its remediation approach in consultation with ASIC.
Banking and other Wealth customer remediation
During the year ended 30 June 2019, the Group recognised provisions of $384 million for Banking and other Wealth Management customer remediation programs. The provision raised for banking remediation includes an estimate of refunds and interest to customers relating to business banking products, including bank guarantees, cash deposit accounts, merchants billing and certain commercial lending products. The wealth remediation provision includes an estimate of refunds and interest relating to advice quality, fees where no service was provided in the Commonwealth Financial Planning business, the Loan Protection Insurance product and certain other products.
Litigation, investigations and reviews
The Group is party to legal proceedings and the subject of investigations and reviews. These include the matters outlined below as at 30 June 2019. Provisions have been raised where indicated in line with the principles outlined in the accounting policy section of this note.
Litigation
Shareholder class actions
In October 2017 CBA was served with a shareholder class action proceeding filed in the Federal Court of Australia alleging breaches of CBA’s continuous disclosure obligations and misleading and deceptive conduct in relation to the subject matter of the civil penalty proceedings brought by Australian Transaction Reports and Analysis Centre (AUSTRAC). The AUSTRAC proceedings concerned contraventions of the Anti-Money Laundering and Counter-Terrorism Financing Act 2006 (Cth). The resolution of the proceedings was approved by the Federal Court on 20 June 2018 with CBA paying a penalty of $700 million and legal costs. In the shareholder class action, it is alleged that CBA shareholders who acquired an interest in CBA shares between 1 July 2015 and 3 August 2017 suffered loss caused by the alleged conduct.
187

Strategic Financial Risk Corporate Directors’ Financial Other report performance management governance report report information
Notes to the financial statements
Litigation, investigations and reviews (continued)
Litigation (continued)
Shareholder class actions (continued) On 29 June 2018 a similar second shareholder class action in relation to the subject matter of the AUSTRAC proceedings was served on CBA on behalf of certain CBA shareholders who acquired an interest in CBA shares between 16 June 2014 and 3 August 2017. On 10 July 2019, court orders were made confirming the two class action proceedings would continue, would be case managed together and proceed by way of one harmonised statement of claim.
It is currently not possible to determine the ultimate impact of these claims, if any, on the Group. The Group denies the allegations and continues to defend both claims. The Group has provided for legal costs expected to be incurred in the defence of the claims.
Superannuation class action
On 9 October 2018, a class action claim was filed against CBA and Colonial First State Investments Limited (CFSIL) in the Federal Court of Australia. The claim relates to investment in cash and deposit options (which are cash and deposit products prioritised by CBA) in Colonial First State FirstChoice Superannuation Trust and Commonwealth Essential Super. The main allegation is that members with these options in the funds received lower interest rates on them than they would have received had CFSIL put them in equivalent products with higher interest rates obtainable on the market. It is alleged that CBA was involved in CFSIL’s breaches as trustee of the funds and CFSIL’s breaches as Responsible Entity of the underlying managed investment schemes. Both CBA and CFSIL deny the allegations and filed a defence to the claim on 20 December 2018. The class action lawyers made further amendments to the claim filing an amended statement of claim on 16 April 2019. The amendments introduced additional allegations relating to another term deposit and a breach of trust in respect of adviser commissions, however the commissions claim is made against CFSIL only. CBA and CFSIL filed a defence to the amended claim on 7 June 2019 denying the new claims. It is currently not possible to determine the ultimate impact of this claim, if any, on the Group. The Group has provided for the legal costs expected to be incurred in the defence of the claim.
ASIC bank bill swap rate
On 21 June 2018 the Federal Court approved the agreement between CBA and the Australian Securities and Investment Commission (ASIC) to resolve the proceedings concerning alleged market manipulation and unconscionable conduct in respect of the bank bill market. Accordingly CBA has paid a civil penalty of $5 million and a community benefit payment of $15 million to Financial Literacy Australia. It also agreed to pay ASIC’s costs of the investigation and legal costs. The Group provided for these costs in the prior period.
As part of the settlement CBA also entered into an Enforceable Undertaking with ASIC under which CBA undertook to engage an independent expert to assess changes it has made (and will make) to its policies, procedures, controls systems, training, guidance and framework for the monitoring and supervision of employees and trading in Prime Bank Bills and CBA’s BBSW referenced product businesses. On 5 October 2018, CBA appointed EY as the independent expert. CBA provided its BBSW Program of remediation work to ASIC and EY on 21 December 2018. EY reviewed the BBSW Program and provided certain recommendations in their report dated 23 April 2019. CBA considered those recommendations with ASIC and EY and delivered its Final BBSW Program to ASIC and EY on 23 July 2019. EY are due to report on CBA’s Final BBSW Program on 30 August 2019. The Group has provided for costs associated with implementation of the BBSW program.
Investigations and reviews
ASIC investigation
In September 2017, following the commencement of the civil proceedings against CBA by AUSTRAC, ASIC launched an investigation in relation to the Group’s disclosure in respect of the matters the subject of the AUSTRAC proceedings. ASIC is also investigating, among other things, whether the officers and directors at CBA complied with other specific obligations under the Corporations Act 2001 (Cth). CBA continues to engage with ASIC in respect of the investigation and respond to requests made by ASIC. It is currently not possible to predict the ultimate impact of this investigation, if any, on the Group. The Group has provided for the legal costs expected to be incurred in relation to this investigation.
APRA’s prudential inquiry into CBA
On 28 August 2017, APRA announced it would establish an independent prudential inquiry (the Inquiry) into the Group with the goal of identifying shortcomings in the governance, culture and accountability frameworks.
The final report of the Inquiry was released on 1 May 2018 (the Final Report). The Final Report made a number of findings regarding the complex interplay of organisational and cultural factors within the Group and the need for enhanced management of non-financial risks. In response to the Final Report, the Group acknowledged that it will implement all of the recommendations and agreed to adjust its minimum operational risk capital requirements by an additional $1 billion (risk weighted assets $12.5 billion) until such time as the recommendations are implemented to APRA’s satisfaction.
CBA has entered into an Enforceable Undertaking under which CBA’s remedial action (Remedial Action Plan) in response to the Final Report would be agreed and monitored regularly by APRA. The Remedial Action Plan provides a detailed program of change outlining how CBA will improve the way it runs its business, manages risk, and works with regulators. The Remedial Action Plan also provides a comprehensive assurance framework, with Promontory Australasia (Sydney) Pty Ltd (Promontory) having been appointed as the independent reviewer and which is required to report to APRA on the Group’s progress against committed milestones every 3 months.
188 Commonwealth Bank of Australia Annual Report 2019

Litigation, investigations and reviews (continued)
Investigations and reviews (continued)
APRA’s prudential inquiry into CBA (continued) Promontory has submitted two reports in September 2018 and December 2018 which have also been released by CBA. Promontory has noted that the Remedial Action Plan program of work remains on track and CBA’s commitment to implementing the Inquiry’s recommendations in a timely and comprehensive way continued to be strong with all 156 milestones on schedule to be delivered by the due date. Promontory is providing APRA with quarterly progress reports, and CBA is committed to report publicly on its progress against the Remedial Action Plan twice a year. The Group has provided for costs associated with the implementation of the Remedial Action Plan.
The Royal Commission
The Royal Commission was established on 14 December 2017 and was authorised to inquire into misconduct by financial service entities (including CBA). Seven rounds of hearings into misconduct in the banking and financial services industry were held throughout 2018, covering a variety of topics including consumer and business lending, financial advice, superannuation, insurance and a policy round. The Royal Commission’s final report was delivered on 1 February 2019. The final report included 76 policy recommendations to the Australian Government and findings in relation to the case studies investigated during the hearings, with a number of referrals being made to regulators for misconduct by financial institutions, which is expected to result in heightened levels of enforcement action across the industry.
The 76 recommendations covered many of CBA’s business areas, and also canvassed the role of the regulators and the approach to be taken to customer focus, culture and remuneration. The recommendations regarding the role of regulators and their approach to enforcement may increase enforcement activity, costs and reputational impact for financial institutions. CBA released a statement to the ASX on 8 March 2019 welcoming the final report and committing to actions to deliver on the recommendations. The Government has accepted 75 of the 76 recommendations.
Ongoing service fees in Commonwealth Financial Planning
Following an ASIC investigation, Commonwealth Financial Planning (CFP) entered into an Enforceable Undertaking (EU) with ASIC in April 2018 and agreed to certain variations on 20 December 2018. Under the EU, as varied, CFP agreed, among other things, to provide an attestation to ASIC in relation to remediation of ongoing service over the period July 2015 to January 2018 and in relation to CFP’s current ongoing service compliance systems and processes. Although CFP was not in a position to sign the attestation in January 2019, CFP provided the attestation to ASIC on 30 May 2019. ASIC has since confirmed that it is satisfied with the attestation and compliance with the obligations under the EU is now finalised (save for the payment of some remaining refunds due to customers by 30 September 2019).
CFP has not charged ongoing service fees since 1 February 2019, and has not entered into new ongoing service agreements since that date. CFP is moving to a new model where customers will pay for advice once they have received it.
Fair Work Ombudsman (FWO) Investigation
The FWO has commenced an investigation in relation to CBA’s self-disclosure of discrepancies in employee arrangements and entitlements. CBA continues to engage with the FWO in respect of the investigation and respond to requests made by the FWO. It is currently not possible to predict the ultimate impact of this investigation, if any, on the Group.
New Zealand compliance audit findings
The Labour Inspectorate in New Zealand is undertaking a programme of compliance audits on a number of organisations in respect of the Holidays Act 2003 (the “Holidays Act”). On 18 December 2018 ASB Bank Limited (ASB) received the Labour Inspectorate’s report of its findings on ASB’s compliance with the Holidays Act. The findings, based on a sample of employees, include that ASB has not complied with the requirements of the Holidays Act by not including certain incentive payments in ASB’s calculation of gross earnings under the Holidays Act. ASB’s position in relation to that finding is that the application of the law is uncertain and yet to be definitively determined. That finding, if extrapolated to ASB’s entire workforce, would result in an estimated liability of NZD31 million in total for the preceding six years’ annual holiday payments. ASB will continue to engage with the Labour Inspectorate on the matter.
Enforceable Undertaking accepted by Office of Australian Information Commission
The Australian Information Commissioner (Commissioner) has accepted an Enforceable Undertaking (EU) offered by CBA. The EU underpins execution of further enhancements to the management and retention of customer personal information within CBA and certain subsidiaries.
The EU follows CBA’s ongoing work to address two incidents: one relating to the disposal by a third party of magnetic data tapes containing historical customer statements and the other relating to potential unauthorised internal user access to certain systems and applications containing customer personal information. CBA reported both incidents to the Commissioner in 2016 and 2018 respectively and has since been working to address these incidents and respond to inquiries made by the Commissioner. CBA has found no evidence to date, as a result of these incidents, that our customers’ personal information was compromised, or that there have been any instances of unauthorised access by CBA employees or third parties.
It is not currently possible to estimate the financial impact of the Group’s response under the EU.
189

Strategic Financial Risk Corporate Directors’ Financial Other report performance management governance report report information
Notes to the financial statements
Litigation, investigations and reviews (continued)
Investigations and reviews (continued)
Program of Action
The Group continues to strengthen its financial crime capabilities, and has invested significantly, recognising the crucial role that it plays, including through the Program of Action with coverage across all aspects of financial crime (including anti-money laundering/counter-terrorism financing, sanctions and anti-bribery and corruption) and all business units. The Group has provided for certain costs of running the Program of Action.
Remediation and Compliance Programs
The Group undertakes ongoing compliance activities, including review of products, advice, conduct and services provided to customers, as well as interest, fees and premiums charged.
Some of these investigations and reviews have resulted in remediation programs and where required the Group consults with the respective regulator on the proposed remediation action. There is a risk that where a breach has occurred, regulators may also impose fines and/or sanctions.
Provisions are recognised when it is probable an outflow will be required to address a past event and where a reliable estimate is available. There remains a contingent liability with respect to these matters, however the aggregate potential liability of the above matters cannot be reliably estimated.
Other matter
Financial Wisdom Limited, a subsidiary of the Group, has agreements pre-dating 2013, which provide authorised representatives with the ability to sell their client book to the subsidiary in certain circumstances contingent upon a number of key conditions being met. The agreements provide for the sale at a multiple of ongoing revenue subject to a range of criteria (including potential discount factors). The authorised representative must apply to commence the conditional sale process. No applications have been received to date. It is not currently possible to reliably estimate the financial impact of these agreements.
Group (1) Bank (1)
30 Jun 19 30 Jun 18 30 Jun 19 30 Jun 18$M $M $M $M
Bills payable 756 931 664 827
Accrued interest payable 2,676 2,745 2,059 2,163
Accrued fees, employee incentives and other items payable (2) (3) (4) 2,390 3,194 1,906 2,523
Securities purchased not delivered 2,414 2,456 1,774 1,942
Unearned income (3) (5) 1,439 1,389 1,011 968
Other 610 910 1,626 1,722
Total bills payable and other liabilities 10,285 11,625 9,040 10,145
(1) Comparative information has been restated to conform to presentation in the current year. (2) The balance as at 30 June 2018 includes a payable for AUSTRAC civil penalty of $700 million. (3) Current period balances reflect the adoption of AASB 15 Revenue from Contracts with Customers’ on 1 July 2018. As permitted by AASB 15 comparative information
has not been restated. For details on adoption of AASB 15 refer to Note 1.1. (4) Accrued fees payable as at 30 June 2019 include trail commissions payable of $265 million for the Group. (5) Unearned income includes annual facility fees, commitment fees and upfront fees that are deferred and recognised over the service periods. Of the unearned income
recognised at the beginning of the period, the Group and the Bank has recognised $177 million and $174 million, respectively, as income for the period ended 30 June 2019.
Bills Payable and Other Liabilities include accrued interest payable, accrued incentives payable, accrued fees payable and unearned income. Bills Payable and Other Liabilities are measured at the contractual amount payable. As most payables are short-term in nature, the contractual amount payable approximates fair value.
190 Commonwealth Bank of Australia Annual Report 2019

The Group maintains a strong capital position in order to satisfy regulatory capital requirements, provide financial security to its depositors and creditors and adequate return to its shareholders. The Group’s Shareholders’ Equity includes issued ordinary shares, retained earnings and reserves.
This section provides analysis of the Group’s Shareholders’ Equity including changes during the period.
The Bank is an Authorised Deposit-taking Institution (ADI) regulated by APRA under the authority of the Banking Act 1959. APRA has set minimum regulatory capital requirements for banks based on the Basel Committee on Banking Supervision (BCBS) guidelines.
The Basel III measurement and monitoring of capital has been effective from 1 January 2013. APRA has adopted a more conservative approach than the minimum standards published by the BCBS and also adopted an accelerated timetable for implementation. The requirements define what is acceptable as capital and provide methods of measuring the risks incurred by the Bank.
The regulatory capital requirements are measured for the Extended Licenced Entity Group (known as “Level 1”, comprising the Bank and APRA approved subsidiaries) and for the Bank and all of its banking subsidiaries, which includes ASB Bank (known as “Level 2” or the “Group”).
All entities which are consolidated for accounting purposes are included within the Group capital adequacy calculations except for:
The insurance and funds management operating subsidiaries; and
The entities through which securitisation of Group assets are conducted.
Regulatory capital is divided into Common Equity Tier 1 (CET1), Additional Tier 1 Capital and Tier 2 Capital. CET1 primarily consists of Shareholders’ Equity, less goodwill and other prescribed adjustments. Additional Tier 1 Capital is comprised of high quality capital providing a permanent and unrestricted commitment of funds, is freely available to absorb losses, ranks behind the claims of depositors and other more senior creditors and provides for fully
discretionary capital distributions. Tier 1 capital is the aggregate of CET1 and Additional Tier 1 capital. Tier 2 Capital is hybrid and debt instruments that fall short of necessary conditions to qualify as Additional Tier 1 to APRA. Total Capital is the aggregate of Tier 1 and Tier 2 Capital.
The tangible component of the investment in the insurance and funds management operations are deducted 100% from CET1.
Capital adequacy is measured by means of risk based capital ratios. The capital ratios reflect capital (CET1, Additional Tier 1, Tier 2 and Total Capital) as a percentage of total Risk Weighted Assets (RWA). RWA represents an allocation of risks associated with the Group’s assets and other related exposures.
The Group has a range of instruments and methodologies available to effectively manage capital. These include share issues and buybacks, dividend and DRP policies, hybrid capital raising and dated and undated subordinated loan capital issuances. All major capital related initiatives require approval of the Board.
The Group’s capital position is monitored on a continuous basis and reported monthly to the Executive Leadership Team and at regular intervals throughout the year to the Board.
The Group’s capital ratios throughout the 2017, 2018 and 2019 financial years were in compliance with both APRA minimum capital adequacy requirements and the Board approved minimums. The Group is required to inform APRA immediately of any breach or potential breach of its minimum prudential capital adequacy requirements, including details of remedial action taken or planned to be taken.
191

Strategic Financial Risk Corporate Directors’ Financial Other report performance management governance report report information
Notes to the financial statements
Group BankCurrency 30 Jun 19 30 Jun 18 30 Jun 19 30 Jun 18
Amount (M) Endnotes $M $M $M $M Tier 1 Loan Capital
Undated FRN USD 100 (1) 143 135 143 135
Undated PERLS VI AUD 2,000 (2) - 1,999 - 1,999
Undated PERLS VII AUD 3,000 (3) 2,985 2,978 2,985 2,978
Undated PERLS VIII AUD 1,450 (3) 1,441 1,436 1,441 1,436
Undated PERLS IX AUD 1,640 (3) 1,628 1,622 1,628 1,622
Undated PERLS X AUD 1,365 (3) 1,356 1,356 1,352 1,352
Undated PERLS XI AUD 1,590 (3) 1,580 - 1,576 -
Total Tier 1 Loan Capital 9,133 9,526 9,125 9,522
Tier 2 Loan Capital
AUD denominated (4) 1,774 1,773 1,774 1,773
USD denominated (5) 4,616 4,380 4,616 4,380
JPY denominated (6) 968 896 968 896
GBP denominated (7) - 266 - 266
NZD denominated (8) 379 729 - -
EUR denominated (9) 5,259 5,107 5,259 5,107
Other currencies denominated (10) 318 309 318 309
Total Tier 2 Loan Capital 13,314 13,460 12,935 12,731
Fair value hedge adjustments 519 6 509 (4)
Total Loan Capital (1) 22,966 22,992 22,569 22,249
(1) Loan Capital includes unrealised movements of $220 million in 2019 predominantly due to foreign exchange gains and losses.
As at 30 June 2019, $1,604 million of securities issued by the Group and $1,620 million of securities issued by the Bank were contractually due for redemption in the next 12 months (the Group has the right to call some securities earlier than the contractual maturity).
(1) USD100 million Floating Rate Notes
On 15 October 1986, the State Bank of Victoria issued USD125 million of floating rate notes, the current outstanding balance is USD100 million. The floating rate notes are perpetual but were able to be redeemed from October 1991. They were assigned to the Bank on 1 January 1991.
The Bank entered into an agreement with the Commonwealth of Australia on 31 December 1991 which provides that, if certain events occur, the Bank may either issue CBA ordinary shares to the Commonwealth of Australia, or (with the consent of the Commonwealth of Australia) conduct a renounceable rights issue for CBA ordinary shares to all shareholders. The capital raised must be used to pay any amounts due and payable on the floating rate notes.
The floating rate notes were issued into the international markets and are subject to English law. They qualify as Additional Tier 1 Capital of the Bank under the Basel III transitional arrangements for capital instruments as implemented by APRA.
(2) PERLS VI On 17 October 2012, the Bank issued $2,000 million of Perpetual Exchangeable Resaleable Listed Securities (PERLS VI). All PERLS VI were redeemed for cash on 17 December 2018.
(3) PERLS VII, PERLS VIII, PERLS IX, PERLS X and PERLS XI On 1 October 2014, the Bank issued $3,000 million of CommBank PERLS VII Capital Notes (PERLS VII). On 30 March 2016, the Bank issued $1,450 million of CommBank PERLS VIII Capital Notes (PERLS VIII). On 31 March 2017, the Bank issued $1,640 million of CommBank PERLS IX Capital Notes (PERLS IX). On 6 April 2018, the Bank issued $1,365 million of CommBank PERLS X Capital Notes (PERLS X). On 17 December 2018, the Bank issued $1,590 million of CommBank PERLS XI Capital Notes (PERLS XI). PERLS VII, PERLS VIII, PERLS IX, PERLS X and PERLS XI are subordinated, unsecured notes.
PERLS VII, PERLS VIII, PERLS IX, PERLS X and PERLS XI are listed on the ASX and are subject to New South Wales law. They qualify as Additional Tier 1 Capital of the Bank under Basel III as implemented by APRA.
192 Commonwealth Bank of Australia Annual Report 2019

(4) AUD denominated Tier 2 loan capital issuances
$25 million subordinated floating rate notes, issued April 1999, due April 2029;
$1,000 million subordinated notes issued November 2014, due November 2024; and
$750 million subordinated notes issued June 2016, due June 2026.
(5) USD denominated Tier 2 loan capital issuances
USD1,250 million subordinated notes issued December 2015, due December 2025;
USD750 million subordinated Euro Medium Term Notes (EMTN) issued October 2016, due October 2026; and
USD 1,250 million subordinated notes issued January 2018, due in January 2048.
(6) JPY denominated Tier 2 loan capital issuances
JPY20 billion perpetual subordinated EMTN, issued February 1999;
JPY40 billion subordinated EMTNs issued December 2016 (three tranches JPY20 billion, JPY10 billion and JPY10 billion), due December 2026; and
JPY13.3 billion subordinated EMTN issued March 2017, due March 2027.
(7) GBP denominated Tier 2 loan capital issuances
GBP150 million subordinated EMTN, issued June 2003, and redeemed in December 2018.
(8) NZD denominated Tier 2 loan capital issuances
NZD400 million subordinated, unsecured notes, issued April 2014, and redeemed in June 2019: On 17 April 2014, a wholly owned entity of the Bank (ASB Bank Limited) issued NZD400 million subordinated, unsecured notes (ASB Notes) with a face value of NZD1 each. All ASB Notes were redeemed for cash on 17 June 2019; and
NZD400 million subordinated, unsecured notes, issued November 2016, due December 2026: On 30 November 2016, ASB Bank Limited issued NZD400 million subordinated, unsecured notes (ASB Notes 2) with a face value of NZD1 each.
ASB Notes 2 are listed on the New Zealand Stock Exchange (NZX) debt market and are subject to New South Wales and New Zealand law. They qualify as Tier 2 Capital of the Bank and ASB under Basel III as implemented by APRA and the RBNZ. (9) EUR denominated Tier 2 loan capital issuances
EUR1,000 million subordinated notes, issued August 2009, due August 2019;
EUR1,250 million subordinated notes issued April 2015, due April 2027; and
EUR 1,000 million subordinated EMTN, issued October 2017, due October 2029.
(10) Other foreign currency denominated Tier 2 loan capital issuances
CNY1,000 million subordinated notes issued March 2015, due March 2025; and
HKD608 million subordinated EMTN issued March 2017, due March 2027.
All Tier 2 Capital securities issued prior to 1 January 2013 qualify as Tier 2 Capital of the Bank under the Basel III transitional arrangements for capital instruments as implemented by APRA. All Tier 2 Capital securities issued after 1 January 2013 qualify as Tier 2 Capital of the Bank under Basel III as implemented by APRA.
PERLS VII, PERLS VIII, PERLS IX, PERLS X and PERLS XI, and all Tier 2 Capital securities issued after 1 January 2013, are subject to Basel III, under which these securities must be exchanged for a variable number of CBA ordinary shares or written down if a capital trigger event (PERLS VII, PERLS VIII, PERLS IX, PERLS X and PERLS XI only) or a non-viability trigger event (all securities) occurs. Any exchange will occur as described in the terms of the applicable instrument documentation.
Loan capital are instruments issued by the Group, which qualify as regulatory capital under the Prudential Standards set by the Australian Prudential Regulation Authority (APRA) and the Reserve Bank of New Zealand (RBNZ). Loan capital is initially measured at fair value and subsequently measured at amortised cost using the effective interest rate method. Interest expense incurred is recognised in Net Interest Income.
193

Strategic Financial Risk Corporate Directors’ Financial Other report performance management governance report report information
Notes to the financial statements
Group Bank 30 Jun 19 30 Jun 18 30 Jun 19 30 Jun 18
$M $M $M $M
Ordinary Share CapitalShares on issue:
Opening balance 37,535 35,266 37,533 35,262
Issue of shares (net of issue costs) (1) - 164 - 164
Dividend reinvestment plan (net of issue costs) (2) (3) 748 2,105 748 2,107
38,283 37,535 38,281 37,533
Less treasury shares:
Opening balance (265) (295) - -
Purchase of treasury shares (4) (93) (95) (69) -
Sale and vesting of treasury shares (4) 95 125 - -
(263) (265) (69) -
Closing balance 38,020 37,270 38,212 37,533
(1) During the year ended 30 June 2018, shares issued relate to the acquisition of the remaining 20% interest in AHL Holding Pty Limited. (2) The determined dividend includes an amount attributable to the dividend reinvestment plan of $749 million (final 2017/2018), $536 million (interim 2017/2018) and
$1,573 million (final 2016/2017). The value of shares issued under plans rules net of issue costs for the respective periods was $748 million, $533 million and $1,572 million.
(3) The DRP in respect of 2018/2019 interim dividend was satisfied in full through the on-market purchase and transfer of 8,080,558 shares to participating shareholders. (4) The movement in treasury shares relate to amounts held within life insurance statutory funds, and 1,178,102 shares acquired at an average price of $69.95 for satisfying
the Company’s obligations under various equity settled share plans. Other than shares purchased as part of the Non-Executive Director fee sacrifice arrangements disclosed in Note 10.3, shares purchased were not on behalf of or initially allocated to a director.
Group Bank 30 Jun 19 30 Jun 18 30 Jun 19 30 Jun 18
Number of shares on issue Shares Shares Shares Shares Opening balance (excluding treasury shares deduction) 1,759,842,930 1,729,868,161 1,759,842,930 1,729,868,161
Issue of shares (1) - 2,087,604 - 2,087,604
Dividend reinvestment plan issues:2016/2017 Final dividend fully paid ordinary shares $75.73 - 20,772,433 - 20,772,433
2017/2018 Interim dividend fully paid ordinary shares $75.38 - 7,114,732 - 7,114,732
2017/2018 Final dividend fully paid ordinary shares $72.05 10,396,577 - 10,396,577 -
2018/2019 Interim dividend fully paid ordinary shares $73.21 (2) - - - -
Closing balance (excluding treasury shares deduction) 1,770,239,507 1,759,842,930 1,770,239,507 1,759,842,930
Less: treasury shares (3) (4) (2,508,628) (3,489,325) - -
Closing balance 1,767,730,879 1,756,353,605 1,770,239,507 1,759,842,930
(1) During the year ended 30 June 2018, the number of shares issued relates to the acquisition of the remaining 20% interest in AHL Holdings Pty Limited. (2) The DRP in respect of 2018/2019 interim dividend was satisfied in full through the on-market purchase and transfer of 8,080,558 shares at $73.21 to participating
shareholders. (3) Comparative information has been restated to conform to presentation in the current year. (4) Relates to treasury shares held within the life insurance statutory funds and the employees share scheme.
Ordinary shares have no par value and the Company does not have a limited amount of share capital.
Ordinary shares entitle holders to receive dividends payable to ordinary shareholders and to participate in the proceeds available to ordinary shareholders on winding up of the Company in proportion to the number of fully paid ordinary shares held.
On a show of hands every holder of fully paid ordinary shares present at a meeting in person or by proxy is entitled to one vote, and upon a poll one vote for each share held.
194 Commonwealth Bank of Australia Annual Report 2019

Group Bank30 Jun 19 30 Jun 18 30 Jun 19 30 Jun 18
Retained Profits $M $M $M $MOpening balance 28,360 26,274 23,819 22,256
Changes on adoption of new accounting standards (1) (955) - (868) -
Restated opening balance 27,405 26,274 22,951 22,256
Actuarial (losses)/gains from defined benefit superannuation plans (49) 161 (50) 159
Losses on liabilities at fair value due to changes in own credit risk - (2) - (2)
Realised gains and dividend income on treasury shares 12 16 - -
Net profit attributable to Equity holders of the Bank 8,571 9,329 7,783 8,875
Total available for appropriation 35,939 35,778 30,684 31,288
Transfers from/(to) general reserve 126 47 (2) (4)
Transfers from asset revaluation reserve 23 19 23 19
Interim dividend - cash component (2,949) (2,969) (2,949) (2,969)
Interim dividend - Dividend reinvestment plan (2) (3) (592) (536) (592) (536)
Final dividend - cash component (3,316) (2,406) (3,316) (2,406)
Final dividend - Dividend reinvestment plan (3) (749) (1,573) (749) (1,573)
Closing balance 28,482 28,360 23,099 23,819
(1) The Group adopted AASB 9 ‘Financial Instruments’ and AASB 15 ‘Revenue’ on 1 July 2018. The carrying amounts of assets and liabilities impacted by the adoption were adjusted through opening retained profits and reserves on 1 July 2018 as if the Group has always applied the new requirements. As permitted by AASB 9 and AASB 15, comparative information has not been restated. For details on the adoption of AASB 9 and AASB 15 refer to Note 1.1.
(2) The DRP in respect of 2018/2019 interim dividend was satisfied in full through the on-market purchase and transfer of 8,080,558 shares to participating shareholders. (3) The determined dividend includes an amount attributable to the dividend reinvestment plan of $749 million (final 2017/2018), $536 million (interim 2017/2018), and $1,573
million (final 2016/2017). The value of shares issued under plans rules net of issue costs for the respective periods was $748 million, $533 million, and $1,572 million.
195

Strategic report
Financial performance
Risk management
Corporate governance
Directors’ report
Financial report
Other information
Notes to the financial statements
Group Bank 30 Jun 19 30 Jun 18 30 Jun 19 30 Jun 18
Reserves $M $M $M $MGeneral ReserveOpening balance 859 906 584 580Transfer (to)/from retained profits (126) (47) 2 4Closing balance 733 859 586 584Capital ReserveOpening balance - - 1,254 1,254Closing balance - - 1,254 1,254Asset Revaluation ReserveOpening balance 235 223 206 196Revaluation of properties 38 35 37 33Transfer to retained profits (23) (19) (23) (19)Income tax effect (4) (4) (4) (4)Closing balance 246 235 216 206Foreign Currency Translation ReserveOpening balance 448 457 88 35Currency translation adjustments of foreign operations 491 (9) 233 39Currency translation on net investment hedge (20) 15 (19) 14Income tax effect (7) (15) - -Closing balance 912 448 302 88Cash Flow Hedge ReserveOpening balance (160) (107) 70 66Gains/(losses) on cash flow hedging instruments:
Recognised in other comprehensive income 1,087 (260) 1,356 6Transferred to Income Statement:
Interest income (630) (960) (674) (975)Interest expense 898 1,160 746 985
Income tax effect (408) 7 (425) (12)Closing balance 787 (160) 1,073 70Employee Compensation ReserveOpening balance 145 164 139 164Current period movement 16 (19) 22 (25)Closing balance 161 145 161 139
196 Commonwealth Bank of Australia Annual Report 2019

Group Bank 30 Jun 19 30 Jun 18 30 Jun 19 30 Jun 18
$M $M $M $MInvestment Securities Revaluation ReserveOpening balance - - - -
Change on adoption of AASB 9 (1) 149 - 227 -Restated opening balance 149 - 227 -Net gains on revaluation of investment securities 140 - 18 -Net gains on investment securities transferred to Income Statement on disposal (42) - (42) -
Income tax effect 6 - 18 -Closing balance 253 - 221 -Available-for-sale Investments ReserveOpening balance 149 226 227 261
Change on adoption of AASB 9 (1) (149) - (227) -Restated opening balance - 226 - 261Net losses on revaluation of available-for-sale investments - (185) - (135)Net losses on available-for-sale investments transferred to Income Statement on disposal - 87 - 87
Income tax effect - 21 - 14Closing balance - 149 - 227Total Reserves 3,092 1,676 3,813 2,568
Shareholders' Equity attributable to Equity holders of the Bank 69,594 67,306 65,124 63,920Shareholders' Equity attributable to Non-controlling interests 55 554 - -Total Shareholders' Equity 69,649 67,860 65,124 63,920
(1) The Group and the Bank adopted AASB 9 ‘Financial Instruments’ on 1 July 2018. The carrying amounts of assets and liabilities impacted by the adoption were adjusted through opening retained profits and reserves on 1 July 2018 as if the Group and the Bank have always applied the new requirements. As permitted by AASB 9, comparative information has not been restated. For details on the adoption of AASB 9 refer to Note 1.1.
197

Strategic report
Financial performance
Risk management
Corporate governance
Directors’ report
Financial report
Other information
Notes to the financial statements
Shareholders’ equity includes ordinary share capital, retained profits and reserves. Policies for each component are set out below:
Ordinary share capital Ordinary shares are recognised at the amount paid up per ordinary share, net of directly attributable issue costs. Where the Bank or entities within the Group purchase shares in the Bank, the consideration paid is deducted from total Shareholders’ equity and the shares are treated as treasury shares until they are subsequently sold, reissued or cancelled. Where such shares are sold or reissued, any consideration received is included in Shareholders’ Equity.
Retained profits
Retained profits includes the accumulated profits for the Group including certain amounts recognised directly in retained profits less dividends paid.
Reserves
General Reserve
The general reserve is derived from revenue profits and is available for dividend payments except for undistributable profits in respect of the Group’s life insurance business.
Capital reserve
The capital reserve held by the Bank relates to historic internal Group restructuring performed at fair value. The capital reserve is eliminated on consolidation.
Asset revaluation reserve
The asset revaluation reserve is used to record revaluation adjustments on the Group’s property assets. Where an asset is sold or disposed of, any balance in the reserve in relation to the asset is transferred directly to retained profits.
Foreign currency translation reserve
Exchange differences arising on translation of the Group’s foreign operations are accumulated in the foreign currency translation reserve. Specifically assets and liabilities are translated at the prevailing exchange rate at Balance Sheet date; revenue and expenses are translated at the transaction date; and all resulting exchange differences are recognised in the foreign currency translation reserve.
When a foreign operation is disposed of, exchange differences are recycled out of the reserve and recognised in the Income Statement.
Cash flow hedge reserve
The cash flow hedge reserve is used to record fair value gains or losses associated with the effective portion of designated cash flow hedging instruments. Amounts are reclassified to the Income Statement when the hedged transaction impacts profit or loss.
Employee compensation reserve
The employee compensation reserve is used to recognise the fair value of shares and other equity instruments issued to employees under the employee share plans and bonus schemes.
Investment securities revaluation reserve
The investment securities revaluation reserve includes changes in the fair value of investment securities measured at fair value through other comprehensive income. For debt securities, these changes are reclassified to the Income Statement when the asset is derecognised. For equity securities, these changes are not reclassified to the Income Statement when derecognised.
198 Commonwealth Bank of Australia Annual Report 2019

Group Bank 30 Jun 19 30 Jun 18 30 Jun 17 30 Jun 19 30 Jun 18
Note $M $M $M $M $M Ordinary SharesInterim ordinary dividend (fully franked) (2019: 200 cents; 2018: 200 cents; 2017: 199 cents)Interim ordinary dividend paid - cash component only 2,949 2,969 2,871 2,949 2,969
592 536 558 592 536
Total dividend paid 3,541 3,505 3,429 3,541 3,505
Other provision carried 119 113 100 119 113
4,089 4,065 3,979 4,089 4,065
Provision for dividends
Opening balance 113 100 90 113 100
Provision made during the year 7,606 7,484 7,237 7,606 7,484
Provision used during the year (7,600) (7,471) (7,227) (7,600) (7,471)
Closing balance 7.1 119 113 100 119 113
Dividend proposed and not recognised as a liability (fully franked) (2019: 231 cents; 2018: 231 cents; 2017: 230 cents) (2)
Interim ordinary dividend paid - Dividend Reinvestment Plan (1)
(1) The DRP in respect of the 2018/2019 interim dividend was satisfied in full through the on-market purchase and transfer of 8,080,558 shares to participating shareholders. (2) The 2019 final dividend will be satisfied by cash disbursements with the Dividend Reinvestment Plan (DRP) anticipated to be satisfied in full through an on-market
purchase of shares. The 2018 final dividend was satisfied by cash disbursements of $3,316 million and $749 million being reinvested by the participants through the DRP. The 2017 final dividend was satisfied by cash disbursements of $2,406 million and $1,573 million being reinvested by the participants through the DRP.
Final dividend
The Directors have declared a franked final dividend of 231 cents per share amounting to $4,089 million. The dividend will be payable on 26 September 2019 to shareholders on the register at 5pm AEST on 15 August 2019. The ex-dividend date is 14 August 2019.
The Board determines the dividends based on the Group’s net profit after tax (“cash basis”) per share, having regard to a range of factors including:
Current and expected rates of business growth and the mix of business; Capital needs to support economic, regulatory and credit ratings requirements; Investments and/or divestments to support business development; Competitors comparison and market expectations; and Earnings per share growth.
Dividend franking account After fully franking the final dividend to be paid for the year, the amount of credits available at the 30% tax rate as at 30 June 2019 to frank dividends for subsequent financial years, is $1,190 million (2018: $1,464 million). This figure is based on the franking accounts of the Bank at 30 June 2019, adjusted for franking credits that will arise from the payment of income tax payable on profits for the year, franking debits that will arise from the payment of dividends proposed, and franking credits that the Bank may be prevented from distributing in subsequent financial periods.
The Bank expects that future tax payments will generate sufficient franking credits for the Bank to be able to continue to fully frank future dividend payments. These calculations have been based on the taxation law as at 30 June 2019.
199

Strategic Financial Risk Corporate Directors’ Financial Other report performance management governance report report information
Notes to the financial statements
Dividend history
Half-year Full Year DRPPayout Payout DRP Participation
Cents Per Ratio (1) Ratio (1) Price Rate (2)
Half year ended Share Payment Date % % $ % 31 December 2016 199 04/04/2017 70. 1 - 83. 21 16. 3
30 June 2017 230 29/09/2017 79. 0 74. 6 75. 73 39. 5
31 December 2017 200 28/03/2018 71. 4 - 75. 38 15. 3
30 June 2018 231 28/09/2018 91. 9 81. 2 72. 05 18. 4
31 December 2018 200 28/03/2019 77. 0 - 73. 21 16. 7
30 June 2019 231 26/09/2019 103. 0 89. 0 - -
(1) Dividend Payout Ratio: dividends divided by statutory earnings (earnings are net of dividends on other equity instruments). (2) DRP Participation Rate: the percentage of total issued share capital participating in the DRP.
Dividends represent a distribution of profits that holders of ordinary shares receive from time to time. Dividends are not accrued as a liability until a dividend declaration is made by the Board of the Bank. The liability is reduced when the dividend is paid. The Board takes into consideration factors including the Group’s relative capital strength and the Group’s existing dividend payout ratio guidelines in determining the amount of dividends to be paid.
200 Commonwealth Bank of Australia Annual Report 2019

-
The Group is exposed to business, financial and non-financial risks arising from its operations. The Group manages these risks through its Risk Management Framework (Framework) that evolves with emerging risks arising from the changing business environment, better practice approaches, and regulatory and community expectations. The components of the Framework are illustrated below, including the governance that enables executive and Board oversight of these risks.
Our Risk Principles Trust and Reputation Risk Culture and Conduct Risk
Governance
Reporting
Risk policies &
Procedures R
isk Infrastructure
Group Strategy Group Risk Appetite Statement
Board Risk Committee
Business Risks (may include impacts across one or more fnancial or non fnancial risk types)
Macroeconomic Competition Technology Regulatory Political Customer preferences
Climate and environment Societal
Financial Risks Non-Financial Risks
Credit Risk
Losses from failure of counterparties to pay their debts
to CBA
Managed through assessments
of counterparty quality, obtaining
collateral and by diversifying portfolios via
our strategy and concentration
limits.
The Board approves Group
and BU strategies, monitors strategy
execution progress and operating environment changes and
regularly appraises the strategy
Insurance Risk
Unplanned losses from events that
we provide insurance for
Managed through underwriting
standards and limits, claims
controls, catastrophe
modelling and reinsurance to limit
large loss exposure.
Market Risk
Losses from unexpected
changes in market rates and prices
Managed through conservative
market risk limits, daily monitoring
of market risk exposures, hedging
strategies, stress testing and regular
tests of Value at Risk models.
Liquidity Risk
Not being able to meet fnancial
obligations as they fall due
Managed through a diverse and stable pool of
funding sources, maintaining
suffcient liquidity buffers, conducting regular stress tests
and daily monitoring of liquidity ratios.
Operational Risk
Losses from failure of internal
processes, systems or people
Our Operational Risk Management
Framework applies a range of tools
and techniques to identify and assess
risks, design and monitor controls and report and manage
issues.
Compliance
Fines or sanctions from
non-compliance with laws and
regulations
Compliance and conduct controls
are embedded in business processes,
routinely monitored and supported by mandatory
compliance training for all staff.
BU NFRC Committees
Non-Financial Risk Committee
(NFRC)
Business Unit (BU) Leadership Teams
Strategic Risk
Value destruction or less than planned
value creation due to changes in the external and
internal operating environments
BU Leadership Teams
Executive Leadership Team (ELT)
Asset and Liability Committee
(ALCO)
Insurance subsidiary
boards
Executive Risk Committee
(ERC)
CBA Group Board
Further details on each of the material risks, and how the Group manages them are outlined in this note.
201

Strategic Financial Risk Corporate Directors’ Financial Other report performance management governance report report information
Notes to the financial statements
The Group’s embedded Framework enables the appropriate development and implementation of strategies, policies and procedures to manage its risks. The Framework incorporates the requirements of APRA’s prudential standard for risk management (CPS 220) supported by the three key documentary components:
The Group Risk Appetite Statement (RAS) articulates the type and degree of risk the Board is prepared to accept and the maximum level of risk that the institution must operate within.
The Group Risk Management Approach (RMA) describes how the Group ensures the comprehensive management of risks across the Group in support of achieving its strategic goals.
The Group Business Plan (Plan) summarises the Group’s approach to the implementation of its strategic objectives. The Plan has a rolling three year duration and reflects material risks arising from its implementation.
The Framework is underpinned by key foundational components, in particular:
Risk culture and conduct risk
Risk culture is the beliefs, values and practices within the organisation that determine how risks are identified, measured, governed, and acted upon. A strong risk culture guides our actions in a resilient and flexible way when we need to react and make sound judgements in new and unfamiliar circumstances. The organisation’s culture influences employee behaviours and has the potential to lead to poor conduct. The Board’s RAS in relation to conduct requires business practices that are fair to our customers, protects the fair and efficient operation of the market and engender confidence in our products and services. The Group’s risk culture emphasises doing what is right, accountability, service, excellence and getting things done the right way. Annually the CBA Board forms a view regarding the effectiveness of the Group’s risk culture in keeping risk taking within appetite. Action plans are initiated and monitored to drive positive risk culture changes in areas of need.
Trust and reputation
The reputation of the Group and trust of stakeholders are significant assets. Damage to the Group’s reputation arises from negative perception on the part of customers, counterparties, shareholders, investors, debt holders, market analysts, regulators and other relevant stakeholders of the Group. The Group’s purpose and values combined with the organisational culture and our conduct as an organisation and as individuals form the framework which protects this asset. Potential adverse reputational impacts are mitigated by managing our material risks well, living by our Code of Conduct and actively focusing on transparency in business decisions and engagement with our customers. In addition the Group has a corporate responsibility plan focused on driving positive change through education, innovation and good business practice.
The four key elements that operationalise the Framework are:
Risk governance
The Group is committed to ensuring that its risk management practices reflect a high standard of governance. This enables Management to undertake, in an effective manner, prudent risk-taking activities. The Board operates as the highest level of the Group’s risk governance as specified in its Charter. The Risk Committee oversees the Framework and helps formulate the Group’s risk appetite for consideration by the Board. In particular it:
Monitors the Group’s risk profile (including identification of emerging risks);
Reviews regular reports from Management on the measurement of risk and the adequacy and effectiveness of the Group’s risk management and internal controls systems;
Forms a view on the independence of the risk function by meeting with the Group Chief Risk Officer (CRO) at the will of the Committee or the CRO.
The Group operates a Three Lines of Accountability (3LoA) model which places accountability for risk ownership with Line 1 Business Units (BUs) while focussing the mandate of Line 2 Risk Teams on appetite and framework, oversight, assurance, approval or acceptance of risk and advice. Line 3 Audit provides independent assurance to the Board, regulators and other stakeholders of the effectiveness of risk management, internal controls and governance. This model recognises that the business is best positioned to make optimal long-term risk-reward decisions that consider the full end-to-end value chain.
Risk policies & procedures
Risk policies and procedures provide guidance to the business on the management of each material risk. They support the Framework by:
Summarising the principles and practices to be used by the Group in identifying and assessing its material risks;
Quantifying the financial operating tolerances for material risks; and
Clearly stating the types of risk outcomes to which the Group is intolerant.
Risk reporting
Regular management information is produced which allows financial and non-financial risk positions to be monitored against approved Risk Appetite and policy limits. At Board level, the majority of risk reporting is provided to the Board Risk Committee but regulatory relationships, strategic risk and reputational matters, capital and liquidity risk are reported directly. Controls reporting is provided to the Audit Committee. The Chairs of the Board Risk and Audit Committees report to the Board post Committee meetings.
Risk management infrastructure
The Framework is supported by key infrastructure systems and processes for the management of the Group’s material risk types. The key risk management systems and processes in place include:
Established risk identification and assessment processes; Risk controls and mitigation plans; A Management Information System to measure and aggregate
risks across the Group; Risk models and tools; A Risk-Adjusted-Performance Measurement (RAPM) process
that is a means of assessing the performance of a business after adjustment for its capital consumption and is used as a basis for executive incentives; and
An Internal Capital Adequacy Assessment Process (ICAAP) used in combination with other risk management practices (including stress testing), to understand, manage and quantify the Group’s risks; the outcomes of which are used to inform risk decisions, set capital buffers and assist strategic planning.
202 Commonwealth Bank of Australia Annual Report 2019

Material risk types
Risk Type Description Governing Policies and KeyManagement Committees
Key Limits, Standards and Measurement Approaches
Credit Risk Credit risk is the potential for loss arising from the failure of a counterparty to meet their contractual obligations to the Group. At a portfolio level, credit risk includes concentration risk arising from interdependencies between customers, and concentrations of exposures to geographical regions and industry sectors.
Governing Policies: Group Credit Risk Principles,
Framework and Governance Group and Business Unit
Credit Risk Policies
Key Management Committee: Executive Risk Committee Loan Loss Provisioning
Committee
The following credit concentration frameworks set credit portfolio concentration limits: Large Credit Exposure Policy; Country Risk Exposure Policy; and Industry Sector Concentration Policy. Credit risk indicators with associated intervention levels are set in the Group RAS for corporate and retail exposures and cascaded to BUs. Group and BU Credit Risk Policies cover the credit risk exposure cycle. The measurement of credit risk is primarily based on the APRA accredited Advanced Internal Ratings Based (AIRB) approach.
Market Risk Market risk is the risk that market Governing Policies: The Group Market Risk Policy sets limits and (including Equity rates and prices will change and The Group Market Risk Policy standards with respect to the following: Risk) that this may have an adverse effect Traded Market Risk;
on the profitability and/or net worth Key Management Committee: Interest Rate Risk in the Banking Book of the Group. This includes Asset and Liability Committee (IRRBB); changes in interest rates, foreign Residual Value Risk; exchange rates, equity and Non-traded Equity Risk; and commodity prices, credit spreads, and the resale value of operating leased assets at maturity (lease residual value risk).
Market Risk in Insurance Businesses. The respective measurement approaches for these risks include: Value at Risk, Stress Testing; Market Value Sensitivity, Net Interest
Earnings at Risk; Aggregate Residual Value Risk Margin; Aggregate Portfolio Limit; and Value at Risk.
Liquidity and Liquidity risk is the combined risks Governing Policies: The Group Liquidity Policy sets limits and Funding Risk of not being able to meet financial
obligations as they fall due (funding liquidity risk), and that liquidity in financial markets, such as the market for debt securities, may reduce significantly (market liquidity risk).
Group Liquidity Risk Management Policy
Key Management Committee: Asset and Liability Committee
standards with respect to the following: The Liquidity Coverage Ratio, which sets
minimum levels for liquid assets; The Net Stable Funding Ratio, which
encourages stable funding of core assets; Market and idiosyncratic stress test
scenarios; and Limits that set tolerances for the sources
and tenor of funding.
The measurement of liquidity risk uses scenario analysis, covering both adverse and ordinary operating circumstances.
Operational Risk Operational risk is the risk of loss resulting from inadequate or failed internal processes, people and systems or from external events.
Governing Policies: Operational Risk
Management Framework (ORMF)
Operational Risk Policies and Standards
Key Management Committee: Executive Leadership Team
Non- Financial Risk Committee.
A range of Operational Risk indicators are included in the Group Risk Appetite Statement (RAS).
The measurement of operational risk capital is based on an APRA accredited Advanced Measurement Approach. The approach combines internal and external loss experience and business judgements captured through Scenario Analysis.
Compliance Risk Compliance risk is the risk of Governing Policies: The CMF sets the standards on how the Group sanctions, financial loss, or reputational damage we may suffer as a result of the Group’s failure to comply with laws, regulations, rules, statements of regulatory policy, and codes of conduct
Group Compliance Management Framework (CMF)
Group and Business Unit Compliance Policies
identifies, assesses, manages, monitors and reports on Compliance management.
The CMF is supported by a number of key policies which are set out in the Group Risk Management Approach (RMA).
applicable to its business activities (not including operational risk failures) and includes societal expectations.
Key Management Committee: Executive Leadership Team
Non- Financial Risk Committee.
Compliance statements and indicators are included in the Group Risk Appetite Statement (RAS).
Financial crime represents a sub-component of Compliance Risk and covers risks including Anti Money Laundering, Counter Terrorism Financing, Anti-Bribery and Corruption, and Sanctions.
203

Strategic Financial Risk Corporate Directors’ Financial Other report performance management governance report report information
Notes to the financial statements
Material risk types (continued)
Risk Type Description Governing Policies and KeyManagement Committees
Key Limits, Standards and Measurement Approaches
Insurance Risk Insurance risk is the risk of loss due to the potential for events the Group has insured against occurring more frequently or with greater severity than anticipated.
Insurance risk also covers inadequacy in product design, pricing, underwriting, claims management and reinsurance management as well as variations in policy lapses, servicing expenses, and option take up rates.
Governing Policies: Product Management Policy Underwriting Policy Claims Management Policy Reinsurance Management
Policy
Key Management Committee: Executive Committees of
insurance writing businesses
The key limits and standards with respect to insurance risk are set via the end-to-end policies of insurance writing businesses. The major methods include: Sound product design and pricing to ensure
that customers understand the extent of their cover and that premiums are sufficient to cover the risk involved;
Controls to ensure payment of valid claims without undue delay;
Regular review of insurance experience (as loss ratios, new business volumes and lapse rates), so that product design, policy liabilities and pricing remains sound; and
Transferring a proportion of insurance risk to reinsurers to keep within risk appetite.
Insurance risk is measured using actuarial techniques which are used to establish the likelihood and severity of possible insurance claims.
Strategic Risk Strategic Risk is the risk of material Governing Policies: The Group assesses, monitors and responds to stakeholder value destruction or less than planned value creation due to changes in the Group’s external and internal operating environments (including macroeconomic conditions, competitive forces, technology,
Group Strategic Risk Management Policy
Key Management Committee: Executive Leadership Team
Strategic Risk throughout its processes for: strategy development, approval and review; identifying and monitoring changes and
potential changes to the operating environment; and
monitoring execution progress of strategies.
regulatory, political and social trends, customer preference and the environment).
In developing the strategy, the following is considered: impact of strategy on the Group’s risk profile
and measures of risk appetite; recent execution progress; and assumptions around the operating
environment.
Climate Change is an important component of strategic risk. As for all other strategic risks, the potential adverse impacts of climate change manifest, and are therefore measured and managed, as an outcome in the Group’s other material risks. In order to understand these potential impacts, and in support of our commitment to limiting climate change in line with the Paris Agreement, and the responsible global transition to net zero emissions by 2050 we: Develop scenario analyses to understand
the impacts of both transition and physical climate-related risks on our business and the implications for strategic and tactical portfolio decisions; and
Have developed policy frameworks which consider Environmental, Social and Governance (ESG) issues, including climate change impacts in assessing our relationships with customers and suppliers.
In addition, Corporate Responsibility programs: Outline our objectives for safeguarding the
environment, while supporting economic growth and development; and
Provide guidelines in monitoring and reducing our own greenhouse gas emissions and energy use.
204 Commonwealth Bank of Australia Annual Report 2019

Credit risk management principles and portfolio standards
The Group has clearly defined credit policies for the approval and management of credit risk. Credit policies apply to all credit risks, with specific portfolio standards applying to all major lending areas. These set the minimum requirements in assessing the integrity and ability of counterparties to meet their contracted financial obligations for repayment, acceptable forms of collateral and security and the frequency of credit reviews.
The Group’s credit policies and frameworks include concentration limits, which are designed to achieve portfolio outcomes that are consistent with the Group’s risk appetite and risk/return expectations.
The Credit Portfolio Assurance unit, part of Group Audit and Assurance, reviews credit portfolios and business unit compliance with credit policies, frameworks, application of credit risk ratings and other key practices on a regular basis.
The credit risk portfolio has two major segments:
(i) Retail managed segment This segment has sub-segments covering housing loans, credit cards, personal loans, and personal overdrafts. It also covers most non-retail lending where the aggregated credit exposure to a group of related obligors is less than $1 million.
Auto-decisioning is used to approve credit applications for eligible counterparties in this segment. Auto-decisioning uses a scorecard approach based on a combination of factors, which may include the Group’s historical experience on similar applications, information from a credit reference bureau, the Group’s existing knowledge of a counterparty’s behaviour and updated information provided by the counterparty.
Loan applications that do not meet scorecard Auto-decisioning requirements may be referred to a Personal Credit Approval Authority (PCAA) for manual decisioning.
After loan origination, these portfolios are managed using behavioural scoring systems and a delinquency band approach, such as actions taken when loan payments are greater than 30 days past due differ from actions when payments are greater than 60 days past due. Loans past due are reviewed by the relevant Arrears Management or Financial Assistance Team.
(ii) Risk-rated segment This segment comprises non-retail exposures, including bank and sovereign exposures. Each exposure is assigned an internal Credit Risk-Rating (CRR) based on Probability of Default (PD) and Loss Given Default (LGD).
Either a PD Rating Tool or expert judgement is used to determine the PD for customers in this segment. Expert judgement is used where the complexity of the transaction and/or the counterparty is
such that it is inappropriate to rely completely on a statistical model. External ratings may be used for benchmarking in the expert judgement assessment.
The CRR is designed to:
Aid in assessing changes to counterparty credit quality; Influence decisions on approval, management and pricing of
individual credit facilities; and Provide the basis for reporting details of the Group's credit
portfolio.
Credit risk-rated exposures are generally reviewed on an individual basis, at least annually, and fall within the following categories:
“Pass” – these credit facilities qualify for approval of new or increased exposure on normal commercial terms; and
“Troublesome or Impaired Assets (TIAs)” – these credit facilities are not eligible for new or increased exposure, unless it facilitates rehabilitation to “pass grade” or protects or improves the Group’s position by maximising recovery prospects. Where a counterparty is in default but no loss is expected based on an assessment of the security position and other factors, the facility may be classed as troublesome but not impaired. Where a loss is expected, a facility is classified as impaired. Restructured facilities, where the original contractual arrangements have been modified outside commercial terms to provide concessions for the customer’s financial difficulties, are classified as impaired.
Default is to be recorded with one or more of the following:
The customer is 90 days or more overdue on a scheduled credit repayment; or
The customer is unlikely to repay their credit obligation to the Group in full without taking action, such as realising on available security.
Credit risk measurement The measurement of credit risk uses analytical tools to calculate both: (i) Expected, and (ii) Unexpected Loss probabilities for the credit portfolio. The use of analytical tools is governed by the Credit Rating Governance Committee.
(i) Expected loss
Expected Loss (EL) is the product of:
PD; Exposure at Default (EAD); and LGD.
The PD, expressed as a percentage, is the estimate of the probability that a client will default within the next 12 months.
205

Strategic Financial Risk Corporate Directors’ Financial Other report performance management governance report report information
Notes to the financial statements
Credit risk measurement (continued) EAD is the estimate of the amount of a facility that will be outstanding under a facility in the event of default. Estimates are based on a downturn in economic conditions. The estimate is based on the actual amount outstanding, plus the undrawn amount multiplied by a credit conversion factor (CCF). The CCF represents the potential rate of conversion from undrawn 12 months prior to default to drawn at default. For most committed facilities, the Group applies a CFF of 100% to the undrawn amount.
For uncommitted facilities, the EAD will generally be the drawn balance only. For defaulted facilities, it is the actual amount outstanding at default. For retail exposures, a modelling approach can be used based on factors including limit usage, arrears and loan type to segment accounts into homogeneous pools to calculate EAD.
LGD expressed as a percentage, is the estimated proportion of a facility likely to be lost in the event of default. LGD is impacted by:
Type and level of any collateral held; Liquidity and volatility of collateral; Carrying costs (effectively the costs of providing a facility that
is not generating an interest return); and Realisation costs.
Various factors are considered when calculating PD, EAD and LGD. Considerations include the potential for default by a borrower due to economic, management, industry and other risks, and the mitigating benefits of any collateral held as security.
(ii) Unexpected loss
In addition to EL, a more stressed loss amount is calculated. This Unexpected Loss estimate directly affects the calculation of regulatory and internal economic capital requirements. Refer to the Performance Overview section and Note 8.1 for information relating to regulatory capital.
Climate related risk
Climate risk is a risk for the Group. The impacts of climate change have the potential to affect our customers’ ability to service and repay their loans, and the value of collateral the Group holds to secure loans. These impacts include long-term changes in climatic conditions, extreme weather events, and the action taken by governments, regulators or society more generally to transition to a low carbon economy. The Group is a major provider of non-retail loans. A key step in credit risk due diligence for non-retail lending is the assessment of potential transactions for environmental, social and governance (ESG) risks, including climate risk, through our ESG Risk Assessment Tool. All Institutional Banking and Markets loans, as well as large loans in other business units, are evaluated through the Group’s compulsory ESG risk assessment process. The risk of climate change is assessed at origination and during the annual review process. Exposures with medium or high risk profile are subject to additional due diligence and heightened consideration and assessment in the credit process. As at 30 June 2019, there is considered to be no material risk of loss due to climate-related risk in our client exposures.
Credit risk mitigation, collateral and other credit enhancements
The Group has policies and procedures in place setting out the circumstances where acceptable and appropriate collateral is to be taken to mitigate credit risk. These include valuation parameters, review frequency and independence of valuation.
The general nature of collateral that may be taken, and the balances held, are summarised below by financial asset classes.
Cash and liquid assets
Collateral is not usually sought on the majority of cash and liquid asset balances as these types of exposures are generally considered low risk. However, securities purchased under agreement to resell are collateralised by highly liquid debt securities. The collateral related to agreements to resell has been legally transferred to the Group subject to an agreement to return them for a fixed price.
The Group’s cash and liquid asset balance included $14,527 million (2018: $21,148 million) deposited with central banks and is considered to carry less credit risk.
Receivables due from other financial institutions
Collateral is usually not sought on these balances as exposures are generally considered to be of low risk. The exposures are mainly short term and to investment grade banks.
Trading assets at fair value through income statement and Investment securities at fair value through OCI These assets are carried at fair value, which accounts for the credit risk. Investment securities at amortised cost are measured at amortised cost and presented net of provisions for impairment. Collateral is not generally sought from the issuer or counterparty but collateral may be implicit in the terms of the instrument (such as an asset-backed security).
Insurance assets
These assets are carried at fair value, which accounts for the credit risk. Collateral is not generally sought or provided on these types of assets, other than a fixed charge over properties backing Australian mortgage investments. In most cases the credit risk of insurance assets is borne by policyholders. However, on certain insurance contracts the Group retains exposure to credit risk.
Other assets at fair value through income statement These assets are carried at fair value, which accounts for the credit risk.
Derivative assets
The Group’s use of derivative contracts is outlined in Note 5.3. The Group is exposed to counterparty credit risk on derivative contracts. The counterparty credit risk is affected by the nature of the trades, the counterparty, netting, and collateral arrangements. Credit risk from derivatives is mitigated where possible (typically for financial institutions counterparties, but less frequently for corporate or government counterparties) through netting agreements, whereby derivative assets and liabilities with the same counterparty can be offset and cleared with Central Counterparties (CCPs). The International Swaps and Derivatives Association (ISDA) Master Agreement (or other derivative agreements) are used by the Group as an agreement for documenting Over-the-Counter (OTC) derivatives.
206 Commonwealth Bank of Australia Annual Report 2019

Derivative assets (continued) The fair value of collateral held and the potential effect of offset obtained by applying master netting agreements are disclosed in Note 9.7.
Due from controlled entities
Collateral is not generally taken on these intergroup balances.
Credit commitments and contingent liabilities
The Group applies fundamentally the same risk management policies for off Balance Sheet risks as it does for its on Balance Sheet risks. Collateral may be sought depending on the strength of the counterparty and the nature of the transaction. Of the Group’s off Balance Sheet exposures, $103,713 million (2018: $100,110 million) are secured.
Loans, bills discounted and other receivables
The principal collateral types for loans and receivable balances are:
Mortgages over residential and commercial real estate; and Charges over business assets such as cash, shares,
inventory, fixed assets and accounts receivables.
Collateral security is generally taken except for government, bank and corporate counterparties that are often externally risk-rated and of strong financial standing. Longer term consumer finance, such as housing loans, are generally secured against real estate, while short term revolving consumer credit is generally not secured by formal collateral.
The collateral mitigating credit risk of the key lending portfolios is addressed in the table ‘Collateral held against Loans, Bills Discounted and Other Receivables’ within this note.
207

Strategic Financial Risk Corporate Directors’ Financial Other report performance management governance report report information
Notes to the financial statements
Maximum exposure to credit risk by industry and asset class before collateral held or other credit enhancements
Bank and Asset OtherAgri- Other Home Constr- Other Financ- Comm and
Sovereign culture Financial Loans uction Personal ing Indust. Other Total $M $M $M $M $M $M $M $M $M $M
Australia
Cash and liquid assets 4,575 - 11,930 - - - - - - 16,505Receivables due from other financial institutions - - 3,037 - - - - - - 3,037
Assets at fair value through Income Statement:
Trading 21,354 - 941 - - - - 9,308 - 31,603Other 81 - 434 - - - - 414 242 1,171
Derivative assets 1,414 64 18,550 - 4 - - 1,150 - 21,182Investment securities:
At amortised cost 9 - 7,341 - - - - - - 7,350At fair value through Other Comprehensive Income 43,540 - 16,893 - - - - 67 - 60,500
Loans, bills discounted and other receivables (1) 16,762 9,291 8,675 467,361 3,238 21,508 7,947 118,207 - 652,989
Bank acceptances - 3 - - 2 - - 27 - 32Other assets (2) 488 3 5,496 - - 10 - 230 14,175 20,402Assets held for sale 1,423 - 5,633 - - - - 3,943 4,211 15,210Total on Balance Sheet Australia 89,646 9,361 78,930 467,361 3,244 21,518 7,947 133,346 18,628 829,981
Credit risk exposures relating to off Balance Sheet assets:Guarantees 36 20 1,584 - 324 - - 3,195 - 5,159Loan commitments 605 1,975 7,675 67,874 2,331 21,207 - 34,156 - 135,823Other commitments 58 11 1,362 - 1,390 214 12 2,963 - 6,010Total Australia 90,345 11,367 89,551 535,235 7,289 42,939 7,959 173,660 18,628 976,973
OverseasCredit risk exposures relating to on Balance Sheet assets:Cash and liquid assets 9,952 - 2,930 - - - - - - 12,882Receivables due from other financial institutions - - 5,056 - - - - - - 5,056
Assets at fair value through Income Statement:
Trading 602 - 251 - - - - 50 - 903Insurance - - - - - - - - - -Other - - - - - - - - - -
Derivative assets 169 12 2,110 - - - - 1,742 - 4,033Investment securities:
At amortised cost 5 - - - - - - - - 5At fair value through Other Comprehensive Income 16,092 - 2,320 - - - - - - 18,412
Loans, bills discounted and other receivables (1) 1,436 10,467 6,637 55,581 701 1,924 416 30,830 - 107,992
Bank acceptances - - - - - - - - - -Other assets (2) 30 - 338 - - 4 8 49 1,308 1,737Assets held for sale 683 - 469 - - - - 23 166 1,341Total on Balance Sheet Overseas 28,969 10,479 20,111 55,581 701 1,928 424 32,694 1,474 152,361
Credit risk exposures relating to off Balance Sheet assets:Guarantees - 10 949 - 54 - - 334 - 1,347Loan commitments 419 834 5,034 7,875 222 2,098 48 9,849 - 26,379Other commitments - - 473 - 3 - - 612 - 1,088Total Overseas 29,388 11,323 26,567 63,456 980 4,026 472 43,489 1,474 181,175Total gross credit risk 119,733 22,690 116,118 598,691 8,269 46,965 8,431 217,149 20,102 1,158,148
Credit risk exposures relating to on Balance Sheet assets:
At 30 June 2019Group
(1) Loans, bills discounted and other receivables is presented gross of provisions for impairment and unearned income in line with Note 3.1. (2) For the purpose of reconciling to the Balance Sheet, “Other Assets” predominantly comprises assets which do not give rise to credit exposure, including Property, plant
and equipment, Investment in Associates and Joint Ventures, Intangible Assets, Deferred tax assets and Other assets.
208 Commonwealth Bank of Australia Annual Report 2019

Maximum exposure to credit risk by industry and asset class before collateral held or other credit enhancements (continued)
Bank and Asset OtherAgri- Other Home Constr- Other Financ- Comm and
Sovereign culture Financial Loans uction Personal ing Indust. Other Total $M $M $M $M $M $M $M $M $M $M
Australia
Cash and liquid assets 4,461 - 10,974 - - - - - - 15,435Receivables due from other financial institutions - - 2,644 - - - - - - 2,644
Assets at fair value through Income Statement:
Trading 15,917 - 2,780 - - - - 10,223 - 28,920Other 49 - 209 - - - - - - 258
Derivative assets 1,371 45 20,865 - 4 - - 1,736 - 24,021Available-for-sale investments 39,906 - 26,525 - - - - 298 - 66,729
Loans, bills discounted and other receivables (1) 16,823 8,998 12,951 451,367 3,028 23,658 8,581 118,681 - 644,087
Bank acceptances - 2 - - 2 - - 35 - 39Other assets (2) 1,030 4 4,272 - 1 7 - 237 15,100 20,651Assets held for sale 1,521 - 4,585 - - - - 4,172 3,136 13,414Total on Balance Sheet Australia 81,078 9,049 85,805 451,367 3,035 23,665 8,581 135,382 18,236 816,198
Credit risk exposures relating to off Balance Sheet assets:Guarantees 44 18 991 6 307 - - 3,059 - 4,425Loan commitments 907 1,750 7,837 66,483 2,439 21,783 - 34,995 - 136,194Other commitments 54 22 736 1 1,357 - 10 3,021 - 5,201Total Australia 82,083 10,839 95,369 517,857 7,138 45,448 8,591 176,457 18,236 962,018
OverseasCredit risk exposures relating to on Balance Sheet assets:Cash and liquid assets 16,688 - 4,294 - - - - - - 20,982Receivables due from other financial institutions - - 6,578 - - - - - - 6,578
Assets at fair value through Income Statement:
Trading 2,161 - 1,085 - - - - 88 - 3,334Insurance 358 - 14 - - - - - - 372Other - - - - - - - - - -
Derivative assets 348 16 4,586 - - - - 3,162 - 8,112Available-for-sale investments 12,515 - 2,995 - - - - 1 - 15,511
Loans, bills discounted and other receivables (1) 1,571 9,930 7,075 50,298 638 1,844 457 32,129 - 103,942
Bank acceptances - - - - - - - 340 - 340Other assets (2) 30 - 798 2 - 3 10 43 1,334 2,220Assets held for sale - - 1,788 - - - - - 452 2,240Total on Balance Sheet Overseas 33,671 9,946 29,213 50,300 638 1,847 467 35,763 1,786 163,631
Credit risk exposures relating to off Balance Sheet assets:Guarantees 1 9 1,486 - 40 - - 304 - 1,840Loan commitments 349 1,007 4,266 7,268 230 1,977 - 10,799 - 25,896Other commitments 9 5 607 - 1 - - 1,018 - 1,640Total Overseas 34,030 10,967 35,572 57,568 909 3,824 467 47,884 1,786 193,007Total gross credit risk 116,113 21,806 130,941 575,425 8,047 49,272 9,058 224,341 20,022 1,155,025
Credit risk exposures relating to on Balance Sheet assets:
At 30 June 2018Group
(1) Loans, bills discounted and other receivables is presented gross of provisions for impairment and unearned income in line with Note 3.1. (2) For the purpose of reconciling to the Balance Sheet, “Other Assets” predominantly comprises assets which do not give rise to credit exposure, including Property, plant
and equipment, Investment in Associates and Joint Ventures, Intangible Assets, Deferred tax assets and Other assets.
209

Strategic Financial Risk Corporate Directors’ Financial Other report performance management governance report report information
Notes to the financial statements
Large exposures
Concentrations of exposure to any counterparty or counterparty group are controlled by a large credit exposure policy, which defines a graduated limit framework that restricts credit limits based on the internally assessed CRR, the type of client, and facility tenor. All exposures outside the policy limits require approval by the Executive Risk Committee and are reported to the Board Risk Committee.
The following table shows the number of the Group’s Corporate and Industrial aggregated counterparty exposures (including direct and contingent exposures), which individually were greater than 5% of the Group’s capital resources (Tier 1 and Tier 2 capital):
Group30 Jun 19 30 Jun 18
Number Number
- -
- -10% to less than 15% of the Group's capital resources
5% to less than 10% of the Group's capital resources
The Group has a high quality, well diversified credit portfolio, with 61% of the gross loans and other receivables in domestic mortgage loans and a further 7% in overseas mortgage loans, primarily in New Zealand. Overseas loans account for 14% of loans and advances.
Distribution of financial assets by credit classification
When doubt arises as to the collectability of a credit facility, the financial instrument is classified and reported as impaired. Provisions for impairment are raised where there is objective evidence of impairment and for an amount adequate to cover assessed credit related losses. The Group regularly reviews its financial assets and monitors adherence to contractual terms. Credit risk-rated exposures are assessed, at least at each Balance Sheet date, to determine whether the financial asset is impaired.
Distribution of financial instruments by credit quality
The tables on pages 211 to 213 provide information about the gross carrying amount of the Group’s and the Bank’s loans, bills discounted and other receivables by credit rating grade and ECL stage as at 30 June 2019.
This segmentation of loans in retail and risk-rated portfolios is based on the mapping of a counterparty’s internally assessed PD to S&P Global ratings, reflecting a counterparty’s ability to meet their credit obligations. In particular, retail PD pools have been aligned to the Group’s PD grades which are consistent with rating agency views of credit quality segmentation. Investment grade is representative of lower assessed default probabilities with other classifications reflecting progressively higher default risk. Specifically, Investment grade corresponds to S&P ratings AAA to BBB-, Pass grade corresponds to S&P ratings BB+ to B-, Weak grade corresponds to S&P ratings below CCC. For Stage 3, weak grade includes exposures in default.
210 Commonwealth Bank of Australia Annual Report 2019

Distribution of financial instruments by credit quality
Group30 Jun 19
Stage 1 Stage 2 Stage 3 Stage 3Collectively Collectively Collectively Individually
Assessed Assessed Assessed Assessed TotalLoans, bills and discounted and other receivables $M $M $M $M $MCredit grade
Investment 380,159 30,212 - - 410,371
Pass 231,412 87,280 - - 318,692
Weak 9,159 15,024 4,500 2,110 30,793
Gross carrying amount 620,730 132,516 4,500 2,110 759,856
Undrawn credit commitments
Credit grade
Investment 78,502 14,470 - - 92,972
Pass 35,709 11,381 - - 47,090
Weak 748 425 87 88 1,348
Total undrawn credit commitments 114,959 26,276 87 88 141,410
Total credit exposures 735,689 158,792 4,587 2,198 901,266
Impairment provision 897 2,444 479 895 4,715
ECL coverage % 0. 1 1. 5 10. 4 40. 7 0. 5
Financial guarantees and other off Balance Sheet instrumentsCredit grade
Investment 8,866 1,553 - - 10,419
Pass 3,358 3,689 - - 7,047
Weak 45 236 19 20 320Total financial guarantees and other off Balance Sheet instruments 12,269 5,478 19 20 17,786
Impairment provision 8 75 1 - 84
ECL coverage % 0. 1 1. 4 5. 3 - 0. 5
Total Credit Exposures
Credit grade
Investment 467,527 46,235 - - 513,762
Pass 270,479 102,350 - - 372,829
Weak 9,952 15,685 4,606 2,218 32,461
Total credit exposures (1) 747,958 164,270 4,606 2,218 919,052
Total impairment provision 905 2,519 480 895 4,799
ECL coverage % 0. 1 1. 5 10. 4 40. 4 0. 5
(1) The assessment of significant increase in credit risk includes the impact of forward looking adjustments for emerging risk at an industry, geographical location or a particular portfolio segment level, which are calculated by stressing an exposure’s internal credit rating grade at the reporting date. This accounts for approximately 65% of Stage 2 credit exposures for the Group as at 30 June 2019.
211

Strategic Financial Risk Corporate Directors’ Financial Other report performance management governance report report information
Notes to the financial statements
Distribution of Financial Instruments by Credit Quality (continued) Bank
30 Jun 19Stage 1 Stage 2 Stage 3 Stage 3
Collectively Collectively Collectively IndividuallyAssessed Assessed Assessed Assessed Total
Loans, bills and discounted and other receivables $M $M $M $M $MCredit grade
Investment 353,676 28,113 - - 381,789
Pass 182,819 72,105 - - 254,924
Weak 8,681 13,529 4,081 1,728 28,019
Gross carrying amount 545,176 113,747 4,081 1,728 664,732
Undrawn credit commitments
Credit grade
Investment 75,156 14,395 - - 89,551
Pass 28,875 10,180 - - 39,055
Weak 728 383 70 65 1,246
Total undrawn credit commitments 104,759 24,958 70 65 129,852
Total credit exposures 649,935 138,705 4,151 1,793 794,584
Impairment provision 793 2,220 441 801 4,255
ECL coverage % 0. 1 1. 6 10. 6 44. 7 0. 5
Financial guarantees and other off Balance Sheet instrumentsCredit grade
Investment 8,762 1,553 - - 10,315
Pass 3,064 3,511 - - 6,575
Weak 45 230 18 20 313Total financial guarantees and other off Balance Sheet instruments 11,871 5,294 18 20 17,203
Impairment provision 8 73 2 - 83
ECL coverage % 0. 1 1. 4 11. 1 - 0. 5
Total Credit Exposures
Credit grade
Investment 437,594 44,061 - - 481,655
Pass 214,758 85,796 - - 300,554
Weak 9,454 14,142 4,169 1,813 29,578
Total credit exposures (1) 661,806 143,999 4,169 1,813 811,787
Total impairment provision 801 2,293 443 801 4,338
ECL coverage % 0. 1 1. 6 10. 6 44. 2 0. 5
(1) The assessment of significant increase in credit risk includes the impact of forward looking adjustments for emerging risk at an industry, geographical location or a particular portfolio segment level, which are calculated by stressing an exposure’s internal credit rating grade at the reporting date. This accounts for approximately 65% of Stage 2 credit exposures for the Bank as at 30 June 2019.
212 Commonwealth Bank of Australia Annual Report 2019

Distribution of financial instruments by credit quality (continued) The tables below present the Group’s and the Bank’s total impairment provisions on lending assets by ECL stage as at 30 June 2019.
30 Jun 19
Stage 1 Stage 2 Stage 3 Stage 312 months ECL Lifetime ECL Lifetime ECL Lifetime ECL
Portfolio (1)Collectively
assessed Collectively
assessed Collectively
assessed Individually
assessedRetail
Secured lending 266 393 132 271 1,062
Unsecured lending 474 934 217 3 1,628
Total retail 740 1,327 349 274 2,690
Non-retailCorporate and business lending, bank and sovereign entities (2) 168 1,192 131 621 2,112
Total (3) 908 2,519 480 895 4,802
Total
Impairment provisions, $M
(1) Exposures subject to impairment provisions include drawn balances, undrawn credit commitments, financial guarantees and debt securities classified at fair value through OCI.
(2) Stage 1 provision includes $3 million ECL in relation to investment securities at fair value through OCI. (3) The assessment of significant increase in credit risk includes the impact of forward looking adjustments for emerging risk at an industry, geographical location or a
particular portfolio segment level, which are calculated by stressing an exposure’s internal credit rating grade at the reporting date. This accounts for approximately 65% of Stage 2 credit exposures for the Group as at 30 June 2019.
Bank30 Jun 19
Stage 1 Stage 2 Stage 3 Stage 312 months ECL Lifetime ECL Lifetime ECL Lifetime ECL
Portfolio (1) (2)Collectively
assessed Collectively
assessed Collectively
assessed Individually
assessedRetail
Secured lending 234 353 122 261 970
Unsecured lending 434 906 200 3 1,543
Total retail 668 1,259 322 264 2,513
Non-retailCorporate and business lending, bank and sovereign entities (3) 135 1,034 121 537 1,827
Total (4) 803 2,293 443 801 4,340
Impairment provisions, $M
Total
(1) Exposures subject to impairment provisions include drawn balances, undrawn credit commitments, financial guarantees and debt securities classified at fair value through OCI.
(2) Impairment provisions exclude $21 million recognised in relation to the Bank’s loans to controlled entities. (3) Stage 1 provision includes $2 million ECL in relation to investment securities at fair value through OCI. (4) The assessment of significant increase in credit risk includes the impact of forward looking adjustments for emerging risk at an industry, geographical location or a
particular portfolio segment level, which are calculated by stressing an exposure’s internal credit rating grade at the reporting date. This accounts for approximately 65% of Stage 2 credit exposures for the Bank as at 30 June 2019.
213

Strategic Financial Risk Corporate Directors’ Financial Other report performance management governance report report information
Notes to the financial statements
Prior year comparative credit risk disclosures
The credit risk disclosures on pages 214 to 219 were included in the Financial Report for the year ended 30 June 2018 and do not reflect the adoption of AASB 9 on 1 July 2018. These tables are not directly comparable to the credit risk information as at 30 June 2019 provided under AASB 9 on pages 211 to 213 above.
Distribution of financial instruments by credit quality
The table below segregates financial instruments into neither past due nor impaired, past due but not impaired and impaired. An asset is considered to be past due when a contracted amount, including principal or interest, has not been met when due or it is otherwise outside contracted arrangements. Excluding some retail portfolios, the amount included as past due is the entire contractual balance, rather than the overdue portion.
Group30 Jun 18
Neither Past Past due Total Provisions Due nor but not Impaired for ImpairmentImpaired Impaired Assets Gross Losses Net
$M $M $M $M $M $MCash and liquid assets 36,417 - - 36,417 - 36,417Receivables due from other f inancial institutions
9,222 - - 9,222 - 9,222
Assets at fair value through Income Statement:
Trading 32,254 - - 32,254 - 32,254
Insurance 372 - - 372 - 372
Other 258 - - 258 - 258
Derivative assets 32,081 - 52 32,133 - 32,133
Available-for-sale investments 82,240 - - 82,240 - 82,240Loans, bills discounted and other receivables:
Australia 628,865 13,071 2,151 644,087 (3,178) 640,909
Overseas 100,904 2,152 886 103,942 (427) 103,515
Bank acceptances 379 - - 379 - 379
Assets held for sale 11,999 - - 11,999 - 11,999
Credit related commitments 175,106 - 90 175,196 (28) 175,168
Total 1,110,097 15,223 3,179 1,128,499 (3,633) 1,124,866
214 Commonwealth Bank of Australia Annual Report 2019

Prior year comparative credit risk disclosures (continued)
Distribution of financial instruments by credit quality (continued)
Bank30 Jun 18
Neither Past Past Due Total ProvisionsDue nor but not Impaired for Impairment
Impaired Impaired Assets Gross Losses Net$M $M $M $M $M $M
Cash and liquid assets 33,581 - - 33,581 - 33,581Receivables due from other f inancial institutions
8,376 - - 8,376 - 8,376
Assets at fair value through Income Statement:
Trading 29,993 - - 29,993 - 29,993
Insurance - - - - - -
Other - - - - - -
Derivative assets 30,834 - 51 30,885 - 30,885
Available-for-sale investments 77,731 - - 77,731 - 77,731Loans, bills discounted and other receivables:
Australia 620,641 13,066 2,130 635,837 (3,171) 632,666
Overseas 24,681 23 326 25,030 (90) 24,940
Bank acceptances 379 - - 379 - 379Shares in and loans to controlled entities
118,252 - - 118,252 - 118,252
Credit related commitments 159,521 - 85 159,606 (28) 159,578
Total 1,103,989 13,089 2,592 1,119,670 (3,289) 1,116,381
215

Strategic Financial Risk Corporate Directors’ Financial Other report performance management governance report report information
Notes to the financial statements
Prior year comparative credit risk disclosures (continued)
Credit quality of loans, bills discounted and other receivables which were neither past due nor impaired
For the analysis below, financial assets that are neither past due nor impaired have been segmented into investment, pass and weak classifications. This segmentation of loans in retail and risk-rated portfolios is based on the mapping of a counterparty’s internally assessed PD to S&P Global ratings, reflecting a counterparty’s ability to meet their credit obligations. In particular, retail PD pools have been aligned to the Group’s PD grades which are consistent with rating agency views of credit quality segmentation. Investment grade is representative of lower assessed default probabilities with other classifications reflecting progressively higher default risk. No consideration is given to LGD, the impact of any recoveries or the potential benefit of mortgage insurance.
Group 30 Jun 18 Other Home Other Asset Commercial Loans Personal Financing and Industrial Total Credit grading $M $M $M $M $M Australia
Investment 307,993 4,608 643 71,525 384,769
Pass 124,371 13,863 7,435 83,185 228,854
Weak 7,567 4,045 243 3,387 15,242
Total Australia 439,931 22,516 8,321 158,097 628,865 Overseas (1)
Investment 15,471 - 9 23,837 39,317
Pass 32,327 1,544 424 26,078 60,373
Weak 888 - - 326 1,214
Total overseas 48,686 1,544 433 50,241 100,904
Total loans which were neither past due nor impaired 488,617 24,060 8,754 208,338 729,769
(1) For New Zealand Housing Loans, PDs reflect Reserve Bank of New Zealand requirements resulting in higher PDs on average and lower grading.
216 Commonwealth Bank of Australia Annual Report 2019

Prior year comparative credit risk disclosures (continued)
Credit quality of loans, bills discounted and other receivables which were neither past due nor impaired (continued)
Bank 30 Jun 18 Other Home Other Asset Commercial Loans Personal Financing and Industrial Total Credit grading $M $M $M $M $M Australia
Investment 307,974 4,603 641 70,727 383,945
Pass 117,245 13,847 7,386 83,066 221,544
Weak 7,539 4,039 243 3,331 15,152
Total Australia 432,758 22,489 8,270 157,124 620,641 Overseas
Investment 65 - 1 18,711 18,777
Pass 295 2 - 5,544 5,841
Weak - - - 63 63
Total overseas 360 2 1 24,318 24,681
Total loans which were neither past due nor impaired 433,118 22,491 8,271 181,442 645,322
217

Strategic Financial Risk Corporate Directors’ Financial Other report performance management governance report report information
Notes to the financial statements
Prior year comparative credit risk disclosures (continued)
Other financial assets which were neither past due nor impaired
The majority of all other financial assets of the Group and the Bank that were neither past due nor impaired as at 30 June 2018 were of investment grade.
Age analysis of loans, bills discounted and other receivables that are past due but not impaired
For the purposes of this analysis an asset is considered to be past due when any payment under the contractual terms has been missed.
Past due loans are not classified as impaired if no loss to the Group is expected. Unsecured consumer loans are impaired at 90 days past due and may be classified as impaired earlier if non-commercial repayment arrangements are agreed or a related loan is classified as impaired.
Group 30 Jun 18 Other Home Other Asset Commercial Loans Personal (1) Financing and Industrial Total Loans which were past due but not impaired $M $M $M $M $M Australia
Past due 1 - 29 days 4,703 550 146 1,170 6,569
Past due 30 - 59 days 1,770 180 38 199 2,187
Past due 60 - 89 days 1,005 121 11 93 1,230
Past due 90 - 179 days 1,410 - 2 140 1,552
Past due 180 days or more 1,292 2 - 239 1,533
Total Australia 10,180 853 197 1,841 13,071 Overseas
Past due 1 - 29 days 1,227 205 13 268 1,713
Past due 30 - 59 days 162 44 4 7 217
Past due 60 - 89 days 63 19 1 8 91
Past due 90 - 179 days 45 14 2 15 76
Past due 180 days or more 26 7 - 22 55
Total overseas 1,523 289 20 320 2,152
Total loans which were past due but not impaired 11,703 1,142 217 2,161 15,223
(1) Included in these balances are credit card facilities and other unsecured portfolio managed facilities up to 90 days past due. At 90 days past due all unsecured portfolio
managed facilities are classified as impaired.
218 Commonwealth Bank of Australia Annual Report 2019

Prior year comparative credit risk disclosures (continued)
Age analysis of loans, bills discounted and other receivables that are past due but not impaired
Bank 30 Jun 18 Other Home Other Asset Commercial Loans Personal (1) Financing and Industrial Total Loans which were past due but not impaired $M $M $M $M $M Australia
Past due 1 - 29 days 4,701 550 146 1,170 6,567
Past due 30 - 59 days 1,769 180 38 199 2,186
Past due 60 - 89 days 1,005 121 11 93 1,230
Past due 90 - 179 days 1,409 - 2 140 1,551
Past due 180 days or more 1,291 2 - 239 1,532
Total Australia 10,175 853 197 1,841 13,066 Overseas
Past due 1 - 29 days 20 - - - 20
Past due 30 - 59 days 2 - - - 2
Past due 60 - 89 days - - - - -
Past due 90 - 179 days - - - - -
Past due 180 days or more - - - 1 1
Total overseas 22 - - 1 23 Total loans which were past due but not impaired 10,197 853 197 1,842 13,089
(1) Included in these balances are credit card facilities and other unsecured portfolio managed facilities up to 90 days past due. At 90 days past due all unsecured portfolio
managed facilities are classified as impaired.
Impaired Assets by Classification
Assets in credit risk rated portfolios and retail managed portfolios are assessed for objective evidence that the financial asset is impaired.
Impaired assets are split into the following categories:
Non-Performing Facilities; Restructured Facilities; and Unsecured retail managed facilities 90 days or more past due.
Non-performing facilities are facilities against which an individually assessed provision for impairment has been raised and facilities where loss of principal or interest is anticipated. Interest income on these facilities is reserved and taken to the Income Statement only if paid in cash or if a recovery is made.
Restructured facilities are facilities where the original contractual terms have been modified to non-commercial terms due to financial difficulties of the borrower. Interest on these facilities is taken to the Income Statement. Failure to comply fully with the modified terms will result in immediate reclassification to non-performing.
Unsecured retail products 90 days or more past due are credit cards, personal loans and other unsecured retail products which are 90 days or more past due. These loans are collectively provided for.
The Group does not manage credit risk based solely on arrears categorisation, but also uses credit risk rating principles as described earlier in this note.
219

Strategic report
Financial performance
Risk management
Corporate governance
Directors’ report
Financial report
Other information
Notes to the financial statements
Impaired assets by classification (continued) Group
30 Jun 19 30 Jun 18 30 Jun 17 30 Jun 16 30 Jun 15$M $M $M $M $M
Australia
Non-Performing assets:
Gross balances 2,217 1,711 1,962 2,002 1,940
Less provisions for impairment (826) (694) (817) (807) (775)
Net non-performing assets 1,391 1,017 1,145 1,195 1,165
Restructured assets:
Gross balances 428 264 174 221 144
Less provisions for impairment (13) (4) - - -
Net restructured assets 415 260 174 221 144
Unsecured retail products 90 days or more past due:
Gross balances 245 254 251 252 251
Less provisions for impairment (199) (161) (157) (169) (130)
Net unsecured retail products 90 days or more past due 46 93 94 83 121
Net Australia impaired assets 1,852 1,370 1,413 1,499 1,430
Overseas
Non-Performing assets:
Gross balances 518 695 686 560 454
Less provisions for impairment (126) (176) (163) (138) (112)
Net non-performing assets 392 519 523 422 342
Restructured assets:
Gross balances 196 242 101 67 54
Less provisions for impairment (6) (20) - - -
Net restructured assets 190 222 101 67 54
Unsecured retail products 90 days or more past due:
Gross balances 18 13 13 14 12
Less provisions for impairment (17) (13) (12) (13) (9)
Net unsecured retail products 90 days or more past due 1 - 1 1 3
Net Overseas impaired assets 583 741 625 490 399
Total net impaired assets 2,435 2,111 2,038 1,989 1,829
220 Commonwealth Bank of Australia Annual Report 2019

Impaired assets by size
GroupAustralia Overseas Total Australia Overseas Total
30 Jun 19 30 Jun 19 30 Jun 19 30 Jun 18 30 Jun 18 30 Jun 18Impaired assets by size $M $M $M $M $M $MLess than $1 million 1,698 266 1,964 1,418 139 1,557
$1 million to $10 million 628 147 775 569 197 766
Greater than $10 million 564 319 883 242 614 856
Total (1) (2) 2,890 732 3,622 2,229 950 3,179
Movement in impaired assets
Group30 Jun 19 30 Jun 18 30 Jun 17 30 Jun 16 30 Jun 15
Movement in gross impaired assets $M $M $M $M $M
Gross impaired assets - opening balance 3,179 3,187 3,116 2,855 3,367
New and increased 2,289 2,136 2,164 2,370 2,095
Balances written off (1,245) (1,196) (1,225) (1,328) (1,355)
Returned to performing or repaid (1,328) (1,666) (1,637) (1,460) (1,903)
Portfolio managed - new/increased/return to performing/repaid 727 718 769 679 651
Gross impaired assets - closing balance (1) (2) 3,622 3,179 3,187 3,116 2,855
(1) As at 30 June 2019, impaired assets include those assets in Stage 3 that are considered impaired, as well as $139 million of restructured assets in Stage 2. Stage 3 assets include impaired assets and those that are defaulted but not impaired as they are well secured.
(2) Includes $3,454 million of loans and advances and $168 million of other financial assets (30 June 2018: $3,037 million of loans and advances and $142 million of other financial assets).
221

Strategic Financial Risk Corporate Directors’ Financial Other report performance management governance report report information
Notes to the financial statements
Impaired assets by industry and status
Group30 Jun 19
Gross Total Provisions NetTotal Impaired for Impaired Impaired Net
Balance Assets Assets (1) Assets Write-offs (2) Recoveries (2) Write-offs (2)
Industry $M $M $M $M $M $M $M Loans - Australia
Sovereign 16,762 - - - - - -
Agriculture 9,291 114 (52) 62 59 - 59
Bank and other financial 8,675 6 (15) (9) 1 - 1
Home loans 467,361 1,596 (272) 1,324 134 (4) 130
Construction 3,238 82 (84) (2) 44 (1) 43
Other personal 21,508 276 (202) 74 787 (169) 618
Asset financing 7,947 78 (10) 68 17 (2) 15Other commercial and industrial 118,207 626 (403) 223 126 (14) 112
Total loans - Australia 652,989 2,778 (1,038) 1,740 1,168 (190) 978
Loans - Overseas
Sovereign 1,436 - - - - - -
Agriculture 10,467 298 (46) 252 2 - 2
Bank and other financial 6,637 10 - 10 5 - 5
Home loans 55,581 204 (10) 194 2 (1) 1
Construction 701 1 - 1 2 - 2
Other personal 1,924 16 (20) (4) 70 (11) 59
Asset financing 416 2 - 2 - - -Other commercial and industrial 30,830 145 (73) 72 152 (4) 148
Total loans - Overseas 107,992 676 (149) 527 233 (16) 217
Total loans 760,981 3,454 (1,187) 2,267 1,401 (206) 1,195
Credit commitments 146,992 111 - 111 - - -
Derivatives 21,182 1 - 1 - - -Total other balances - Australia 168,174 112 - 112 - - -
Credit commitments 28,814 9 - 9 - - -
Derivatives 4,033 47 - 47 - - -Total other balances - Overseas 32,847 56 - 56 - - -
Total other balances 201,021 168 - 168 - - -
Total 962,002 3,622 (1,187) 2,435 1,401 (206) 1,195
Other balances - Overseas
Other balances - Australia
(1) Includes $895 million of individually assessed provisions and $292 million of collective provisions. Provisions for impaired assets include $9 million for restructured assets in Stage 2.
(2) Write-off, recoveries and net write-offs are not recognised against credit commitments or derivatives as these exposures are closed out and converted to loans and receivables on impairment. Write-offs and recoveries take place subsequent to this conversion.
222 Commonwealth Bank of Australia Annual Report 2019

Impaired assets by industry and status (continued) Group
30 Jun 18Gross Total Provisions Net
Total Impaired for Impaired Impaired NetBalance Assets Assets (1) Assets Write-offs (2) Recoveries (2) Write-offs (2)
Industry $M $M $M $M $M $M $M Loans - Australia
Sovereign 16,823 - - - - - -
Agriculture 8,998 94 (56) 38 28 - 28
Bank and other financial 12,951 7 (16) (9) 3 (1) 2
Home loans 451,367 1,256 (236) 1,020 126 (2) 124
Construction 3,028 16 (21) (5) 13 - 13
Other personal 23,658 289 (171) 118 764 (165) 599
Asset financing 8,581 63 (16) 47 23 (5) 18Other commercial and industrial 118,681 426 (343) 83 179 (14) 165
Total loans - Australia 644,087 2,151 (859) 1,292 1,136 (187) 949
Loans - Overseas
Sovereign 1,571 - - - - - -
Agriculture 9,930 365 (25) 340 3 - 3
Bank and other financial 7,075 9 - 9 5 - 5
Home loans 50,298 89 (5) 84 2 (1) 1
Construction 638 1 (1) - 1 (1) -
Other personal 1,844 11 (33) (22) 65 (10) 55
Asset financing 457 4 - 4 - - -Other commercial and industrial 32,129 407 (145) 262 207 (2) 205
Total loans - Overseas 103,942 886 (209) 677 283 (14) 269
Total loans 748,029 3,037 (1,068) 1,969 1,419 (201) 1,218
Other balances - Australia
Credit commitments 145,820 75 - 75 - - -
Derivatives 24,021 3 - 3 - - -Total other balances - Australia 169,841 78 - 78 - - -
Other balances - Overseas
Credit commitments 29,376 15 - 15 - - -
Derivatives 8,112 49 - 49 - - -Total other balances - Overseas 37,488 64 - 64 - - -
Total other balances 207,329 142 - 142 - - -
Total 955,358 3,179 (1,068) 2,111 1,419 (201) 1,218
(1) Includes $870 million of individually assessed provisions and $198 million of collective provisions. (2) Write-off, recoveries and net write-offs are not recognised against credit commitments or derivatives as these exposures are closed out and converted to loans and
receivables on impairment. Write-offs and recoveries take place subsequent to this conversion.
223

Strategic Financial Risk Corporate Directors’ Financial Other report performance management governance report report information
Notes to the financial statements
Collateral held against loans, bills discounted and other receivables
Group30 Jun 19
Home Other Asset CommercialLoans Personal Financing and Industrial Total (1)
Maximum exposure ($M) 522,942 23,432 8,363 206,244 760,981Collateral classification:Secured (%) 99. 1 12. 2 98. 7 49. 0 83. 4Partially secured (%) 0. 9 - 1. 3 15. 7 4. 8Unsecured (%) - 87. 8 - 35. 3 11. 8
(1) As at 30 June 2019, total exposures in ECL Stage 3 were $6,610 million. 60% of these exposures were secured, 26% partially secured and 14% unsecured.
Group30 Jun 18
Home Other Asset CommercialLoans Personal Financing and Industrial Total
Maximum exposure ($M) 501,665 25,502 9,038 211,824 748,029Collateral classification:Secured (%) 99. 1 12. 4 99. 4 44. 7 81. 2Partially secured (%) 0. 9 - 0. 6 15. 3 4. 9Unsecured (%) - 87. 6 - 40. 0 13. 9
Bank30 Jun 19
Home Other Asset CommercialLoans Personal Financing and Industrial Total (1)
Maximum exposure ($M) 460,031 21,497 7,900 176,306 665,734Collateral classification:Secured (%) 99. 0 13. 0 98. 4 46. 5 82. 9Partially secured (%) 1. 0 - 1. 6 15. 2 4. 6Unsecured (%) - 87. 0 - 38. 3 12. 5
(1) As at 30 June 2019, total exposures in ECL Stage 3 were $5,809 million. 65% of these exposures were secured, 20% partially secured and 15% unsecured.
Bank30 Jun 18
Home Other Asset CommercialLoans Personal Financing and Industrial Total
Maximum exposure ($M) 444,583 23,633 8,531 184,120 660,867Collateral classification:Secured (%) 99. 1 13. 4 99. 2 40. 7 79. 6Partially secured (%) 0. 9 - 0. 8 14. 7 4. 8Unsecured (%) - 86. 6 - 44. 6 15. 6
For the purposes of the collateral classification above, home loans are classified as secured unless they are impaired in which case they are classified as partially secured. For other types of credit exposures, a facility is determined to be secured where its ratio of exposure to the estimated value of collateral (adjusted for lending margins) is less than or equal to 100%. A facility is deemed to be partly secured when this ratio exceeds 100% but not more than 250%, and unsecured when either no security is held (e.g. can include credit cards, personal loans, small business loans, and exposures to highly rated corporate entities), or where the secured loan to estimated value of collateral exceeds 250%.
Home loans
Home loans are generally secured by fixed charges over borrowers’ residential properties. In limited circumstances, collateral in the form of cash or commercial property may be provided in addition to residential properties. Further, with the exception of some relatively small portfolios, for loans with a Loan to Valuation Ratio (LVR) of higher than 80% either a Low Deposit Premium or margin is levied, or Lenders Mortgage Insurance (LMI) is taken out to cover the difference between the principal plus interest owing and the net amount received from selling the collateral post default.
224 Commonwealth Bank of Australia Annual Report 2019

Collateral held against loans, bills discounted and other receivables (continued)
Personal lending
Personal lending (such as credit cards and personal loans) are predominantly unsecured, whilst margin lending is secured.
Asset finance
The Group leases assets to corporate and retail clients. When the title to the underlying assets is held by the Group as collateral, the balance is deemed fully secured. In other instances, a client’s facilities may be secured by collateral valued at less than the carrying amount of the credit exposure. These facilities are deemed partly secured or unsecured.
Other commercial and industrial lending
The Group’s main collateral types for other commercial and industrial lending consists of secured rights over specified assets of the borrower in the form of: commercial property; land rights; cash (usually in the form of a charge over a deposit); guarantees by company Directors; a charge over a company’s assets (including debtors, inventory and work in progress); or a charge over shares. In other instances, a client’s facilities may be secured by collateral with value less than the carrying amount of the credit exposure. These facilities are deemed partly secured or unsecured.
225

Strategic Financial Risk Corporate Directors’ Financial Other report performance management governance report report information
Notes to the financial statements
Market risk measurement The Group uses Value-at-Risk (VaR) as one of the measures of Traded and Non-traded market risk. VaR measures potential loss using historically observed market movements and correlation between different markets.
VaR is modelled at a 97.5% confidence level. This means that there is a 97.5% probability that the loss will not exceed the VaR estimate on any given day.
The VaR measured for Traded market risk uses two years of daily movement in market rates. The VaR measure for Non-traded Banking Book market risk uses six years of daily movement in market rates. The VaR measure for the insurance business is a forward-looking measure based on ten thousand simulations, which are calibrated to current market conditions and past price movements.
A 1-day holding period is used for trading book positions. A 20- day holding period is used for Interest Rate Risk in the Banking Book, insurance business market risk and Non-traded equity risk.
VaR is driven by historical observations and is not an estimate of the maximum loss that the Group could experience from an extreme market event. As a result of this limitation, management also uses stress testing to measure the potential for economic loss at confidence levels significantly higher than 97.5%. Management then uses these results in decisions to manage the economic impact of market risk positions.
Average As at Average As atTotal Market Risk June June June JuneVaR (1-day 97.5% 2019 (1) 2019 2018 (1) 2018confidence) $M $M $M $MTraded Market Risk 9. 9 9. 5 11. 1 13. 3Non-Traded Interest Rate Risk (2) 36. 7 36. 3 43. 1 37. 6
Non-Traded Equity Risk (2) 4. 9 5. 0 5. 3 4. 7
Non-Traded Insurance Market Risk (2) 5. 1 5. 6 5. 4 5. 6
(1) Average VaR calculated for each 12 month period. (2) The risk of these exposures has been represented in this table using a one
day holding period. In practice however, these ‘non-traded’ exposures are managed to a longer holding period.
Traded market risk
Traded market risk is generated through the Group’s participation in financial markets to service its customers. The Group trades and distributes interest rate, foreign exchange, debt, equity and commodity products, and provides treasury, capital markets and risk management services to its customers globally.
The Group maintains access to markets by quoting bid and offer prices with other market makers and carries an inventory of treasury, capital market and risk management instruments, including a broad range of securities and derivatives.
Average As at Average As atTraded Market Risk June June June JuneVaR (1-day 97.5% 2019 (1) 2019 2018 (1) 2018confidence) $M $M $M $MInterest rate risk 7. 6 9. 0 8. 4 12. 5Foreign exchange risk 1. 9 3. 6 2. 2 2. 7
Equities risk 0. 1 0. 1 0. 2 0. 1
Commodities risk 3. 1 3. 3 3. 2 3. 6
Credit spread risk 1. 7 1. 3 2. 0 1. 4Diversification benefit (6. 9) (10. 0) (7. 7) (9. 4)
Total general market risk 7. 5 7. 3 8. 3 10. 9
Undiversified risk 2. 2 2. 1 2. 5 2. 3
ASB Bank 0. 2 0. 1 0. 3 0. 1
Total 9. 9 9. 5 11. 1 13. 3
(1) Average VaR calculated for each 12 month period.
Non-traded market risk
Interest rate risk in the banking book
Interest rate risk is the current and prospective impact to the Group’s financial condition due to adverse changes in interest rates to which the Group’s Balance Sheet is exposed. The maturity transformation activities of the Group create mismatches in the repricing terms of assets and liabilities positions. These mismatches may have undesired earnings and value outcomes depending on the interest rate movements. The Group’s objective is to manage interest rate risk to achieve stable and sustainable net interest income in the long-term.
The Group measures and manages the impact of interest rate risk in two ways:
(a) Next 12 months’ earnings
Interest rate risk from an earnings perspective is the impact based on changes to the net interest income over the next 12 months.
The risk to net interest income over the next 12 months from changes in interest rates is measured on a monthly basis.
Earnings risk is measured through sensitivity analysis, which applies an instantaneous 100 basis point parallel shock in interest rates across the yield curve.
The prospective change to the net interest income is measured by using an Asset and Liability Management simulation model which incorporates both existing and anticipated new business in its assessment. The change in the Balance Sheet product mix, growth, funding and pricing strategies is incorporated.
Assets and liabilities that reprice directly from observable market rates are measured based on the full extent of the rate shock that is applied.
226 Commonwealth Bank of Australia Annual Report 2019

Non-Traded Market Risk (continued)
Interest rate risk in the banking book (continued) Products that are priced based on Group administered or discretionary interest rates and that are impacted by customer behaviour are measured by taking into consideration the historic repricing strategy of the Group and repricing behaviours of customers. In addition to considering how the products have been repriced in the past the expected change in price based on both the current and anticipated competitive market forces are also considered in the sensitivity analysis.
The figures in the following table represent the potential unfavourable change to the Group’s net interest earnings during the year based on a 100 basis point parallel rate shock.
June JuneNet Interest 2019 (1) 2018Earnings at Risk $M $MAverage monthly exposure AUD 421. 9 229. 2
NZD (2) 8. 0 23. 3
High monthly exposure AUD 558. 0 311. 5
NZD (2) 15. 5 44. 3
Low monthly exposure AUD 217. 8 120. 2
NZD (2) 1. 1 4. 3
As at balance date AUD 450. 3 231. 4
NZD (2) 8. 3 10. 5
(1) Exposures over a 12 month period. NZD exposures are presented in NZD. (2) Net interest earnings at risk for NZD decreased during the period due to an
update to products classified as sensitive to interest rate changes.
(b) Economic value
Interest rate risk from the economic value perspective is based on a 20-day 97.5% VaR measure.
Measuring the change in the economic value of equity is an assessment of the long-term impact to the earnings potential of the Group present valued to the current date. The Group assesses the potential change in its economic value of equity through the application of the VaR methodology.
A 20-day 97.5% VaR measure is used to capture the net economic value impact over the long-term or total life of all Balance Sheet assets and liabilities to adverse changes in interest rates.
The impact of customer prepayments on the contractual cash flows for fixed rate products is included in the calculation. Cash flows for discretionary priced products are behaviourally adjusted and repriced at the resultant profile.
The figures in the following table represent the net present value of the expected change in the Group’s future earnings in all future periods for the remaining term of all existing assets and liabilities.
Non-traded equity risk
The Group retains Non-Traded equity risk primarily through business activities in Wealth Management.
A 20-day, 97.5% confidence VaR is used to measure the economic impact of adverse changes in value.
As at As atJune June
Non-Traded Equity VaR 2019 2018(20 day 97.5% confidence) $M $MVaR 22. 4 21. 2
Market risk in insurance businesses
There are two main sources of market risk in the life insurance businesses: (i) market risk arising from guarantees made to policyholders; and (ii) market risk arising from the investment of Shareholders’ capital.
Guarantees (to policyholders) All financial assets within the life Insurance Statutory Funds directly support either the Group's life insurance or life investment contracts. Market risk arises for the Group on contracts where the liabilities to policyholders are guaranteed by the Group. The Group manages this risk by having an asset and liability management framework which includes the use of hedging instruments. The Group also monitors the risk on a monthly basis.
Shareholders’ capital A portion of financial assets held within the Insurance business, both within the Statutory Funds and in the Shareholder Funds of the life insurance company represents shareholder (Group) capital. Market risk also arises for the Group on the investment of this capital. Shareholders’ funds in the Australian life insurance businesses are invested 99% in income assets (cash and fixed interest) and 1% in growth assets as at 30 June 2019.
A 20-day 97.5% VaR measure is used to capture the Non-traded market risk exposures.
Average Average Non-Traded VaR in Australian June JuneLife Insurance Business (1) 2019 (2) 2018 (2)
(20 day 97.5% confidence) $M $M
Shareholder funds (3) 1. 1 1. 1
Guarantees (to Policyholders) (4) 22. 8 23. 6
(1) On 21 September 2017, the Group announced the sale of 100% of its Australian life insurance business (CommInsure Life) to AIA. CommInsure Life is presented as a discontinued operation with assets and liabilities reclassified as held for sale as at 30 June 2019 and 30 June 2018. For further details, see Note 11.3.
(2) Average VaR calculated for each 12 month period. (3) VaR in relation to the investment of shareholder funds. (4) VaR in relation to product portfolios where the Group has guaranteed
liabilities to policyholders.
Average Average June June
Non-Traded Interest Rate VaR 2019 (1) 2018 (1)
(20 day 97.5% confidence) (2) $M $MAUD Interest rate risk 164. 1 192. 9NZD Interest rate risk (3) 2. 2 3. 3
(1) Average VaR calculated for each 12 month period. (2) VaR is only for entities that have material risk exposure. (3) ASB data (expressed in NZD) is for the month-end date.
227

Strategic Financial Risk Corporate Directors’ Financial Other report performance management governance report report information
Notes to the financial statements
Structural foreign exchange risk
Structural foreign exchange risk is the risk that movements in foreign exchange rates may have an adverse effect on the Group’s Australian dollar earnings and economic value when the Group’s foreign currency denominated earnings and capital are translated into Australian dollars. The Group’s only material exposure to this risk arises from its New Zealand banking and insurance, Asian and US operations.
Lease residual value risk
The Group takes lease residual value risk on assets such as industrial, mining, rail, aircraft, marine, technology, healthcare and other equipment. A lease residual value guarantee exposes the Group to the movement in second-hand prices of these assets.
Commonwealth Bank Group Super Fund
The Commonwealth Bank Group Super Fund (the Fund) has a defined benefit portion that creates market risk for the Group.
Risk Management and Human Resources provide oversight of the market risks of the Fund held and managed on behalf of the employees receiving defined benefit pension funds on behalf of the Group (refer to Note 10.2).
Overview
The Group’s liquidity and funding policies are designed to ensure it will meet its obligations as and when they fall due by ensuring it is able to borrow funds on an unsecured basis, has sufficient liquid assets to borrow against on a secured basis, or sell to raise immediate funds without adversely affecting the Group’s net asset value.
The Group’s liquidity policies are designed to ensure it maintains sufficient cash balances and liquid asset holdings to meet its obligations to customers, in both ordinary market conditions and during periods of extreme stress. These policies are intended to protect the value of the Group’s operations during periods of unfavourable market conditions.
The Group’s funding policies are designed to achieve diversified sources of funding by product, term, maturity date, investor type, investor location, currency and concentration, on a cost effective basis. This objective applies to the Group’s wholesale and retail funding activities.
Liquidity and funding risk management framework
The CBA Board is ultimately responsible for the sound and prudent management of liquidity risk across the Group. The Group’s liquidity and funding policies, structured under a formal Group Liquidity and Funding Risk Management Framework, are approved by the Board and agreed with APRA. The Group has an Asset and Liability Committee (ALCO) the charter of which includes reviewing the management of assets and liabilities, reviewing liquidity and funding policies and strategies, as well as regularly monitoring compliance with those policies across the Group. Group Treasury manages the Group’s liquidity and funding positions in accordance with the Group’s liquidity policies and has ultimate authority to execute liquidity decisions should the Group Contingent Funding Plan be activated. Group Risk Management provides oversight of the Group’s liquidity and funding risks and compliance with Group policies and manages the Group’s relationship with prudential regulators.
Subsidiaries within the Colonial Holding Company Group apply their own liquidity and funding strategies to address their specific needs. The Group’s New Zealand banking subsidiary, ASB Bank, manages its own domestic liquidity and funding needs in accordance with its own liquidity policies and the policies of the Group. ASB’s liquidity policy is also overseen by the Reserve Bank of New Zealand.
Liquidity and funding policies and management The Group’s liquidity and funding policies provide that:
An excess of liquid assets over the minimum prescribed under APRA’s Liquidity Coverage Ratio (LCR) requirement is maintained. Australian ADIs are required to meet a 100% LCR, calculated as the ratio of high quality liquid assets to 30 day net cash outflows projected under a prescribed stress scenario;
A surplus of stable funding from various sources, as measured by APRA’s Net Stable Funding Ratio (NSFR), is maintained. The NSFR is calculated by applying APRA prescribed factors to assets and liabilities to determine a ratio of required stable funding to available stable funding which must be greater than 100%;
Additional internal funding and liquidity metrics are also calculated and stress tests additional to the LCR are run;
Short and long-term wholesale funding limits are established, monitored and reviewed regularly;
The Group’s wholesale funding market capacity is regularly assessed and used as a factor in funding strategies;
Balance Sheet assets that cannot be liquidated quickly are funded with stable deposits or term borrowings that meet minimum maturity requirements with appropriate liquidity buffers;
Liquid assets are held in Australian dollar and foreign currency denominated securities in accordance with expected requirements;
The Group has three categories of liquid assets within its domestic liquid assets portfolio. The first includes cash, government and Australian semi-government securities. The second includes Negotiable Certificates of Deposit, bank bills, bank term securities, supranational bonds, Australian Residential Mortgage-backed Securities (RMBS) and securities that meet certain Reserve Bank of Australia (RBA) criteria for purchases under reverse repo. The final category is internal RMBS, being mortgages that have been securitised but retained by the Bank, that are repo-eligible with the RBA under stress; and
Offshore branches and subsidiaries adhere to liquidity policies and hold appropriate foreign currency liquid assets to meet required obligations.
228 Commonwealth Bank of Australia Annual Report 2019

Liquidity and funding policies and management (continued) The Group’s key funding tools include:
Its consumer retail funding base, which includes a wide range of retail transaction accounts, savings accounts and term deposits for individual consumers;
Its small business customer and institutional deposit base; and
Its wholesale international and domestic funding programs which include its Australian dollar Negotiable Certificates of Deposit; Australian dollar bank bills; Asian Transferable Certificates of Deposit program; Australian, U.S. and Euro Commercial Paper programs; US Extendible Notes programs; Australian dollar Domestic Debt Program; U.S.144a and 3a2 Medium-Term Note Programs; Euro Medium-Term Note Program; multi jurisdiction Covered Bond program; and its Medallion securitisation program.
The Group’s key liquidity tools include:
A regulatory liquidity management reporting system delivering granular customer and product type information to inform business decision making, product development and resulting in a greater awareness of the liquidity risk adjusted value of banking products;
A liquidity management model similar to a “maturity ladder” or “liquidity gap analysis”, that allows forecasting of liquidity needs on a daily basis;
An additional liquidity management model that implements the agreed prudential liquidity policies. This model is calibrated with a series of “stress” liquidity crisis scenarios, incorporating both systemic and idiosyncratic crisis assumptions, such that the Group will have sufficient liquid assets available to ensure it meets all of its obligations as and when they fall due;
Central bank repurchase agreement facilities including the RBA’s Committed Liquidity Facility that provide the Group with the ability to borrow funds on a secured basis, even when normal funding markets are unavailable; and
A robust Contingent Funding Plan that is regularly tested so that it can be activated in case of need due to a liquidity event.
229

Strategic Financial Risk Corporate Directors’ Financial Other report performance management governance report report information
Notes to the financial statements
Maturity analysis of monetary liabilities
Amounts shown in the tables below are based on contractual undiscounted cash flows for the remaining contractual maturities. Group
0 to 3 3 to 12 1 to 5 Over 5 NotMonths Months Years Years Specified Total
$M $M $M $M $M $MMonetary liabilitiesDeposits and other public borrowings (1) 524,555 105,532 6,903 676 - 637,666Payables due to other financial institutions 19,486 3,902 41 - - 23,429Liabilities at fair value through Income Statement 4,590 2,299 621 1,244 - 8,754Derivative financial instruments:
Held for trading 17,925 - - - - 17,925Held for hedging purposes (net-settled) 59 293 829 714 - 1,895Held for hedging purposes (gross-settled):
Outflows 2,391 14,346 35,918 26,791 - 79,446Inflows (2,264) (13,642) (34,332) (26,250) - (76,488)
Bank acceptances 32 - - - - 32Insurance policy liabilities - - - - - -Debt issues and loan capital 17,913 36,163 89,164 53,483 - 196,723Managed funds units on issue - - - - - -Other monetary liabilities 5,657 374 495 58 - 6,584Liabilities held for sale 561 169 956 491 13,052 15,229Total monetary liabilities 590,905 149,436 100,595 57,207 13,052 911,195
Guarantees (2) 6,506 - - - - 6,506Loan commitments (2) 162,202 - - - - 162,202Other commitments (2) 7,098 - - - - 7,098Total off Balance Sheet items 175,806 - - - - 175,806
Total monetary liabilities and off Balance Sheet items 766,711 149,436 100,595 57,207 13,052 1,087,001
Maturity Period as at 30 June 2019
Group (3)
0 to 3 3 to 12 1 to 5 Over 5 NotMonths Months Years Years Specified Total
$M $M $M $M $M $MMonetary liabilitiesDeposits and other public borrowings (1) 502,021 103,788 17,587 489 - 623,885Payables due to other financial institutions 18,064 2,827 - 44 - 20,935Liabilities at fair value through Income Statement 6,622 1,747 524 1,441 - 10,334Derivative financial instruments:
Held for trading 21,771 - - - - 21,771Held for hedging purposes (net-settled) 19 155 1,238 838 - 2,250Held for hedging purposes (gross-settled):
Outflows 644 13,185 34,427 20,938 - 69,194Inflows (614) (11,825) (32,652) (19,651) - (64,742)
Bank acceptances 331 48 - - - 379Insurance policy liabilities - - - - 451 451Debt issues and loan capital 18,597 43,784 96,080 46,296 - 204,757Managed funds units on issue - - - - - -Other monetary liabilities 6,582 903 96 23 - 7,604Liabilities held for sale 182 572 274 143 12,886 14,057Total monetary liabilities 574,219 155,184 117,574 50,561 13,337 910,875
Guarantees (2) 6,265 - - - - 6,265Loan commitments (2) 162,090 - - - - 162,090Other commitments (2) 6,841 - - - - 6,841Total off Balance Sheet items 175,196 - - - - 175,196
Total monetary liabilities and off Balance Sheet items 749,415 155,184 117,574 50,561 13,337 1,086,071
Maturity Period as at 30 June 2018
(1) Includes deposits that are contractually at call, customer savings and cheque accounts. These accounts provide a stable source of long-term funding. (2) All off Balance Sheet items are included in the 0 to 3 months maturity band to reflect their earliest possible maturity. (3) Comparative information has been restated to conform to presentation in the current year.
230 Commonwealth Bank of Australia Annual Report 2019
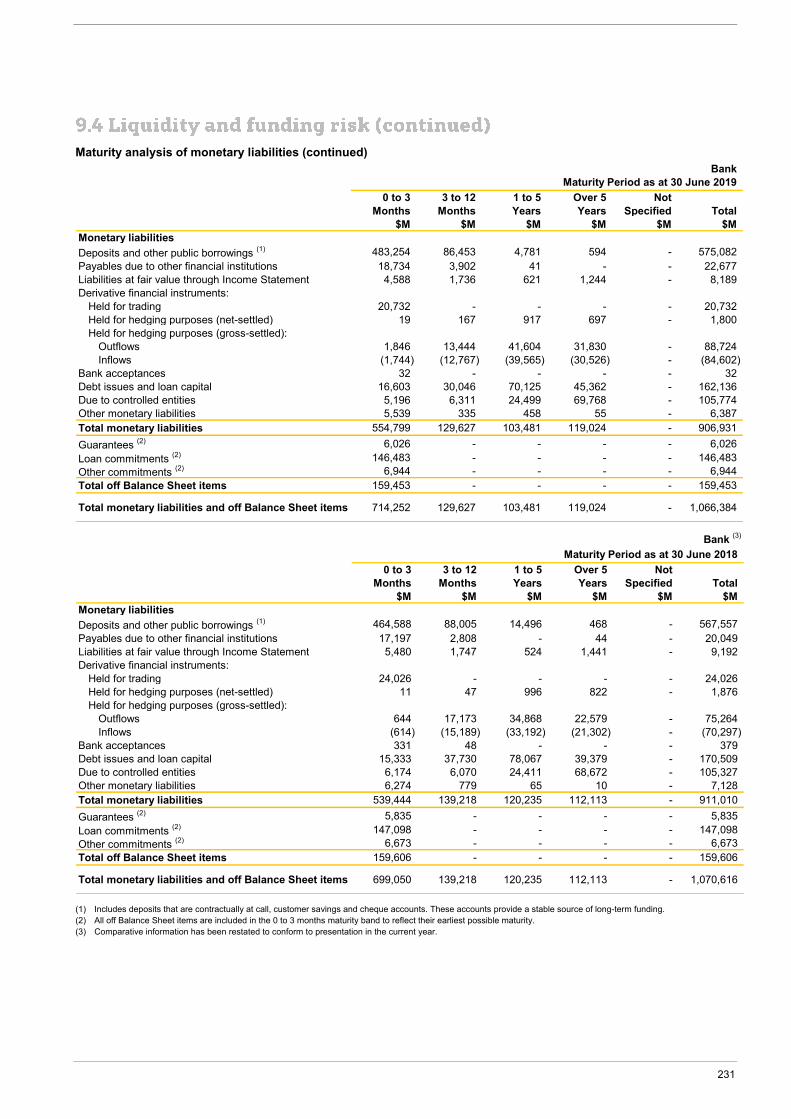
Maturity analysis of monetary liabilities (continued) Bank
0 to 3 3 to 12 1 to 5 Over 5 NotMonths Months Years Years Specified Total
$M $M $M $M $M $MMonetary liabilitiesDeposits and other public borrowings (1) 483,254 86,453 4,781 594 - 575,082Payables due to other financial institutions 18,734 3,902 41 - - 22,677Liabilities at fair value through Income Statement 4,588 1,736 621 1,244 - 8,189Derivative financial instruments:
Held for trading 20,732 - - - - 20,732Held for hedging purposes (net-settled) 19 167 917 697 - 1,800Held for hedging purposes (gross-settled):
Outflows 1,846 13,444 41,604 31,830 - 88,724Inflows (1,744) (12,767) (39,565) (30,526) - (84,602)
Bank acceptances 32 - - - - 32Debt issues and loan capital 16,603 30,046 70,125 45,362 - 162,136Due to controlled entities 5,196 6,311 24,499 69,768 - 105,774Other monetary liabilities 5,539 335 458 55 - 6,387Total monetary liabilities 554,799 129,627 103,481 119,024 - 906,931Guarantees (2) 6,026 - - - - 6,026Loan commitments (2) 146,483 - - - - 146,483Other commitments (2) 6,944 - - - - 6,944Total off Balance Sheet items 159,453 - - - - 159,453
Total monetary liabilities and off Balance Sheet items 714,252 129,627 103,481 119,024 - 1,066,384
Maturity Period as at 30 June 2019
Bank (3)
0 to 3 3 to 12 1 to 5 Over 5 NotMonths Months Years Years Specified Total
$M $M $M $M $M $MMonetary liabilitiesDeposits and other public borrowings (1) 464,588 88,005 14,496 468 - 567,557Payables due to other financial institutions 17,197 2,808 - 44 - 20,049Liabilities at fair value through Income Statement 5,480 1,747 524 1,441 - 9,192Derivative financial instruments:
Held for trading 24,026 - - - - 24,026Held for hedging purposes (net-settled) 11 47 996 822 - 1,876Held for hedging purposes (gross-settled):
Outflows 644 17,173 34,868 22,579 - 75,264Inflows (614) (15,189) (33,192) (21,302) - (70,297)
Bank acceptances 331 48 - - - 379Debt issues and loan capital 15,333 37,730 78,067 39,379 - 170,509Due to controlled entities 6,174 6,070 24,411 68,672 - 105,327Other monetary liabilities 6,274 779 65 10 - 7,128Total monetary liabilities 539,444 139,218 120,235 112,113 - 911,010Guarantees (2) 5,835 - - - - 5,835Loan commitments (2) 147,098 - - - - 147,098Other commitments (2) 6,673 - - - - 6,673Total off Balance Sheet items 159,606 - - - - 159,606
Total monetary liabilities and off Balance Sheet items 699,050 139,218 120,235 112,113 - 1,070,616
Maturity Period as at 30 June 2018
(1) Includes deposits that are contractually at call, customer savings and cheque accounts. These accounts provide a stable source of long-term funding. (2) All off Balance Sheet items are included in the 0 to 3 months maturity band to reflect their earliest possible maturity. (3) Comparative information has been restated to conform to presentation in the current year.
231

Strategic Financial Risk Corporate Directors’ Financial Other report performance management governance report report information
Notes to the financial statements
Fair value hierarchy for financial assets and liabilities measured at fair value
The classification in the fair value hierarchy of the Group’s and the Bank’s financial assets and liabilities measured at fair value is presented in the tables below. An explanation of how fair values are calculated and the levels in the fair value hierarchy are included in the accounting policy within this note.
Group
Level 1 Level 2 Level 3 Total Level 1 Level 2 Level 3 Total$M $M $M $M $M $M $M $M
Financial assets measured at fair value on a recurring basisAssets at fair value through Income Statement:
Trading 24,599 7,907 - 32,506 22,078 10,176 - 32,254
Insurance (1) - - - - - 372 - 372
Other 319 852 - 1,171 49 209 - 258
Derivative assets 59 25,072 84 25,215 42 31,998 93 32,133Investment securities at fair value through Other Comprehensive Income 77,193 1,666 53 78,912 - - - -
Available-for-sale investments - - - - 74,234 7,941 65 82,240
Bills discounted - - - - 4,280 - - 4,280
Assets held for sale (1) 934 7,631 2,339 10,904 2,012 8,061 1,818 11,891Total financial assets measured at fair value 103,104 43,128 2,476 148,708 102,695 58,757 1,976 163,428
Financial liabilities measured at fair value on a recurring basisLiabilities at fair value through Income Statement 1,583 6,937 - 8,520 1,724 8,523 - 10,247
Derivative liabilities 132 22,579 66 22,777 57 28,075 340 28,472
Life investment contracts (1) - - - - - 337 - 337
Liabilities held for sale (1) 3 6,325 496 6,824 5 6,985 353 7,343Total financial liabilities measured at fair value 1,718 35,841 562 38,121 1,786 43,920 693 46,399
Fair Value as at 30 June 2018Fair Value as at 30 June 2019
(1) As at 30 June 2019, assets and liabilities of CommInsure Life, CFSGAM, PT Commonwealth Life, Count Financial and the Group’s investment in BoCommLife are presented as held for sale. As at 30 June 2018, assets and liabilities of CommInsure Life, Sovereign and the Group’s investment in BoCommLife are presented as held for sale.
232 Commonwealth Bank of Australia Annual Report 2019

Fair value hierarchy for financial assets and liabilities measured at fair value (continued)
Bank
Level 1 Level 2 Level 3 Total Level 1 Level 2 Level 3 Total$M $M $M $M $M $M $M $M
Financial assets measured at fair value on a recurring basisAssets at fair value through Income Statement:
Trading 24,569 7,907 - 32,476 20,813 9,180 - 29,993
Other - 652 - 652 - - - -
Derivative assets 56 24,171 84 24,311 41 30,751 93 30,885Investment securities at fair value through Other Comprehensive Income 72,479 680 53 73,212 - - - -
Available-for-sale investments - - - - 69,988 7,678 65 77,731
Bills discounted - - - - 4,280 - - 4,280Total financial assets measured at fair value 97,104 33,410 137 130,651 95,122 47,609 158 142,889
Financial liabilities measured at fair value on a recurring basisLiabilities at fair value through Income Statement 1,583 6,378 - 7,961 1,724 7,382 - 9,106
Derivative liabilities 132 26,456 66 26,654 57 30,474 340 30,871Total financial liabilities measured at fair value 1,715 32,834 66 34,615 1,781 37,856 340 39,977
Fair Value as at 30 June 2019 Fair Value as at 30 June 2018
233

Strategic Financial Risk Corporate Directors’ Financial Other report performance management governance report report information
Notes to the financial statements
Analysis of movements between fair value hierarchy levels
During the year ended 30 June 2018, $1,722 million of trading securities were reclassified from Level 2 to Level 1 due to changes in the observability of inputs. The tables below summarise movements in Level 3 balance during the year. Transfers have been reflected as if they had taken place at the end of the reporting periods. Transfers in and out of Level 3 were due to changes in the observability of inputs.
Level 3 movement analysis for the year ended 30 June 2019
Group
InvestmentSecurities at Available Assets Life Liabilities
Insurance Derivative Fair Value for Sale held for Derivative Investment held for Assets Assets through OCI Investments Sale (1) Liabilities Contracts Sale (1)
$M $M $M $M $M $M $M $M
As at 1 July 2017 1,530 67 - 139 - (102) (565) -
Purchases 618 - - - - - - -
Sales/(settlements) (2) (208) (18) - (100) - 14 212 -
Gains/(losses) in the year:Recognised in the Income Statement (122) (15) - - - (144) - -
Recognised in the Statement of Comprehensive Income - - - - - - - -
Transfers in - 59 - 26 1,818 (108) - (353)Transfers out (1,818) - - - - - 353 -
As at 30 June 2018 - 93 - 65 1,818 (340) - (353)
Gains/(losses) recognised in the Income Statement for financial instruments held as at 30 June 2018
(103) (15) - - - (144) - -
As at 1 July 2018 - 93 - 65 1,818 (340) - (353)Changes on adoption of new accounting standard (3) - - 65 (65) - - - -
Purchases - 15 - - 499 - - -Sales/(settlements) - - (8) - - - - -Gains/(losses) in the year:
Recognised in the Income Statement - (5) - - 22 198 - -
Recognised in the Statement of Comprehensive Income - - (4) - - - - -
Transfers in - - - - - - - (143)Transfers out - (19) - - - 76 - -
As at 30 June 2019 - 84 53 - 2,339 (66) - (496)
Gains/(losses) recognised in the Income Statement for financial instruments held as at 30 June 2019
- 22 - - 22 175 - -
Financial LiabilitiesFinancial Assets
(1) As at 30 June 2019, assets and liabilities of CommInsure Life, CFSGAM, PT Commonwealth Life, Count Financial and the Group’s investment in BoCommLife are presented as held for sale. As at 30 June 2018, assets and liabilities of CommInsure Life, Sovereign and the Group’s investment in BoCommLife were presented as held for sale.
(2) Sales/ settlements includes the impact of changing fund ownership percentage held via the Group’s life insurance operations. (3) Current year balances reflect the adoption of AASB 9 ‘Financial Instruments’ on 1 July 2018. As permitted by AASB 9 comparative information has not been restated.
For details on the adoption of AASB 9 refer to Note 1.1. Level 3 available-for-sale securities were reclassified to Investment securities measured at fair value through other comprehensive income on adoption of AASB 9 on 1 July 2018.
234 Commonwealth Bank of Australia Annual Report 2019

Analysis of movements between fair value hierarchy levels (continued)
Level 3 movement analysis for the year ended 30 June 2019 (continued) The valuation of insurance assets directly impacts the life investment contracts they are backing. The Group’s exposure to other financial instruments measured at fair value based in full or in part or non-market observable inputs is restricted to a small number of financial instruments, which comprise an insignificant component of the portfolios to which they belong. As such, changes in fair value assumptions on all these instruments due to size or backing by policy holder funds generally have minimal impact on the Group’s Income Statement and Shareholders’ Equity.
Bank Financial
Liabilities Investment
Securities at AvailableDerivative Fair Value for Sale Derivative
Assets through OCI Investments Liabilities$M $M $M $M
As at 1 July 2017 67 - 139 (103)
Purchases - - - -
Sales/(settlements) (18) - (100) 15
Gains/(losses) in the period:
Recognised in the Income Statement (15) - - (144)
Recognised in the Statement of Comprehensive Income - - - -
Transfers in 59 - 26 (108)
Transfers out - - - -
As at 30 June 2018 93 - 65 (340)
(15) - - (144)
As at 1 July 2018 93 - 65 (340)
Changes on adoption of new accounting standard (1) - 65 (65) -
Purchases 15 - - -
Sales/(settlements) - (8) - -
Gains/(losses) in the period:
Recognised in the Income Statement (5) - - 198
Recognised in the Statement of Comprehensive Income - (4) - -
Transfers in - - - -
Transfers out (19) - - 76
As at 30 June 2019 84 53 - (66)
22 - - 175
Gains/(losses) recognised in the Income Statement for financial instruments held as at 30 June 2018
Gains/(losses) recognised in the Income Statement for financial instruments held as at 30 June 2019
Financial Assets
(1) Current year balances reflect the adoption of AASB 9 ‘Financial Instruments’ on 1 July 2018. As permitted by AASB 9 comparative information has not been restated. For details on the adoption of AASB 9 refer to Note 1.1. Level 3 available-for-sale securities were reclassified to Investment securities measured at fair value through other comprehensive income on adoption of AASB 9 on 1 July 2018.
235

Strategic Financial Risk Corporate Directors’ Financial Other report performance management governance report report information
Notes to the financial statements
Fair value information for financial instruments not measured at fair value
The estimated fair values and fair value hierarchy of the Group’s and the Bank’s financial instruments not measured at fair value are presented below:
CarryingvalueTotal Level 1 Level 2 Level 3 Total
$M $M $M $M $MFinancial assets not measured at fair value on a recurring basisCash and liquid assets 29,387 16,655 12,732 - 29,387Receivables due from other financial institutions 8,093 - 8,093 - 8,093Investment securities at amortised cost 7,355 - 7,330 15 7,345Loans and other receivables 755,141 - - 755,515 755,515Bank acceptances of customers 32 32 - - 32Other assets 5,431 1,893 3,532 6 5,431Assets held for sale 699 354 326 19 699Total financial assets 806,138 18,934 32,013 755,555 806,502Financial liabilities not measured at fair value on a recurring basisDeposits and other public borrowings 636,040 - 636,465 18 636,483Payables due to other financial institutions 23,370 - 23,370 - 23,370Bank acceptances 32 32 - - 32Debt issues 163,990 - 164,295 - 164,295Bills payable and other liabilities 8,236 2,414 5,822 - 8,236Loan capital 22,966 9,477 14,168 - 23,645Liabilities held for sale 3,963 - 1,831 2,132 3,963Total financial liabilities 858,597 11,923 845,951 2,150 860,024Financial guarantees, loan commitments and other off Balance Sheet instruments 171,084 - - 171,084 171,084
30 Jun 19
Fair value
Group
236 Commonwealth Bank of Australia Annual Report 2019

Fair value information for financial instruments not measured at fair value (continued)
Carryingvalue Fair valueTotal Level 1 Level 2 Level 3 Total
$M $M $M $M $MFinancial assets not measured at fair value on a recurring basis
Cash and liquid assets 36,417 22,896 13,521 - 36,417
Receivables due from other financial institutions 9,222 - 9,222 - 9,222Loans and other receivables 739,085 - - 739,545 739,545Bank acceptances of customers 379 379 - - 379Other assets 5,455 1,823 3,630 2 5,455Assets held for sale 192 107 85 - 192Total financial assets 790,750 25,205 26,458 739,547 791,210Financial liabilities not measured at fair value on a recurring basisDeposits and other public borrowings 622,234 - 622,327 - 622,327
Payables due to other financial institutions 20,899 - 20,899 - 20,899Bank acceptances 379 379 - - 379Debt issues 172,294 - 173,895 - 173,895
Bills payable and other liabilities (1) 9,326 2,459 6,867 - 9,326Loan capital 22,992 9,566 14,131 - 23,697Liabilities held for sale 2,621 13 923 1,685 2,621Total financial liabilities 850,745 12,417 839,042 1,685 853,144Financial guarantees, loan commitments and other off Balance Sheet instruments 170,586 - - 170,586 170,586
30 Jun 18Group
(1) Comparative information has been restated to conform to presentation in the current year.
237

Strategic report
Financial performance
Risk management
Corporate governance
Directors’ report
Financial report
Other information
Notes to the financial statements
Fair value information for financial instruments not measured at fair value (continued) Bank
CarryingvalueTotal Level 1 Level 2 Level 3 Total
$M $M $M $M $M Financial assets not measured at fair value on a recurring basisCash and liquid assets 26,912 15,534 11,378 - 26,912Receivables due from other financial institutions 7,334 - 7,334 - 7,334Investment securities at amortised cost 7,349 - 7,340 9 7,349Loans and other receivables 660,476 - - 660,660 660,660Bank acceptances of customers 32 32 - - 32Loans to controlled entities 120,193 - - 113,029 113,029Other assets 4,158 1,324 2,829 5 4,158
Total financial assets 826,454 16,890 28,881 773,703 819,474Financial liabilities not measured at fair value on a recurring basisDeposits and other public borrowings 573,851 - 574,164 18 574,182Payables due to other financial institutions 22,618 - 22,618 - 22,618Bank acceptances 32 32 - - 32Due to controlled entities 105,774 - - 105,774 105,774Debt issues 131,062 - 132,071 - 132,071Bills payable and other liabilities 6,403 1,774 4,629 - 6,403Loan capital 22,569 9,483 13,764 - 23,247Total financial liabilities 862,309 11,289 747,246 105,792 864,327Financial guarantees, loan commitments and other off Balance Sheet instruments 154,731 - - 154,731 154,731
Fair value
30 Jun 19
238 Commonwealth Bank of Australia Annual Report 2019

Fair value information for financial instruments not measured at fair value (continued) Bank
Carryingvalue Fair valueTotal Level 1 Level 2 Level 3 Total
$M $M $M $M $M Financial assets not measured at fair value on a recurring basisCash and liquid assets 33,581 21,351 12,230 - 33,581Receivables due from other financial institutions 8,376 - 8,376 - 8,376Loans and other receivables 652,370 - - 652,794 652,794Bank acceptances of customers 379 379 - - 379Loans to controlled entities 106,431 - - 106,509 106,509Other assets 4,717 1,398 3,317 2 4,717Total financial assets 805,854 23,128 23,923 759,305 806,356Financial liabilities not measured at fair value on a recurring basisDeposits and other public borrowings 566,200 - 566,200 - 566,200Payables due to other financial institutions 20,014 - 20,014 - 20,014Bank acceptances 379 379 - - 379Due to controlled entities 105,327 - - 105,309 105,309Debt issues 139,984 - 142,064 - 142,064
Bills payable and other liabilities (1) 7,455 1,942 5,513 - 7,455Loan capital 22,249 9,561 13,373 - 22,934Total financial liabilities 861,608 11,882 747,164 105,309 864,355Financial guarantees, loan commitments and other off Balance Sheet instruments 155,012 - - 155,012 155,012
30 Jun 18
(1) Comparative information has been restated to conform to presentation in the current year.
239

Strategic report
Financial performance
Risk management
Corporate governance
Directors’ report
Financial report
Other information
Notes to the financial statements
Valuation
Fair value is the amount that would be received to sell an asset or paid to transfer a liability in an orderly transaction between market participants at the measurement date. On initial recognition, the transaction price generally represents the fair value of the financial instrument, unless there is observable information from an active market that provides a more appropriate fair value.
The fair value for financial instruments traded in active markets at the reporting date is based on their quoted market price or dealer price quotations, without any deduction for transaction costs. Assets and long positions are measured at a quoted bid price; liabilities and short positions are measured at a quoted asking price. Where the Group has positions with offsetting market risks, mid-market prices are used to measure the offsetting risk positions and a quoted bid or asking price adjustment is applied only to the net open position as appropriate.
Non-market quoted financial instruments are mostly valued using valuation techniques based on observable inputs except where observable market data is unavailable. Where market data is unavailable the financial instrument is initially recognised at the transaction price, which is generally the best indicator of fair value. This may differ from the value obtained from the valuation model. The timing of the recognition in the Income Statement of this initial difference in fair value depends on the individual facts and circumstances of each transaction, but is never later than when the market data becomes observable. The difference may be either amortised over the life of the transaction, recognised when the inputs become observable or on derecognition of the instrument, as appropriate.
The fair value of Over-the-Counter (OTC) derivatives includes credit valuation adjustments (CVA) for derivative assets to reflect the credit worthiness of the counterparty. Fair value of uncollateralised derivative assets and uncollateralised derivative liabilities incorporate funding valuation adjustments (FVA) to reflect funding costs and benefits to the Group. These adjustments are applied after considering any relevant collateral or master netting arrangements.
Fair value hierarchy
The Group utilises various valuation techniques and applies a hierarchy for valuation inputs that maximise the use of observable market data, if available.
Under AASB 13 ‘Fair Value Measurement’ all financial and non-financial assets and liabilities measured or disclosed at fair value are categorised into one of the following three fair value hierarchy levels:
Quoted Prices in Active Markets – Level 1
This category includes assets and liabilities for which the valuation is determined by reference to unadjusted quoted prices for identical assets or liabilities in active markets where the quoted price is readily available, and the price represents actual and regularly occurring market transactions on an arm’s length basis.
An active market is one in which transactions occur with sufficient volume and frequency to provide pricing information on an ongoing basis.
Financial instruments included in this category are liquid government bonds, financial institution and corporate bonds, certificates of deposit, bank bills, listed equities and exchange traded derivatives.
Valuation technique using observable inputs – Level 2
This category includes assets and liabilities that have been valued using inputs other than quoted prices as described for Level 1, but which are observable for the asset or liability, either directly or indirectly. The valuation techniques include the use of discounted cash flow analysis, option pricing models and other market accepted valuation models.
Financial instruments included in this category are commercial papers, mortgage-backed securities and OTC derivatives including interest rate swaps, cross currency swaps and FX options.
Valuation technique using significant unobservable inputs – Level 3
This category includes assets and liabilities where the valuation incorporates significant inputs that are not based on observable market data (unobservable inputs). Unobservable inputs are those not readily available in an active market due to market illiquidity or complexity of the product. These inputs are generally derived and extrapolated from observable inputs to match the risk profile of the financial instrument, and are calibrated against current market assumptions, historic transactions and economic models, where available. These inputs may include the timing and amount of future cash flows, rates of estimated credit losses, discount rates and volatility. Financial instruments included in this category for the Group and Bank are assets backing insurance liabilities held through infrastructure funds, certain exotic OTC derivatives and certain asset-backed securities valued using unobservable inputs.
240 Commonwealth Bank of Australia Annual Report 2019

Critical accounting judgements and estimates
Valuation techniques are used to estimate the fair value of securities. When using valuation techniques the Group makes maximum use of market inputs and relies as little as possible on entity specific inputs. It incorporates all factors that the Group believes market participants would consider in setting a price and is consistent with accepted economic methodologies for pricing financial instruments. Data inputs that the Group relies upon when valuing financial instruments relate to counterparty credit risk, volatility, correlation and extrapolation.
Periodically, the Group calibrates its valuation techniques and tests them for validity using prices from any observable current market transaction in the same instruments (i.e. without modification or repackaging) and any other available observable market data.
Collateral accepted as security for assets
The Group takes collateral where it is considered necessary to support both on and off Balance Sheet financial instruments. The Group evaluates each customer’s creditworthiness on a case-by-case basis. The amount of collateral taken, if deemed necessary, is based on management’s credit evaluation of the counterparty. The Group has the right to sell, re-pledge, or otherwise use some of the collateral received. At Balance Sheet date the carrying value of cash accepted as collateral (and recognised on the Group’s and the Bank’s Balance Sheets) and the fair value of securities accepted as collateral (but not recognised on the Group’s or the Bank’s Balance Sheets) were as follows:
Group Bank30 Jun 19 30 Jun 18 30 Jun 19 30 Jun 18
$M $M $M $MCash 6,147 6,884 5,568 6,155
Securities 12,732 13,520 11,379 12,230
Collateral held 18,879 20,404 16,947 18,385
Collateral held which is re-pledged or sold - - - -
Assets pledged
As part of standard terms of transactions with other banks, the Group has provided collateral to secure liabilities. At Balance Sheet date, the carrying value of assets pledged as collateral to secure liabilities were as follows:
Group Bank30 Jun 19 30 Jun 18 30 Jun 19 30 Jun 18
$M $M $M $MCash 5,837 6,064 5,781 5,679
Securities (1) 21,022 15,495 21,138 15,604
Assets pledged 26,859 21,559 26,919 21,283
Asset pledged which can be re-pledged or re-sold by counterparty 21,022 15,495 21,138 15,604
(1) These balances include assets sold under repurchase agreements. The liabilities related to these repurchase agreements are disclosed in Note 4.1.
The Group and the Bank have pledged collateral as part of entering into repurchase and derivative agreements. These transactions are governed by standard industry agreements.
241

The
tabl
e be
low
iden
tifie
s am
ount
s th
at h
ave
been
offs
et o
n th
e Ba
lanc
e Sh
eet a
nd a
mou
nts
cove
red
by e
nfor
ceab
le n
ettin
g ar
rang
emen
ts o
r sim
ilar a
gree
men
ts th
at d
o no
t qua
lify
for s
et o
ff.
Cas
h se
ttled
der
ivat
ives
that
trad
e on
an
exch
ange
are
dee
med
to b
e ec
onom
ical
ly s
ettle
d an
d th
eref
ore
outs
ide
the
scop
e of
thes
e di
sclo
sure
s.
Gro
up
Gro
ss B
alan
ceAm
ount
Repo
rted
on th
eFi
nanc
ial
Fina
ncia
l Col
late
ral
Not s
ubje
ct to
Tota
l Bal
ance
Shee
t Am
ount
offs
et (1
)Ba
lanc
e Sh
eet
Inst
rum
ents
(2)
(Rec
eive
d)/P
ledg
ed (2
)Ne
t Am
ount
Net
ting
Agre
emen
tsSh
eet a
mou
ntFi
nanc
ial I
nstru
men
ts$M
$M$M
$M$M
$M$M
$MDe
rivat
ive a
sset
s40
,913
(17,
801)
23,1
12(1
4,31
8)(5
,095
)3,
699
2,10
325
,215
Secu
ritie
s pu
rcha
sed
unde
r ag
reem
ents
to re
sell
12,7
32-
12,7
32(5
65)
(12,
146)
21-
12,7
32
Equi
ty s
ecur
ities
sold
not
de
liver
ed
661
(313
)34
8-
-34
8-
348
Tota
l fin
anci
al a
sset
s54
,306
(18,
114)
36,1
92(1
4,88
3)(1
7,24
1)4,
068
2,10
338
,295
Deriv
ative
liabi
lities
(42,
756)
20,7
27(2
2,02
9)14
,318
4,08
6(3
,625
)(7
48)
(22,
777)
Secu
ritie
s so
ld u
nder
ag
reem
ents
to re
purc
hase
(19,
099)
-(1
9,09
9)56
518
,534
--
(19,
099)
Equi
ty s
ecur
ities
purc
hase
d no
t del
ivere
d (8
21)
313
(508
)-
-(5
08)
-(5
08)
Tota
l fin
anci
al li
abili
ties
(62,
676)
21,0
40(4
1,63
6)14
,883
22,6
20(4
,133
)(7
48)
(42,
384)
Amou
nts
offs
et o
n th
e Ba
lanc
e Sh
eet
Amou
nts
not o
ffset
on
the
Bala
nce
Shee
tSu
bjec
t to
Enfo
rcea
ble
Mas
ter N
ettin
g or
Sim
ilar A
gree
men
ts30
Jun
19
(1)
The
net o
ffset
bal
ance
of $
2,92
6 m
illion
rela
tes
to v
aria
tion
mar
gin
netti
ng re
flect
ed o
n ot
her B
alan
ce S
heet
line
s.
(2)
For t
he p
urpo
se o
f thi
s di
sclo
sure
, the
rela
ted
amou
nts
of fi
nanc
ial i
nstru
men
ts a
nd fi
nanc
ial c
olla
tera
l not
set
off
on th
e Ba
lanc
e Sh
eet h
ave
been
cap
ped
by re
leva
nt n
ettin
g ag
reem
ents
so
as n
ot to
exc
eed
the
net a
mou
nts
of fi
nanc
ial
asse
ts/(l
iabi
litie
s) re
porte
d on
the
Bala
nce
Shee
t, i.e
. ove
r col
late
ralis
atio
n, w
here
it e
xist
s, is
not
refle
cted
in th
e ta
bles
. As
a re
sult,
the
abov
e co
llate
ral b
alan
ces
will
not c
orre
spon
d to
the
tabl
es in
Not
e 9.
6.

Gro
up
Gro
ss B
alan
ceAm
ount
Re
porte
d on
the
Fina
ncia
lFi
nanc
ial C
olla
tera
lNo
t sub
ject
toTo
tal B
alan
ceSh
eet A
mou
ntof
fset
(1)
Bala
nce
Shee
tIn
stru
men
ts (2
)(R
ecei
ved)
/Ple
dged
(2)
Net A
mou
nt N
ettin
g Ag
reem
ents
Shee
t am
ount
Fina
ncia
l Ins
trum
ents
$M$M
$M$M
$M$M
$M$M
Deriv
ative
ass
ets
36,9
23(6
,794
)30
,129
(19,
344)
(6,7
70)
4,01
52,
004
32,1
33Se
curit
ies
purc
hase
d un
der
agre
emen
ts to
rese
ll13
,520
-13
,520
(765
)(1
2,75
5)-
-13
,520
Equi
ty s
ecur
ities
sold
not
de
liver
ed
516
(230
)28
6-
-28
6-
286
Tota
l fin
anci
al a
sset
s50
,959
(7,0
24)
43,9
35(2
0,10
9)(1
9,52
5)4,
301
2,00
445
,939
Deriv
ative
liabi
lities
(37,
466)
10,1
49(2
7,31
7)19
,344
4,56
7(3
,406
)(1
,155
)(2
8,47
2)Se
curit
ies
sold
und
er
agre
emen
ts to
repu
rcha
se(1
4,69
6)-
(14,
696)
765
13,9
31-
-(1
4,69
6)
Equi
ty s
ecur
ities
purc
hase
d no
t del
ivere
d (6
56)
230
(426
)-
-(4
26)
-(4
26)
Tota
l fin
anci
al li
abili
ties
(52,
818)
10,3
79(4
2,43
9)20
,109
18,4
98(3
,832
)(1
,155
)(4
3,59
4)
Amou
nts
not o
ffset
on
the
Bala
nce
Shee
tAm
ount
s of
fset
on
the
Bala
nce
Shee
tSu
bjec
t to
Enfo
rcea
ble
Mas
ter N
ettin
g or
Sim
ilar A
gree
men
ts30
Jun
18
(1)
The
net o
ffset
bal
ance
of $
3,35
5 m
illion
rela
tes
to v
aria
tion
mar
gin
netti
ng re
flect
ed o
n ot
her B
alan
ce S
heet
line
s.
(2)
For t
he p
urpo
se o
f thi
s di
sclo
sure
, the
rela
ted
amou
nts
of fi
nanc
ial i
nstru
men
ts a
nd fi
nanc
ial c
olla
tera
l not
set
off
on th
e Ba
lanc
e Sh
eet h
ave
been
cap
ped
by re
leva
nt n
ettin
g ag
reem
ents
so
as n
ot to
exc
eed
the
net a
mou
nts
of fi
nanc
ial
asse
ts/(l
iabi
litie
s) re
porte
d on
the
Bala
nce
Shee
t, i.e
. ove
r col
late
ralis
atio
n, w
here
it e
xist
s, is
not
refle
cted
in th
e ta
bles
. As
a re
sult
the
abov
e co
llate
ral b
alan
ces
will
not c
orre
spon
d to
the
tabl
es in
Not
e 9.
6.

Bank
Gro
ss B
alan
ceAm
ount
Repo
rted
on th
e Fi
nanc
ial
Fina
ncia
l Col
late
ral
Not s
ubje
ct to
Tota
l Bal
ance
Shee
t Am
ount
offs
et (1
)Ba
lanc
e Sh
eet
Inst
rum
ents
(2)
(Rec
eive
d)/P
ledg
ed (2
)Ne
t Am
ount
Net
ting
Agre
emen
tsSh
eet a
mou
ntFi
nanc
ial I
nstru
men
ts$M
$M$M
$M$M
$M$M
$MDe
rivat
ive a
sset
s39
,487
(17,
273)
22,2
14(1
4,06
5)(4
,697
)3,
452
2,09
724
,311
Secu
ritie
s pu
rcha
sed
unde
r ag
reem
ents
to re
sell
11,3
78-
11,3
78(5
73)
(10,
784)
21-
11,3
78
Tota
l fin
anci
al a
sset
s50
,865
(17,
273)
33,5
92(1
4,63
8)(1
5,48
1)3,
473
2,09
735
,689
Deriv
ative
liabi
lities
(45,
839)
19,9
44(2
5,89
5)14
,065
4,03
9(7
,791
)(7
59)
(26,
654)
Secu
ritie
s so
ld u
nder
ag
reem
ents
to re
purc
hase
(19,
215)
-(1
9,21
5)57
318
,642
--
(19,
215)
Tota
l fin
anci
al li
abili
ties
(65,
054)
19,9
44(4
5,11
0)14
,638
22,6
81(7
,791
)(7
59)
(45,
869)
Amou
nts
offs
et o
n th
e Ba
lanc
e Sh
eet
Amou
nts
not o
ffset
on
the
Bala
nce
Shee
tSu
bjec
t to
Enfo
rcea
ble
Mas
ter N
ettin
g or
Sim
ilar A
gree
men
ts30
Jun
19
(1)
The
net o
ffset
bal
ance
of $
2,67
1 m
illion
rela
tes
to v
aria
tion
mar
gin
netti
ng re
flect
ed o
n ot
her B
alan
ce S
heet
line
s.
(2)
For t
he p
urpo
se o
f thi
s di
sclo
sure
, the
rela
ted
amou
nts
of fi
nanc
ial i
nstru
men
ts a
nd fi
nanc
ial c
olla
tera
l not
set
off
on th
e Ba
lanc
e Sh
eet h
ave
been
cap
ped
by re
leva
nt n
ettin
g ag
reem
ents
so
as n
ot to
exc
eed
the
net a
mou
nts
of fi
nanc
ial
asse
ts/(l
iabi
litie
s) re
porte
d on
the
Bala
nce
Shee
t, i.e
. ove
r col
late
ralis
atio
n, w
here
it e
xist
s, is
not
refle
cted
in th
e ta
bles
. As
a re
sult
the
abov
e co
llate
ral b
alan
ces
will
not c
orre
spon
d to
the
tabl
es in
Not
e 9.
6.

Bank
Gro
ss B
alan
ceAm
ount
Repo
rted
on th
e Fi
nanc
ial
Fina
ncia
l Col
late
ral
Not s
ubje
ct to
Tota
l Bal
ance
Shee
t Am
ount
offs
et (1
)Ba
lanc
e Sh
eet
Inst
rum
ents
(2)
(Rec
eive
d)/P
ledg
ed (2
)Ne
t Am
ount
Net
ting
Agre
emen
tsSh
eet a
mou
ntFi
nanc
ial I
nstru
men
ts$M
$M$M
$M$M
$M$M
$MDe
rivat
ive a
sset
s35
,483
(6,7
94)
28,6
89(1
8,88
7)(5
,955
)3,
847
2,19
630
,885
Secu
ritie
s pu
rcha
sed
unde
r ag
reem
ents
to re
sell
12,2
30-
12,2
30(7
65)
(11,
465)
--
12,2
30
Tota
l fin
anci
al a
sset
s47
,713
(6,7
94)
40,9
19(1
9,65
2)(1
7,42
0)3,
847
2,19
643
,115
Deriv
ative
liabi
lities
(39,
785)
10,1
49(2
9,63
6)18
,887
4,37
5(6
,374
)(1
,235
)(3
0,87
1)Se
curit
ies
sold
und
er
agre
emen
ts to
repu
rcha
se
(14,
806)
-(1
4,80
6)76
514
,041
--
(14,
806)
Tota
l fin
anci
al li
abili
ties
(54,
591)
10,1
49(4
4,44
2)19
,652
18,4
16(6
,374
)(1
,235
)(4
5,67
7)
Amou
nts
not o
ffset
on
the
Bala
nce
Shee
tAm
ount
s of
fset
on
the
Bala
nce
Shee
tSu
bjec
t to
Enfo
rcea
ble
Mas
ter N
ettin
g or
Sim
ilar A
gree
men
ts30
Jun
18
(1)
The
net o
ffset
bal
ance
of $
3,35
5 m
illion
rela
tes
to v
aria
tion
mar
gin
netti
ng re
flect
ed o
n ot
her B
alan
ce S
heet
line
s.
(2)
For t
he p
urpo
se o
f thi
s di
sclo
sure
, the
rela
ted
amou
nts
of fi
nanc
ial i
nstru
men
ts a
nd fi
nanc
ial c
olla
tera
l not
set
off
on th
e Ba
lanc
e Sh
eet h
ave
been
cap
ped
by re
leva
nt n
ettin
g ag
reem
ents
so
as n
ot to
exc
eed
the
net a
mou
nts
of fi
nanc
ial
asse
ts/(l
iabi
litie
s) re
porte
d on
the
Bala
nce
Shee
t, i.e
. ove
r col
late
ralis
atio
n, w
here
it e
xist
s, is
not
refle
cted
in th
e ta
bles
. As
a re
sult
the
abov
e co
llate
ral b
alan
ces
will
not c
orre
spon
d to
the
tabl
es in
Not
e 9.
6.
Rel
ated
am
ount
s no
t set
off
on th
e ba
lanc
e sh
eet
Der
ivat
ive
Asse
ts a
nd L
iabi
litie
s Th
e “F
inan
cial
Inst
rum
ents
” col
umn
iden
tifie
s fin
anci
al a
sset
s an
d lia
bilit
ies
that
are
sub
ject
to s
et o
ff un
der n
ettin
g ag
reem
ents
, suc
h as
the
ISD
A M
aste
r Agr
eem
ent.
All o
utst
andi
ng tr
ansa
ctio
ns
with
the
sam
e co
unte
rpar
ty c
an b
e of
fset
and
clo
se-o
ut n
ettin
g ap
plie
d if
an e
vent
of d
efau
lt or
oth
er p
rede
term
ined
eve
nts
occu
r. Fi
nanc
ial c
olla
tera
l ref
ers
to c
ash
and
non-
cash
col
late
ral o
btai
ned
to c
over
the
net e
xpos
ure
betw
een
coun
terp
artie
s by
ena
blin
g th
e co
llate
ral t
o be
real
ised
in a
n ev
ent o
f def
ault
or if
oth
er p
rede
term
ined
eve
nts
occu
r.
Rep
urch
ase
and
Rev
erse
Rep
urch
ase
Agre
emen
ts a
nd S
ecur
ity L
endi
ng A
gree
men
ts
The
“Fin
anci
al In
stru
men
ts” c
olum
n id
entif
ies
finan
cial
ass
ets
and
liabi
litie
s th
at a
re s
ubje
ct to
set
off
unde
r net
ting
agre
emen
ts, s
uch
as g
loba
l mas
ter r
epur
chas
e ag
reem
ents
and
glo
bal m
aste
r se
curit
ies
lend
ing
agre
emen
ts. U
nder
thes
e ne
tting
agr
eem
ents
, all
outs
tand
ing
trans
actio
ns w
ith th
e sa
me
coun
terp
arty
can
be
offs
et a
nd c
lose
-out
net
ting
appl
ied
if an
eve
nt o
f def
ault
or o
ther
pr
edet
erm
ined
eve
nts
occu
r. Fi
nanc
ial c
olla
tera
l typ
ical
ly c
ompr
ises
hig
hly
liqui
d se
curit
ies
whi
ch a
re le
gally
tran
sfer
red
and
can
be li
quid
ated
in th
e ev
ent o
f cou
nter
party
def
ault.
Fina
ncia
l ass
ets
and
liabi
litie
s ar
e of
fset
and
the
net a
mou
nt is
pre
sent
ed in
the
Bala
nce
Shee
t if,
and
only
if, t
here
is a
cur
rent
ly e
nfor
ceab
le le
gal r
ight
to o
ffset
the
reco
gnis
ed a
mou
nts,
and
ther
e is
an
inte
ntio
n to
set
tle o
n a
net b
asis
, or t
o re
alis
e th
e as
set a
nd s
ettle
the
liabi
lity
sim
ulta
neou
sly.

Strategic report
Financial performance
Risk management
Corporate governance
Directors’ report
Financial report
Other information
Notes to the financial statements
The Group employs over 50,000 people across multiple jurisdictions and remunerates its employees through both fixed and variable arrangements. This section outlines details of the share-based payment and superannuation components of employee remuneration and provides an overview of key management personnel arrangements.
The Group operates a number of cash and equity settled share plans as detailed below.
Long Term Variable Remuneration (LTVR) The Group’s 2019 LTVR award for the CEO and Group Executives is made under the Employee Equity Plan (EEP). LTVR awards up to and including the 2018 financial year were made under the Group Leadership Reward Plan (GLRP). LTVR focuses efforts on achieving superior performance for key stakeholders – being customers, community, employees and shareholders – in order to create sustainable long-term shareholder value and drive positive culture and behaviours in the Group.
Participants are awarded a maximum number of Rights, which may convert into CBA shares on a 1-for-1 basis. The Board has discretion to apply a cash equivalent.
The Rights may vest at the end of a performance period of four years subject to the satisfaction of performance measures as follows:
For awards up to and including the 2017 financial year:
25% of the award is assessed against Customer Satisfaction compared to ANZ, NAB, Westpac and other key competitors for our wealth management business by reference to independent external surveys; and
75% of the award is assessed against Total Shareholder Return (TSR) compared to the 20 largest companies listed on the ASX (by market capitalisation) at the beginning of each respective performance period, excluding resource companies and CBA.
For awards made from the 2018 financial year:
75% of the award is assessed against TSR compared to the 20 largest companies listed on the ASX (by market capitalisation) at the beginning of each respective performance period, excluding resource companies and CBA.
12.5% of the award is assessed against a Relative Trust and Reputation measure; and 12.5% of the award is assessed against an Absolute Employee Engagement measure.
A positive TSR gateway applies to the Trust and Reputation and Employee Engagement measures. Refer to the Remuneration Report for further details on LTVR.
The following table provides details of outstanding awards of Rights granted under LTVR awards:
Outstanding Outstanding ExpensePeriod 1 July Granted Vested Forfeited 30 June ($'000)30 Jun 19 678,801 294,619 (34,099) (130,802) 808,519 7,186
30 Jun 18 1,174,899 215,356 (174,139) (537,315) 678,801 4,329
The weighted average fair value at the grant date for TSR was $33.57 and $49.87 for both Trust and Reputation and Employee Engagement Rights issued during the year (2018: $36.94 for TSR and $57.11 for both Trust and Reputation and Employee Engagement). The fair value of the Rights granted during the period has been independently calculated at grant date using a Monte Carlo pricing model based on market information and excluding the impact of non-market performance conditions. The assumptions included in the valuation of the 2019 financial year award include a share price of $71.77, a risk-free interest rate of 2.29%, a 5.83% dividend yield on the Bank’s ordinary shares and a volatility in the Bank share price of 15%.
Group Rights Plan (GRP) and Employee Equity Plan (EEP) The GRP and EEP Restricted Shares facilitate mandatory short-term variable remuneration deferral, sign-on incentives and retention awards. Participants are awarded rights or restricted shares that vest provided the participant remains in employment of the Group until vesting date. The following table provides details of outstanding awards of rights and shares granted under the GRP and EEP.
246 Commonwealth Bank of Australia Annual Report 2019

Group Rights Plan (GRP) and Employee Equity Plan (EEP) (continued)
Outstanding Outstanding ExpensePeriod 1 July Granted Vested Forfeited 30 June ($'000)30 Jun 19 2,246,204 1,086,280 (993,435) (186,582) 2,152,467 77,136
30 Jun 18 2,125,927 1,045,179 (849,508) (75,394) 2,246,204 67,725
The weighted average fair value at grant date of the awards issued during the year was $71.08 (2018: $75.67).
Employee Share Acquisition Plan (ESAP) Under the ESAP eligible employees have the opportunity to receive up to $1,000 worth of shares each year if the Group meets the required performance hurdle of growth in the Group’s net profit after tax (“cash basis”). If the hurdle is not met, the Board has discretion to determine whether a full award, a partial award or no award is made.
The number of shares a participant receives is calculated by dividing the award amount by the average price paid for CBA shares purchased during the purchase period preceding the grant date. Shares granted are restricted from sale until the earlier of three years or until such time as the participant ceases employment with the Group. Participants receive full dividend entitlements and voting rights attached to those shares.
While the Group did not achieve the ESAP performance target for the 2018 financial year, the Board exercised its discretion and approved a partial award of $550 during the financial year ended 30 June 2019 to each eligible employee to recognise their contribution through-out the year.
The following table provides details of shares granted under the ESAP:
Number of Shares Total Number of TotalPeriod Allocation date Participants Allocated per Participant Shares Allocated Issue Price $ Fair Value $30 Jun 19 16 Nov 2018 30,960 7 216,720 70.86 15,356,779
30 Jun 18 8 Sep 2017 31,780 12 381,360 79.11 30,169,390
It is estimated that approximately $34 million of CBA shares will be purchased on market at the prevailing market price for the 2019 grant.
Other employee awards
A number of other plans are operated by the Group, including:
The Employee Share (Performance Unit) Plan and Employee Equity Plan (EEP) Cash Settled Rights are cash-based versions of the GRP and EEP; and
The International Employee Share Acquisition Plan, which is the cash-based version of the ESAP.
The following table provides a summary of the movement in awards during the year:
Outstanding Outstanding ExpensePeriod 1 July Granted Vested Forfeited 30 June ($'000)30 Jun 19 509,927 162,180 (242,026) (48,657) 381,424 15,805
30 Jun 18 458,764 251,284 (168,925) (31,196) 509,927 21,405
The weighted average fair value at grant date of the awards issued during the year was $71.35 (2018: $75.70).
Salary sacrifice arrangements
The Group facilitates the purchase of CBA shares via salary sacrifice as follows:
Type Arrangements
Salary Sacrifice Australian based employees and Non-Executive Directors can elect to sacrifice between $2,000 and $5,000 p.a. of their fixed remuneration and/or annual STVR or fees (in the case of Non-Executive Directors) (ESSSP)
Restricted from sale for a minimum of two years and a maximum of seven years or earlier, if the employee ceases employment with the Group (or retires from the Group in the case of Non-Executive Directors).
Non-Executive Required to defer 20% of post-tax fees until a minimum shareholding requirement of 5,000 shares is reached. Directors Restricted from sale for ten years or when the Non-Executive Director retires from the Board if earlier.
(NEDSP)
247

Strategic Financial Risk Corporate Directors’ Financial Other report performance management governance report report information
Notes to the financial statements
Salary sacrifice arrangements (continued)
Shares are purchased on market at the prevailing market price at that time and receive full dividend entitlements and voting rights. The following table provides details of shares granted under the ESSSP and NEDSP (voluntary fee sacrifice).
Number of Average purchase Total purchasePeriod Participants shares purchased price $ consideration $30 Jun 19 952 47,205 71.57 3,378,462
30 Jun 18 983 41,390 77.68 3,215,222
During the year four (2018: four) Non-Executive Directors applied $103,151 in fees (2018: $74,991) to purchase 1,424 shares (2018: 988 shares).
Name of Plan Type Form of Benefit Date of Last Actuarial Assessment of the Fund
Commonwealth Bank Group Super
Defined Benefits
and Accumulation(1)
Indexed pension and lump sum 30 June 2018
Commonwealth Bank of Australia (UK) Staff Benefits Scheme (CBA (UK) SBS)
Defined Benefits
and Accumulation(1)
Indexed pension and lump sum 30 June 2016
(1) The defined benefit formulae are generally comprised of final salary, or final average salary, and service.
Regulatory framework
Both plans operate under trust law with the assets of the plans held separately in trust. The Trustee of Commonwealth Bank Group Super is Commonwealth Bank Officers Superannuation Corporation Pty Limited. The Trustee of CBA (UK) SBS is Commonwealth Bank of Australia (UK) Staff Benefits Scheme Trustee Company Limited. Both Trustees are wholly owned subsidiaries of the Group. The Trustees do not conduct any business other than trusteeship of the plans. The plans are managed and administered on behalf of the members in accordance with the terms of each trust deed and relevant legislation. The funding of the plans complies with regulations in Australia and the UK respectively.
Funding and contributions
An actuarial assessment as at 30 June 2018 showed Commonwealth Bank Group Super remained in funding surplus. The Bank agreed to continue contributions of $20 million per month to the plan. Employer contributions paid to the plan are subject to tax at the rate of 15% in the plan.
An actuarial assessment of the CBA (UK) SBS as at 30 June 2016 was completed in September 2017. It confirmed a funding deficit of GBP26.2 million ($47.4 million). The Bank agreed to pay deficit reduction contributions of GBP5 million ($9 million) per annum, paid monthly from 1 January 2018 to 31 December 2022. The Group’s expected contributions to the Commonwealth Bank Group Super and the CBA (UK) SBS for the year ended 30 June 2020 are $240 million and GBP7.5 million ($13.6 million) respectively.
248 Commonwealth Bank of Australia Annual Report 2019
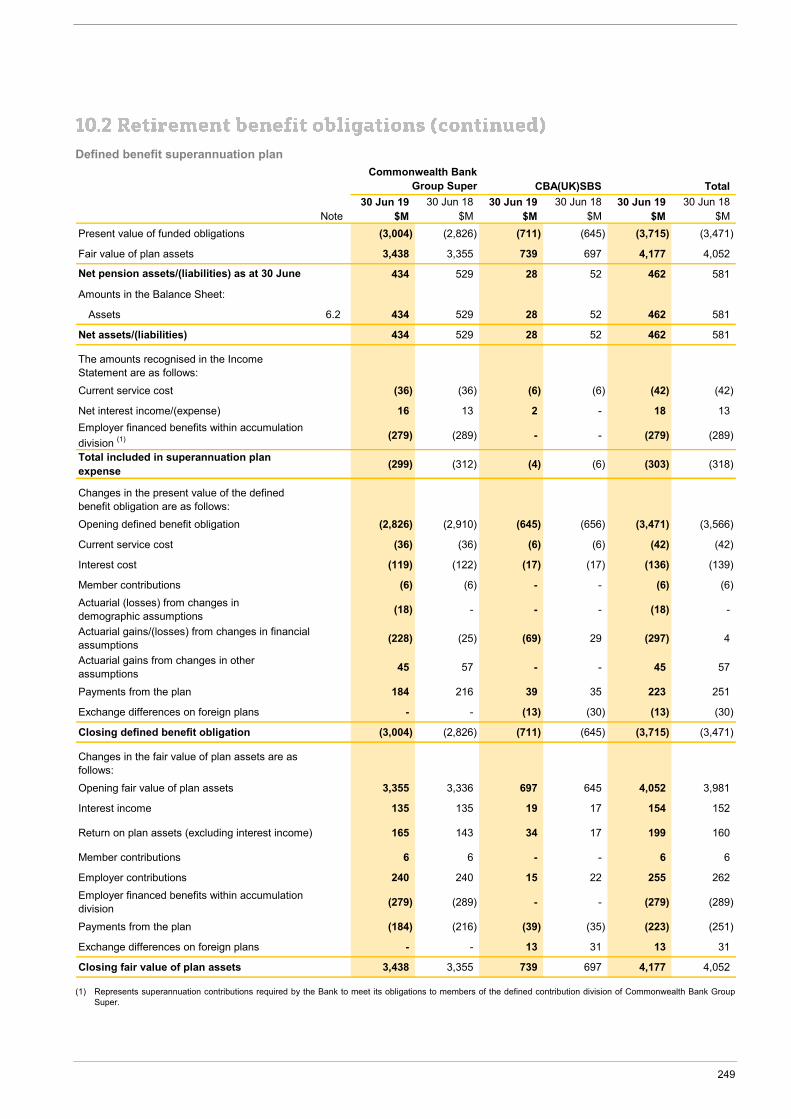
Defined benefit superannuation plan
Total30 Jun 19 30 Jun 18 30 Jun 19 30 Jun 18 30 Jun 19 30 Jun 18
Note $M $M $M $M $M $MPresent value of funded obligations (3,004) (2,826) (711) (645) (3,715) (3,471)
Fair value of plan assets 3,438 3,355 739 697 4,177 4,052
434 529 28 52 462 581
Amounts in the Balance Sheet:
Assets 6.2 434 529 28 52 462 581
Net assets/(liabilities) 434 529 28 52 462 581
The amounts recognised in the Income Statement are as follows:Current service cost (36) (36) (6) (6) (42) (42)
Net interest income/(expense) 16 13 2 - 18 13Employer financed benefits within accumulation division (1) (279) (289) - - (279) (289)
Total included in superannuation plan expense (299) (312) (4) (6) (303) (318)
Changes in the present value of the defined benefit obligation are as follows:Opening defined benefit obligation (2,826) (2,910) (645) (656) (3,471) (3,566)
Current service cost (36) (36) (6) (6) (42) (42)
Interest cost (119) (122) (17) (17) (136) (139)
Member contributions (6) (6) - - (6) (6)Actuarial (losses) from changes in demographic assumptions (18) - - - (18) -
Actuarial gains/(losses) from changes in financial assumptions (228) (25) (69) 29 (297) 4
Actuarial gains from changes in other assumptions 45 57 - - 45 57
Payments from the plan 184 216 39 35 223 251
Exchange differences on foreign plans - - (13) (30) (13) (30)
Closing defined benefit obligation (3,004) (2,826) (711) (645) (3,715) (3,471)
Changes in the fair value of plan assets are as follows:Opening fair value of plan assets 3,355 3,336 697 645 4,052 3,981
Interest income 135 135 19 17 154 152
Return on plan assets (excluding interest income) 165 143 34 17 199 160
Member contributions 6 6 - - 6 6
Employer contributions 240 240 15 22 255 262Employer financed benefits within accumulation division (279) (289) - - (279) (289)
Payments from the plan (184) (216) (39) (35) (223) (251)
Exchange differences on foreign plans - - 13 31 13 31
Closing fair value of plan assets 3,438 3,355 739 697 4,177 4,052
Commonwealth Bank Group Super CBA(UK)SBS
Net pension assets/(liabilities) as at 30 June
(1) Represents superannuation contributions required by the Bank to meet its obligations to members of the defined contribution division of Commonwealth Bank Group Super.
249

Strategic Financial Risk Corporate Directors’ Financial Other report performance management governance report report information
Notes to the financial statements
Economic assumptions
CBA(UK)SBS 30 Jun 19 30 Jun 18 30 Jun 19 30 Jun 18
Economic assumptions % % % %
Discount rate 3. 20 4. 20 2. 30 2. 70
Inflation rate 1. 60 2. 10 3. 50 3. 30
Rate of increases in salary 2. 40 2. 90 4. 50 4. 30
Commonwealth BankGroup Super
The above calculations were based on the following assumptions:
In addition to financial assumptions, the mortality assumptions for pensioners can materially impact the defined benefit obligations. These assumptions are age related and allowances are made for future improvement in mortality. The expected life expectancies (longevity) for pensioners are set out below:
CBA(UK)SBS 30 Jun 19 30 Jun 18 30 Jun 19 30 Jun 18
Expected life expectancies for pensioners Years Years Years Years Male pensioners currently aged 60 28. 8 28. 8 28. 0 27. 6
Male pensioners currently aged 65 23. 9 23. 8 23. 2 23. 1
Female pensioners currently aged 60 31. 2 33. 1 29. 9 29. 8
Female pensioners currently aged 65 26. 1 28. 1 25. 1 25. 0
Commonwealth BankGroup Super
Sensitivity to changes in assumptions
The table below sets out the sensitivities of the present value of defined benefit obligations at 30 June to a change in the principal actuarial assumptions:
CBA(UK)SBS 30 Jun 19 30 Jun 19
Impact of change in assumptions on liabilities % % 0.25% decrease in discount rate 3. 70 4. 90
0.25% increase in inflation rate 2. 96 3. 30
0. 47 0. 30
Longevity increase of 1 year 4. 76 3. 70
Group SuperCommonwealth Bank
0.25% increase to the rate of increases in salary
Average duration
The average duration of defined benefit obligation at 30 June is as follows:
CBA(UK)SBS 30 Jun 19 30 Jun 19
Years YearsAverage duration at balance date 13 19
Group SuperCommonwealth Bank
250 Commonwealth Bank of Australia Annual Report 2019

Risk management The pension plans expose the Group to longevity risk, currency risk, interest rate risk, inflation risk and market risk. The Trustees perform Asset-Liability Matching (ALM) exercises to ensure the plan assets are well matched to the nature and maturities of the defined benefit obligations.
The Commonwealth Bank Group Super’s investment strategy comprises 41% growth and 59% defensive assets. Inflation and interest rate risks are partly mitigated by investing in long dated fixed interest securities which better match the average duration of liabilities and entering into inflation and interest rate swaps.
The allocation of assets backing the defined benefit portion of the Commonwealth Bank Group Super is as follows:
30 Jun 19 30 Jun 18Fair value % of plan Fair value % of plan
Asset allocations $M asset $M assetCash 83 2. 4 81 2. 4
Equities - Australian (1) 193 5. 6 253 7. 5
Equities - Overseas (1) 591 17. 2 570 17. 0
Bonds - Commonwealth Government (1) 967 28. 1 679 20. 2
Bonds - Semi-Government (1) 956 27. 8 1,179 35. 1
Bonds - Corporate and other (1) 71 2. 1 79 2. 4
Real Estate and Infrastructure (2) 346 10. 1 334 10. 0
Derivatives (33) (1. 0) (17) (0. 5)
Other (3) 264 7. 7 197 5. 9
Total fair value of plan assets 3,438 100. 0 3,355 100. 0
Commonwealth Bank Group Super
(1) Values based on prices or yields quoted in an active market. (2) This includes listed and unlisted property and infrastructure investments. (3) These are alternative investments which are not included in the traditional asset classes of equities, fixed interest securities, real estate and cash. They include multi-
asset investments, liquid alternative investments and hedge funds.
The Australian equities fair value includes $15.3 million of Commonwealth Bank shares. The real estate fair value includes $1.4 million of property assets leased to the Bank. The bonds – corporate and other fair value includes $0.4 million of Commonwealth Bank debt securities. The other asset allocation includes $0.5 million of Commonwealth Bank shares and $0.1 million debt securities held in a multi-asset fund.
Detailed remuneration disclosures by Key Management Personnel (KMP) are provided in the Remuneration Report of the Directors’ Report on pages 82 to 106.
Group Bank30 Jun 19 30 Jun 18 30 Jun 19 30 Jun 18
Key Management Personnel compensation $'000 $'000 $'000 $'000
Short-term benefits (1) (2) 23,326 23,127 21,413 23,127
Post-employment benefits 457 421 400 421
Long-term benefits 864 854 836 854
Share-based payments (1) 14,715 11,235 14,405 11,235
Total 39,362 35,637 37,054 35,637
(1) Non-Executive Director fees for the 2018 financial year have been restated to reflect car parking benefits (including associated fringe benefits tax) and the proportion between cash fees and Non-Executive Directors’ share plan shares for some individuals.
(2) Short-term benefits includes termination benefits of $1,294,969 (2018: $4,700,917)
251

Strategic Financial Risk Corporate Directors’ Financial Other report performance management governance report report information
Notes to the financial statements
Security holdings
Details of the aggregate security holdings of KMP are set out below.
PreviousAcquired/ Years Net
Balance Granted as Awards Change BalanceClass (1) 1 July 18 (2) Remuneration Vested (3) Other (4) 30 June 19 (5)
Non-Executive Directors Ordinary (6) 138,406 9,145 - (97,190) 50,361PERLS 8,600 - - (5,830) 2,770
Executives Ordinary 228,623 - 96,267 (114,930) 209,960LTVR Rights 440,321 294,619 (18,390) (131,133) 585,417Deferred Shares - 38,818 - (14,923) 23,895Deferred Rights 54,353 7,064 (41,896) 409 19,930Sign-on equity 9,234 125,772 (42,651) - 92,355PERLS 2,330 - - (2,330) -
(1) LTVR rights are subject to performance hurdles. Deferred shares represent the deferred STVR awarded in the 2019 financial year. Deferred rights represent the deferred STVR awarded under Executive General Manager arrangements and retention awards received as rights in prior years, as well as the CEO ASB’s 2018 financial year STVR award. Sign-on equity includes sign-on awards received as deferred rights or shares. PERLS include cumulative holdings of all PERLS securities issued by the Group.
(2) Due to the changes in KMP during the 2019 financial year, aggregate security holdings balance at 1 July 2018 does not align to the balance disclosed for 30 June 2018. (3) LTVR rights, deferred shares and deferred rights become ordinary shares or are cash settled upon vesting. (4) Net change other incorporates changes resulting from purchases, sales, forfeitures and appointment or departure of KMP during the year. (5) 30 June 2019 balances represent aggregate shareholdings of all KMP at balance date. (6) Non-Executive Directors who hold fewer than 5,000 Commonwealth Bank shares are required to receive 20% of their total after-tax base fees as CBA shares. These
shares are subject to a 10-year trading restriction (the shares will be released earlier if the Non-Executive Director leaves the Board).
Loans to KMP
All loans to KMP (including close family members or entities controlled, jointly controlled, or significantly influenced by them, or any entity over which any of those family members or entities held significant voting power) have been made in the ordinary course of business on normal commercial terms and conditions no more favourable than those given to other employees and customers, including the term of the loan, security required and the interest rate (which may be fixed or variable). There has been no write down of loans during the period.
Details of aggregate loans to KMP are set out below:
30 Jun 19 30 Jun 18$'000 $'000
Loans 12,337 12,914Interest charged 480 476
Other transactions of KMP
Financial Instrument Transactions
Financial instrument transactions (other than loans and shares disclosed within this report) of KMP occur in the ordinary course of business on normal commercial terms and conditions no more favourable than those given to other employees and customers.
Disclosure of financial instrument transactions regularly made as part of normal banking operations is limited to disclosure of such transactions with KMP and entities controlled or significantly influenced by them.
All such financial instrument transactions that have occurred between entities within the Group and their KMP have been trivial or domestic in nature and were in the nature of normal personal banking and deposit transactions.
Transactions other than Financial Instrument Transactions of Banks
All other transactions with KMP and their related entities and other related parties are conducted on an arm’s length basis in the normal course of business and on commercial terms and conditions. These transactions principally involve the provision of financial and investment services by entities not controlled by the Group.
Services agreements
The maximum contingent liability for termination benefits in respect of service agreements with the Chief Executive Officer and other Group KMP at 30 June 2019 was $2,254,283 (2018: $3,096,820).
252 Commonwealth Bank of Australia Annual Report 2019

The Group structure includes the Bank legal entity and its interests in operating and special purpose subsidiaries, joint ventures and associates. These entities were either acquired or established and their classification is driven by the Bank’s level of control or influence.
These entities operating activities include banking, advice, funds management, specialised customer financing and asset backed financing across multiple jurisdictions.
Subsidiaries
The key subsidiaries of the Bank are:
Entity Name Entity Name
Australia
(a) Banking
CBA Covered Bond Trust Medallion Trust Series 2015-2
Commonwealth Securities Limited Medallion Trust Series 2016-1
Medallion Trust Series 2008-1R Medallion Trust Series 2016-2
Medallion Trust Series 2011-1 Medallion Trust Series 2017-1
Medallion Trust Series 2013-1 Medallion Trust Series 2017-1P
Medallion Trust Series 2013-2 Medallion Trust Series 2017-2
Medallion Trust Series 2014-1 Residential Mortgage Group Pty Ltd
Medallion Trust Series 2014-2 Medallion Trust Series 2018-1
Medallion Trust Series 2015-1
(b) Insurance and Funds Management
Capital 121 Pty Limited Commonwealth Insurance Limited
Colonial Holding Company Limited The Colonial Mutual Life Assurance Society Limited (1)
Commonwealth Insurance Holdings Limited
(1) This subsidiary is classified as a discontinued operation.
All the above subsidiaries are 100% owned and incorporated in Australia.
253

Strategic Financial Risk Corporate Directors’ Financial Other report performance management governance report report information
Notes to the financial statements
Subsidiaries (continued) Extent of Beneficial
Entity Name Interest if not 100% Incorporated inNew Zealand and Other Overseas
(a) Banking
ASB Bank Limited New Zealand
ASB Covered Bond Trust New Zealand
ASB Finance Limited New Zealand
ASB Holdings Limited New Zealand
ASB Term Fund New Zealand
CommBank Europe Limited Malta
Medallion NZ Series Trust 2009-1R New Zealand
PT Bank Commonwealth 99% Indonesia
(b) Insurance and Funds Management
PT Commonwealth Life (1) 80% Indonesia
First Gas Limited (1) 12% New Zealand
(1) As at 30 June 2019, PT Commonwealth Life and First Gas Limited are classified as discontinued operations.
The Group also consolidates a number of unit trusts and other companies as part of the ongoing investment activities of the life insurance and wealth businesses. These investment vehicles are excluded from the above list.
Significant Judgements and Assumptions
Control and voting rights
Holding more than 50% of an entity’s voting rights typically indicates that the Group has control over the entity. Significant judgement is involved where the Group either holds more than 50% of the voting rights but does not control an entity, or where the Group is deemed to control an entity despite holding less than 50% of the voting rights.
Agent or principal
The Group is deemed to have power over an investment fund when it holds either the responsible entity (RE) and/or the manager function of that fund. Whether that power translates to control depends on whether the Group is deemed to act as an agent or a principal of that fund. Management have determined that the Group acts as a principal and controls a fund when it cannot be easily removed as a manager or RE by investors and when its economic interest in that fund is substantial compared to the economic interest of other investors. In all other cases the Group acts as agent and does not control the fund.
Non-controlling interests
Group 30 Jun 19 30 Jun 18
$M $M Shareholders' Equity 55 554
Total non-controlling interests 55 554
New Zealand Perpetual Preference Shares of AUD505 million issued by ASB Capital Limited and ASB Capital No.2 Limited, the Group’s New Zealand subsidiaries, were bought back and subsequently cancelled in May 2019.
As at 30 June 2019, non-controlling interests include minority shareholders’ interest in the Group’s subsidiaries, PT Bank Commonwealth, PT Commonwealth Life and First Gas Limited.
254 Commonwealth Bank of Australia Annual Report 2019

Significant restrictions
There were no significant restrictions on the ability to transfer cash or other assets, pay dividends or other capital distributions, provide or repay loans and advances between the entities within the Group. There were also no significant restrictions on the Group's ability to access or use the assets and settle the liabilities of the Group resulting from protective rights of non-controlling interests.
Associates and joint ventures
There were no individually significant investments in associates or joint ventures held by the Group as at 30 June 2019 and 30 June 2018. In addition, there were no significant restrictions on the ability of associates or joint ventures to transfer funds to the Bank or its subsidiaries in the form of cash dividends or to repay loans or advances made.
The Group’s investments in associates and joint ventures are shown in the table below.
Group30 Jun 19 30 Jun 18
30 Jun 19 30 Jun 18 Ownership Ownership Principal Country of Balance$M $M Interest % Interest % Activities Incorporation Date
Bank of Hangzhou Co., Ltd 1,816 1,680 18 18 Commercial Banking China 31-Dec
First State European Diversified Infrastructure Fund FCP-SIF (1) - 121 4 3 Funds
Management Luxembourg 31-Dec
Qilu Bank Co., Ltd 771 638 18 18 Commercial Banking China 31-Dec
Vietnam International Commercial Joint Stock Bank 242 210 20 20 Commercial
Banking Vietnam 31-Dec
Other 172 193 Various Various Various Various VariousCarrying amount of investments in associates and joint ventures 3,001 2,842
Group30 Jun 19 30 Jun 18
Share of Associates' and Joint Ventures profits (2) $M $M Operating profits before income tax 315 321
Income tax expense (27) (52)
Operating profits after income tax (3) 288 269
(1) The investment in First State European Diversified Infrastructure Fund FCP-SIF has been classified as held for sale following the announced sale of CFSGAM. (2) Excludes information concerning associates and joint ventures classified as held for sale. (3) This amount is recognised within Note 2.3 in the share of profits of associates and joint ventures net of impairment.
Structured entities
A structured entity is an entity in which voting or similar rights are not the dominant factor in deciding control. Structured entities are generally created to achieve a narrow and well defined objective with restrictions around their ongoing activities. Depending on the Group’s power over the activities of the entity and its exposure to and ability to influence its own returns, it may consolidate the entity. In other cases it may sponsor or have exposure to such an entity but not consolidate it.
Consolidated structured entities
The Group has the following contractual arrangements which require it to provide financial support to its structured entities.
255

Strategic Financial Risk Corporate Directors’ Financial Other report performance management governance report report information
Notes to the financial statements
Structured entities (continued)
Securitisation structured entities
The Group provides liquidity facilities to Medallion, Medallion NZ and Swan structured entities. The liquidity facilities can only be drawn to cover cash flow shortages relating to mismatches in timing of cash inflows due from securitised asset pools and cash outflows due to note holders. These ‘timing mismatch’ facilities rank pari passu with other senior secured creditors. The facilities limit is $877 million (2018: $857 million).
The Group has no contractual obligations to purchase assets from its securitisation structured entities.
Covered bonds trust
The Group provides funding and support facilities to CBA Covered Bond Trust and ASB Covered Bond Trust (the ‘Trusts’). The Trusts are bankruptcy remote SPVs that guarantee any debt obligations owing under the US$30 billion CBA Covered Bond Programme and the EUR7 billion ASB Covered Bond Programme, respectively. The funding facilities allow the Trusts to hold sufficient residential mortgage loans to support the guarantees provided to the Covered Bonds. The Group also provides various swaps to the Trusts to hedge any interest rate and currency mismatches. The Group, either directly or via its wholly owned subsidiaries, Securitisation Advisory Services Pty Limited and Securitisation Management Services Limited, provides various services to the Trusts including servicing and monitoring of the residential mortgages.
Structured asset finance structured entities
The Group has no contractual obligation to provide financial support to any of its Structured asset finance structured entities.
During the year ended 30 June 2019, the Bank entered into a debt forgiveness arrangement with two wholly owned structured entities for the total of $7 million (2018: $17 million). The financial impact of the debt forgiveness was fully eliminated on consolidation.
Unconsolidated structured entities
The Group has exposure to various securitisation vehicles via Residential Mortgage-backed Securities (RMBS) and Asset-backed Securities (ABS). The Group may also provide derivatives and other commitments to these vehicles. The Group also has exposure to Investment funds and other financing vehicles.
Securitisations
Securitisations involve transferring assets into an entity that sells beneficial interests to investors through the issue of debt and equity notes with varying levels of subordination. The notes are collateralised by the assets transferred to these vehicles and pay a return based on the returns of those assets, with residual returns paid to the most subordinated investor.
The Group may trade or invest in RMBS and ABS, which are backed by Commercial Properties, Consumer Receivables, Equipment and Auto Finance. The Group may also provide lending, derivatives, liquidity and commitments to these securitisation entities.
Other financing
Asset-backed entities are used to provide tailored lending for the purchase or lease of assets transferred by the Group or its clients. The assets are normally pledged as collateral to the lenders. The Group engages in raising finance for assets such as aircraft, trains, vessels and other infrastructure. The Group may also provide lending, derivatives, liquidity and commitments to these entities.
Investment funds
The Group conducts investment management and other fiduciary activities as responsible entity, trustee, custodian, advisor or manager for investment funds and trusts, including superannuation and approved deposit funds, wholesale and retail trusts. The Group’s exposure to investment funds includes holding units in the investment funds and trusts, providing lending facilities, derivatives and receiving fees for services.
The nature and extent of the Group’s interests in these entities are summarised below. Interests do not include derivatives and other positions where the Group creates rather than absorbs variability of the Structured entity, for example deposits. These have been excluded from the below table.
256 Commonwealth Bank of Australia Annual Report 2019

Unconsolidated structured entities (continued)
30 Jun 19Other Investment
RMBS ABS Financing Funds TotalExposures to unconsolidated structured entities $M $M $M $M $MAssets at fair value through income statement - trading - - - 242 242
Investment securities 7,619 476 - - 8,095
Loans, bills discounted and other receivables 1,977 1,602 5,454 7,367 16,400
Other assets - - - - -
Assets held for sale - - - 1,108 1,108
Total on Balance Sheet exposures 9,596 2,078 5,454 8,717 25,845
Total notional amounts of off Balance Sheet exposures (1) 2,761 729 539 4,302 8,331
Total maximum exposure to loss 12,357 2,807 5,993 13,019 34,176
Total assets of the entities (2) 55,508 9,523 17,542 329,237 411,810
(1) Relates to undrawn facilities. (2) Size of the entities is generally the total assets of the entities, except for Real Estate Investment Trusts where the size is based on the Group’s credit exposure of
$9,073 million.
30 Jun 18Other Investment
RMBS ABS Financing (1) Funds TotalExposures to unconsolidated structured entities $M $M $M $M $MAssets at fair value through income statement - trading 22 - - 43 65
Available-for-sale investments 7,233 652 - 224 8,109
Loans, bills discounted and other receivables 3,056 1,576 5,576 8,089 18,297
Other assets - - - 401 401
Assets held for sale - - - 824 824
Total on Balance Sheet exposures 10,311 2,228 5,576 9,581 27,696
Total notional amounts of off Balance Sheet exposures (2) 2,027 674 1,068 4,302 8,071
Total maximum exposure to loss 12,338 2,902 6,644 13,883 35,767
Total assets of the entities (3) 52,230 9,869 16,101 332,443 410,643
(1) In prior years, Other Financing included exposures to structured entities where the Group had recourse only to assets of the structured entities. Comparative information has been restated to conform to presentation in the current year and includes all exposures to structured entities.
(2) Relates to undrawn facilities. (3) Size of the entities is generally the total assets of the entities, except for Real Estate Investment Trusts where the size is based on the Group’s credit exposure of
$9,688 million.
257

Strategic Financial Risk Corporate Directors’ Financial Other report performance management governance report report information
Notes to the financial statements
Unconsolidated structured entities (continued)
The Group’s exposure to loss depends on the level of subordination of the interest, which indicates the extent to which other parties are obliged to absorb credit losses before the Group. An overview of the Group’s interests, relative ranking and external credit rating, for vehicles that have credit subordination in place, is summarised in the table below, and include securitisation vehicles and other financing.
30 Jun 19Other
Ranking and credit rating of exposures RMBS ABS Financing Totalto unconsolidated structured entities $M $M $M $MSenior (1) 12,269 2,807 5,993 21,069
Mezzanine (2) 88 - - 88
Total maximum exposure to loss 12,357 2,807 5,993 21,157
(1) All ABS and RMBS exposures and $3,901 million of other financing exposures are rated investment grade. $2,092 million of other financing exposures are sub-investment grade.
(2) All RMBS exposures are rated investment grade.
30 Jun 18 (1)
OtherRanking and credit rating of exposures RMBS ABS Financing Totalto unconsolidated structured entities $M $M $M $M
Senior (2) 12,254 2,902 6,644 21,800
Mezzanine (3) 84 - - 84
Total maximum exposure to loss 12,338 2,902 6,644 21,884
(1) In prior years, Other Financing included exposures to structured entities where the Group had recourse only to assets of the structured entities. Comparative information has been restated to conform to presentation in the current year and includes all exposures to structured entities.
(2) All ABS exposures, $12,240 million of RMBS exposures and $4,067 million of other financing exposures are rated investment grade. $14 million of RMBS and $2,577 million of other financing exposures are sub-investment grade.
(3) All RMBS exposures are rated investment grade.
Sponsored unconsolidated structured entities
For the purposes of this disclosure, the Group sponsors an entity when it manages or advises the entity’s program, places securities into the market on behalf of the entity, provides liquidity and/or credit enhancements to the entity, or the Group’s name appears in the Structured Entity.
As at 30 June 2019, the Group has not sponsored any unconsolidated structured entities.
258 Commonwealth Bank of Australia Annual Report 2019

Subsidiaries
The consolidated financial report comprises the financial report of the Bank and its subsidiaries. Subsidiaries are entities (including structured entities) over which the Bank has control. The Bank controls an entity when it has:
power over the relevant activities of the entity, for example through voting or other rights; exposure to, or rights to, variable returns from the Bank’s involvement with the entity; and the ability to use its power over the entity to affect the Bank’s returns from the entity.
Consolidation of structured entities
The Group exercises judgement at inception and periodically thereafter, to assess whether that structured entity should be consolidated based on the Bank’s power over the relevant activities of the entity and the significance of its exposure to variable returns of the structured entity. Such assessments are predominately required for the Group’s securitisation program, structured transactions and involvement with investment funds.
Transactions between subsidiaries in the Group are eliminated. Non-controlling interests and the related share of profits in subsidiaries are shown separately in the consolidated Income Statement, Statement of Comprehensive Income, Statement of Changes in Equity, and Balance Sheet. Subsidiaries are consolidated from the date on which control is transferred to the Group and de-consolidated when control ceases. Subsidiaries are accounted for at cost less accumulated impairments at the Bank level.
Business combinations
Business combinations are accounted for using the acquisition method. At the acquisition date, the cost of the business is the fair value of the purchase consideration, measured as the aggregate of the fair values of assets transferred, equity instruments issued, or liabilities incurred or assumed at the date of exchange.
Identifiable assets acquired and liabilities and contingent liabilities assumed in a business combination are measured at fair value on the acquisition date. Goodwill represents the excess of the fair value of the purchase consideration over the fair value of the Group’s share of assets acquired and liabilities and contingent liabilities assumed on the date of acquisition. If there is a deficit instead, this discount on acquisition is recognised directly in the consolidated Income Statement, but only after a reassessment of the identification and measurement of the net assets acquired.
Investments in associates and joint ventures
Associates and joint ventures are entities over which the Group has significant influence or joint control, but not control. In the consolidated financial report, they are equity accounted. They are initially recorded at cost and adjusted for the Group’s share of the associates’ and joint ventures’ post-acquisition profits or losses and other comprehensive income (OCI), less any dividends received. At the Bank level, they are accounted for at cost less accumulated impairments.
The Group assesses, at each Balance Sheet date, whether there is any objective evidence of impairment. If there is an indication that an investment may be impaired, then the entire carrying amount of the investment in associate or joint venture is tested for impairment by comparing the recoverable amount (higher of value in use and fair value less disposal costs) with the carrying amount. Impairment losses recognised in the Income Statement are subsequently reversed through the Income Statement if there has been a change in the estimates used to determine recoverable amount since the impairment loss was recognised.
Banking transactions are entered into with related parties in the normal course of business on an arm’s length basis. These include loans, deposits and foreign currency transactions, upon which some fees and commissions may be earned. Details of amounts paid or received from related parties, in the form of dividends or interest, are set out in Notes 2.3 and 2.1.
The Bank’s aggregate investments in, and loans to controlled entities are disclosed in the table below. Amounts due to controlled entities are disclosed in the Balance Sheet of the Bank.
Bank30 Jun 19 30 Jun 18
$M $MShares in controlled entities 10,728 11,821
Loans to controlled entities 109,465 106,431
Total shares in and loans to controlled entities 120,193 118,252
As at 30 June 2019, loans to controlled entities in the table above are presented net of $21 million provisions for impairment.
259

Strategic Financial Risk Corporate Directors’ Financial Other report performance management governance report report information
Notes to the financial statements
The Group receives fees on an arm’s length basis of $61 million (2018: $118 million) from funds included in assets held for sale.
The Bank provides letters of comfort to other entities within the Group on standard terms. Guarantees include a $175 million (2018: $175 million) guarantee to AFS license holders in respect of excess compensation claims. During the year ended 30 June 2019, the Bank entered into reimbursement arrangements totalling $396 million with its subsidiaries, Avanteos Investments Limited, Count Financial Limited, Financial Wisdom Limited and Commonwealth Financial Planning Limited (for the Pathways business (CFPL)), to cover potential remediation of ongoing service failures to customers, deceased estates, and inappropriate advice and other matters. This amount includes $374 million for Aligned Advice remediation and $22 million for other wealth remediation programs. The Group and the Bank have provided for these costs.
The Bank is the head entity of the tax consolidated group and has entered into tax funding and tax sharing agreements with its eligible Australian resident subsidiaries. The details of these agreements are set out in Note 2.5. The amount receivable by the Bank under the tax funding agreement with the tax consolidated entities is $320 million as at 30 June 2019 (2018: $283 million receivable). This balance is included in ‘Other assets’ in the Bank’s separate Balance Sheet.
All transactions between Group entities are eliminated on consolidation.
Parties are considered to be related if one party has the ability to control the other party or exercise significant influence over the other party in making financial or operational decisions, or a separate party controls both. The definition includes subsidiaries, associates, joint ventures, pension plans as well as other persons.
Completed transactions
Life insurance business in New Zealand
On 21 September 2017, the Group announced the sale of 100% of its New Zealand life insurance business (Sovereign) to AIA Group Limited (AIA) for $1.3 billion. The sale agreement includes a long-term partnership with AIA for the provision of life insurance products to customers in New Zealand. The sale of Sovereign completed on 2 July 2018, resulting in a total post-tax gain of $117 million (net of transaction and separation costs). This includes $135 million post-tax gain net of transaction and separation costs recognised during the year ended 30 June 2019, and $18 million post-tax transaction and separation costs recognised during the year ended 30 June 2018.
TymeDigital SA
On 1 November 2018, the Group completed the sale of Commonwealth Bank of South Africa (Holding Company) Limited (TymeDigital SA) to the minority shareholder, African Rainbow Capital, resulting in a total post-tax loss of $113 million.
Colonial First State Global Asset Management On 31 October 2018, the Group announced the sale of Colonial First State Global Asset Management (CFSGAM) to Mitsubishi UFJ Trust and Banking Corporation (MUTB). The sale of CFSGAM completed on 2 August 2019, resulting in final sale proceeds of $4.2 billion and a total post tax gain of $1.5 billion (inclusive of separation costs and subject to final tax calculations and completion adjustments).
Ongoing transactions
Life insurance businesses in Australia
On 21 September 2017, the Group announced the 100% sale of its Australian life insurance businesses (CommInsure Life) to AIA for $2.5 billion. The sale agreement includes a long-term partnership with AIA for the provision of life insurance products to customers in Australia. The sale of CommInsure Life remains subject to the completion of the transfer of the Group’s stake in BoCommLife out of CommInsure Life and its associated Chinese regulatory approvals.
The Group and AIA remain fully committed to completing the CommInsure Life transaction. The Group and AIA are also well progressed in exploring an alternative path to complete the CommInsure Life transaction prior to the transfer of the Group’s stake in BoCommLife. The alternative path is expected to be subject only to Australian regulatory approvals. The Group expects to be able to provide further details of this alternative path by the end of the first quarter of the financial year 2020, if the sale of BoCommLife has not substantially progressed in that timeframe.
BoCommLife
On 23 May 2018, the Group announced the sale of its 37.5% equity interest in BoCommLife to Mitsui Sumitomo Insurance Co. Ltd (MSI). On completion, CBA is expected to receive proceeds of approximately $891 million. The sale of BoCommLife is subject to Chinese regulatory approvals, and is expected to be completed in the second half of the calendar year 2019.
260 Commonwealth Bank of Australia Annual Report 2019

Ongoing transactions (continued)
PT Commonwealth Life
On 23 October 2018, the Group announced the sale of its 80% interest in its Indonesian life insurance business, PT Commonwealth Life (PTCL), to FWD Group (FWD). As part of the sale, CBA’s Indonesian banking subsidiary, PT Bank Commonwealth (PTBC), will enter into a 15-year life insurance distribution partnership with FWD. On completion, CBA is expected to receive $426 million in consideration for the sale of PTCL and entering the distribution partnership. The sale is subject to regulatory approvals in Indonesia and is now expected to complete in the second half of calendar year 2019.
Count Financial On 13 June 2019, the Group announced the sale of its 100% interest in Count Financial Limited (Count Financial) to CountPlus Limited (CountPlus) for $2.5 million. Completion is expected to occur in October 2019. Upon completion, the Group will provide an indemnity to CountPlus capped at $200 million. This indemnity amount represents a potential contingent liability of $56 million in excess of a $144 million Count Financial remediation provision included in the Group’s total Aligned Advice provision of $534 million as at 30 June 2019. Refer to Note 7.1 for further information.
The assets and liabilities of Count Financial have been presented as held for sale as at 30 June 2019. Count Financial has not been classified as a discontinued operation.
Financial impact of discontinued operations on the Group
The performance and net cash flows of the Group’s interests in CommInsure Life, Sovereign, BoCommLife, PTCL, CFSGAM and TymeDigital SA are set out in the tables below:
30 Jun 19 30 Jun 18 30 Jun 17$M $M $M
Net interest income 6 - (9)
Other banking income 20 21 20
Net banking operating income 26 21 11
Funds management income 1,102 1,194 1,138
Investment revenue 391 503 513
Claims, policyholder liability and commission revenue/(expense) (548) (604) (644)
Net funds management operating income 945 1,093 1,007
Premiums from insurance contracts 1,256 2,066 2,305
Investment revenue 539 367 216
Claims, policyholder liability and commission expense from insurance contracts (1,503) (1,702) (1,861)
Net insurance operating income 292 731 660
Total net operating income before operating expenses 1,263 1,845 1,678
Operating expenses (938) (1,110) (989)
Net profit before tax 325 735 689
Income tax expense (48) (172) (176)
Policyholder tax (50) (58) (32)
Net profit after tax and before transaction and separation costs 227 505 481
Losses on disposals of businesses net of transaction and separation costs (9) (227) -
Non-controlling interests (7) (6) (11)Net profit after income tax from discontinued operations attributable to Equity holders of the Bank 211 272 470
Full Year Ended (1)
(1) Comparative information has been restated to conform to presentation in the current year.
261

Strategic report
Financial performance
Risk management
Corporate governance
Directors’ report
Financial report
Other information
Notes to the financial statements
Earnings per share for profit from discontinued operations attributable to equity holders of the parent:
30 Jun 19 30 Jun 18 30 Jun 17
Earnings per share from discontinued operations:
Basic 11. 9 15. 5 27. 4
Diluted 11. 1 14. 5 25. 9
Full Year Ended (1)
Cents per Share
(1) Comparative information has been restated to conform to presentation in the current year.
Cash flow statement
30 Jun 19 30 Jun 18 30 Jun 17$M $M $M
Net cash used in operating activities (563) (543) (739)
Net cash from investing activities 809 1,080 1,120
Net cash used in financing activities (180) (659) (122)
Net cash (outflows)/inflows from discontinued operations 66 (122) 259
Full Year Ended (1) (2)
(1) Comparative information has been restated to conform to presentation in the current year. (2) Represents cash flows from the underlying businesses classified as discontinued operations and excludes proceeds from disposal.
262 Commonwealth Bank of Australia Annual Report 2019

Balance sheet
The balance sheet of the Group’s interest in CommInsure Life, Sovereign, BoCommLife, PTCL, CFSGAM and Count Financial are set out in the table below. TymeDigital SA did not meet the held for sale classification criteria as at 30 June 2018. Count Financial met the held for sale criteria as at 30 June 2019 but has not been reclassified as a discontinued operation.
30 Jun 19 30 Jun 18
Assets held for sale $M $M
Cash and liquid assets 354 108
Assets at fair value through Income Statement 10,417 11,867
Investment securities at fair value through other comprehensive income 260 -
Available-for-sale investments - 10
Intangible assets 2,049 1,372
Property, plant and equipment 1,510 1,225
Investment in associates and joint ventures 607 401
Deferred tax assets 145 13
Other assets 1,207 630
Total assets (2) 16,549 15,626
Liabilities held for saleInsurance policy liabilities 10,854 11,188
Deferred tax liabilities 404 763
Deposits and other public borrowings 1,268 871
Managed funds units on issue 2,197 1,698
Other liabilities 1,073 380
Total liabilities 15,796 14,900
As at (1)
(1) Intragroup balances have been eliminated; however it will impact the final gain/loss on disposal of the discontinued operations. (2) Includes assets of Count Financial classified as held for sale as at 30 June 2019 and assets of the businesses classified as discontinued operations. Excludes other
assets classified as held for sale.
As at 30 June 2019, the foreign currency translation reserve relating to discontinued operations was $69 million (30 June 2018: $63 million, 30 June 2017: $61 million); the investment securities revaluation reserve relating to discontinued operations was $11 million.
As at 30 June 2018 and 30 June 2017, the available-for-sale investments revaluation reserve relating to discontinued operations was $4 million and $13 million respectively.
263

Strategic report
Financial performance
Risk management
Corporate governance
Directors’ report
Financial report
Other information
Notes to the financial statements
This section includes other information about the Group’s operations that is disclosed to provide a more complete view of our business. It includes customer related commitments and contingent liabilities that arise in the ordinary course of business through certain lending arrangements. In addition, it covers the impact of adopting new accounting standards, notes to the statement of cash flows, lease commitments and remuneration of auditors. Finally, details of events that have taken place subsequent to the Balance Sheet date are provided.
Details of contingent liabilities and off Balance Sheet instruments are presented below and in Note 7.1. The face (contract) value, as disclosed below, represents the maximum amount that could be lost if the counterparty fails to meet its financial obligations. The credit equivalent amounts are a measure of potential loss to the Group in the event of non-performance by the counterparty. The credit commitments shown in the table below also constitute contingent assets. These commitments would be classified as loans and other assets in the Balance Sheet should they be drawn upon by the customer.
Group Face Value Credit Equivalent
30 Jun 19 30 Jun 18 30 Jun 19 30 Jun 18Credit risk related instruments $M $M $M $M Guarantees 6,506 6,265 5,387 5,185
Documentary letters of credit 326 761 322 753
Performance related contingents 4,722 4,610 2,362 2,531
Commitments to provide credit 162,202 162,090 154,408 157,636
Other commitments 2,050 1,470 2,040 1,470
Total credit risk related instruments 175,806 175,196 164,519 167,575
Bank Face Value Credit Equivalent
30 Jun 19 30 Jun 18 30 Jun 19 30 Jun 18Credit risk related instruments $M $M $M $M Guarantees 6,026 5,835 4,907 4,754
Documentary letters of credit 249 720 248 715
Performance related contingents 4,722 4,593 2,362 2,514
Commitments to provide credit 146,483 147,098 140,035 144,102
Other commitments 1,973 1,360 1,963 1,360
Total credit risk related instruments 159,453 159,606 149,515 153,445
264 Commonwealth Bank of Australia Annual Report 2019

Credit default financial guarantees are unconditional undertakings given to support the obligations of a customer to third parties. Other forms of financial guarantees include documentary letters of credit which are undertakings by the Group to pay or accept drafts drawn by a supplier of goods against presentation of documents in the event of payment default by a customer. Financial guarantees are recognised within other liabilities and are initially measured at their fair value, equal to the premium received. Subsequent to initial recognition, the Group’s liability under each guarantee is measured at the higher of the amount initially recognised less cumulative amortisation recognised in the Income Statement, and the expected credit loss recognised under AASB 9. Any increase in the liability relating to financial guarantees is recorded in the Income Statement. The premium received is recognised in the Income Statement in other operating income on a straight line basis over the life of the guarantee.
Performance related contingencies are undertakings that oblige the Group to pay third parties should a customer fail to fulfil a contractual non-monetary obligation. Performance related contingencies are performance guarantees and do not meet the definition of a financial guarantee, because they do not transfer credit risk. Performance guarantees are recognised when it is probable that an obligation has arisen. The amount of any provision is the best estimate of the amount required to fulfil the obligation.
Commitments to provide credit include all obligations on the part of the Group to provide credit facilities (unutilised credit lines or undrawn portions of credit lines) against which clients can borrow money under defined terms and conditions. Such loan commitments are made either for a fixed period, or are cancellable by the Group subject to notice conditions. As facilities may expire without being drawn upon, the notional amounts do not necessarily reflect future cash requirements. Under AASB 9 loan commitments must be measured with reference to the quantum of expected credit losses required to be recognised. In the case of undrawn loan commitments, the inherent credit risk is managed and monitored by the Group together with the drawn component as a single credit exposure. The exposure at default on the entire facility is therefore used to calculate the cumulative expected credit losses. Upon a loan drawdown by the counterparty, the amount of the loan is accounted for in accordance with accounting policies for loans and receivables.
Other commitments to provide credit include commitments with certain drawdowns, standby letters of credit and bill endorsements.
The details of the Group’s accounting policies and critical judgements and estimates involved in calculating the AASB 9 impairment provisions for the year ended 30 June 2019 are provided in Note 1.1.
Group Bank 30 Jun 19 30 Jun 18 30 Jun 19 30 Jun 18
$M $M $M $M Lease Commitments - Property, Plant and Equipment
Due within one year 673 681 626 619
Due after one year but not later than five years 1,805 1,764 1,668 1,593
Due after five years 1,600 1,811 1,466 1,658
Total lease commitments - property, plant and equipment 4,078 4,256 3,760 3,870
Lease arrangements
Operating leases are entered into to meet the business needs of entities in the Group. Leases are primarily over commercial and retail premises and plant and equipment.
Lease rentals are determined in accordance with market conditions when leases are entered into or on rental review dates. The total expected future sublease payments to be received are $77 million as at 30 June 2019 (2018: $88 million).
265

Strategic report
Financial performance
Risk management
Corporate governance
Directors’ report
Financial report
Other information
Notes to the financial statements
(a) Reconciliation of net profit after income tax to net cash provided by/ (used in) operating activities
Group Bank30 Jun 19 30 Jun 18 30 Jun 17 30 Jun 19 30 Jun 18
$M $M $M $M $MNet profit after income tax 8,590 9,348 9,952 7,783 8,875
(Increase)/decrease in interest receivable (36) (62) (14) 537 (17)
(Decrease)/increase in interest payable (69) 112 (26) (104) 243Net (increase)/decrease in assets at fair value through Income Statement (excluding life insurance) (4,935) 1,536 2,788 (3,089) 2,079
Net loss/(gain) on sale of controlled entities and associates 61 184 (2) 236 172
Net movement in derivative assets/liabilities 6,606 3,381 (492) 8,873 4,830
Net loss/(gain) on sale of property, plant and equipment 9 17 (6) 11 17
Equity accounting (profit)/loss (231) (287) (292) 63 7
Loan impairment expense 1,201 1,079 1,095 1,058 963Depreciation and amortisation (including asset write downs) 1,011 968 1,229 912 777
(Decrease)/increase in liabilities at fair value through Income Statement (excluding life insurance) (603) (258) 121 (1,013) (41)
Increase in other provisions 783 156 114 722 205
(Decrease)/increase in income taxes payable (1,082) (461) 603 (1,573) (484)
(Decrease)/increase in deferred tax liabilities (457) 400 (14) (27) -
Decrease/(increase) in deferred tax assets 67 (538) (573) (140) (106)(Increase)/decrease in accrued fees/reimbursements receivable (111) 20 (238) (53) (68)
(Decrease)/increase in accrued fees and other items payable (340) 631 18 (775) 801
Decrease in life insurance contract policy liabilities (787) (836) (1,240) - -
Cash flow hedge ineffectiveness (4) (4) (20) (6) 4
Loss/(gain) on changes in fair value of hedged items 558 (765) 799 (624) (763)
Dividend received - controlled entities and associates - - - (1,473) (2,085)Changes in operating assets and liabilities arising from cash flow movements 6,577 (15,461) (15,228) 7,157 (15,771)
Other 1,278 1,949 619 635 1,953
Net cash provided by/(used in) operating activities 18,086 1,109 (807) 19,110 1,591
(b) Reconciliation of cash
For the purposes of the Statements of Cash Flows, cash includes cash and money at short call.
Group Bank30 Jun 19 30 Jun 18 30 Jun 17 30 Jun 19 30 Jun 18
$M $M $M $M $MNotes, coins and cash at banks 16,930 17,110 14,836 15,633 15,586
Other short-term liquid assets 80 5,895 8,281 (99) 5,765
Cash and cash equivalents at end of year 17,010 23,005 23,117 15,534 21,351
266 Commonwealth Bank of Australia Annual Report 2019

(c) Non-cash financing and investing activities
Group30 Jun 19 30 Jun 18 30 Jun 17
$M $M $MShares issued under the Dividend Reinvestment Plan 748 2,105 1,143
(d) Disposal of controlled entities
Group30 Jun 19 30 Jun 18 30 Jun 17
$M $M $MNet assets 1,128 - -
Cash consideration received 1,304 - -
Cash and cash equivalents held in disposed entities 45 - -
During the financial year, the following fees were paid or payable for services provided by the auditor of the Group and the Bank, and its network firms:
Group Bank30 Jun 19 30 Jun 18 30 Jun 19 30 Jun 18
$'000 $'000 $'000 $'000a) Audit and audit related services
Audit services
PricewaterhouseCoopers Australian firm 23,858 21,292 16,776 14,040
Network firms of PricewaterhouseCoopers Australian firm 5,334 5,939 1,204 1,027
Total remuneration for audit services 29,192 27,231 17,980 15,067
Audit related services
PricewaterhouseCoopers Australian firm 3,809 4,416 2,630 3,736
Network firms of PricewaterhouseCoopers Australian firm 1,697 2,133 34 145
Total remuneration for audit related services 5,506 6,549 2,664 3,881
Total remuneration for audit and audit related services 34,698 33,780 20,644 18,948
b) Non-audit services
Taxation services
PricewaterhouseCoopers Australian firm 925 757 228 561
Network firms of PricewaterhouseCoopers Australian firm 470 1,508 266 481
Total remuneration for tax related services 1,395 2,265 494 1,042
Other Services
PricewaterhouseCoopers Australian firm 7,315 10,955 7,315 10,933
Network firms of PricewaterhouseCoopers Australian firm 600 66 3 -
Total remuneration for other services 7,915 11,021 7,318 10,933
Total remuneration for non-audit services 9,310 13,286 7,812 11,975
Total remuneration for audit and non-audit services (1) 44,008 47,066 28,456 30,923
(1) An additional amount of $10,497,464 (2018: $11,850,256) was paid to PricewaterhouseCoopers by way of fees for entities not consolidated into the Financial Statements. Of this amount, $7,521,734 (2018: $8,093,111) relates to audit and audit-related services.
267

Strategic Financial Risk Corporate Directors’ Financial Other report performance management governance report report information
Notes to the financial statements
The Audit Committee has considered the non-audit services provided by PricewaterhouseCoopers and is satisfied that the services and the level of fees are compatible with maintaining auditors’ independence. All such services were approved by the Audit Committee in accordance with pre-approved policies and procedures.
Audit related services principally include assurance and attestation relating to sustainability reporting and comfort letters over financing programmes as well as reviews of internal control systems.
Taxation services include assistance with tax software configuration as well as advice regarding tax returns and submissions, and Australia/foreign tax legislation.
Other services include benchmarking and process reviews on the Bank’s response to the Royal Commission, IT security assessments, and consulting services related to corporate transactions.
Adoption of AASB 16 ‘Leases’ On 1 July 2019, the Group adopted AASB 16 ‘Leases’ replacing the previous standard AASB 117 ‘Leases’. AASB 117 required leases to be classified as operating leases or finance leases according to their economic substance at inception of the lease. Finance leases were recognised on the Balance Sheet. Operating leases were not recognised on the Balance Sheet and rent payable was recognised as an expense over the lease term.
AASB 16 introduces a single accounting model for recognising and measuring lease arrangements. A contract contains a lease if it conveys the right to control the use of an identified asset for a period of time. Lessor accounting remains largely unchanged from the previous standard. Under lessee accounting, AASB 16 requires all leases to be recognised on the Balance Sheet, unless the underlying asset is of low value or the lease has a term of 12 months or less.
From 1 July 2019, the Group will recognise a ‘right-of-use asset’ representing its right to use leased assets and a ‘lease liability’, measured as the present value of future lease payments. The income statement will include depreciation of the right-of-use asset and interest expense on the lease liability over the lease term. Total lease expense recognised over the life of a lease remains unchanged as compared to AASB 117, however the timing of expense recognition changes, with a higher expense recognised in the earlier stages of a lease due to the interest expense being determined on the lease liability that amortises over the lease term.
The Group has applied the modified retrospective approach in adopting AASB 16, and measured the right-of-use asset for certain existing premises as if AASB 16 has always been applied. The resulting transition adjustments will be recognised in opening retained profits. For other leases, the right-of-use asset is measured as equal to the lease liability. Under this approach no restatement to comparative information is required. The adoption of AASB 16 is expected to increase assets by approximately $2,755 million and increase liabilities by approximately $2,951 million. This will result in a post-tax decrease in retained profits of $138 million and an increase in deferred tax asset of $58 million. This predominantly relates to leases over the Group’s commercial and retail premises. Management judgement applied in determining these values includes the determination of whether an arrangement contains a lease, the term of the lease, the discount rate and future lease cash flows.
Interest Rate Benchmark Reform
Interbank offered rates (IBORs), such as LIBOR, play a critical role in global financial markets, serving as reference rates for derivatives, loans and securities, and as parameters in the valuation of financial instruments. The global regulatory community has initiated various programmes to develop alternative benchmarks (known as “IBOR reform”) within certain jurisdictions. In response to the uncertainty about the long-term viability of these benchmark rates, the IASB announced in 2018 that it would establish a project to consider the financial reporting implications of the reform. It is expected to have an impact on various elements of financial instrument accounting, including hedge accounting, loan modifications, as well as fair value methodologies and disclosures. In May 2019, the IASB published an Exposure Draft Interest Rate Benchmark Reform which proposes exceptions to specific hedge accounting requirements in IFRS 9 and IAS 39. The IASB expects to issue final guidance later in 2019. The Group is monitoring these developments and continues to assess the expected impact.
268 Commonwealth Bank of Australia Annual Report 2019

Other Accounting Developments
AASB 17 ‘Insurance Contracts’, amends the accounting for insurance contracts and will replace AASB 4 ‘Insurance Contracts’, AASB 1023 ‘General Insurance Contracts’ and AASB 1038 ‘Life Insurance Contracts’. AASB 17 will apply to the Group from 1 July 2021. The impact of AASB 17 is dependent on the Group’s composition at the time of adoption. The Group is still assessing the impact of AASB 17.
AASB Interpretation 23 ‘Uncertainty over Income Tax Treatments’ (Interpretation 23) clarifies the recognition and measurement criteria where there is uncertainty over income tax treatments. It requires an assessment of each uncertain tax position to determine whether it is probable that a taxation authority will accept the position. Where it is not considered probable, the effect of the uncertainty will be reflected in determining the relevant taxable profit or loss, tax bases, unused tax losses, unused tax credits or tax rates. The amount will be determined as either the single most likely amount or the sum of the probability weighted amounts in a range of possible outcomes, whichever better predicts the resolution of the uncertainty. Judgements will be reassessed as and when new facts and circumstances are presented. Interpretation 23 will apply to the Group from 1 July 2019, and is not expected to have a significant impact on the Group.
A revised conceptual framework has been issued, which contains new definitions and recognition criteria for assets, liabilities, income and expenses in the framework. These changes will apply to the Group from 1 July 2020, where the criteria are not inconsistent with the specific requirements of an accounting standard. The changes are not expected to have a significant impact on the Group.
Other amendments to existing standards that are not yet effective are not expected to result in significant changes to the Group's accounting policies.
The Group adopted AASB 9 and AASB 15 on 1 July 2018. The Group’s current accounting policies for the recognition and measurement of financial assets are detailed in Notes 3.1, 3.2, 5.2, 5.3 and 5.4 and the recognition of revenue from contracts with customers is detailed in Note 2.3. A summary of accounting policies that applied to financial instruments and revenue recognition for the comparative periods is provided below.
Financial instruments
The Group classifies its financial assets in the following categories:
available-for-sale investments; loans and receivables; financial assets at fair value through the Income Statement; and derivative assets.
The classification of financial instruments at initial recognition depends on their purpose, characteristics and management’s intention when acquiring them.
Available-for-sale investments
The Group Available-for-sale (AFS) investments are non-derivative financial assets that are not classified at fair value through the Income Statement or as loans and receivables. They primarily include public debt securities held as part of the Group’s liquidity portfolio. Subsequent to initial recognition, AFS investments are measured at fair value with unrealised gains and losses arising from changes in fair value recognised in the AFS investment reserve within equity, net of applicable income taxes until such investments are sold, collected, otherwise disposed of, or become impaired. Interest, premiums and dividends are recognised in the Income Statement when earned. Foreign exchange gains and losses on AFS equity instruments are recognised directly in equity.
The Group assesses at each Balance Sheet date, whether there is any objective evidence of impairment as a result of one or more events which have an impact on the estimated future cash flows of the AFS investments that can be reliably estimated. For equity securities classified as an AFS investment, the main indicators of impairment are significant changes in the market, economic or legal environment and a significant or prolonged decline in fair value below cost. If any such evidence exists for AFS investments, cumulative losses are removed from equity and recognised in the Income Statement. If, in a subsequent period, the fair value of an AFS debt security increases and the increase can be linked objectively to an event occurring after the impairment event, the impairment is reversed through the Income Statement. Impairment losses on AFS equity securities are not reversed. Upon disposal, the accumulated change in fair value within the AFS investments reserve is transferred to the Income Statement and reported within Other Banking Income.
269

Strategic Financial Risk Corporate Directors’ Financial Other report performance management governance report report information
Notes to the financial statements
Financial instruments (continued)
Loans and receivables
Loans, bills discounted and other receivables are financial assets, with fixed and determinable payments that are not quoted in an active market. Loans, bills discounted and other receivables include overdrafts, home loans, credit card and other personal lending, term loans, discounted bills and finance leases. Loans and receivables are recognised on settlement date, when funding is advanced to the borrowers. The loans and receivables are initially recognised at their fair value plus directly attributable transaction costs such as broker fees. Subsequent to initial recognition, loans and receivables are measured at amortised cost using the effective interest method and are presented net of provisions for impairment. Discounted bills are included in this category due to their financing nature, however they meet the definition of a trading asset. They are measured at fair value through the Income Statement with directly attributable transaction costs expensed.
The Group assesses at each Balance Sheet date whether there is any objective evidence of impairment. If there is objective evidence that an impairment loss on loans and other receivables has been incurred, the amount of the loss is measured as the difference between the asset's carrying amount and the present value of the estimated future cash flows (excluding future credit losses that have not been incurred), discounted at the financial asset's original effective interest rate. Short-term balances are not discounted. Loans and other receivables are presented net of provisions for loan impairment.
Guarantees and other contingent liabilities are accounted for as off Balance Sheet items. Provisioning for these exposures is calculated under AASB 137 ‘Provisions, Contingent Liabilities and Contingent Assets’. Loan assets under committed lending facilities are not recognised until the facilities are drawn upon. However, the Group has determined that it is appropriate to establish provisions in relation to such facilities where a customer has been downgraded. These provisions are disclosed as other liabilities in the Balance Sheet.
Provisions for impairment of financial assets are raised to cover assessed credit related losses where there is objective evidence of impairment (i.e. where the Group does not expect to receive all of the cash flows contractually due). Individually assessed provisions against loans are subject to change as new information becomes available to reassess the level of impairment against a loan.
Loans and receivables that do not have an individually assessed provision are assessed collectively for impairment. The collective provision is maintained to reduce the carrying amount of portfolios of similar loans and receivables to their estimated recoverable amounts at the Balance Sheet date. Increases or decreases in the provision amount are recognised in the Income Statement.
Financial assets at fair value through the Income Statement
These assets are categorised as assets held for trading, insurance assets and other investments. Trading assets are those acquired for the purpose of selling or repurchasing in the near term. Insurance assets are investments that back life insurance and life investment contracts. Other assets are those that are designated at fair value through Income Statement at inception. Subsequent to initial recognition, financial assets are measured at fair value with changes in fair value recognised in Other Banking Income.
Derivative financial instruments
Derivatives are initially measured at fair value. Subsequent to initial recognition, gains or losses on derivatives are recognised in the Income Statement, unless they are entered into for hedging purposes and designated into a cash flow hedge.
Revenue recognition
Lending fees and commission income include:
Facility fees earned for managing and administering credit and other facilities for customers, which are recognised over the service period; Commitment fees to originate a loan that is unlikely to be drawn down which are recognised when the commitment is issued; and Fee income earned for providing advisory or arrangement services, placement and underwriting services, which are recognised when the
related service is completed.
Trading income represents both realised and unrealised gains and losses from changes in the fair value of trading assets, liabilities and derivatives, which are recognised in the period in which they arise.
Net gain/(loss) on non-trading financial instruments includes realised gains and losses from non-trading financial assets and liabilities (i.e. available-for-sale investments), as well as realised and unrealised gains and losses on non-trading derivatives that are held for risk management purposes.
Net gain/(loss) on the sale of property, plant and equipment is the difference between proceeds received and their carrying values.
Net hedging ineffectiveness is measured on fair value, cash flow and net investment hedges.
Dividends received on non-trading equity investments including controlled entities are recognised either on the ex-dividend date or when the right to receive payment is established.
270 Commonwealth Bank of Australia Annual Report 2019

Revenue recognition (continued) Net funds management operating income includes fees earned where the Group acts as the Responsible Entity, Trustee or Manager for a number of wholesale, superannuation, and investment funds or trusts. Management fees are recognised over the service period.
Performance fees are recognised when it is probable that the revenue will be received.
General insurance premiums received and receivable are recognised as revenue when they are earned, based on actuarial assessment of the likely pattern in which risk will emerge. The portion not yet earned based on the pattern assessment is recognised as unearned premium liability. Claims are recognised as an expense when the liability is established.
The Group recognises its share of the profits or losses from associate or joint venture investments, less any dividends received or impairment recognised.
Other income includes rental income on operating leases which are recognised on a straight line basis over the lease term. This is offset by depreciation and impairment expense on the associated operating lease assets held by the Group. For the Bank, this includes management fee income for services provided to subsidiaries.
Other income also includes the impact of foreign currency revaluations for foreign currency monetary assets and liabilities. These assets and liabilities are retranslated at the spot rate at balance date. Exchange differences arising upon settling or translating monetary items at different rates to those at which they were initially recognised or previously reported, are recognised in the Income Statement.
Dividend Reinvestment Plan (DRP) The Bank expects the DRP for the final dividend for the year ended 30 June 2019 will be satisfied in full by an on-market purchase and transfer of shares of approximately $683 million.
Completion of CFSGAM Sale
On 31 October 2018, the Group announced the sale of Colonial First State Global Asset Management (CFSGAM) to Mitsubishi UFJ Trust and Banking Corporation (MUTB). The sale of CFSGAM completed on 2 August 2019, resulting in final sale proceeds of $4.2 billion and a total post tax gain of $1.5 billion (inclusive of separation costs and subject to final tax calculations and completion adjustments).
Update on Aligned Advice businesses
Ceasing to provide licensee services through Financial Wisdom
The Group has decided to cease providing licensee services through Financial Wisdom and will proceed with an assisted closure. The Group will support advisers through an orderly transition to alternative arrangements, including self-licensing or joining another licensee. The Group will also continue to manage customer remediation arising from past issues at Financial Wisdom. The cost of customer remediation for Financial Wisdom has been included in customer remediation provisions recognised by the Group during the year.
Commonwealth Financial Planning Limited-Pathways (CFP-Pathways) advisers to transition to new licensee arrangements
In July 2019, the Group reached a decision to allow CFP-Pathways advisers to transition to self-licensing arrangements or move to another licensee.
The estimated pre-tax costs of supporting the Financial Wisdom and CFP-Pathways businesses, their advisers and their customers through this transition, as well as other internal project costs, is approximately $26 million.
Investment in Klarna Holding AB (Klarna) The Group has committed an investment of US$100 million into Klarna Holding AB (Klarna), as part of their US$460 million capital raise. The Group will become Klarna’s exclusive partner in Australia and New Zealand and intends to further invest at the parent and local level to support this partnership.
271

Strategic Financial Risk Corporate Directors’ Financial Other report performance management governance report report information
Directors’ declaration
The Directors of the Commonwealth Bank of Australia declare that in their opinion:
(a) the consolidated financial statements and notes for the year ended on 30 June 2019, as set out on pages 112 to 271, are in accordance with the Corporations Act 2001 (Cth), including:
(i) complying with the Australian Accounting Standards and any further requirements in the Corporations Regulations 2001; and
(ii) giving a true and fair view of the Group’s financial position as at 30 June 2019 and its performance for the year ended 30 June 2019;
(b) there are reasonable grounds to believe that the Commonwealth Bank of Australia will be able to pay its debts as and when they become due and payable.
Note 1.1 of the consolidated financial statements includes a statement of compliance with the International Financial Reporting Standards.
The Directors have been given the declarations required by section 295A of the Corporations Act 2001 (Cth) for the year ended 30 June 2019.
This declaration is made in accordance with a resolution of the Directors.
Catherine Livingstone AO Matt Comyn Chairman Managing Director and Chief Executive Officer 7 August 2019 7 August 2019
272 Commonwealth Bank of Australia Annual Report 2019

Independent auditor’s report To the members of the Commonwealth Bank of Australia
Report on the audit of the financial report
Our opinion In our opinion:
The accompanying financial report of the Commonwealth Bank of Australia (the Bank) and its controlled entities (together the Group) is in accordance with the Corporations Act 2001, including:
a. giving a true and fair view of the Bank's and Group's financial positions as at 30 June 2019 and of their financial performance for the year then ended; and
b. complying with Australian Accounting Standards and the Corporations Regulations 2001.
What we have audited The Bank and Group financial report comprises:
the Bank and the Group balance sheets as at 30 June 2019; the Bank and the Group income statements for the year then ended; the Bank and the Group statements of comprehensive income for the year then ended; the Bank and the Group statements of changes in equity for the year then ended; the Bank and the Group statements of cash flows for the year then ended; the notes to the financial statements, which include a summary of significant accounting
policies; and the directors’ declaration.
Basis for opinion We conducted our audit in accordance with Australian Auditing Standards. Our responsibilities under those standards are further described in the Auditor’s responsibilities for the audit of the financial report section of this report.
We believe that the audit evidence we have obtained is sufficient and appropriate to provide a basis for our opinion.
Independence We are independent of the Bank and the Group in accordance with the auditor independence requirements of the Corporations Act 2001 and the ethical requirements of the Accounting Professional and Ethical Standards Board’s APES 110 Code of Ethics for Professional Accountants (the Code) that are relevant to our audit of the financial report in Australia. We have also fulfilled our other ethical responsibilities in accordance with the Code.
PricewaterhouseCoopers, ABN 52 780 433 757 One International Towers Sydney, Watermans Quay, Barangaroo, GPO BOX 2650, SYDNEY NSW 2001 T: +61 2 8266 0000, F: +61 2 8266 9999, www.pwc.com.au Level 11, 1PSQ, 169 Macquarie Street, Parramatta NSW 2150, PO Box 1155 Parramatta NSW 2124 T: +61 2 9659 2476, F: +61 2 8266 9999, www.pwc.com.au
273

Commonwealth Bank of Australia Annual Report 2019274
Strategic report
Financial performance
Risk management
Corporate governance
Directors’ report
Financial report
Independent auditor’s report
Other information
Our audit approach
Bank and Group audit scope
We tailored the scope of our audit to ensure that we performed enough work to be able to give an opinion on the financial report as a whole, taking into account the geographic and management structure of the Bank and the Group, their accounting processes and controls and the industries in which they operate. We also ensured that the audit team had the appropriate skills and competencies needed for the audit of a complex financial services group. This included industry expertise in retail, business and institutional banking, and insurance and wealth management financial services, as well as specialists and experts in IT, actuarial, tax, treasury and valuation.
The Group is structured into 6 business segments being Retail Banking Services (RBS), Business and Private Banking (B&PB), Institutional Banking and Markets (IB&M), Wealth Management (WM), New Zealand (NZ), International Financial Services and Corporate Centre (IFS and Corporate Centre).
In designing our scope we considered the structure of the Bank and the Group and further identified those entities or business activities within each business segment for which the Bank and the Group prepares financial information for inclusion in the financial report (referred to as components).
The nature, timing and extent of audit work performed for each component was determined by the components’ risk characteristics and financial significance to the Bank and the Group and consideration of whether sufficient evidence had been obtained for our opinion on the financial report as a whole. This involved either:
an audit of the complete financial information of a component (full scope); an audit of one or more of the component’s account balances, classes of transactions or
disclosures (specified scope); analytical procedures performed at the Group level; or audit procedures at a Group level, including over the consolidation of the Group’s reporting
units and the preparation of the financial report.
Set out on the next page is an overview of our Bank and Group audit approach highlighting key aspects of our audit.

1 Full scope audits are performed for the purposes of standalone legal entity statutory financial reports as required.
Bank and Group materiality
The scope of our audit was influenced by our application of materiality. An audit is designed to provide reasonable assurance about whether the financial report is free from material misstatement. Items are considered material if individually or in aggregate, they could reasonably be expected to influence the economic decisions of the users taken on the basis of the financial report.
Based on our professional judgement, we determined certain quantitative thresholds for materiality, including the overall Bank and Group materiality for the financial report, which we have set out in the table below:
Overall Bank and $510 million (2018: $615 million) Group materiality
How we determined it Approximately 5% of 2019 financial year profit before tax (PBT) (2018: approximately 5% of 2018 financial year PBT) for the Bank.
Rationale for the materiality benchmark applied
We chose net profit before income tax because, in our view, it is the metric against which the performance of the Bank and the Group is most commonly measured and is a generally accepted benchmark in the financial services industry.
We performed our audit over both the Bank and the Group financial information concurrently. We apply the lower of materiality calculated based on the Bank or the Group PBT in order to avoid duplication of work. As the Bank has a lower PBT, we calculated materiality based on the Bank PBT and applied this during the audit of both the Bank and the Group.
We selected 5% based on our professional judgement noting that it is also within the range of commonly acceptable quantitative materiality measures.
275

Commonwealth Bank of Australia Annual Report 2019276
Strategic report
Financial performance
Risk management
Corporate governance
Directors’ report
Financial report
Independent auditor’s report
Other information
Key audit matters
Key audit matters are those matters that, in our professional judgement, were of most significance in our audit of the financial report for the current year. We describe each key audit matter and include a summary of the principal audit procedures we performed to address those matters in the table below.
The key audit matters were addressed in the context of our audit of the financial report as a whole, and in forming our opinion thereon, and we do not provide a separate opinion on these matters. Further, any commentary on the outcomes of a particular audit procedure is made in that context. We communicated the key audit matters to the Audit and Risk Committee. The key audit matters identified below relate to both the Bank and the Group audit with the exception of the valuation of insurance policy holder liabilities which relates only to the Group.
Key audit matter How our audit addressed the key audit matter
Loan impairment provisions (Bank and Group Level; Relevant components: RBS, B&PB, IB&M, NZ -ASB)
AASB 9 Financial Instruments was adopted by the Bank and the Group for the financial year beginning 1 July 2018.
Insofar as it applies to loan impairment provisions, AASB 9 introduces an expected credit loss (ECL) impairment model which takes into account forward-looking information reflecting potential future economic events. The Bank and the Group developed new models which are reliant on data as well as a number of estimates including the impact of multiple economic scenarios and other assumptions such as defining a significant increase in credit risk.
We considered this a key audit matter due to the subjective judgements made by the Bank and the Group in determining when to recognise impairment provisions including:
· Models used to calculate ECLs (ECL models) are inherently complex and judgement is applied in determining the appropriate construct of model to be applied; and
· A number of assumptions are made by the Bank and Group concerning the values of inputs to the ECL models and how inputs correlate with one another.
Provisions for impairment of loans that exceed specific thresholds are individually assessed by the Bank and the Group. These provisions are
We developed an understanding of the controls relevant to our audit over the following areas and assessed whether they were appropriately designed and were operating effectively throughout the year on a sample basis:
· Review and approval of forward looking information used in ECL models;
· Reliability and accuracy of critical data elements used in ECL models; and
· Review and approval of ECL model adjustments and the ECL loan impairment provisions by the Bank’s and the Group’s Loan Loss Provisioning Committee (LLPC).
In addition to controls testing, we along with PwC actuarial experts, performed the following audit procedures, amongst others on a sample basis:
· Assessed the ECL model methodology applied against general market practice and the results of model monitoring performed, including back-testing of actual losses against predicted losses;
· Considered the Bank’s and the Group’s judgements including the reasonableness of forward-looking information incorporated into the ECL

Key audit matter How our audit addressed the key audit matter
Loan impairment provisions (Bank and Group Level; Relevant components: RBS, B&PB, IB&M, NZ -ASB)
established based on the expected future cash repayments and estimated proceeds from the value of the collateral held by the Bank and the Group in respect of those loans. During the financial year ended 30 June 2019, the majority of the Bank’s and the Group’s individually assessed provisions for specific lending assets related primarily to business and corporate loans.
Relevant references in the financial report Refer notes 1.1 and 3.2 for further information.
models by assessing the forecasts, assumptions and probability weightings applied in the multiple economic scenarios;
· Agreed a sample of data used as input to the ECL models to relevant source documentations;
· Compared the modelled calculations to our own calculated expectations as determined by independently applying the model methodology; and
· Assessed the appropriateness of model adjustments identified by the Bank and the Group against internal and external supporting information.
For a selection of individually assessed provisions for specific lending assets, we performed the following audit procedures, amongst others:
· Examined cashflow forecasts supporting the impairment calculation by assessing judgements (in particular the amount and timing of recoveries) made by the Bank and the Group in the context of the borrowers’ circumstances based on the detailed loan and counterparty information known by the Bank and the Group; and
· Compared inputs in the Bank’s and the Group’s estimates (such as valuation of collateral held) to external information where available.
We also assessed the appropriateness of the Group’s disclosures against the requirements of Australian Accounting Standards.
277

Commonwealth Bank of Australia Annual Report 2019278
Strategic report
Financial performance
Risk management
Corporate governance
Directors’ report
Financial report
Independent auditor’s report
Other information
Key audit matter How our audit addressed the key audit matter
Judgemental valuation of financial instruments (Bank and Group Level; Relevant components: IB&M, NZ – ASB, WM – Colonial Mutual Life Assurance)
The Bank and Group hold financial instruments measured at fair value representing 14% of the total assets and 4% of the total liabilities of the Bank and 15% of the total assets and 4% of the total liabilities of the Group. The financial instruments held at fair value include:
· Derivative assets and liabilities; · Investment securities at fair value
though other comprehensive income; · Life insurance assets and liabilities;
and · Bills discounted and other assets and
liabilities designated at fair value.
The majority of the Bank’s and the Group’s financial instruments are considered to be non-complex in nature as fair value is based on prices and rates that can be easily observed in the relevant markets. On this basis the majority of the Bank’s and the Group’s financial instruments are classified under Australian Accounting Standards as either ‘Level 1’ (i.e. where key inputs to the valuation is based on quoted prices in the market) or ‘Level 2’ (i.e. where key inputs to the valuation is based on observable prices in the market). We considered these Level 1 and Level 2 financial instruments to be a key audit matter due to their financial significance to the Bank and the Group.
The Group also holds a limited number of financial instruments considered to be ‘Level 3’ in nature under Australian Accounting Standards (i.e. where key inputs to the valuation require additional judgement as observable inputs are not available in the market due to market illiquidity or complexity of the product) primarily in respect to complex derivatives, certain asset-backed securities and infrastructure funds. While the Bank’s and the Group’s holdings of such instruments is limited relative to total
We developed an understanding of the controls relevant to our audit over the following areas and assessed whether they were appropriately designed and were operating effectively throughout the year:
· Valuation model governance control framework;
· Completeness and accuracy of data inputs, including sourcing independent market data inputs;
· Methodology for the determination of fair value adjustments; and
· The Bank and Group’s assessment of its own models used to measure fair value.
In relation to the fair value of financial instruments as at 30 June 2019, together with PwC valuation experts, we compared the Bank’s and the Group’s calculation of fair value to our own independent calculation across a sample of financial instruments. This involved sourcing independent inputs from market data providers or external sources and using our own valuation models. We considered the results to assess whether there was evidence of systemic bias or error in the Bank and the Group’s calculation of fair value.

Key audit matter How our audit addressed the key audit matter
Judgemental valuation of financial instruments (Bank and Group Level; Relevant components: IB&M, NZ – ASB, WM – Colonial Mutual Life Assurance)
financial instrument holdings, we considered their valuation to be a key audit matter because there is more judgement involved in determining their value.
Relevant references in the financial report
Refer notes 1.1, 4.2, 5.2, 5.3, 5.4 and 9.5 for further information.
Key audit matter How our audit addressed the key audit matter
Provisions for customer remediation and project costs associated with regulatory compliance matters (Bank and Group level; Relevant components: All)
The Bank and the Group have assessed the need to raise provisions in relation to customer remediation payments, legal proceedings, project costs associated with compliance matters and investigations and reviews from its regulators including APRA’s Enforceable Undertaking, amongst others.
We considered this a key audit matter due to the subjective judgements required by the Bank and the Group in determining:
· the probability of financial outcomes based on available information;
· the estimate of customer remediation payment amounts; and
· the project costs associated with the remediation activities, and regulatory proceedings, investigations and reviews.
Relevant references in the financial report
Refer notes 1.1 and 7.1 for further information.
We developed an understanding of the Bank’s and the Group’s processes for identifying and assessing the impact of customer remediation payments, legal proceedings and project costs associated with compliance matters and investigations and reviews from its regulators.
We read the minutes of the Bank’s main governance meetings (i.e. Audit Committee, Risk Committee and Board of Directors), attended the Bank’s Audit and Risk Committee meetings and considered correspondence with relevant regulatory bodies.
We discussed ongoing legal matters with the directors and management. We obtained written representations from the Group Chief Executive Officer, Chief Financial Officer and Group General Counsel and obtained access to relevant documents in order to develop our understanding of the matters.
For material provisions, we considered the judgement as to whether there is potential material financial exposure for the Bank and the Group, and if so, the amount of any provision required. This included
· inspecting the Bank’s and the Group’s underlying calculations and assumptions made against available information; and
279

Commonwealth Bank of Australia Annual Report 2019280
Strategic report
Financial performance
Risk management
Corporate governance
Directors’ report
Financial report
Independent auditor’s report
Other information
Key audit matter How our audit addressed the key audit matter
Provisions for customer remediation and project costs associated with regulatory compliance matters (Bank and Group level; Relevant components: All)
· assessing assumptions in light of historical trends, if possible; or
· developing an understanding of the basis of estimating the provisions and discussing the assumptions, including costs of identifying and remediating affected customers.
Where the Bank and the Group determined that they were unable to reliably estimate the possible financial impact of a remediation activity or investigations, we considered relevant information available in relation to the activities and investigations to assess the appropriateness of this conclusion.
We also assessed the adequacy of related disclosures against the requirements of Australian Accounting Standards.
Key audit matter How our audit addressed the key audit matter
Valuation of insurance policyholder liabilities (Group Level; Relevant components: WM - Colonial Mutual Life Assurance)
We considered this a key audit matter because the Group’s valuation of the provisions for the settlement of future insurance claims involves complex and subjective judgements about future events, both internal and external to the business, for which small changes in assumptions can result in a material impact to the valuation of these liabilities. The Group’s insurance policyholder liabilities relate to the life insurance businesses.
In determining the valuation of the liabilities, the key actuarial assumptions made by the Group’s experts include:
· Expected amount, timing and duration of claims and/or policy payments, likely lapse rates of policies by policyholders, mortality and morbidity rates, acquisition and maintenance expenses; and
To assess the appropriateness of a selection of actuarial assumptions used to determine the value of insurance policyholder liabilities, we along with PwC actuarial experts performed the following audit procedures, amongst others:
· Compared the methodology and models used by the Group to those commonly applied in the insurance industry and recognised by regulatory standards;
· Developed an understanding of and evaluated the relevant controls the Group has in place over processes relating to the valuation of insurance policyholder liabilities. This included the Group’s use of models, the quality of oversight and controls over assumptions within those models, and the Group’s preparation of the

Key audit matter How our audit addressed the key audit matter
Valuation of insurance policyholder liabilities (Group Level; Relevant components: WM - Colonial Mutual Life Assurance)
· Long term economic assumptions manually calculated components of the including inflation rates. liability;
· Compared inputs (for example Relevant references in the financial inflation rates) used by the Group in report calculating the insurance policy
Refer note 1.1 and 11.3 for further information. liability to relevant supporting evidence, such as external market
WM – Colonial Mutual Life Assurance data;
business segment was classified as a discontinued operation as at 30 June 2019.
· Considered the impact of changes in assumptions and methodologies over the year and compared these to historical experience and industry trends;
· Compared the underlying supporting data relating to policyholder information used in the Group's valuation to source documentation; and
· Tested that all relevant policy data was included in the Group’s valuation models by reference to source systems.
Key audit matter How our audit addressed the key audit matter
Operation of financial reporting Information Technology (IT) systems and controls (Bank and Group Level; Relevant components: All)
We considered this a key audit matter because the Bank’s and the Group’s operations and financial reporting processes are heavily dependent on IT systems for the processing and recording of a significant volume of transactions.
In particular, in common with all banks, access rights to technology are important because they are intended to ensure that changes to applications and data are appropriately authorised. Ensuring staff have appropriate access to IT systems, and that access is monitored, are key controls in mitigating the potential for fraud or error as a result of a change to an application or underlying data.
For material financial statement balances we developed an understanding of the business processes, key controls and IT systems used to generate and support those balances. Our procedures included evaluating and testing the design and operating effectiveness of certain controls over the continued integrity of the IT systems that are relevant to financial reporting. This involved assessing:
· The technology control environment: the governance processes and controls used to monitor and enforce control consciousness throughout the Group’s technology teams;
· Change management: the processes and controls used to develop, test and
281

Commonwealth Bank of Australia Annual Report 2019282
Strategic report
Financial performance
Risk management
Corporate governance
Directors’ report
Financial report
Independent auditor’s report
Other information
Key audit matter How our audit addressed the key audit matter
Operation of financial reporting Information Technology (IT) systems and controls (Bank and Group Level; Relevant components: All)
The Bank’s and the Group’s controls over IT systems include:
· The framework of governance over IT systems;
· Program development and changes; · Access to process, data and IT
operations; and · Governance over generic and
privileged user accounts.
authorise changes to the functionality and configurations within systems;
· System development: the project disciplines which ensure that new systems are developed to meet a defined business need, are appropriately tested before implementation and that data is converted and transferred completely and accurately;
· Security: the access controls designed to enforce segregation of duties, govern the use of generic and privileged accounts or ensure that data is only changed through authorised means; and
· IT operations: the controls over key operations are used to ensure that any issues that arise are managed appropriately
For IT operations within the scope of our audit where technology services are provided by a third party, we considered:
· Assurance reports from the third party’s auditor on the design and operating effectiveness of controls; and
· Managements monitoring control over the third party.
We also carried out tests, on a sample basis, of system functionality that was key to our audit testing in order to assess the accuracy of certain system calculations, the generation of certain reports and the operation of certain system enforced access controls.
Where we noted design or operating effectiveness matters relating to IT systems and applications controls relevant to our audit, we performed alternative or additional audit procedures.

Other information The directors are responsible for the other information. The other information comprises the information included in the annual report for the year ended 30 June 2019, but does not include the financial report and our auditor’s report thereon.
Our opinion on the financial report does not cover the other information and accordingly we do not express any form of assurance conclusion thereon, with the exception of our limited assurance report over the Non-Financial Performance Metrics as detailed in pages 297 to 304 of the annual report.
In connection with our audit of the financial report, our responsibility is to read the other information and, in doing so, consider whether the other information is materially inconsistent with the financial report or our knowledge obtained in the audit, or otherwise appears to be materially misstated.
If, based on the work we have performed on the other information that we obtained prior to the date of this auditor’s report, we conclude that there is a material misstatement of this other information, we are required to report that fact. We have nothing to report in this regard.
Responsibilities of the directors for the financial report The directors of the Bank are responsible for the preparation of the financial report that gives a true and fair view in accordance with Australian Accounting Standards and the Corporations Act 2001 and for such internal controls as the directors determine is necessary to enable the preparation of the financial report that gives a true and fair view and is free from material misstatement, whether due to fraud or error.
In preparing the financial report, the directors are responsible for assessing the ability of the Bank and the Group to continue as a going concern, disclosing, as applicable, matters related to going concern and using the going concern basis of accounting unless the directors either intend to liquidate the Bank or the Group or to cease operations, or have no realistic alternative but to do so.
Auditor’s responsibilities for the audit of the financial report Our objectives are to obtain reasonable assurance about whether the financial report as a whole is free from material misstatement, whether due to fraud or error, and to issue an auditor’s report that includes our opinion. Reasonable assurance is a high level of assurance, but is not a guarantee that an audit conducted in accordance with the Australian Auditing Standards will always detect a material misstatement when it exists. Misstatements can arise from fraud or error and are considered material if, individually or in the aggregate, they could reasonably be expected to influence the economic decisions of users taken on the basis of the financial report.
A further description of our responsibilities for the audit of the financial report is located at the Auditing and Assurance Standards Board website at: http://www.auasb.gov.au/auditors_responsibilities/ar1.pdf. This description forms part of our auditor's report.
283

Commonwealth Bank of Australia Annual Report 2019284
Strategic report
Financial performance
Risk management
Corporate governance
Directors’ report
Financial report
Independent auditor’s report
Other information
Report on the Remuneration Report
Our opinion on the Remuneration Report We have audited the information on pages 87 to 106 included as part of the Remuneration Report on pages 82 to 106 of the Directors’ Report for the year ended 30 June 2019.
In our opinion, the Remuneration Report complies with section 300A of the Corporations Act 2001.
Responsibilities The directors of the Bank are responsible for the preparation and presentation of the Remuneration Report in accordance with section 300A of the Corporations Act 2001. Our responsibility is to express an opinion on the Remuneration Report, based on our audit conducted in accordance with Australian Auditing Standards.
PricewaterhouseCoopers
Matthew Lunn Sydney Partner 7 August 2019