c.banner international holdings ltd.€¦ · c.banner international holdings ltd. (hkex stock...
TRANSCRIPT

C.banner International Holdings Ltd.(HKEx Stock Code:1028)
March 2013
2012 Results Announcement

1/25
Disclaimer
This document has been prepared by C.banner International Holdings Limited (the “Company”) solely for use at this
presentation and is subject to change without notice. Its accuracy is not guaranteed and it may not contain all material
information concerning the Company. The Company makes no representation regarding, and assumes no responsibility or
liability for, the accuracy or completeness of, or any errors or omissions in, any information contained herein.
This presentation contains forward-looking statements that involve risks and uncertainties. All statements other than
statements of historical facts are forward-looking statements. These statements involve known and unknown risks,
uncertainties and other factors that may cause the actual results, performance or achievements of the Company to be
materially different from those expressed or implied by the forward-looking statements. You should not rely upon forward-
looking statements as predictions of future events. This presentation speaks as of the date hereof. We undertake no
obligation to update or revise any forward-looking statements, either as a result of new information, future events or
otherwise.
This presentation does not constitute an offer or invitation to purchase or subscribe for any securities or financial instruments
or to provide any investment service or investment advice, and no part of it shall form the basis of or be relied upon in
connection with any contract, commitment or investment decision in relation thereto..

2/25
C.banner: A leading multi-brand retailer of mid-to-premium women’s footwear in China
Total Revenue(RMB Mn)
(RMB Mn, %)
Gross Profit and Gross Profit Margin
Company Overview
Financial Highlights
Brand Portfolio
Self-developed
brands
Licensed
brand
The second largest retailer of mid-to-premium women’s formal and casual footwear in China
Distribution Network
1,556 proprietary outlets and 610 third-party outlets in China
1044.01284.9
1575.0
2043.7
2432.2
2008 2009 2010 2011 2012
564.6651.2
972.3
1298.3
1539.5
54.10% 50.70%
61.70%
63.50%
63.30%
2008 2009 2010 2011 2012毛利润 毛利率

3/25
1. Financial Highlights
2. Business Review
3. Future Strategies
4. Appendix
1. Financial Highlights
5/25
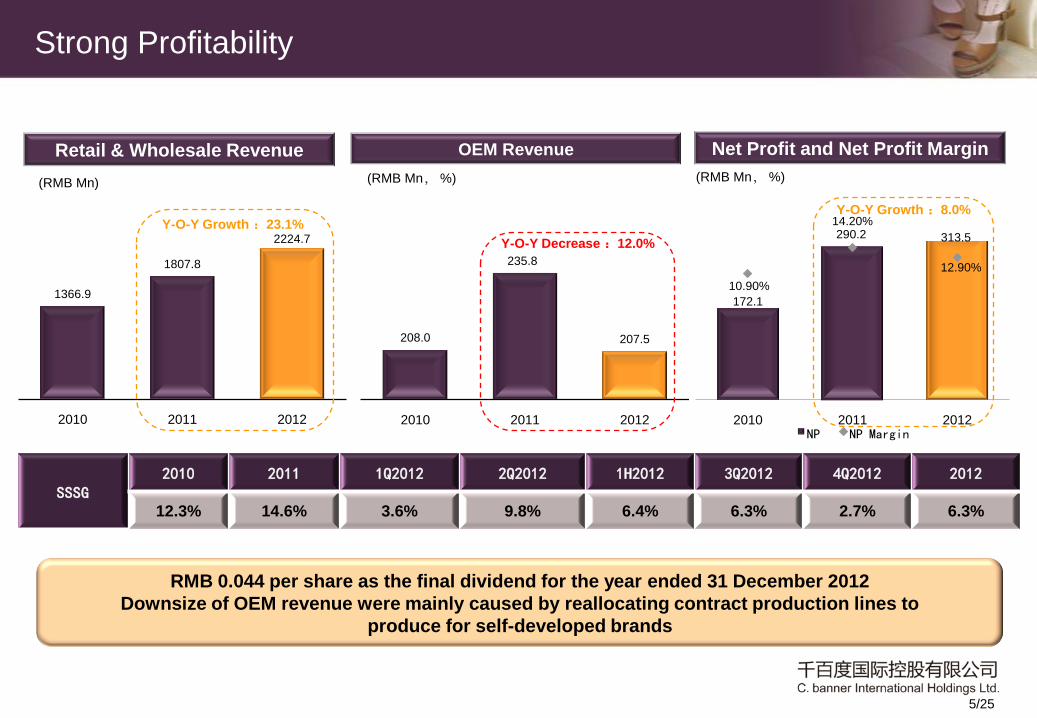
Strong Profitability
Retail & Wholesale Revenue
(RMB Mn)
RMB 0.044 per share as the final dividend for the year ended 31 December 2012
Downsize of OEM revenue were mainly caused by reallocating contract production lines to
produce for self-developed brands
OEM Revenue Net Profit and Net Profit Margin
(RMB Mn, %) (RMB Mn, %)
172.1
290.2 313.5
10.90%
14.20%
12.90%
2010 2011 2012NP NP Margin
1366.9
1807.8
2224.7
2010 2011 2012
208.0
235.8
207.5
2010 2011 2012
Y-O-Y Decrease :12.0%
Y-O-Y Growth :8.0%Y-O-Y Growth :23.1%
SSSG2010 2011 1Q2012 2Q2012 1H2012 3Q2012 4Q2012 2012
12.3% 14.6% 3.6% 9.8% 6.4% 6.3% 2.7% 6.3%

6/25
Revenue Breakdown by Business and Retail Revenue
Revenue Mix Retail Revenue Breakdown
2011 20112012 2012
The rising proportion of the retail business with higher profit margin and the launching of
“sundance” and “MIO” brands will help consolidate the retail and wholesale business
Retail & Wholesale
88.5%
OEM
11.5%
Retail & Wholesale
91.5%
OEM
8.5%
C.banner
65.9%
EBLAN
24.2%
naturalizer
4.0%
sundance
5.4%
EBLAN
25.1%
naturalizer
3.9%
sundance
1.1%
C.banner
69.9%
MIO
0.5%

7/25
Strong Profitability
RMB Mn 2010 2011 2012
Cost of Sales 602.7 745.4 892.7
As % of Sales 38.3% 36.9% 36.7%
Distribution and
Selling Expenses 653.0 817.8 1040.5
As % of Sales 41.5% 40.0% 42.8%
Administrative and General
Expenses 84.8 74.4 111.0
As % of Sales 5.4% 3.6% 4.6%
Other Income and Gains 9.1 2.9 56.6
As % of Sales 0.6% 0.1% 2.3%
Breakdown of Costs
Other income and gains of 2012 was mainly constituted by
Government Tax returns and bank deposit interest income
EBIT and Margin (RMB mn, %)
243.6
409.0
444.6
15.50%
20.00%18.28%
2010 2011 2012
EBIT EBIT Ratio
8/25
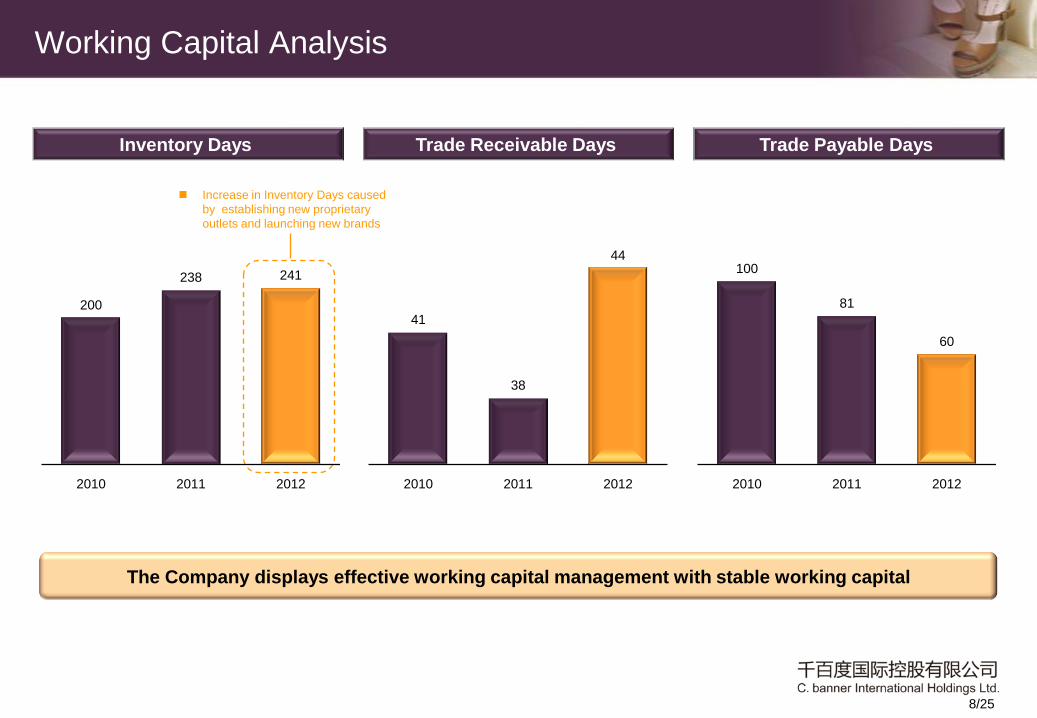
Working Capital Analysis
The Company displays effective working capital management with stable working capital
Inventory Days Trade Receivable Days Trade Payable Days
Increase in Inventory Days caused
by establishing new proprietary
outlets and launching new brands
200
238 241
2010 2011 2012
41
38
44
2010 2011 2012
100
81
60
2010 2011 2012

2. Business Review

10/25
Business Review
1.
2.
3.
4.
5.
Strong Fundamentals - High Growth in Women’s Footwear Market
Expanding Nationwide Distribution Network
Vertically Integrated Model and Responsive Supply Chain
Effective Marketing Strategies
Customer-oriented Research and Development
Leader in Most Attractive Segment
Multi-brand Portfolio for Diversified Market Segmentation
6.
7.
Steady Growth in Outlets
8.

11/25
High Growth of Women’s Footwear Market in China1.
Women's Footwear
Outpacing Other Segments
Mid-to-Premium
Gaining Market Share
Rising Urbanization
Uplift Trend of the Retail Sales of
Mid-to-Premium Women’s Footwear
26,941 29,27733,137
37,93043,161
48,18053,418
59,200
0
10,000
20,000
30,000
40,000
50,000
60,000
70,000
2008 2009 2010 2011 2012F 2013F 2014F 2015F
11.8%
11.1%
CAGR (2008-2011) CAGR (2011-2015)Mid-to-Premium
Low-end 9.3%
Middle-end
(RMB mn)
12.1%
11.5%
9.4%
62,403
64,512
66,978
69,079 47.0%
48.3%
49.9%
51.3%
44.0%
45.0%
46.0%
47.0%
48.0%
49.0%
50.0%
51.0%
52.0%
58,000
60,000
62,000
64,000
66,000
68,000
70,000
2008 2009 2010 2011Urban Population
Urbanization rate(mn)
98,995106,609
119,133134,861
0
20,000
40,000
60,000
80,000
100,000
120,000
140,000
160,000
2008 2009 2010 2011
CAGR (2008-2011)
Men ChildrenWomen
10.5% 10.9% 7.6%
(RMB mn)
Women Becoming
Financially Independent
10,14711,154
12,15713,944
02,0004,0006,0008,000
10,00012,00014,00016,000
2008 2009 2010 2011
Disposable Income per Capita of Women (RMB)
27.2%27.5%
27.8%28.1%
28.5%28.8%
29.0%29.2%
26.0%
26.5%
27.0%
27.5%
28.0%
28.5%
29.0%
29.5%
2008 2009 2010 2011 2012F 2013F 2014F 2015F
Progressive decrease of Middle-end
and Low-end segments in next 5 years
Information in this presentation on the women’s footwear market in the PRC is from independent market research carried out by
Euromonitor International Ltd. but should not be relied upon in making, or refraining from making, any investment decision.

12/25
Leader in Most Attractive Segment
2nd Largest Retailer in the Mid-to-Premium Women’s Formal and Casual Footwear Market
2.
Increasing market share, from
4.7% in 2008 to 7.4% in 2011 (1)
Multi-brand strategy to meet
market demand
Focused on department
stores, the primary retail
channel for mid-to-premium
women’s footwear in China
Supported by strong marketing
campaigns
Top Five Retailers of Mid-to-Premium Women’s Formal and
Casual Footwear in China
Company Market Share(1) Major Brands
50.5%
7.4%
4.8%
4.0%
3.8%
(1): according to Euromonitor, as measured by its 2011 retail revenue.
Information in this presentation on the women’s footwear market in the PRC is from independent market research carried out
by Euromonitor International Ltd. but should not be relied upon in making, or refraining from making, any investment decision.

13/25
Multiple Brands Targeting A Broad Customer Base in the Mid-to-Premium Formal and Casual Segment
Multi-brand Portfolio for Diversified Market Segmentation3.
(1): according to Euromonitor, based on 2011 retail revenue.
PositioningLaunchedCustomer Base
(Age)
Price Range
(RMB)Highlight
2H 2007 25-44 650-3,000Casual/
Comfortable
A leading women’s footwear
brand in the US
2011
Fashion/Business
/Business Casual1996 20-40 500-2,500
4th largest brand in the mid-
to-premium formal and
casual segment (1)
2011
Fashion/Business
/Business Casual2004 20-35 500-2,500
45.4% CAGR of retail
revenue from 2008 to 2011
2011
CasualAugust 2011 18-35 400-2,200
Over 150 retail stores
as of June 30, 2012
January 2012 22-28 800-3,000Over 80 retail stores
as of June 30, 2012
Premium Fashion/
Business/Business
Casual

14/25
Total
Expanding Nationwide Distribution Network4.
Note: all data as of December 31, 2012
1,556 proprietary outlets and
610 third-party outlets across China
0-20 Outlets
20-40 Outlets
40-60 Outlets
60-200 Outlets
200+ Outlets
Primarily located in first-
to-third-tier cities
─ To target at the
customers with
stronger spending
power
Focus on department
stores
─ 1,553 department
store outlets and 3
independent store
outlets
Proprietary Outlets
77
444
828
1,556
184
Third-party Outlets
Primarily located in
other cities
– To expand in a cost-
effective manner
Established by
authorized distributors
– 250 authorized
distributors
-
123
366
610
8
23 113

15/25
Steady Growth in Outlets
Robust sales growth is driven by extensive sales network of both self-developed brands and licensed brand
5.
2008 2009 2010 2011 2012
Proprietary 494 544 623 735 828
Third-Party 160 194 230 311 366
Total 654 738 853 1,046 1,194
2008 2009 2010 2011 2012
Proprietary 188 210 307 412 444
Third-Party 46 65 87 122 123
Total 234 275 394 534 567
2008 2009 2010 2011 2012
Proprietary 40 32 42 67 77
Third-Party
Total 40 32 42 67 77
2008 2009 2010 2011 2012
Proprietary 97 184
Third-Party 4 8
Total 101 192
2008 2009 2010 2011 2012
Proprietary 23
Third-Party 113
Total 136
16/25
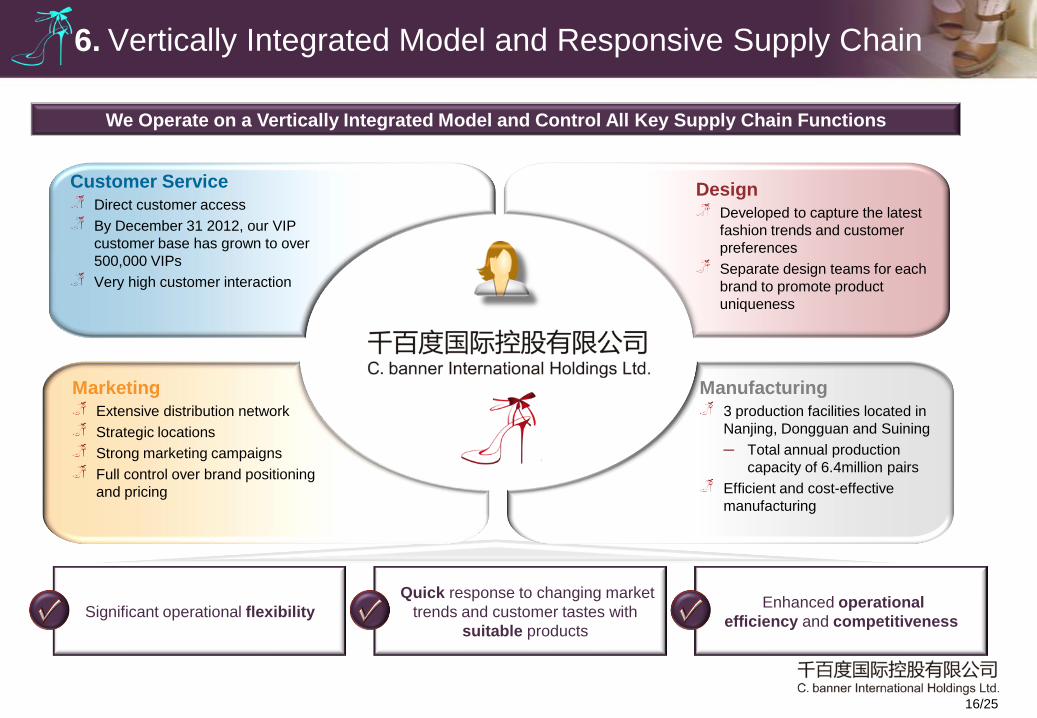
We Operate on a Vertically Integrated Model and Control All Key Supply Chain Functions
Significant operational flexibility
Quick response to changing market
trends and customer tastes with
suitable products
Enhanced operational
efficiency and competitiveness
Design
Developed to capture the latest
fashion trends and customer
preferences
Separate design teams for each
brand to promote product
uniqueness
Customer Service
Direct customer access
By December 31 2012, our VIP
customer base has grown to over
500,000 VIPs
Very high customer interaction
Manufacturing
3 production facilities located in
Nanjing, Dongguan and Suining
─ Total annual production
capacity of 6.4million pairs
Efficient and cost-effective
manufacturing
Marketing
Extensive distribution network
Strategic locations
Strong marketing campaigns
Full control over brand positioning
and pricing
Vertically Integrated Model and Responsive Supply Chain6.

17/25
Effective Marketing Strategies7.
Brand Events
Diversified marketing campaigns focusing on the mid-to-premium women’s footwear
in China. Emphasis on the interaction with customers and enhance brand recognition.
Thematic Photos

18/25
Promotion Activities
Effective Marketing Strategies (Cont’d)7.
Magazines and TV Commercials
Enhancement of brand awareness and reputation through exhibition in department
stores and advertisement promotions in renowned magazines

19/25
Total GFA of approx. 15,000 m2
Located at Foshan, next to Guangzhou, the hub of
China’s footwear industry
Designs 2,000-2,400 SKUs per year for
each of our self-developed brands
Market
Research
Product
Design
Product
Development
Determine the manufacturing process and cost
Further discussions to rectify any problems
discovered in the manufacturing process
Determine quantities of subsequent batches
based on consumer response and weekly sales
records
Customer-oriented Research and Development8.
Design managers for our self-developed brands,
on average, have over10 years footwear design experience
Regularly attend trade exhibitions and conduct
field studies in Hong Kong and Europe; and
collect market information from professional
websites and publications
Customer focused designs targeting at a
broad customer base with differentiated
products
Decide on seasonal themes including styles,
colors, materials and other features; Create
sample shoes to be tried on by models to test
for proper fitting and wearing comfort
Our creative and R&D director collaborate
together to launch a series of shoe designs
closely tracking international fashion trends
Strategically Located R&D Center with Strong Design Capacity Systematic Research, Design and Development Capabilities

3. Future Strategies

21/25
Future Strategies
Increase Channel Quality
Strengthen Product Management
Strengthen Staff Management
Improve Sales and Marketing
Capability
VIP Program – Improve Shopping
Experience
Multi-brand Portfolio to
Increase Market Share
1-2 New Brands in 2013
Generate Synergies
Expand business in a time
efficient manner
Enhance competitiveness and
strengthen market position
Expand Manufacturing Facilities
Optimize Inventory Level
Upgrade Business Intelligence
System
Develop Strategic Relationship
with Suppliers
New Outlets Opening in 2013
- Proprietary Outlets: around 200
- Third Party Outlets: around 100
Network Expansion

22/25
Briefing of New Cooperation Brand
Project Brief
On March 21 2013, the Company entered into the
distribution agreement with Dongguan Highline and
J.C. to appoint Nanjing Mayflower, one of the
Company’s wholly-owned subsidiaries as a principal
distributor of ASH and JC brand ladies footwear in
mainland, China.
Expansion Plan
Nanjing Mayflower will take over the operation of over
100 existing ASH and JC stores, and the stores of two
brands will reach around 200 in the next three years.

23/25
Customer Base (Age):18-28
Price Range:RMB1300-3500
Positioning:Fashion, Trendsetter, Casual
Customer Base (Age):22-32
Price Range:RMB1000-2800
Positioning:Concise, Sexy, Delicate, Taste
Briefing of New Cooperation Brand (Cont’d)

4. Appendix
25/25
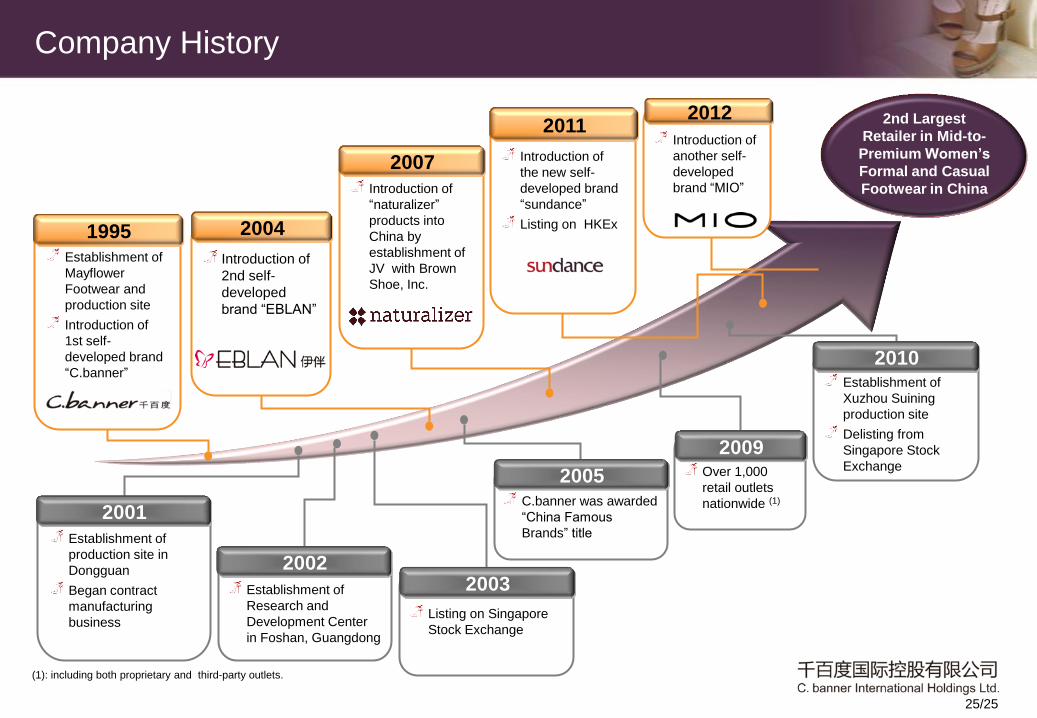
2nd Largest
Retailer in Mid-to-
Premium Women’s
Formal and Casual
Footwear in ChinaIntroduction of
“naturalizer”
products into
China by
establishment of
JV with Brown
Shoe, Inc.
Introduction of
the new self-
developed brand
“sundance”
Listing on HKEx
C.banner was awarded
“China Famous
Brands” title
Listing on Singapore
Stock Exchange
Over 1,000
retail outlets
nationwide (1)
Establishment of
Research and
Development Center
in Foshan, Guangdong
Establishment of
production site in
Dongguan
Began contract
manufacturing
business
Establishment of
Mayflower
Footwear and
production site
Introduction of
1st self-
developed brand
“C.banner”Establishment of
Xuzhou Suining
production site
Delisting from
Singapore Stock
Exchange
Introduction of
2nd self-
developed
brand “EBLAN”
2009
2010
2011
2007
20041995
2001
20022003
2005
Company History
Introduction of
another self-
developed
brand “MIO”
2012
(1): including both proprietary and third-party outlets.
26/25
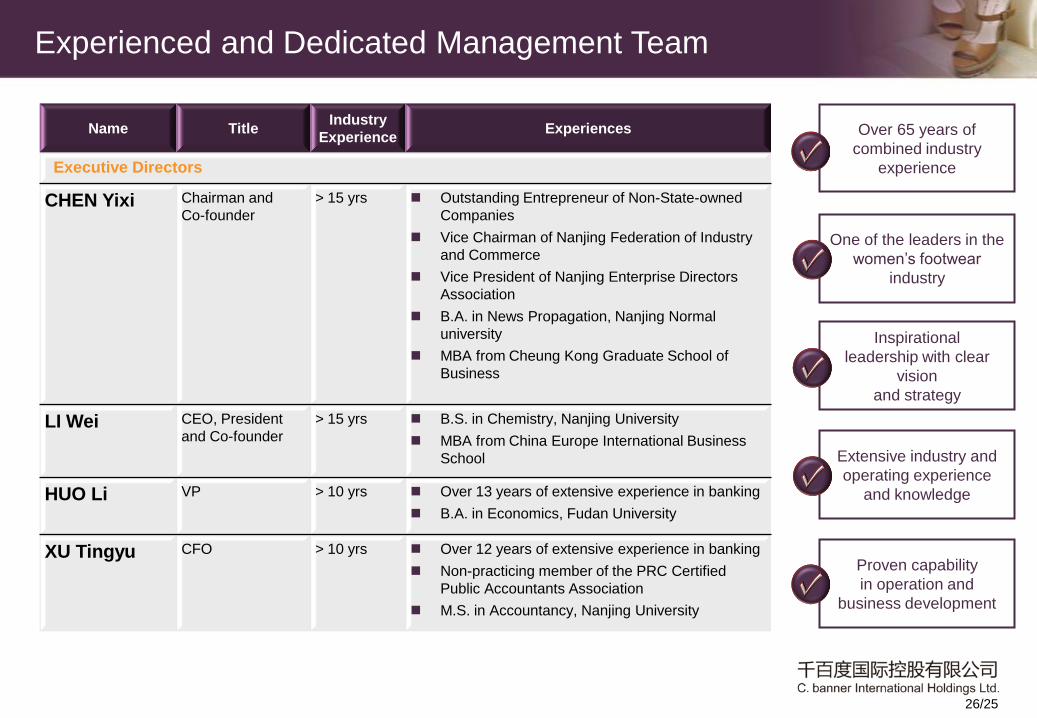
Over 65 years of
combined industry
experience
Inspirational
leadership with clear
vision
and strategy
Proven capability
in operation and
business development
Extensive industry and
operating experience
and knowledge
One of the leaders in the
women’s footwear
industry
Name TitleIndustry
ExperienceExperiences
Executive Directors
CHEN Yixi Chairman and
Co-founder
> 15 yrs Outstanding Entrepreneur of Non-State-owned
Companies
Vice Chairman of Nanjing Federation of Industry
and Commerce
Vice President of Nanjing Enterprise Directors
Association
B.A. in News Propagation, Nanjing Normal
university
MBA from Cheung Kong Graduate School of
Business
LI Wei CEO, President
and Co-founder
> 15 yrs B.S. in Chemistry, Nanjing University
MBA from China Europe International Business
School
HUO Li VP > 10 yrs Over 13 years of extensive experience in banking
B.A. in Economics, Fudan University
XU Tingyu CFO > 10 yrs Over 12 years of extensive experience in banking
Non-practicing member of the PRC Certified
Public Accountants Association
M.S. in Accountancy, Nanjing University
Experienced and Dedicated Management Team