cber selecting the appropriate statistical distribution for a primary analysis p. lachenbruch
TRANSCRIPT

CC BBEE RR
Selecting the Appropriate Statistical Distribution for a
Primary Analysis
P. Lachenbruch
CC BBEE RR
A Study of Xeroderma Pigmentosa (XP)
A characteristic of XP is the formation of Actinic Keratoses (AK s )
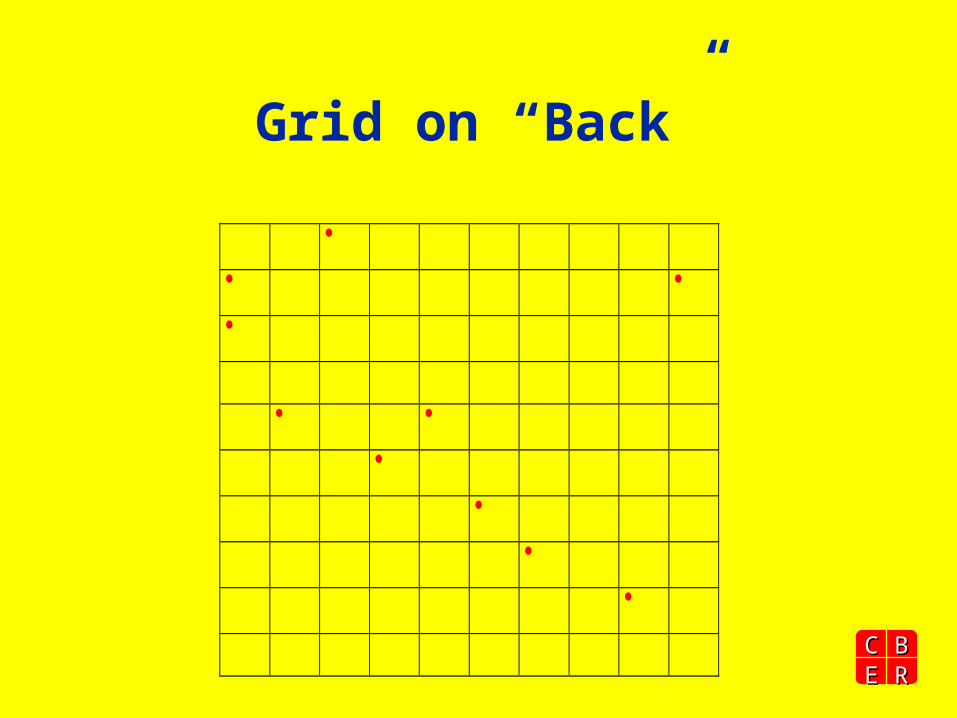
Multiple lesions appear haphazardly on a patient’s back
The rate of appearance may not be the same for different patients

CC BBEE RR
Background
Analysis: Rank Sum test. Late in study the Statistical
Analysis Plan (SAP) was amended to use Poisson regression
Unclear if stepwise selection of covariates was planned a priori

CC BBEE RR
Study Results
Poisson regression analysis showed highly significant treatment difference (p=0.009) adjusting for baseline AK, age, and age x treatment interaction (stepwise selection)
All these effects were highly significant.
Substantial outlier problem
CC BBEE RR
Assumptions
• Each patient has the same incidence rate, per area unit.
• Chance of more than one AK in small area unit is negligible.
• Non-overlapping lesions are independent, that is, lesions occurring in one area of the body are not affected by those occurring in another area.
CC BBEE RR
Outliers
Outliers are observations that are jarringly different from the remainder of the data
• May be multiple outliers• If frequency is large, this may be
evidence that we have a mixture distribution.
Can substantially affect analysis

CC BBEE RR
Analyses
Two-Sample Wilcoxon rank-sum (Mann-Whitney) test
trt | obs rank sum expected--------+--------------------------------- 0 | 9 158 135 1 | 20 277 300--------+---------------------------------Combined| 29 435 435
unadjusted variance 450.00adjustment for ties -15.07 ----------adjusted variance 434.93
Ho: ak12tot(trt==0) = ak12tot(trt==1) z = 1.103 Prob > |z| = 0.2701

CC BBEE RR
Distribution of AK Data at Baseline (Stem and Leaf)
(Yarosh et al, Lancet)
Lead | Trailing digits
0* | 00000000000000000011223335 // 4* | 27 // 10* | 0 oops!
Lead | Trailing digits
0* | 00000000000000000011223335 // 4* | 27 // 10* | 0 oops!
CC BBEE RR
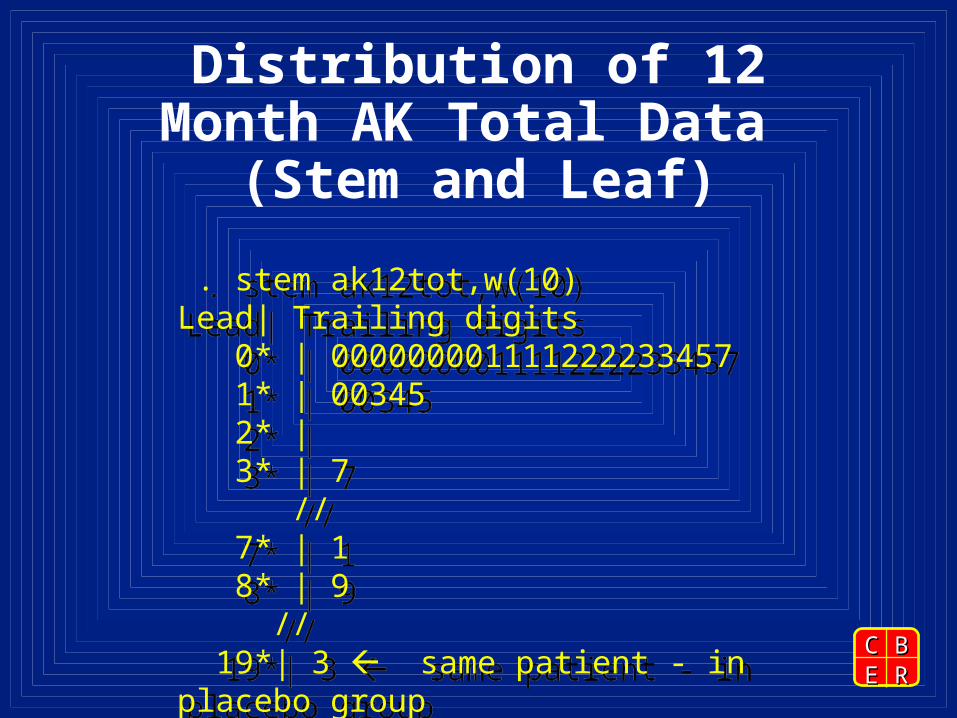
Distribution of 12 Month AK Total Data
(Stem and Leaf)
. stem ak12tot,w(10)Lead| Trailing digits 0* | 000000001111222233457 1* | 00345 2* | 3* | 7 // 7* | 1 8* | 9 // 19*| 3 same patient - in placebo group
. stem ak12tot,w(10)Lead| Trailing digits 0* | 000000001111222233457 1* | 00345 2* | 3* | 7 // 7* | 1 8* | 9 // 19*| 3 same patient - in placebo group

CC BBEE RR
Results of Poisson Analyses
Poisson regression Number of obs = 29 LR chi2(3) = 1044.65 Prob > chi2 = 0.0000Log likelihood = -127.46684 Pseudo R2 = 0.8038
---------------------------------------------------------- ak12tot | Coef. Std. Err. z P>|z| [95% Conf. Interval]---------+------------------------------------------------ age | .017 .0056 3.00 0.003 .0058 .0276 trt | .532 .167 3.20 0.001 .2061 .859 akb | .045 .0019 23.10 0.000 .0409 .0485 _cons | .658 .219 3.00 0.003 .2282 1.0878---------------------------------------------------------- G-O-F in control group, 2 =1222.5 with 8 d.f. G-O-F in treatment group, 2 =682.5 with 19 d.f.

CC BBEE RR
Permutation Test
Procedure: Scramble treatment codes and redo analysis. Repeat many (5,000?) times.
Count number of times the coefficient for treatment exceeds the observed value.

CC BBEE RR
Command and Output
. permute trt "permpois trt ak12tot age akb" rtrt=rtrt rage=rage rakb=rakb ,reps(5000) d
command: permpois trt ak12tot age akbstatistics: rtrt = rtrt rage = rage rakb = rakbpermute var: trtMonte Carlo permutation statistics Number of obs = 30 Replications = 5000
----------------------------------------------------------T | T(obs) c n p=c/n SE(p) -------------+--------------------------------------------rtrt | .5324557 2660 5000 0.5320 0.0071 rage | .0167116 3577 5000 0.7154 0.0064 rakb | .0446938 1118 5000 0.2236 0.0059 ----------------------------------------------------------Note: c = #{|T| >= |T(obs)|}I deleted the confidence intervals for the proportions
CC BBEE RR
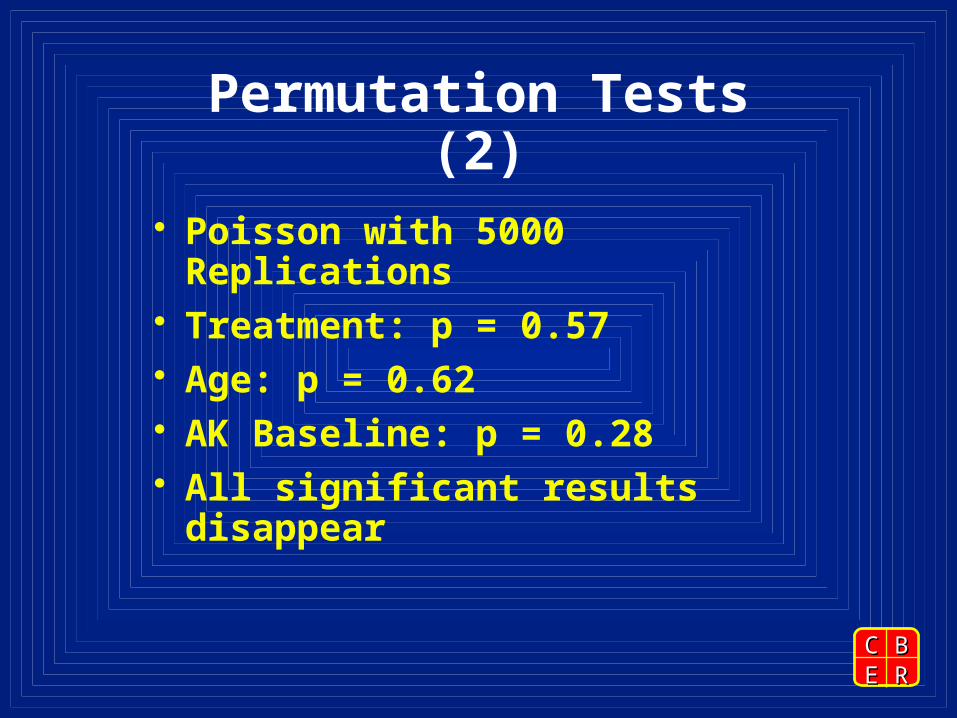
Permutation Tests (2)
Poisson with 5000 Replications Treatment: p = 0.57 Age: p = 0.62 AK Baseline: p = 0.28 All significant results disappear

CC BBEE RR
Results of Poisson Analysis
Sponsor found that all terms were highly significant (including the treatment x age interaction).
We reproduced this analysis. We also did a Poisson goodness-of-fit
test that strongly rejected the assumption of a Poisson distribution.
What does a highly significant result mean when the model is wrong?
CC BBEE RR
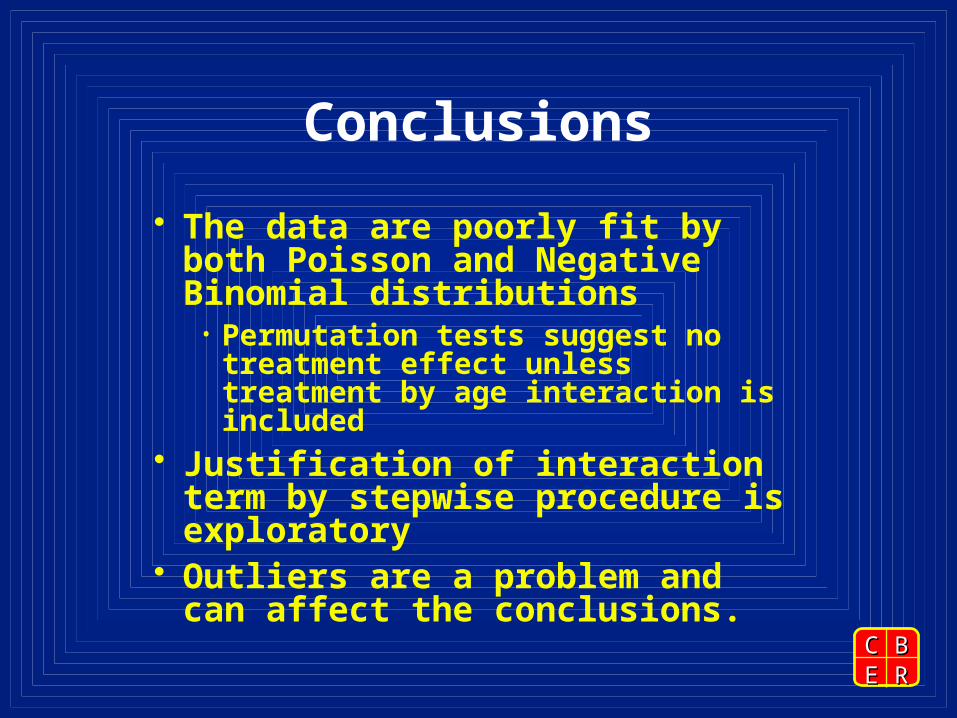
Conclusions
The data are poorly fit by both Poisson and Negative Binomial distributions
• Permutation tests suggest no treatment effect unless treatment by age interaction is included
Justification of interaction term by stepwise procedure is exploratory
Outliers are a problem and can affect the conclusions.
CC BBEE RR
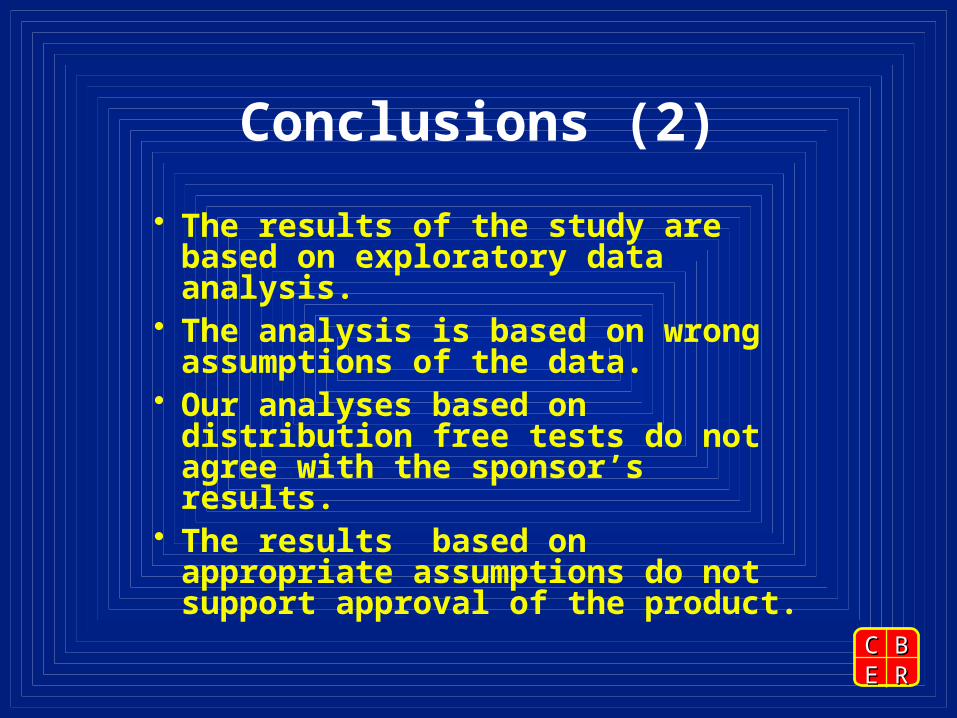
Conclusions (2)
The results of the study are based on exploratory data analysis.
The analysis is based on wrong assumptions of the data.
Our analyses based on distribution free tests do not agree with the sponsor’s results.
The results based on appropriate assumptions do not support approval of the product.
CC BBEE RR
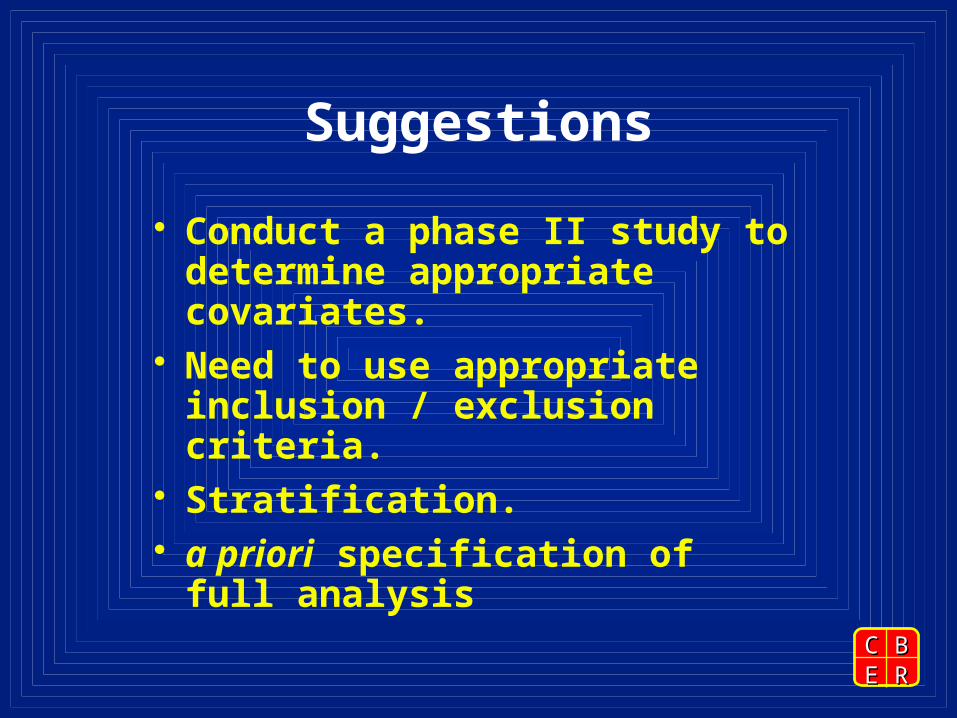
Suggestions
Conduct a phase II study to determine appropriate covariates.
Need to use appropriate inclusion / exclusion criteria.
Stratification. a priori specification of full
analysis

CC BBEE RR
Reference
Yarosh D. et al., "Effect of topically applied T4 endonuclease V in liposomes on skin cancer in xeroderma pigmentosum: a randomised study" Lancet 357:926-929, 2001.

CC BBEE RR
The End
CC BBEE RR
Grid on “Back”

CC BBEE RR
The Data
+-------------------------+| sex trt akb ak12tot| |-------------------------|| F 0 0 5 || M 0 0 1 || F 0 0 1 || F 0 0 0 || F 0 1 15 ||-------------------------|| M 0 0 3 |
| F 0 100 193 |
| M 0 0 2 || M 0 2 13 |
| M 1 47 71 |
|-------------------------|| F 1 0 0 || F 1 0 1 || F 1 0 0 |
| F 1 42 37 |
| F 1 2 0 ||-------------------------|
+-------------------------+ | sex trt akb ak12tot| +-------------------------+ | F 1 3 2 | | F 1 0 10 | | M 1 0 0 | | F 1 0 2 | | M 1 0 0 | |-------------------------| | F 1 0 0 | | F 1 3 10 | | F 1 1 0 | | F 1 0 4 | | F 1 5 3 | |-------------------------| | M 1 0 0 | | F 1 0 2 | | F 1 0 7 | | F 1 3 14 | | M . . . | +-------------------------+

CC BBEE RR
Descriptive Statistics (1)
Baseline AK
N Mean SD
Control 9 11.4 33.2
Treatment 20 5.3 13.5
12 Months Total AK
Control 9 25.9 62.9
Treatment 20 8.2 17.1

CC BBEE RR
Descriptive Statistics (2)
Baseline AK
Median Min Max
Control 0 0 100
Treatment 0 0 47
12 Months Total AK
Control 3 0 193
Treatment 2 0 71

CC BBEE RR
Negative Binomial Model
Need a model that allows for individual variability.
Negative binomial distribution assumes that each patient has Poisson, but incidence rate varies according to a gamma distribution.
Treatment: p = 0.64 Age: p = 0.45 AK Baseline: p = 0.0001 Age x Treat: p <0.001
• Main effect of treatment is not interpretable. Need to look at effects separately by age.

CC BBEE RR
Negative Binomial Results
This model shows only that the baseline AK and age x treatment effects are significant factors.
It also gives a test for whether the data are Poisson; the test rejects the Poisson Distribution: p<0.0005
A test based on chisquare test (obs - exp) suggests that these data are not negative binomial.