cbir system based on the clustering and genetic algorithmlibrary.iugaza.edu.ps/thesis/109769.pdf ·...
TRANSCRIPT

Computer Engineering Department
Faculty of Engineering
Deanery of Higher Studies
Islamic University – Gaza
Palestine
Content-Based Image Retrieval (CBIR)
System Based on the Clustering and
Genetic Algorithm
By
Eng. Ahmed K. Mikhraq
Supervisor
Prof. Mohammad Mikki
A Thesis Submitted in Partial Fulfillment of the Requirements for the
Degree of Master of Science in Computer Engineering
1434H 2013) )

CBIR System Based on the Clustering and Genetic Algorithm
ii

CBIR System Based on the Clustering and Genetic Algorithm
iii
DEDICATION
To the spirit of my brother martyr Nabil, that his departure increased my
insistence on the face of life, I miss you a lot in the meantime.
To my beloved brother and friend, Mohammed, who has never dawdle in
my support in various ways.
To My beloved Family, My Father, My Mother, My Brothers and Sisters
who are the main reason that gives me the power to complete this work.
To the rose of my life, my wife Amani, who fills my life with love, happiness,
warmth and tenderness,.
To my Sons, Mohammed and Nabil, and my daughters, Zaina and Samira,
who are the candles that bring the light into my heart and my mind.
To My second family, My wife's Father and Mother, her Brothers and
Sisters who gave me special kind of love and incubation.
To all, I dedicate this work.

CBIR System Based on the Clustering and Genetic Algorithm
iv
ACKNOWLEDGMENT
First of all, All praise and glory are due to Allah for blessing me with the much
needed strength and stamina to successfully accomplish this work.
This thesis would have been an impossible task without the assistance, guidance,,
valuable advice and encouragement of my supervisor Prof. Mohammad Mikki
throughout the course of my research. I deeply thank him for all of his efforts to
support me during my work.
I would like to express my deep thanks and love for my wife for her patience,
understanding and carry around a lot during the period of my master study.
I owe my largest debt to my family, and I wish to express my heartfelt gratitude to all
of them for their encouragement, constant prayers, and continued support. My dear
parents who have given me all their love and support over the years; I thank them for
their unwavering commitment through good times and hard times.
Finally, I thank all of those whose names are not mentioned here but have helped and
supported me in any way to accomplish this work.

CBIR System Based on the Clustering and Genetic Algorithm
v
TABLE OF CONTENTS
COMMITTEE DECISION
DEDICATION
ii
iii
ACKNOWLEDGMENT iv
TABLE OF CONTENTS v
LIST OF TABLES vii
LIST OF FIGURES viii
LIST OF ABBREVIATIONS x
ARABIC ABSTRACT xi
ABSTRACT xii
CHAPTER 1: Introduction 1
1.1 Information Retrieval 1
1.2 Information Retrieval Problem as Image Retrieval Problem 1
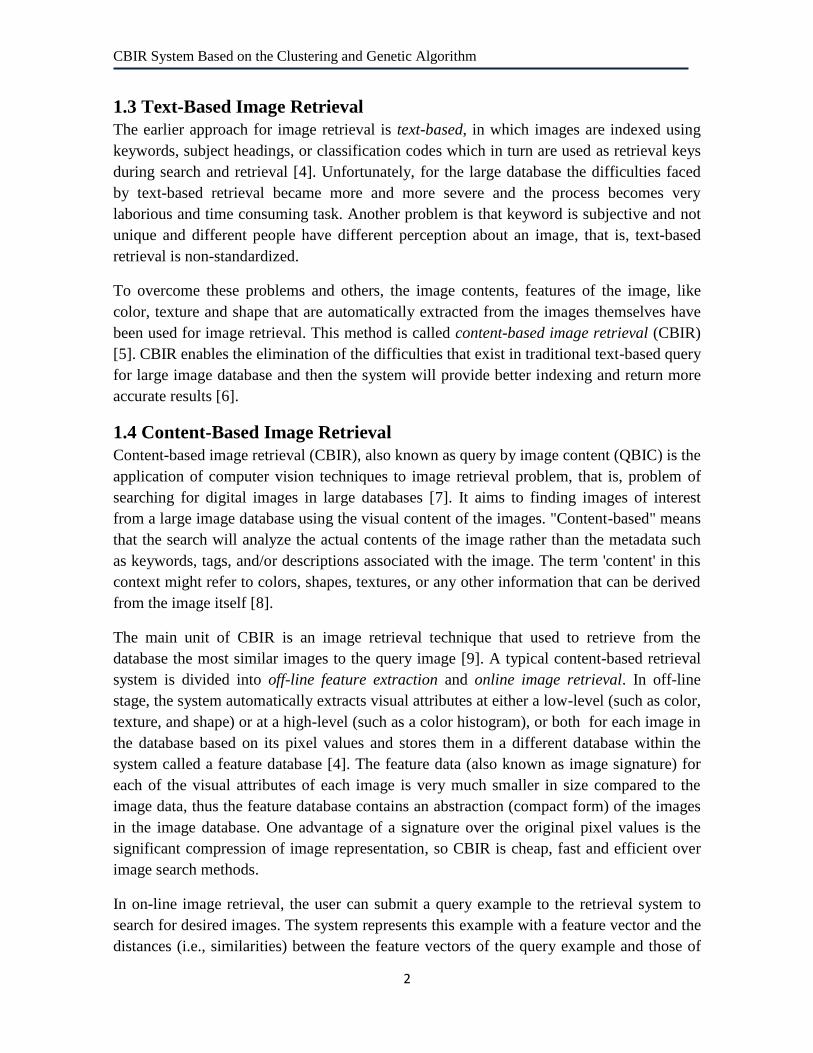
1.3 Text-Based Image Retrieval 2
1.4 Content-Based Image Retrieval 2
1.5 Practical Applications of CBIR Systems 4
1.5.1 Medical Applications
1.5.2 Digital Libraries
1.5.3 Crime Prevention
1.5.4 Web Searching
1.5.5 Other Applications
4
5
5
5
5
1.6 Thesis Significance and Contribution 5
1.7 Outline of Rest of Thesis 8
CHAPTER 2: Related Work 9
2.1 Introduction 9
2.2 General-Purpose Systems 10
2.2.1 QBIC
2.2.2 NETRA
2.2.3 KIWI
2.2.4 ImageMiner
2.2.5 Photobook
10
10
11
11
11
2.3 Global Feature Based CBIR Systems 11
2.4 Cluster-Based Retrieval Systems 13
2.5 Genetic Algorithm for CBIR Systems 14
2.6 Research Issues 15
CHAPTER 3: Background of Content Based Image Retrieval 16
3.1 Introduction 16
3.2 Feature Extraction 17

CBIR System Based on the Clustering and Genetic Algorithm
vi
3.2.1 Color Features 18
3.2.2 Texture Features 22
3.2.3 Shape Features 24
3.3 Similarity Measure 25
3.4 Indexing Structures 25
3.5 Genetic Algorithms 26
3.5.1 Genetic Operators 29
3.5.2 Fitness Function 32
3.5.3 Outline of the Basic Algorithm 32
3.5.4 Weights Optimization Problem 32
CHAPTER 4: The Proposed CBIR System 34
4.1 Introduction 34
4.2 Color Feature Extraction 35
4.2.1 Color Similarity Measure 36
4.3 Texture Feature Extraction 37
4.3.1 The Complex Gabor Function 37
4.3.2 Texture Representation 39
4.3.3 Texture Extraction Using Gabor wavelets 39
4.3.4 Texture Similarity Measure 41
4.4 Shape Feature Extraction 42
4.4.1 Edge Histogram Descriptor 42
4.4.2 Shape Similarity Measure 46
4.5 Genetic Algorithm to Optimize Features Weights 46
4.6 K-Means for Database Clustering 49
4.7 Image Matching 50
4.8 The Proposed CBIR System Architecture 52
CHAPTER 5: Results and Evaluation 55
5.1 Introduction 55
5.2 Image Database 55
5.3 Implementation Environment 56
5.4 Performance Evaluation Metrics of CBIR Systems 56
5.5 The proposed System Evaluation 58
5.5.1 Retrieval Effectiveness 58
5.5.2 Retrieval Efficiency 62
5.6 Comparison of The Proposed System with Other Systems 65
CHAPTER 6: Conclusion and Future Work 69
6.1 Conclusion 69
6.2 Future Works 70
REFERENCES 71

CBIR System Based on the Clustering and Genetic Algorithm
vii
LIST OF TABLES
Table
No. Caption Page
3.1 Genetic Algorithm. 33
4.1 Texture Feature Extraction. 41
4.2 Semantics of Local Edge Bins. 44
4.3 The k-means Algorithm. 50
4.4 The Proposed CBIR Algorithm (Phase 1: Learning). 54
4.5 The Proposed CBIR Algorithm (Phase 2: Querying). 54
5.1 Precision of Our Proposed System for Top 5, 10, 20, and 30 Retrieved
Images for Different Queries. 61
5.2
Comparing the Implementation Results of Optimal Weighted Features
(GA) for CBIR with Equally Weighted Features Results in Terms of
Precision and Recall.
62
5.3 Comparison of Precision of Our Proposed System with Previously
Existed Systems with All kinds of Features. 66
5.4 Comparison of Recall of Our Proposed System with Previously
Existed Systems with All kinds of Features. 67

CBIR System Based on the Clustering and Genetic Algorithm
viii
LIST OF FIGURES
Figure
No. Caption Page
1.1 General View for Image Retrieval Problem. 1
1.2 Typical Architecture of CBIR System. 3
3.1 An Overview of A CBIR System. 17
3.2 An Example of Color Image Properties. 17
3.3 RGB Color Space. 20
3.4 An RGB Image and Its Three Colors Components. 20
3.5 An RGB Image and Its Histogram. 21
3.6 Examples of Texture Images. 23
3.7 Main Operators of Genetic Algorithm. 27
3.8 Block Diagram of Genetic Algorithm. 29
3.9 Roulette Wheel Selection. 29
3.10 Crossover and Mutation Operators. 31
4.1 Block Diagram of Our Proposed CBIR System. 35
4.2 Gabor Filter Composition for 1-D Signals. 38
4.3 2-D Gabor Filter Composition. 38
4.4 2-D Frequency Spectrum View of Gabor Filter Bank. 40
4.5 An Example of Image Response to Bank of Gabor Filters 41
4.6 Definition of Sub-image and Image-block in the EHD. 42
4.7 Five Types of Edges in the EHD. 43
4.8 A Sub-image and its Corresponding EHD. 43
4.9 Sub-blocks and their Labeling. 45
4.10 Filters for Edge Detection. 45
4.11 Total EHD Bins. 46
4.12 GA/K-Means Hybrid Approach. 48
4.13 The Proposed System Architecture. 53
5.1 Example Images from Each of the 10 Classes of WANG Database. 55
5.2 Five Query Response Examples of the Proposed System. 58 - 60
5.3 The Average Precision/Recall Chart of Our System for 100 Queries. 61
5.4 Comparison of Precision of the Proposed System Applied With K-
means, Without k-means and With K-means and GA. 63
5.5 Comparison of Average Retrieval Time Required by the proposed
system Applied with Clustering and without Clustering. 64
5.6 Comparison of Precision of the Proposed System with Previously
Existed Systems with Different Kinds of Features. 65
5.7 Comparison of Precision of the Proposed System with Previously
Existed Systems with All kinds of Features.
67

CBIR System Based on the Clustering and Genetic Algorithm
ix
5.8 Comparison of Recall of the Proposed System with Previously
Existed Systems with All kinds of Features. 68

CBIR System Based on the Clustering and Genetic Algorithm
x
LIST OF ABBREVIATIONS
AMORE : Advanced Multimedia Oriented Retrieval Engine (A World
Wide Web Image Retrieval Engine)
CBIR : Content Based Image Retrieval
CIE : International Commission on Illumination
CLUE : Cluster-based Retrieval Images by Unsupervised Learning
CMY : Cyan, Magenta, and Yellow Color Space
DB : DataBase
EHD : Edge Histogram Descriptor
GA : Genetic Algorithm
GFBIR : Global Feature Based Image Retrieval
GCH : Global Color Histogram
GLCM : Gray-Level Co-occurrence Matrix
HSV : Hue, Saturation, Value color space
KIWI : Key-point Indexing Web Interface
LCH : Local Color Histogram
MARS : Multimedia Analysis and Retrieval System
QBIC : Query By Image and video Content
RBIR : Region Based Image Retrieval
RF : Relevance Feedback
RGB : Red, Green, Blue color space
SSE : Sum of Squared-Error
VIR : Visual Information Retrieval
WALRUS : Wavelet-based Retrieval of User-specified Scenes
WBIIS : Wavelet Based Image Indexing and Searching

CBIR System Based on the Clustering and Genetic Algorithm
xi
نظام استرجاع الصور استنادا على المحتوى باالعتماد على
خوارزميات التجميع والخوارزميات الجينية
مقدم من
أحمد كمال محمد مخراق
الملخص
تقريبا بما في ذلك التجارة، والحكومة، والتعليم، والمستشفيات، ومنع الجريمة، المراقبة، في أيامنا هذه، كل مجاالت الحياة البشرية
كما . والهندسة، والبحوث التاريخية تستخدم المعلومات كصور، وبالتالي فإن حجم البيانات الرقمية في تزايد مستمر وسريع
تصنف هذه الصور والبيانات الخاصة بها وتخزن في أجهزة الحاسوب وتظهر المشكلة عند استرجاع هذه الصور من وسائط
وهكذا أصبح نظام استرجاع الصور باستخدام المحتوى يحظى بمساحة كبيرة من االهتمام في السنوات األخيرة . التخزين
. وخاصة في العقد األخير
في أطروحة الماجستير هذه نقدم نظاما فعاال السترجاع الصور استنادا على محتواها وهذا النظام يستخدم اللون والنسيج والشكل
:وتكمن المساهمة الرئيسة في هذا البحث في ثالثة اتجاهات.كخصائص بصرية لوصف محتوى الصورة
نحن نستخرج ميزة اللون للصورة عن طريق حساب بعض القيم اإلحصائية للون والتي هي خاصية فريدة : االتجاه األول
.للصورة وثابتة ضد الدوران و التحجيم
نحن نستخدم تقنية مرشحات جابور الستخراج ميزات النسيج من مناطق عشوائية الشكل تم فصلها من الصور : االتجاه الثاني
.بعد عملية التجزئة لزيادة فعالية النظام
والتي تشمل خمس فئات كخاصية لوصف وصف الرسم البياني للحدودلزيادة فعالية النظام أيضا نحن نستخدم :االتجاه الثالث
. أيضاضد الدوران و التحجيمشكل الصورة وهذه الخاصية هي ثابتة
لتحسين كفاءة النظام المقترح قمنا بتعيين أوزان مختلفة للخصائص البصرية المختلفة ، هذه األوزان يتم تحسينها : الرابع االتجاه
وعالوة على ذلك ولتسريع .حتى يتم الوصول لالوازن المثلى باستخدام الخوارزميات الجينية المعتمدة على دقة خوارزمية التجميع
عملية حساب التشابه واسترجاع الصور المتشابهة ، نقوم بتقسيم الصور الموجودة في قاعدة البيانات إلى مجموعات بناء على
يتم تطبيق الخوارزمية الجينية وخوارزمية . الخصائص المستخرجة منها والموزونة مسبقا وذلك باستخدام خوارزمية التجميع
وبالتالي للرد على استعالم معين فإن هذا النظام ال يحتاج للبحث في صور قاعدة . التجميع في مرحلة أولية سابقة لعملية االستعالم
البيانات بأكملها، بدال من ذلك فإنه يبحث فقط في عدد من الصور المرشحة المطلوبة ليتم البحث فيها عن التشابه مع الصورة
. المطلوبة
النتائج العملية التجريبية لنظامنا تمت باستخدام قاعدة بيانات وانج للصور الملونة والتي تستخدم على نطاق واسع لتقييم أداء أنظمة
وأظهرت النتائج التجريبية أن نظامنا المقترح تجاوز عددا من نظرائه من األنظمة . استرجاع الصور استنادا على المحتوى
من االسترجاعاالسترجاع ووقت االسترجاع ، حيث تم زيادة متوسط دقةكمية ودقة االسترجاعاألخرى من حيث
وكما حصلنا على متوسط انخفاض في % 69.9إلى % 50.4االسترجاع من كمية ، وزيادة متوسط % 88.2إلى % 78.1
لقد أثبتت النتائج التجريبية أن نظامنا المقترح هو النظام األمثل السترجاع الصور استنادا . ثانية6.21وقت استرجاع الصور بلغ
عالوة على ذلك فان نموذجنا يعتبر واحدا من النماذج األولى التي تجمع بين مفاهيم وتقنيات مختلفة لبناء نظام. على المحتوى
. اهاالسترجاع الصور استنادا على محتو
استرجاع الصور استنادا على المحتوى، اللون ، النسيج ، الشكل ، مرشحات جابور، وصف الرسم البياني:الكلمات المفتاحية
.، كمية االسترجاعالخوارزميات الجينية، دقة االسترجاع خوارزميات التجميع، للحدود،

CBIR System Based on the Clustering and Genetic Algorithm
xii
Content-Based Image Retrieval (CBIR) System Based on
the Clustering and Genetic Algorithm
By
Ahmed K. M. Mikhraq
ABSTRACT
Nowadays, virtually all spheres of human life including commerce, government,
academics, hospitals, crime prevention, surveillance, engineering and historical research
use information as images, so the volume of digital data is increasing rapidly. These images
and their data are categorized and stored on computers and the problem appears when
retrieving these images from storage media. Thus, Content based image retrieval from large
resources has become an area of wide interest in recent years especially in the last decade.
In this thesis we present an efficient general-purpose CBIR system that uses color, texture
and shape as visual features to describe the content of an image. The main contribution of
this thesis is of four directions. First, we extract the color feature of the image by
calculating the color moments which they are unique and invariant to rotation and scaling.
Second, we use Gabor filters to extract texture features from arbitrary shaped regions
separated from an image after segmentation to increase the system effectiveness. Third, to
further increase the efficiency of the proposed system, edge histogram features that include
five categories are used as shape descriptor which are invariant to rotation and scaling.
Fourth, to improve the efficiency of the proposed system we assign different weights to
each feature. These weights are optimized using genetic algorithm (GA) with a k-means
accuracy as a fitness function to select optimum weights for features. Furthermore, to speed
up retrieval and similarity computation of the proposed system, the database images are
clustered using k-means clustering algorithm according to their weighted feature vectors.
We perform GA and clustering algorithm on the database as an offline step before query
processing, therefore to answer a query, the system does not need to search the entire
database images; instead just a number of candidate images are required to be searched for
image similarity.
The experimental evaluation of the proposed system is based on the WANG color image
database that is widely used for CBIR performance evaluation. From the experimental
results, it is evident that the proposed system surpassed its counterpart, other existing
systems, in terms of precision, recall and retrieval time. The average precision increased
from 78.1% to 88.2%, the average recall increased from 50.4% to 69.9% and an average
reduction in time that equal to 6.21 seconds. Thus, the experimental results confirm that the
proposed CBIR system architecture attains better solution for image retrieval. Furthermore,
at our knowledge, the proposed model represents one of the first models in which combine
different concepts and techniques to build general purpose CBIR system.
Keywords: Content Based Image Retrieval (CBIR), Color, Texture, Shape, Gabor Filters,
edge histogram descriptor (EHD), Clustering, Genetic Algorithm (GA), Precision, Recall.

CBIR System Based on the Clustering and Genetic Algorithm
1
Chapter 1
Introduction
1.1 Information Retrieval
In recent years especially in the last decade, the rapid development in computers, storage
media and digital image capturing devices enable to collect a large number of digital
information and store them in computer readable formats. The large numbers of images has
posed increasing challenges to computer systems to store and manage data effectively and
efficiently. In the meanwhile, the advances of software and hardware technology have
eased the problem of maintaining large information collections including books, journals,
newspapers, videos, audios, images and satellite pictures accessible for computer users [1].
Although the advent in internet makes it possible for the human to access this huge amount
of information easily, but the rule is that the more information available about a given
topic, the more difficult to locate accurate and relevant information easily. For this reason
the need and the demand for an efficient and accurate information retrieval system has
increased and attracted much interest among the researchers in recent years.
1.2 Information Retrieval Problem as Image Retrieval Problem
Nowadays, virtually all spheres of human life including commerce, government,
academics, hospitals, crime prevention, surveillance, engineering, architecture, journalism,
fashion and graphic design, and historical research use information as images [2]. These
images and their data are categorized and stored on computers as a large collection referred
to as image database. Image data include the raw images and information extracted from
images by automated or computer assisted image analysis.
To retrieve any image, we have to search for it among the database using some search
engine. Then, this search engine will retrieve many of images related to the searched one.
The main problem encounters user here is the difficulty of locating his relevant image in
this large and varied collection of resulted images. This problem referred to as image
retrieval problem. A general view for this problem is shown in Figure 1.1 below. To solve
this problem, text-based and content-based are the two techniques adopted for search and
retrieval in an image database [3].
Figure (1.1): General View for Image Retrieval Problem.
CBIR System Based on the Clustering and Genetic Algorithm
2
1.3 Text-Based Image Retrieval
The earlier approach for image retrieval is text-based, in which images are indexed using
keywords, subject headings, or classification codes which in turn are used as retrieval keys
during search and retrieval [4]. Unfortunately, for the large database the difficulties faced
by text-based retrieval became more and more severe and the process becomes very
laborious and time consuming task. Another problem is that keyword is subjective and not
unique and different people have different perception about an image, that is, text-based
retrieval is non-standardized.
To overcome these problems and others, the image contents, features of the image, like
color, texture and shape that are automatically extracted from the images themselves have
been used for image retrieval. This method is called content-based image retrieval (CBIR)
[5]. CBIR enables the elimination of the difficulties that exist in traditional text-based query
for large image database and then the system will provide better indexing and return more
accurate results [6].
1.4 Content-Based Image Retrieval
Content-based image retrieval (CBIR), also known as query by image content (QBIC) is the
application of computer vision techniques to image retrieval problem, that is, problem of
searching for digital images in large databases [7]. It aims to finding images of interest
from a large image database using the visual content of the images. "Content-based" means
that the search will analyze the actual contents of the image rather than the metadata such
as keywords, tags, and/or descriptions associated with the image. The term 'content' in this
context might refer to colors, shapes, textures, or any other information that can be derived
from the image itself [8].
The main unit of CBIR is an image retrieval technique that used to retrieve from the
database the most similar images to the query image [9]. A typical content-based retrieval
system is divided into off-line feature extraction and online image retrieval. In off-line
stage, the system automatically extracts visual attributes at either a low-level (such as color,
texture, and shape) or at a high-level (such as a color histogram), or both for each image in
the database based on its pixel values and stores them in a different database within the
system called a feature database [4]. The feature data (also known as image signature) for
each of the visual attributes of each image is very much smaller in size compared to the
image data, thus the feature database contains an abstraction (compact form) of the images
in the image database. One advantage of a signature over the original pixel values is the
significant compression of image representation, so CBIR is cheap, fast and efficient over
image search methods.
In on-line image retrieval, the user can submit a query example to the retrieval system to
search for desired images. The system represents this example with a feature vector and the
distances (i.e., similarities) between the feature vectors of the query example and those of

CBIR System Based on the Clustering and Genetic Algorithm
3
the image in the feature database are then computed and ranked. Retrieval is conducted by
applying an indexing scheme to provide an efficient way of searching the image database.
Finally, the system ranks the search results and then returns the results that are most similar
to the query examples [5]. If the user is not satisfied with the search results, he can provide
relevance feedback to the retrieval system, which contains a mechanism to learn the user‟s
information needs. A typical Architecture for CBIR System is illustrated in Figure 1.2.
Figure (1.2): Typical Architecture of CBIR System.
The corner stone of the any CBIR system is a methodology known as relevance feedback
(RF), in which the search/retrieval session is divided into a number of consecutive loops.
At every loop, the user provides feedback regarding the results by characterizing the
retrieved images as either relevant or irrelevant [10]. RF is typically based on some simple
distance measures for image similarity, usually deal with small training samples (typically
less than 20 per round of interaction), asymmetry in training sample (a few negative
examples are usually fed back to the system), and real time requirement (RF algorithms
should be fast enough to support real-time user interaction). Since the main goal of CBIR
system is the efficiency during image indexing and retrieval, thus human intervention in the
these processes must be reduced as much as possible. That is, the computer must be able to
retrieve images from a database without any human assumption on specific domain (such
as texture vs. non-texture). Thus, Instead of RF we can use any clustering algorithm (like
K-means) that based on the features extracted from the images themselves, and allocates
those images into the nearest cluster. The algorithm calculates and allocates until there is
little variation in the movement of feature points in each cluster.

CBIR System Based on the Clustering and Genetic Algorithm
4
Clustering is the unsupervised classification of patterns (observations, data items, or feature
vectors) into groups (clusters) [11]. Its main task is to assigning a set of objects into groups
(called clusters) so that the objects in the same cluster are more similar (according to some
defined similarity measure) to each other than to those in other clusters [12]. In testing
phase of CBIR system, systems attempt to compare the query image with every target
image in the database to find the top matching images, resulting in an essentially linear
search, which is prohibitive when the database is large. We believe that it is not necessary
to conduct a whole database comparison. Since each image database contains number of
classes that each image belongs to one class, the system can select some images from
different classes and use them to be compared with the query image. This can be done by
divide the database into groups (using any clustering algorithm) where images with similar
features are clustered to one group. This method saves significant query processing time
and computation load without compromising the retrieval accuracy.
One of the main tasks for CBIR systems is similarity comparison; extracting feature
signatures of every image based on its pixel values and defining rules for comparing
images. These features become the image representation for measuring similarity with other
images in the database. An image is compared to other images by calculating the
similarities (or differences) between their corresponding features [2].
Implementation of a CBIR system using one content feature doesn‟t give sufficient retrieval
accuracy [13]. To overcome this problem, any novel model for the content based image
retrieval system must combine multiple features for the image like color, texture, and
shape. Unfortunately, assigning equal weights for each feature can‟t achieve good result
[14]. Moreover, these weights must be optimized using any search optimization procedure
(like genetic algorithm) to increase the average accuracy of the image retrieval.
1.5 Practical Applications of CBIR Systems
CBIR systems have become a reliable tool for many image database applications and they
were used in various fields and spheres of human activity. There is a growing interest in
CBIR systems because of the limitations inherent in metadata based systems, as well as the
large range of possible uses for efficient image retrieval systems [15]. The CBIR
technology has been used in a plethora of applications such as fingerprint identification,
digital libraries, crime prevention, medical diagnosis, historical research, architectural and
engineering design, publishing and advertising, art, education, fashion and graphic design,
geographical information and remote sensing systems, etc [3]. Some of these applications
are presented below:
1.5.1 Medical Applications
The use of CBIR can result in powerful services that can benefit biomedical information
systems. Three large domains can instantly take advantage of CBIR techniques: teaching,
research, and diagnostics [16]. Clinicians usually use similar cases for case-based reasoning

CBIR System Based on the Clustering and Genetic Algorithm
5
in their clinical decision-making process. In the medical field, some ailments require the
medical practitioner to search and review similar X-rays or scanned images of a patient
before proffering a solution.
1.5.2 Digital Libraries
There are several digital libraries that support services based on image content. One
example is the digital museum of butterflies [17], aimed at building a digital collection of
Taiwanese butterflies. This digital library includes a module responsible for content-based
image retrieval based on color, texture, and patterns.
1.5.3 Crime Prevention
One of the main jobs of police is to identify and arrest criminals in the country. However,
to achieve that, the department of security investigation must identify the identity of
criminals as fast as possible and with a high accuracy rate. Day after day, the crime rate is
increasing so that the police must deal with a large number of criminals images that stored
in a database. Once a new image is arrived, it must be compared with all of these images to
classify it correctly. It is clear that, doing this job manually takes a long time so, the need
for criminal recognition system is strongly highlighted here.
1.5.4 Web Searching
The most important application, however, is the Web, as a big fraction of it is devoted to
images, and searching for a specific image is indeed a daunting task. Numerous commercial
and experimental CBIR systems are now available, and many web search engines are now
equipped with CBIR facilities, as for example Alta Vista, Yahoo and Google. Today it is
estimated that there are 30 billion images in Imageshack, Facebook holds 35 billion photos
and Corp's PhotoBucket has 10 billion photos [18].
1.5.5 Other Applications
In the commerce department, before trademark is finally approved for use, there is a need
to find out if such or similar ones ever existed. In architectural and engineering design,
image database exists for design projects, finished projects, and machine parts. In
publishing and advertising, journalists create image databases for various events and
activities such as sports, buildings, personalities, national and international events, and
product advertisements. In historical research, image databases are created for archives in
areas that include arts, sociology, and medicine [18].
1.6 Thesis Significance and Contribution
With the rapid increase of the volume of digital image collections, CBIR is becoming an
active research area [19]. The design and development of effective and efficient CBIR
systems are still a research problem with many important issues like:

CBIR System Based on the Clustering and Genetic Algorithm
6
1. Make semantic gap between image representation and image semantics narrow as
much as possible.
2. Select suitable image features that will represent the image.
3. Extracting such features from raw images.
4. Providing compact storage for large image databases.
5. Efficiently accessing stored images by content.
6. Matching query and stored images in a way that reflects human similarity judgments.
7. Providing usable human interfaces to CBIR systems.
8. Get sufficient generalization performance and high accuracy.
9. Get Adequate system speed and low computational load.
When we want to develop an efficient algorithm for CBIR, some problems have to be
solved. The first problem is to select the features that will represent the images. Naturally,
the images are rich with information and features that can be used for image retrieval. But
we must choose and extract the most important features that lead to a good retrieval result.
The second problem is the computational load to extract features of an image and to deal
with large image databases. We have to keep in our mind that large image databases are
used for features extracting and images retrieving, so we need a system with high speed and
low computational load.
Since most of previously designed CBIR system may suffer from insufficient
generalization performance and unsatisfactory accuracy, the goal of our research is to
propose a new CBIR system that has a good generalization performance, high accuracy and
adequate speed.
The major contributions of this thesis can be summarized as follows:
1. Our thesis proposes novel system architecture for CBIR system which combines
techniques includes content-based image retrieval, multi-features analysis, artificial
intelligence procedure, as well as data mining techniques. To our best knowledge in this
field, this is the first model or one of the first models that combine content-based, multi-
features extraction, k-means clustering and GA to build a CBIR system.
2. As we said before, implementation of a CBIR system with one images' feature descriptor
doesn‟t give sufficient retrieval accuracy. In our thesis, to increase the performance of
the system, a fusion of multiple features (color, texture and shape) as a descriptor for the
image is used to compute the distance between two images.
3. Most CBIR systems use gray-scale images. If the image database or the query image is a
color image, they convert it to gray-scale image. However, when some systems use the
color of the image as its feature, they derive the histogram from the color space of the
image. In our research, the color moments will be used for extracting the image features

CBIR System Based on the Clustering and Genetic Algorithm
7
because the distribution of color in an image can be interpreted as a probability
distribution. Probability distributions are characterized by a number of unique moments.
So, the moments of the color image can be used as features to identify that image based
on color.
4. Low-level texture features are extracted from arbitrary-shaped regions using Gabor
filter, which has been a widely acclaimed natural and excellent tool in texture feature
classification, segmentation, and extraction [58]. In many systems, texture features are
obtained during segmentation from pixels or small blocks [62]. Such features may not
well represent the property of an entire region. In some other systems, segmentation
does not produce texture features. Hence, it is necessary to study texture feature
extraction from the whole region after segmentation.
5. Shape is known to play an important role in human recognition and perception and
object shape features provide a powerful clue to object identity. Histogram is the most
commonly used characteristic to represent the global feature composition of an image. It
is considered to be very useful for indexing and retrieving images [20]. Edge is a local
shape feature and it captures the general shape information in the image [36]. Since
edges play an important role for image perception, it is frequently used as a feature
descriptor in image retrieval. The Edge Histogram Descriptor is such an example; which
represents the spatial distribution of five types of edges, namely four directional edges
and one non-directional edge. To increase efficiency of the proposed system, edge
features that include these five categories are used as shape features.
6. Assigning equal weights for each feature can‟t achieve good results in terms of average
precision, and recall [14]. This problem can be solved by assigning different weights to
each feature and optimize these weights using GA with a suitable fitness function to
select optimum weights of features. This exactly what we did in the proposed system.
7. Data clustering is used in many fields, including machine learning, data mining, pattern
recognition, image analysis and bioinformatics [11]. A clustering algorithm, definitely
the k-means, is used to cluster the database into classes. Images with similar features are
clustered to one class. This clustering process is performed offline and each class will be
indexing along with its associated class ID in the index files. To retrieve images similar
to the query image, the system will compute the distance between the query image and
the centroid image of each class. The smallest distance (most similar) will determine to
which the image belongs. The class with the smallest distance is returned and the images
in this class will be compared with the query image. The most matching images will be
retrieved. This method saves significant query processing time and computation load
without compromising the retrieval precision.

CBIR System Based on the Clustering and Genetic Algorithm
8
1.7 Outline of Rest of Thesis
The rest of the thesis is organized as follows. Chapter 2 summarizes some of the related
works in the topic of CBIR and the primary research issues. In Chapter 3, we introduce an
overview of the CBIR system, its principle, and the techniques used for feature extraction,
similarity measure, and indexing structures. Genetic Algorithm, the essential technique
used for feature weights optimization in our proposed systems, is also discussed in this
chapter. In Chapter 4, we introduce our proposed system for CBIR and talk about some
methods for image indexing and clustering. Simulation results and evaluation of our system
are detailed in Chapter 5. Finally, Chapter 6 concludes our work and suggests future work.

CBIR System Based on the Clustering and Genetic Algorithm
9
Chapter 2
Related Work 2.1 Introduction
Nowadays, CBIR is a hotspot of digital image processing techniques. CBIR research
started in the early 1990‟s and it is likely to continue during the first two decades of the
21st century [20]. It is a problem of searching for digital images in large databases and it
aims to finding images of interest from a large image database using the visual content of
the images. Before CBIR, the traditional image retrieval is usually based on text [19]. Text-
based image retrieval has been discussed over those years and it is easy to find out some
disadvantages such as:
Manually annotation is always involved by human‟s feeling, situation, etc. which
directly results in what it is in the images and what is it about.
Annotation is never complete.
Language and culture difference always cause problems, the same image is usually
text out by many different ways.
Mistakes such as spelling error or spell difference leads to totally different results.
There is a growing interest in CBIR because of the limitations inherent in metadata-based
systems, as well as the large range of possible uses for efficient image retrieval. In order to
overcome these limitations, CBIR was first introduced by Kato in 1992 [7]. The term,
CBIR, is widely used for retrieving desired images from a large collection, which is based
on extracting the features from images themselves. In general, the purpose of CBIR is to
present an image conceptually, with a set of low-level visual features such as color, texture,
and shape [21].
The common ground for CBIR systems is to extract a signature for every image based on
its pixel values and to define a rule for comparing images. The signature serves as an image
representation in the “view” of a CBIR system. The components of the signature are called
features. One advantage of a signature over the original pixel values is the significant
compression of image representation. However, a more important reason for using the
signature is to gain an improved correlation between image representation and semantics.
Actually, the main task of designing a signature is to bridge the gap between image
semantics and the pixel representation, that is, to create a better correlation with image
semantics [22]. After extracting signatures, the next step is to determine a comparison rule,
including a querying scheme and the definition of a similarity measure between images.
One highly problem when designing CBIR system is to make a system general-purpose.
CBIR for general-purpose image databases is a highly challenging problem because of the
large size of the databases, the difficulty of understanding images both by people and
computers, the diversity of real world images, and the issue of evaluating results properly.
CBIR System Based on the Clustering and Genetic Algorithm
10
However, all current CBIR systems suffer from insufficient generalization performance and
accuracy as they are not able to establish a robust link/map between image features and
high-level concepts. As a result, we can say that "there is no complete and perfect solution
for this issue from user and system points of view".
A number of general-purpose image search engines have been developed. In the
commercial domain, QBIC [23] is one of the earliest systems. Recently, additional systems
have been developed such as VIR [24], AMORE [25], and Bell Laboratory WALRUS [26].
In the academic domain, MIT Photobook [27] is one of the earliest systems. Berkeley
Blobworld [28], Columbia Visualseek and Webseek [29], Natra [30], and Stanford WBIIS
[31] are some of the recent well known systems.
2.2 General-Purpose Systems
Several general-purpose systems have been developed for content based information and
image retrieval. For each system, we will focus on the features that are used to extract
information from the image and matching between the query image and the database. We
will mention some of them below:
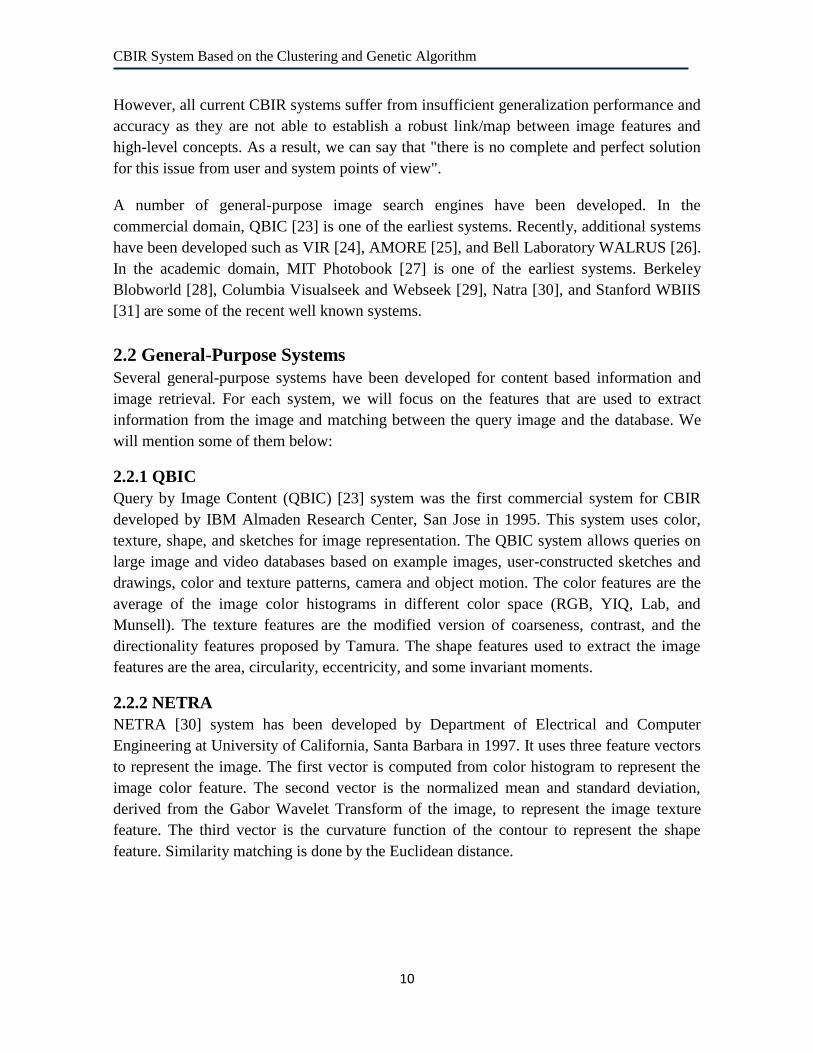
2.2.1 QBIC
Query by Image Content (QBIC) [23] system was the first commercial system for CBIR
developed by IBM Almaden Research Center, San Jose in 1995. This system uses color,
texture, shape, and sketches for image representation. The QBIC system allows queries on
large image and video databases based on example images, user-constructed sketches and
drawings, color and texture patterns, camera and object motion. The color features are the
average of the image color histograms in different color space (RGB, YIQ, Lab, and
Munsell). The texture features are the modified version of coarseness, contrast, and the
directionality features proposed by Tamura. The shape features used to extract the image
features are the area, circularity, eccentricity, and some invariant moments.
2.2.2 NETRA
NETRA [30] system has been developed by Department of Electrical and Computer
Engineering at University of California, Santa Barbara in 1997. It uses three feature vectors
to represent the image. The first vector is computed from color histogram to represent the
image color feature. The second vector is the normalized mean and standard deviation,
derived from the Gabor Wavelet Transform of the image, to represent the image texture
feature. The third vector is the curvature function of the contour to represent the shape
feature. Similarity matching is done by the Euclidean distance.

CBIR System Based on the Clustering and Genetic Algorithm
11
2.2.3 KIWI
KIWI [32], Key-point Indexing Web Interface, has been developed in France by INSA
Lyon in 2001. This system extracts the key points in the query image rather than the entire
image using some wavelet-based salient point detector. Color histograms, are computed
from each color component (R, G, and B), and the shape descriptors, computed from Gabor
Filter, are used as image features. Euclidean distance is used for similarity matching.
2.2.4 ImageMiner
ImageMiner [33] has been developed by Technology-Zentrum Informatics at University of
Bremen in Germany in 1997. It uses color, texture, and shape to describe the image. Color
histogram is used to describe image color features. Grey level co-occurrence matrix is used
for texture feature. Image contour size, centroids, and boundary coordinates are used for
shape features. For similarity, special module is developed within the system.
2.2.5 Photobook
Photobook [27] was developed by Vision and Modeling Group at MIT Media Lab in 1997.
It implements three different methods for image representation according to image content
type (face, 2D shape, and texture). Photobook consists of three sub-books. There are the
Appearance Photobook, Shape Photobook and Texture Photobook, which can extract the
face, shape and texture, respectively. To query an image, users can select one of image
features that the system supports or a combination of different features besides a text-based
description.
However, although these systems formulate the special semantic features for image
retrieval, there still have not been perfect descriptions for semantic features. This is due to
the diversity of visual features, which widely exists in real applications of image retrieval.
For example, all of these systems can‟t be useful for some special images (like medical
images for example) because these systems uses some simple feature extraction methods
which may provide unwanted results and they are not that much precise.
2.3 Global Feature Based CBIR Systems (GFBIR)
For most image retrieval systems, a query is specified by an image to be matched. We refer
to this idea as “global search” since similarity is based on the overall properties of images.
By contrast, there are also “partial search” querying systems called Region-based Image
retrieval (RBIR) that retrieve results based on a particular region in an image. Even though
RBIR systems increased the retrieval accuracy, they require high complex computations to
calculate similarity; since these systems need to consider each region in the database
images resulting in high retrieval response time [22]. Basically, one of the key points of
realizing CBIR is to extract appropriate feature vectors to represent image content
correctly. Color, texture and shape features have been used for describing image content.

CBIR System Based on the Clustering and Genetic Algorithm
12
Color is one of the most widely used low-level visual features and it is invariant to image
size and orientation [21]. Color histogram is invariant to orientation and scale which makes
it powerful in image classification. Hence, color histogram-based descriptor has been
extensively studied and widely used in CBIR systems. This is due to its simplicity and
effectiveness. Before a color descriptor is selected, the underlying color space has to be
specified. For CBIR, the RGB space was used by many researchers to extract the color
features in it. Unfortunately, the RGB is not well suited for describing colors in terms that
are practical for human interpretation [5]. While the color histogram is robust to translation
of object and rotation about the viewing axis, it does not include any spatial information.
Different images can have same color distribution; however, large appearance changes in
an image can easily change the histogram. Unfortunately, Image retrieval using color
features only often gives disappointing results, because in many cases, images with similar
colors do not have similar content. This is due to the fact that information about object
location, shape and texture is discarded.
Texture is another important visual feature to characterize the content of one image and it
has been widely used in applications such as remote sensing image classification, face
recognition, image retrieval et al. Based on personal perceptions or driven by special
applications, vision researches had presented a number of different definitions of
„„Texture‟‟. It is an innate property of virtually all surfaces, including clouds, trees, bricks,
hair, fabric, etc. It contains important information about the structural arrangement of
surfaces and their relationship to the surrounding environment [13].
Object shape features can also provide powerful information for image retrieval, because
humans can recognize objects solely from their shapes. Usually, the shape carries semantic
information, and shape features are different from other elementary visual features such as
color or texture features [15]. Basically, shape features can be categorized as boundary-
based and region-based. The former extracts features based on the outer boundary of the
region while the latter extracts features based on the entire region [41]. Retrieving images
based on their shape feature have also been considered in many researches works. Edge is
local shape feature and it captures the general shape information in the image. Since edges
play an important role for image perception, it is frequently used as a feature descriptor in
image retrieval. The edge histogram descriptor is such an example; which represents the
spatial distribution of five types of edges, namely four directional edges and one non-
directional edge [36]. These five types of edges evolve from the color distribution within
the edges; more precisely it can be said that these edges immerse from the color distribution
of pixels and from an internal feature of edge shape descriptor.
Over the past decades, many researchers have focused on the studies of CBIR by using only
a single feature. However, it is hard to gain satisfactory retrieval results using a single
feature because an image generally contains various visual characteristics [37]. Therefore,
it is necessary to extract and select efficient features that are complementary to each other

CBIR System Based on the Clustering and Genetic Algorithm
13
so as to achieve a satisfactory retrieval performance. Peiqiang Zhang et al. [38] have
proposed edge histogram for image retrieval. In [39], Salih, N.D. et al. have used shape
features for image retrieval and classification.
D. Zhang [40] proposed a method combining both color and texture features to improve
retrieval performance. By computing both the color and texture features from the images,
the database images are indexed using both types of features. During the retrieval process,
given a query image, images in the database are firstly ranked using color features. Then, in
a second step, a number of top ranked images are selected and re-ranked according to their
texture features. Two alternatives are provided to the user, one is the retrieval based on
color features, and the other is retrieval based on combined features. When the retrieval
based on color fails, the user will use the other alternative which is the combined retrieval.
Since the texture features are extracted globally from the image; they are not an accurate
description of the image in some cases, which degrades the system performance.
Saad, M.H. et al. [42] have used color histogram and shape features for image retrieval. In
[43], Fakhri, M. et al. have utilized color and texture features for image retrieval. Rai,
H.G.N. et al. have proposed shape and texture features for image retrieval in [44]. In [45],
Chen et al. have proposed multi features for CBIR By assigning equal weights for each
feature. In [15], EI-Kholy, Abdel-Haleim et al. have proposed a new CBIR search engine
using combined of two features (color and shape) and weighted similarity.
In [46], a framework for image retrieval using combined features was presented: it utilizes
color histograms to extract color features in HSI space, applying gray-level co-occurrence
matrix to extract the texture features and it utilizes Zernike moments to extract the shape
features.
In [13], Hiremath, et al. have proposed color, texture and shape features for CBIR. Color
moments and moments on Gabor filter responses as local descriptors of color and texture
respectively. While Shape information is captured in terms of edge images computed using
Gradient Vector Flow field. Invariant moments are then used to record the shape features.
2.4 Cluster-Based Retrieval Systems
Clustering is the task of assigning a set of objects into groups (called clusters) so that the
objects in the same cluster are more similar (according to some defined similarity measure)
to each other than to those in other clusters [47]. Data clustering is a common technique for
statistical data analysis, which is used in many fields, including machine learning, data
mining, pattern recognition, image analysis and bioinformatics.
In [12], the authors developed a new approach named cluster-based retrieval of images by
unsupervised learning (CLUE), in which the system aims to retrieve images by including
the similarity knowledge between target images through user interaction. They claim that

CBIR System Based on the Clustering and Genetic Algorithm
14
the degree of user involvement with CBIR system can assist to reduce the semantic gap.
Although, results of this approach showed its efficiency but from our point of view, high
computational cost is one of the main draw back in this sort of clustering methods.
Chang et al. [6] have proposed novel system architecture for CBIR which combines
segmentation and grid module, feature extraction module, K-means clustering and
neighborhood module to build the CBIR system. Actually, although the experimental
results confirm that this proposed CBIR system architecture attains better solution for
image retrieval and improves its precision but this system also suffers from insufficient
generalization performance.
In [47], the authors proposed a new partitional clustering algorithm and apply this
algorithm to content-based image retrieval. They claim that their algorithm optimizes on
both intra-cluster and inter-cluster similarity measures and improves the recall. But
unfortunately, this content-based image retrieval technique uses only the RGB color
histogram as the visual content descriptor of an image and the improving of recall at the
cost of precision.
2.5 Genetic Algorithm for CBIR Systems
Genetic algorithm (GA) is an artificial intelligence procedure based on the theory of natural
selection and evolution [7]. It is an efficiently global searching algorithm based on the
principle of „survival of the fittest‟ and used for optimization and searching problems. As
mentioned before, implementation of content-based image indexing and retrieval (CBIR)
using one content feature doesn‟t give sufficient retrieval accuracy. To overcome this
problem, any novel model for the content based image retrieval system must combine
multiple features for the image like color, texture, and shape. Unfortunately, assigning
equal weights for each feature can‟t achieve good result. These weights must be optimized
using any search optimization procedure like genetic algorithm (GA) for increasing average
precision and average recall of image retrieval.
In [14], Color, Texture and Shape features were extracted and combined to form feature
vector of image and optimized using GA and adapted in similarity/distance measurement to
perform retrieval image from database.
Shao et al. changed the problem of weight assignment into optimization problem and
genetic algorithm was used for finding the optimization weight in order to obtain better
image retrieval results [48]. In [49], an optimum weighted Manhattan distance function was
designed using a genetic algorithm utilizing the Mantel test as a fitness function by Celebi
et al. In [50], feature selection based on GA whose fitness function combined the number of
features to be used and the error rate of the Bayesian classifier was presented.

CBIR System Based on the Clustering and Genetic Algorithm
15
2.6 Research Issues
Remarkable observations in the review of related works are as follows:
1. There still have not been perfect descriptions for semantic features. This is due to the
diversity of visual features, which widely exists in real applications of image retrieval.
2. Implementation of content-based image indexing and retrieval (CBIR) using one
content feature doesn‟t give sufficient retrieval accuracy.
3. For combining of different types of features, there is a need to train these features with
different weights to achieve good results. Assigning equal weights for each feature
can‟t achieve good result.
4. It is more suitable and it has a great benefit to classify the images into clusters so as to
be able to reduce the search domain in such search engines. Data Clustering is often
took as a step for speeding-up image retrieval and improving accuracy especially in
large databases.
5. There are many of methods used to measure the similarity between different entities,
such as information content [51], Dice coefficient, cosine coefficient and distance-based
measurements. In our thesis, a new function is designed to combine features and
calculate similarity between two images based on the Euclidean distance.
6. The existing CBIR systems use either global features, or region based features to
represent the content of an image. Even though RBIR systems can increase the retrieval
accuracy, they require high complex computations to calculate similarity; since these
systems need to consider each region in the database images especially and color
images have large dimensions and the computations are quite time consuming, RBIR
systems need a high retrieval response time.
7. All current CBIR systems suffer from insufficient generalization performance and
accuracy. One highly problem when designing CBIR system is to make a system
general-purpose. When we combine some techniques like content-based, multi-features
extraction, clustering and artificial intelligence to build the CBIR system, we can get
closer to generalization more and more.
8. In some of previous works, a combination of GA and K-means was used especially to
optimize the main input of k-means, k. In our thesis, we will use this combination but in
different manner; hence we will use GA to optimize features' weights which contributes
significantly in overall system performance.

CBIR System Based on the Clustering and Genetic Algorithm
16
Chapter 3
Background of Content-based Image Retrieval
3.1 Introduction
With the growth of technology and internet, images had become really famous nowadays
and the search for similar images in large-scale image databases has been an active research
area in the last couple of years. Intuitively, the most direct method to compare two images
is to compare the pixels in one image to the corresponding pixels in the other image.
Clearly, this method is not feasible, because images may have different size that
applications cannot determine which pixels from one image correspond to which pixels in
the other image. Another reason is the computational complexity. When a system wants to
match two images by comparing pixel by pixel, it will take a long time. This is just for two
images. Nowadays, we talk about thousands of images stored in databases that are used for
image retrieving. Comparing images using their pixels is time consuming. More powerful
method is to use image features instead of using the original pixel values because of the
significant simplification of image representation, and the easy way to compare images
using their features.
A very promising approach to do this task is content based image retrieval (CBIR). The
main idea behind CBIR systems is to allow users to find images that are visually similar to
the query image. Similar may have different meanings. Some users may be interested in
some image regions. Others are interested in some shapes and the color of them. Therefore,
different needs mean different methods for similarity. To allow different methods for
similarity, different image descriptors are needed. Image descriptors may account for
different properties of images. In such systems, images are typically represented by
approximations of their contents. Typical approximations consist of statistics, and Fourier
or wavelet transformations of the raw image data. This so-called feature extraction which
aims to extracting information that is semantically meaningful but needs a small amount of
storage [52]. These features are used for computing the similarity between images. Then,
some measurement methods are used to calculate the similarity between images. For fast
retrieval, an indexing structure based on the query model is developed. These main steps to
build a CBIR system are illustrated in Figure 3.1.

CBIR System Based on the Clustering and Genetic Algorithm
17
Figure (3.1): An Overview of A CBIR System.
In this chapter, we will define image features and explain their properties in section 3.2. An
overview of some methods for similarity measures will be given in section 3.3. In section
3.4, we will present some of the indexing structures that are commonly used in CBIR
systems. Finally, GA will be discussed in section 3.5.
3.2 Feature Extraction
Feature extraction is very crucial step in image retrieval system to describe the image with
minimum number of descriptors. It is a means of extracting compact but semantically
useful information from images which can describe the image with its content. A “feature”
means anything that is localized, meaningful and detectable. If we talk about image
features, we mean objects in that image such as corners, lines, shapes, textures, and
motions. Features extracted from an image describe and define the content of that image.
These Features are used as a signature for the image. Similar images should have similar
signatures. We mean by image features the characteristic properties. For example if we
look at the image shown in Figure 3.2, the white color and the texture of the building are
characteristic properties. In a similar way, the sky can be described by its blue color.
Furthermore, we can take the size of the objects in the image into account.
Figure (3.2): An Example of Color Image Properties.

CBIR System Based on the Clustering and Genetic Algorithm
18
A wide variety of features had been considered for image retrieval. To describe an image,
we have to consider its main features. Selecting suitable image features is an important step
so that it can represent the content of the image very well. Representation of images needs
to consider which features are most useful for representing the contents of images and
which approaches can effectively code the attributes of the images. Feature extraction of
the image in the database is typically conducted off-line so computation complexity is not a
significant issue. Color, texture, and shape are some image features that can be used to
describe an image. However, no particular feature is most suitable for retrieving all types of
images. Color images need color features that are most suitable to describe them. Images
containing visual patterns, surface properties, and scene need texture features to describe
them. In reality, no one particular feature can describe an image completely. Many images
have to be described by more than one feature. For example, color and texture features are
best features to describe natural scenes. This section introduces three features: color,
texture, and shape, which are used most often to extract the features of an image.
3.2.1 Color Features
One of the most important features visually recognized by humans in images is color. Color
is the sensation caused by the light as it interacts with our eyes and brain. Humans tend to
distinguish images based mostly on color features. Because of this, color features are the
most widely used in CBIR systems and it is the most studied in literature. Color is a
powerful descriptor that simplifies object identification, and it is one of the most frequently
used visual features for content-based image retrieval. To extract the color features from the
content of an image, a proper color space (also called color models or color systems) and an
effective color descriptor have to be determined.
Color space
To extract the color features from the content of an image, we need to select a color space
and use its properties in the extraction. In common, colors are defined in three-dimensional
color space. The purpose of the color space is to facilitate the specification of colors in
some standard, accepted way. Several color spaces are used to represent images for
different purposes. The RGB color space is the most widely used color space. RGB stands
for Red, Green, and Blue. RGB color space combines the three colors in different ratio to
create other colors. In digital image purposes, RGB color space is the most prevalent
choice. The main drawback of the RGB color space is that it is perceptually non-uniform.
To overcome the drawback of the RGB color space, different color spaces are proposed.
The HSx color space is commonly used in digital image processing that converts the color
space of the image from RGB color space to one of the HSx color spaces. HSx color space
contains the HSI, HSV, HSB color spaces. They are common to human color perception.
HS stands for Hue and Saturation. I, V, and B stand for Intensity, Value, and Brightness,
respectively. The difference between them is their transformation method from the RGB

CBIR System Based on the Clustering and Genetic Algorithm
19
color space. Hue describes the actual wavelength of the color. Saturation is the measure of
the purity of the color. For example, red is 100% saturated color, but pink is not 100%
saturated color because it contains an amount of white. Intensity describes the lightness of
the color. HSV color space is the most widely used when converting the color space from
RGB color space [53].
A color space is a specification of a coordinate system and a subspace within the system
where each color is represented by a single point. The purpose of a color space is to
facilitate the specification of colors. Each color in the color space is a single point
represented in a coordinate system. Several color spaces, such as RGB, HSV, CIE L*a*b,
and CIE L*u*v, have been developed for different purposes [54]. Although there is no
agreement on which color space is the best for CBIR, an appropriate color system is
required to ensure perceptual uniformity. In most digital image processing, RGB color
space is used in practice for color monitors and CMY (cyan, magenta, yellow) color space
is used for color printing. In our work, we will use RGB as a color space.
RGB Color space
RGB color model is the most common color model in use. The primary colors are red,
green, and blue. We can imagine the RGB color space as a unit cube with red, green, and
blue axes as shown in Figure 3.3. Any color in this space can be represented by a vector of
three coordinates. From the Figure, the RGB model is based on a Cartesian coordinate
system. The three coordinates of the system are the primary colors of the model. The color
black is at the origin of the plane, and the color white is at the farthest corner from black.
The different colors in this model are on or inside the cube, and they are defined by vectors
extending from the origin. Images represented in the RGB color model consist of three
component images, one for each primary color. When a monitor displays the image, the
three images are combined to produce the original image. The number of bits used to
represent each pixel is called the pixel depth. For example, if we represent each primary
color in the RGB model by 8 bits, then each pixel in an RGB color image is represented
using 24 bits (8 bits for each primary color). In general, the total number of colors in a 24-
bit RGB image is (28)3 that is equal to 16,777,216 colors. Figure 3.4 shows an RGB image
and its three colors components.
After selecting a color space, an effective color descriptor should be developed in order to
represent the color of the global area. Several color descriptors have been developed from
various representation schemes, such as color histograms [55], color moments [56], color
edge [57], color texture [58], and color correlograms [29]. The most important of them are
the color histogram and the color moments which will be explained briefly in the next
subsections.

CBIR System Based on the Clustering and Genetic Algorithm
20
Figure (3.3): RGB Color Space.
Figure (3.4): An RGB Image and Its Three colors Components.
Color Histograms
As mentioned before, the most commonly used method to represent color feature of an
image is the color histogram. Many CBIR systems use color histograms as a color feature
to represent the image. A color histogram is a type of bar graph, where the height of each
bar represents an amount of particular color of the color space being used in the image [54].
The bars in a color histogram are named as bins and they represent the x-axis where the
number of bins depends on the number of colors in the image. The number of pixels in each
bin denotes y-axis, which shows how many pixels in an image are of a particular color. The
color histogram can not only easily characterize the global and regional distribution of
colors in an image, but also be invariant to rotation about the view axis.
CBIR System Based on the Clustering and Genetic Algorithm
21
In color histograms, quantization is a process where number of bins is reduced by taking
colors that are similar to each other and placing them in the same bin. Reducing the number
of colors will decrease the possibility that similar colors are assigned to different bins, but it
will increase the possibility that distinct colors may be assigned to the same bins. This step
will decrease the information can be gained from the image about its content. Quantizing
reduces the space required to store the histogram information and time to compare the
histograms. Obviously, quantization reduces the information regarding the content of
images; this is the tradeoff between space, processing time, and accuracy in results [60].
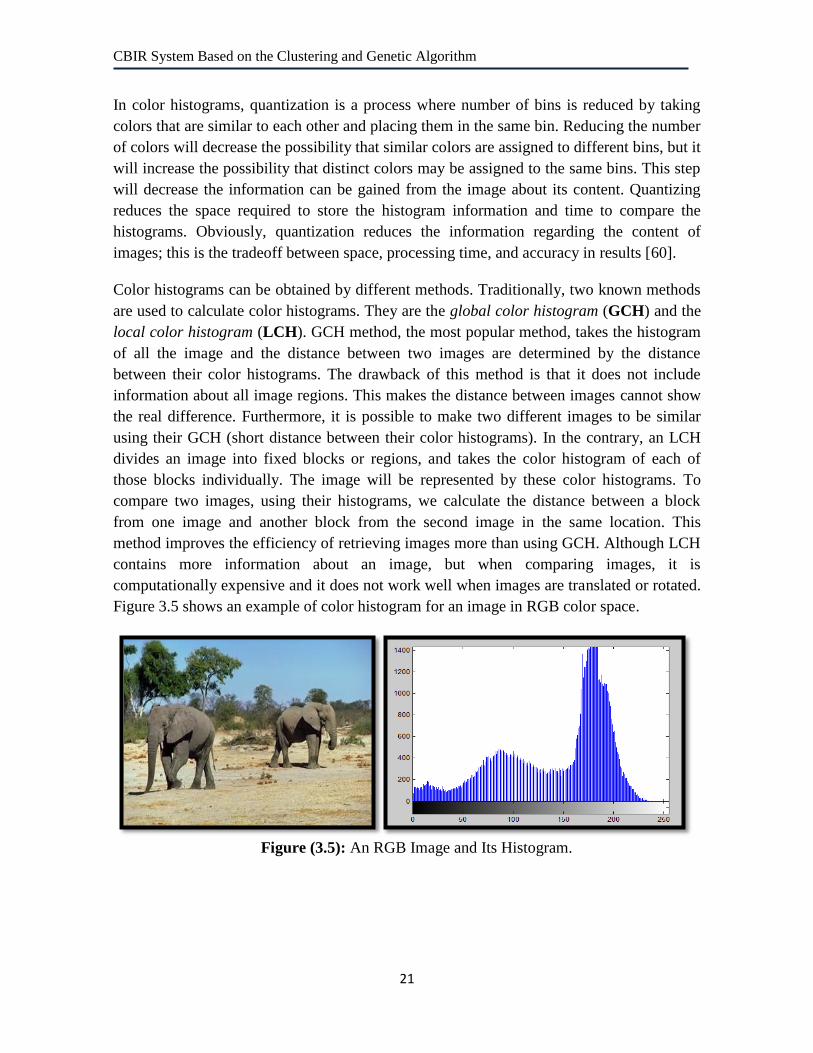
Color histograms can be obtained by different methods. Traditionally, two known methods
are used to calculate color histograms. They are the global color histogram (GCH) and the
local color histogram (LCH). GCH method, the most popular method, takes the histogram
of all the image and the distance between two images are determined by the distance
between their color histograms. The drawback of this method is that it does not include
information about all image regions. This makes the distance between images cannot show
the real difference. Furthermore, it is possible to make two different images to be similar
using their GCH (short distance between their color histograms). In the contrary, an LCH
divides an image into fixed blocks or regions, and takes the color histogram of each of
those blocks individually. The image will be represented by these color histograms. To
compare two images, using their histograms, we calculate the distance between a block
from one image and another block from the second image in the same location. This
method improves the efficiency of retrieving images more than using GCH. Although LCH
contains more information about an image, but when comparing images, it is
computationally expensive and it does not work well when images are translated or rotated.
Figure 3.5 shows an example of color histogram for an image in RGB color space.
Figure (3.5): An RGB Image and Its Histogram.

CBIR System Based on the Clustering and Genetic Algorithm
22
Color Moments
Color moments are measures that can be used differentiate images based on their features
of color. Once calculated, these moments provide a measurement for color similarity
between images. These values of similarity can then be compared to the values of images
indexed in a database for tasks like image retrieval. The basis of color moments lays in the
assumption that the distribution of color in an image can be interpreted as a probability
distribution. Probability distributions are characterized by a number of unique moments. It
therefore follows that if the color in an image follows a certain probability distribution, the
moments of that distribution can then be used as features to identify that image based on
color.
There are many central moments of an image's color distribution. The most important of
them are Mean, Standard deviation and Skewness. Mean can be understood as the average
color value in the image. The standard deviation is the square root of the variance of the
distribution. Skewness can be understood as a measure of the degree of asymmetry in the
distribution.
Therefore, in our thesis, the moments of the color distribution are the features extracted
from the images, and we will use them as a color descriptor for the image in our proposed
global features based retrieval system, as will be detailed in Chapter 4.
3.2.2 Texture Features
In the field of computer vision and image processing, there is no clear-cut definition of
texture. This is because available texture definitions are based on texture analysis methods
and the features extracted from the image. However, texture can be thought of as repeated
patterns of pixels over a spatial domain, of which the addition of noise to the patterns and
their repetition frequencies results in textures that can appear to be random and
unstructured. Texture properties are the visual patterns in an image that have properties of
homogeneity that do not result from the presence of only a single color or intensity. The
different texture properties as perceived by the human eye are, for example, regularity,
directionality, smoothness, and coarseness, see Figure 3.6(a). In real world scenes, texture
perception can be far more complicated. The various brightness intensities give rise to a
blend of the different human perception of texture as shown in Figure 3.6(b).
Image textures have useful applications in image processing and computer vision. They
include: recognition of image regions using texture properties, known as texture
classification, recognition of texture boundaries using texture properties, known as texture
segmentation, texture synthesis, and generation of texture images from known texture
models. Since there is no accepted mathematical definition for texture, many different
methods for computing texture features have been proposed over the years. Unfortunately,
there is still no single method that works best with all types of textures. According to

CBIR System Based on the Clustering and Genetic Algorithm
23
Manjunath and Ma [61], the commonly used methods for texture feature description are
statistical, model-based, and transform-based methods.
Figure (3.6): Examples of Texture Images.
Statistical Methods
Statistical methods analyze the spatial distribution of grey values by computing local
features at each point in the image, and deriving a set of statistics from the distribution of
the local features. They include co-occurrence matrix representation; statistical moments,
gray level differences, autocorrelation function, and grey level run lengths.
The most commonly used statistical method is the Gray-level Co-occurrence Matrix
(GLCM). It is a two-dimensional matrix of joint probabilities 𝑃𝑑 ,𝑟(𝑖, 𝑗) between pairs of
pixels, separated by a distance, 𝑑, in a given direction, 𝑟. It is popular in texture description
and it is based on the repeated occurrence of some gray level configuration in the texture;
this configuration varies rapidly with distance in fine textures and slowly in coarse textures.
Haralick [62] defined 14 statistical features from gray-level co-occurrence matrix for
texture classification, such as energy, entropy, contrast, maximum probability,
autocorrelation, and inverse difference moment. Gray-level co-occurrence matrix method
of representing texture features has found useful applications in recognizing fabric defects,
and in rock texture classification and retrieval [61].
Model Based Approaches
Model-based texture methods try to capture the process that generated the texture. By using
the model-based features, some part of the image model is assumed and an estimation

CBIR System Based on the Clustering and Genetic Algorithm
24
algorithm is used to set the parameters of the model to yield the best fit [61]. To describe a
random field, assume the image is modeled as a function 𝑓 (𝑟, 𝜔), where 𝑟 is the position
vector representing the pixel location in the 2-D space and 𝜔 is a random parameter. For a
given value of 𝑟, 𝑓 (𝑟, 𝜔) is a random variable (because 𝜔 is a random variable). Once a
specific texture 𝜔 is selected, 𝑓 (𝑟, 𝜔) is an image, which is a function over the two-
dimensional grid indexed by 𝑟. Function 𝑓 (𝑟, 𝜔) is called as a random field. There are
currently three major model based methods: Markov random fields, Fractals and The multi-
resolution autoregressive features.
Transform Domain Features
The word transform refers to a mathematical representation of an image. There are several
texture classifications using transform domain features in the past, such as discrete Fourier
transform, discrete wavelet transforms, and Gabor wavelets. Transform methods analyze
the frequency content of the image to determine texture features. Fourier analysis consists
of breaking up a signal into sine waves of various frequencies. On the other hand, wavelet
analysis breaks up a signal into shifted and scaled versions of the original wavelet (mother
wavelet), which refers to decomposition of a signal into a family of basis functions
obtained through translation and dilation of a special function. Moments of wavelet
coefficients in various frequency bands have been shown to be effective for representing
texture [58]. Gabor filter (or Gabor wavelet) has been shown to be very efficient.
Manjunath and Ma [61] have shown that image retrieval using Gabor features outperforms
that using other transform features.
Therefore in our thesis, we will use Gabor wavelet transform as our technique to extract
the texture features. Gabor wavelet and its implementation for texture feature extraction
will be detailed briefly in chapter 4.
3.2.3 Shape Features
Shape is known to play an important role in human recognition and perception and object
shape features provide a powerful clue to object identity. Humans can recognize objects
solely from their shapes. The significance of shape as a feature for content-based image
retrieval can be seen from the fact that every major content-based image retrieval system
incorporates some shape features in one form or another [49]. Shape of an object is the
characteristic surface configuration as represented by the outline or contour. Shape
recognition is one of the modes through which human perception of the environment is
executed. It is important in CBIR because it corresponds to region of interests in images.
Shape feature representations are categorized according to the techniques used. They are
boundary-based and region-based. In region-based techniques, all the pixels within a shape
are taken into account to obtain the shape representation. Common region based methods
use moment descriptors to describe shape [44]. Region moment representations interpret a
normalized gray level image function as a probability density of a 2-D random variable.

CBIR System Based on the Clustering and Genetic Algorithm
25
Because moments combine information across an entire object rather than providing
information just at a single boundary point, they capture some of the global properties
missing from many pure contour-based representations. Comparing with region based
shape representation; contour based shape representation is more popular. Contour based
shape representation only exploits shape boundary information. Simple contour-based
shape descriptors include area, perimeter, compactness, eccentricity, elongation, and
orientation. Complex boundary-based descriptors include Fourier descriptors, grid
descriptors, and chain codes.
Edge is local shape feature and it captures the general shape information in the image [38].
Since edges play an important role for image perception, it is frequently used as a feature
descriptor in image retrieval. The edge histogram descriptor is such an example; which
represents the spatial distribution of five types of edges, namely four directional edges and
one non-directional edge [36]. These five types of edges evolve from the color distribution
within the edges; more precisely it can be said that these edges immerse from the color
distribution of pixels and from an internal feature of edge shape descriptor.
In our thesis, edge histogram features that include five categories will be used as shape
descriptor. Our techniques to extract this shape features will be detailed in chapter 4.
3.3 Similarity Measure
The similarity between two images (represented by their features values) is defined by a
similarity measure. Selection of similarity metrics has a direct impact on the performance
of content-based image retrieval [26]. The kind of features vectors selected determines the
kind of measurement that will be used to compare their similarity [8]. If the features
extracted from the images are presented as multi-dimensional points, the distances between
corresponding multi-dimensional points can be calculated. Euclidean distance is the most
common metric used to measure the distance between two points in multi-dimensional
space [8]. Many systems used the Euclidean Distance such as Netra, MARS, and
Blobworld. The distance between two images X and Y with n-dimensional features vectors,
is calculated by Equation 3.1:
𝐷 𝑋, 𝑌 = 𝑥𝑘 − 𝑦𝑘 2𝑛
𝑘=1 (3.1)
A number of other metrics, such as Mahalanobis distance, Minkowski distance, Earth
Mover‟s distance, and Proportional Transportation distance, have been proposed for
specific purposes. In our thesis, we will use Euclidean Distance as a basis to design our
new similarity metric to compute similarities between images.
3.4 Indexing Structures
The large numbers of images has posed increasing challenges to computer systems to store
and manage data effectively and efficiently. Our world contains many digital images of

CBIR System Based on the Clustering and Genetic Algorithm
26
different categories. Images are stored in digital libraries or databases. When manipulating
massive databases, a good indexing is a necessity. Processing every single item in a
database, when performing queries, is extremely inefficient and slow, because the databases
contain huge number of images. When working with text-based documents, creating good
indexes is not very difficult. Simply maintaining a list of all words in the database, and
information on which documents contain which words, is quite good. When searching for a
phrase, the system first checks the index for which documents contain all the necessary
search words. Next, in-depth processing only needs to be done with these documents.
When searching for images, however, this approach is much more difficult. Raw image
data is non-indexable as such, so the feature vectors must be used as the basis of the index.
Indexing schema is important in CBIR systems. Indexing methods are proposed to
accelerate searching and retrieving steps. Indexing methods categorize images in the
database to groups. Each group contains similar images. This can be a preprocessing step
for CBIR system. Features extracted from images in the database are used for indexing.
Popular multi-dimensional indexing methods include the R-tree and the R*-tree algorithms.
The k-means is also one of the indexing structures [6].
In our thesis, we will use k-means algorithm as a clustering algorithm for indexing. K-
means algorithm will be used to cluster the database into clusters. Within these clusters, the
search step will be performed by means of nearest neighbor search. When the user submits
a query image, it will be compared with each cluster‟s centroid. According to the similarity
with the query image, the clusters will be ranked. The query image will be compared with
the images in the top ranked cluster. This method will reduce the number of comparisons
which, in this case, depends only on the number of clusters and the number of images in the
top ranked cluster. This cuts down processing time quite a lot. K-means, the indexing
technique used in this thesis, will be discussed in Chapter 4.
In the end, our feature vector consists of three parts, types of features, namely color, texture
and shape. By assigning equal weights for each feature type, we can‟t achieve good results
in terms of average precision and recall (will be defined in chapter 5). This problem can be
solved by assigning different weights to each feature and these weights must be optimized
using genetic algorithm (GA) with a suitable fitness function to select optimum weights of
features. This exactly, what we will do in our system design. GA will be discussed in the
following section.
3.5 Genetic Algorithms
In 1975, Holland described a methodology for studying natural adaptive systems and
designing artificial adaptive systems [14]. It is now frequently used as an optimization
method, based on an analogy to the process of natural selection in biology. The biological
basis for the adaptation process is evolution from one generation to the next, based on
elimination of weak elements and retention of optimal and near-optimal elements (“survival

CBIR System Based on the Clustering and Genetic Algorithm
27
of the fittest”). Searching this representation space is performed using so-called “Genetic
Algorithms” (GA‟s). The genetic algorithm is now widely recognized as an effective search
paradigm in artificial intelligence, image processing, VLSI circuit layout, optimization of
bridge structures, solving of non-linear equations, correction of test data with functional
grouping, and many other areas.
In a genetic algorithm approach, a solution (i.e., a point in the search space) is called a
“chromosome” or string [19]. A GA approach requires a population of chromosomes
(strings) representing a combination of features from the solution set, and requires a cost
function (called an evaluation or fitness function) F(.). This function calculates the fitness
of each chromosome. The algorithm manipulates a finite set of chromosomes (the
population), based loosely on the mechanism of evolution. In each generation,
chromosomes are subjected to certain operators, such as selection, crossover, and mutation,
which are analogous to processes which occur in natural reproduction. So GA can be
divided to four sequential main operations namely as population, selection, recombination
(or crossover) and mutation as shown in Figure 3.7 below. These operations will be
illustrated in detail later.
The optimization process is performed in cycles called generations. During each
generation, a set of new chromosomes is created using crossover, inversion, mutation and
other operators. Since the population size is fixed, only the best chromosomes are allowed
to survive to the next cycle of reproduction. (There is considerable variation among various
implementation of the genetic algorithm approach in the strictness with which the principle
of “survival of the fittest” is applied. In some system, the fitness affects only the probability
of survival, whereas in others, only the N fittest individuals are allowed to survival at each
generation).
Figure (3.7): Main Operators of Genetic Algorithm.

CBIR System Based on the Clustering and Genetic Algorithm
28
The crossover rate usually assumes quite a high value (on the order of 80%), while the
mutation rate is small (typically 1- 15%) for efficient search [16]. The cycle repeats until
the population “converges”, that is all the solutions are reasonably the same and further
exploration seems fruitless, or until the answer is “good enough”. Note that the number of
generations required could be anywhere from hundreds to millions. A block diagram for
GA is shown in Figure 3.8.
The popularity of GA is motivated by a number of factors including:
Evolution is known to be a successful, robust method for adaptation within
biological systems.
GA can search spaces of hypotheses containing complex interacting parts, where the
impact of each part on overall hypothesis fitness may be difficult to model.
GA are easily parallelized and can take advantage of the decreasing costs of
powerful computer hardware.
GA has been increasingly applied in conjunction with other AI techniques. However, few
studies have dealt with the combining GA and K-means, though there is a great potential
for useful applications in this area. The problem addressed by GA is to search a space of
candidate hypotheses to identify the best hypothesis. In GA the "best hypothesis" is defined
as the one that optimizes a predefined numerical measure for the problem at hand, called
the fitness. For example, if the learning task is the problem of approximating an unknown
function given training examples of its input and output, then fitness could be defined as
the accuracy of the hypothesis over this training data. If the task is to learn a strategy for
playing chess, fitness could be defined as the number of games won by the individual when
playing against other individuals in the current population.
Although different implementations of genetic algorithms vary in their details, they
typically share the following structure: The algorithm operates by iteratively updating a
pool of hypotheses, called the population. On each iteration, all members of the population
are evaluated according to the fitness function. A new population is then generated by
probabilistically selecting the fittest individuals from the current population. Some of these
selected individuals are carried forward into the next generation population intact. Others
are used as the basis for creating new offspring individuals by applying genetic operations
such as crossover and mutation.

CBIR System Based on the Clustering and Genetic Algorithm
29
Figure (3.8): Block Diagram of GA.
3.5.1 Genetic Operators
GA searches for better solutions by genetic operations, including selection operation,
crossover operation and mutation operation.
1. Selection Operation
Selection operation is to select elitist individuals as parents in current population, which can
generate offspring. Fitness values are used as criteria to judge whether individuals are
elitist. There are many methods how to select the best chromosomes, for example roulette
wheel selection, Boltzman selection, tournament selection, rank selection, steady-state
selection, elitism selection and some others. Some of them will be described shortly.
Roulette Wheel Selection
Parents are selected according to their fitness. The better the chromosomes are, the more
chances to be selected they have. Imagine a roulette wheel where are placed all
chromosomes in the population, every has its place big accordingly to its fitness function
like on the Figure 3.9. Chromosome with bigger fitness will be selected more times.
Figure (3.9): Roulette Wheel Selection.

CBIR System Based on the Clustering and Genetic Algorithm
30
Rank Selection
The previous selection method will have problems when the fitness‟s differ very much. For
example, if the best chromosome fitness is 90% of the entire roulette wheel, then the other
chromosomes will have very few chances to be selected. Rank selection first sorts the
population by fitness and then every chromosome receives fitness from this ranking. The
worst will have fitness 1, second worst 2 etc. and the best will have fitness N (number of
chromosomes in population). After this, all the chromosomes have a chance to be selected.
The probability that a chromosome will be selected is then proportional to its rank in this
sorted list, rather than its fitness. But this method can lead to slower convergence, because
the best chromosomes do not differ so much from other ones.
Elitism Selection
When creating new population by crossover and mutation; we have a big chance, that we
will lose the best chromosome. Elitism is name of method, which first copies the best
chromosome (or a few best chromosomes) to new population. The rest is done in
classical way. Elitism can very rapidly increase performance of GA, because it prevents
losing the best found solution.
2. Crossover Operation
The generation of successors in a GA is determined by a set of operators that recombine
and mutate selected members of the current population. The two most common operators
are crossover and mutation. The crossover operator produces two new offspring from two
parent strings, by copying selected bits from each parent. The bit at position 𝑖 in each
offspring is copied from the bit at position 𝑖 in one of the two parents. The choice of which
parent contributes the bit for position 𝑖 is determined by an additional string called the
crossover mask. Figure 3.10 below illustrates crossover operator briefly. There are three
types of crossover operators, namely as single-point, two-point and uniform crossover.
Single-Point Crossover
In the single-point crossover, the crossover mask is always constructed so that it begins
with a string containing n contiguous 1s, followed by the necessary number of 0s to
complete the string. This results in offspring in which the first n bits are contributed by one
parent and the remaining bits by the second parent. Each time the single-point crossover
operator is applied, the crossover point n is chosen at random, and the crossover mask is
then created and applied. To illustrate, consider the single-point crossover operator at the
top of the figure and consider the topmost of the two offspring in this case. This offspring
takes its first five bits from the first parent and its remaining six bits from the second
parent, because the crossover mask 11111000000 specifies these choices for each of the bit
positions. The second offspring uses the same crossover mask, but switches the roles of the
two parents. Therefore, it contains the bits that were not used by the first offspring.

CBIR System Based on the Clustering and Genetic Algorithm
31
Two-Point Crossover
In two-point crossover, offspring are created by substituting intermediate segments of one
parent into the middle of the second parent string. Put another way, the crossover mask is a
string beginning with n0 zeros, followed by a contiguous string of nl ones, followed by the
necessary number of zeros to complete the string. Each time the two-point crossover
operator is applied, a mask is generated by randomly choosing the integers n0 and nl. For
instance, in the example shown in Figure 3.10 the offspring are created using a mask for
which n0= 2 and nl = 5. Again, the two offspring are created by switching the roles played
by the two parents.
Uniform Crossover
Uniform crossover combines bits sampled uniformly from the two parents, as illustrated in
Figure 3.10. In this case the crossover mask is generated as a random bit string with each
bit chosen at random and independent of the others.
3. Mutation Operation
In addition to recombination operators that produce offspring by combining parts of two
parents, a second type of operator produces offspring from a single parent. In particular, the
mutation operator produces small random changes to the bit string by choosing a single bit
at random, then changing its value. Mutation is often performed after crossover as in Figure
3.10.
Figure (3.10): Crossover and Mutation Operators.
CBIR System Based on the Clustering and Genetic Algorithm
32
3.5.2 Fitness Function
The fitness function defines the criterion for ranking potential hypotheses and for
probabilistically selecting them for inclusion in the next generation population. If the task is
to learn classification rules, then the fitness function typically has a component that scores
the classification accuracy of the rule over a set of provided training examples. Often other
criteria may be included as well, such as the complexity or generality of the rule. More
generally, when the bit-string hypothesis is interpreted as a complex procedure (e.g., when
the bit string represents a collection of if-then rules that will be chained together to control
a robotic device), the fitness function may measure the overall performance of the resulting
procedure rather than performance of individual rules.
3.5.3 Outline of the Basic Algorithm
Genetic Algorithm is starts with a set of solutions represented by chromosomes, called
population. Solutions from one population are taken and used to form a better new
population. Solutions which are selected to form new solutions (offspring) are selected
according to their fitness - the more suitable they are the more chances they have to
reproduce [37]. This is repeated until some condition (for example number of populations
or improvement in the best solution) is satisfied. Genetic Algorithm is given in table 3.1:
3.5.4 Weights Optimization Problem
The focus of our research is to build a universal CBIR system using low level features.
These features are moments of the image color, the texture feature using Gabor transform
and the edge histogram. We assign different weights to each feature type and these weights
must be optimized using GA with a suitable fitness function to select optimum weights for
the features. This problem can describe formally as follow:
If we define w, the weight vector, to be a vector generated by the GA, then we multiply w
by each pattern vector x, yielding the new feature vector y. That is,
𝑦 = 𝑤 𝑥 (3.2)
Where, w = [w1, w2, wx = [x1, x2, , xN], N = |x| and wk > 0

CBIR System Based on the Clustering and Genetic Algorithm
33
Table (3.1): Genetic Algorithm
Purpose: Genetic algorithm to search a space of candidate solutions to identify the best
one.
Input: Fitness function, crossover probability, mutation probability,
population size, maximum iteration.
Output: The fittest solution.
Procedure:
{
1. [Start] Generate random population of n chromosomes (suitable solutions for the
problem).
2. [Fitness] Evaluate the fitness f(x) of each chromosome x in the population.
3. [New population] Create a new population by repeating following steps until the
new population is complete
a. [Selection] Select two parent chromosomes from a population according to
their fitness (the better fitness, the bigger chance to be selected).
b. [Crossover] With a crossover probability cross over the parents to form a new
offspring (children). If no crossover was performed, offspring is an exact copy
of parents.
c. [Mutation] With a mutation probability mutate new offspring at each locus
(position in chromosome).
d. [Accepting] Place new offspring in a new population.
4. [Replace] Use new generated population for a further run of algorithm.
5. [Test] If the end condition is satisfied, stop, and return the best solution in current
population.
6. [Loop] Go to step 2.
}

CBIR System Based on the Clustering and Genetic Algorithm
34
Chapter 4
The Proposed CBIR System
4.1 Introduction
In this chapter, we introduce our proposed CBIR system. In this system, we will extract
some features to represent the image and use these features to compare between the images.
This system defines the similarity between contents of two images based on global features
(i.e., features extracted from the whole image).
Color is a powerful descriptor that simplifies object identification, and it is one of the most
frequently used visual features for content-based image retrieval. To extract the color
features from the content of an image, a proper color space and an effective color descriptor
have to be determined. In addition, color histogram technique is applied for color feature
representation combined with histogram intersection technique for color similarity measure.
Texture is one of the crucial primitives in human vision and texture features have been used
to identify contents of images. Moreover, texture can be used to describe contents of
images, such as clouds, bricks, hair, etc. Both identifying and describing contents of an
image are strengthened when texture is integrated with color, hence the details of the
important features of image objects for human vision can be provided. In the proposed
system, Gabor filters, a tool for texture features extraction that has been proved to be very
effective in describing visual contents of an image via multi-resolution analysis, is used.
Shape is known to play an important role in human recognition and perception. Object
shape features can also provide powerful information for image retrieval, because humans
can recognize objects solely from their shapes. Usually, the shape carries semantic
information, and shape features are different from other elementary visual features, such as
color or texture features [39]. Basically, shape features can be categorized as boundary-
based and region-based. The former extracts features based on the outer boundary of the
region while the latter extracts features based on the entire region [44]. The significance of
shape as a feature for content-based image retrieval can be seen from the fact that every
major CBIR system incorporates some shape features in one form or another. Our
techniques to extract shape feature will be detailed later in this Chapter.
A similarity distance between two images is defined based on color, texture and shape
features to decide which images in the image database are similar to the query and should
be retrieved to the user. Figure 4.1 shows a block diagram for the proposed CBIR system
The architecture details of this proposed system are described in the following sections.
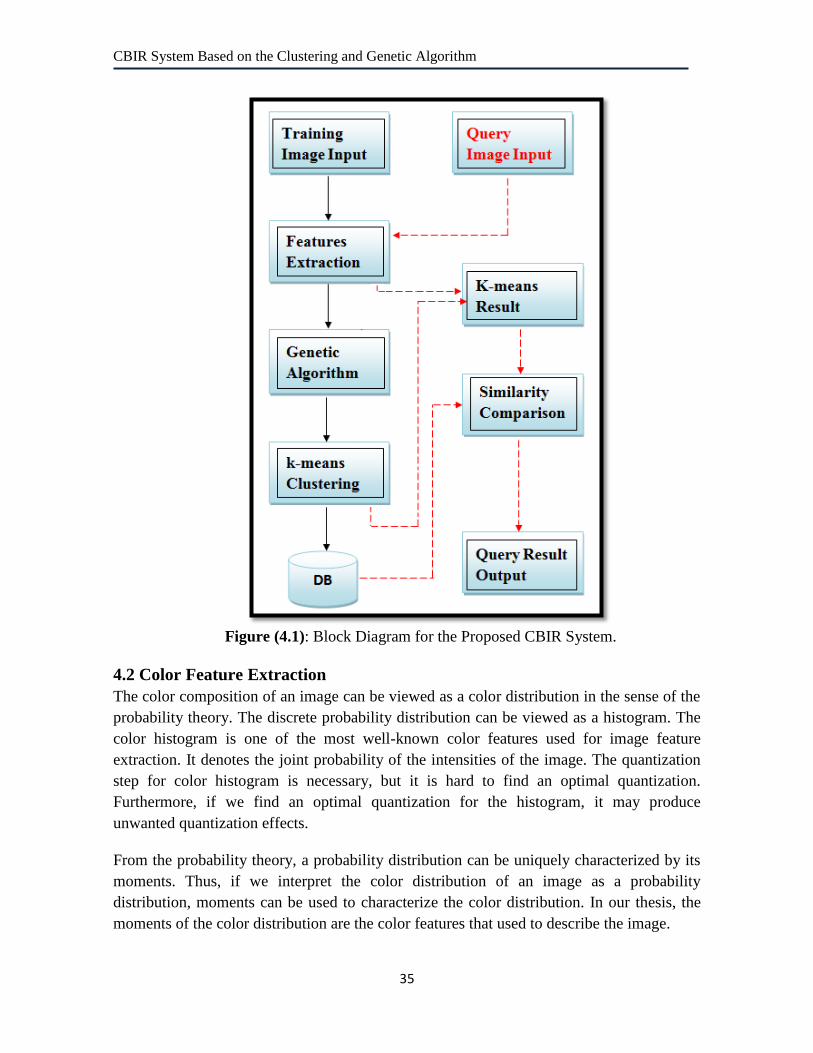
CBIR System Based on the Clustering and Genetic Algorithm
35
Figure (4.1): Block Diagram for the Proposed CBIR System.
4.2 Color Feature Extraction
The color composition of an image can be viewed as a color distribution in the sense of the
probability theory. The discrete probability distribution can be viewed as a histogram. The
color histogram is one of the most well-known color features used for image feature
extraction. It denotes the joint probability of the intensities of the image. The quantization
step for color histogram is necessary, but it is hard to find an optimal quantization.
Furthermore, if we find an optimal quantization for the histogram, it may produce
unwanted quantization effects.
From the probability theory, a probability distribution can be uniquely characterized by its
moments. Thus, if we interpret the color distribution of an image as a probability
distribution, moments can be used to characterize the color distribution. In our thesis, the
moments of the color distribution are the color features that used to describe the image.
CBIR System Based on the Clustering and Genetic Algorithm
36
The first order (mean), the second (standard deviation) and the third order (skewness) color
moments have been proved to be efficient and effective in representing color distributions
of images. Since we are working with RGB image (H x W x 3), we have to calculate mean,
standard deviation and skewness separately for each channel. In this case, each of them will
be 3-values vector. In total we have 3 x 3 = 9 values for each image.
If the value of the 𝑖𝑡 color channel at the 𝑗𝑡 image pixel is 𝑝𝑖𝑗 , then the color moments are
as the following:
Moment 1: Mean
𝐸𝑖 =1
𝑁 𝑝𝑖𝑗
𝑁𝑗=1 (4.1)
Moment 2: Standard Deviation
𝜎𝑖 = 1
𝑁 𝑝𝑖𝑗 − 𝐸𝑖
2𝑁𝑗 =1 (4.2)
Moment 3: Skewness
𝑠𝑖 = 1
𝑁 𝑝𝑖𝑗 − 𝐸𝑖
3𝑁𝑗=1
3 (4.3)
For color image, color moments are very compact representation features compared with
other color features since only 9 numerical values are used to represent the color content of
each image channel.
4.2.1 Color Similarity Measure
To test the similarity between a query image q and a database image d based on their color
feature, A function of the similarity between two image distributions is defined as the sum
of the weighted differences between the moments of the two distributions. Formally this is:
𝐷𝑐 𝑞, 𝑑 = 𝐸𝑖1 − 𝐸𝑖
2 + 𝜎𝑖1 − 𝜎𝑖
2 + 𝑠𝑖1 − 𝑠𝑖
2 𝑟𝑖=1 (4.4)
Where: q and d :are the two images to be compared.
i :is the current image component index that is 1= R, 2 = G, and 3 = B.
r :is the number of image layers that is 3.
Ei1, Ei
2 :are the means of the two images in the ith
component.
σi1, σi
2 :are the standard deviations of the two images in the ith
component.
si1, si
2 :are the skewness of the two images in the ith
component.

CBIR System Based on the Clustering and Genetic Algorithm
37
4.3 Texture Feature Extraction
Texture feature is computed using Gabor wavelets. Gabor function is chosen as a tool for
texture feature extraction because of its widely acclaimed efficiency in texture feature
extraction. Manjunath and Ma [61] recommended Gabor texture features for retrieval after
showing that Gabor features performs better than that using pyramid-structured wavelet
transform features, tree-structured wavelet transform features and multi-resolution
simultaneous autoregressive model. The detailed descriptions for using Gabor filters in
texture extraction are mentioned below.
4.3.1 The Complex Gabor Function
In 1946, Dennis Gabor proposed to represent signals in time and frequency domain by the
use of elementary functions constructed from a single block, or "mother" signal, by
translation and modulation [43]. By his proposal, any signal of finite duration 𝑇 and
bandwidth 𝐹 can be divided into a finite number of elementary information cells, called
logons. Each logon is of duration 𝛥𝑡 and bandwidth 𝛥𝑓, and is localized at a different time
and frequency in each of the domains. If we let 𝛥𝑡 = 𝑇/𝑀 and 𝛥𝑓 = 𝐹/𝑁, then there are
𝑀𝑁 elementary information cells, and any signal is considered to represent 𝑀𝑁 logons of
information, namely, the 𝑀𝑁 coefficients associated with the cells. This is the most
information that can be represented by the signal, and these 𝑀𝑁 complex coefficients are
sufficient to regenerate the signal.
Basically, Gabor filters are a group of wavelets, with each wavelet capturing energy at a
specific frequency and a specific direction. Expanding a signal using this basis provides a
localized frequency description, therefore capturing local features/energy of the signal.
Texture features can then be extracted from this group of energy distributions. The scale
(frequency) and orientation tunable property of Gabor filter makes it especially useful for
texture analysis. A Gabor function is obtained by modulating a complex sinusoid by a
Gaussian envelope. For the case of one dimensional (1-D) signals, a 1-D sinusoid is
modulated with a Gaussian. This filter will therefore respond to some frequency, but only
in a localized part of the signal. This is illustrated in Figure 4.1 [43]. For two dimensional
(2-D) signals such as images, consider the sinusoid shown in Figure 4.2(a). By combining
this sinusoid with a Gaussian shown in Figure 4.2(b), we obtain a Gabor filter as in Figure
4.2(c).
The 2-D Gabor function can be specified by the frequency of the sinusoid W and the
standard deviation σx and σy, of the Gaussian envelope as:
𝑔 𝑥, 𝑦 =1
2πσx σy exp −
1
2
𝑥2
𝜎𝑥2 +
𝑦2
𝜎𝑦2 + 2𝜋𝑗𝑊𝑥 (4.5)

CBIR System Based on the Clustering and Genetic Algorithm
38
a) 1-D Sinusoid. b) A Gaussian Kernel.
(c) The Corresponding Gabor Filter.
Figure (4.2): Gabor Filter Composition for 1-D Signals.
(a) 2-D sinusoid (b) 2-D Gaussian kernel
(c) The Corresponding Gabor Filter.
Figure (4.3): 2-D Gabor Filter Composition.

CBIR System Based on the Clustering and Genetic Algorithm
39
4.3.2 Texture Representation
The Gabor wavelet image representation is a convolution of that image within the same
family of Gabor kernels given in Equation 4.5. Let 𝐼 𝑥, 𝑦 be the gray level distribution of
an image, the convolution of the image 𝐼 together with a Gabor kernel 𝑔𝑚𝑛 is defined as
follows:
𝐺𝑚𝑛 𝑥, 𝑦 = 𝐼 𝑥 − 𝑠, 𝑦 − 𝑡 𝑡𝑠 𝑔𝑚𝑛 ∗ 𝑠, 𝑡 (4.6)
Where, 𝑠 and 𝑡 are the filter mask size variables, 𝑔𝑚𝑛∗ is the complex conjugate of the
mother Gabor function 𝑔𝑚𝑛 , and 𝐺𝑚𝑛 is the convolution result corresponding to the Gabor
kernel at orientation m and scale n.
After applying Gabor filters on the image with different orientation at different scale, we
obtain an array of magnitudes:
𝐸 𝑚, 𝑛 = 𝑡𝑠 𝐺𝑚𝑛 𝑥, 𝑦 (4.7)
These magnitudes represent the energy content at different scale and orientation of the
image. The main purpose of texture-based retrieval is to find images or regions with similar
texture. It is assumed that we are interested in images or regions that have homogenous
texture, therefore the following mean 𝜇𝑚𝑛 and standard deviation 𝜎𝑚𝑛 of the magnitude of
the transformed coefficients are used to represent the homogenous texture feature of the
region:
𝜇𝑚𝑛 =𝐸 𝑚 ,𝑛
𝑃× 𝑄 (4.8)
𝜎𝑚𝑛 = 𝑦 𝑥 𝐺𝑚𝑛 𝑥 ,𝑦 − 𝜇𝑚𝑛 2
𝑃× 𝑄 (4.9)
A feature vector 𝐹 (texture representation) is created using 𝜇𝑚𝑛 and 𝜎𝑚𝑛 as the feature
components. With M scales and N orientations used in common implementation; the feature
vector is given by:
𝐹Texture = (𝜇00 , 𝜎00 , 𝜇01 , 𝜎01 , …………………………, 𝜇𝑀𝑁 , 𝜎𝑀𝑁) (4.10)
4.3.3 Texture Extraction using Gabor wavelets
A total of twenty-four wavelets are generated from the "mother" Gabor function given in
Equation 4.5 using four scales of frequency and six orientations. Redundancy, which is the
consequence of the non-orthogonality of Gabor wavelets, is addressed by choosing the
parameters of the filter bank to be set of frequencies and orientations that cover the entire

CBIR System Based on the Clustering and Genetic Algorithm
40
spatial frequency space so as to capture texture information as much as possible in
accordance with filter design [46]. The lower and upper frequencies of the filters are set to
0.04 octaves and 0.5 octaves, respectively, the orientations are at intervals of 30 degrees,
and the half-peak magnitudes of the filter responses in the frequency spectrum are
constrained to touch each other as shown in Figure 4.4. Note that because of the symmetric
property of the Gabor function, wavelets with center frequencies and orientation covering
only half of the frequency spectrum (0,𝜋
6 ,𝜋
3, 𝜋
2 ,
3𝜋
2,5𝜋
6) are generated.
Figure (4.4): 2-D Frequency Spectrum View of Gabor Filter Bank.
To extract texture feature from an image, Algorithm in table 4.1 is applied. We first convert
the image from the RGB color space into gray level and implement the group of designed
Gabor filters. Twenty-four filtered images (by using 4 frequencies and 6 orientations),
Gmn(x,y) , are produced by convolution of the gray level image and the Gabor filters as
given in Equation 4.6. Using Equations 4.7, 4.8, and 4.9 given in the previous subsection,
the mean 𝜇𝑚𝑛 and variance 𝜎𝑚𝑛 of the energy distribution 𝐸 𝑚, 𝑛 of the filters responses
are computed to finally get the texture feature vector 𝐹 𝑡𝑒𝑥𝑡𝑢𝑟𝑒 with 48 attributes:
𝐹 𝑡𝑒𝑥𝑡𝑢𝑟𝑒 = (𝜇00 , 𝜎00 , 𝜇01 , 𝜎01 , …………………………, 𝜇35 , 𝜎35).
Our algorithm to extract texture features from an image is summarized in table 4.1 and an
example of the an image and its filter responses is shown in Figure 4.5.

CBIR System Based on the Clustering and Genetic Algorithm
41
Table (4.1): Algorithm for Texture Feature Extraction
Purpose: To extract texture features from an image.
Input: RGB colored image.
Output: Multi-dimension texture feature vector.
Procedure:
{
Step1: Convert the RGB image into gray level.
Step2: Construct bank of 24 Gabor filters using the mother Gabor function with 4
scales and 6 orientations.
Step3: Apply Gabor filters on the gray level of the image by convolution.
Step4: Get the energy distribution of each of the 24 filters responses.
Step5: Compute the mean μ and the standard deviation 𝛔 of each energy distribution.
Step6: Return the texture vector consisting of 48 attributes calculated from step 5.
}
a) An RGB Image. b) Image in Gray Level.
Orientation Varies
c) Filtered Image Responses.
Figure (4.5): An Example of Image Response to Bank of Gabor Filters.
4.3.4 Texture Similarity Measure
To test the similarity between a query image q and a database image d based on their
texture feature we proposed to use the Euclidian distance for its simplicity. Let Tq and Td
denote the texture vector of a query image and an image in the database respectively, we
define the distance between the two texture vectors denoted as Dt(q, d) by the Euclidian
distance as:
Spatial Frequency Varies

CBIR System Based on the Clustering and Genetic Algorithm
42
𝐷𝑡 𝑞, 𝑑 = 𝑇𝑞𝑖− 𝑇𝑑𝑖
248
𝑖=1 (4.11)
4.4 Shape Feature Extraction
Shape is known to play an important role in human recognition and perception and object
shape features provide a powerful clue to object identity. Histogram is the most commonly
used characteristic to represent the global feature composition of an image. It is invariant to
translation and rotation of the images and normalizing the histogram leads to scale
invariance. Exploiting the above properties, the histogram is considered to be very useful
for indexing and retrieving images [50]. Edge is a local shape feature and it captures the
general shape information in the image [36]. Since edges play an important role for image
perception, it is frequently used as a feature descriptor in image retrieval. The Edge
Histogram Descriptor, EHD, is such an example; which represents the spatial distribution
of five types of edges, namely four directional edges and one non-directional edge. To
increase efficiency of the proposed system, edge features that include these five categories
are used as shape features.
4.4.1 Edge Histogram Descriptor
The edge histogram descriptor (EHD) basically represents the distribution of 5 types of
edges in each local area called a sub-image. As shown in figure 4.6, the sub-image is
defined by dividing the image space into 4x4 non-overlapping blocks. Thus, the image
partition always yields 16 equal-sized sub-images regardless of the size of the original
image. To characterize the sub-image, we then generate a histogram of edge distribution for
each sub-image. Edges in the sub-images are categorized into 5 types: vertical, horizontal,
45-degree diagonal, 135-degree diagonal and non-directional edges, as shown in Figure 4.7
[36]. Thus, the histogram for each sub-image represents the relative frequency of
occurrence of the 5 types of edges in the corresponding sub-image.
Figure (4.6): Definition of Sub-image and Image-block in the EHD.

CBIR System Based on the Clustering and Genetic Algorithm
43
Figure (4.7): Five Types of Edges in the EHD.
As a result, as shown in Figure 4.8(a) below, each local histogram contains 5 bins where
each bin corresponds to one of 5 edge types. Since there are 16 sub-images in the image, a
total of 5x16=80 histogram bins is required (shown in Figure 4.8(b)).
a) Five Types of Edge bins. b) 1-D array of 80 bins of EHD.
Figure (4.8): A Sub-image and Its Corresponding EHD.
Semantics of Local Edge Histogram
Note that each of the 80-histogram bins has its own semantics in terms of location and edge
type. For example, the bin for the horizontal type edge in the sub-image located at (0, 0) in
Figure 4.8(a) carries the information of the relative population of the horizontal edges in the
top-left local region of the image. The semantics of the 1-D histogram bins starts from the
sub-image at (0,0) and ending at (3,3), 16 sub-images are visited in the raster scan order
and corresponding local histogram bins are arranged accordingly. Within each sub-image,
the edge types are arranged in the following order: vertical, horizontal, 45-degree diagonal,
135-degree diagonal, and non-directional. Table 4.2 summarizes the complete semantics for
the EHD with 80 histogram bins.

CBIR System Based on the Clustering and Genetic Algorithm
44
Table (4.2): Semantics of Local Edge Bins
Histogram bins Semantics
Local_Edge [0] Vertical edge of sub-image at (0,0)
Local_Edge [1] Horizontal edge of sub-image at (0,0)
Local_Edge [2] 45degree edge of sub-image at (0,0)
Local_Edge [3] 135 degree edge of sub-image at (0,0)
Local_Edge [4] Non-directional edge of sub-image at (0,0)
: : : :
Local_Edge [75] Vertical edge of sub-image at (3,3)
Local_Edge [76] Horizontal edge of sub-image at (3,3)
Local_Edge [77] 45degree edge of sub-image at (3,3)
Local_Edge [78] 135 degree edge of sub-image at (3,3)
Local_Edge [79] Non-directional edge of sub-image at (3,3)
Edge Extraction Method
To extract both directional non-directional edge features, we need to define a small square
image-block. That is, we divide an image space into non-overlapping square blocks and
then we can extract edge information from each block. Note that, regardless of the image
size, we divide the sub-image into a fixed number of image-blocks. That is, the size of the
image-block is proportional to the size of original image to deal with the images with
different resolutions. Equations (4.12) and (4.13) show how to decide the size of the image-
block for a given image. The size of image-block, 𝑥, is assumed to be a multiple of 2. If it
is not a multiple of 2, we can simply ignore some outmost pixels so that the image-block
becomes a multiple of 2.
𝑥 = 𝑖𝑚𝑎𝑔𝑒 _𝑤𝑖𝑑𝑡 ×𝑖𝑚𝑎𝑔𝑒 _𝑖𝑒𝑔𝑡
𝑑𝑒𝑠𝑖𝑟𝑒𝑑 _𝑛𝑜 _𝑏𝑙𝑜𝑐𝑘 (4.12)
𝑏𝑙𝑜𝑐𝑘_𝑠𝑖𝑧𝑒 = 𝑥
2 × 2 (4.13)
Where, 𝑖𝑚𝑎𝑔𝑒_𝑤𝑖𝑑𝑡 and 𝑖𝑚𝑎𝑔𝑒_𝑖𝑒𝑔𝑡 represent the horizontal and vertical sizes of the
image, respectively. The 𝑑𝑒𝑠𝑖𝑟𝑒𝑑_𝑛𝑜_𝑏𝑙𝑜𝑐𝑘 is given and fixed to cope with the various
image resolutions.
A simple method to extract an edge feature in the image-block is to apply digital filters in
the spatial domain. To this end, we first divide the image-block into four sub-blocks as
shown in Figure 4.9. Then, by assigning labels for the four sub-blocks from 0 to 3, we can
represent the average gray levels for the four sub-blocks at 𝑖, 𝑗 𝑡 image-block as 𝑎0 𝑖, 𝑗 ,
𝑎1 𝑖, 𝑗 , 𝑎2 𝑖, 𝑗 , and 𝑎3 𝑖, 𝑗 respectively. Also, we can represent the filter coefficients for
vertical, horizontal, 45-degree diagonal, 135-degree diagonal, and non-directional edges as
𝑓𝑣 𝑘 , 𝑓 𝑘 , 𝑓𝑑45 𝑘 , 𝑓𝑑135 𝑘 , and 𝑓𝑛𝑑 𝑘 respectively, where 𝑘 = 0, … ,3 represents the

CBIR System Based on the Clustering and Genetic Algorithm
45
location of the sub-blocks. We have the coefficients of the vertical edge filter in Figure 4.10
- a) as follows. Similarly, we can represent the filter coefficients for other edge filters as
shown in Figure 4.10 – b), c), d) and e).
Now, the respective edge magnitudes 𝑚𝑣(𝑖, 𝑗), 𝑚(𝑖, 𝑗), 𝑚𝑑45(𝑖, 𝑗), 𝑚𝑑135 𝑖, 𝑗 , and
𝑚𝑛𝑑 𝑖, 𝑗 for the 𝑖, 𝑗 𝑡 image-block can be obtained as follows:
𝑚𝑣 𝑖, 𝑗 = 𝑎𝑘 𝑖, 𝑗 × 𝑓𝑣 𝑘 3𝑘=0 (4.14)
𝑚 𝑖, 𝑗 = 𝑎𝑘 𝑖, 𝑗 × 𝑓 𝑘 3𝑘=0 (4.15)
𝑚𝑑45 𝑖, 𝑗 = 𝑎𝑘 𝑖, 𝑗 × 𝑓𝑑45 𝑘 3𝑘=0 (4.16)
𝑚𝑑135 𝑖, 𝑗 = 𝑎𝑘 𝑖, 𝑗 × 𝑓𝑑135 𝑘 3𝑘=0 (4.17)
𝑚𝑛𝑑 𝑖, 𝑗 = 𝑎𝑘 𝑖, 𝑗 × 𝑓𝑛𝑑 𝑘 3𝑘=0 (4.18)
Figure (4.9): Sub-blocks and their Labeling.
Figure (4.10): Filters for Edge Detection.
Among the calculated five directional edge strengths for five edge types, obtained from
(4.14) to (4.18), if the maximum one of them is greater than a threshold value (𝑇𝑒𝑑𝑔𝑒 ), then
we accept that the block has the corresponding edge type. Then the image-block is
considered to have the corresponding edge in it. Otherwise, the image-block contains no
edge. That is, the image block have an edge if the equation 4.19 below is achieved

CBIR System Based on the Clustering and Genetic Algorithm
46
max 𝑚𝑣 𝑖, 𝑗 , 𝑚 𝑖, 𝑗 , 𝑚𝑑45 𝑖, 𝑗 , 𝑚𝑑135 𝑖, 𝑗 , 𝑚𝑛𝑑 𝑖, 𝑗 > 𝑇𝑒𝑑𝑔𝑒 (4.19)
Non-Normative Global Edge Histogram
To achieve a high retrieval performance, the local histogram alone may not be enough [52].
Rather, we may need edge distribution information for the whole image space as well. That
is, beside the local histogram, we need the global histogram. The global edge histogram
represents the edge distribution for the whole image space. Note that the bin values for all
global histograms can be obtained directly from the local histogram. Since there are five
edge types, the global edge histogram also has five bins. Consequently, we have total 80
bins (local) + 5 bins (global) = 85 bins as shown in Figure 4.11.
Figure (4.11): Total EHD Bins.
4.4.2 Shape Similarity Measure
In the retrieval process where EHD is used, we have used expression (4.20) as an
appropriate similarity distance measure:
𝐷𝑠 𝑑, 𝑞 = 𝑑 𝑖 − 𝑞 𝑖 79𝑖=0 + 𝑑
𝑔 𝑖 − 𝑞
𝑔 𝑖 4𝑖=0 (4.20)
Where 𝑑 𝑖 and 𝑞 𝑖 represent the normalized histogram bin values of image d and q,
respectively, 𝑑𝑔
𝑖 and 𝑞𝑔 𝑖 represent the normalized bin values for the global edge
histograms of these images respectively; which are obtained from the corresponding local
histograms 𝑑 𝑖 and 𝑞 𝑖 . Smaller values imply greater similarity.
4.5 Genetic Algorithm to Optimize Features Weights
As discussed previously, genetic algorithm searches for the “best” weight vector w for the
extracted features. We use k-means classification accuracy, given by equation 3.4, as a
fitness function. That is, we need to find the “best” transformation from pattern space to
feature space for improving the performance of the K-means classifier [47]. This process is
divided into several steps summarized as follows:

CBIR System Based on the Clustering and Genetic Algorithm
47
A. Similarity Measurement
In order to compute the similarity/distance between the query image and the images in the
database, the feature vector of query image and feature vectors of database images have
been compared. So, we get 𝑛 similarities /distances for every comparison. We can‟t
consider this summation of 𝑛 similarities/distances one similarity/distance. Sometimes
using a fewer types of features gives better results and sometimes combination of other
features out of the 𝑛 give improved result [8]. In order to overcome this problem, new
similarity/distance metric has been formed from Equation 3.1 with different weight
assigned to each feature. Considering different weights 𝑤𝑘 may be assigned to different
features, a weighted Euclidean distance is defined as:
𝐷 𝑋, 𝑌 = 𝑤𝑘 𝑥𝑘 − 𝑦𝑘 2𝑛
𝑘=1 (4.21)
Where wk is the weight to be assigned to individual content features. Hence, the task of the
GA consists of finding the wk that maximizes the retrieval accuracy to the context defined
by the query image.
B. Chromosome Encoding and initial population
In order to apply GA to a given problem the first decision one has to make is to determine
the kind of genotype the problem needs, i.e., the chromosome representation. That means, a
decision must be taken on how the parameters of the problem will be mapped into a finite
string of symbols (genes), encoding a possible solution in a given problem space. The
chromosome should in some way contain information about solution which it represents. In
this work a chromosome represents the weights assigned to the similarity/distance of the
features. Each gene Gj of a chromosome corresponds to one feature weight, being mapped
by any of feature weights assigned to similarity/distance associated with that comparison.
This type of encoding is called value encoding where every chromosome is a string of real
numbers.
Let m as the number of feature descriptors, N the size of population. Commonly, population
size N is 20<N<100. Chromosome C of m genes is used to represent the weights wk of
feature descriptors. That is, C=w1w2….wk. In initial population P={C1,C2,…,CN}, all the
genes of the first chromosome C1 are „1.0‟, which means the weights of all the descriptors
are equal. For the other individuals, we randomly generate a set of real numbers wk, where
wk > 0 and k=1,2,…,m.
C. Fitness Function Design
The GA which has been previously optimized has been used. Classification accuracy of k-
means classifier is used to evaluate the fitness of individuals. Fitness function Fitness is
designed as the following:
𝐹𝑖𝑡𝑛𝑒𝑠𝑠 = 𝐾 − 𝑚𝑒𝑎𝑛𝑠𝑎𝑐𝑐𝑢𝑟𝑎𝑐𝑦 (4.22)

CBIR System Based on the Clustering and Genetic Algorithm
48
Where K-meansaccuracy in equation (4.22) is the k-means classification accuracy which can
be calculated by Equation 4.23 below:
𝐾 − 𝑚𝑒𝑎𝑛𝑠𝑎𝑐𝑐𝑢𝑟𝑎𝑐𝑦 = 𝑡 𝑑 (4.23)
Where t is the number of correctly classified images and d is the number of images in the
training set.
D. Genetic Operations
For selection operation, chromosomes are selected from the population to be parents to
crossover. The problem is how to select these chromosomes. According to evolution theory
the best ones should survive and create new offspring. In our system design, we preferred
to use roulette wheel selection with elitist preserved model for selection operation to
increase performance of GA. For crossover operation, we preferred to use single-point
crossover with crossover rate 90%. Mutation operation will be done with mutation rate
0.5% by adding a small number to selected values like next example
C1= (0.29 0.68 0.86 0.17 0.25) => C1= (0.29 0.68 0.96 0.17 0.35).
E. Termination Criteria
We proceed with the next generation until the process reaches the maximum iteration
Genmax. When the process ends, the fittest individual is output as the optimum feature
weights result. The whole structure of the GA/K-means hybrid approach is shown on
Figure 4.12.
Figure (4.12): GA/K-Means Hybrid Approach.

CBIR System Based on the Clustering and Genetic Algorithm
49
4.6 K-Means for Database Clustering
The time of image retrieval in almost all CBIR systems depends in a large degree on the
number of images in the database. Many existing systems attempt to compare the query
image with every target image in the database to find the top matching images, resulting in
an essentially linear search, which is highly computationally inefficient when the database
is large. However, it is a benefit to use all images in the database for similarity matching, so
that the results will be good enough. To overcome this problem, image clustering or
categorization has often been treated as a preprocessing step to speed-up image retrieval in
large databases and to improve the accuracy so that when a query is received, only a part of
the database needs to be searched, while a large portion of the database may be eliminated
in the search. This certainly saves significant query processing time without compromising
the retrieval precision. Clustering algorithms are used as a preprocessing step, performed
offline, to cluster the database into N different categories [12] and each feature vector, along
with its associated class number, is recorded in the database files.
In the proposed system, we use k-means algorithm to classify the feature vectors of the
input images. We select the k-means algorithm because it is suitable to cluster large amount
of data. Each feature vector is treated as an object having a location in space. The cluster
generates in which objects within this cluster are close to each other and far from objects in
other clusters as possible. Selecting the distance measure is an important step in clustering.
The distance measure determines the similarity of two images.
A cluster is a group of objects that are similar to each other within the same group and are
dissimilar to the objects in other groups. Clustering has been widely used in different
applications, including pattern recognition, data analysis, machine learning, and image
processing. K-means is one of the simplest clustering algorithms. In k-means algorithm, the
clustering results are measured by the sum of within-cluster distances between every vector
and its cluster centroid. This criterion ensures that the clusters generated are tight. K-means
algorithm takes k, the number of clusters to be generated, as the input parameter and
partitions a set of N objects into k clusters so that the resulting intra-cluster similarity is
high but the inter-cluster similarity is low. If the number of clusters is not specified, a
simple method is done. The algorithm initializes the number of clusters to a certain number
less than the total number of the dataset. The algorithm increases that number gradually
until the average distance between a vector and its cluster centroid is below a given
threshold [6].
The k-means algorithm works as the following. The number of clusters, k, is entered as an
input parameter. The algorithm randomly selects k of the objects, each of which initially
represents a cluster centroid. The centroid for each cluster is a point to which the sum of
distances from all objects in that cluster is minimized. For each of the remaining objects, an
object is assigned to the cluster to which it is most similar. Similarity between the cluster

CBIR System Based on the Clustering and Genetic Algorithm
50
centroid and the object is determined by a distance. For example, if we use the Euclidean
Distance to measure the similarity and the result is smaller than a threshold, this means that
this object belongs to the cluster. It then computes the new mean for each cluster. This
process is iterated until the criterion function converges. The criterion function used for
convergence is the sum of squared-error, SSE, which defined by:
𝐸 = 𝑝 − 𝑚𝑖 2
𝑝𝜖 𝑐𝑖
𝑘𝑖=1 (4.24)
In equation 4.24, E is the sum of squared error for all objects in the database; p is feature
vector representing the image and 𝑚𝑖 is the mean of cluster 𝑐𝑖 . This criterion attempts to
make the resulting k clusters as separate as possible.
The algorithm tries to determine the k clusters that minimize the squared error function. It
will work well when the clusters are compact and well separated from one another. This
algorithm is relatively scalable and efficient in processing large data sets, but it often
terminates at a local optimum. The k-means algorithm is given in Table 4.3 [64].
Table (4.3): The K-means Algorithm
Purpose: The k-means algorithm for partitioning based on the mean value of the objects
in the cluster.
Input: A database of N objects, number of clusters k.
Output: A set of k clusters.
Procedure:
{
Step1: Arbitrarily choose k objects as the initial cluster centers.
Step2: (Re)Assign each object to the cluster to which the object is the most similar
based on the mean value of objects in the cluster.
Step3: Update the cluster means, i.e., calculate the mean value of the objects for each
cluster.
Step4: Repeat steps 2 and 3 until no changes.
}
4.7 Image Matching
Once we have extracted color, texture and shape feature vectors from the query image, as
well as the database images, we can use these feature vectors to measure the similarity
between images in order to retrieve the most similar DB images to the query. The similarity
between a query image 𝑞 and a DB image 𝑑 is defined by a distance between them, denoted
as 𝐷(𝑞, 𝑑), which is assessed according to the extracted color, texture and shape features.
Two images are equivalent when the distance value between them approaches zero and the
similarity between them decreases as the distance value between them increases.

CBIR System Based on the Clustering and Genetic Algorithm
51
Normalization of Feature Vector
As different feature components have different ranges, the original low-level feature vector
of each descriptor is normalized so that each dimension contributes equally in the similarity
measure. Though the attributes of one feature vector may have different ranges (one of very
small value and one of very high value), therefore a normalization method should be
applied to make all features have the same effect in measuring image similarity. The Min-
Max algorithm [63] is employed as a normalization technique; it performs a linear
transformation on the original data.
Suppose that 𝑚𝑖𝑛𝐴 and 𝑚𝑎𝑥𝐴 are the minimum and maximum values of the attribute A, the
Min-Max normalization maps a value, 𝑣𝑘 of attribute A to 𝑣 𝑘 in the range [0,1] by
computing:
𝑣 𝑘 = 𝑣𝑘 − 𝑚𝑖𝑛 𝐴
𝑚𝑎𝑥 𝐴− 𝑚𝑖𝑛 𝐴 𝐴 = 3 , 𝑘 = 1, … , 𝑁 (4.25)
Where, 𝑣 𝑘 is the normalized feature vector of 𝐴𝑡 attribute and 𝑁 is the number of values
in each feature vector. Then, normalized 𝑣 𝑘 forms normalized image feature vector 𝑉, i.e.
𝑉 = 𝑣 1,𝑣 2,𝑣 3 .
Distance Measure
Using the color distance 𝐷𝑐(𝑞, 𝑑), the texture distance 𝐷𝑡 𝑞, 𝑑 and the shape
distance 𝐷𝑠(𝑞, 𝑑), given in equations (4.4), (4.11) and (4.20) respectively, we define the
weighted distance between two images, 𝐷 𝑞, 𝑑 , as following:
𝑫 𝒒, 𝒅 = 𝒘𝒄 𝑫𝒄 + 𝒘𝒕 𝑫𝒕 + 𝒘𝒔 𝑫𝒔 (4.26)
In equation 4.26, 𝑤𝑐 , 𝑤𝑡 𝑎𝑛𝑑 𝑤𝑠 are weights for the color, texture and shape features
respectively. These weights are generated and optimized using genetic algorithm.

CBIR System Based on the Clustering and Genetic Algorithm
52
4.8 The Proposed CBIR System Architecture
In this section we are introducing our proposed method for CBIR. More specifically, the
proposed method for image retrieval is composed of two phases. Learning and Querying.
Phase 1: Offline Preparing the features database (learning)
The learning phase tells about the training process which a huge mount sample images are
input in the first step, then the images‟ features will extract and go to the second step, in
which we combine these different types of features using genetic algorithm (GA) to train
these features with different weights to achieve good results. K-means classification
accuracy is used as fitness function to optimize feature weights. In the third step, the
resulted fusion feature vector from step two will classify using K-means algorithm. Finally,
the training part outputs the classifying result and stores it in the feature database. All of
these steps are performed offline and each class will be indexing along with its associated
class ID in the index files. Figure 4.13 illustrates the process of preparation of the features
database.
Phase 2: Online Image retrieval (querying)
The querying phase describes the images searching process. The image retrieval
methodology proposed in our system goes throughout the steps shown in the block diagram
Figure 4.1 which repeated in more details in Figure 4.13. The user enters a query image for
which the system extracts color, texture and shape features as explained in the previous
sections, the features vectors of database images are previously extracted and stored. Using
the similarity metrics defined for color, texture and shape, the similarity distances between
the query image and the centroid image of each class are calculated according to Equation
4.26. The smallest distance (most similar) will determine to which the image belongs. The
class with the smallest distance is returned and the images in this class will be compared
with the query image using Equation 4.26 again. The most matching images will be
retrieved and then they are sorted in ascending order. The first N similar target images (with
smallest distance value to the query) are retrieved and shown to the user, where N is the
number of the retrieved images required by the user. Figure 4.13 shows the architecture of
the proposed CBIR System and the proposed algorithm is stated in Tables 4.4 and 4.5.

CBIR System Based on the Clustering and Genetic Algorithm
53
Figure (4.13): The Proposed System Architecture.

CBIR System Based on the Clustering and Genetic Algorithm
54
Table (4.4): The Proposed CBIR Algorithm (Phase 1: Learning)
Purpose: Construct the features database and the index files.
Input: RGB images.
Output: Image's features database and its index files.
Procedure:
{
Step 1: The input images are color images in RGB color space.
Step 2: Calculate the color features (moments) using equations 4.1, 4.2, and 4.3.
Step 3: Calculate the texture features using equations 4.8 and 4.9.
Step 4: Calculate the shape features (edge histogram) using equations 4.14 to 4.18.
Step 5: Construct features vectors that will represent the images where each vector
containing 142 numerical values .
Step 6: Using genetic algorithm (Table 3.1) to optimize features weights.
Step 7: Save weighted features vectors in the features database.
Step 8: Cluster the images in the database using k-means algorithm (Table 4.4) into
different categories.
Step 9: Save index files which indexing each class along with its associated class ID.
}
Table (4.5): The Proposed CBIR Algorithm (Phase 2: Querying)
Purpose: Retrieving N images similar to the input image.
Input: RGB image, number of retrieved images N.
Output: N images similar to the input image.
Procedure:
{
Step 1: The input image is a color image in RGB color space.
Step 2: Extract the features vector for the input image by using the same
techniques as given in phase 1.
Step 3: Calculate the weighted features vector for the input image by multiplying its
features vector by the optimal weight vector that generated by GA.
Step 4: Calculate the distance between the input image and the centroid of each cluster
using equation 4.26, and find the smallest distance.
Step 5: Calculate the distance between the input image and the images in the cluster
that has the smallest distance with the input image using equation 4.26.
Step 6: Retrieve the first N images that are more similar to the input image.
}

CBIR System Based on the Clustering and Genetic Algorithm
55
Chapter 5
System Results and Evaluation
5.1 Introduction
In this chapter, we present the evaluation of our proposed system that was introduced in the
previous chapter. We introduce the database that we select to test our system, and we also
compare our system results with other already existing CBIR systems that most of them use
the same image database.
5.2 Image Database
The images database that we used in our evaluation is WANG database [65]. It is a subset
of the Corel database of 1000 images in JPEG format. These images are grouped into 10
classes, each class contains 100 images. Within this database, it is known whether any two
images are of the same class. Classification of the images in the database into 10 classes
makes the evaluation of the system easy. Figure 5.1 shows 10 sample images in each image
class. Where the images in the same row belong to the same class.
Figure (5.1): Example Images from Each of the 10 Classes of WANG Database.

CBIR System Based on the Clustering and Genetic Algorithm
56
Additional some information about WANG database are:
It was created by the group of Professor James Wang from the Pennsylvania State
University.
It is free and available to download.
It was used extensively to test many CBIR systems. This popularity is because the size
of the database and the availability of class information allows for performance
evaluation.
Since this database is a subset of the Corel database, the images are of size 384 × 256
or 256 × 384 pixels as well.
As we have said before, we chose this database for many reasons, including:
Many CBIR systems use this database, so we can easily compare our results with
these systems.
This database contains large images in different classes (100 images per class) so, it is
almost sure that a user wants to find the other images from a class if the query is from
one of these 10 classes that is due to the given classification it is possible to evaluate
retrieval results.
The diversity in the images in this database helps us to get good results and enhance
our system.
Finally, the most interesting point is that the images are familiar to human, and they
are very friendly to us.
5.3 Implementation Environment
The proposed CBIR system is implemented using MATLAB program of version 7.8.0.347
(R2011a) which imbedded with image processing tools and statistical tools. We use a
platform of Intel Core 2 Due Processing power of 2 GHz CPU with 3 GB RAM during the
implementation. 1000 image database went through our implemented system to extract the
features and stored them. The extracted features are weighted by GA and they are used for
classification using the k-means clustering algorithm. This step is made offline for all
images in the database. The database now is ready for testing and evaluating our CBIR
proposed system.
5.4 Performance Evaluation Metrics of CBIR Systems
The level of retrieval accuracy achieved by a system is important to establish its
performance. If the outcome is satisfactory and promising, it can be used as a standard in
future research works. Unfortunately, when we want to evaluate a CBIR system, we may
face some problems. One of them is that neither a standard database nor a unique
performance measure is available. There are many image databases that are used to

CBIR System Based on the Clustering and Genetic Algorithm
57
represent results for CBIR system. So, no standard image databases are available for CBIR
systems. Therefore, it is impossible to compare the performance of different systems using
different image databases. Furthermore, the early CBIR systems were restricted their
results. They presented one or more example queries, which are used to give a positive
impression about the efficiency of the system. This is neither a quantitative nor an objective
measure that can be used for system performance evaluation.
In CBIR, the most commonly used performance measures are Precision and Recall.
Precision, P, is defined as the ratio of the number of retrieved relevant images to the total
number of retrieved images [66]. This means that precision measures the accuracy of the
retrieval. Let the number of all retrieved images be 𝑛 and let 𝑟 be the number of relevant
images according to the query then the Precision value is:
𝑷 = 𝑵𝒖𝒎𝒃𝒆𝒓 𝒐𝒇 𝑹𝒆𝒍𝒆𝒗𝒂𝒏𝒕 𝑰𝒎𝒂𝒈𝒆𝒔 𝑹𝒆𝒕𝒓𝒆𝒊𝒗𝒆𝒅
𝑻𝒐𝒕𝒂𝒍 𝑵𝒖𝒎𝒃𝒆𝒓 𝒐𝒇 𝑰𝒎𝒂𝒈𝒆𝒔 𝑹𝒆𝒕𝒓𝒆𝒊𝒗𝒆𝒅=
𝒓
𝒏 (6.1)
Recall, 𝑅, is defined as the ratio of the number of retrieved relevant images to the total
number of relevant images in the database [66]. This means that recall measures the
robustness of the retrieval. Let 𝑟 be the number of relevant images among all retrieved
images according to the query and let 𝑀 be the number of all relevant images to the query
in the whole database then the Recall value is:
𝑹 =𝑵𝒖𝒎𝒃𝒆𝒓 𝒐𝒇 𝑹𝒆𝒍𝒆𝒗𝒂𝒏𝒕 𝑰𝒎𝒂𝒈𝒆𝒔 𝑹𝒆𝒕𝒓𝒆𝒊𝒗𝒆𝒅
𝑻𝒐𝒕𝒂𝒍 𝑵𝒖𝒎𝒃𝒆𝒓 𝒐𝒇 𝑹𝒆𝒍𝒆𝒗𝒂𝒏𝒕 𝑰𝒎𝒂𝒈𝒆𝒔 𝒊𝒏 𝒕𝒉𝒆 𝑫𝑩 =
𝒓
𝑴 (6.2)
In CBIR, if the precision score is 1.0, this means that every image retrieved by a search is
relevant, but we do not know if the search retrieves all the images relevant to the query. If
the recall score is 1.0, this means that all relevant images are retrieved by the search, but we
do not know the numbers of irrelevant images were also retrieved. In classification task, a
precision of score 1.0 for a class C means that every object labeled as belonging to class C
does indeed belong to class C, but we do not know the number of objects from class C that
were not labeled correctly. Also, a recall of score 1.0 for a class C means that every object
from class C was labeled as belonging to C, but we do not know the number of objects
were also labeled as belonging to class C incorrectly. There is a trade-off between precision
and recall. In search engine, for example, the user prefers to increase the number of results
relevant to the query by retrieving more documents. This will increase the recall. On the
other hand, the results will have quite large number of irrelevant documents retrieved. This
will decrease the precision. As a result, precision and recall scores are not discussed in
isolation. Instead, either values for one measure are compared for a fixed level at the other
measure (e.g. precision at a recall level of 0.75) or both are combined into a single measure,
such as Precision/Recall graph.

CBIR System Based on the Clustering and Genetic Algorithm
58
In general, when we want to evaluate the performance of a CBIR system, we use both the
two metrics. The Precision/Recall graph is widely used. It provides meaningful results
when the database is known and has been used in some earlier systems. Because we know
every image in the database and also know the relevant images for each image, we can use
any image from the database to be the query. For other data sets, especially those that have
been created by collecting user generated images, the result may vary due to different
human concepts of image classification.
5.5 The proposed System Evaluation
Here, we come to the most important section in the thesis. In this section, we test our
proposed system and show the results. We explain the results, comment on them, and
compare our system with other existing systems. We evaluate the system regarding two
metrics: the Retrieval Effectiveness in terms of precision and recall, and the Retrieval
Efficiency in term of the time the system takes to answer a query.
5.5.1 Retrieval Effectiveness
In order to check retrieval effectiveness of our proposed system, we have to test it by
selecting some images randomly from different classes. Each query returns the top 10
images from the database. In particular, a retrieved image is considered a match if and only
if it is in the same class as the query image. Figure 5.2 from (a) through (e) illustrates five
query results from our proposed system.
a) Buses Query, 10 Matches from Top 10 Retrieved Images.
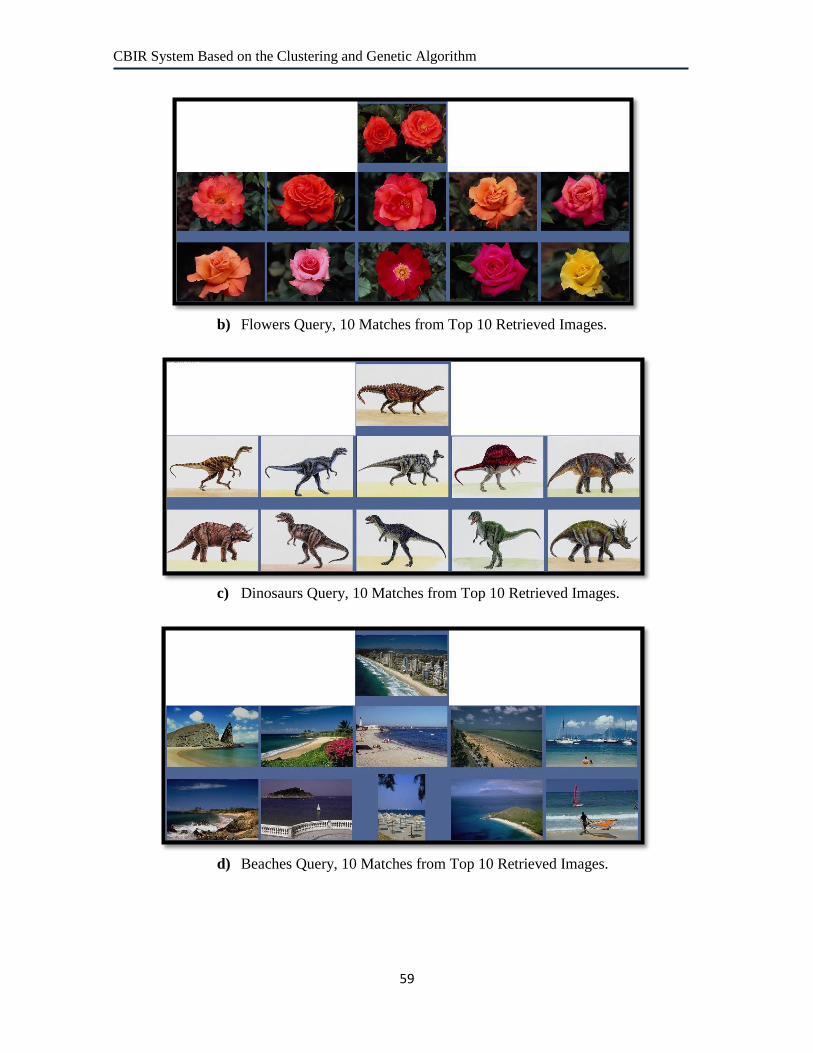
CBIR System Based on the Clustering and Genetic Algorithm
59
b) Flowers Query, 10 Matches from Top 10 Retrieved Images.
c) Dinosaurs Query, 10 Matches from Top 10 Retrieved Images.
d) Beaches Query, 10 Matches from Top 10 Retrieved Images.

CBIR System Based on the Clustering and Genetic Algorithm
60
e) Foods Query, 10 Matches from Top 10 Retrieved Images.
Figure (5.2): Five Query Response Examples of Our Proposed System.
The first test is selecting a random image from the Buses class. We submit the image to the
system and retrieve the top 10 images that are similar to the query image. As can be seen
from Figure 5.2(a), all images retrieved by the system are relevant to the query image.
Figure 5.2(b) shows another query image and its result. This is the second test for our
proposed system. We select an image randomly from the Flowers class and retrieve 10
images similar to the query image. Again, all images from the results are belonging to the
same class of the query image. The third, the fourth and the fifth tests and their results for
our proposed system are shown in Figure 5.2(c) for Dinosaurs class, Figure 5.2(d) for
Beaches class and Figure 5.2(e) for Foods class respectively. As we can see from these
Figures, all the images are similar to the query image and belong to the same class.
From the above testing, we can notice that the system works well and it retrieves good
results over the randomly selected images as queries. This gives us a good impression that
the system will also retrieve good results for most of the other images with different classes
in the database if we use them as queries images. These good results were achieved as a
regular result for using many different features as descriptors for the images. Not only this ,
but also by weighting these features optimally using GA and then classify the images
perfectly using K-means Algorithm.
The precision values of the retrieval results for top 5, 10, 20, and 30 retrieved images in
response to each of the five queries are given in Table 5.1. As can be noted from this table,
the precision values are high for small number of retrieved images, and these values
decrease as the number of retrieved image increases. This is a regular case since the
increasing in the number of retrieved results will increase the number of relevant images,
increase recall, but in the other hand the results will have quite large number of irrelevant
documents retrieved. This decreases the precision. By the way, the results indicating that
the system gives a good ranking of the retrieved images. For example in Buses query, the

CBIR System Based on the Clustering and Genetic Algorithm
61
first top 5 and top 10 of the retrieved images are relevant, whereas in the top 20 and top 30
retrieved images only 1 of them is found to be irrelevant.
Table (5.1): Precision of the Proposed System for top 5, 10, 20, and 30 Retrieved Images
for Some Different Queries.
Query Class Top 5 Top 10 Top 20 Top 30
Buses 1.00 1.00 0.95 0.95
Flowers 1.00 1.00 0.75 0.70
Dinosaurs 1.00 1.00 1.00 1.00
Beaches 1.00 1.00 0.70 0.65
Foods 1.00 1.00 0.80 0.75
Average Precision/Recall
To further evaluate the proposed system, 10 images are randomly selected as queries from
each of the 10 semantic classes in the database, for each query the precision of the retrieval
at each level of the recall is obtained by gradually increasing the number of retrieved
images. The 100 retrieval results are averaged to give the final Precision/Recall chart of
Figure 5.3.
Figure (5.3): The Average Precision/Recall Chart of the proposed System Over 100
Queries.
From Figure 5.3, it can be noted that the system has good average precision values over
different recall levels. It has a maximum average precision of 0.92 at recall level of 0.05,
this value decreases to 0.51 precision value at 0.5 of recall level. For example, for an
average recall value of 10%, we have an average precision value of 80% (i.e., if the user
0
0.1
0.2
0.3
0.4
0.5
0.6
0.7
0.8
0.9
1
0.02 0.05 0.1 0.2 0.3 0.4 0.5
Ave
rage
Pre
cisi
on
Average Recall
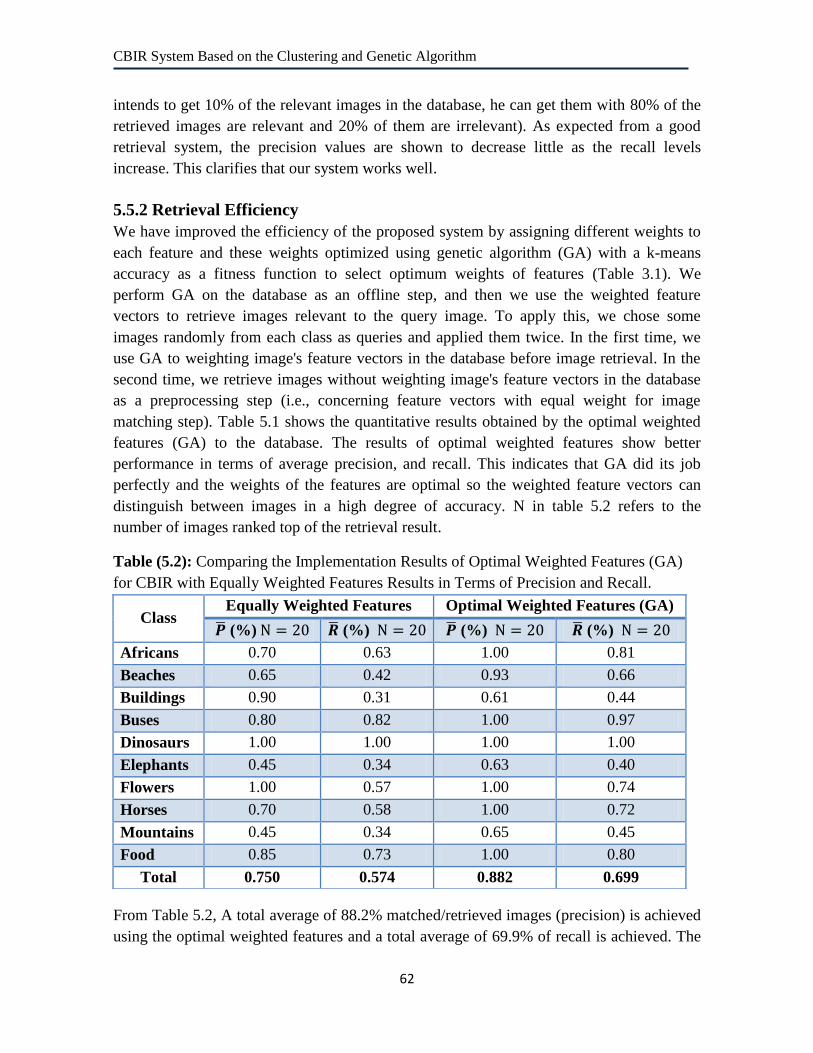
CBIR System Based on the Clustering and Genetic Algorithm
62
intends to get 10% of the relevant images in the database, he can get them with 80% of the
retrieved images are relevant and 20% of them are irrelevant). As expected from a good
retrieval system, the precision values are shown to decrease little as the recall levels
increase. This clarifies that our system works well.
5.5.2 Retrieval Efficiency
We have improved the efficiency of the proposed system by assigning different weights to
each feature and these weights optimized using genetic algorithm (GA) with a k-means
accuracy as a fitness function to select optimum weights of features (Table 3.1). We
perform GA on the database as an offline step, and then we use the weighted feature
vectors to retrieve images relevant to the query image. To apply this, we chose some
images randomly from each class as queries and applied them twice. In the first time, we
use GA to weighting image's feature vectors in the database before image retrieval. In the
second time, we retrieve images without weighting image's feature vectors in the database
as a preprocessing step (i.e., concerning feature vectors with equal weight for image
matching step). Table 5.1 shows the quantitative results obtained by the optimal weighted
features (GA) to the database. The results of optimal weighted features show better
performance in terms of average precision, and recall. This indicates that GA did its job
perfectly and the weights of the features are optimal so the weighted feature vectors can
distinguish between images in a high degree of accuracy. N in table 5.2 refers to the
number of images ranked top of the retrieval result.
Table (5.2): Comparing the Implementation Results of Optimal Weighted Features (GA)
for CBIR with Equally Weighted Features Results in Terms of Precision and Recall.
From Table 5.2, A total average of 88.2% matched/retrieved images (precision) is achieved
using the optimal weighted features and a total average of 69.9% of recall is achieved. The
Class Equally Weighted Features Optimal Weighted Features (GA)
𝑷 (%) N = 20 𝑹 (%) N = 20 𝑷 (%) N = 20 𝑹 (%) N = 20
Africans 0.70 0.63 1.00 0.81
Beaches 0.65 0.42 0.93 0.66
Buildings 0.90 0.31 0.61 0.44
Buses 0.80 0.82 1.00 0.97
Dinosaurs 1.00 1.00 1.00 1.00
Elephants 0.45 0.34 0.63 0.40
Flowers 1.00 0.57 1.00 0.74
Horses 0.70 0.58 1.00 0.72
Mountains 0.45 0.34 0.65 0.45
Food 0.85 0.73 1.00 0.80
Total 0.750 0.574 0.882 0.699
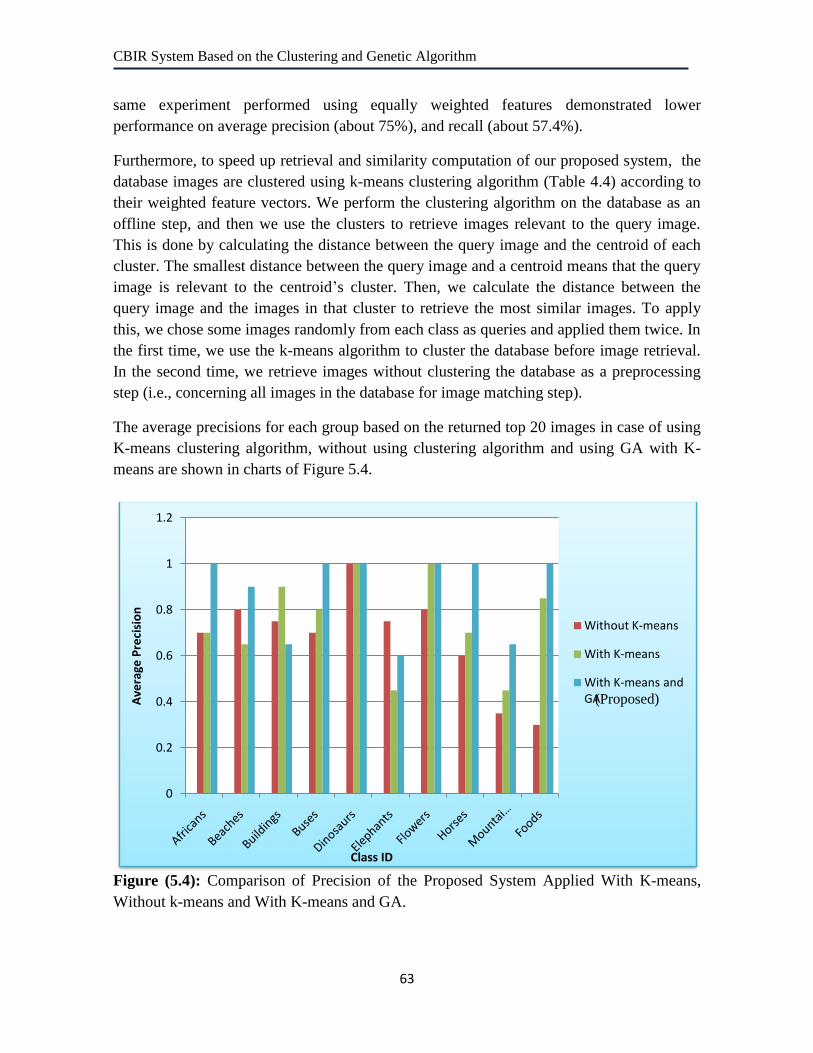
CBIR System Based on the Clustering and Genetic Algorithm
63
same experiment performed using equally weighted features demonstrated lower
performance on average precision (about 75%), and recall (about 57.4%).
Furthermore, to speed up retrieval and similarity computation of our proposed system, the
database images are clustered using k-means clustering algorithm (Table 4.4) according to
their weighted feature vectors. We perform the clustering algorithm on the database as an
offline step, and then we use the clusters to retrieve images relevant to the query image.
This is done by calculating the distance between the query image and the centroid of each
cluster. The smallest distance between the query image and a centroid means that the query
image is relevant to the centroid‟s cluster. Then, we calculate the distance between the
query image and the images in that cluster to retrieve the most similar images. To apply
this, we chose some images randomly from each class as queries and applied them twice. In
the first time, we use the k-means algorithm to cluster the database before image retrieval.
In the second time, we retrieve images without clustering the database as a preprocessing
step (i.e., concerning all images in the database for image matching step).
The average precisions for each group based on the returned top 20 images in case of using
K-means clustering algorithm, without using clustering algorithm and using GA with K-
means are shown in charts of Figure 5.4.
Figure (5.4): Comparison of Precision of the Proposed System Applied With K-means,
Without k-means and With K-means and GA.
0
0.2
0.4
0.6
0.8
1
1.2
Ave
rage
Pre
cisi
on
Class ID
Without K-means
With K-means
With K-means and GA(Proposed)

CBIR System Based on the Clustering and Genetic Algorithm
64
If we look carefully on the Figure 5.4, we can note that the precision of classes Buildings
and Elephants without using k-means is better than the precision when using the k-means
and GA. This is because some images from each class are incorrectly clustered as a result
of weighting the features. However, the difference between the two precisions is small and
negligible. In the other hand for all other classes, we note that the precision reached using
k-means and GA are the better. This is because only a number of candidate images, image
that lies in the same cluster with the query image, were considered in similarity
comparison. Which in their turn, best classified according to optimally weighted features.
The average retrieval time that the proposed system takes for feature extraction is about 2
seconds per image. A comparison of the average retrieval time required for returning top 20
images, per query in seconds, recorded for each semantic group in the database over 20
randomly selected queries by the system applied with clustering and without using
clustering is shown in Figure 5.5.
Figure (5.5): Comparison of Average Retrieval Time Required by the Proposed system
Applied with Clustering and without Clustering.
We notice that using clustering pre-process of the database image via K-means algorithm
decreases the average query response time, as well as it increases the efficiency of the
system, as can be shown in Figure 5.4. Note that the system has the same feature extraction
time, but using the clustering pre-process decreases the similarity search time for image
matching, since it avoids searching all the database images, but some candidate images
only. The query response time is reduced significantly using the clustering process, as
noticed in Figure 5.5, hence we obtained an average reduction in time equals, 6.21
seconds.
0
2
4
6
8
10
12
14
Re
trie
val T
ime
in S
eco
nd
s
Class ID
Without K-means
With K-means(Our Proposed)

CBIR System Based on the Clustering and Genetic Algorithm
65
5.6 Comparison of Our Proposed System with Other Systems
In this section, we evaluate the retrieval accuracy of our proposed system and compare it
with some of the existing CBIR system‟s results. Here, we have two kinds of comparisons.
The first one is a comparison of the proposed system with some other existing systems
that use only color feature to represent images, Then, a comparison with the systems
that use color and texture features to represent images. In both cases these systems are
use the WANG database to evaluate their proposed systems.
Our proposed system precision result is compared against the precision of Afifi‟s method
[55] that use only color as feature descriptor, Chaudhari‟s method [49] that use color and
shape as a features descriptors and Salama‟s method [2] that use color and texture as a
features descriptors. The comparison is shown in Figure 5.6.
Figure (5.6): Comparison of Precision of the Proposed System with Previously Existed
Systems with Different Kinds Of Features.
Figure 5.6 shows that the proposed system performs significantly better, over most classes,
than other systems, those that use only color and those that use color and texture features to
represent the images. This results confirm our assumption that a good fusion of multiple
features (color, texture and shape) as a descriptor for the image can increase the
performance of the system.
0
0.2
0.4
0.6
0.8
1
1.2
Afr
ican
s
Bea
ches
Bu
ildin
gs
Bu
ses
Din
osa
urs
Elep
han
ts
Flo
wer
s
Ho
rses
Mo
un
tain
s
Foo
ds
Ave
rage
Pre
cisi
on
Class ID
Color Feature Only
Color & Texure Features
Color & Shape Features
Color,Texture and Shape Features (Our Proposed)
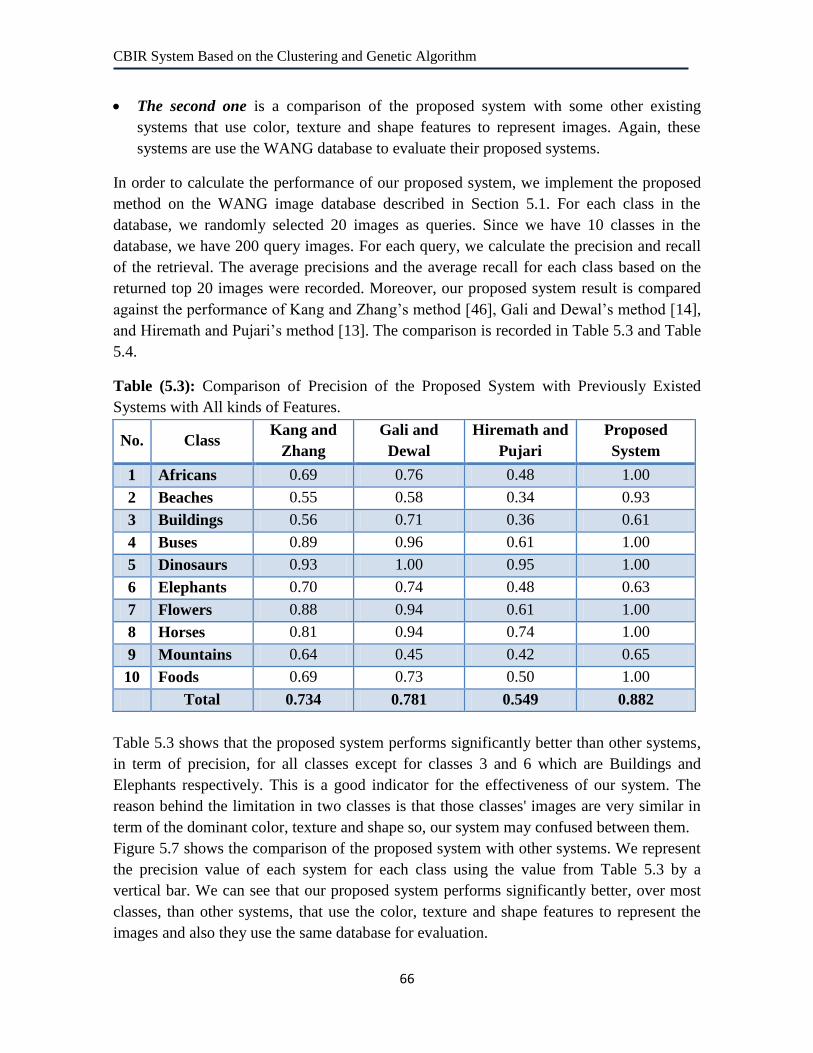
CBIR System Based on the Clustering and Genetic Algorithm
66
The second one is a comparison of the proposed system with some other existing
systems that use color, texture and shape features to represent images. Again, these
systems are use the WANG database to evaluate their proposed systems.
In order to calculate the performance of our proposed system, we implement the proposed
method on the WANG image database described in Section 5.1. For each class in the
database, we randomly selected 20 images as queries. Since we have 10 classes in the
database, we have 200 query images. For each query, we calculate the precision and recall
of the retrieval. The average precisions and the average recall for each class based on the
returned top 20 images were recorded. Moreover, our proposed system result is compared
against the performance of Kang and Zhang‟s method [46], Gali and Dewal‟s method [14],
and Hiremath and Pujari‟s method [13]. The comparison is recorded in Table 5.3 and Table
5.4.
Table (5.3): Comparison of Precision of the Proposed System with Previously Existed
Systems with All kinds of Features.
Table 5.3 shows that the proposed system performs significantly better than other systems,
in term of precision, for all classes except for classes 3 and 6 which are Buildings and
Elephants respectively. This is a good indicator for the effectiveness of our system. The
reason behind the limitation in two classes is that those classes' images are very similar in
term of the dominant color, texture and shape so, our system may confused between them.
Figure 5.7 shows the comparison of the proposed system with other systems. We represent
the precision value of each system for each class using the value from Table 5.3 by a
vertical bar. We can see that our proposed system performs significantly better, over most
classes, than other systems, that use the color, texture and shape features to represent the
images and also they use the same database for evaluation.
No. Class Kang and
Zhang
Gali and
Dewal
Hiremath and
Pujari
Proposed
System
1 Africans 0.69 0.76 0.48 1.00
2 Beaches 0.55 0.58 0.34 0.93
3 Buildings 0.56 0.71 0.36 0.61
4 Buses 0.89 0.96 0.61 1.00
5 Dinosaurs 0.93 1.00 0.95 1.00
6 Elephants 0.70 0.74 0.48 0.63
7 Flowers 0.88 0.94 0.61 1.00
8 Horses 0.81 0.94 0.74 1.00
9 Mountains 0.64 0.45 0.42 0.65
10 Foods 0.69 0.73 0.50 1.00
Total 0.734 0.781 0.549 0.882

CBIR System Based on the Clustering and Genetic Algorithm
67
Figure (5.7): Comparison of Precision of the Proposed System with Previously Existed
Systems with All kinds of Features.
Table (5.4): Comparison of Recall of the Proposed System with Previously Existed
Systems with All kinds of Features.
Table 5.4 shows that the proposed system performs significantly better than other systems,
in term of recall, for all classes. This means that the proposed system can retrieve most of
database images that match query image. These images must be at the same class which in
turn implies that our proposed system works well especially in the classification part as a
result of using GA with K-means. Figure 5.8 shows the comparison of our proposed system
with other systems. We represent the recall value of each system for each class using the
value from Table 5.4 by a vertical bar. We can see that our proposed system outperforms
0
0.2
0.4
0.6
0.8
1
1.2
Ave
rage
P
reci
sio
n
Class ID
Kang and Zhang
Gali and Dewal
Hiremath and Pujari
Proposed System
No. Class Kang and
Zhang
Gali and
Dewal
Hiremath
and Pujari
Proposed System
1 Africans 0.14 0.43 0.21 0.81
2 Beaches 0.18 0.32 0.25 0.66
3 Buildings 0.18 0.35 0.22 0.44
4 Buses 0.13 0.69 0.31 0.97
5 Dinosaurs 0.11 0.99 0.75 1.00
6 Elephants 0.16 0.35 0.25 0.40
7 Flowers 0.12 0.69 0.19 0.74
8 Horses 0.12 0.62 0.44 0.72
9 Mountains 0.19 0.24 0.14 0.45
10 Foods 0.15 0.36 0.19 0.80
Total 0.148 0.504 0.295 0.699

CBIR System Based on the Clustering and Genetic Algorithm
68
other existing systems, over most classes, that use the color, texture and shape features to
represent the images and also they use the same database for evaluation.
Figure (5.8): Comparison of Recall of the Proposed System with Previously Existed
Systems with All kinds of Features.
0
0.2
0.4
0.6
0.8
1
1.2
Ave
rage
R
eca
ll
Class ID
Kang and Zhang
Gali and Dewal
Hiremath and Pujari
Proposed System

CBIR System Based on the Clustering and Genetic Algorithm
69
Chapter 6
Conclusion and Future Work
In this Chapter, we present the conclusions from this thesis and some recommendation and
future works. In section 6.1, we talk about the contributions we have achieved and a
conclusion for the work. Some of the Future works are proposed in section 6.2.
6.1 Conclusion
Content based image retrieval is an active research issue that had been famous from 1990s
till present. CBIR as a set of challenging techniques aims to retrieve semantically requested
relevant image concepts from large-scale image databases. The main target of CBIR is to
get accurate results with lower computational time. Although this area has been explored
for decades and many researches have been done to develop some algorithms that solve
some of its problems, no technique has achieved the accuracy of human visual perception
in distinguishing images. Whatever the size and content of the image database is, a human
being can easily recognize images of same category.
Many proposed algorithms use images to extract features and use their features for
similarity matching. In this research, Color, Texture and Shape features were extracted and
combined to form feature vector of image. For color features, the moments of the color
distribution were calculated from the images and used as color descriptor. For texture
features, We used Gabor filter, which is a powerful texture extraction technique in
describing the content of image. For shape features, edge histogram features that include
five categories were used as shape descriptor. These three descriptors were combined and
optimized using GA with a k-means accuracy as a fitness function to select optimum
weights of features. We performed GA with K-means on the database as an offline step,
and adapted in similarity/distance measurement to perform retrieval image from database.
Furthermore, we have improved the efficiency of our system by not considering the whole
database images for similarity computation but a number of candidate images were only
considered. A candidate image is any database image that lies in the same cluster with the
query image. The clustering process of the database images is performed offline using K-
means algorithm. The simulation results have proved the benefit of this clustering process
in decreasing the retrieval time without sacrificing the retrieval accuracy.
In our work, we used WANG database, which is widely used for CBIR, to evaluate the
performance of our system by calculating the precision and recall metrics. We also
compared our proposed system with other existing CBIR systems that use the same
database for system evaluation. The performance of our algorithm in terms of average
precision, recall and retrieval time has been shown to perform good. From the experimental
results, it is evident that our proposed system surpassed its counterpart, other existing

CBIR System Based on the Clustering and Genetic Algorithm
70
systems, in terms of precision, recall and retrieval time. The average precision increased
from 78.1% to 88.2%, the average recall increased from 50.4% to 69.9% and we obtained
an average reduction in time equals, 6.21 seconds.
The experimental results confirm that the proposed CBIR system architecture attains better
solution for image retrieval. Furthermore, in our knowledge, our model represents one of
the first times in which combine concepts and techniques to build CBIR system.
6.2 Future Work
The future works appear from the limitations and the difficulties when we develop our
system. The following developments can be made in the future:
1. We hope to build more generalized CBIR system which increase the system
searching ability and provide more accurate results.
2. To improve the retrieval results, the system has to take the feedback from the user.
The user checks the results and comments on them by some way. Then, the system
recalculates the results with the advantage of the feedback.
3. To further improve the performance of the retrieval system, we hope to optimize
some settings of the system architecture and techniques that used in this research.
There exist some details setting that can be discussed and optimized with the images
retrieval issues. This is like, the number of clusters k as an inputs for the K-means
algorithm and input parameters of the genetic algorithm etc.
4. The results demonstrate that each type of feature is effective for a particular type of
images according to its semantic contents, and using a combination of them gives
better retrieval results for almost all semantic classes. In future, we hope to try
different types of features.
5. Region-based retrieval attempt to overcome the deficiencies of global feature based
search by representing images at the object-level. It applies image segmentation to
decompose an image into regions, which correspond to objects if the decomposition
is ideal [28]. We hope to try applying this technique in our proposed system to
increase its efficiency especially when we can solve the main problem of this
technique, long computational time, by any way. Parallel computing is one of the
main ways to this purpose.
6. Using different benchmark image datasets with different semantics and categories to
further evaluate our system and found its limitations and weaknesses and work to
fix them.
CBIR System Based on the Clustering and Genetic Algorithm
71
REFERENCES
[1] R. Gonzales and R.E. Woods, “Digital Image Processing,” 2nd Edition, New Jersey
Prentice Hall, 2002.
[2] V. Gudivada and V. Raghavan, “Content-based Image Retrieval Systems,” IEEE
Computer, vol. 28, no 9, pp18-22, Sep. 1995.
[3] S. Theodoridis and K. Koutroumbas, “Pattern Recognition,” 4th Edition, 2009.
[4] S. Gerard and C. Buckely, “Term-Weighting Approaches in Automatic Text Retrieval,”
Information Processing and Management, vol. 24, no.5, pp. 513-523, Jan. 1988.
[5] F. Long, H. Zhang, H. Dagan, and D. Feng, “Fundamentals of Content Based Image
Retrieval,” Multimedia Signal Processing Book, Chapter 1, Springer-Verlag, Berlin
Heidelberg New York, 2003.
[6] R. Chang, J. Ho, S. Lin, C. Fann and Y. Wang, “A Novel Content Based Image
Retrieval System using K-means with Feature Extraction,” International Conference on
Systems and Informatics, 2012.
[7] M. Lew, N. Sebe, C. Djeraba and R. Jain, “Content-based Multimedia Information
Retrieval: State of the Art and Challenges,” ACM Transactions on Multimedia Computing,
Communications, and Applications, pp. 1–19, 2006.
[8] I. El-Naqa, Y. Yang, N. Galatsanos, R. Nishikawa and M. Wernick, “A Similarity
Learning Approach to Content-Based Image Retrieval: Application to Digital
Mammography,” IEEE Transactions on Medical Imaging, 2009.
[9] N. Singh, S. Dubey, P. Dixit, and J. Gupta. “Semantic Image Retrieval by Combining
Color, Texture and Shape Features,” International Conference on Computing Sciences,
2012.
[10] B. WANG, X. ZHANG, and N. LI, “Relevance Feedback Technique For Content-
Based Image Retrieval Using Neural Network Learning,” Proceedings of the Fifth
International Conference on Machine Learning and Cybernetics, Dalian, 2006.
[11] R. Ng and J. Han, “Efficient and Effective Clustering Method for Spatial Data
Mining,” Proceedings of the 20th VLDB Conference, pages 144-155, 1994.
CBIR System Based on the Clustering and Genetic Algorithm
72
[12] Y. Chen, J. Z. Wang, and R. Krovetz, “CLUE: Cluster-based Retrieval of Images by
Unsupervised Learning,” Image Processing, IEEE Transactions, 2005.
[13] P. Hiremath, and J. Pujari, “Content Based Image Retrieval using Color, Texture and
Shape features,” 15th International Conference on Advanced Computing and
Communications, 2007.
[14] R. Gali, M. Dewal, and R. Anand, “Genetic Algorithm for Content Based Image
Retrieval,” Fourth International Conference on Computational Intelligence,
Communication Systems and Networks, 2012.
[15] A. H. EI-Kholy and A. M. Abdel-Haleim, “Content-Based Image Retrieval Using
Combined Features and Weighted Similarity,” 2nd International Conference on Computer
Technology and Development, 2011.
[16] K. Seo, “ Content-Based Image Retrieval by Combining Genetic Algorithm and
Support Vector Machine,” Proceedings of the 17th international conference on Artificial
neural networks,2007.
[17] Y. Huang, C. Huang, H. Sun and Y. Liao, “Fault Diagnosis Using Hybrid Artificial
Intelligent Methods,” Industrial Electronics and Applications (ICIEA), the 5th IEEE
Conference, 2010.
[18] M. Kherfi, D. Ziou, and A. Bernardi, “Image Retrieval From the World Wide Web:
Issues, Techniques, and Systems,” ACM Computing Surveys, vol. 36, no. 1, pp. 35–67,
March 2004.
[19] R. Salamah, “Efficient Content Based Image Retrieval,” Master dissertation,
Computer Engineering Department, Islamic University of Gaza, Palestine 2010.
[20] R. Rasli, T. Muda, Y. Yusof and J. Abu Bakar, “Comparative Analysis of Content
Based Image Retrieval Technique using Color Histogram. A Case Study of GLCM and K-
Means Clustering,” Third International Conference on Intelligent Systems Modeling and
Simulation, 2012.
[21] N. Krishnan, S. Banu, and C. Christiyana, “Content Based Image Retrieval using
Dominant Color Identification Based on Foreground Objects,” Fourth International
Conference on Natural Computation, 2008.

CBIR System Based on the Clustering and Genetic Algorithm
73
[22] T. Dharani, and I. Aroquiaraj, “A Survey on Content Based Image Retrieval,”
Proceedings of the 2013 International Conference on, Pattern Recognition, Informatics
and Mobile Engineering, February 2013.
[23] M. Flickner, H. Sawhney, W. Niblack, J. Ashley, Q. Huang, B. Dom, M. Gorkani, J.
Hafner, D. Lee, D. Petkovic, and P. Yanker, “Query by image and video content: The
QBIC system,” IEEE Computer, vol. 28, no 9, pp.23-32, Sep. 1995.
[24] A. Gupta, and R. Jain, “Visual Information Retrieval,” Comm. Assoc. Comp. Mach.,
vol. 40, no. 5, pp. 70–79, May. 1997.
[25] S. Mukherjea, K. Hirata, and Y. Hara, “AMORE: A World Wide Web Image Retrieval
Engine,” Proceedings of World Wide Web, vol. 2, no. 3, pp. 115-132, June. 1999.
[26] A. Natsev, R. Rastogi, and K. Shim, “WALRUS: A Similarity Retrieval Algorithm for
Image Databases,” IEEE Transaction On Knowledge and Data Engineering, vol.16, pp.
301-318, Mar. 2004.
[27] A. Pentland, R. Picard, and S. Sclaroff , “Photobook: Content based manipulation of
image databases,” International Journal of Computer Vision, vol.18, no 3, pp.233–254,
June 1997.
[28] C. Carson, M. Thomas, S. Belongie, J.M. Hellerstein, and J. Malik, “Blobworld: A
System for Region-Based Image Indexing and Retrieval,” Proceedings of Visual
Information Systems, pp. 509-516, June 1999.
[29] J. Smith and S. Chang, “Visualseek: A Fully Automated Content-Based Image Query
System,” Proceedings of the 4th ACM international conference on Multimedia Table of
Contents, Boston, Massachusetts, United States, pp. 87-98, Nov. 1996.
[30] W. Ma and B. Manjunath, “Natra: A Toolbox for Navigating Large Image Databases,”
Proceedings IEEE Int'l Conf. Image Processing, Santa Barbara, 1997, pp. 568- 571.
[31] J. Wang, G. Wiederhold, O. Firschein, and X. Sha, “Content-Based Image Indexing
and Searching Using Daubechies' Wavelets,” Int. J. Digital Libraries, vol. 1, no. 4, pp. 311-
328, 1998.
[32] E. Loupias and S. Bres, “Key Point-Based Indexing for Pre-Attentive Similarities: The
Kiwi System,” Pattern Analysis and Applications, 4(2/3):200–214, 2001.

CBIR System Based on the Clustering and Genetic Algorithm
74
[33] J. Kreyss, M. Röper, P. Alshuth, Th. Hermes, and O. Herzog, “Video Retrieval by Still
Image Analysis with ImageMiner, ” Proceedings of IS&T/SPIE's Symposium on Electronic
Imaging: Science & Technologies, San Jose, CA, 1997.
[34] J. Z. Wang, J. Li, and G. Wiederhold. “SIMPLIcity: Semantics Sensitive Integrated
Matching for Picture Libraries," IEEE Transactions on Pattern Analysis and Machine
Intelligence, 2001.
[35] M. Ortega-Binderberger and S. Mehrotra. “Relevance Feedback Techniques in the
MARS Image Retrieval Systems," Multimedia Systems, 2004.
[36] D. Park, Y. Jeon and C. Won. “Efficient Use of Local Edge Histogram Descriptor,"
Int. J. of Computer Vision, vol.7-1, pp. 11-32, 2003.
[37] T. Zhao, J. Lu, Q. Xiao and Y. Zhang. “Feature Selection Based-on Genetic Algorithm
for CBIR," Congress on Image and Signal Processing, 2008.
[38] P. Zhang and H. Zhu, “Medical Image Retrieval Based on Co-Occurrence Matrix and
Edge Histogram,“ Multimedia Technology (ICMT), International Conference, pp.5434-
5437, 26-28, July 2011.
[39] N. Salih, R. Besar and F. Abas, “Multi-level Shape Description Technique,”
Information Technology and Multimedia (ICIM), International Conference, pp.1-5, 14-16,
2011
[40] D. Zhang, “ Improving Image Retrieval Performance by Using Both Color and Texture
Features,” Proceedings of IEEE 3rd International Conference on Image and Graphics
(ICIG04), Hong Kong, China, Dec.18-20, 2004.
[41] Y. Rui, T.S. Huang, and S.F. Chang, “Image Retrieval: Current Techniques, Promising
Directions and Open Issues,” Journal of Visual Communication and Image Representation,
Transaction on Systems, Man, and Cybernetics, vol. 8, pp. 460–472, 1999.
[42] M. Saad, H. Saleh, H. Konbor and M. Ashour, “Image Retrieval Based on Integration
between YCbCr Color Histogram and Shape Feature,” Computer Engineering Conference
(ICENCO), Seventh International, pp.97-102, 27-28, 2011.
[43] M. Fakheri, M. Amirani and T. Sedghi, “Gabor Wavelets and GVF Functions for
Feature Extraction in Efficient Content Based Colour and Texture Images Retrieval,”
Machine Vision and Image Processing (MVIP), 7th Iranian , pp.1-5, 16-17, 2011.

CBIR System Based on the Clustering and Genetic Algorithm
75
[44] H. Rai, S. Xiaobo, K. Deepak and P. Krishna, “Hybrid Feature to Encode Shape and
Texture for Content Based Image Retrieval,” Image Information Processing (ICIIP),
International Conference on , pp.1-6, 3-5, Nov. 2011.
[45] L. Chen and W. Zhou, “Multi-feature Method: An Integrated Content Based Image
Retrieval System,” Intelligence Information Processing and Trusted Computing (IPTC),
2nd International Symposium, pp.43-46, 22-23, Oct. 2011.
[46] J. Kang and W. Zhang, “A Framework for Image Retrieval with Hybrid Features,”
IEEE, 2012.
[47] H. Narasimhan and P. Ramraj, “Contribution-Based Clustering Algorithm for Content-
Based Image Retrieval,” 5th International Conference on Industrial and Information
Systems, ICIIS 2010, Aug. 2010.
[48] H. Shao, J. Zhang, W. Cui, and H. ZHAO, “Automatic Feature Weight Assignment
Based on Genetic Algorithm for Image Retrieval,” Proceedings of the 2003 IEEE
International Conference on Robotics, Intelligent Systems and Signal Processing, China,
2003.
[49] R. Chaudharand and A. M. Patil, “Content Based Image Retrieval Using Color and
Shape Features,” International Journal of Advanced Research in Electrical, Electronics
and Instrumentation Engineering, 2012.
[50] W. Jiang, G. Er, Q. Dai and J. Gu, “Similarity-based Online Feature Selection in
Content-based Image Retrieval,” Transactions on Image Processing, 2006.
[51] P. Resnik, “Using Information Content to Evaluate Semantic Similarity in a
Taxonomy,” International Joint Conference for Artificial Intelligence, 1995.
[52] R. Datta, J. Li, and J. Wang, “Content-Based Image Retrieval - Approaches and
Trends of the New Age,” ACM Computing Surveys, vol. 40, no. 2, pp. 1-60, April 2008.
[53] T. Shih, J. Huang, C. Wang, J. Hung, and C. Kao, “An Intelligent Content-based
Image Retrieval System Based on Color, Shape and Spatial Relations,” Proc. Natl. Sci.
Counc. ROC (A) Vol. 25, No. 4, 2001.
[54] G. Sivakamasundari and V. Seenivasagam, “Different Relevance Feedback
Techniques in CBIR: A Survey and Comparative Study,” International Conference on
Computing, Electronics and Electrical Technologies, 2012.

CBIR System Based on the Clustering and Genetic Algorithm
76
[55] A. Afifi, “Image Retrieval Based on Content Using Color Feature,” Master
dissertation, Computer Engineering Department, Islamic University of Gaza, Palestine
2011.
[56] H. Yu, M. Li, H. Zhang, and J. Feng, “Color Texture Moments for Content-Based
Image Retrieval,” Proceedings of the International Conference on Image Processing,
Rochester, New York, USA, vol. 3, pp. 929-932, Sep. 2002.
[57] T. Gevers, and H. Stokman, “Classifying Color Edges in Video into Shadow
Geometry, Highlight, or Material Transitions,” IEEE Transactions on Multimedia, vol. 5,
no. 2, pp. 237-243, Sep. 2003.
[58] H. Guan, and S. Wada, “Flexible Color Texture Retrieval Method Using
Multiresolution Mosaic for Image Classification,” Proceedings of the 6th International
Conference on Signal Processing, vol. 1, pp. 612-615, Feb. 2002.
[59] H. Moghaddam, T. Khajoie, and A. Rouhi, “A New Algorithm for Image Indexing and
Retrieval Using Wavelet Correlogram,” Proceedings of the International Conference on
Image Processing, vol. 3, pp. 497-500, May 2003.
[60] M. Lew, N. Sebe, C. Djeraba and R. Jain, “Content-Based Multimedia Information
Retrieval: State of the Art and Challenges,” ACM Transactions on Multimedia Computing,
Communications and Applications, vol. 2, no. 1, pp. 1-19, February 2006.
[61] F. Riaz, A. Hassan, S. Rehman and U. Qamar, “Texture Classification Using Rotation-
and Scale-Invariant Gabor Texture Features,” IEEE transactions on pattern analysis and
machine intelligence, 2013.
[62] K.P. Jisha, T. Mary., and A. Vasuki. “An Image Retrieval Technique Based on Texture
Features Using Semantic Properties,” International Conference on Signal Processing,
Image Processing and Pattern Recognition, 2013.
[63] J. Han and M. Kambr, “Data Mining Concepts and Techniques,” 2nd Ed., Morgan
Kaufmann Publisher, 2006.
[64] P. Jeyanthi and V. Jawahar Senthil Kumar, “Image Classification by K-means
Clustering.” Advances in Computational Sciences and Technology, 2010.
[65] J.Z. Wang, “Wang Database,” [Online], Available at: http://wang.ist.psu.edu/, last
visited March 15th 2013.

CBIR System Based on the Clustering and Genetic Algorithm
77
[66] M. John, K. Francis, S. Richard and W. Ralph, “Performance Measures for
Information Extraction,” Proceedings of DARPA Broadcast News Workshop, Herndon,
VA, February 1999.