cbo's economic forecasting record - congressional budget office
TRANSCRIPT

CBO
CBO’s Economic Forecasting Record
An evaluation of the economic forecastsCBO made from January 1976 through January 2004
November 2006
A
R E P O R T
The Congress of th
e United States O Congressional Budget Office
Pub. No. 2824

Preface
The Congressional Budget Office (CBO) regularly publishes evaluations of the accuracy of its economic and budget forecasts. Those evaluations help guide CBO’s efforts to improve its forecasts and also assist Members of Congress in their use of CBO's estimates.
This report was prepared by Christopher Williams, with the assistance of Adam Weber and Andrew Gisselquist and under the direction of John Peterson and Robert Dennis. John Skeen edited the report, and Maureen Costantino prepared it for publication. It and other publica-tions appear on the agency’s Web site (www.cbo.gov).
Donald B. MarronActing Director
November 2006


Contents
Sources and Choice of Data for the Evaluation 1
Measuring the Quality of Forecasts 1
Bias 1
Accuracy 1
Alternative Measures of Forecast Quality 2
Limitations of Forecast Evaluations 2
The Effects of Business Cycles, Changes in the Trend Rate ofProductivity Growth, and Oil Price Shocks 3
CBO’s Forecasting Record 4
Two-Year Forecasts 4
Five-Year Projections 9
Tables
1.
Summary Measures of Forecast Performance for Two- andFive-Year Averages 122.
CBO, Administration, and Blue Chip Forecasts of Two-Year AverageGrowth Rates for Real Output 143.
Comparison of CBO, Administration, and Blue ChipForecasts of Two-Year Average Growth Rates for Nominal Output 164.
CBO, Administration, and Blue Chip Forecasts of Two-Year Average Inflation in the Consumer Price Index 185.
CBO, Administration, and Blue Chip Forecasts of Two-Year Average Nominal Interest Rates on Three-Month Treasury Bills 206.
CBO, Administration, and Blue Chip Forecasts of Two-YearAverages for Nominal Long-Term Interest Rates 227.
CBO, Administration, and Blue Chip Forecasts of Two-YearAverage Real Interest Rates on Three-Month Treasury Bills 24
VI CBO’S ECONOMIC FORECASTING RECORD
8.
CBO, Administration, and Blue Chip Forecasts of theDifference Between Two-Year Average Inflation in the CPI and in the GNP or GDP Price Index 269.
CBO and Administration Forecasts of the Two-Year Change in Wage and Salary Disbursements Plus Corporate Book Profits as a Share of Output 2810.
CBO, Administration, and Blue Chip Projections ofFive-Year Average Growth Rates for Real Output 3011.
CBO, Administration, and Blue Chip Projections ofFive-Year Average Growth Rates for Nominal Output 3212.
Comparison of CBO, Administration, and Blue Chip Projections of the Difference Between Five-Year Average Inflation in the CPI and in the GNP or GDP Price Index 3413.
CBO and Administration Projections of the Five-Year Change in Wage and Salary Disbursements Plus Corporate Profits as a Share of Output 36Box
1.
How Data Revisions May Affect the Interpretation ofForecast Errors 5Tables (Continued)

CBO’s Economic Forecasting Record
Since publishing its first macroeconomic forecast in 1976, the Congressional Budget Office (CBO) has compiled a forecasting track record comparable in quality with that of the Blue Chip consensus (an average of pri-vate-sector forecasters) as well as that of the Administra-tion. In particular, CBO’s accuracy for two-year forecasts made between 1982 and 2004 did not differ markedly ei-ther from that of the Blue Chip consensus or from that of the Administration over those years. The accuracy of CBO’s five-year projections also was similar (see Table 1 on page 12). Comparing CBO’s forecasts with those of the Blue Chip consensus suggests that when the agency’s economic predictions missed by the largest margin, those inaccuracies probably reflected problems that all forecast-ers had in predicting turning points in the business cycle.
Sources and Choice of Data for the EvaluationThe data employed in this evaluation were compiled us-ing forecasts published early in the years from 1976 through 2004. (Two-year average forecasts published in 2005 and in early 2006 could not be included in this evaluation because the latest full-year historical data are for 2005.) For all years except 1981, CBO’s forecasts were based on the calendar year forecasts published early each year (or from related files of unpublished forecasts for some variables in some years). The Administration’s fore-casts were taken from the budget documents for all years except 1981.1 Where possible, Blue Chip consensus fore-casts were those published in the same month as CBO’s forecasts. Although the Blue Chip publishes forecasts ev-ery month, in only two months of the year—March and October—do forecasts extend out more than two years, and those longer-term forecasts are published, on average,
1. The Administration’s forecast made in early 1981 came from the Reagan Administration’s revisions to President Carter’s last budget.
three months after CBO’s forecast is completed. Also lim-iting the analysis are the shorter history of the Blue Chip’s two-year forecasts, which began in 1982, and their nar-rower scope. (The Blue Chip’s forecasts do not include a number of important series, most notably wages and sala-ries, that are vital for budget projections.) The appendix to this report gives further details on the choice of histor-ical time-series data as well as on the sources of forecast data for the comparisons.
Measuring the Quality of ForecastsLike earlier studies of economic forecasts, this evaluation focused on two aspects of the quality of CBO’s forecasts: statistical bias and accuracy. Other desirable characteris-tics—such as the efficiency of a forecast, which is dis-cussed later—are harder to assess definitively and would require a larger sample than is available for CBO’s fore-casts.
BiasThe statistical bias of a forecast is its tendency to be overly pessimistic or optimistic. To measure statistical bias, CBO’s evaluation used the mean error (the arith-metic average of the forecast errors), which is the simplest and most widely used measure. Because it is a simple av-erage, however, underestimates and overestimates offset each other in calculating it. As a result, the mean error imperfectly measures the quality of a forecast—a small mean error would result either if all the errors were small or if all the errors were large but the overestimates and underestimates happened to balance each other out.
AccuracyThe accuracy of a forecast is the degree to which its values are narrowly dispersed around actual outcomes. Measures of accuracy more clearly reflect the usual meaning of fore-cast quality than does the mean error because overesti-mates and underestimates do not offset each other in

2 CBO’S ECONOMIC FORECASTING RECORD
these measures. CBO’s evaluation used two measures of accuracy. The mean absolute error (the average of the forecasts’ errors without regard to arithmetic sign) indi-cates the average difference between forecasts and actual values without regard to whether individual forecasts are overestimates or underestimates. The root mean square error (calculated by first squaring the errors, then taking the square root of the arithmetic average of the squared errors) also shows the size of the error without regard to sign, but it gives greater weight to larger errors. Because small errors typically are inconsequential, the root mean square error usually gives the best indication of accuracy.
Alternative Measures of Forecast QualityStudies by analysts outside CBO have used measures that are somewhat more elaborate than the mean error to test for statistical bias in CBO’s forecasts. Those studies have generally concluded, as does this evaluation, that CBO’s short-term economic forecasts do not contain a statisti-cally significant bias.2
A number of other methods have been developed to evaluate a forecast’s “efficiency,” or the extent to which a particular forecast could have been improved by using additional information that was available when the fore-cast was made.3 A simple method is comparing a forecast with the Blue Chip consensus forecast, which represents a wide variety of economic forecasters and thus reflects a broader blend of sources and methods than can be ex-pected from any single forecaster. As such, the consensus forecast may produce better forecasts than any single fore-caster.4 In this evaluation, the Blue Chip predictions serve as a proxy for an efficient forecast. The fact that CBO’s
2. Another approach to testing a forecast for bias is based on linear regression analysis of actual values against forecast values. For details of that method, see J. Mincer and V. Zarnowitz, “The Eval-uation of Economic Forecasts,” in J. Mincer, ed., Economic Fore-casts and Expectations (New York: National Bureau of Economic Research, 1969). That approach is not used here because of the small size of the sample. However, previous studies that have used it to evaluate the short-term forecasts by CBO and the Adminis-tration have not been able to reject the hypothesis that those fore-casts are unbiased. See, for example, M.T. Belongia, “Are Economic Forecasts by Government Agencies Biased? Accurate?” Review, Federal Reserve Bank of St. Louis, vol. 70, no. 6 (Novem-ber/December 1988), pp. 15-23. For a more recent and more elaborate study of forecast bias that included CBO’s forecasts among a sizable sample, see David Laster, Paul Bennett, and In Sun Geoum, Rational Bias in Macroeconomic Forecasts, Staff Report No. 21 (New York: Federal Reserve Bank of New York, March 1997).
forecasts are about as accurate as the Blue Chip’s is a rough indication of their efficiency.
Some researchers contend that economic forecasters, in general, do not use all of the information available to them to forecast downturns in the business cycle and, as a result, makes avoidable systematic errors in forecasting those business cycles.5 Such critics point to the ability of certain leading indicators to predict recessions. Neverthe-less, it is unclear how the information in such indicators can be reliably translated into economic forecasts.
Limitations of Forecast EvaluationsElaborate measures and methods do not necessarily pro-duce reliable indicators of a forecast’s quality when the sample of observations is small, as is the case with CBO’s sample of only 29 two-year observations. Small samples present three main problems in evaluating forecasts. First, they reduce the reliability of statistical tests that are based on the assumption that the errors in the forecast follow a normal (bell-shaped) distribution. The more elaborate measures of forecast quality all make such an assumption about the hypothetical ideal forecast with which the ac-tual forecasts are being compared. Second, in small sam-ples, individual errors in a forecast can have an unduly large influence on the measures. Third, the small sample means that CBO’s track record indicates only weakly the possible direction or size of forecasting inaccuracies in the future.
3. For studies that have examined the relative efficiency of CBO’s economic forecasts, see Belongia, “Are Economic Forecasts by Government Agencies Biased?”; and S.M. Miller, “Forecasting Federal Budget Deficits: How Reliable Are U.S. Congressional Budget Office Projections?” Applied Economics, vol. 23 (December 1991), pp. 1789-1799. Although both studies identify series that might have been used to make CBO’s forecasts more accurate, they rely on statistics that assume a larger sample than is available. Moreover, although statistical tests can identify sources of ineffi-ciency in a forecast after the fact, they generally do not indicate how such information could be used to improve forecasts when they are being made.
4. See, for example, Andy Bauer and others, “Forecast Evaluation with Cross-Sectional Data: The Blue Chip Surveys,” Economic Review, Federal Reserve Bank of Atlanta (Spring 2003), pp. 17-31; and Henry Townsend, “A Comparison of Several Consensus Fore-casts,” Business Economics (January 1996).
5. See R. Fildes and H. Stekler, “The State of Macroeconomic Fore-casting,” pp. 435-468, and K.D. West, “Comments on ‘The State of Macroeconomic Forecasting,’” pp. 495-497, both in Journal of Macroeconomics, vol. 24 (December 2002).

CBO’S ECONOMIC FORECASTING RECORD 3
Apart from the general caveat that should attend any con-clusions based on statistical analysis, there are several rea-sons for viewing any evaluation of CBO’s forecasts with particular caution:
B The procedures and purposes of the CBO, Blue Chip, and Administration economic forecasts differ and have changed over the past two decades, and they may change again. For example, in the late 1970s, CBO characterized its medium-term projections as a goal for the economy; it now considers them to be projec-tions of what will prevail, on average, if the economy continues to reflect historical trends and fiscal policies are unchanged. In contrast, the underlying policy as-sumptions in the Blue Chip forecasts are not clear, for either the short run or the medium term. The Blue Chip is a survey, and the various forecasters often do not state their assumptions about fiscal policy. Last, the various Administration forecasts normally include the projected economic effects of their respective pol-icy proposals, whereas CBO’s forecasts assume current policies.6
B An institution’s track record in forecasting may not indicate its future abilities because of changes in per-sonnel or methods.
B Inaccuracies in a forecast increase when the economy is more volatile and when economic trends change. All three groups of forecasters—CBO, the Blue Chip, and the Administration—made relatively large errors when forecasting for periods that included turning points in the business cycle and for the late 1990s, when the sustainable growth rate of the economy increased be-cause of faster growth in productivity.
B Revisions of the national accounts may mean that in-stitutions forecast one concept while the statistical agencies ultimately report the outcome for a materially different concept. A quantitatively important case in point was the addition of software expenditures to business fixed investment—and hence to gross domes-tic product (GDP)—in the comprehensive revision of the national income and product accounts in October 1999.
6. The role of current-policy or current-law assumptions in CBO’s economic forecasts is explored in Congressional Budget Office, What Is a Current-Law Economic Baseline? (June 2, 2005).
The Effects of Business Cycles, Changes in the Trend Rate of Productivity Growth, and Oil Price ShocksAs the track record shows, forecasters collectively tend to err during periods that include either turning points in the business cycle or significant shifts in the trend rate of labor productivity growth. The difficulty of forecasting business-cycle turning points explains why most forecast-ers overestimated the economy’s growth rate in forecasts they made just before the two back-to-back recessions of the early 1980s. That pattern was repeated in the fore-casts they made just before the more moderate recession of the early 1990s. In addition, during the mid- to late 1970s, forecasters continued to assume that the produc-tivity trend of the previous two decades would prevail. In retrospect, however, the productivity trend of the 1970s and 1980s was significantly lower than that of the 1950s and 1960s. Because forecasters in the 1970s expected the previous trend to return, their forecasts of real output in the mid- to late 1970s turned out to be too optimistic. Partly for the same reason, forecasters repeatedly underes-timated inflation in the late 1970s. Large errors in fore-casting inflation have also been associated with large movements in oil prices.
The late 1990s were a mirror image of the forecasting experience of the late 1970s. Partly because forecasters underestimated the trend rate of productivity growth be-ginning in 1996, they underpredicted the economy’s growth rate and overpredicted inflation for several con-secutive years. As the economy continued to outperform expectations, analysts put more effort into investigating the possible causes of the increase in productivity growth. Those investigations focused on the possible contribution of the so-called new economy—especially the better flow of information among producers and between producers and consumers, which improved productivity and low-ered inventories. On the basis of the most recent revisions to data on production and inputs to production, CBO estimates that an increase in the amount of capital (build-ings, equipment, and software) per worker—sometimes referred to as “capital deepening”—was the primary source of the faster productivity growth in the late 1990s.
Productivity growth has held up very well through the 2001 recession, subsequent recovery, and expansion to date, suggesting that the strong performance of U.S. pro-ductivity in the late 1990s was not simply a transient fea-ture of the economic boom. The productivity growth

4 CBO’S ECONOMIC FORECASTING RECORD
since 2001 has resulted from something other than fur-ther increases in measured capital per worker. But the rapid pace of growth in labor productivity during this pe-riod did not surprise forecasters and so has not caused major forecast errors.
Of course, large forecast errors of economic growth can occur in the absence of recessions and changes in produc-tivity trends. The two-year forecasts made in 2004 by CBO, the Blue Chip consensus, and the Administration all show significant forecast errors for real GDP (the causes of which are discussed in a subsequent section).
The proximate cause of many large errors in forecasting price inflation has been large, unexpected movements in oil prices. From 1979 to 1980, and again from late 2003 to 2005, oil prices roughly doubled. Both CBO and the Administration substantially underpredicted consumer price index (CPI) inflation in the 1979-1980, 1980-1981, and 2004-2005 forecasts. By contrast, sharp and unexpected declines in oil prices in 1986, and again in 1997 and 1998, led forecasters to overestimate the two-year rate of price inflation.
CBO’s Forecasting RecordThis analysis evaluates CBO’s macroeconomic forecasts, which cover two-year and five-year periods. Because the budget reports that CBO and the Administration publish every winter focus on budget projections for the fiscal year that begins in the following October, an economic forecast that is accurate not only for the months leading up to that budget year but also for the budget year itself will provide the basis for a more accurate forecast of the budget’s bottom line (the annual deficit or surplus)—hence the interest in the two-year period. The five-year period is used to examine the accuracy of longer-term projections of several variables that are important for CBO’s budget projections.
CBO has analyzed elsewhere the overall uncertainty of its budget projections, which depend in part on the accuracy of its economic projections.7 In addition, “rules of thumb” for estimating the effects that alternative assump-tions about various macroeconomic variables have on budget projections appear in Appendix C of CBO’s The
Budget and Economic Outlook: Fiscal Years 2007 to 2016 (January 2006).
Two-Year ForecastsHistorically, the accuracy of CBO’s two-year forecasts, as measured by the root mean square error, has been very similar to the accuracy of the forecasts of the Blue Chip consensus and the Administration.
Growth in Real Output. The accuracy of CBO’s forecasts closely matched that of the Blue Chip consensus for the two-year forecasts made between 1982 and 2004. CBO’s root mean square error was 1.2, as was that for the Blue Chip consensus (see Table 2 on page 14). In addition, the two sets of errors were highly positively correlated; when CBO’s error was relatively large, the Blue Chip’s error also was large and in the same direction. In fact, the two sets of forecast errors differed by more than 0.1 percentage point in only 11 of the 23 forecasts made during those years. CBO was closer to the actual value in six of those forecasts and the Blue Chip in five. (CBO’s forecasts, which were published in the same month as the Blue Chip forecasts with which they were compared, were normally completed nearly two months earlier to provide time for the budget projections to be prepared.) Overall, CBO’s forecasts were about as accurate as those of the Adminis-tration.
As noted earlier, forecast errors tend to be larger at turn-ing points in the business cycle and when there are shifts in major economic trends. That tendency can be clearly seen in the forecasts of real output growth by comparing the large errors for 1979 through 1983—when the econ-omy went through its most turbulent recessionary period of the postwar era—with the smaller errors recorded for the mid-expansion years from 1985 to 1987. More re-cently, the recession of 2001 and slow recovery in 2002 accounted for the overpredictions made by all three fore-casters in 2000 and 2001.
All three forecasters underpredicted two-year real, or in-flation-adjusted, GDP growth in every year between
7. See also Congressional Budget Office, The Uncertainty of Budget Projections: A Discussion of Data and Methods (March 2006).
CBO’S ECONOMIC FORECASTING RECORD 5
Box 1.
How Data Revisions May Affect the Interpretation of Forecast ErrorsData revisions can be an important factor in explain-ing forecast errors for a number of the series exam-ined in this analysis. If revisions change trends incor-porated into history, forecasts made on the basis of prerevision trends are likely to be inaccurate. The Bu-reau of Economic Analysis’s (BEA’s) comprehensive revisions published in October 1999 increased the two-year growth rates for real gross domestic product (GDP) over most of the historical period; in particu-lar, rates went up by about 0.4 percentage points, on average, for the 1985-1998 period. That upward revi-sion in growth rates stemmed largely from redefining, in the national income and product accounts (NIPAs), software spending as investment as well as adopting new price series for various categories of consumption. The upward revision to the growth of real output was accompanied by a downward revision to the growth of the GDP price index over the same period. In addition to making the mean forecast error less informative, those revisions distort the reliability of the statistical measures of accuracy. Some series ex-amined in this analysis—nominal interest rates—are not affected by revisions. Others are subject to trivial revisions—notably the consumer price index, which is affected only by revisions to seasonal factors.
Not every revision has a large effect. BEA’s latest com-prehensive revision to the NIPAs—in December 2003—did not significantly affect the historical pat-tern of any of the variables used in this analysis of forecast accuracy. Real GDP growth from 1976 to 2002 (the period used in this analysis) was revised upward, on average, by about 0.05 percentage points, and the greatest revision for any two-year span was +0.3 percentage points for the 1991-1992 period. The revision also had small effects on the growth of the GDP price index and nominal GDP. Although the revision had a significant impact on income shares in 2002—taxable income as a share of GDP was revised upward by 0.3 percentage points—in general, CBO’s view of the history of income shares
did not change. Hence, the December 2003 revisions did not have a significant effect on this evaluation of forecasts.
The three-year NIPA revisions released in July 2006, however, changed the patterns of errors for forecasts of NIPA variables for 2003 through 2005. Growth of real GDP was revised down, but because the price in-dex for gross domestic purchases was revised up, the downward revisions to nominal GDP were small (that pattern was qualitatively similar to the impact of the previous year’s NIPA revisions). One illustra-tion of the way that revisions to historical data change forecast performance is given by the two-year forecast for real GDP growth over 2003 and 2004. Prior to the latest revision, CBO’s forecast error was an underprediction of 0.4 percentage points, while the Blue Chip’s and the Administration’s were also un-derpredictions, of 0.3 and 0.2 percentage points, re-spectively. After the revision, the forecast errors for the Blue Chip and the Administration essentially dis-appeared, and CBO’s turns out to have been only 0.2 percentage points, as currently measured.
A more vivid illustration of the impacts of data revi-sions on forecast accuracy can be seen in the forecast for the change in the income share of wages and prof-its for the 2003-2004 period. In early 2003, CBO forecast a gain of 1.1 percentage points in that share over the two-year horizon, while the Administration forecast a gain of 1.6 percentage points. Prior to BEA’s latest revision, the actual income share was re-ported as essentially unchanged, implying a forecast error by CBO of 1.2 percentage points. But July’s three-year revision of the NIPAs now implies that the income share of wages and profits increased by 0.9 percentage points over those years, so that CBO’s forecast error is now only 0.2 percentage points. The Administration’s error, which was previously 1.6 per-centage points, has fallen to 0.7 percentage points.

6 CBO’S ECONOMIC FORECASTING RECORD
1992 and 1999, with errors approaching or exceeding 2 percentage points for the two-year forecasts made be-tween 1996 and 1999. About a fourth of that apparent pessimism resulted from subsequent revisions to the na-tional income and product accounts, including important definitional changes (see Box 1). Yet leaving those data re-visions aside, the underpredictions made between 1996 and 1999 still reflect the failure to foresee important eco-nomic developments. What CBO and other forecasters missed was the investment boom of the late 1990s, which deepened the capital stock and thereby boosted labor pro-ductivity and real economic growth.
All three forecasters overpredicted the growth of real GDP for the two-year forecast made in early 2004. They correctly foresaw strong expansion in domestic demand but wrongly expected that U.S. output would grow as fast as demand. Forecasters, including CBO, failed to see that labor force participation would stay low, that the hours worked would not rebound quickly, and that the demand for imports would be so strong and therefore that, with the growth of domestic output lower than predicted, an increasing share of domestic demand would be met by foreign production. Instead of the narrowing of the trade deficit that was anticipated for 2005, the trade deficit widened further. CBO forecast somewhat stronger eco-nomic growth for the two-year period than the Adminis-tration and the Blue Chip consensus did, and so its fore-cast error for real output was larger.
Growth in Nominal Output. The records of CBO and the Blue Chip in forecasting two-year growth in nominal out-put are also quite similar overall (see Table 3 on page 16). Again, the two forecasts are positively correlated. Of the 23 forecasts made between 1982 and 2004, the Blue Chip’s error was smaller (by more than 0.1 percentage point) than CBO’s eight times; CBO had the smaller er-ror three times; and the two forecasters recorded virtually identical errors 12 times. The accuracies for the entire pe-riod, as measured by the root mean square error, were al-most identical.
CBO’s projections of nominal output were about as accu-rate as those of the Administration, both since 1982 and over the longer interval between 1976 and 2004.
For the 2004-2005 period, all three forecasters overpre-dicted the growth rate of real output but also underpre-dicted inflation in the GDP price index by more. Hence, all three forecasters underpredicted the growth rate of
nominal output. The forecast errors for the two-year pro-jection of nominal GDP beginning in 2004 made by CBO and the Blue Chip were almost identical, while the Administration’s underprediction of nominal GDP was somewhat larger.
CPI Inflation. CBO was about as successful as the Blue Chip in forecasting the two-year average growth in the consumer price index (see Table 4 on page 18). CBO was more than 0.1 percentage point closer to the actual value in eight of the 23 periods, the Blue Chip was closer in four periods, and the two forecasters had essentially matching errors in 11 periods.
The variability of oil prices caused both CBO and the Blue Chip to err in forecasting inflation. They overesti-mated future inflation in the 1982-1986 period as well as in the 1997-1998 period, partly because of the rapid drop in oil prices early in 1986 and in 1997 to 1998. Con-versely, the sharp rise in oil prices in 2000 and again in 2003 caused both forecasters to underestimate inflation in the two-year-ahead forecasts published in early 1999 and 2000 as well as those published in 2003. Additional unanticipated hikes in oil prices that were each larger than the previous year’s occurred in 2004 and again in 2005, and as a result, both forecasters recorded above av-erage errors in their two-year forecasts for CPI inflation made in early 2004.
The accuracy of CBO’s forecasts of inflation was virtually the same as the Administration’s in the period since 1982 and over the longer period since 1976.
Nominal Interest Rates. For the 1982-2004 forecasts of nominal short-term interest rates, CBO’s record was al-most the same as the Blue Chip’s as measured by the root mean square error (see Table 5 on page 20). Both CBO and the Blue Chip tended to overestimate rates slightly (the forecasters’ mean errors over that period were 0.5 percentage points). CBO was more than 0.1 percentage point closer to the actual value in eight of the 23 periods, and the Blue Chip was closer six times.
The overall accuracy of CBO’s forecasts of long-term in-terest rates for the 1984-2004 period was very close to that of the Blue Chip forecasts (see Table 6 on page 22). CBO was more than 0.1 percentage point closer to the actual value in six of the 21 periods, the Blue Chip was closer in five periods, and the two forecasters had essen-

CBO’S ECONOMIC FORECASTING RECORD 7
tially identical errors in 10 periods. Since 1991, CBO has been closer for five forecasts and the Blue Chip for one.
CBO’s forecasts of long-term interest rates were slightly more accurate than those of the Administration, but there was no significant difference between the accuracy of the two government forecasters for short-term rates.
Real Short-Term Interest Rates. CBO and the Blue Chip had about the same accuracy, using the root mean square error, in estimating short-term interest rates adjusted for inflation in the 1982-2004 period (see Table 7 on page 24). CBO’s forecasts were closer to the actual value in three of the 23 periods, the Blue Chip’s were closer in 11, and the two registered similar errors in nine periods.
CBO’s forecast accuracy was similar to that of the Ad-ministration for the period since 1982; CBO was slightly more accurate than the Administration for the 1976-2004 period.
The Difference Between the Growth of the CPI and the GDP Price Index. The difference in the forecasted growth rates of the two major price indexes, the CPI and the GDP price index, is important for budget projections. The growth of the GDP price index is a major determi-nant in forecasting the growth of nominal GDP and, therefore, the growth of income subject to federal tax. All else being equal, the faster the projected growth of the GDP price index, the faster the projected growth of revenues. The growth of the consumer price index affects forecasts of outlays because a number of programs are indexed to the CPI. The CPI projection, however, also affects projections of revenues because elements of the personal tax code, such as tax brackets, are indexed to the CPI. In general, the faster the growth of the CPI, the faster the growth of outlays and the slower the growth of revenues. Therefore, if the growth of the GDP price index is forecast to be large relative to that of the CPI, the projection of the deficit will be smaller than if the GDP price index is assumed to grow much less rapidly than the CPI.
The mean error statistics indicate a downward bias to CBO’s forecast of the difference between the growth of the CPI and the growth of the GDP price index for fore-casts made through 1999 (see Table 8 on page 26). A similar bias is evident in the forecasts of the Blue Chip and the Administration. The apparent bias in those fore-casts can be explained in large part by changes in the
national income accounts. Most notably, in a conceptual and methodological change implemented in 1999, busi-ness spending on software was added to investment and therefore to GDP (previously business software spending was considered a purchase of an intermediate good). Be-cause the price index for software purchases has been growing much less rapidly than all other prices on aver-age, the change in classifying software spending caused a downward revision of the historical data for the growth of the GDP price index. Hence, the forecasts made before 2000 had been based on a pattern of historical growth in the GDP price index that was higher than is currently reported.
The accuracy of CBO’s forecast of the difference between the two indexes two years ahead was the same as that of the Blue Chip consensus (see Table 8). CBO was more ac-curate than the Blue Chip (by more than 0.1 percentage point) in four of the 23 periods, the Blue Chip was more accurate in four periods, and the two forecasters had es-sentially identical errors in 15 periods.
CBO was about as accurate as the Administration during both the 1976-2004 and 1982-2004 periods.
Taxable Income. One of the greatest sources of error in budget projections is in forecasting taxable income. The errors in the first step of such forecasting, the forecast of nominal GDP growth, were discussed above. The errors in the second step—the forecast of the relationship of major components of taxable income to nominal GDP (particularly the “high-tax” income share of GDP)—are discussed here. The most important component of tax-able income for revenue projections is wages and salaries, followed by the book profits of corporations. Because the Blue Chip does not forecast wages and salaries, CBO’s forecast record cannot be compared with that of the pri-vate-sector survey in this respect.8
The accuracy of CBO’s and the Administration’s forecasts of the two-year change in the combined share of wages and salaries and book profits in GDP has been almost identical for the period since 1980 (see Table 8 on page 26). Moreover, the pattern of errors has been simi-lar: both forecasters experienced a string of underpredic-tions of the change in the income share in the forecasts they made between 1994 and 1999. Both forecasters
8. See Congressional Budget Office, How CBO Forecasts Income (August 2006).
8 CBO’S ECONOMIC FORECASTING RECORD
made large errors by overpredicting the increase in the share in the forecasts they made in 2001 and 2002. Re-cently revised data from the Bureau of Economic Analysis (BEA) shows that the actual value of this combined in-come share has risen for the two-year periods beginning in 2003 and 2004. In the light of the revised data, it now appears that neither forecaster made the large overpredic-tions previously reported for the 2003-2004 period. The forecasts made in 2004 by both CBO and the Adminis-tration for the two-year change in the income share are close to the actual data.
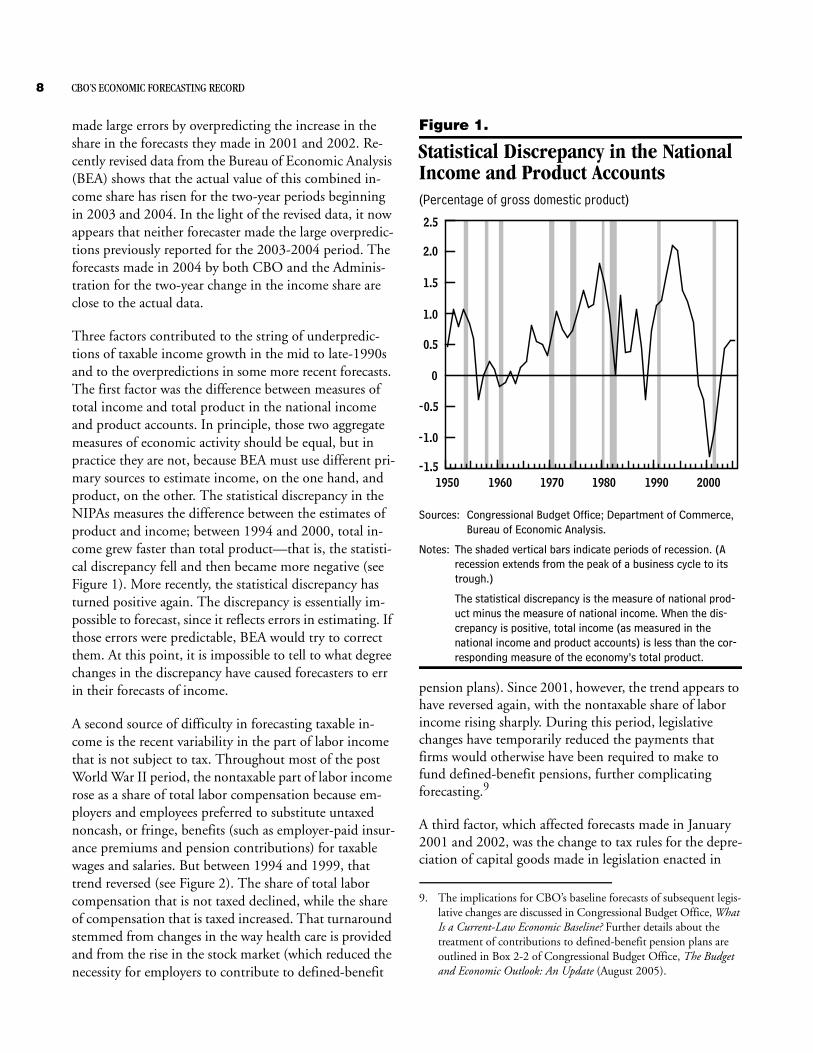
Three factors contributed to the string of underpredic-tions of taxable income growth in the mid to late-1990s and to the overpredictions in some more recent forecasts. The first factor was the difference between measures of total income and total product in the national income and product accounts. In principle, those two aggregate measures of economic activity should be equal, but in practice they are not, because BEA must use different pri-mary sources to estimate income, on the one hand, and product, on the other. The statistical discrepancy in the NIPAs measures the difference between the estimates of product and income; between 1994 and 2000, total in-come grew faster than total product—that is, the statisti-cal discrepancy fell and then became more negative (see Figure 1). More recently, the statistical discrepancy has turned positive again. The discrepancy is essentially im-possible to forecast, since it reflects errors in estimating. If those errors were predictable, BEA would try to correct them. At this point, it is impossible to tell to what degree changes in the discrepancy have caused forecasters to err in their forecasts of income.
A second source of difficulty in forecasting taxable in-come is the recent variability in the part of labor income that is not subject to tax. Throughout most of the post World War II period, the nontaxable part of labor income rose as a share of total labor compensation because em-ployers and employees preferred to substitute untaxed noncash, or fringe, benefits (such as employer-paid insur-ance premiums and pension contributions) for taxable wages and salaries. But between 1994 and 1999, that trend reversed (see Figure 2). The share of total labor compensation that is not taxed declined, while the share of compensation that is taxed increased. That turnaround stemmed from changes in the way health care is provided and from the rise in the stock market (which reduced the necessity for employers to contribute to defined-benefit
Figure 1.
Statistical Discrepancy in the National Income and Product Accounts(Percentage of gross domestic product)
Sources: Congressional Budget Office; Department of Commerce, Bureau of Economic Analysis.
Notes: The shaded vertical bars indicate periods of recession. (A recession extends from the peak of a business cycle to its trough.)
The statistical discrepancy is the measure of national prod-uct minus the measure of national income. When the dis-crepancy is positive, total income (as measured in the national income and product accounts) is less than the cor-responding measure of the economy’s total product.
pension plans). Since 2001, however, the trend appears to have reversed again, with the nontaxable share of labor income rising sharply. During this period, legislative changes have temporarily reduced the payments that firms would otherwise have been required to make to fund defined-benefit pensions, further complicating forecasting.9
A third factor, which affected forecasts made in January 2001 and 2002, was the change to tax rules for the depre-ciation of capital goods made in legislation enacted in
9. The implications for CBO’s baseline forecasts of subsequent legis-lative changes are discussed in Congressional Budget Office, What Is a Current-Law Economic Baseline? Further details about the treatment of contributions to defined-benefit pension plans are outlined in Box 2-2 of Congressional Budget Office, The Budget and Economic Outlook: An Update (August 2005).
200019901980197019601950
2.5
2.0
1.5
1.0
0.5
0
-0.5
-1.0
-1.5

CBO’S ECONOMIC FORECASTING RECORD 9
Figure 2.
Fringe Benefits(Percentage of total labor compensation)
Sources: Congressional Budget Office; Department of Commerce, Bureau of Economic Analysis.
Notes: The shaded vertical bars indicate periods of recession. (A recession extends from the peak of a business cycle to its trough.)
Fringe benefits are employers’ contributions for employees’ pension and insurance funds.
2002 and 2003. By allowing more depreciation than pre-viously, the changes caused corporate book profits to be lower relative to economic profits (because more depreci-ation could be written off as a business expense) than usual. Forecasters in 2001 did not incorporate that effect for 2002, so forecasts of book profits were too high for that year.
Five-Year ProjectionsCBO’s economic projections were about as accurate as those of the Blue Chip and the Administration in all the series examined. The Blue Chip’s five-year economic pro-jections (published twice a year) are generally prepared about three months after the CBO forecasts with which they are compared. While the CBO projections are con-strained to assume no change in fiscal policy and the Administration’s forecasts generally assume the Adminis-tration’s proposals are enacted, the Blue Chip forecasters are free to make their best projections for future fiscal policy. That freedom and additional months of data do not seem to translate into a forecasting edge, however.
200019901980197019601950
14
12
10
8
6
4
2
0
Real Output. CBO’s projections of medium-term growth in real output were about as accurate as the Blue Chip’s in the period since 1979 (see Table 10 on page 30). As with the errors in the two-year forecasts, the errors in the five year projections of the two forecasters were highly posi-tively correlated, with both forecasters posting similarly large errors for the same years (1979 as well as 1994 through 1997). The mean errors for the 1979-2001 pe-riod indicate that both forecasters had an identical down-ward bias (they predicted lower growth, on average, than what actually occurred) of 0.3 percentage points. In the five-year-ahead projections made between 1992 and 1999, both CBO and the Blue Chip underpredicted long-term growth because of the surprisingly strong economy of the late 1990s and, to a lesser extent, the upward revi-sions to BEA’s estimates of the rate of growth previously discussed.
In 2000 and 2001, all three forecasters boosted their five-year projections of real economic growth from previous estimates. Those projections now appear to have been overpredictions, mainly because they did not anticipate the recession of 2001 and the weakness of the subsequent recovery. The overprediction in the early part of those five-year projections is partly offset by the fact that in 2004 real growth was appreciably stronger than had been forecast in 2000 and 2001.
The accuracy of CBO’s projections was also similar to that of the Administration’s.
Nominal Output. The accuracy of the CBO and the Blue Chip forecasts of the growth of nominal output have been very similar for the period since 1982 (see Table 11 on page 32). The accuracy has been better than that for the growth of real output in forecasts made since 1992 be-cause the forecasters’ errors in their projections of the in-flation rate for the price index of output offset their errors in forecasting real output.
Inflation Measures. The difference between the two ma-jor inflation measures is even more important for five-year budget projections than for two-year forecasts. The mean error statistics indicate a slightly larger downward bias than in the two-year case, and the projections of the difference in the growth of the CPI and the GDP price index over five-year horizons were too low in virtually all of the periods (see Table 12 on page 34). Like CBO, the Blue Chip and the Administration have also tended to forecast too high a rate of growth in the GDP price

10 CBO’S ECONOMIC FORECASTING RECORD
measure relative to the CPI measure of prices. At least 0.2 percentage points of the apparent forecast bias be-tween 1985 and 1998 resulted from the downward revi-sion in the growth of the GDP price index that occurred when the national accounts were revised in 1999.
Even after the errors are adjusted for the effect of the revi-sions, a slight downward bias remains for all three fore-casters. That bias indicates that projections of the rela-tionship between those two price measures tend to contribute to optimistic budget projections. While all of the projections showed a similar bias, CBO’s forecast ac-curacy is about the same as that of the Blue Chip and slightly better than that of the Administration.
Taxable Income. The final five-year projection record ex-amined here is that of the change in the sum of wages and salaries and corporate book profits expressed as a share of output. (As with the two-year forecast, these are the most
important income components for revenue projections.) CBO’s projections are less accurate than those of the Ad-ministration (see Table 13 on page 36). Compared with the Administration’s projections, CBO’s five-year fore-casts of these important components of the tax base were insufficiently pessimistic in the early 1980s but then too pessimistic in 1996 and 1997. As with some other vari-ables, the errors of both forecasters show alternating peri-ods of optimism and pessimism and are positively corre-lated. CBO’s five-year projections made between 1991 and 1997 indicated less growth in the tax base relative to GDP than actually occurred. The Administration made similar errors. Difficulties in forecasting the statistical dis-crepancy and the nontaxable component of labor income are major sources of errors in five-year projections as well as in two-year forecasts. (Three factors contributing to er-rors in CBO’s forecasts of taxable income were discussed above in the context of the two-year horizon.)


12 CBO’S ECONOMIC FORECASTING RECORD
Table 1.
Summary Measures of Forecast Performance for Two- and Five-Year Averages(Percentage points)
Continued
Mean error -0.4 -0.5 -0.3Mean absolute error 1.0 1.0 1.0Root mean square error 1.2 1.2 1.3
Mean error 0.1 0.1 0.2Mean absolute error 1.0 1.0 1.1Root mean square error 1.3 1.2 1.4
Mean error 0.4 0.4 0.2Mean absolute error 0.7 0.7 0.7Root mean square error 0.9 0.9 0.9
Nominal Interest Rate on Three-Month Treasury Bills (1982–2004)Mean error 0.5 0.5 0.2Mean absolute error 1.1 1.0 1.1Root mean square error 1.3 1.2 1.3
Mean error 0.3 0.4 -0.1Mean absolute error 0.7 0.7 0.8Root mean square error 0.7 0.7 0.9
Real Interest Rate on Three-Month Treasury Bills (1982–2004)Mean error 0.2 0.1 -0.1Mean absolute error 1.0 0.9 1.0Root mean square error 1.2 1.1 1.2
Mean error -0.1 -0.2 -0.3Mean absolute error 0.3 0.4 0.4Root mean square error 0.4 0.4 0.5
Change in Wage and Salary Disbursements Plus Corporate Book Profits as a Share of Output (1980–2004)
Mean error 0.2 * 0.3Mean absolute error 0.9 * 0.9Root mean square error 1.1 * 1.1
(1982–2004)
CBO Blue Chip a Administration
Growth Rate for Real Output (1982–2004)
Growth Rate for Nominal Output (1982–2004)
Inflation in the Consumer Price Index (1982–2004)
Nominal Long-Term Interest Rate (1984–2004)
Difference Between Inflation in the CPI and the GDP Price Index

CBO’S ECONOMIC FORECASTING RECORD 13
Table 1.
Continued(Percentage points)
Sources: Congressional Budget Office; Office of Management and Budget; Aspen Publishers, Inc., Blue Chip Economic Indicators; Department of Commerce, Bureau of Economic Analysis.
Notes: The values reported here are derived from Tables 2 through 13. Errors are projected values minus actual values; thus, a positive error is an overestimate.
*= not applicable.
a. The Blue Chip is the average of approximately 50 private-sector forecasters.
Mean error -0.3 -0.3 0.0Mean absolute error 0.6 0.6 0.8Root mean square error 0.9 0.8 0.9
Mean error 0.4 0.6 0.6Mean absolute error 0.8 0.8 0.8Root mean square error 0.9 1.0 1.0
(1983–2001)Mean error -0.3 -0.3 -0.4Mean absolute error 0.4 0.4 0.5Root mean square error 0.4 0.5 0.6
Profits as a Share of Output (1980–2001)Mean error -0.1 * 0.1Mean absolute error 1.7 * 1.4Root mean square error 2.2 * 1.8
CBO Blue Chip a Administration
Growth Rate for Real Output (1979–2001)
Growth Rate for Nominal Output (1982–2001)
Difference Between Inflation in the CPI and the GDP Price Index
Change in Wage and Salary Disbursements Plus Corporate Book

14 CBO’S ECONOMIC FORECASTING RECORD
Table 2.
CBO, Administration, and Blue Chip Forecasts of Two-Year AverageGrowth Rates for Real Output(By calendar year, in percent)
Continued
1976–1977 6.7 4.8 4.8 5.1 6.2 1.1 * * 5.9 0.91977–1978 5.2 5.0 4.7 5.1 5.5 0.4 * * 5.1 0.11978–1979 3.9 3.9 3.8 4.5 4.7 0.3 * * 4.7 0.31979–1980 1.3 1.1 1.1 1.6 2.7 1.2 * * 2.9 1.31980–1981 1.1 0.9 0.5 1.0 0.5 -0.5 * * 0.5 -0.51981–1982 0.2 -0.3 -0.4 0.2 2.1 1.9 * * 2.6 2.41982–1983 0.7 0.5 0.7 1.2 2.1 0.9 2.0 0.8 2.7 1.41983–1984 5.2 5.2 4.9 5.7 3.4 -2.3 3.5 -2.2 2.6 -3.11984–1985 * 5.1 4.4 5.4 4.7 -0.7 4.3 -1.1 4.7 -0.71985–1986 * 3.0 2.8 3.5 3.3 -0.2 3.2 -0.3 3.9 0.41986–1987 * 3.1 2.9 3.3 3.1 -0.1 3.0 -0.3 3.7 0.41987–1988 * 3.9 3.5 3.8 2.9 -0.9 2.8 -0.9 3.3 -0.51988–1989 * 3.5 3.3 3.9 2.4 -1.4 2.1 -1.7 3.0 -0.91989–1990 * 1.7 2.0 2.8 2.5 -0.3 2.2 -0.6 3.2 0.41990–1991 * * 0.3 0.9 2.0 1.2 1.9 1.1 2.8 1.91991–1992 * * 0.7 1.5 1.6 0.1 1.2 -0.3 1.4 -0.1
1992–1993 * * 2.7 3.0 2.6 -0.4 2.3 -0.7 2.2 -0.81993–1994 * * 3.6 3.3 2.9 -0.4 3.0 -0.3 2.9 -0.41994–1995 * * * 3.3 2.8 -0.5 2.8 -0.4 2.9 -0.31995–1996 * * * 3.1 2.4 -0.7 2.6 -0.5 2.6 -0.51996–1997 * * * 4.1 1.9 -2.1 2.1 -2.0 2.2 -1.81997–1998 * * * 4.3 2.1 -2.2 2.2 -2.1 2.1 -2.21998–1999 * * * 4.3 2.3 -2.0 2.4 -1.9 2.2 -2.11999–2000 * * * 4.1 2.0 -2.1 2.3 -1.7 2.2 -1.92000–2001 * * * 2.2 3.2 1.0 3.3 1.1 3.0 0.82001–2002 * * * 1.2 2.9 1.7 3.0 1.8 3.2 2.12002–2003 * * * 2.1 2.4 0.4 2.2 0.1 2.2 0.22003–2004 * * * 3.2 3.0 -0.2 3.2 0.0 3.2 0.02004–2005 * * * 3.6 4.5 0.9 4.1 0.6 4.0 0.4
Real GDPf
Errord Forecast Errord
Real GNP
CBO Blue Chip e AdministrationDollarsa Dollarsb Dollarsc Index Forecast Errord Forecast
Actual Chain-Type
Annual-1972 1982 1987 Weighted
CBO’S ECONOMIC FORECASTING RECORD 15
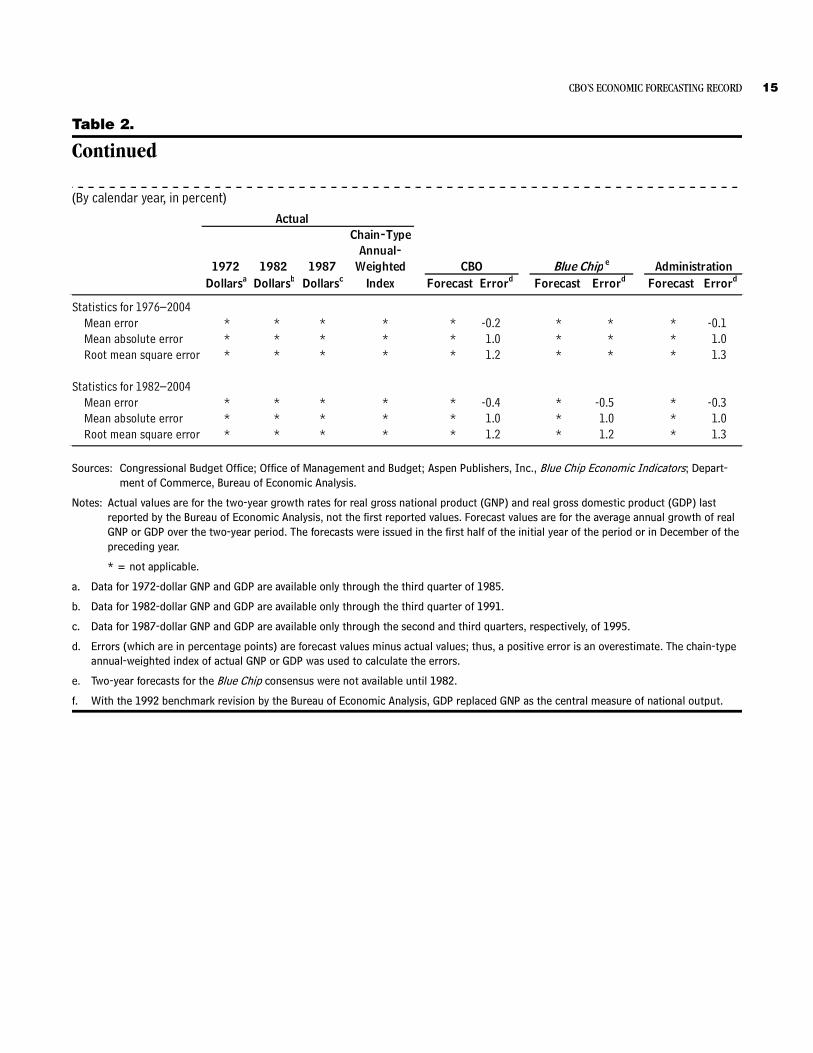
Table 2.
Continued
(By calendar year, in percent)
Sources: Congressional Budget Office; Office of Management and Budget; Aspen Publishers, Inc., Blue Chip Economic Indicators; Depart-ment of Commerce, Bureau of Economic Analysis.
Notes: Actual values are for the two-year growth rates for real gross national product (GNP) and real gross domestic product (GDP) last reported by the Bureau of Economic Analysis, not the first reported values. Forecast values are for the average annual growth of real GNP or GDP over the two-year period. The forecasts were issued in the first half of the initial year of the period or in December of the preceding year.
* = not applicable.
a. Data for 1972-dollar GNP and GDP are available only through the third quarter of 1985.
b. Data for 1982-dollar GNP and GDP are available only through the third quarter of 1991.
c. Data for 1987-dollar GNP and GDP are available only through the second and third quarters, respectively, of 1995.
d. Errors (which are in percentage points) are forecast values minus actual values; thus, a positive error is an overestimate. The chain-type annual-weighted index of actual GNP or GDP was used to calculate the errors.
e. Two-year forecasts for the Blue Chip consensus were not available until 1982.
f. With the 1992 benchmark revision by the Bureau of Economic Analysis, GDP replaced GNP as the central measure of national output.
Mean error * * * * * -0.2 * * * -0.1Mean absolute error * * * * * 1.0 * * * 1.0Root mean square error * * * * * 1.2 * * * 1.3
Mean error * * * * * -0.4 * -0.5 * -0.3Mean absolute error * * * * * 1.0 * 1.0 * 1.0Root mean square error * * * * * 1.2 * 1.2 * 1.3
Statistics for 1982–2004
Errord Forecast Errord
Statistics for 1976–2004
CBO Blue Chip e AdministrationDollarsa Dollarsb Dollarsc Index Forecast Errord Forecast1972 1982 1987 Weighted
Actual Chain-Type
Annual-

16 CBO’S ECONOMIC FORECASTING RECORD
Table 3.
Comparison of CBO, Administration, and Blue Chip Forecasts of Two-YearAverage Growth Rates for Nominal Output(By calendar year, in percent)
Continued
1976–1977 11.5 13.1 1.7 * * 12.3 0.81977–1978 12.1 10.8 -1.3 * * 11.2 -1.01978–1979 12.5 10.9 -1.6 * * 11.2 -1.31979–1980 10.4 11.0 0.5 * * 10.4 -0.11980–1981 10.4 9.7 -0.7 * * 9.5 -0.81981–1982 8.0 12.1 4.1 * * 11.9 4.01982–1983 6.3 9.7 3.4 9.5 3.2 9.8 3.51983–1984 9.8 8.2 -1.6 9.0 -0.9 8.0 -1.81984–1985 9.0 9.9 0.9 9.6 0.6 9.6 0.61985–1986 6.2 7.6 1.3 7.4 1.2 8.2 1.91986–1987 5.8 7.1 1.3 6.7 0.9 7.7 1.81987–1988 7.0 6.5 -0.5 6.4 -0.5 6.9 -0.11988–1989 7.6 6.3 -1.3 6.1 -1.5 6.8 -0.91989–1990 6.7 6.8 0.1 6.6 -0.1 7.1 0.41990–1991 4.6 6.1 1.5 6.0 1.4 7.1 2.51991–1992 4.4 5.7 1.3 5.2 0.8 5.6 1.2
1992–1993 5.4 5.7 0.3 5.5 0.2 5.4 0.01993–1994 5.6 5.3 -0.3 6.0 0.4 5.3 -0.31994–1995 5.4 5.6 0.2 5.6 0.2 5.7 0.31995–1996 5.1 5.2 0.1 5.7 0.6 5.6 0.41996–1997 6.0 4.7 -1.3 4.5 -1.4 5.1 -0.91997–1998 5.8 4.6 -1.2 4.6 -1.2 4.7 -1.01998–1999 5.6 4.5 -1.2 4.5 -1.1 4.2 -1.51999–2000 5.9 3.9 -2.0 4.1 -1.8 4.0 -1.92000–2001 4.5 4.9 0.3 5.1 0.6 4.9 0.42001–2002 3.3 5.2 1.9 5.1 1.8 5.4 2.12002–2003 4.0 4.2 0.2 4.0 0.0 4.2 0.22003–2004 5.8 4.8 -1.0 5.0 -0.8 4.7 -1.12004–2005 6.6 5.6 -1.0 5.7 -0.9 5.3 -1.3
CBO Blue Chip b AdministrationActual Forecast Errora Forecast Errora Forecast Errora
GNP
GDPc

CBO’S ECONOMIC FORECASTING RECORD 17
Table 3.
Continued
(By calendar year, in percent)
Sources: Congressional Budget Office; Office of Management and Budget; Aspen Publishers, Inc., Blue Chip Economic Indicators; Depart-ment of Commerce, Bureau of Economic Analysis.
Notes: Actual values are for the two-year growth rates for gross national product (GNP) and gross domestic product (GDP) last reported by the Bureau of Economic Analysis, not the first reported values. Forecast values are for the average annual growth of nominal GNP or GDP over the two-year period. The forecasts were issued in the first half of the initial year of the period or in December of the preced-ing year.
* = not applicable.
a. Errors (which are in percentage points) are forecast values minus actual values; thus, a positive error is an overestimate.
b. Two-year forecasts for the Blue Chip consensus were not available until 1982.
c. With the 1992 benchmark revision by the Bureau of Economic Analysis, GDP replaced GNP as the central measure of national output.
Mean error * * 0.1 * * * 0.2Mean absolute error * * 1.2 * * * 1.2Root mean square error * * 1.5 * * * 1.5
Mean error * * 0.1 * 0.1 * 0.2Mean absolute error * * 1.0 * 1.0 * 1.1Root mean square error * * 1.3 * 1.2 * 1.4
ErroraCBO Blue Chip b
Statistics for 1976–2004
Statistics for 1982–2004
AdministrationActual Forecast Errora Forecast Errora Forecast

18 CBO’S ECONOMIC FORECASTING RECORD
Table 4.
CBO, Administration, and Blue Chip Forecasts of Two-Year AverageInflation in the Consumer Price Index(By calendar year, in percent)
Continued
6.1 6.1 7.1 1.0 * * 6.1 *7.0 7.0 4.9 -2.1 * * 5.2 -1.89.4 9.5 5.8 -3.7 * * 6.0 -3.5
12.4 12.5 8.1 -4.3 * * 7.4 -5.011.9 11.9 10.1 -1.8 * * 10.5 -1.4
8.2 8.1 10.4 2.1 * * 9.7 1.64.6 4.5 7.2 2.6 7.2 2.6 6.6 2.13.8 3.3 4.7 1.0 4.9 1.1 4.7 1.53.9 3.5 4.9 1.0 5.2 1.3 4.5 1.02.7 2.5 4.1 1.4 4.3 1.6 4.2 1.72.8 2.6 3.8 1.2 3.8 1.0 3.8 1.23.8 3.8 3.9 0.1 3.6 -0.2 3.3 -0.54.4 4.4 4.7 0.3 4.3 -0.1 4.2 -0.25.1 5.0 4.9 -0.1 4.7 -0.4 3.7 -1.34.8 4.6 4.1 -0.7 4.1 -0.7 3.9 -0.73.6 3.5 4.2 0.6 4.4 0.8 4.6 1.13.0 2.9 3.4 0.4 3.5 0.5 3.1 0.12.8 2.7 2.8 0.1 3.3 0.6 2.8 0.12.7 2.7 2.8 0.1 3.0 0.3 3.0 0.32.9 2.9 3.2 0.4 3.4 0.6 3.1 0.32.6 2.6 2.9 0.3 2.8 0.2 2.9 0.31.9 1.8 2.9 1.0 2.9 1.0 2.7 0.81.9 1.8 2.3 0.5 2.4 0.5 2.1 0.32.8 2.8 2.5 -0.2 2.2 -0.6 2.2 -0.53.1 3.1 2.4 -0.6 2.5 -0.6 2.5 -0.62.2 2.0 2.8 0.6 2.5 0.3 2.6 0.41.9 1.8 2.1 0.2 2.0 0.1 2.0 0.1
2003–2004 2.5 2.4 2.2 -0.2 2.2 -0.2 2.1 -0.32004–2005 3.0 3.1 1.6 -1.4 1.9 -1.1 1.4 -1.6
2000–20012001–20022002–2003
1996–19971997–19981998–19991999–2000
1992–19931993–19941994–19951995–1996
1988–19891989–19901990–19911991–1992
1984–19851985–19861986–19871987–1988
1980–19811981–19821982–19831983–1984
1976–19771977–19781978–19791979–1980
Forecast Errora Forecast ErroraCPI-U CPI-W Forecast ErroraActual CBO Blue Chip b Administration

CBO’S ECONOMIC FORECASTING RECORD 19
Table 4.
Continued
By calendar year, in percent)
Sources: Congressional Budget Office; Office of Management and Budget; Aspen Publishers, Inc., Blue Chip Economic Indicators; Depart-ment of Labor, Bureau of Labor Statistics.
Notes: Values are for the average annual growth of the consumer price index (CPI) over the two-year period. Before 1978, the Bureau of Labor Statistics published only one consumer price index series, now known as the CPI-W (the price index for urban wage earners and clerical workers). In January 1978, the bureau began to publish a second, broader consumer price index series, the CPI-U (the price index for all urban consumers). For most years since 1979, CBO forecast the CPI-U; from 1986 through 1989, however, CBO forecast the CPI-W. The Administration forecast the CPI-W until 1992, when it switched to the CPI-U. The Blue Chip forecast the CPI-U for the entire period. The forecasts were issued in the first half of the initial year of the period or in December of the preceding year.
* = not applicable.
a. Errors (which are in percentage points) are forecast values minus actual values; thus, a positive error is an overestimate.
b. Two-year forecasts for the Blue Chip consensus were not available until 1982.
Mean error * * * 0 * * * -0.2Mean absolute error * * * 1.0 * * * 1.0Root mean square error * * * 1.5 * * * 1.5
Mean error * * * 0.4 * 0.4 * 0.2Mean absolute error * * * 0.7 * 0.7 * 0.7Root mean square error * * * 0.9 * 0.9 * 0.9
Actual CBO Blue Chip b AdministrationCPI-U CPI-W Forecast Errora Forecast Errora Forecast Errora
Statistics for 1976–2004
Statistics for 1982–2004

20 CBO’S ECONOMIC FORECASTING RECORD
Table 5.
CBO, Administration, and Blue Chip Forecasts of Two-Year Average Nominal Interest Rates on Three-Month Treasury Bills(By calendar year, in percent)
Continued
5.1 5.1 6.2 1.1 * * 5.5 0.46.2 6.2 6.4 0.2 * * 4.4 -1.88.6 8.6 6.0 -2.6 * * 6.1 -2.5
10.8 10.7 8.3 -2.4 * * 8.2 -2.612.8 12.7 9.5 -3.2 * * 9.7 -3.112.4 12.3 13.2 0.9 * * 10.0 -2.4
9.7 9.6 12.6 3.0 11.3 1.6 11.1 1.49.1 9.1 7.1 -2.0 7.9 -1.2 7.9 -1.18.5 8.5 8.7 0.3 9.1 0.5 8.1 -0.46.7 6.7 8.5 1.8 8.5 1.8 8.0 1.35.9 5.9 6.7 0.9 7.1 1.2 6.9 1.06.2 6.2 5.6 -0.6 5.7 -0.5 5.5 -0.77.4 7.4 6.4 -0.9 6.1 -1.2 5.2 -2.17.8 7.8 7.5 -0.3 7.5 -0.3 5.9 -1.96.5 6.4 7.0 0.6 7.1 0.7 6.0 -0.44.4 4.4 6.8 2.4 6.4 2.0 6.2 1.83.2 3.2 4.7 1.5 4.6 1.4 4.5 1.33.6 3.6 3.4 -0.2 3.8 0.2 3.4 -0.24.9 4.9 3.9 -1.0 3.6 -1.3 3.6 -1.35.3 5.2 5.9 0.7 6.1 0.9 5.7 0.45.0 5.0 4.8 -0.2 5.0 0.0 4.7 -0.34.9 4.9 5.0 0.1 5.1 0.2 4.8 -0.14.7 4.7 5.2 0.5 5.1 0.4 4.9 0.25.2 5.2 4.5 -0.7 4.3 -0.9 4.2 -1.04.6 4.6 5.5 0.9 5.6 1.0 5.2 0.62.5 2.5 4.8 2.4 5.4 2.9 5.8 3.41.3 1.3 3.3 2.0 2.7 1.4 2.8 1.5
2003–2004 1.2 1.2 2.4 1.3 2.2 1.1 2.4 1.32004–2005 2.3 2.3 2.1 -0.1 1.9 -0.3 1.8 -0.4
2000–20012001–20022002–2003
1996–19971997–19981998–19991999–2000
1992–19931993–19941994–19951995–1996
1988–19891989–19901990–19911991–1992
1984–19851985–19861986–19871987–1988
1980–19811981–19821982–19831983–1984
1976–19771977–19781978–19791979–1980
Blue Chip b AdministrationIssue Market Forecast Errora Forecast Errora Forecast Errora
ActualNew Secondary CBO

CBO’S ECONOMIC FORECASTING RECORD 21
Table 5.
Continued
(By calendar year, in percent)
Sources: Congressional Budget Office; Office of Management and Budget; Aspen Publishers, Inc., Blue Chip Economic Indicators; Federal Reserve Board.
Notes: Values are for the geometric averages of the three-month Treasury bill rates for the two-year period. The actual values are published by the Federal Reserve Board as the rate on new issues (reported on a bank-discount basis) and the secondary-market rate. CBO fore-cast the secondary-market rate; the Administration forecast the new-issue rate prior to 2001, but since then, the secondary-market rate. The Blue Chip alternated between the two rates, forecasting the new-issue rate from 1982 to 1985, the secondary-market rate from 1986 to 1991, the new-issue rate again from 1992 to 1997, and the secondary-market rate since then. The forecasts were issued in the first half of the initial year of the period or in December of the preceding year.
* = not applicable.
a. Errors (which are in percentage points) are forecast values minus actual values; thus, a positive error is an overestimate.
Mean error * * * 0.2 * * * -0.3Mean absolute error * * * 1.2 * * * 1.3Root mean square error * * * 1.5 * * * 1.6
Mean error * * * 0.5 * 0.5 * 0.2Mean absolute error * * * 1.1 * 1.0 * 1.1Root mean square error * * * 1.3 * 1.2 * 1.3
Statistics for 1976–2004
Statistics for 1982–2004
AdministrationIssue Market Forecast Errora Forecast Errora Forecast ErroraNew Secondary CBO Blue Chip b
Actual

22 CBO’S ECONOMIC FORECASTING RECORD
Table 6.
CBO, Administration, and Blue Chip Forecasts of Two-Year Averages for Nominal Long-Term Interest Rates(By calendar year, in percent)
Sources: Congressional Budget Office; Office of Management and Budget; Aspen Publishers, Inc., Blue Chip Economic Indicators; Federal Reserve Board.
Notes: Actual values are for the geometric averages of the 10-year Treasury note rates or Moody's corporate Aaa bond rates for the two-year period as reported by the Federal Reserve Board. CBO forecast the 10-year Treasury note rate in all years except 1984 and 1985, when it forecast the corporate Aaa bond rate. The Administration forecast the 10-year note rate, but the Blue Chip forecast the corporate Aaa bond rate through 1995 and then switched to the 10-year Treasury note rate. Data are only available beginning in 1984 because not all of the forecasters published long-term rate projections before then. The forecasts were issued in the first half of the initial year of the period or in December of the preceding year.
* = not applicable.
a. Errors (which are in percentage points) are forecast values minus actual values; thus, a positive error is an overestimate.
11.5 12.0 11.9 -0.1 12.2 0.2 9.7 -1.89.1 10.2 11.5 1.3 11.8 1.7 10.6 1.58.0 9.2 8.9 0.9 9.9 0.8 8.7 0.78.6 9.5 7.2 -1.4 8.7 -0.8 6.6 -2.08.7 9.5 9.4 0.7 9.8 0.3 7.7 -1.08.5 9.3 9.1 0.6 9.5 0.3 7.7 -0.88.2 9.0 7.7 -0.5 8.7 -0.3 7.2 -1.07.4 8.5 7.8 0.4 8.7 0.3 7.3 -0.16.4 7.7 7.1 0.7 8.4 0.7 6.9 0.56.5 7.6 6.6 0.2 8.2 0.6 6.6 0.26.8 7.8 5.9 -0.9 7.1 -0.7 5.8 -1.06.5 7.5 7.3 0.8 8.6 1.1 7.5 1.06.4 7.3 6.2 -0.2 6.2 -0.1 5.4 -0.95.8 6.9 6.2 0.4 6.4 0.6 6.0 0.25.5 6.8 6.0 0.6 5.9 0.5 5.8 0.45.8 7.3 5.2 -0.6 5.0 -0.8 4.9 -0.95.5 7.4 6.3 0.8 6.3 0.8 6.1 0.64.8 6.8 5.1 0.3 5.4 0.6 5.8 1.04.3 6.1 5.2 0.9 5.3 1.0 5.1 0.8
2003–2004 4.1 5.6 4.8 0.7 4.8 0.7 4.6 0.52004–2005 4.3 5.4 5.0 0.7 5.0 0.8 4.8 0.5
Mean error * * * 0.3 * 0.4 * -0.1Mean absolute error * * * 0.7 * 0.7 * 0.8Root mean square error * * * 0.7 * 0.7 * 0.9
Actual10-Year Corporate CBO Blue Chip Administration
Note Aaa Bond Forecast Errora Forecast Errora Forecast Errora
1984–19851985–19861986–19871987–19881988–19891989–19901990–19911991–19921992–19931993–19941994–19951995–19961996–19971997–19981998–19991999–20002000–20012001–20022002–2003
Statistics for 1984–2004


24 CBO’S ECONOMIC FORECASTING RECORD
Table 7.
CBO, Administration, and Blue Chip Forecasts of Two-Year Average Real Interest Rates on Three-Month Treasury Bills(By calendar year, in percent)
Continued
-0.9 -0.9 -0.9 -0.9 -0.8 0.1 * * -0.6 0.3-0.8 -0.7 -0.8 -0.7 1.5 2.2 * * -0.8 -0.1-0.7 -0.8 -0.7 -0.8 0.2 1.0 * * 0.1 0.9-1.4 -1.5 -1.4 -1.5 0.2 1.7 * * 0.7 2.20.8 0.9 0.7 0.8 -0.5 -1.2 * * -0.7 -1.63.8 4.0 3.7 3.9 2.6 -1.2 * * 0.3 -3.74.8 4.9 4.7 4.9 5.0 0.3 3.8 -1.0 4.2 -0.85.1 5.7 5.1 5.6 2.2 -2.9 2.9 -2.3 3.1 -2.64.4 4.9 4.4 4.8 3.6 -0.8 3.6 -0.8 3.4 -1.43.9 4.1 3.9 4.1 4.2 0.3 4.0 0.1 3.6 -0.43.1 3.2 3.0 3.2 2.8 -0.4 3.2 0.1 3.0 -0.32.3 2.4 2.3 2.3 1.7 -0.7 2.0 -0.3 2.1 -0.22.8 2.9 2.8 2.9 1.7 -1.2 1.8 -1.0 1.0 -1.92.6 2.6 2.6 2.6 2.5 -0.1 2.7 0.2 2.1 -0.61.6 1.7 1.5 1.7 2.8 1.2 2.9 1.3 2.0 0.30.8 0.9 0.7 0.9 2.5 1.8 1.9 1.2 1.5 0.60.2 0.4 0.2 0.3 1.3 1.1 1.1 0.8 1.3 1.10.8 0.9 0.8 0.9 0.5 -0.3 0.5 -0.4 0.6 -0.32.1 2.2 2.1 2.1 1.0 -1.1 0.5 -1.6 0.6 -1.52.3 2.3 2.3 2.3 2.6 0.3 2.6 0.3 2.5 0.12.3 2.4 2.3 2.4 1.8 -0.5 2.1 -0.3 1.7 -0.62.9 3.1 2.9 3.1 2.0 -0.9 2.1 -0.8 2.1 -0.92.8 2.9 2.8 2.9 2.8 0.0 2.6 -0.1 2.7 -0.12.4 2.3 2.4 2.3 1.9 -0.5 2.1 -0.3 2.0 -0.41.5 1.5 1.5 1.5 3.0 1.5 3.0 1.6 2.6 1.10.3 0.5 0.3 0.4 2.0 1.7 2.8 2.5 3.1 2.8
-0.6 -0.5 -0.6 -0.5 1.2 1.8 0.7 1.3 0.8 1.42003–2004 -1.3 -1.2 -1.3 -1.2 0.2 1.4 0.0 1.3 0.3 1.52004–2005 -0.7 -0.8 -0.7 -0.8 0.5 1.2 0.0 0.8 0.4 1.1
2001–20022002–2003
1997–19981998–19991999–20002000–2001
1993–19941994–19951995–19961996–1997
1989–19901990–19911991–19921992–1993
1985–19861986–19871987–19881988–1989
1981–19821982–19831983–19841984–1985
1977–19781978–19791979–19801980–1981
Errora Forecast Errora
1976–1977
CBO Blue Chip b AdministrationCPI-U CPI-W CPI-U CPI-W Forecast Errora Forecast
ActualNew SecondaryIssue Market

CBO’S ECONOMIC FORECASTING RECORD 25
Table 7.
Continued
(By calendar year, in percent)
Sources: Congressional Budget Office; Office of Management and Budget; Aspen Publishers, Inc., Blue Chip Economic Indicators; Depart-ment of Labor, Bureau of Labor Statistics; Federal Reserve Board.
Notes: Values are for the appropriate three-month Treasury bill rate discounted by the respective forecast for inflation as measured by the change in the consumer price index. CBO forecast the secondary-market rate; the Administration forecast the new-issue rate prior to 2001, but since then, the secondary-market rate. The Blue Chip alternated between the two rates, forecasting the new-issue rate from 1982 to 1985, the secondary-market rate from 1986 to 1991, the new-issue rate again from 1992 to 1997, and the secondary-market rate since then. Moreover, for most years since 1979, CBO forecast the CPI-U (the consumer price index for all urban consumers); from 1986 through 1989, however, CBO forecast the CPI-W (the consumer price index for urban wage earners and clerical workers). The Administration forecast the CPI-W until 1992, when it switched to the CPI-U. The Blue Chip forecast the CPI-U for the entire period. All forecasts were issued in the first half of the initial year of the period or in December of the preceding year.
* = not applicable.
a. Errors (which are in percentage points) are forecast values minus actual values; thus, a positive error is an overestimate.
b. Two-year forecasts for the Blue Chip consensus were not available until 1982.
Mean error * * * * * 0.2 * * * -0.1Mean absolute error * * * * * 1.0 * * * 1.1Root mean square error * * * * * 1.2 * * * 1.4
Mean error * * * * * 0.2 * 0.1 * -0.1Mean absolute error * * * * * 1.0 * 0.9 * 1.0Root mean square error * * * * * 1.2 * 1.1 * 1.2
Errora
Statistics for 1976–2004
Statistics for 1982–2004
AdministrationCPI-U CPI-W CPI-U CPI-W Forecast Errora Forecast Errora Forecast
Issue Market CBO Blue Chip b
ActualNew Secondary

26 CBO’S ECONOMIC FORECASTING RECORD
Table 8.
CBO, Administration, and Blue Chip Forecasts of the Difference BetweenTwo-Year Average Inflation in the CPI and in the GNP or GDP Price Index(By calendar year, in percentage points)
Continued
0.0 0.0 0.6 0.5 * * 0.2 0.10.4 0.3 -0.1 -0.5 * * -0.5 -0.81.8 1.8 -0.1 -1.9 * * -0.1 -1.93.7 3.8 0.1 -3.6 * * 0.2 -3.62.7 2.6 1.0 -1.7 * * 1.6 -1.10.5 0.4 0.7 0.1 * * 0.6 0.3
-0.4 -0.5 -0.2 0.2 -0.1 0.3 -0.3 0.2-0.1 -0.6 0.1 0.2 -0.4 -0.3 -0.5 0.20.5 0.1 0.1 -0.5 0.1 -0.4 -0.2 -0.30.1 -0.1 0.0 -0.1 0.2 0.1 0.1 0.20.3 0.1 -0.1 -0.2 0.2 -0.1 0.0 -0.10.8 0.7 0.4 -0.3 0.2 -0.6 -0.1 -0.80.8 0.8 1.0 0.2 0.4 -0.4 0.5 -0.21.3 1.2 0.7 -0.5 0.4 -0.9 0.0 -1.21.1 1.0 0.2 -1.0 0.2 -1.0 -0.2 -1.20.7 0.6 0.2 -0.5 0.4 -0.3 0.4 -0.10.7 0.6 0.4 -0.3 0.4 -0.3 0.0 -0.70.6 0.5 0.5 -0.1 0.4 -0.1 0.5 -0.10.6 0.6 0.2 -0.5 0.3 -0.3 0.3 -0.30.9 0.9 0.5 -0.4 0.4 -0.5 0.3 -0.60.9 0.8 0.3 -0.6 0.5 -0.4 0.1 -0.70.6 0.4 0.5 0.0 0.6 0.0 0.1 -0.40.6 0.5 0.3 -0.3 0.3 -0.3 0.2 -0.41.0 1.0 0.6 -0.3 0.5 -0.5 0.4 -0.50.8 0.8 0.8 0.0 0.8 0.0 0.7 -0.10.1 0.0 0.6 0.5 0.5 0.4 0.6 0.40.0 -0.1 0.4 0.4 0.3 0.3 0.1 0.1
2003–2004 0.0 -0.1 0.6 0.6 0.5 0.5 0.7 0.82004–2005 0.1 0.1 0.6 0.5 0.4 0.3 0.2 0.1
Actual CBO Blue Chip b AdministrationCPI-U CPI-W Forecast Errora Forecast Errora Forecast Errora
1976–19771977–19781978–19791979–19801980–19811981–19821982–19831983–19841984–19851985–19861986–19871987–19881988–19891989–19901990–19911991–19921992–19931993–19941994–19951995–19961996–19971997–19981998–19991999–20002000–20012001–20022002–2003
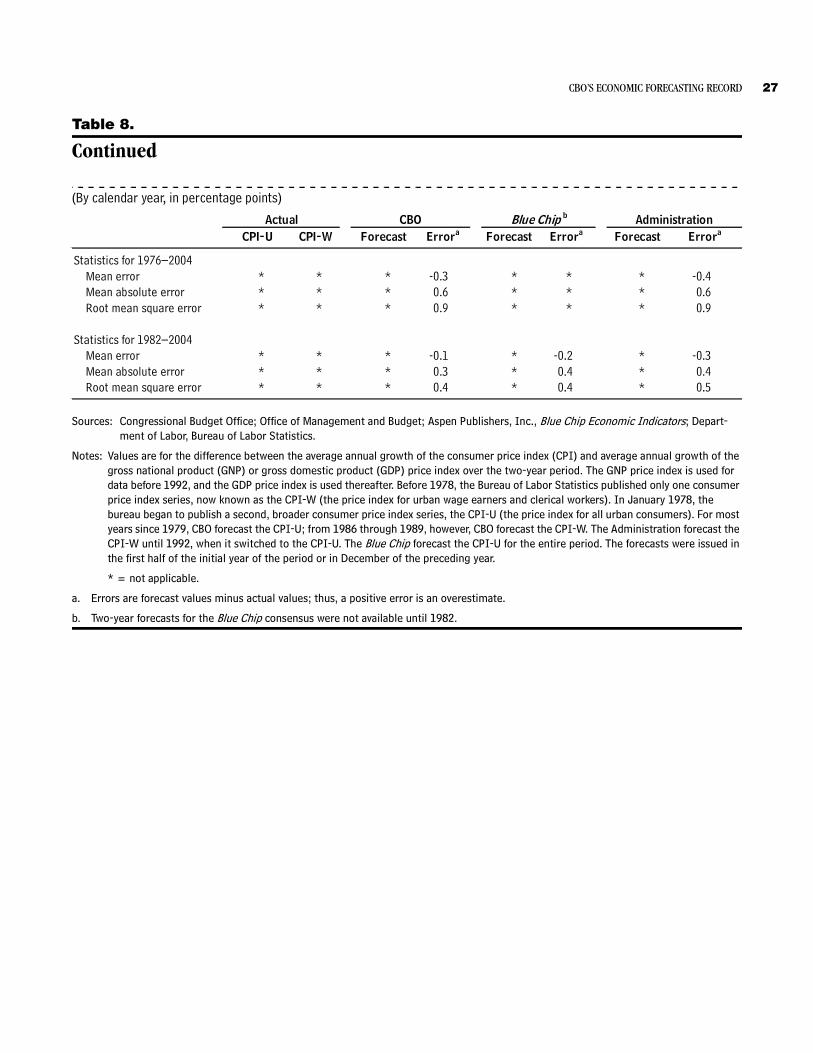
CBO’S ECONOMIC FORECASTING RECORD 27
Table 8.
Continued
(By calendar year, in percentage points)
Sources: Congressional Budget Office; Office of Management and Budget; Aspen Publishers, Inc., Blue Chip Economic Indicators; Depart-ment of Labor, Bureau of Labor Statistics.
Notes: Values are for the difference between the average annual growth of the consumer price index (CPI) and average annual growth of the gross national product (GNP) or gross domestic product (GDP) price index over the two-year period. The GNP price index is used for data before 1992, and the GDP price index is used thereafter. Before 1978, the Bureau of Labor Statistics published only one consumer price index series, now known as the CPI-W (the price index for urban wage earners and clerical workers). In January 1978, the bureau began to publish a second, broader consumer price index series, the CPI-U (the price index for all urban consumers). For most years since 1979, CBO forecast the CPI-U; from 1986 through 1989, however, CBO forecast the CPI-W. The Administration forecast the CPI-W until 1992, when it switched to the CPI-U. The Blue Chip forecast the CPI-U for the entire period. The forecasts were issued in the first half of the initial year of the period or in December of the preceding year.
* = not applicable.
a. Errors are forecast values minus actual values; thus, a positive error is an overestimate.
b. Two-year forecasts for the Blue Chip consensus were not available until 1982.
Mean error * * * -0.3 * * * -0.4Mean absolute error * * * 0.6 * * * 0.6Root mean square error * * * 0.9 * * * 0.9
Mean error * * * -0.1 * -0.2 * -0.3Mean absolute error * * * 0.3 * 0.4 * 0.4Root mean square error * * * 0.4 * 0.4 * 0.5
Actual CBO Blue Chip b AdministrationCPI-U CPI-W Forecast Errora Forecast Errora Forecast Errora
Statistics for 1976–2004
Statistics for 1982–2004

28 CBO’S ECONOMIC FORECASTING RECORD
Table 9.
CBO and Administration Forecasts of the Two-Year Change in Wage and Salary Disbursements Plus Corporate Book Profits as a Share of Output(By calendar year, in percent of GNP or GDP)
Sources: Congressional Budget Office; Office of Management and Budget; Department of Commerce, Bureau of Economic Analysis.
Notes: The forecasts were issued in the first half of the initial year of the period or in December of the preceding year. For the forecasts made between 1980 and 1991, gross national product was used to calculate the shares; for the forecasts made in 1992 and later, gross domestic product was used. The Blue Chip does not forecast wages and salaries.
* = not applicable.
a. Errors (which are in percentage points) are forecast values minus actual values; thus, a positive error is an overestimate.
-3.2 -0.6 2.5 -1.3 1.8-3.3 -2.6 0.7 -1.2 2.1-2.0 -1.8 0.3 -1.7 0.3-1.0 0.0 0.9 -1.0 -0.1-0.6 -0.2 0.4 -0.2 0.5-0.8 -0.6 0.2 -0.8 0.01.4 1.0 -0.3 0.8 -0.52.7 0.9 -1.8 1.4 -1.3
-0.3 0.6 0.9 0.4 0.7-1.2 0.4 1.6 0.7 1.9-0.2 0.7 0.9 1.4 1.6-0.1 0.1 0.2 -0.1 0.1-0.1 1.0 1.1 1.4 1.4-0.4 0.5 1.0 0.5 1.01.3 0.2 -1.1 0.4 -0.91.8 -0.3 -2.1 -0.6 -2.51.0 -0.4 -1.4 0.8 -0.20.4 -0.5 -0.9 0.0 -0.40.3 -0.2 -0.4 0.2 -0.11.0 -0.1 -1.2 0.0 -1.1
-0.8 -0.5 0.2 -0.8 0.0-2.2 -0.4 1.7 -0.8 1.4-0.9 0.1 1.0 0.6 1.4
2003–2004 0.9 1.1 0.2 1.6 0.72004–2005 2.7 2.8 0.1 3.0 0.3
Mean error * * 0.2 * 0.3Mean absolute error * * 0.9 * 0.9Root mean square error * * 1.1 * 1.1
Statistics for 1980–2004
2000–20012001–20022002–2003
1996–19971997–19981998–19991999–2000
1992–19931993–19941994–19951995–1996
1988–19891989–19901990–19911991–1992
1984–19851985–19861986–19871987–1988
1980–19811981–19821982–19831983–1984
CBO AdministrationActual Forecast Errora Forecast Errora


30 CBO’S ECONOMIC FORECASTING RECORD
Table 10.
CBO, Administration, and Blue Chip Projections of Five-Year Average Growth Rates for Real Output(By calendar year, in percent)
Continued
1976–1980 4.2 3.4 3.3 3.8 5.7 1.9 * * 6.2 2.41977–1981 3.1 2.8 2.6 3.1 5.3 2.2 * * 5.1 2.01978–1982 1.6 1.4 1.2 1.8 4.8 3.0 * * 4.8 3.01979–1983 1.3 1.0 1.1 1.6 3.8 2.2 3.1 1.5 3.8 2.21980–1984 2.1 1.9 1.7 2.3 2.4 0.1 2.5 0.2 3.0 0.71981–1985 * 2.6 2.4 3.1 2.8 -0.3 3.0 -0.1 3.8 0.71982–1986 * 2.7 2.6 3.3 3.0 -0.3 2.7 -0.5 3.9 0.61983–1987 * 4.0 3.7 4.4 3.6 -0.8 3.5 -0.9 3.5 -0.91984–1988 * 4.1 3.7 4.3 4.0 -0.3 3.5 -0.8 4.3 0.01985–1989 * 3.3 3.1 3.6 3.4 -0.3 3.4 -0.3 4.0 0.31986–1990 * 2.8 2.7 3.3 3.3 0.1 3.1 -0.1 3.8 0.51987–1991 * * 2.0 2.6 2.9 0.4 2.7 0.1 3.5 0.91988–1992 * * 1.9 2.5 2.6 0.0 2.5 0.0 3.2 0.71989–1993 * * 1.7 2.2 2.3 0.1 2.6 0.3 3.2 1.01990–1994 * * 1.9 2.3 2.3 0.0 2.4 0.1 3.0 0.71991–1995 * * * 2.4 2.3 -0.1 2.0 -0.4 2.5 0.1
1992–1996 * * * 3.2 2.6 -0.6 2.5 -0.8 2.7 -0.61993–1997 * * * 3.5 2.8 -0.7 2.8 -0.7 2.8 -0.71994–1998 * * * 3.8 2.7 -1.1 2.8 -1.0 2.8 -1.01995–1999 * * * 3.9 2.4 -1.5 2.5 -1.3 2.6 -1.31996–2000 * * * 4.1 2.0 -2.1 2.1 -2.0 2.3 -1.81997–2001 * * * 3.5 2.1 -1.4 2.3 -1.2 2.2 -1.31998–2002 * * * 2.9 2.1 -0.8 2.3 -0.6 2.2 -0.71999–2003 * * * 2.6 2.2 -0.4 2.6 0.0 2.2 -0.42000–2004 * * * 2.5 2.9 0.4 3.2 0.7 2.8 0.32001–2005 * * * 2.4 3.0 0.6 3.1 0.7 3.2 0.8
ActualChain-TypeAnnual-
1972 1982 1987 Weighted CBO Blue Chip e AdministrationDollarsa Dollarsb Dollarsc Index Forecast Errord Forecast Errord Forecast Errord
Real GNP
Real GDPf

CBO’S ECONOMIC FORECASTING RECORD 31
Table 10.
Continued
(By calendar year, in percent)
Sources: Congressional Budget Office; Office of Management and Budget; Aspen Publishers, Inc., Blue Chip Economic Indicators; Depart-ment of Commerce, Bureau of Economic Analysis.
Notes: Actual values are for the five-year growth rates for real gross national product (GNP) and gross domestic product (GDP) last reported by the Bureau of Economic Analysis, not the first reported values. Projected values are for the average growth of real GNP or GDP over the five-year period. The majority of the projections were issued in the first quarter of the initial year of the period or in December of the preceding year.
* = not applicable.
a. Data for 1972-dollar GNP and GDP are available only through the third quarter of 1985.
b. Data for 1982-dollar GNP and GDP are available only through the third quarter of 1991.
c. Data for 1987-dollar GNP and GDP are available only through the second and third quarters, respectively, of 1995.
d. Errors (which are in percentage points) are projected values minus actual values; thus, a positive error is an overestimate. The chain-type annual-weighted index of actual GNP or GDP was used to calculate the errors.
e. Five-year projections for the Blue Chip consensus were not available until 1979.
f. With the 1992 benchmark revision by the Bureau of Economic Analysis, GDP replaced GNP as the central measure of national output.
Mean error * * * * * 0.0 * * * 0.3Mean absolute error * * * * * 0.8 * * * 1.0Root mean square error * * * * * 1.2 * * * 1.2
Mean error * * * * * -0.3 * -0.3 * 0.0Mean absolute error * * * * * 0.6 * 0.6 * 0.8Root mean square error * * * * * 0.9 * 0.8 * 0.9
ActualChain-TypeAnnual-
1972 1982 1987 Weighted CBO Blue Chip e AdministrationDollarsa Dollarsb Dollarsc Index Forecast Errord Forecast
Statistics for 1979–2001
Errord Forecast Errord
Statistics for 1976–2001

32 CBO’S ECONOMIC FORECASTING RECORD
Table 11.
CBO, Administration, and Blue Chip Projections of Five-Year Average Growth Rates for Nominal Output(By calendar year, in percent)
Continued
1976–1980 11.3 12.3 1.0 * * 12.0 0.61977–1981 11.4 10.6 -0.8 * * 10.5 -0.91978–1982 9.9 10.7 0.8 * * 10.6 0.71979–1983 9.1 11.3 2.2 * * 9.6 0.61980–1984 8.9 11.3 2.5 * * 11.3 2.51981–1985 8.5 11.8 3.3 * * 11.3 2.81982–1986 7.2 9.8 2.6 9.7 2.4 9.7 2.51983–1987 7.6 8.2 0.6 9.0 1.4 8.5 0.91984–1988 7.5 9.0 1.5 9.1 1.6 8.9 1.41985–1989 6.8 7.7 0.9 7.8 1.0 8.1 1.31986–1990 6.6 7.5 0.9 7.0 0.4 7.4 0.81987–1991 6.1 6.9 0.8 6.6 0.5 6.9 0.81988–1992 6.0 6.6 0.6 6.6 0.6 6.7 0.71989–1993 5.5 6.6 1.1 6.9 1.5 6.5 1.01990–1994 5.2 6.3 1.2 6.4 1.2 6.9 1.71991–1995 5.0 6.1 1.2 5.9 1.0 6.4 1.4
1992–1996 5.4 5.8 0.4 5.9 0.4 6.0 0.51993–1997 5.6 5.1 -0.4 6.0 0.5 5.1 -0.41994–1998 5.6 5.4 -0.2 5.8 0.1 5.7 0.11995–1999 5.6 5.2 -0.4 5.6 0.0 5.5 0.01996–2000 5.8 4.8 -1.0 4.5 -1.3 5.1 -0.71997–2001 5.3 4.7 -0.6 4.9 -0.4 4.9 -0.41998–2002 4.7 4.4 -0.3 4.7 0.0 4.3 -0.41999–2003 4.6 4.3 -0.3 4.5 -0.2 4.2 -0.42000–2004 4.8 4.6 -0.2 5.2 0.4 4.8 0.02001–2005 4.9 5.1 0.3 5.3 0.4 5.4 0.5
CBO Blue Chip b AdministrationActual Forecast Errora Forecast Errora Forecast Errora
GNP
GDPc

CBO’S ECONOMIC FORECASTING RECORD 33
Table 11.
Continued
(By calendar year, in percent)
Sources: Congressional Budget Office; Office of Management and Budget; Aspen Publishers, Inc., Blue Chip Economic Indicators; Depart-ment of Commerce, Bureau of Economic Analysis.
Notes: Actual values are for the five-year growth rates for gross national product (GNP) and gross domestic product (GDP) last reported by the Bureau of Economic Analysis, not the first reported values. Projected values are for the average annual growth of nominal GNP or GDP over the five-year period. The projections were issued in the first half of the initial year of the period or in December of the pre-ceding year.
* = not applicable.
a. Errors (which are in percentage points) are projected values minus actual values; thus, a positive error is an overestimate.
b. Five-year projections for the Blue Chip consensus were not available until 1982.
c. With the 1992 benchmark revision by the Bureau of Economic Analysis, GDP replaced GNP as the central measure of national output.
Mean error * * 0.7 * * * 0.7Mean absolute error * * 1.0 * * * 0.9Root mean square error * * 1.2 * * * 1.2
Mean error * * 0.4 * 0.6 * 0.6Mean absolute error * * 0.8 * 0.8 * 0.8Root mean square error * * 0.9 * 1.0 * 1.0
ErroraCBO Blue Chip b
Statistics for 1976–2001
Statistics for 1982–2001
AdministrationActual Forecast Errora Forecast Errora Forecast

34 CBO’S ECONOMIC FORECASTING RECORD
Table 12.
Comparison of CBO, Administration, and Blue Chip Projections of theDifference Between Five-Year Average Inflation in the CPI and in the GNP or GDP Price Index(By calendar year, errors in percentage points)
Continued
1.6 1.6 0.2 -1.4 * * 0.0 -1.61.8 1.8 0.0 -1.8 * * -0.3 -2.11.8 1.7 0.0 -1.7 * * -0.1 -1.81.5 1.4 0.0 -1.5 * * 0.1 -1.41.0 0.7 0.4 -0.6 * * 0.6 -0.10.3 0.0 0.4 0.2 * * -0.1 -0.10.0 -0.3 0.1 0.1 * * -0.2 0.10.2 -0.1 0.0 -0.2 -0.1 -0.3 -0.2 -0.10.5 0.2 0.0 -0.5 0.1 -0.4 -0.1 -0.30.5 0.5 0.0 -0.6 0.1 -0.5 0.1 -0.40.8 0.6 0.1 -0.5 -0.1 -0.8 0.0 -0.71.0 0.9 0.3 -0.6 0.2 -0.8 -0.1 -0.90.9 0.8 0.6 -0.2 0.3 -0.6 0.2 -0.60.9 0.8 0.5 -0.3 0.2 -0.7 0.0 -0.80.8 0.7 0.3 -0.5 0.2 -0.6 -0.1 -0.80.7 0.6 0.1 -0.5 0.4 -0.2 0.2 -0.40.7 0.7 0.4 -0.3 0.4 -0.4 0.0 -0.80.7 0.7 0.5 -0.3 0.4 -0.3 0.5 -0.30.7 0.6 0.4 -0.3 0.3 -0.3 0.4 -0.30.7 0.7 0.6 -0.2 0.4 -0.3 0.2 -0.50.8 0.8 0.2 -0.6 0.4 -0.4 0.1 -0.70.7 0.6 0.4 -0.3 0.5 -0.2 0.1 -0.60.5 0.4 0.3 -0.2 0.2 -0.3 0.1 -0.40.5 0.4 0.6 0.1 0.4 0.0 0.3 -0.2
2000–2004 0.3 0.2 0.8 0.6 0.6 0.3 0.6 0.32001–2005 0.1 0.1 0.6 0.5 0.5 0.4 0.6 0.5
Actual CBO Blue Chip b AdministrationCPI-U CPI-W Forecast Errora Forecast Errora Forecast Errora
1976–19801977–19811978–19821979–19831980–19841981–19851982–19861983–19871984–19881985–19891986–19901987–19911988–19921989–19931990–19941991–19951992–19961993–19971994–19981995–19991996–20001997–20011998–20021999–2003

CBO’S ECONOMIC FORECASTING RECORD 35
Table 12.
Continued
(By calendar year, errors in percentage points)
Sources: Congressional Budget Office; Office of Management and Budget; Aspen Publishers, Inc., Blue Chip Economic Indicators; Depart-ment of Labor, Bureau of Labor Statistics.
Notes: Values are for the difference between the average annual growth of the consumer price index (CPI) and average annual growth of the GNP or GDP price index over the five-year period. The GNP price index is used for data before 1992, and the GDP price index is used thereafter. Before 1978, the Bureau of Labor Statistics published only one consumer price index series, now known as the CPI-W (the price index for urban wage earners and clerical workers). In January 1978, the bureau began to publish a second, broader consumer price index series, the CPI-U (the price index for all urban consumers). For most years since 1979, CBO forecast the CPI-U; from 1986 through 1989, however, CBO forecast the CPI-W. The Administration forecast the CPI-W until 1992, when it switched to the CPI-U. The Blue Chip forecast the CPI-U for the entire period. The forecasts were issued in the first half of the initial year of the period or in December of the preceding year.
* = not applicable.
a. Errors (which are in percentage points) are projected values minus actual values; thus, a positive error is an overestimate.
a. Five-year projections for the Blue Chip consensus were not available until 1983.
Mean error * * * -0.4 * * * -0.6Mean absolute error * * * 0.6 * * * 0.6Root mean square error * * * 0.7 * * * 0.8
Mean error * * * -0.3 * -0.3 * -0.4Mean absolute error * * * 0.4 * 0.4 * 0.5Root mean square error * * * 0.4 * 0.5 * 0.6
AdministrationErrora
Actual CBO Blue Chip b
Statistics for 1976–2001
Statistics for 1983–2001
Forecast Errora Forecast ErroraCPI-U CPI-W Forecast

36 CBO’S ECONOMIC FORECASTING RECORD
Table 13.
CBO and Administration Projections of the Five-Year Change in Wage and Salary Disbursements Plus Corporate Profits as a Share of Output(By calendar year, in percent of GNP or GDP)
Sources: Congressional Budget Office; Office of Management and Budget; Aspen Publishers, Inc., Blue Chip Economic Indicators; Depart-ment of Commerce, Bureau of Economic Analysis.
Notes: The forecasts were issued in the first half of the initial year of the period or in December of the preceding year. For the forecasts made between 1980 and 1991, gross national product was used to calculate the shares; for the forecasts made in 1992 and later, gross domestic product was used. The Blue Chip does not forecast wages and salaries.
* = not applicable.
a. Errors (which are in percentage points) are projected values minus actual values; thus, a positive error is an overestimate.
-5.4 1.0 6.4 -1.1 4.3-4.7 -2.6 2.2 -1.9 2.8-3.0 -0.4 2.6 -3.3 -0.30.0 -0.6 -0.5 -0.3 -0.21.7 0.0 -1.7 0.3 -1.40.6 -1.1 -1.6 -0.1 -0.71.1 0.8 -0.3 0.6 -0.51.2 2.3 1.1 1.7 0.6
-0.4 0.7 1.1 1.1 1.5-1.6 0.2 1.7 1.5 3.1-0.4 0.5 0.9 1.9 2.30.9 -0.3 -1.2 0.8 -0.11.5 1.2 -0.4 1.6 0.02.0 0.7 -1.3 0.7 -1.32.0 -0.4 -2.3 0.1 -1.82.7 -0.9 -3.6 -1.0 -3.71.7 -1.6 -3.3 1.0 -0.70.1 -1.6 -1.7 -0.2 -0.3
-1.4 -0.9 0.5 -0.2 1.2-1.1 -0.3 0.8 -0.5 0.6-0.8 -1.2 -0.5 -1.9 -1.20.6 -0.8 -1.4 -1.1 -1.7
Mean error * * -0.1 * 0.1Mean absolute error * * 1.7 * 1.4Root mean square error * * 2.2 * 1.8
2000–20042001–2005
Statistics for 1980–2001
1996–20001997–20011998–20021999–2003
1992–19961993–19971994–19981995–1999
1988–19921989–19931990–19941991–1995
1984–19881985–19891986–19901987–1991
1980–19841981–19851982–19861983–1987
CBO AdministrationActual Forecast Errora Forecast Errora

Appendix: Sources of Historical and Forecast Data
Evaluating the Congressional Budget Office’s (CBO’s) forecasting record entails compiling the basic historical and forecast data for growth in real (inflation-adjusted) and nominal output, inflation in the consumer price index (CPI), interest rates, and taxable income.
Selection of Historical DataWhich historical data to use for the evaluation was defined by the availability of actual data and the nature of the forecast variables examined. Although CBO, the Administration, and the Blue Chip consensus all published the same measure for real output growth, selecting a historical series was difficult because of
periodic benchmark revisions to the actual data.1 By comparison, not all of the forecasters published the same measures for CPI inflation and interest rates, but the selection of historical data for those series was clear-cut.
Growth in Real and Nominal Output Historical two-year averages of growth in real output were developed from calendar year averages of the quarterly chain-type annual weighted indexes of real gross national product (GNP) and real gross domestic product (GDP) published by the Bureau of Economic Analysis (BEA). The fact that several real GNP and GDP series were discontinued because of periodic benchmark revisions meant that they were unsuitable historical series. For example, during the 1976-1985 period, the three forecasters published estimates for a measure of growth in real GNP that was based on 1972 prices, which was the
1. Before 1992, CBO, the Administration, and the Blue Chip con-sensus survey used gross national product to measure output. Beginning in early 1992, however, all three forecasters began to publish forecasts and projections of gross domestic product instead.
measure published by BEA at that time; however, in late 1985, BEA discontinued the 1972-dollar series and began to publish estimates of GNP on a 1982-dollar basis. As a result, an official series of values for GNP growth in 1972 dollars is not available for the years after 1984, and actual two-year average growth rates are not
available to compare with the forecasts made in early 1984 and 1985.
From 1986 to 1991, the three forecasters published estimates of growth in real GNP based on 1982 prices. BEA revised the benchmark again in the second half of 1991: it discontinued the 1982-dollar GNP and began to use a 1987-dollar basis. Consequently, the historical annual series for 1982-dollar GNP is available only through 1990, and actual two-year average growth rates are not available for the forecasts made in early 1990 and 1991. The forecasters then published estimates of growth
in real GDP on a 1987-dollar basis until 1995, when BEA made another switch, late in the year, to a chain-weighted measure of GDP. Therefore, the historical annual series for 1987-dollar GDP ends with the 1994 annual value, and actual two-year average growth rates are not available for the forecasts made in early 1994 and 1995.
By periodically updating the series to reflect more recent prices, BEA’s benchmark revisions yield a measure of real output that is more relevant for analyzing contemporary movements in real growth. But the process makes it difficult to evaluate forecasts of real growth produced
over a period of years in series that are later discontinued. This comparison avoids the difficulties presented by periodic revisions of the data by using BEA’s chain-type

38 CBO’S ECONOMIC FORECASTING RECORD
annual-weighted index of real GNP or GDP throughout
the data series.2
Historical two-year averages for growth of nominal GNP and GDP were developed from calendar year averages of the quarterly values published by BEA.
CPI Inflation CBO calculated two-year averages of inflation in the consumer price index from calendar year averages of monthly data published by the Bureau of Labor Statistics. Before 1978, the bureau published only one consumer price index series, now known as the CPI-W (the price index for urban wage earners and clerical workers). In January 1978, however, the bureau began to publish a second, broader consumer price index series, the CPI-U (the price index for all urban consumers). CBO’s comparison of forecasts uses both series.
Until 1992, the Administration published its forecasts for the CPI-W, the measure used to index most of the federal government’s spending for entitlement programs. In contrast, for all but four of its forecasts since 1979 (1986 through 1989), CBO based its inflation forecast on the CPI-U, a more widely cited measure of inflation and the one now used to index federal income tax brackets. The Blue Chip consensus has always published its forecast for the CPI-U. Although annual fluctuations in the CPI-U and CPI-W are virtually indistinguishable, the indexes differ in some years. For that reason, CBO used historical data for both series to evaluate the alternative forecasting records.
Interest RatesCBO used monthly data published by the Board of Governors of the Federal Reserve System to calculate two-year averages of nominal short- and long-term interest rates.
The forecasts of short-term interest rates were compared using historical values for two measures of the interest rate on three-month Treasury bills: the new-issue rate
2. For a discussion of that index, see Congressional Budget Office, The Economic and Budget Outlook: An Update (August 1995), pp. 71-73.
and the secondary-market rate. Prior to 2001, the Administration forecast the new-issue rate, which corresponds to the price of three-month bills auctioned by the Department of the Treasury—that is, it reflects the interest actually paid on that debt. Since mid-2001, the Administration has forecast the secondary-market rate, which corresponds to the price of the three-month bills traded outside the Treasury auctions. Such transactions occur continually in markets that involve many more traders than do Treasury auctions. Thus, the secondary-market rate provides an updated evaluation of short-term federal debt by the wider financial community.
CBO forecasts the secondary-market rate and, unlike the Administration, has never forecast the new-issue rate. The Blue Chip has alternated between those two rates; it published the new-issue rate from 1982 to 1985, switched to the secondary-market rate during the 1986-1991 period, and then returned to the new-issue rate between 1992 and 1997. Since March 1997, the Blue Chip has once again forecast the secondary-market rate. Clearly, there is no reason to expect the two rates to differ persistently; indeed, the differences between their calendar year averages are minuscule.
CBO likewise compared the various forecasts of long-term interest rates using historical values for two measures of long-term rates: the 10-year Treasury note rate and Moody’s Aaa corporate bond rate. A comparison of forecasts is not possible before 1984 because not all of the forecasters published projections of long-term interest rates before then. For forecasts made in early 1984 and 1985, CBO projected the Aaa corporate bond rate. Beginning with its early 1986 forecast, however, CBO switched to the 10-year Treasury note rate. The Administration has always published its projection for the 10-year Treasury note rate, but the Blue Chip published the Aaa corporate bond rate until January 1996, when it switched to the 10-year Treasury rate.
CBO calculated separate historical values for real short-term interest rates using the nominal short-term interest rate and the inflation rate appropriate for each forecaster. In each case, the two-year average nominal short-term

APPENDIX: SOURCES OF HISTORICAL AND FORECAST DATA 39
interest rate was discounted by the two-year average rate of inflation. The resulting real short-term interest rates were similar.
Taxable IncomeThrough its direct influence on projections of federal revenues, the forecast for taxable income plays a critical role in determining the accuracy of budget projections. The income measure examined here—wage and salary disbursements—focuses on the source of income to which tax receipts are most sensitive. In addition, because a proportion of other types of income is not taxed (if, for instance, the income derives from assets held in nontaxable accounts), the effective tax rate on wages and salaries exceeds the corresponding rate on other income.
Historical estimates of taxable income are subject to substantial statistical revisions that do not, however, have much of an implication for projections of revenues as long as the revisions are carried forward into the forecast. For that reason, the accuracy of taxable income projections is measured using the forecast change in the share of taxable income in GDP.
Sources of Forecast DataFor every measure except taxable income, this evaluation used the calendar year forecasts and projections that CBO has published early each year since 1976, coinciding with the publication of the Administration’s annual budget proposals. The Administration’s forecasts were taken from its budget in all but one case: the forecast made in early 1981 came from the Reagan Administration’s revisions of President Carter’s last budget. The corresponding CBO forecast was taken from
CBO’s published analysis of President Reagan’s budget proposals. That CBO baseline forecast did not include the economic effects of the new Administration’s fiscal policy proposals but did assume the continuation of the tax and spending policies of the Second Concurrent Resolution on the Budget for Fiscal Year 1981, including a 10 percent personal income tax cut and accelerated
depreciation.3
The average two-year forecasts in the Blue Chip consensus survey, which are published monthly, were taken from those published in the same month as CBO’s forecasts. Because the Blue Chip consensus did not begin publishing its two-year forecasts until the middle of 1981, the first such forecast available for this comparison was published in early 1982. Average five-year projections, however, are published by Blue Chip only twice a year, and those publication dates do not correspond to the times that forecasts are necessary for budgeting. All but one of its five-year projections used in this evaluation were published in March; the 1980-1984 projection of real output was published in May. Therefore, the Blue Chip medium-term forecasts were prepared about three months after CBO made its medium-term projections.
Because CBO has published forecasts for wages and salaries regularly only since 1985, some of the CBO forecasts for wages and salaries that are used here were taken from CBO’s files of unpublished forecasts.
3. Another exceptional case occurred in early 1993, when the Clin-ton Administration adopted CBO’s economic assumptions as the basis for its budget. As a result, the errors for the early 1993 fore-cast are the same for CBO and the Administration.
