cc assessment -gross 07
TRANSCRIPT
8/8/2019 CC Assessment -Gross 07
http://slidepdf.com/reader/full/cc-assessment-gross-07 1/29
Mike Gross
Technical Leader CC
April 2007
Combined CycleAssessment
GEEnergy
2007 EuropeCombined Cycle
Performance Seminar
8/8/2019 CC Assessment -Gross 07
http://slidepdf.com/reader/full/cc-assessment-gross-07 2/29
2
2 /
GE Energy ± Proprietary TrainingInformation
Europe CC Performance Seminar ± April2007
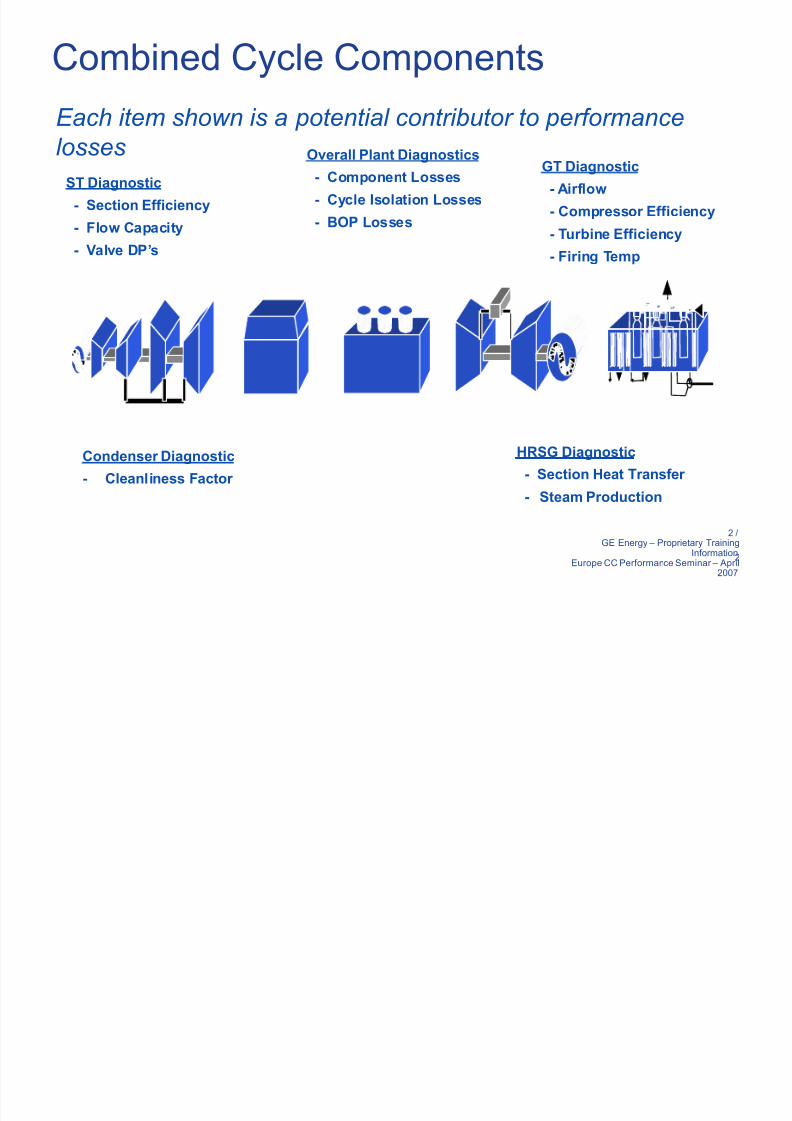
HRSG Diagnostic
- Section Heat Transfer
- Steam Production
Condenser Diagnostic
- Cleanliness Factor
ST Diagnostic
- Section Efficiency
- Flow Capacity
- Valve DP¶s
HPLPIP
GT Diagnostic
- Airflow
- Compressor Efficiency
- Turbine Efficiency
- Firing Temp
Overall Plant Diagnostics
- Component Losses
- Cycle Isolation Losses
- BOP Losses
Combined Cycle Components
Each item shown is a potential contributor to performance
losses
8/8/2019 CC Assessment -Gross 07
http://slidepdf.com/reader/full/cc-assessment-gross-07 3/29
3
3 /
GE Energy ± Proprietary TrainingInformation
Europe CC Performance Seminar ± April2007
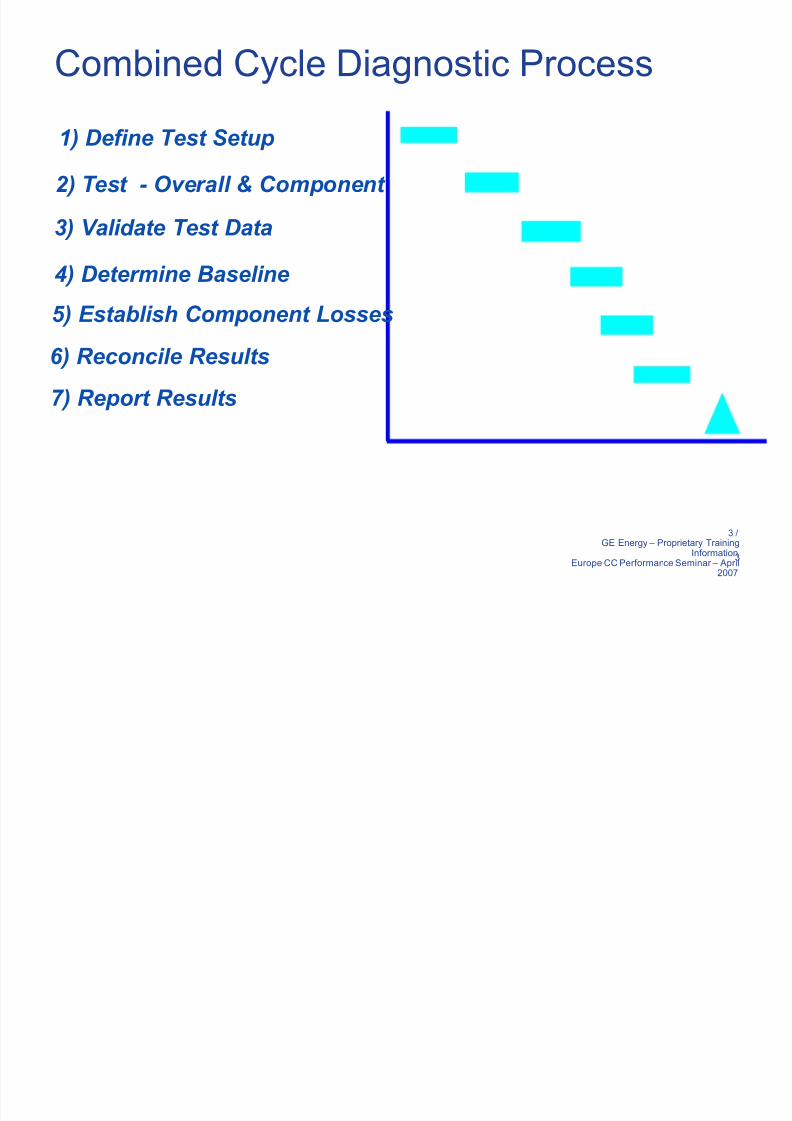
Combined Cycle Diagnostic Process
1) Define Test Setup
2) Test - Overall & Component
3) Validate Test Data
5) Establish Component Losses
6) Reconcile Results
7) Report Results
4) Determine Baseline
8/8/2019 CC Assessment -Gross 07
http://slidepdf.com/reader/full/cc-assessment-gross-07 4/29
4
4 /
GE Energy ± Proprietary TrainingInformationEurope CC Performance Seminar ± April
2007
Test Case
Plant Description: 107FA, 3-pressurereheat combined cycle plant, in operation
12 years. Capable of simple cycle
operation via operation of bypass
stack/damper.
Test Goal: Determine
repairs/modifications to make to steamcycle (steam turbine and HRSG) during
the next scheduled planned outage.
8/8/2019 CC Assessment -Gross 07
http://slidepdf.com/reader/full/cc-assessment-gross-07 5/29
5
5 /
GE Energy ± Proprietary TrainingInformationEurope CC Performance Seminar ± April
2007
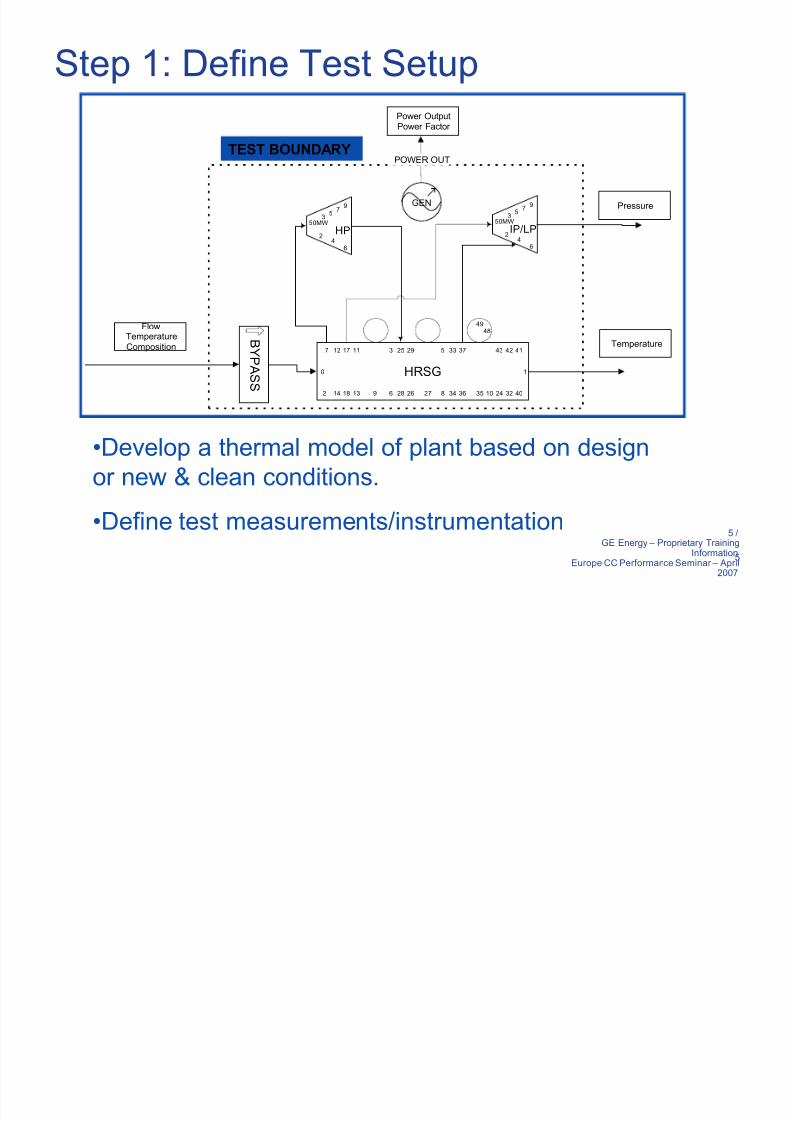
Step 1: Define Test Setup
1
289 24
29
36
25 3717
26
12 42 41
403227 10
4849
351318
0
333 4311
346 8
7
2 14
5
HRSG
2
6
3
97
5
4
50MW
HP 2
6
3
97
5
4
50MW
IP/LP
GEN
POWER OUT
Power OutputPower Factor
B Y P A S S
FlowTemperatureComposition Temperature
Pressure
TEST BOUNDARY
Develop a thermal model of plant based on design
or new & clean conditions.
Define test measurements/instrumentation

8/8/2019 CC Assessment -Gross 07
http://slidepdf.com/reader/full/cc-assessment-gross-07 6/29
6
6 /
GE Energy ± Proprietary TrainingInformationEurope CC Performance Seminar ± April
2007
Step 1) Define Test «continuedGT Measurements (for GT exhaust conditions)
Measurements
TI ET, PI ET, Humidity
GT Po er utput, P
uel DP, P, T,Constituents
GT Exhaust Temp
Design Info
Generator loss curves
GT ixed osses
Combustion efficiency

8/8/2019 CC Assessment -Gross 07
http://slidepdf.com/reader/full/cc-assessment-gross-07 7/29
7
7 /
GE Energy ± Proprietary TrainingInformationEurope CC Performance Seminar ± April
2007
Step 1) Test-Setup «continuedHRSG Measurements
(mass & energy balances, section performance) ater/Steam
± P and T In and ut of each economizer and superheater
section
± P, DP and T Across feed ater, spray flo sections.
± P, DP, T across P Steam flo section
± Drum, superheater outlet pressures
Exhaust Gas
± T Into HRSG (GT Exhaust Temperature) ± T ut of HRSG (Stack Temperature)
± GT easurements for Energy alance
Legend : Precision Measurement | Station Measurement
8/8/2019 CC Assessment -Gross 07
http://slidepdf.com/reader/full/cc-assessment-gross-07 8/29
8
8 /
GE Energy ± Proprietary TrainingInformationEurope CC Performance Seminar ± April
2007
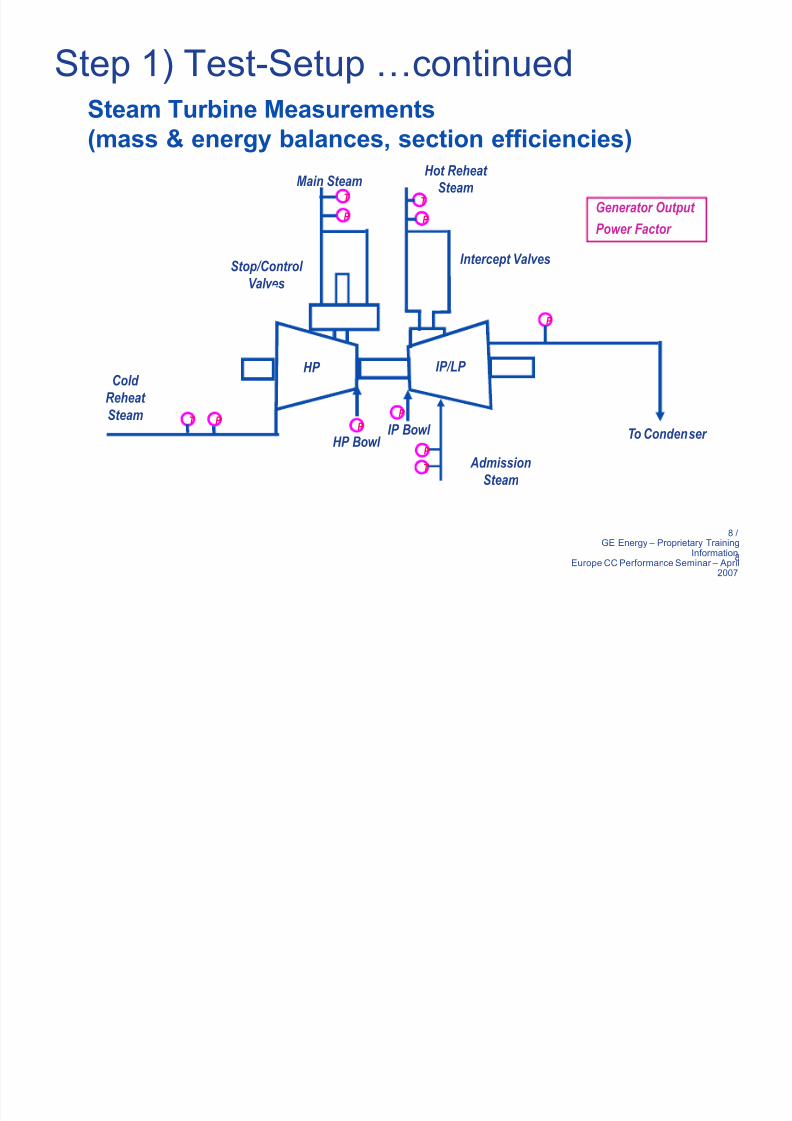
Step 1) Test-Setup «continuedSteam Turbine Measurements
(mass & energy balances, section efficiencies)
T
T T
P P
P P
Cold
Reheat
Steam
HP
Admission
Steam
Stop/Control Valves
Main SteamHot Reheat
Steam
Intercept Valves
To Condenser
P
IP/LP
P
T
HP Bowl
Generator Output
Power Factor
P
IP Bowl
8/8/2019 CC Assessment -Gross 07
http://slidepdf.com/reader/full/cc-assessment-gross-07 9/29
9
9 /
GE Energy ± Proprietary TrainingInformationEurope CC Performance Seminar ± April
2007
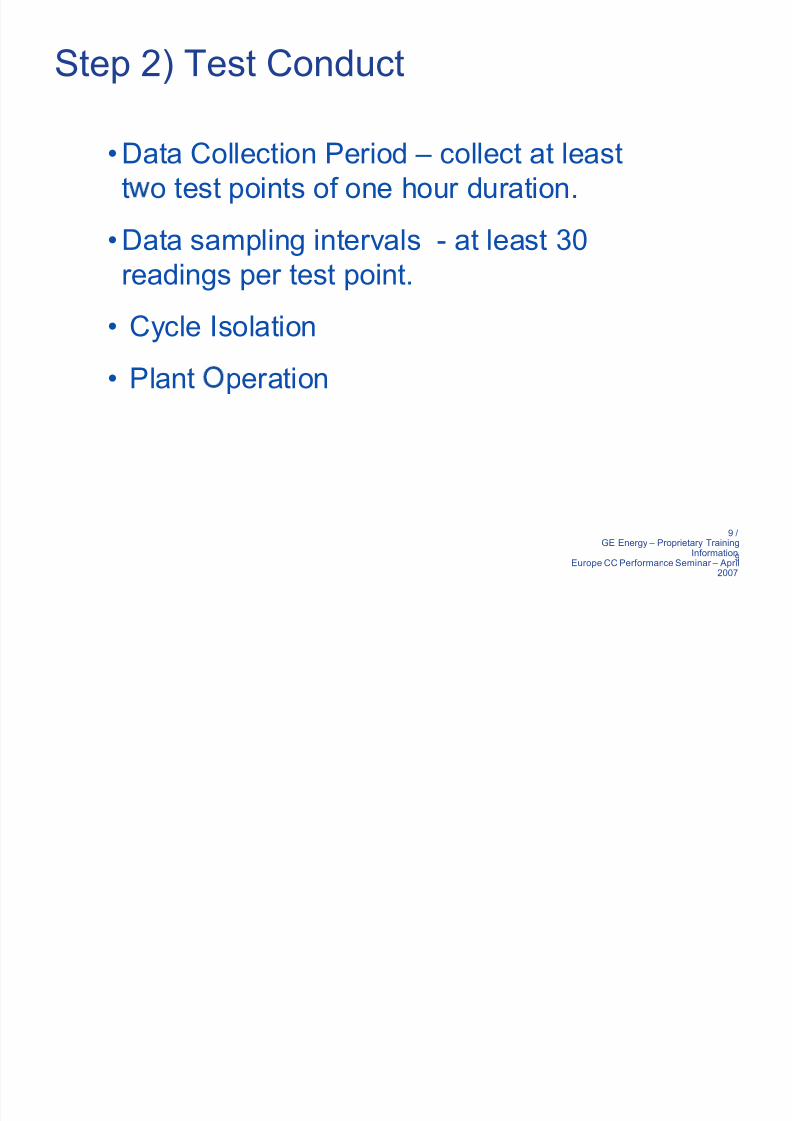
Step 2) Test Conduct
Data Collection Period ± collect at least
t o test points of one hour duration.
Data sampling intervals - at least 30
readings per test point.
Cycle Isolation
Plant peration
8/8/2019 CC Assessment -Gross 07
http://slidepdf.com/reader/full/cc-assessment-gross-07 10/29
10
10 /
GE Energy ± Proprietary TrainingInformationEurope CC Performance Seminar ± April
2007
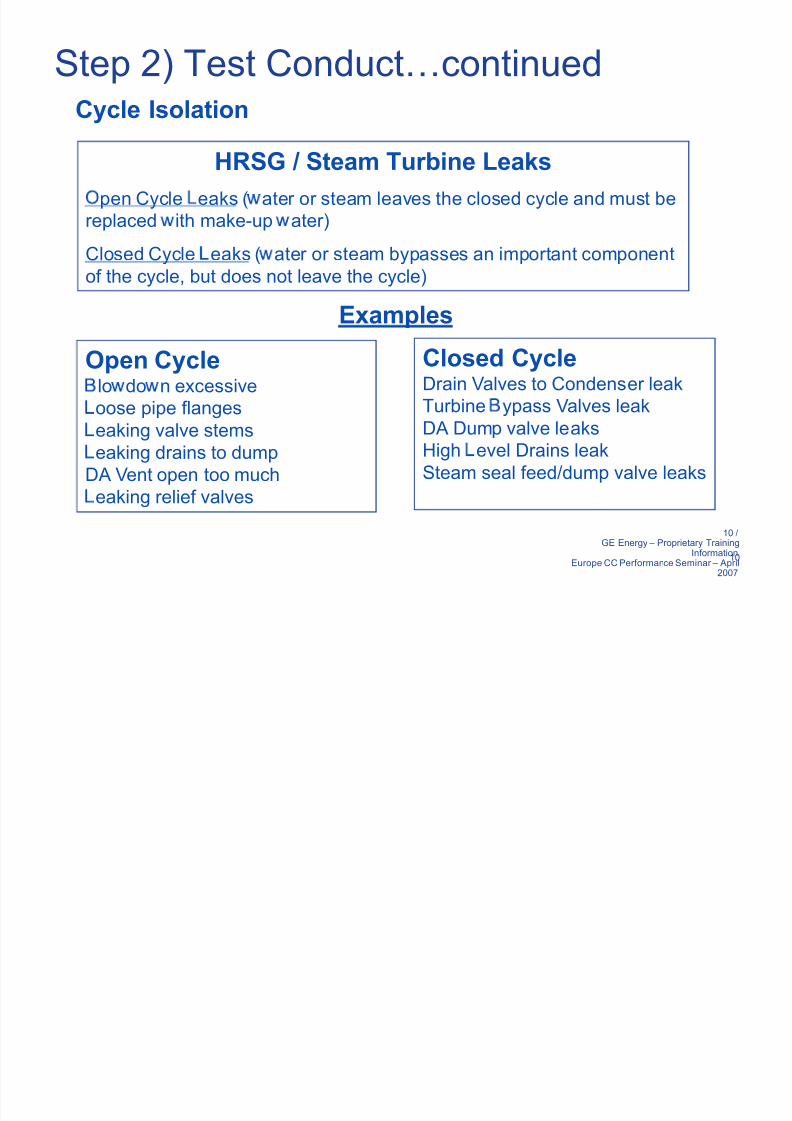
Step 2) Test Conduct«continuedCycle Isolation
HRSG / Steam Turbine Leaks
pen Cycle eaks ( ater or steam leaves the closed cycle and must be
replaced ith make-up ater)
Closed Cycle eaks ( ater or steam bypasses an important component
of the cycle, but does not leave the cycle)
Open Cyclelo do n excessive
oose pipe flangeseaking valve stems
eaking drains to dump
DA Vent open too much
eaking relief valves
Closed CycleDrain Valves to Condenser leak
Turbine ypass Valves leakDA Dump valve leaks
High evel Drains leak
Steam seal feed/dump valve leaks
Examples
8/8/2019 CC Assessment -Gross 07
http://slidepdf.com/reader/full/cc-assessment-gross-07 11/29
11
11 /
GE Energy ± Proprietary TrainingInformationEurope CC Performance Seminar ± April
2007
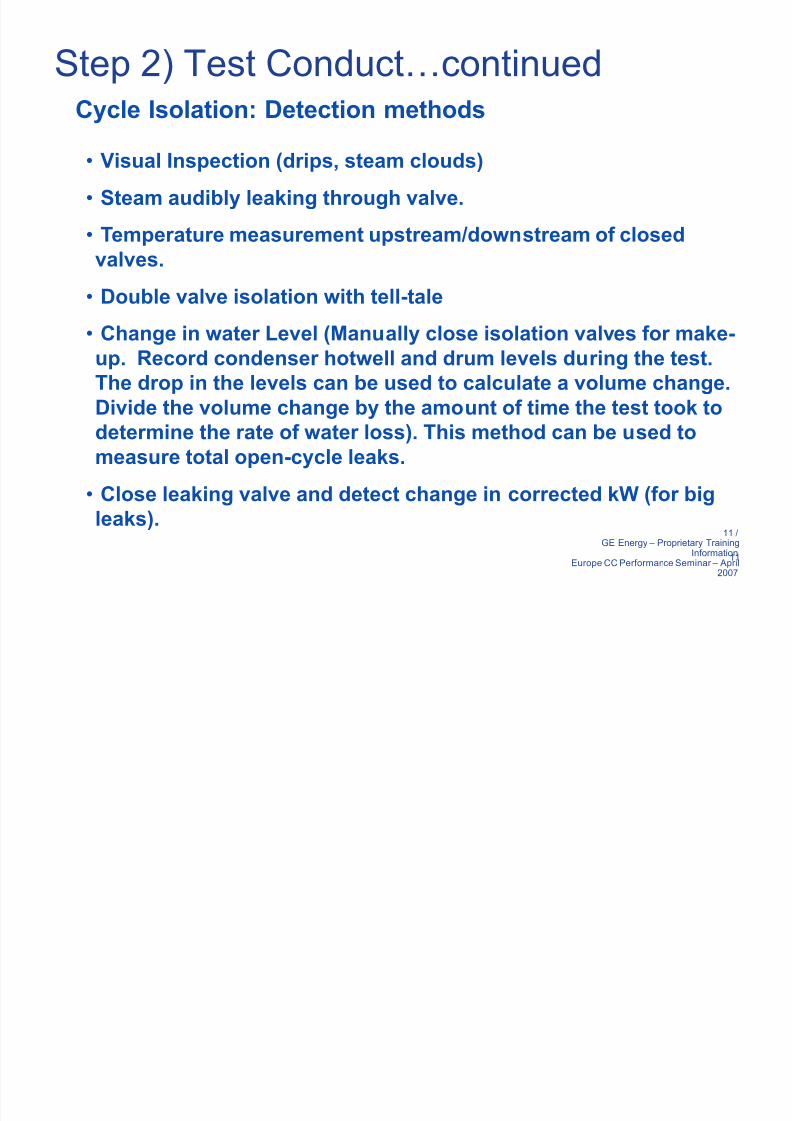
Step 2) Test Conduct«continuedCycle Isolation: Detection methods
Visual Inspection (drips, steam clouds)
Steam audibly leaking through valve.
Temperature measurement upstream/downstream of closed
valves.
Double valve isolation with tell-tale
Change in water Level (Manually close isolation valves for make-
up. Record condenser hotwell and drum levels during the test.
The drop in the levels can be used to calculate a volume change.
Divide the volume change by the amount of time the test took todetermine the rate of water loss). This method can be used to
measure total open-cycle leaks.
Close leaking valve and detect change in corrected kW (for big
leaks).
8/8/2019 CC Assessment -Gross 07
http://slidepdf.com/reader/full/cc-assessment-gross-07 12/29
12
12 /
GE Energy ± Proprietary TrainingInformationEurope CC Performance Seminar ± April
2007
Step 2) Test Conduct«continuedPlant Operational Checks
Plant operating as intended
Valve line up
Control (i.e. GT at base load, duct burners on or
off)
Plant has reached steady-state conditions
Data acquisition system functioning

8/8/2019 CC Assessment -Gross 07
http://slidepdf.com/reader/full/cc-assessment-gross-07 13/29
13
13 /
GE Energy ± Proprietary TrainingInformationEurope CC Performance Seminar ± April
2007
Step 3) Data ValidationData Validation Techniques
Comparison to expected readings
Comparison to redundant measurements
Mass balances
Energy balances
Physical principles
8/8/2019 CC Assessment -Gross 07
http://slidepdf.com/reader/full/cc-assessment-gross-07 14/29
14
14 /
GE Energy ± Proprietary TrainingInformationEurope CC Performance Seminar ± April
2007
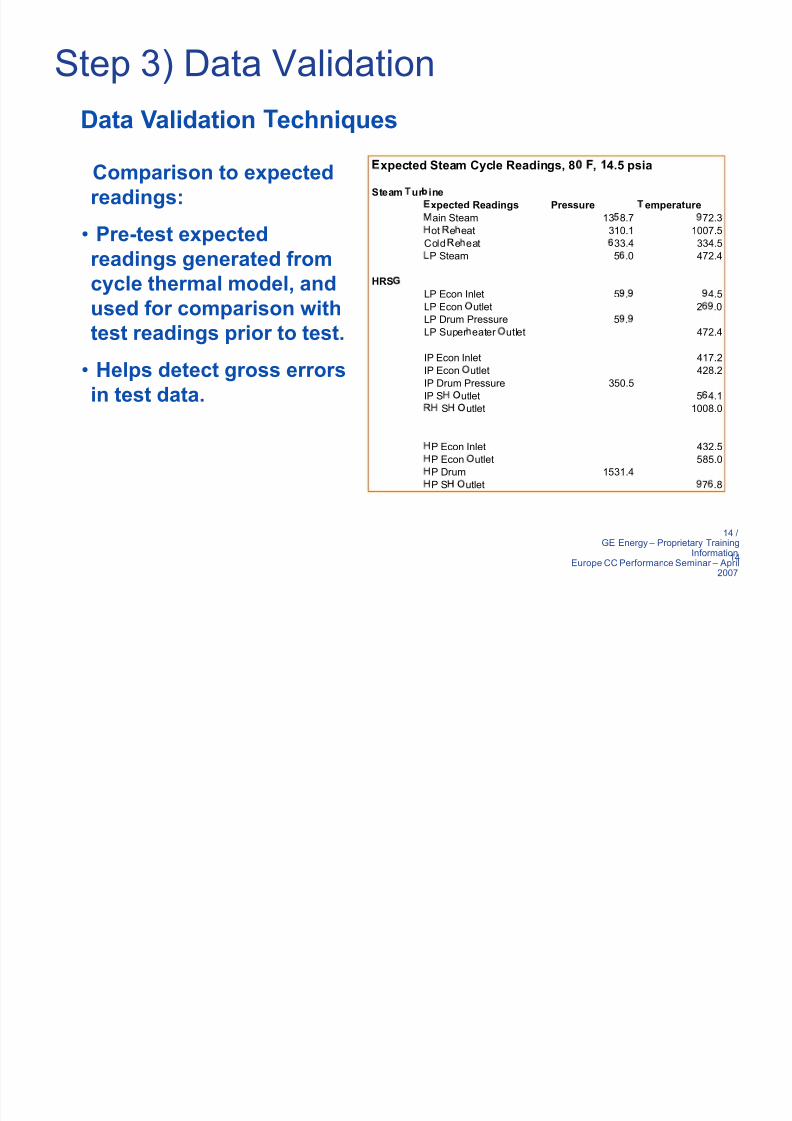
Step 3) Data Validation
Comparison to expected
readings:
Pre-test expected
readings generated from
cycle thermal model, and
used for comparison with
test readings prior to test.
Helps detect gross errors
in test data.
xpected Steam Cycle Readings, 8 , 4.5 psia
Steam ur ine
xpected Readings Pressure emperature
ain Steam 13 8.7 72.3
ot e eat 310.1 1007.5
Cold e eat 33.4 334.5
P Steam 5 .0 472.4
HRS
LP Econ Inlet 5 . 4.5
LP Econ utlet 2 .0
LP Drum Pressure 5 .
LP Super eater utlet 472.4
IP Econ Inlet 417.2
IP Econ utlet 428.2
IP Drum Pressure 350.5
IP S utlet 5 4.1
S utlet 1008.0
P Econ Inlet 432.5
P Econ utlet 585.0
P Drum 1531.4
P S utlet 7 .8
Data Validation echniques
8/8/2019 CC Assessment -Gross 07
http://slidepdf.com/reader/full/cc-assessment-gross-07 15/29
15
15 /
GE Energy ± Proprietary TrainingInformationEurope CC Performance Seminar ± April
2007
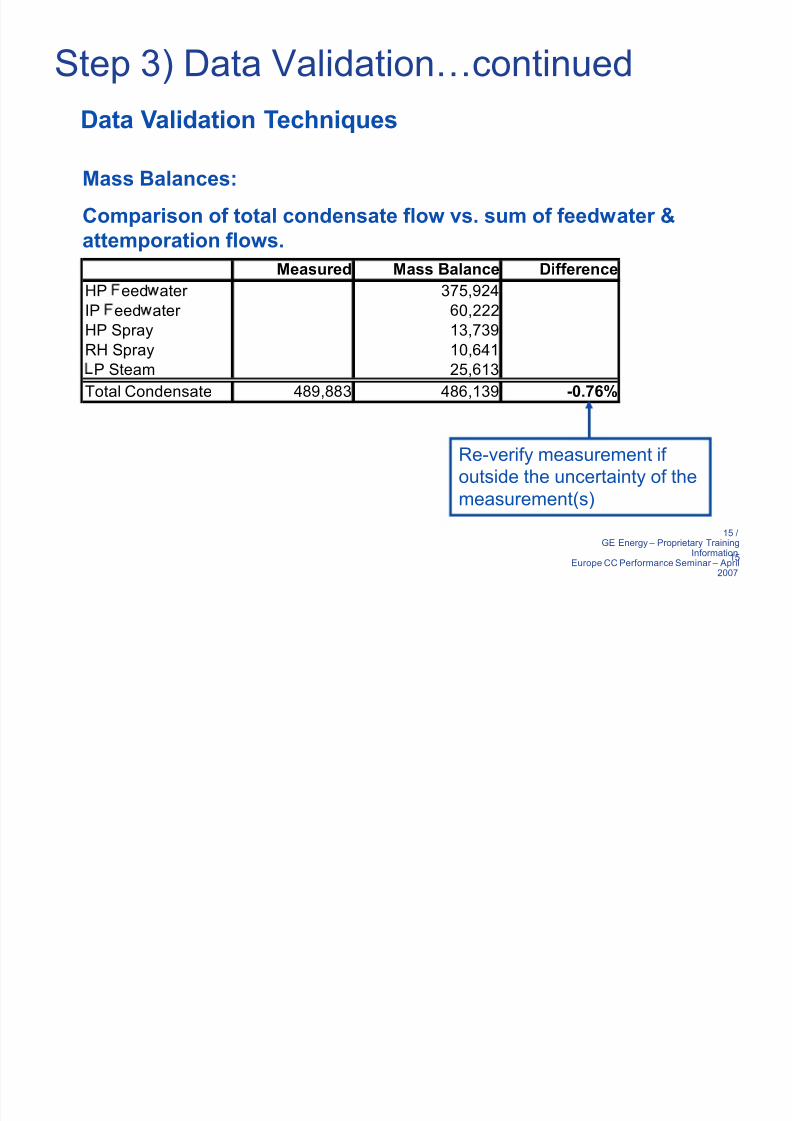
Step 3) Data Validation«continued
Data Validation Techniques
Mass Balances:
Comparison of total condensate flow vs. sum of feedwater &
attemporation flows.
Measured Mass Balance DifferenceHP eed ater 375,924
IP eed ater 60,222
HP Spray 13,739
RH Spray 10,641
P Steam 25,613
Total Condensate 489,883 486,139 -0.76%
Re-verify measurement if
outside the uncertainty of the
measurement(s)

8/8/2019 CC Assessment -Gross 07
http://slidepdf.com/reader/full/cc-assessment-gross-07 16/29
16
16 /
GE Energy ± Proprietary TrainingInformationEurope CC Performance Seminar ± April
2007
Step 3) Data Validation«continuedData Validation Techniques
Energy
Balances:
Comparison
of energy
released byexhaust gas
to energy
gained by
steam/water
in HRSG.
Gas Side 1
Inputs
low¡
ressure Temperature h [Btu/lb] H [Btu/hr]
¢
£
SG Inlet Gas 3,1¤
1,8¥
9 11¥
2.26 282.¥
901,¥
27,658
GT E¦ § aust Gas Composition
Argon 0.0087
̈
2 0.732¥
©
2 0.1261
C©
2 0.0367
¢ 2© 0.0961
utputs
Stack Temperature 3,191,8¥
9 235.9 38.3 122,131,¥
91
Energy Lost rom Gas Side 779,296,166
Heat
tilization
actor (£
adiation,
isc Losses) 0.9950
%
lo
to HRSG Heat Xfer Sections (
ypass Leakage) 99.8%
Gas-Side Energy Release
,4
,
8
Steam/ ater SideInputs
low¡
ressure Temperature h [Btu/lb] H [Btu/hr]
Condensate In ( rom ass alance) ¥ 86,139 72.85 105.0 73.18 35,57¥ ,987
Cold Re§ eat Steam In 379,659 3¥ ¥ .5 692.1 1362.23 517,18¥ ,132
IP
eed
ater 60,222 37¥
.0 308.6 0.00 0
HP
eed
ater 375,92¥
1766.1 311.¥
0.00 0
HP
eed
ater Pump Energy 2,563,879
IP
eed
ater Pump Energy 865,365
Energy In 556,188,363
utputs
low¡
ressure Temperature h [Btu/lb] H [Btu/hr]
HP Steam 389,663 1333 996.25 1¥
93.1 581,793,889
RH Steam ¥ 50,521 31 ¥ .99 1003.8 1527.7 688,283,206
LP Steam 25,613 68.18¥
99.1 1281.9 32,83¥ ,922
HP
lo
do
n 0 1¥ ¥
6.1 60¥
.8 0
IP
lo
do
n 0 351.92¥
10.¥
0
Energy©
ut 1,302,912,016
Energy Gained
rom Steam Side Steam-Side Energy Gain
4
,
,
5
Gas to ater/Steam Imbalance - .5%ad data or real
problem?

8/8/2019 CC Assessment -Gross 07
http://slidepdf.com/reader/full/cc-assessment-gross-07 17/29
17
17 /
GE Energy ± Proprietary TrainingInformationEurope CC Performance Seminar ± April
2007
Step 3) Data Validation«continuedData Validation Techniques
Fluid dynamics:
Compare design K-factor to Test K factor for ST sections
HP Section Design Test Difference
HP Throttle lo 378,399 389,663
HP Throttle Pressure 1,354.0 1,308.6
HP Throttle Temperature 1001.1 995.4
HP Throttle Enthalpy 1495.3 1493.3
HP o l Pressure 1293.1 1297
HP o l Specific Volume 0.6312 0.627
K- actor 8360.1 8568.6 2.5%
Used to detect gross errors in test data.
Typical as built K-factor within % of original design.
If stage physical condition stays constant, K factor will
be constant over time.
8/8/2019 CC Assessment -Gross 07
http://slidepdf.com/reader/full/cc-assessment-gross-07 18/29
18
18 /
GE Energy ± Proprietary TrainingInformationEurope CC Performance Seminar ± April
2007
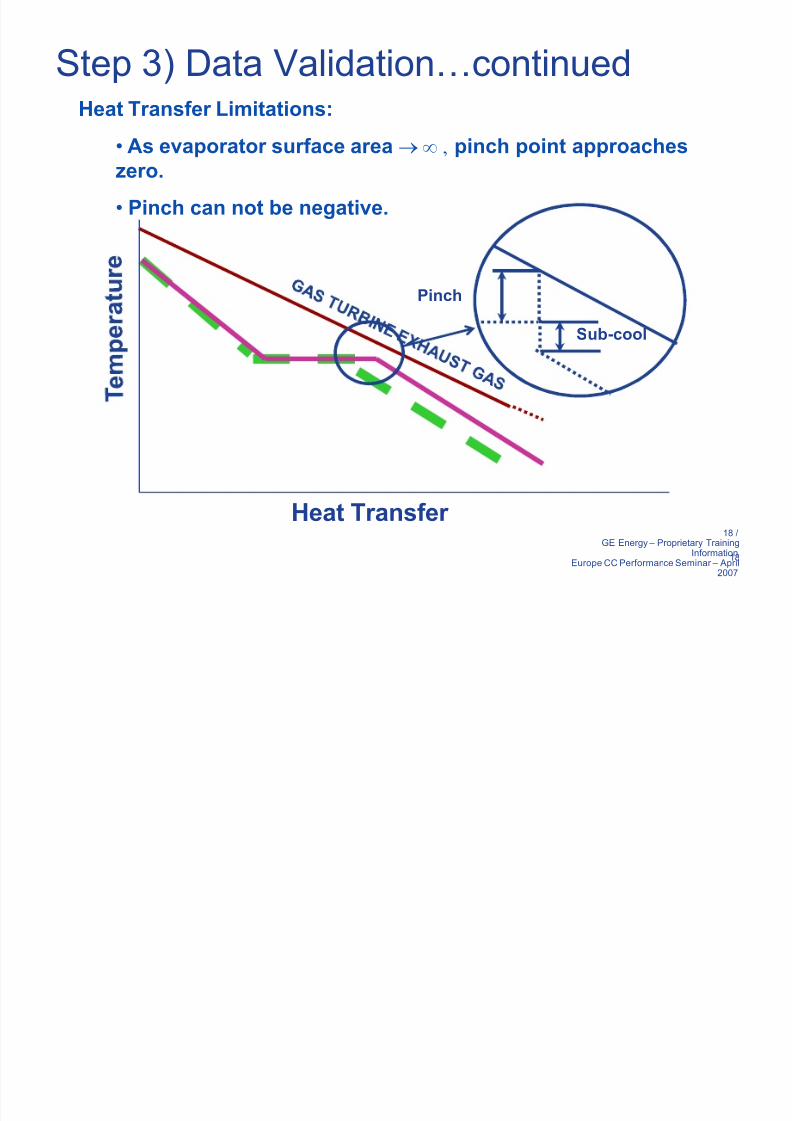
Heat Transfer
Sub-cool
Pinch
Heat Transfer Limitations:
As evaporator surface area p gpinch point approacheszero.
Pinch can not be negative.
Step 3) Data Validation«continued

8/8/2019 CC Assessment -Gross 07
http://slidepdf.com/reader/full/cc-assessment-gross-07 19/29
19
19 /
GE Energy ± Proprietary TrainingInformationEurope CC Performance Seminar ± April
2007
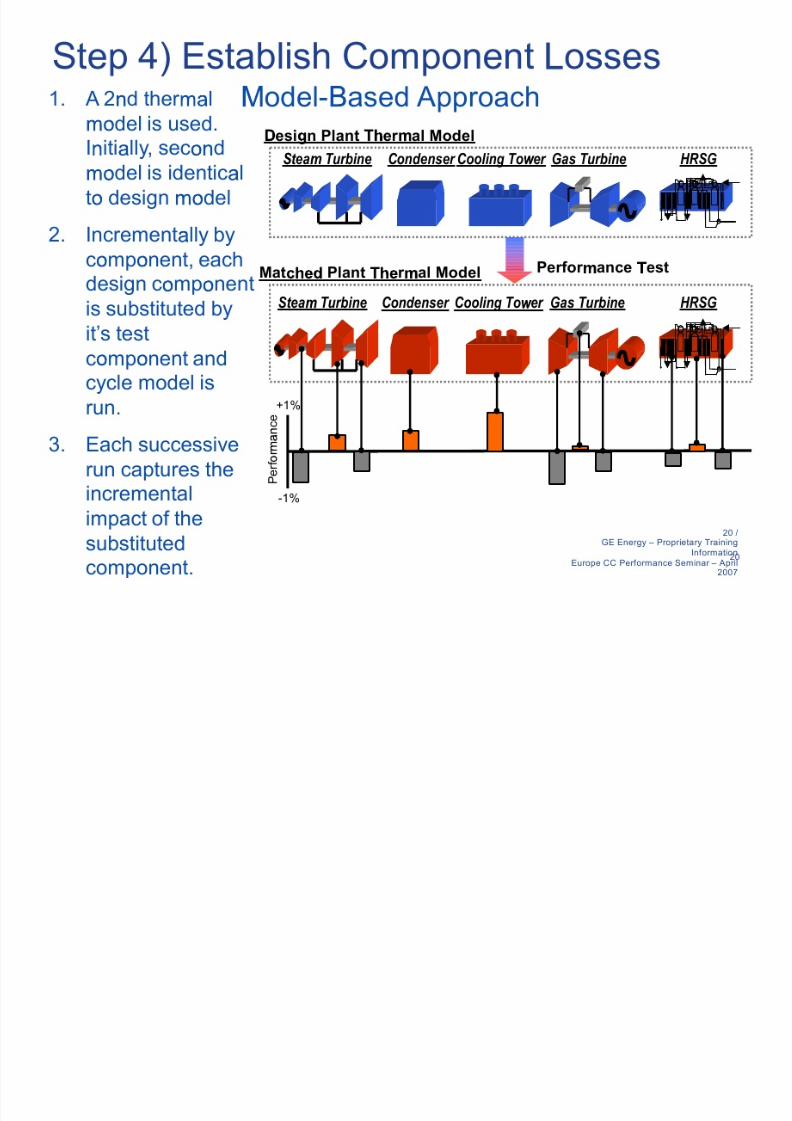
Step 4) Establish aseline Performance
Run design/new & clean thermal model at test
boundary conditions to establish expectedperformance at test conditions. UNITS TESTED EXPECTED
Boundary conditions
GT exhaust gas flo lb/hr 3,192,902 3,192,902
GT exhaust gas pressure psia 15.1 15.1
GT exhaust gas temperature 1,143.3 1,143.3
GT exhaust gas Carbon Dioxide mol frac 0.03640 0.03640GT exhaust gas H2 mol frac 0.09557 0.09557
GT exhaust gas itrogen mol frac 0.73263 0.73263
GT exhaust gas xygen mol frac 0.12668 0.12668
GT exhaust gas Argon mol frac 0.00872 0.00872
Steam turbine exhaust pressure 1.0083 1.0083
Cycle Measurements/Predictions
ST output k 77,238 84,147
Stack temperature 236.3 216.5
Predicted Design utput 84,147
easured ST utput 77,238
Steam Cycle Shortfall 6,909
Steam Cycle
Shortfall
8/8/2019 CC Assessment -Gross 07
http://slidepdf.com/reader/full/cc-assessment-gross-07 20/29
8/8/2019 CC Assessment -Gross 07
http://slidepdf.com/reader/full/cc-assessment-gross-07 21/29
21
21 /GE Energy ± Proprietary Training
InformationEurope CC Performance Seminar ± April
2007
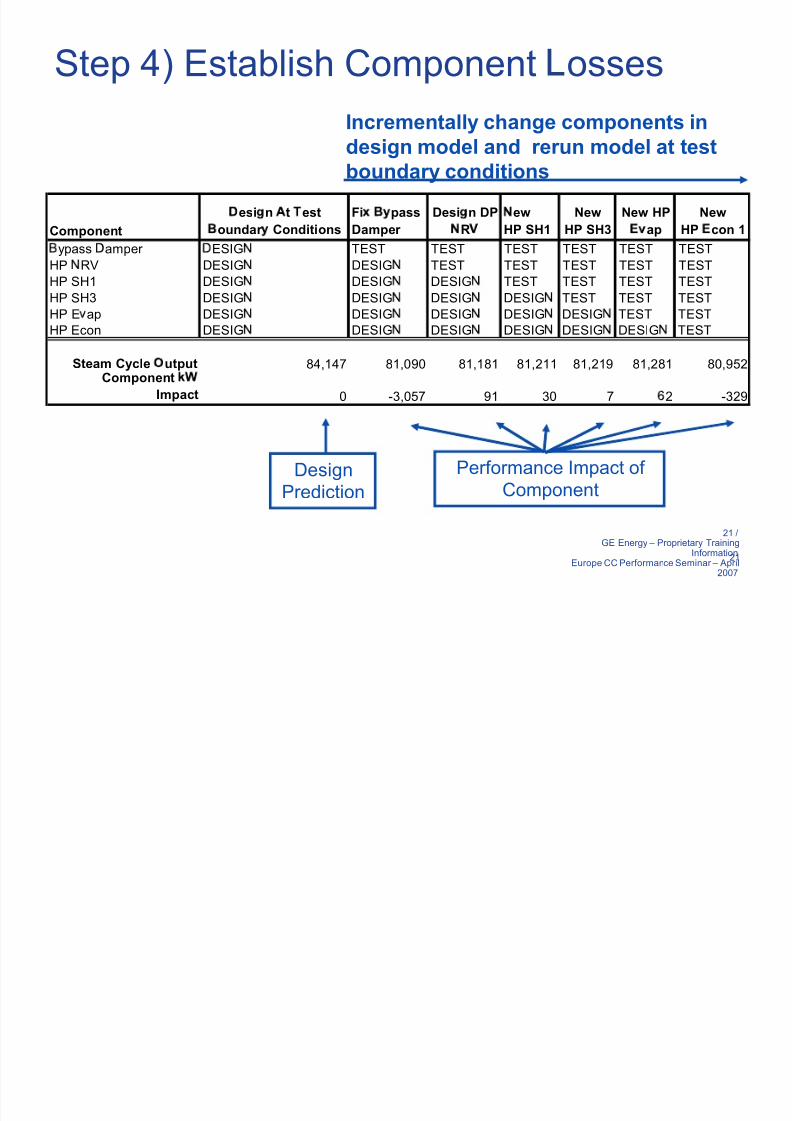
Step 4) Establish Component osses
Component
esi n t est
oundar Conditions
Fi pass
Damper
Desi n DP
R
ew
HP SH1
New
HP SH3
New HP
ap
New
HP con 1
ypass amper ESIG TEST TEST TEST TEST TEST TEST
HP RV DESIG DESIG TEST TEST TEST TEST TEST
HP SH1 DESIG DESIG DESIG TEST TEST TEST TEST
HP SH3 DESIG DESIG DESIG DESIG TEST TEST TEST
HP E ap DESIG DESIG DESIG DESIG DESIG TEST TEST
HP Econ DESIG DESIG DESIG DESIG DESIG DESIG TEST
Steam Cycle utput 84,147 81,090 81,181 81,211 81,219 81,281 80,952Component
Impact 0 -3,057 91 30 7 2 -329
Incr ementally change components in
design model and r er un model at testboundar y conditions
Performance Impact of
ComponentDesign
Prediction

8/8/2019 CC Assessment -Gross 07
http://slidepdf.com/reader/full/cc-assessment-gross-07 22/29
22
22 /GE Energy ± Proprietary Training
InformationEurope CC Performance Seminar ± April
2007
Step 5) Reconcile Results
Do component impacts add up to total plant shortfall?
Can be a sign of measurement errors.
Do component impacts make sense?
Is an individual component behaving much better
than design?
You may need to return to Step 3
8/8/2019 CC Assessment -Gross 07
http://slidepdf.com/reader/full/cc-assessment-gross-07 23/29
23
23 /GE Energy ± Proprietary Training
InformationEurope CC Performance Seminar ± April
2007
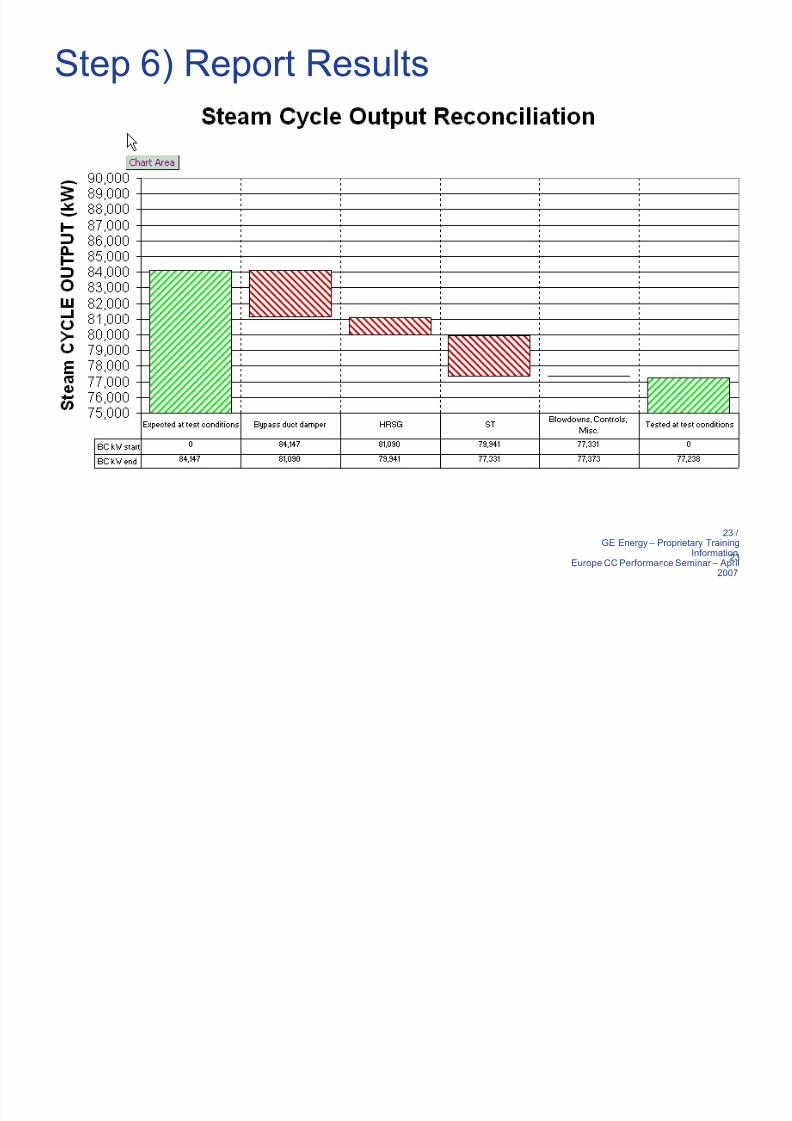
Step 6) Report Results

8/8/2019 CC Assessment -Gross 07
http://slidepdf.com/reader/full/cc-assessment-gross-07 24/29
24
24 /GE Energy ± Proprietary Training
InformationEurope CC Performance Seminar ± April
2007
Step 6) Report Results«Continued
8/8/2019 CC Assessment -Gross 07
http://slidepdf.com/reader/full/cc-assessment-gross-07 25/29
25
25 /GE Energy ± Proprietary Training
InformationEurope CC Performance Seminar ± April
2007
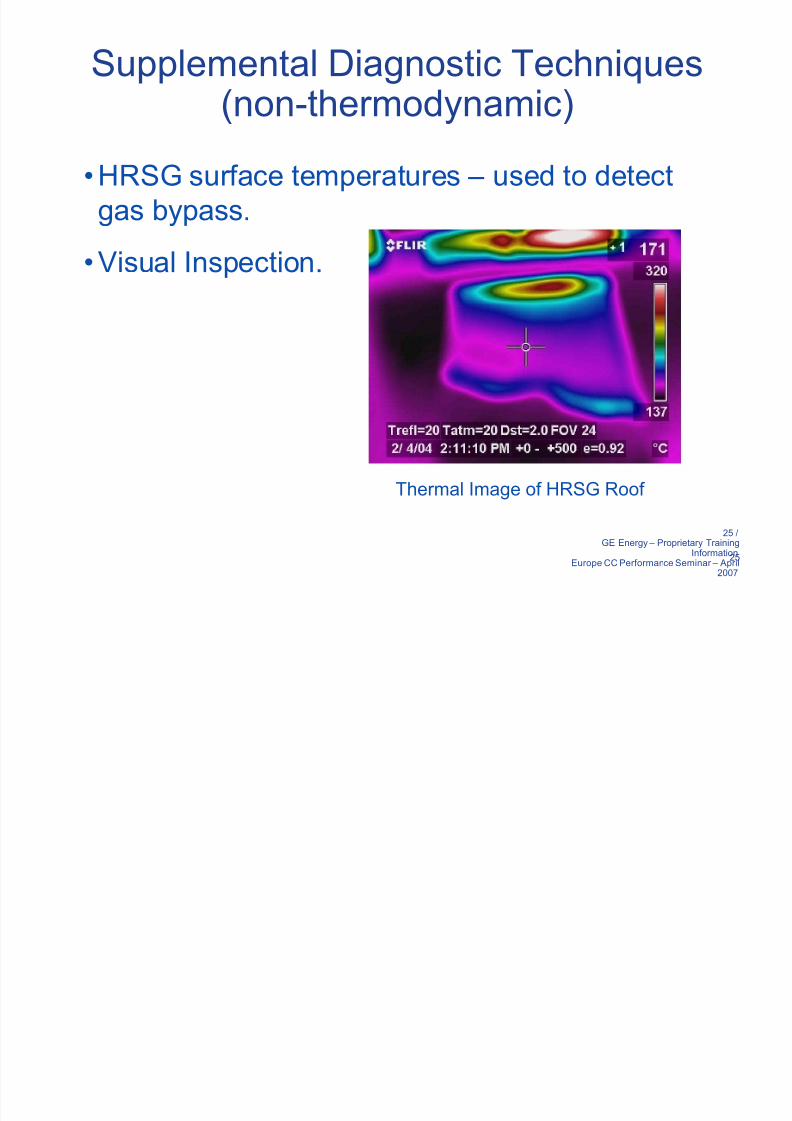
Supplemental Diagnostic Techniques(non-thermodynamic)
HRSG surface temperatures ± used to detect
gas bypass.
Visual Inspection.
Thermal Image of HRSG Roof

8/8/2019 CC Assessment -Gross 07
http://slidepdf.com/reader/full/cc-assessment-gross-07 26/29
26
26 /GE Energy ± Proprietary Training
InformationEurope CC Performance Seminar ± April
2007
Supplemental Diagnostic Techniques(non-thermodynamic)
HRSG skin temperatures
0
100
200
300
400
500
600
1 2 3 4 5 6 7 8 9 10
Strut
T e m p e r a t u r e [ F ]
HRSG 1A
HRSG 1!
8/8/2019 CC Assessment -Gross 07
http://slidepdf.com/reader/full/cc-assessment-gross-07 27/29
27
27 /GE Energy ± Proprietary Training
InformationEurope CC Performance Seminar ± April
2007
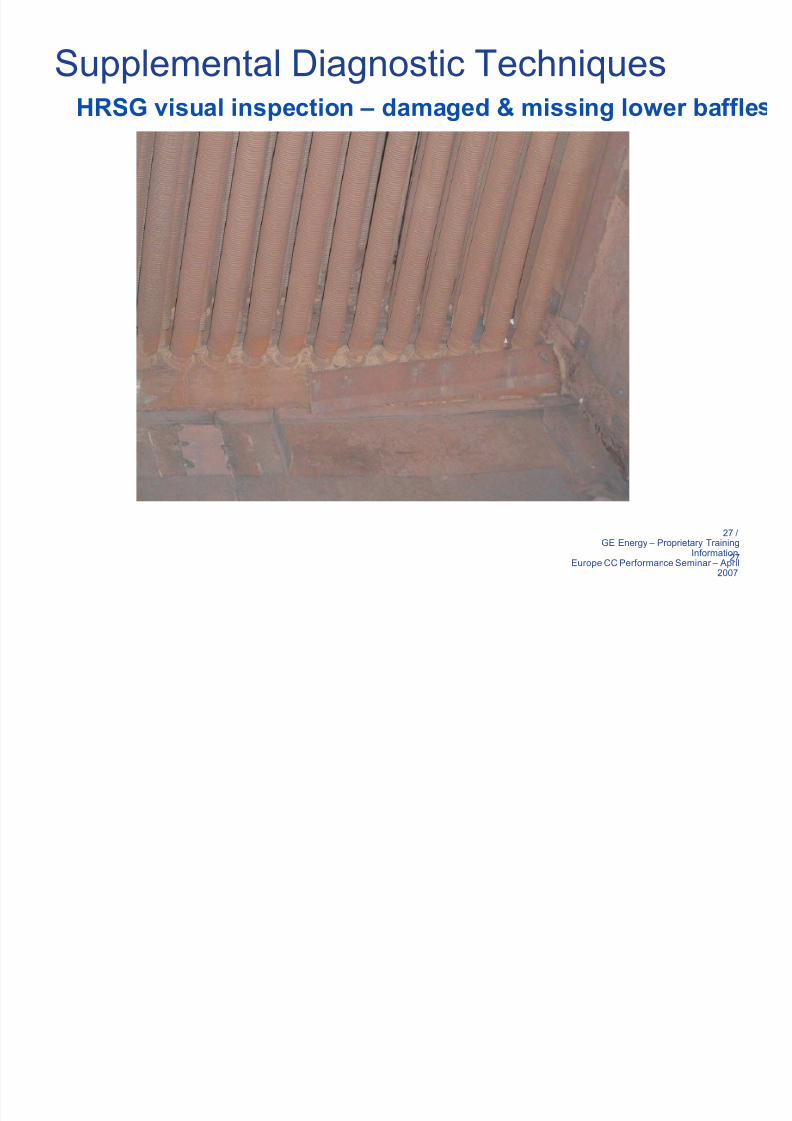
Supplemental Diagnostic TechniquesHRSG visual inspection ± damaged & missing lower baffle
8/8/2019 CC Assessment -Gross 07
http://slidepdf.com/reader/full/cc-assessment-gross-07 28/29
28
28 /GE Energy ± Proprietary Training
InformationEurope CC Performance Seminar ± April
2007
Bypass damper/ exhaust duct
1. Install a temporary cap on the bypass damper for the next performance test to
eliminate bypass leakage. Investigate replacing damper at an future outage.3. eld repair all visible cracks in the duct upstream and do nstream of the bypass
damper.
4. Inspect the exhaust expansion joints located at either side of the bypass damper
and repair or replace as necessary.
HRSG1.Replace HP attemporator control TC. It currently reads high, and caused a 97 k
loss at test conditions.
2. Install redesigned baffling (side, center-line, upper and lo er) throughout the HRSG
to direct the exhaust gas flo to the heat transfer surfaces. Perform full inspection of
the HRSG sections at the next outage.
3. Clean the P economizer section per the HRSG manufacturer¶s recommendations.
ST
1. ST Improvements/ odifications: Conducting a full steam path audit at next full
outage to determine specific component replacement plan. Component
repair/replacement recommendations shall be based on the steam path auditor¶s
recommendations.2. verhaul leaking IP bypass valve.
Recommendations

8/8/2019 CC Assessment -Gross 07
http://slidepdf.com/reader/full/cc-assessment-gross-07 29/29
29
29 /GE Energy ± Proprietary Training
InformationEurope CC Performance Seminar ± April
2007
Combined Cycle Assessment
Use thermodynamic analysis to pinpoint areas of focusand provide basis for economic justification of
repairs/modifications.
By itself, thermodynamic assessment does not reveal a
root cause for performance shortfalls. Combine withexperience and visual hardware inspection to create an
actionable maintenance outage plan.
Validate results with a post modification test and
analysis.
Document your findings/results to build up internal
library of lessons learned.