c/cag countywide carpooling incentives pilot program...
TRANSCRIPT

C/CAG Countywide Carpooling Incentives Pilot Program Update
City/County Association of Governments of San Mateo County (C/CAG)Board of Directors
November 9, 2017

Goals
• Reduce number of single occupancy vehicles on the road and increase usage of carpooling and ridesharing in San Mateo County during peak commute periods
• Encourage residents and employees of San Mateo County to consider carpooling/ridesharing as an alternative to driving alone when commuting to and from work

Objectives
• Initiate the C/CAG Countywide Carpooling Incentive Pilot Program (Program)
• Provide incentives to offset the cost of carpooling trips
• Enable Program to be available to all 20 cities and County residents and workers
• Collaborate with private sector with Dynamic Ridesharing / Carpooling Application (App) for real-time ride-matching services to support the Program

How the Program Works
• Applies to trips within peak AM and PM periods, M-F
• Applies to trips that begins or ends in San Mateo County
• Targeted users – for residents of San Mateo County or for workers who work in the County
• Incentive is established at $2 per trip per person (rider/driver)
• Offer up to $1 million to subsidize the cost of the program over a one (1) year period or until funds are exhausted
• Roll out in July 24, 2017 with Scoop, Officially launched August 1, 2017

Reporting
• Number of registered users
• Number of monthly active users
• Number of new users in month
• Average vehicle occupancy
• Number of completed trips
• Number of Trips in month
• Trip length
• Trips by origin/destination (zip-codes)
• Trip % increase month/month
• Total trips taken to date
• Other:
• Cars out of parking lots, Miles saved, Pounds of CO2 saved, VMT reduction, drivers trip reduced

Incentives Model
Scoop Rider Pays C/CAG Pays Driver Rec Scoop Gets
No Incentive $6 $0 $5 $1
With Incentive $4 $4 $7 $1
Examples of how the incentive pricing is applied to one (1) trip for Scoop:
1 Trip = Rider or Driver
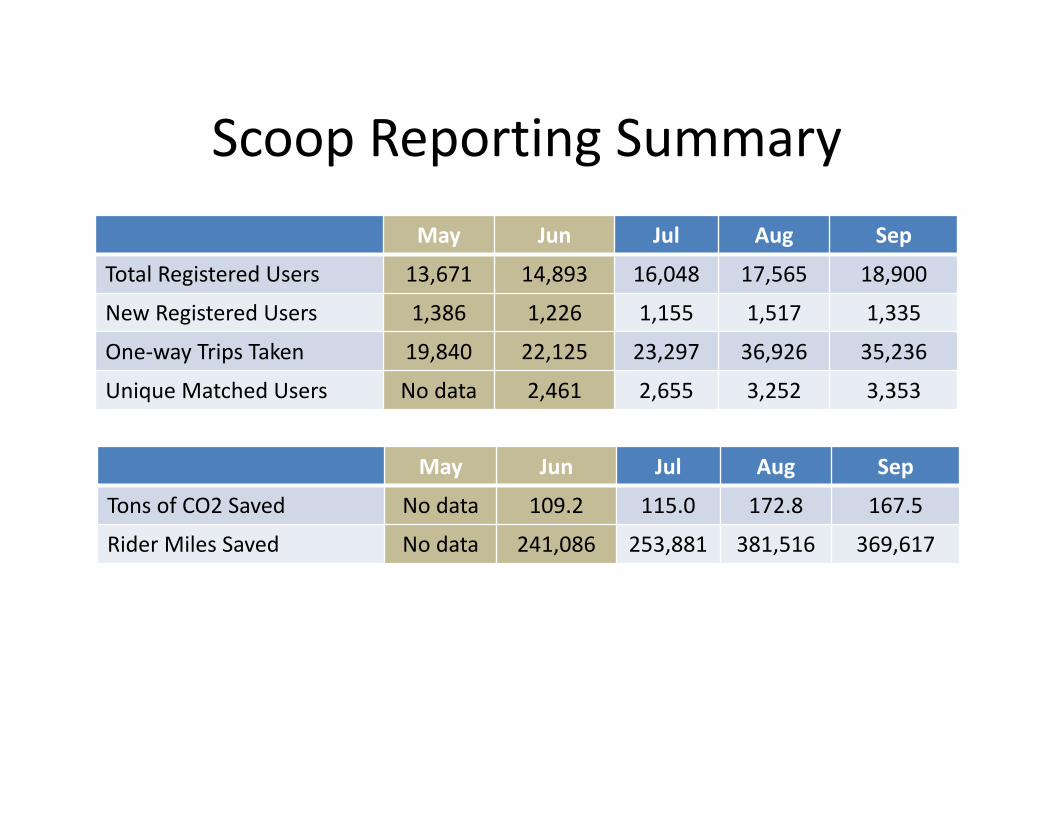
Scoop Reporting SummaryExamples of how the incentive pricing is applied to one (1) trip for the respective Apps are as follows:
May Jun Jul Aug Sep
Total Registered Users 13,671 14,893 16,048 17,565 18,900
New Registered Users 1,386 1,226 1,155 1,517 1,335
One-way Trips Taken 19,840 22,125 23,297 36,926 35,236
Unique Matched Users No data 2,461 2,655 3,252 3,353
May Jun Jul Aug Sep
Tons of CO2 Saved No data 109.2 115.0 172.8 167.5
Rider Miles Saved No data 241,086 253,881 381,516 369,617

Scoop Reporting Summary (cont.)Jul Aug Sep
One-way Trips Taken (CCAG) 8,426 35,767 34,077
No. of Carpool Trip 4,213 17,884 17,039
No. of Days 6 23 21
Average Daily Carpool Trips 702 778 811
Jul Aug Sep
Incentives applied $16,852 $71,534 $68,154

Registered User Growth is Steady in San Mateo County
Data reflects total Scoop registrations in San Mateo County for the past five months.
Registered user growth has been steady, with some pop in August following the launch of the incentive in the last week of July.
More significant registered user growth could be achieved through additional marketing and awareness efforts.

C/CAG’s Scoop program has increased carpooling by 60%
Data reflects Scoop one-way trips into, out of, or within San Mateo County for the past five months.
This is the strongest indicator of the success of the program, showing ~60% growth from pre-program carpooling levels.
September’s slight decline is a symptom of the Labor Day holiday (fewer working days in the month).
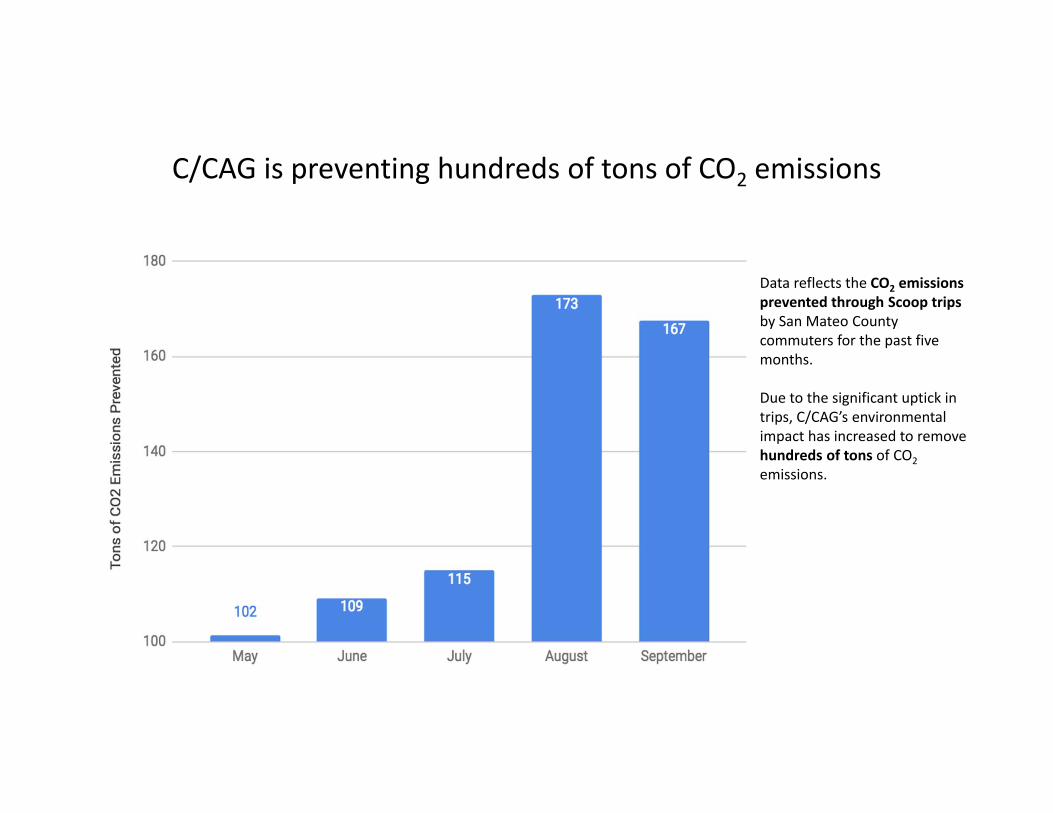
Data reflects the CO2 emissions prevented through Scoop tripsby San Mateo County commuters for the past five months.
Due to the significant uptick in trips, C/CAG’s environmental impact has increased to remove hundreds of tons of CO2emissions.
C/CAG is preventing hundreds of tons of CO2 emissions

Scoop Data Overview: July -September
• Total Trips• Origin and Destination• Uses• Day of Week

Total Trips
0
5000
10000
15000
20000
25000
30000
35000
40000
July August September
34,499 32,965
75,624 trips from July to September8,160

Starting City
0%
2%
4%
6%
8%
10%
12%
14%
16%
18%
20%
Foster City Fremont San Mateo Redwood City South SF
July August Sept
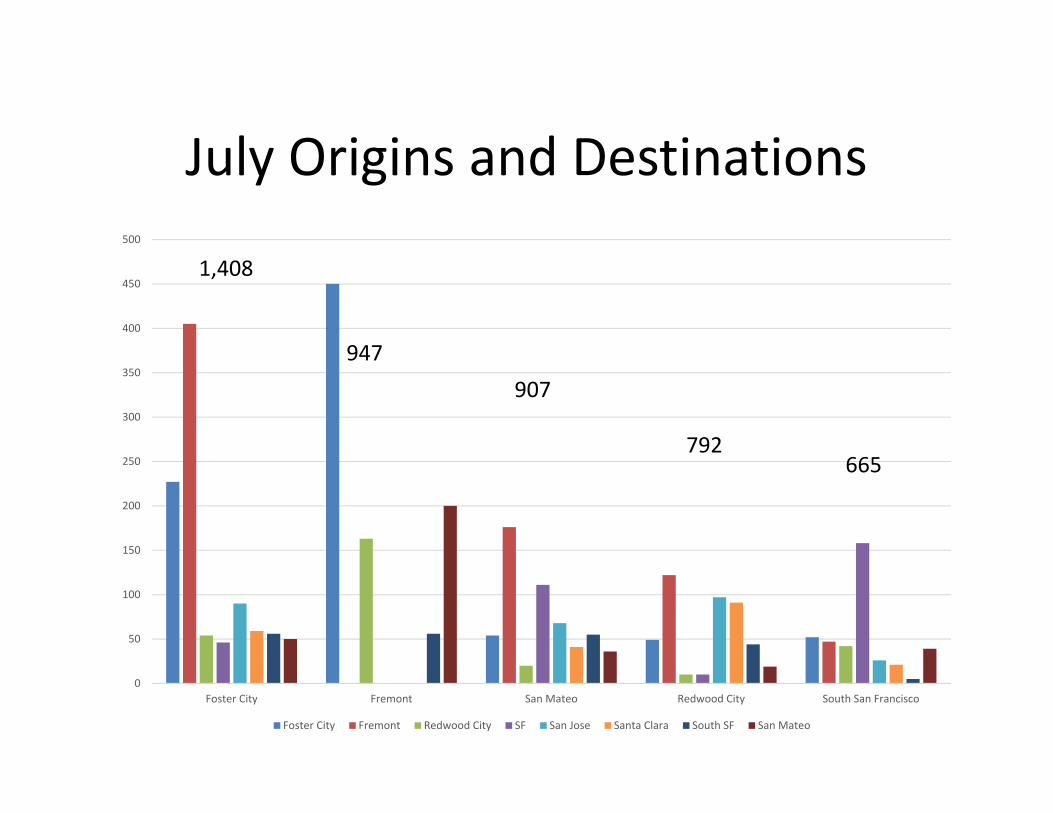
July Origins and Destinations
0
50
100
150
200
250
300
350
400
450
500
Foster City Fremont San Mateo Redwood City South San Francisco
Foster City Fremont Redwood City SF San Jose Santa Clara South SF San Mateo
947907
792665
1,408

August Origins and Destinations
0
200
400
600
800
1000
1200
1400
1600
Foster City Fremont San Mateo Redwood City South San Francisco
Foster City Fremont Sunnyvale San Jose South SF San Mateo SF Santa Clara
5,751
3,637
3,964 3,313 2,849

September Origins and Destinations
0
200
400
600
800
1000
1200
1400
1600
Foster City Fremont San Mateo Redwood City South San Francisco
Foster City Fremont Sunnyvale San Jose South SF San Mateo San Francisco Santa Clara
5,354
3,523
4,164 3,4282,701

Less Than 50 Trips in September
• Atherton (42)• Brisbane (18)• Colma (18)• Emerald Hills (17)• Half Moon Bay (18)• Hillsborough (21)• Woodside (6)

Where are people starting and ending?
97% 96% 96%
91% 92% 91%
0%
10%
20%
30%
40%
50%
60%
70%
80%
90%
100%
July August September
Starting Home, Ending Work (AM) Starting Work, Ending Home (PM)

Trips by Day of Week
0%
5%
10%
15%
20%
25%
30%
35%
Monday Tuesday Wednesday Thursday Friday
July August September

Summary
• 75,624 total trips• Regional travel has more trips• Commuter travel behavior • More outreach needed

Next Steps/Follow Up Activities
• Increase outreach efforts to cities with low number of trips
• Obtain information about alternative choice of commute from users
• Bring Waze Carpool on board• Other

Questions?