ccalc pvc manual v2.0 - ccalc.org.uk · ccalc pvc manual i list of contents ... in excel 2003, on...
TRANSCRIPT

CCaLC© PVC Manual (V2.0)
July 2011
CCaLC PVC Manual
i
List of contents
1 System requirements............................................................................................... 1 1.1 Users of Excel 2003......................................................................................... 1 1.2 Users of Excel 2007/2010............................................................................... 1
2 Compatibility with CCaLC V1.1 and V2.0............................................................. 1 3 Tool development credits ........................................................................................ 2 4 Acknowledgements .................................................................................................. 2 5 Introduction................................................................................................................ 2 6 CCaLC PVC tool overview...................................................................................... 3 7 Carbon footprint estimation..................................................................................... 6
7.1 Defining system details ................................................................................... 6 7.2 Defining the production stage names ........................................................... 8 7.3 Defining raw materials ..................................................................................... 9 7.4 Defining transport ........................................................................................... 11 7.5 Defining the production stage....................................................................... 13
7.5.1 Defining energy use ............................................................................... 14 7.5.2 Defining land use change ..................................................................... 15 7.5.3 Defining direct emissions ...................................................................... 16 7.5.4 Defining packaging use ......................................................................... 17 7.5.5 Defining waste ........................................................................................ 18 7.5.6 Linking waste to raw materials ............................................................. 19 7.5.7 Defining production stage outputs ....................................................... 21
7.6 Defining the storage stage ............................................................................ 22 7.7 Defining the use stage................................................................................... 22
7.7.1 Defining appliance use .......................................................................... 23 7.7.2 Defining biogenic carbon storage/uptake in products ...................... 23 7.7.3 Defining carbon release from product disposal ................................. 25 7.7.4 Co-product systems: System expansion and allocation .................. 26
8 Viewing carbon footprint data and results .......................................................... 29 8.1 Numerical display ........................................................................................... 29 8.2 Graphical display ............................................................................................ 29
9 Modifying user carbon footprint databases ........................................................ 30 9.1 Creating a new user database item............................................................. 30 9.2 Modifying an existing user database item .................................................. 32 9.3 Deleting a user database item ..................................................................... 33
10 Carbon footprint data quality assessment ...................................................... 33 11 Loading, saving, deleting or starting a new carbon footprint study ............ 35
11.1 Loading an analysis ....................................................................................... 35 11.2 Saving an analysis ......................................................................................... 36 11.3 Starting a new study ...................................................................................... 36 11.4 Deleting an analysis....................................................................................... 36
12 Carbon footprint summary ................................................................................ 36 13 Data comparison ................................................................................................ 37 14 Sharing user-created studies and results between users............................ 39
14.1 Importing and exporting studies................................................................... 39

CCaLC PVC Manual
ii
14.2 Exporting comparisons .................................................................................. 40 14.3 Exporting graphs ............................................................................................ 40
15 Importing data sets............................................................................................. 40 15.1 Importing data using the CCaLC template ................................................. 40 15.2 Importing ILCD data....................................................................................... 41
16 Calculating water usage and water footprint.................................................. 43 16.1 Switching between water footprint and value added ................................ 43 16.2 Populating the water footprint data.............................................................. 43 16.3 Missing water data ......................................................................................... 45 16.4 Water usage graphs....................................................................................... 45
17 Calculating other environmental impacts ....................................................... 45 18 Calculating value added .................................................................................... 47 19 Case studies ....................................................................................................... 48 Appendix 1 – Methodology for caculating the carbon footprint of transport ......... 49 Appendix 2 – List of data sets in the CCaLC database ........................................... 51 Appendix 3 – List of data sets in the Ecoinvent database ..................................... 127 Appendix 4 – Data quality criteria .............................................................................. 251
A4.1 General about LCA data quality ............................................................... 251 A4.2 Data quality assessment in the CCaLC PVC tool.................................. 251
Appendix 5 – Water use and water footprint............................................................ 255

CCaLC PVC Manual
1
1 System requirements
The CCaLC PVC tool is an Excel-based application run by macros. It was designed and built using the English version of Microsoft Excel for Windows XP. The tool may not run properly on non-English operating systems or on older versions of Excel or Windows. CCaLC PVC is designed for use on PCs and is not suitable for use on Mac computers. If on opening the tool, a message appears “The file can be opened as read only”, then: click on ‘Read-only’ to open the file save the tool under a different name and continue using the tool. Please note that, depending on the speed of your computer, some operations may take longer time to complete. Normally, the hour-glass will indicate that the system is busy. If it appears that there is no response after clicking on an option or action-button or the cursor does not turn into the hour-glass, please wait a few moments as the system is busy and may take some time to complete the action. The tool will run faster in Excel 2003 than in Excel 2007.
1.1 Users of Excel 2003
In order for the CCaLC PVC macros to work correctly, the Excel security settings should be set to either Medium or Low. In Excel 2003, on opening the tool, click on 'Enable macros' when prompted.
1.2 Users of Excel 2007/2010
In order for the CCaLC PVC macros to work correctly, the Excel security settings should be set to either Medium or Low. In Excel 2007, on opening the tool, click on 'Security Warning - Options'and select 'Enable this content'. To see the CCaLC PVC menus in Excel 2007, click on the Add-ins tab on the main menu-bar. The menu items will be displayed on the left hand side of the main menu-bar. To be able to use the Share data menu option (Import and Export options), the default Save option for Excel files should be set as Excel 97-2003 Workbook (*.xls). This can be done by clicking on: Excel options; selecting Save; and chosing the file format: Excel 97-2003 Workbook (*.xls).
2 Compatibility with CCaLC V1.1 and V2.0
CCaLC PVC is fully compatible with CCaLC V1.1 and V2.0. To transfer studies from V1.1 or V2.0 to CCaLC PVC:
CCaLC PVC Manual
2
Save the study in V1.1 or V2.0 by choosing the menu option CF Study/Save CF study
Type the name of the study in the pop-up window and click OK Click on the menu option Share data/Export study and click in the pop-up window on
the study to be exported; the study will be saved in the directory chosen by the user Open the CCaLC PVC tool and click on the menu option Share data/Import study;
from the dialogue box that pops-up, select the file to be imported To view the study imported, click on PVC Study/Load study and then in the pop-up
dialogue box click on the radio-button User-defined where the imported study should be listed. Click on the study name and then on the OK button to load the study.
3 Tool development credits
CCaLC PVC was developed by a research group based at the University of Manchester and led by Professor Adisa Azapagic. The following researchers were involved in the project: David Amienyo (case studies); Haruna Gujba (case studies and databases); Harish Jeswani (case studies and databases); Anthony Morgan (software development); Namy Espinoza-Orias (case studies and databases); and Heinz Stichnothe (methodology and case studies). For further information visit www.ccalc.org.uk or contact: [email protected]
4 Acknowledgements
This tool has been developed as part of the EPSRC funded project “Improving Sustainability of PVC through Novel Materials, Processes and Life Cycle Methodologies” (EP/D505372/2). This funding is gratefully acknowledged. The support of the project partners is also gratefully acknowledged, in particular:
Ineos ChlorVinyls: Dr Jason Leadbitter and Roger Mottram; Loughborough University: Prof. Bryan Brooks, Prof. Marianne Gilbert and Dr
Noreen Thomas; ECOPLAS: Bob Bittlestone and Steve Smith; and Polyflor: Mike Minett and John Whitesmith.
5 Introduction
The CCaLC PVC tool focuses on PVC based processes and products. It allows quick and easy estimations of environmental impacts and value added along the supply chains. It takes a life cycle approach and it enables estimation of the following environmental impacts:
Carbon footprint (or Global warming potential); Water footprint; Acidification potential;
CCaLC PVC Manual
3
Eutrophication potential; Ozone layer depletion potential; Photochemical smog; and Human toxicity potential.
The tool has been developed with the following objectives in mind: to enable non-expert users to calculate the carbon footprint and other environmental
impacts quickly and easily while following internationally accepted LCA standards such as ISO 14044 and PAS2050;
to reduce the data collection effort by providing comprehensive databases; to help identify environmental hot-spots and improvement opportunities; and to enable trade offs between environmental impacts and economic costs.
6 CCaLC PVC tool overview
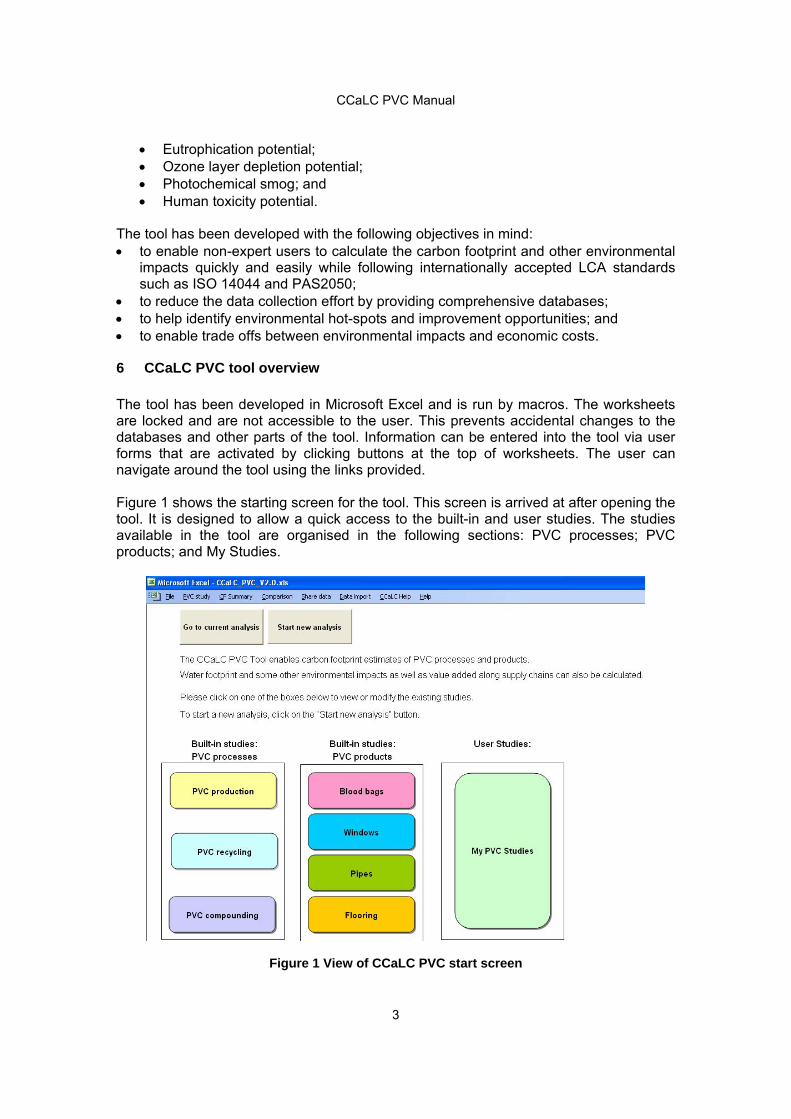
The tool has been developed in Microsoft Excel and is run by macros. The worksheets are locked and are not accessible to the user. This prevents accidental changes to the databases and other parts of the tool. Information can be entered into the tool via user forms that are activated by clicking buttons at the top of worksheets. The user can navigate around the tool using the links provided. Figure 1 shows the starting screen for the tool. This screen is arrived at after opening the tool. It is designed to allow a quick access to the built-in and user studies. The studies available in the tool are organised in the following sections: PVC processes; PVC products; and My Studies.
Figure 1 View of CCaLC PVC start screen
CCaLC PVC Manual
4
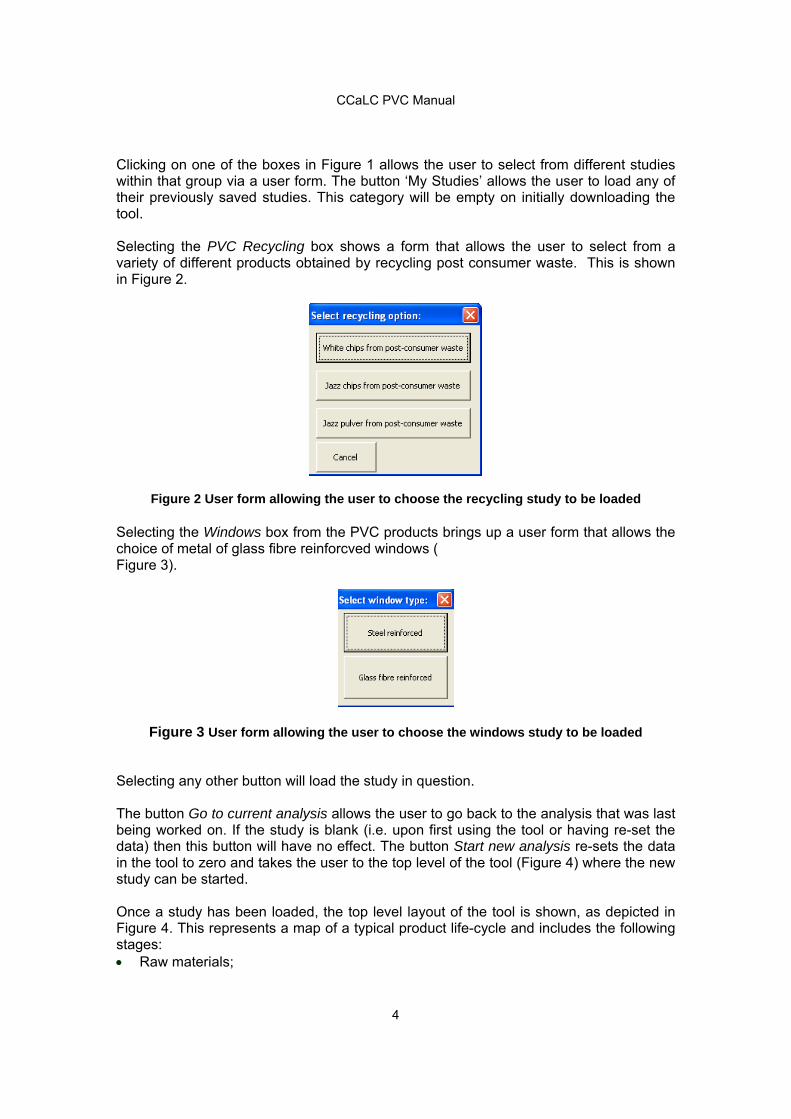
Clicking on one of the boxes in Figure 1 allows the user to select from different studies within that group via a user form. The button ‘My Studies’ allows the user to load any of their previously saved studies. This category will be empty on initially downloading the tool. Selecting the PVC Recycling box shows a form that allows the user to select from a variety of different products obtained by recycling post consumer waste. This is shown in Figure 2.
Figure 2 User form allowing the user to choose the recycling study to be loaded Selecting the Windows box from the PVC products brings up a user form that allows the choice of metal of glass fibre reinforcved windows ( Figure 3).
Figure 3 User form allowing the user to choose the windows study to be loaded
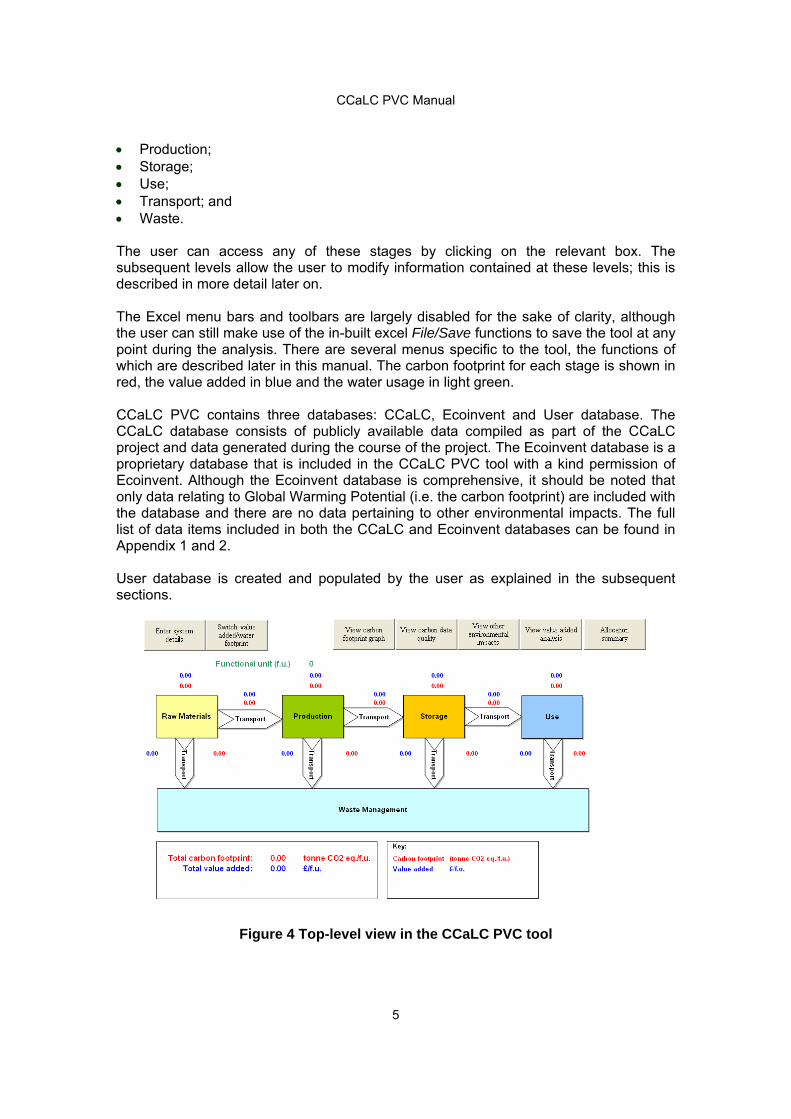
Selecting any other button will load the study in question. The button Go to current analysis allows the user to go back to the analysis that was last being worked on. If the study is blank (i.e. upon first using the tool or having re-set the data) then this button will have no effect. The button Start new analysis re-sets the data in the tool to zero and takes the user to the top level of the tool (Figure 4) where the new study can be started. Once a study has been loaded, the top level layout of the tool is shown, as depicted in Figure 4. This represents a map of a typical product life-cycle and includes the following stages: Raw materials;
CCaLC PVC Manual
5
Production; Storage; Use; Transport; and Waste. The user can access any of these stages by clicking on the relevant box. The subsequent levels allow the user to modify information contained at these levels; this is described in more detail later on. The Excel menu bars and toolbars are largely disabled for the sake of clarity, although the user can still make use of the in-built excel File/Save functions to save the tool at any point during the analysis. There are several menus specific to the tool, the functions of which are described later in this manual. The carbon footprint for each stage is shown in red, the value added in blue and the water usage in light green. CCaLC PVC contains three databases: CCaLC, Ecoinvent and User database. The CCaLC database consists of publicly available data compiled as part of the CCaLC project and data generated during the course of the project. The Ecoinvent database is a proprietary database that is included in the CCaLC PVC tool with a kind permission of Ecoinvent. Although the Ecoinvent database is comprehensive, it should be noted that only data relating to Global Warming Potential (i.e. the carbon footprint) are included with the database and there are no data pertaining to other environmental impacts. The full list of data items included in both the CCaLC and Ecoinvent databases can be found in Appendix 1 and 2. User database is created and populated by the user as explained in the subsequent sections.
Figure 4 Top-level view in the CCaLC PVC tool
CCaLC PVC Manual
6
7 Carbon footprint estimation
The carbon footprint of a system can be calculated in two main ways: by starting a new study from scratch, with all the information and data entered by the
user step by step or by using the built-in case studies, which can be loaded up via the menu option PVC
Study/Load PVC study and then modified according to the user specification. The following procedure illustrates how the carbon footprint can be estimated within the CCaLC PVC tool, starting a study from scratch. Instructions on how to modify an existing study can be found in section 11.
7.1 Defining system details
Clicking on the Enter System Details button at the top of the screen at the top level activates the System Details user form (Figure 5). In order to proceed with the analysis, the name of the study and a functional unit must be specified. The latter relates the function of the system to a common unit, e.g. mass, energy, etc. The amount specified for the functional unit will be the amount to which the carbon footprint will be attributed. Any unit may be used in the Unit window but it should be noted that all other data must be directly related to this unit. For example, if the functional unit is 3 kg of PVC flooring (as illustrated in Figure 5), then the data entered later on must directly correspond to the amounts of materials, energy etc. used to produce 3 kg of PVC flooring.

CCaLC PVC Manual
7
Figure 5 System Details user form The user can also define different mass (g, kg, tonne), energy (MJ, kWh, BTU), distance (km and miles) and monetary units (£, $, €). The default values are tonne, kWh, km and £, respectively. The units can be changed at any point during the analysis. If using a currency other than £, an exchange rate should be supplied in the textbox. This enables the user to switch between different currency types during the analysis. NB: The units are not linked to the unit of the Functional Unit defined by the user. The user should ensure that they are working in consistent units at all times. There are two ways to convert units. This can be specified in the section Units, which lists two options (see Figure 5): Change the units displayed and convert (default); and Change only the units displayed. The default setting on the form is to convert units. This means that,should the user change units during the analysis, all amounts already entered will be converted to the new specified unit(s). Should the user require that the amounts entered are left unchanged but only the units displayed are changed (e.g. in the event that data were entered in the wrong units), then the second options should be selected. Other information on this form is related to the age and source of data, date of conducting the study and the author – however, these are not compulsory but may be useful for transparency and record keeping.
CCaLC PVC Manual
8
The system details can then be updated by clicking on the OK button, after which the whole system is updated. This takes a short while to complete.
7.2 Defining the production stage names
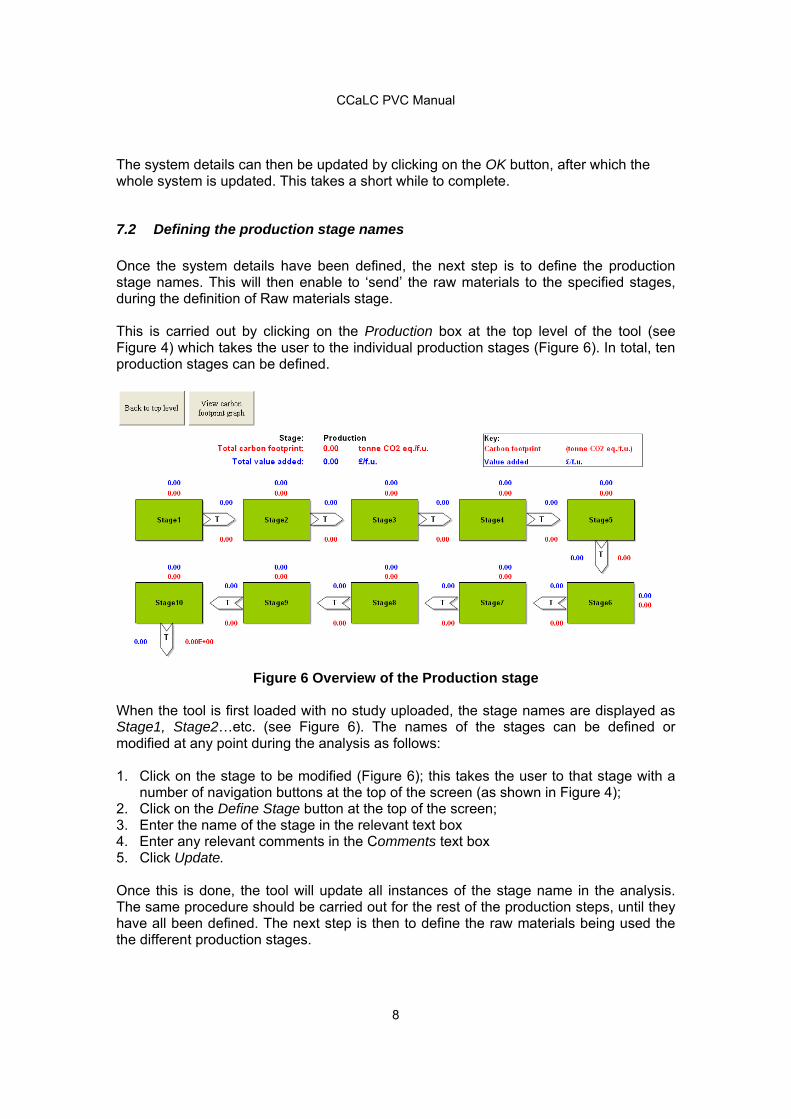
Once the system details have been defined, the next step is to define the production stage names. This will then enable to ‘send’ the raw materials to the specified stages, during the definition of Raw materials stage. This is carried out by clicking on the Production box at the top level of the tool (see Figure 4) which takes the user to the individual production stages (Figure 6). In total, ten production stages can be defined.
Figure 6 Overview of the Production stage
When the tool is first loaded with no study uploaded, the stage names are displayed as Stage1, Stage2…etc. (see Figure 6). The names of the stages can be defined or modified at any point during the analysis as follows: 1. Click on the stage to be modified (Figure 6); this takes the user to that stage with a
number of navigation buttons at the top of the screen (as shown in Figure 4); 2. Click on the Define Stage button at the top of the screen; 3. Enter the name of the stage in the relevant text box 4. Enter any relevant comments in the Comments text box 5. Click Update. Once this is done, the tool will update all instances of the stage name in the analysis. The same procedure should be carried out for the rest of the production steps, until they have all been defined. The next step is then to define the raw materials being used the the different production stages.
CCaLC PVC Manual
9
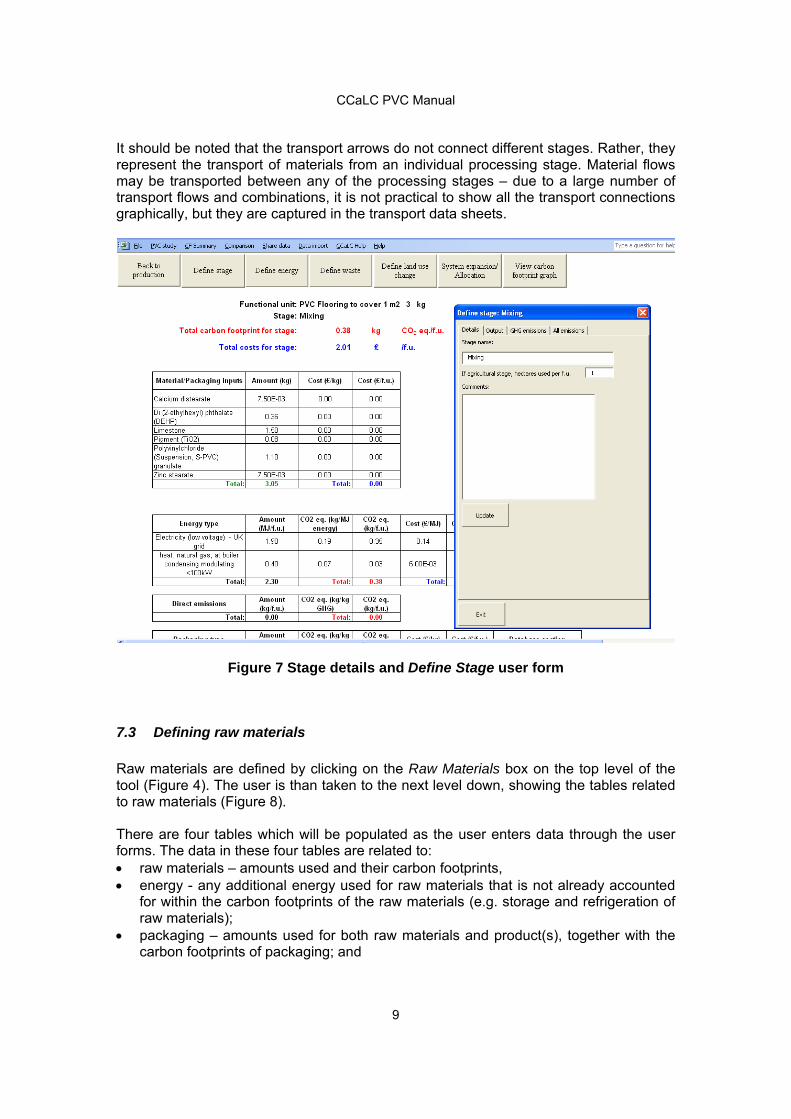
It should be noted that the transport arrows do not connect different stages. Rather, they represent the transport of materials from an individual processing stage. Material flows may be transported between any of the processing stages – due to a large number of transport flows and combinations, it is not practical to show all the transport connections graphically, but they are captured in the transport data sheets.
Figure 7 Stage details and Define Stage user form
7.3 Defining raw materials
Raw materials are defined by clicking on the Raw Materials box on the top level of the tool (Figure 4). The user is than taken to the next level down, showing the tables related to raw materials (Figure 8). There are four tables which will be populated as the user enters data through the user forms. The data in these four tables are related to: raw materials – amounts used and their carbon footprints, energy - any additional energy used for raw materials that is not already accounted
for within the carbon footprints of the raw materials (e.g. storage and refrigeration of raw materials);
packaging – amounts used for both raw materials and product(s), together with the carbon footprints of packaging; and

CCaLC PVC Manual
10
waste from raw materials and the carbon footprints related to waste management (e.g. due to spillage or perishable nature of raw materials).
The amount of each of these can be modified by clicking on the appropriate button at the top of the screen. The carbon footprint data are also specified here, either via the databases available or by entering user carbon footprint data. To add a raw material to the analysis:
1. Click on the Define Materials button (Figure 8) 2. Select the appropriate database to use (CCaLC, Ecoinvent) 3. From the first drop-down list, select type of raw material (e.g. agricultural inputs,
construction materials etc.) 4. Select the required material from the next drop-down list 5. Select the required production stage from the second drop-down list where the raw
material will be sent 6. Add the amount of material per functional unit in the textbox (Note: agricultural
materials are defined in mass per hectare of land) 7. Select the data quality for the amount used (high, medium, low) to indicate how
confident you are in the figure used [see Appendix 3 for a description of how the data quality is calculated for the system]
8. Add any comments that are appropriate to this instance of material use (this is optional but is recommended as a reminder for future uses)
9. Add the cost of the raw material, per unit mass, if needed 10. Click the Update button. The Raw material table on the screen will be updated to show the material name, the amount used, the carbon footprint associated with it and its destination. The database section from which the data have been selected is also shown in the tables.

CCaLC PVC Manual
11
Figure 8 Raw materials stage with the Define raw materials user form Other materials can be added in the same way. If a new material needs to be added to the database, then this can be done through the Modify Database tab. This is discussed in more detail in section 9. The total carbon footprint for the Raw materials stage can be seen at the top of the screen in red. The costs incurred during the stage are shown in blue and if in the Water usage view, the water footprint will be shown in green. The amount of material being used can be updated at any time or can be removed completely from the analysis by selecting that raw material in the Define materials user form and setting its amount to zero.
7.4 Defining transport
Transport links can be defined when there is a material to be transported between stages. To define transport (Figure 9): 1. Click on the relevant transport box either at the top level or in the Production stage;
this takes the user to the transport stage screen 2. Click the Define Transport button 3. A user form appears asking the user to select materials to be transported 4. Select the required material from the list box
CCaLC PVC Manual
12
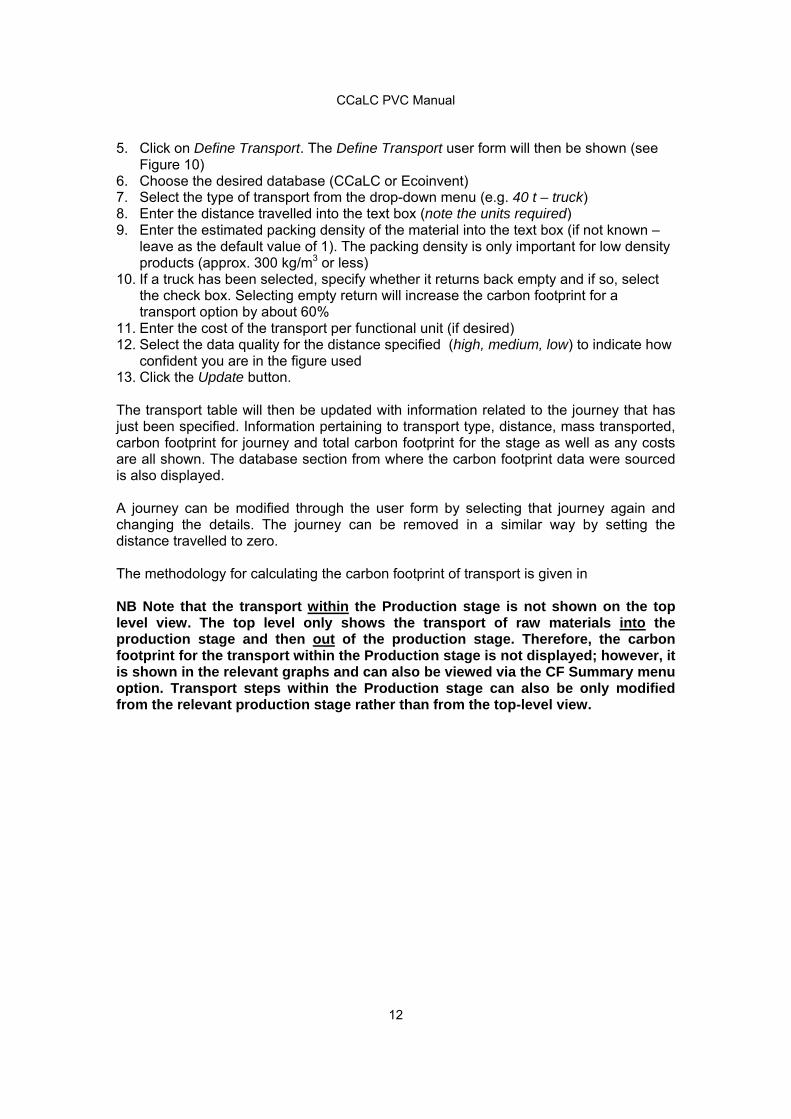
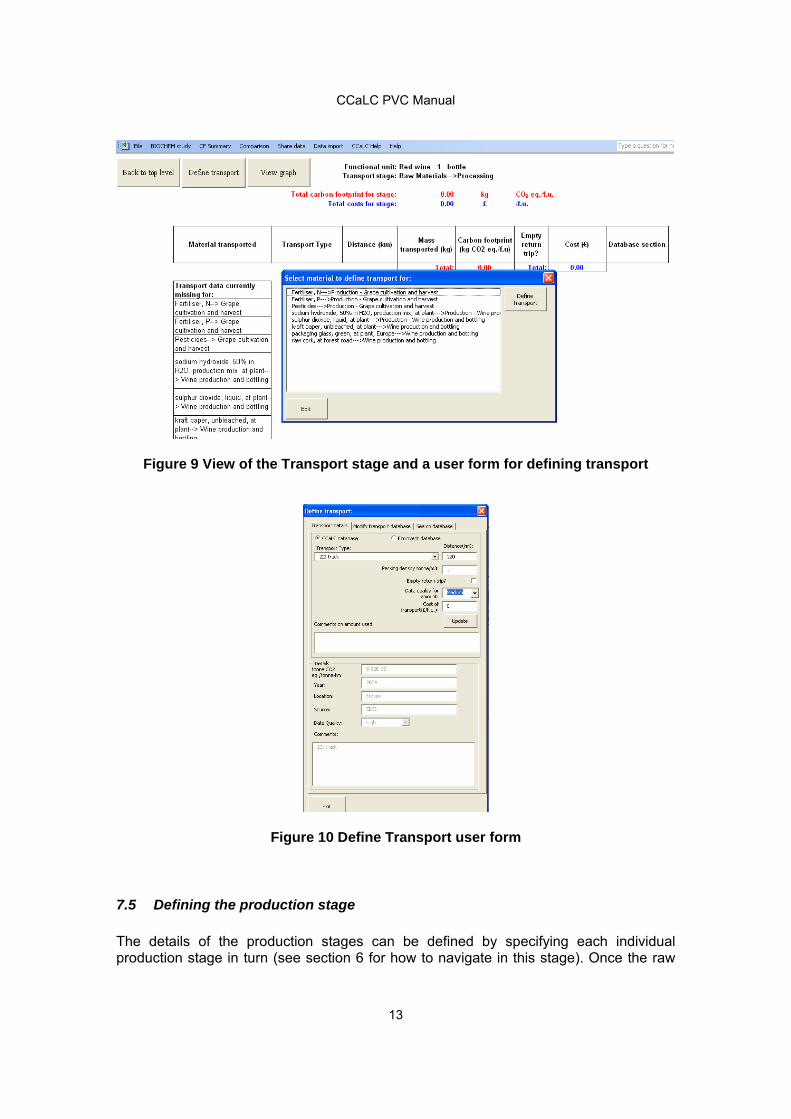
5. Click on Define Transport. The Define Transport user form will then be shown (see Figure 10)
6. Choose the desired database (CCaLC or Ecoinvent) 7. Select the type of transport from the drop-down menu (e.g. 40 t – truck) 8. Enter the distance travelled into the text box (note the units required) 9. Enter the estimated packing density of the material into the text box (if not known –
leave as the default value of 1). The packing density is only important for low density products (approx. 300 kg/m3 or less)
10. If a truck has been selected, specify whether it returns back empty and if so, select the check box. Selecting empty return will increase the carbon footprint for a transport option by about 60%
11. Enter the cost of the transport per functional unit (if desired) 12. Select the data quality for the distance specified (high, medium, low) to indicate how
confident you are in the figure used 13. Click the Update button. The transport table will then be updated with information related to the journey that has just been specified. Information pertaining to transport type, distance, mass transported, carbon footprint for journey and total carbon footprint for the stage as well as any costs are all shown. The database section from where the carbon footprint data were sourced is also displayed. A journey can be modified through the user form by selecting that journey again and changing the details. The journey can be removed in a similar way by setting the distance travelled to zero. The methodology for calculating the carbon footprint of transport is given in NB Note that the transport within the Production stage is not shown on the top level view. The top level only shows the transport of raw materials into the production stage and then out of the production stage. Therefore, the carbon footprint for the transport within the Production stage is not displayed; however, it is shown in the relevant graphs and can also be viewed via the CF Summary menu option. Transport steps within the Production stage can also be only modified from the relevant production stage rather than from the top-level view.
CCaLC PVC Manual
13
Figure 9 View of the Transport stage and a user form for defining transport
Figure 10 Define Transport user form
7.5 Defining the production stage
The details of the production stages can be defined by specifying each individual production stage in turn (see section 6 for how to navigate in this stage). Once the raw
CCaLC PVC Manual
14
materials have been defined, they will be showing as inputs into the production stages where they are being used. This can be viewed by clicking on Production box from the top level of the tool and then clicking on the individual stage of interest. This takes the user to the tables which show the raw materials input to that stage (see Figure 7).
7.5.1 Defining energy use
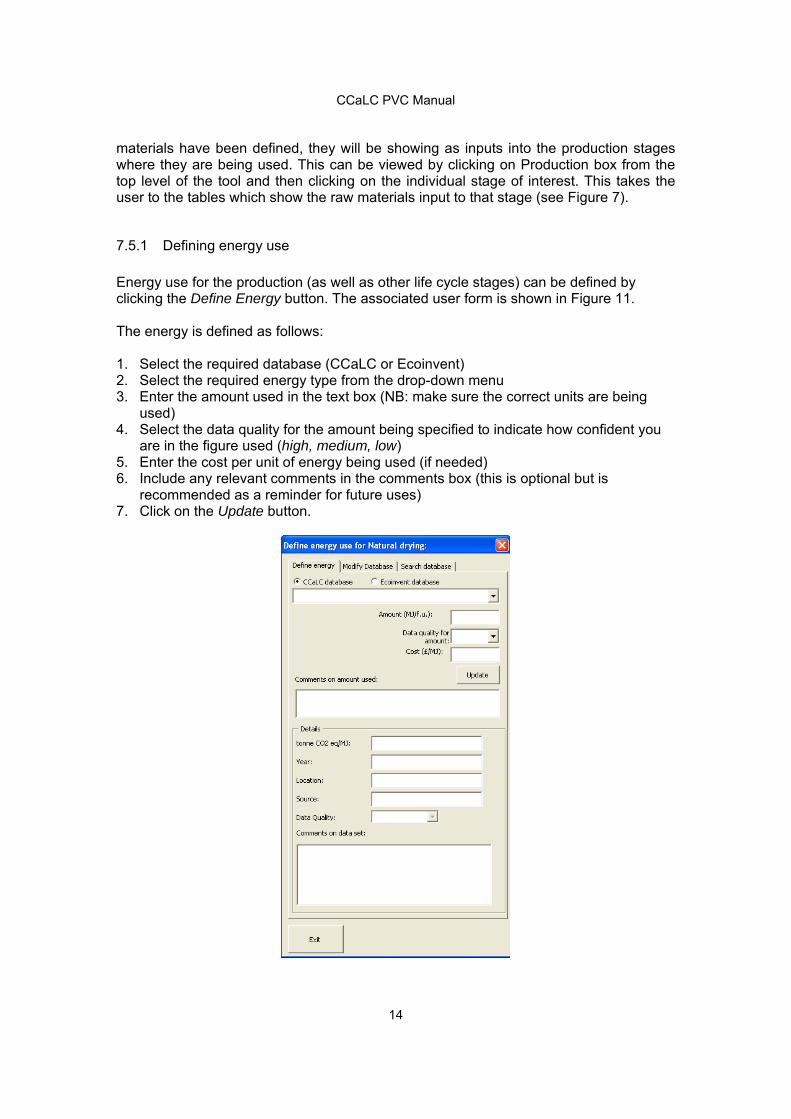
Energy use for the production (as well as other life cycle stages) can be defined by clicking the Define Energy button. The associated user form is shown in Figure 11. The energy is defined as follows: 1. Select the required database (CCaLC or Ecoinvent) 2. Select the required energy type from the drop-down menu 3. Enter the amount used in the text box (NB: make sure the correct units are being
used) 4. Select the data quality for the amount being specified to indicate how confident you
are in the figure used (high, medium, low) 5. Enter the cost per unit of energy being used (if needed) 6. Include any relevant comments in the comments box (this is optional but is
recommended as a reminder for future uses) 7. Click on the Update button.

CCaLC PVC Manual
15
Figure 11 Define Energy user form The energy table on the screen will be updated with the relevant information and the carbon footprint and associated cost shown. The database from where the data were selected is also displayed.
7.5.2 Defining land use change
If following the PAS2050 guidelines, land use change relevant to the functional unit that has occurred during the last 20 years must be accounted for in the analysis. Land use change can be defined in any of the production stages as well as in the raw materials stage. The procedure is as follows (see Figure 12): 1. Click the Define land use change button in any Production or Raw material stage 2. From the drop-down list, select the country where the land use change has taken
place 3. From the drop-down list, select the current land use (annual cropland, perennial
cropland) 4. From the drop-down list, select the previous land use (forest land, grassland) 5. Enter the area of land changed per functional unit (hectares) 6. Enter the time the land is used for per functional unit (years or pro-rata months
expressed in years) 7. Select the data quality for steps 5 and 6 above (high, medium, low) to indicate how
confident you are in the figures used 8. Click Update.
Figure 12 Land use change form
CCaLC PVC Manual
16
7.5.3 Defining direct emissions
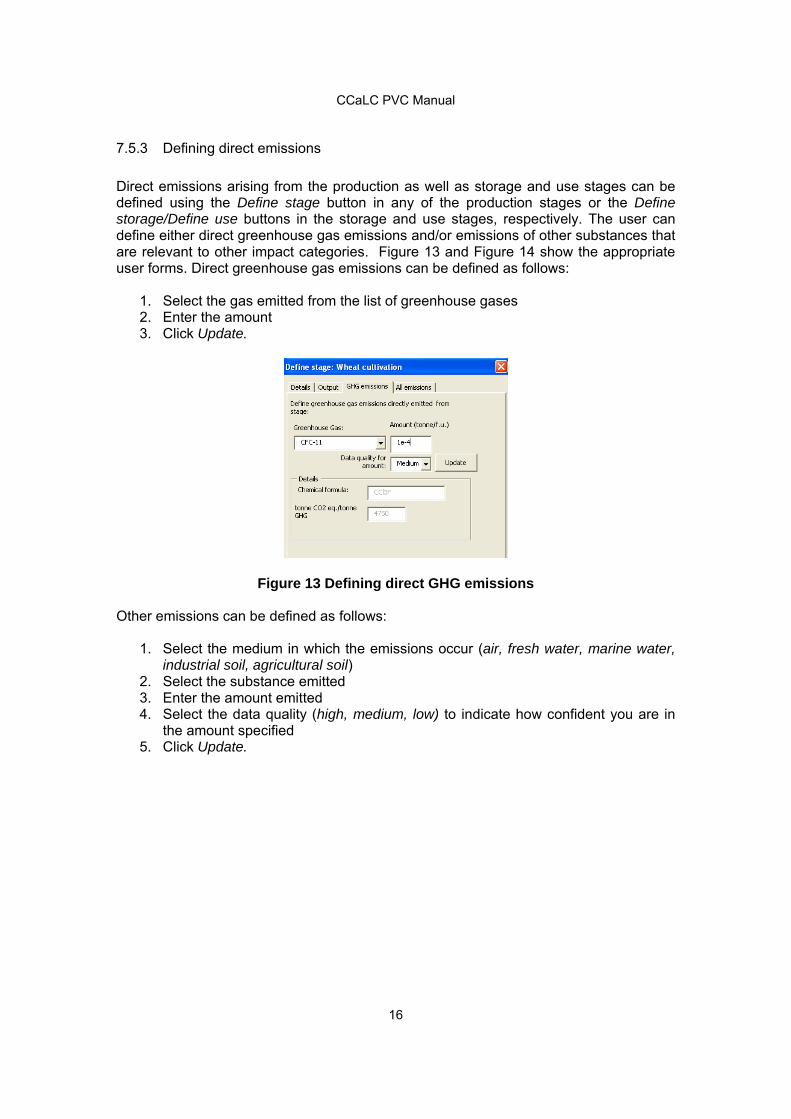
Direct emissions arising from the production as well as storage and use stages can be defined using the Define stage button in any of the production stages or the Define storage/Define use buttons in the storage and use stages, respectively. The user can define either direct greenhouse gas emissions and/or emissions of other substances that are relevant to other impact categories. Figure 13 and Figure 14 show the appropriate user forms. Direct greenhouse gas emissions can be defined as follows:
1. Select the gas emitted from the list of greenhouse gases 2. Enter the amount 3. Click Update.
Figure 13 Defining direct GHG emissions Other emissions can be defined as follows:
1. Select the medium in which the emissions occur (air, fresh water, marine water, industrial soil, agricultural soil)
2. Select the substance emitted 3. Enter the amount emitted 4. Select the data quality (high, medium, low) to indicate how confident you are in
the amount specified 5. Click Update.

CCaLC PVC Manual
17
Figure 14 Defining other direct emissions
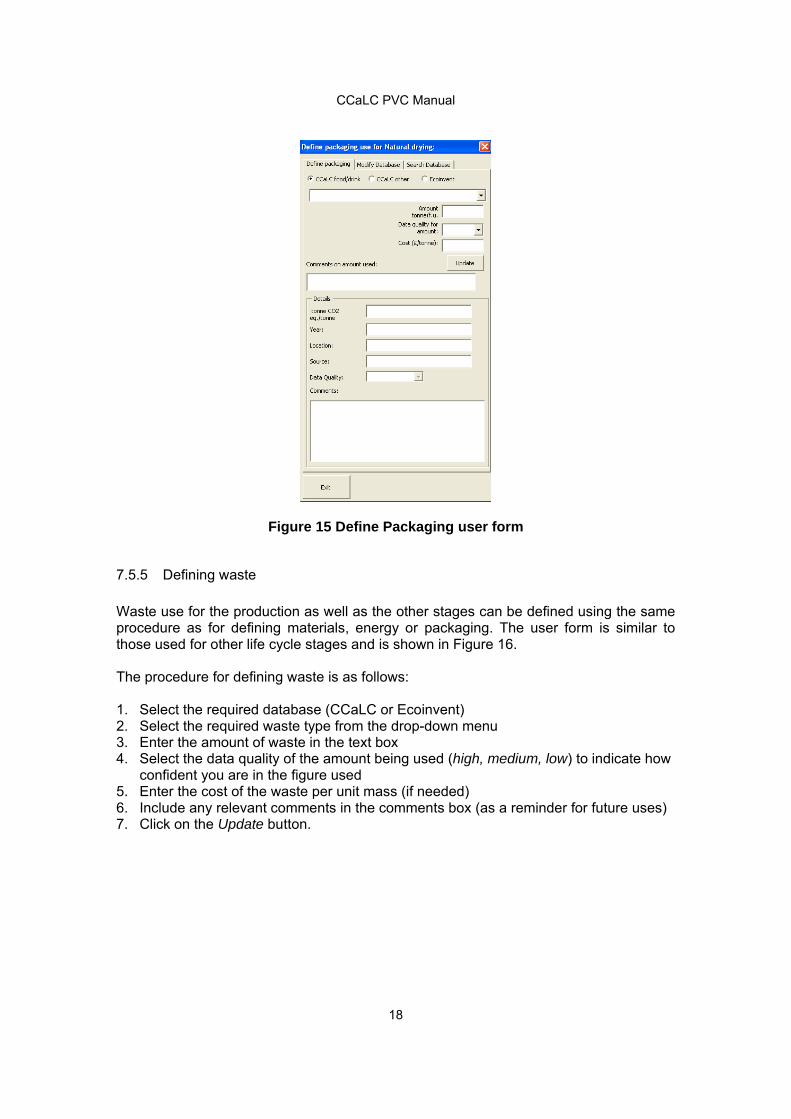
7.5.4 Defining packaging use
Packaging use for the production stage as well as any other stage can be defined by clicking the Define Packaging button. The associated user form is shown in Figure 15. Three databases exist for packaging: CCaLC food/drink, CCaLC other and Ecoinvent. Packaging can be defined as follows (Figure 15):
1. Select the required database (CCaLC food/drink; CCaLC other; Ecoinvent) 2. Select the required packaging type from the drop-down menu 3. Enter the amount used in the text box 4. Select the data quality of the amount being specified (high, medium, low) to
indicate how confident you are in the figure used 5. Enter the cost per unit of packaging (if needed) 6. Include any relevant comments in the comments box (as a reminder for any
future uses) 7. Click on the Update button.
The packaging table for the stage is then populated. Packaging types can be modified or removed from the analysis by selecting the packaging type and changing the details or setting the mass to zero, respectively.
CCaLC PVC Manual
18
Figure 15 Define Packaging user form
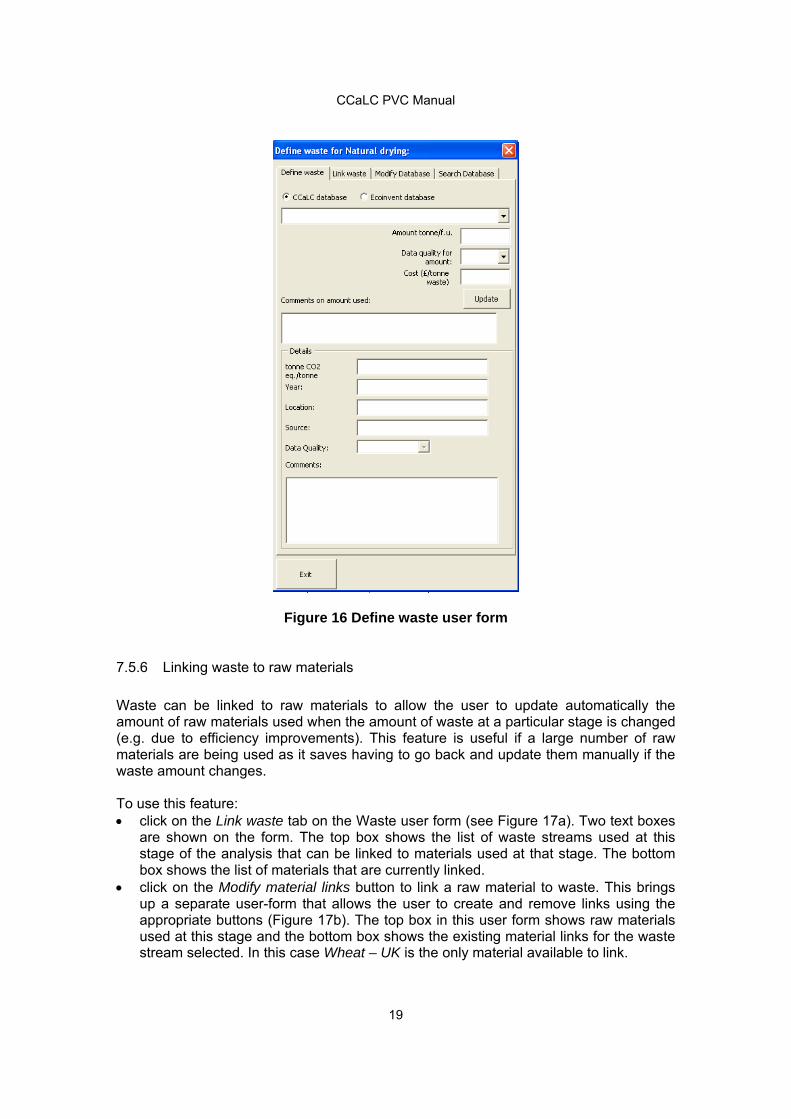
7.5.5 Defining waste
Waste use for the production as well as the other stages can be defined using the same procedure as for defining materials, energy or packaging. The user form is similar to those used for other life cycle stages and is shown in Figure 16. The procedure for defining waste is as follows: 1. Select the required database (CCaLC or Ecoinvent) 2. Select the required waste type from the drop-down menu 3. Enter the amount of waste in the text box 4. Select the data quality of the amount being used (high, medium, low) to indicate how
confident you are in the figure used 5. Enter the cost of the waste per unit mass (if needed) 6. Include any relevant comments in the comments box (as a reminder for future uses) 7. Click on the Update button.
CCaLC PVC Manual
19
Figure 16 Define waste user form
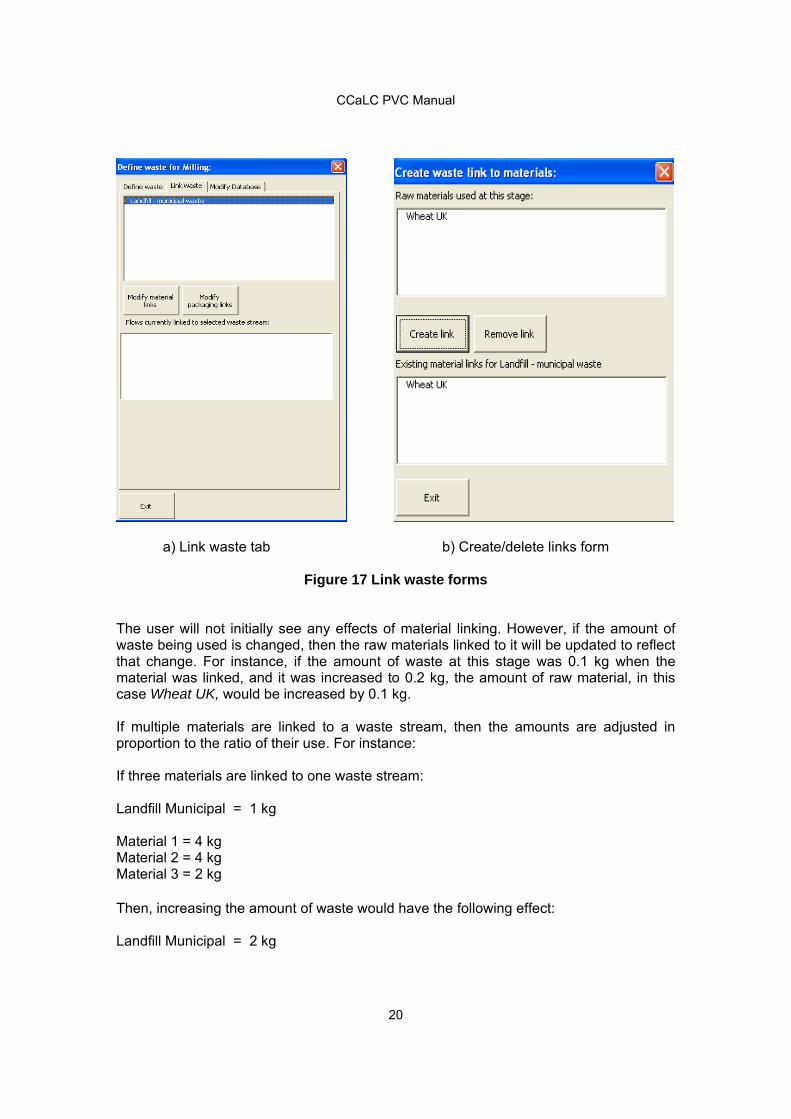
7.5.6 Linking waste to raw materials
Waste can be linked to raw materials to allow the user to update automatically the amount of raw materials used when the amount of waste at a particular stage is changed (e.g. due to efficiency improvements). This feature is useful if a large number of raw materials are being used as it saves having to go back and update them manually if the waste amount changes. To use this feature: click on the Link waste tab on the Waste user form (see Figure 17a). Two text boxes
are shown on the form. The top box shows the list of waste streams used at this stage of the analysis that can be linked to materials used at that stage. The bottom box shows the list of materials that are currently linked.
click on the Modify material links button to link a raw material to waste. This brings up a separate user-form that allows the user to create and remove links using the appropriate buttons (Figure 17b). The top box in this user form shows raw materials used at this stage and the bottom box shows the existing material links for the waste stream selected. In this case Wheat – UK is the only material available to link.
CCaLC PVC Manual
20
a) Link waste tab b) Create/delete links form
Figure 17 Link waste forms The user will not initially see any effects of material linking. However, if the amount of waste being used is changed, then the raw materials linked to it will be updated to reflect that change. For instance, if the amount of waste at this stage was 0.1 kg when the material was linked, and it was increased to 0.2 kg, the amount of raw material, in this case Wheat UK, would be increased by 0.1 kg. If multiple materials are linked to a waste stream, then the amounts are adjusted in proportion to the ratio of their use. For instance: If three materials are linked to one waste stream: Landfill Municipal = 1 kg Material 1 = 4 kg Material 2 = 4 kg Material 3 = 2 kg Then, increasing the amount of waste would have the following effect: Landfill Municipal = 2 kg
CCaLC PVC Manual
21
Material 1 = 4 kg + 0.4 kg = 4.4 kg Material 2 = 4 kg + 0.4 kg = 4.4 kg Material 3 = 2 kg + 0.2 kg = 2.2 kg
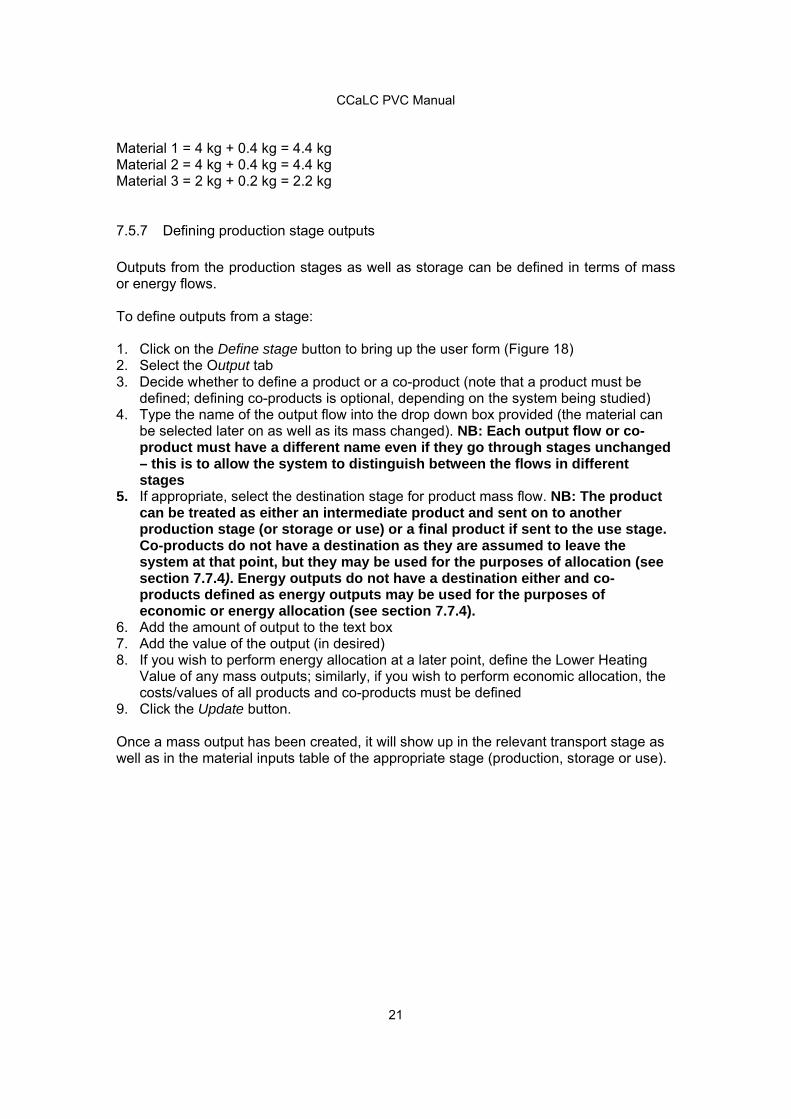
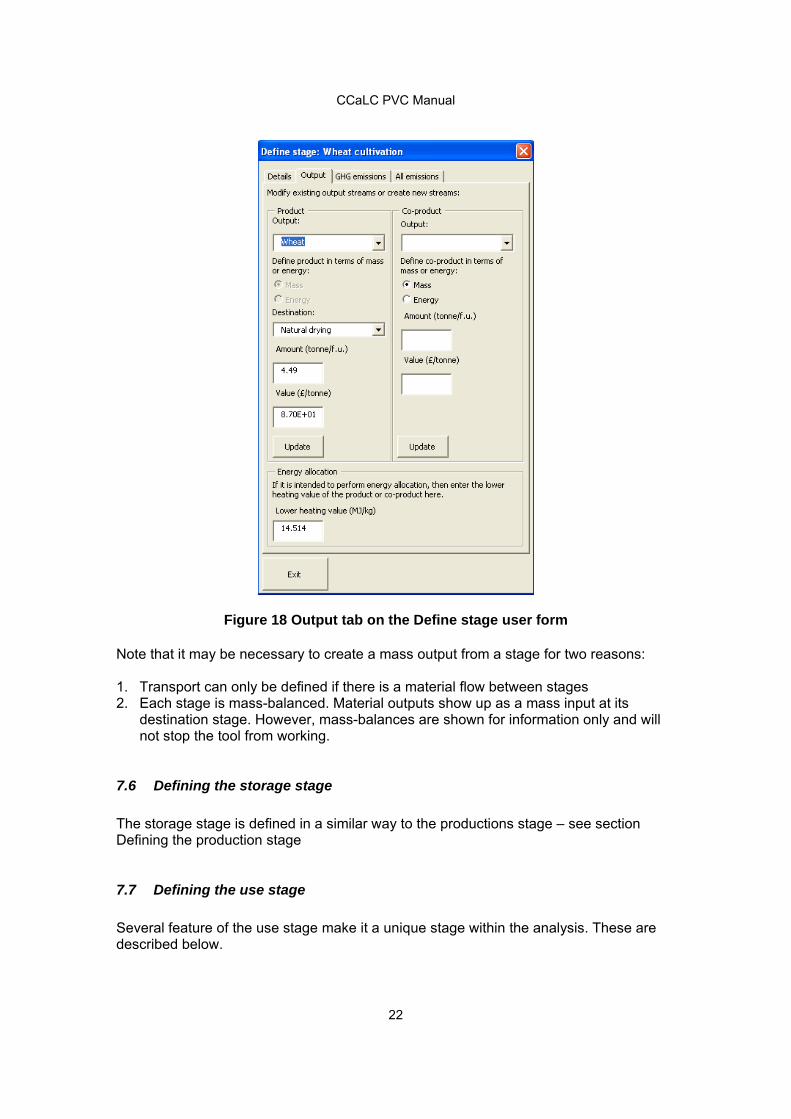
7.5.7 Defining production stage outputs
Outputs from the production stages as well as storage can be defined in terms of mass or energy flows.
To define outputs from a stage: 1. Click on the Define stage button to bring up the user form (Figure 18) 2. Select the Output tab 3. Decide whether to define a product or a co-product (note that a product must be
defined; defining co-products is optional, depending on the system being studied) 4. Type the name of the output flow into the drop down box provided (the material can
be selected later on as well as its mass changed). NB: Each output flow or co-product must have a different name even if they go through stages unchanged – this is to allow the system to distinguish between the flows in different stages
5. If appropriate, select the destination stage for product mass flow. NB: The product can be treated as either an intermediate product and sent on to another production stage (or storage or use) or a final product if sent to the use stage. Co-products do not have a destination as they are assumed to leave the system at that point, but they may be used for the purposes of allocation (see section 7.7.4). Energy outputs do not have a destination either and co-products defined as energy outputs may be used for the purposes of economic or energy allocation (see section 7.7.4).
6. Add the amount of output to the text box 7. Add the value of the output (in desired) 8. If you wish to perform energy allocation at a later point, define the Lower Heating
Value of any mass outputs; similarly, if you wish to perform economic allocation, the costs/values of all products and co-products must be defined
9. Click the Update button. Once a mass output has been created, it will show up in the relevant transport stage as well as in the material inputs table of the appropriate stage (production, storage or use).
CCaLC PVC Manual
22
Figure 18 Output tab on the Define stage user form
Note that it may be necessary to create a mass output from a stage for two reasons: 1. Transport can only be defined if there is a material flow between stages 2. Each stage is mass-balanced. Material outputs show up as a mass input at its
destination stage. However, mass-balances are shown for information only and will not stop the tool from working.
7.6 Defining the storage stage
The storage stage is defined in a similar way to the productions stage – see section Defining the production stage
7.7 Defining the use stage
Several feature of the use stage make it a unique stage within the analysis. These are described below.
CCaLC PVC Manual
23
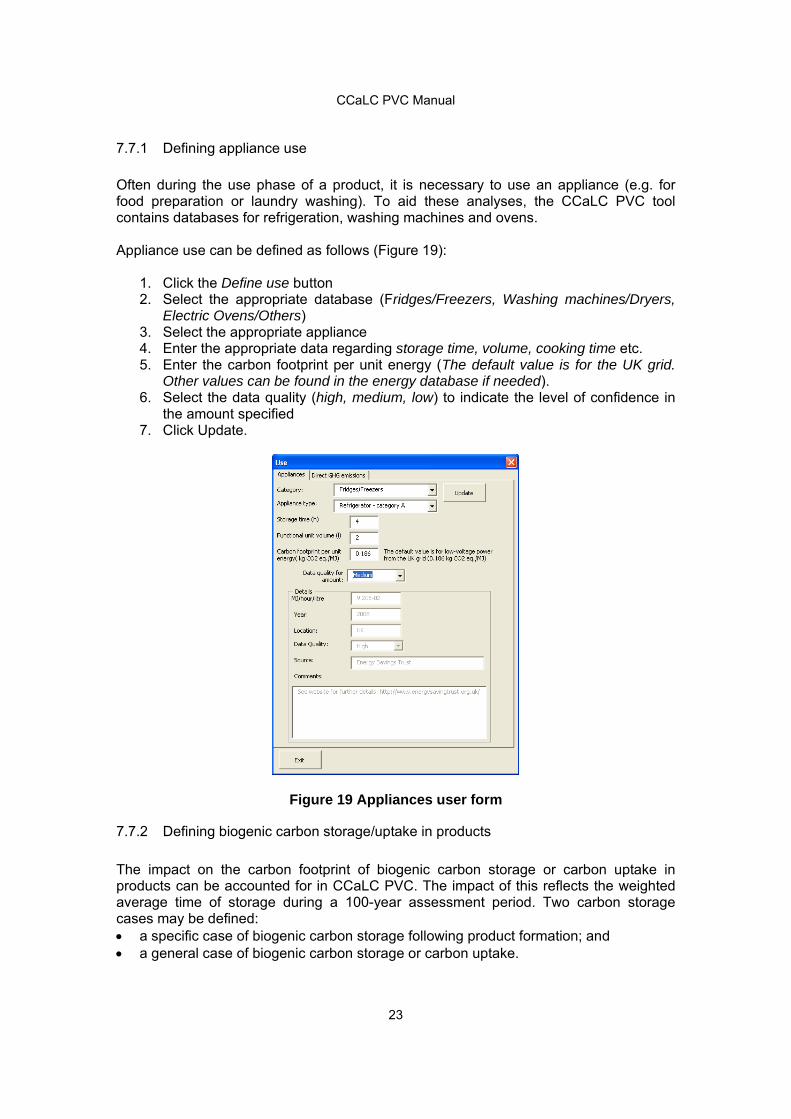
7.7.1 Defining appliance use
Often during the use phase of a product, it is necessary to use an appliance (e.g. for food preparation or laundry washing). To aid these analyses, the CCaLC PVC tool contains databases for refrigeration, washing machines and ovens. Appliance use can be defined as follows (Figure 19):
1. Click the Define use button 2. Select the appropriate database (Fridges/Freezers, Washing machines/Dryers,
Electric Ovens/Others) 3. Select the appropriate appliance 4. Enter the appropriate data regarding storage time, volume, cooking time etc. 5. Enter the carbon footprint per unit energy (The default value is for the UK grid.
Other values can be found in the energy database if needed). 6. Select the data quality (high, medium, low) to indicate the level of confidence in
the amount specified 7. Click Update.
Figure 19 Appliances user form
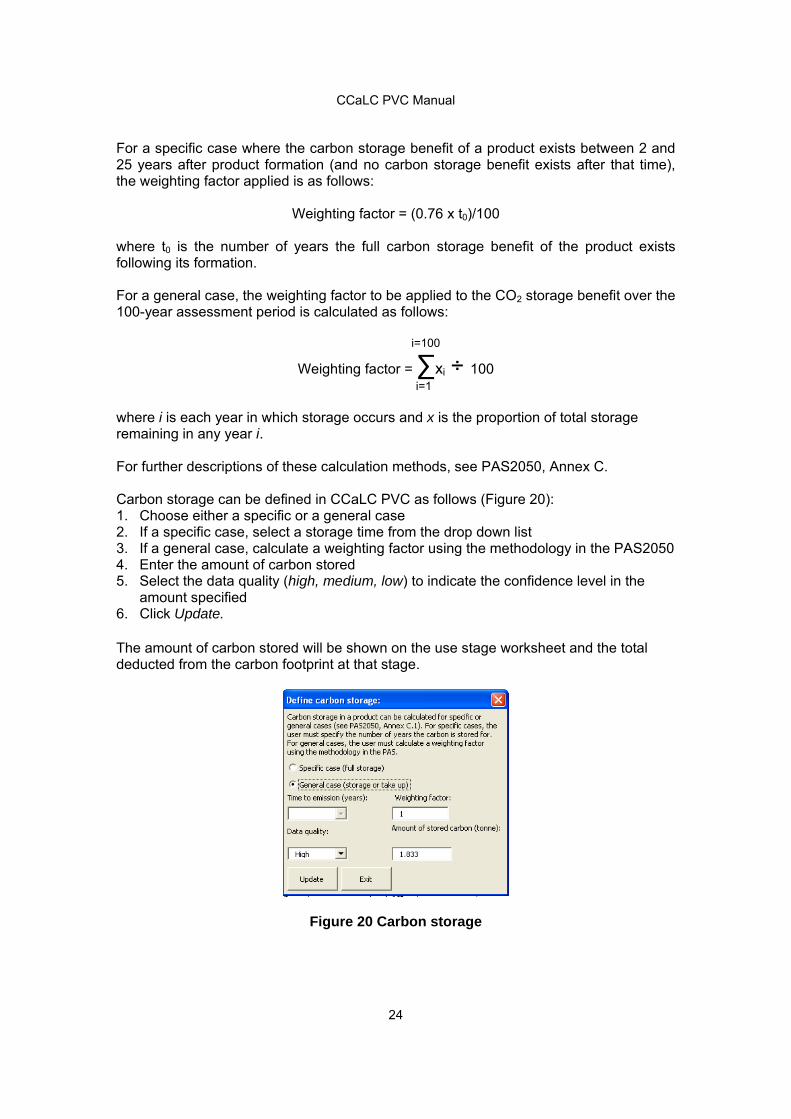
7.7.2 Defining biogenic carbon storage/uptake in products
The impact on the carbon footprint of biogenic carbon storage or carbon uptake in products can be accounted for in CCaLC PVC. The impact of this reflects the weighted average time of storage during a 100-year assessment period. Two carbon storage cases may be defined: a specific case of biogenic carbon storage following product formation; and a general case of biogenic carbon storage or carbon uptake.
CCaLC PVC Manual
24
For a specific case where the carbon storage benefit of a product exists between 2 and 25 years after product formation (and no carbon storage benefit exists after that time), the weighting factor applied is as follows:
Weighting factor = (0.76 x t0)/100
where t0 is the number of years the full carbon storage benefit of the product exists following its formation. For a general case, the weighting factor to be applied to the CO2 storage benefit over the 100-year assessment period is calculated as follows: i=100
Weighting factor = ∑xi ÷ 100 i=1 where i is each year in which storage occurs and x is the proportion of total storage remaining in any year i. For further descriptions of these calculation methods, see PAS2050, Annex C. Carbon storage can be defined in CCaLC PVC as follows (Figure 20): 1. Choose either a specific or a general case 2. If a specific case, select a storage time from the drop down list 3. If a general case, calculate a weighting factor using the methodology in the PAS2050 4. Enter the amount of carbon stored 5. Select the data quality (high, medium, low) to indicate the confidence level in the
amount specified 6. Click Update. The amount of carbon stored will be shown on the use stage worksheet and the total deducted from the carbon footprint at that stage.
Figure 20 Carbon storage

CCaLC PVC Manual
25
7.7.3 Defining carbon release from product disposal
In cases where the disposal of a product is not immediate, it may be appropriate to apply a weighting factor to the carbon footprint of the waste stream in order to account for carbon stored up to that point. Two end-of-life scenarios can be defined: a specific case for a delayed single release and a general case for a delayed release. For a specific case where the disposal of a product occurs between 2 and 25 years after product formation, the weighting factor applied is as follows:
Weighting factor = (100- (0.76 x t0))/100
where t0 is the number of years between product formation and the single release of emissions. For a general case where releases may not occur singularly, the methodology used is as follows: i=100
Weighting factor = ∑xi (100-i) ÷ 100 i=1
where i is each year in which emissions occur and x is the proportion of total emissions occurring in any one year i. The methodology for this calculation is given in PAS2050 Annex B. The product’s end of life can be defined as follows (Figure 21):
1. Choose whether a specific or general case is being modelled 2. If a specific case, select the time to disposal from the drop down list 3. If a general case, calculate a weighting factor as described in PAS2050 and enter
it in the text box 4. Select the appropriate disposal waste stream from the drop down list 5. Enter the product mass 6. Enter the cost of disposal per unit mass (if needed) 7. Select the data quality (high, medium, low) to indicate the confidence level for the
amount specified 8. Click Update.

CCaLC PVC Manual
26
Figure 21 End of product’s life user form
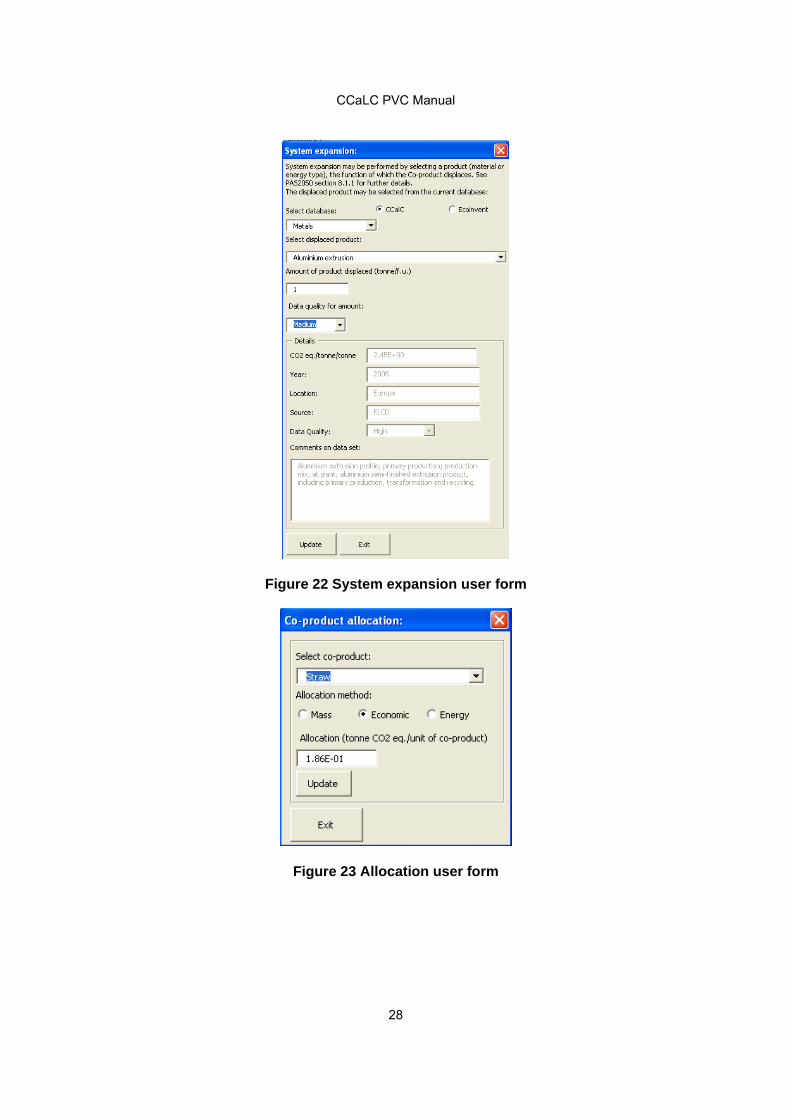
7.7.4 Co-product systems: System expansion and allocation
In co-product systems it is often necessary to calculate the carbon footprint of each co-product. Within CCaLC, this can be carried out in two ways: by system expansion and by allocation (mass, energy and economic basis). NB: The results of either system expansion or allocation are shown at the top level and not at individual stages. To perform system expansion or allocation, click the System expansion/allocation button at a Production stage where co-products are produced. It is then possible to choose between system expansion and allocation by clicking on the appropriate buttons at the top of the tool. Note that, to be able to perform either operation, the co-products must first be defined (by clicking on Define stage and specifying co-product details; see section 7.5.7).
CCaLC PVC Manual
27
System expansion System expansion is performed by selecting a product/service that the co-product can substitute. The CCaLC PVC tool then subtracts the carbon footprint of this substitute product/service from the carbon footprint of the whole system. System expansion is carried out in CCaLC PVC as follows:
1. Click on the Perform system expansion button 2. Select a co-product from the dialogue box that pops up; this bring up the System
Expansion user form shown in Figure 22 3. Select a material or energy from one of the available databases 4. Enter the amount of product 5. Select the data quality (high, medium, low) to indicate the confidence level for the
amount specified 6. Click Update.
The data tables are then updated and the amount to be subtracted from the carbon footprint of the whole system is shown. Allocation Allocation can be carried out using mass, energy or economic basis. Allocation can be carried out in CCaLC PVC as follows:
1. Click on the Perform allocation button; this brings up the user form shown in Figure 23
2. Select either Mass, Energy or Economic radio button (NB: PAS2050 requires economic allocation)
3. Click Update (NB: allocation can be deleted by setting the value in the Allocation text box to zero)
The allocation tables are then updated to show the allocation results. Note that to perform economic or energy allocation, all cost and energy data should be specified for all the products and co-products.
CCaLC PVC Manual
28
Figure 22 System expansion user form
Figure 23 Allocation user form
CCaLC PVC Manual
29
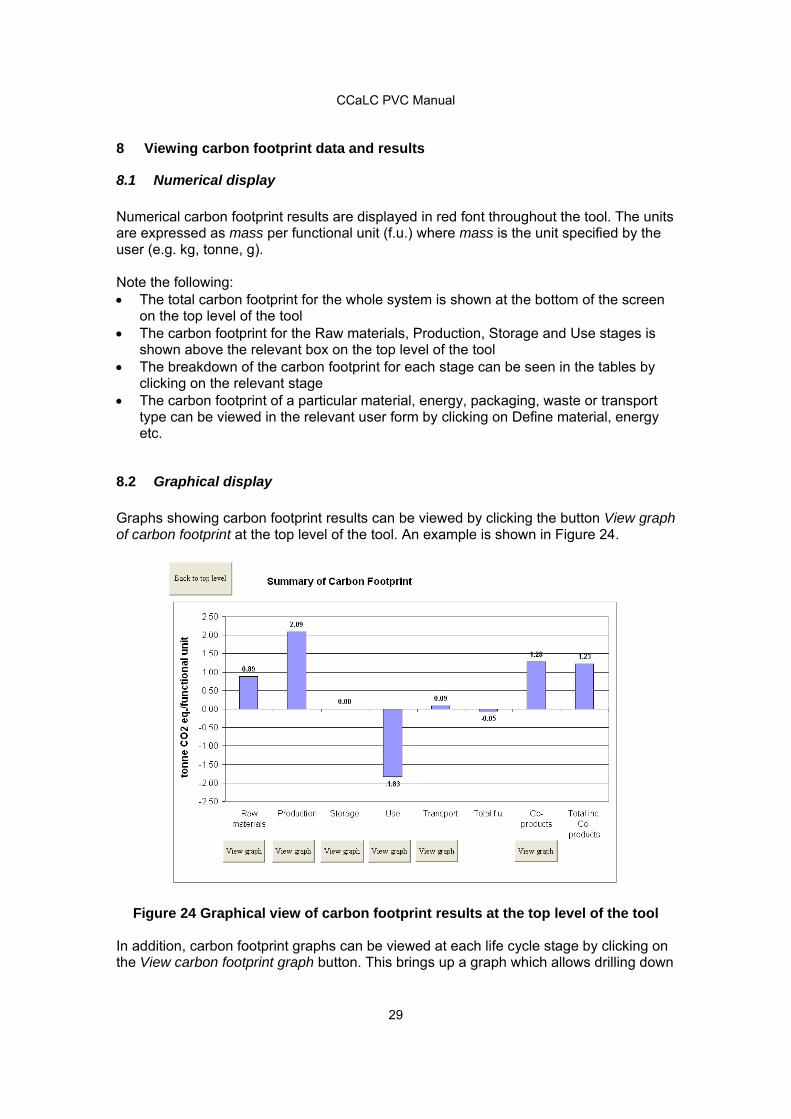
8 Viewing carbon footprint data and results
8.1 Numerical display
Numerical carbon footprint results are displayed in red font throughout the tool. The units are expressed as mass per functional unit (f.u.) where mass is the unit specified by the user (e.g. kg, tonne, g). Note the following: The total carbon footprint for the whole system is shown at the bottom of the screen
on the top level of the tool The carbon footprint for the Raw materials, Production, Storage and Use stages is
shown above the relevant box on the top level of the tool The breakdown of the carbon footprint for each stage can be seen in the tables by
clicking on the relevant stage The carbon footprint of a particular material, energy, packaging, waste or transport
type can be viewed in the relevant user form by clicking on Define material, energy etc.
8.2 Graphical display
Graphs showing carbon footprint results can be viewed by clicking the button View graph of carbon footprint at the top level of the tool. An example is shown in Figure 24.
Figure 24 Graphical view of carbon footprint results at the top level of the tool In addition, carbon footprint graphs can be viewed at each life cycle stage by clicking on the View carbon footprint graph button. This brings up a graph which allows drilling down

CCaLC PVC Manual
30
to see the breakdown of each material, production stage, etc. (see the example for the Production stage in Figure 25).
Figure 25 Carbon footprint for production stages
9 Modifying user carbon footprint databases
User-defined data can be added, modified and deleted, as explained below. The databases that come with the tool cannot be deleted or changed in any way.
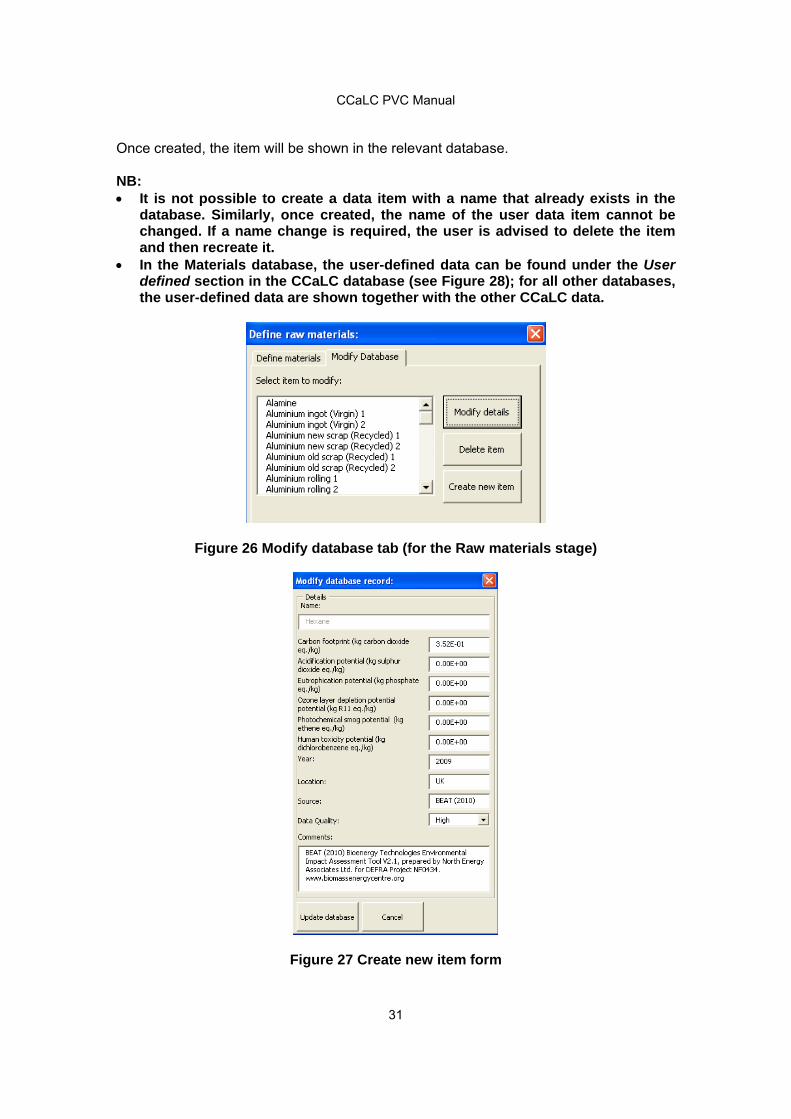
9.1 Creating a new user database item
User data can be added in the CCaLC PVC tool. This can be done for any of the following: materials, energy, packaging, waste and transport. New data item can be created by: Selecting the Modify Database tab on the appropriate user form (see Figure 26 for a
Raw materials example – to get there, click on the Raw Materials box from the top level view, then on the Define Materials button at the top of the screen and then on the Modify Database tab; the same applies for all other databases, i.e. energy, waste, packaging and transport)
Clicking the Create new item button Filling in the appropriate fields in the resulting user form (see Figure 27).
CCaLC PVC Manual
31
Once created, the item will be shown in the relevant database. NB: It is not possible to create a data item with a name that already exists in the
database. Similarly, once created, the name of the user data item cannot be changed. If a name change is required, the user is advised to delete the item and then recreate it.
In the Materials database, the user-defined data can be found under the User defined section in the CCaLC database (see Figure 28); for all other databases, the user-defined data are shown together with the other CCaLC data.
Figure 26 Modify database tab (for the Raw materials stage)
Figure 27 Create new item form

CCaLC PVC Manual
32
Figure 28 Materials database: user-defined data items are placed in the User defined section in the CCaLC database
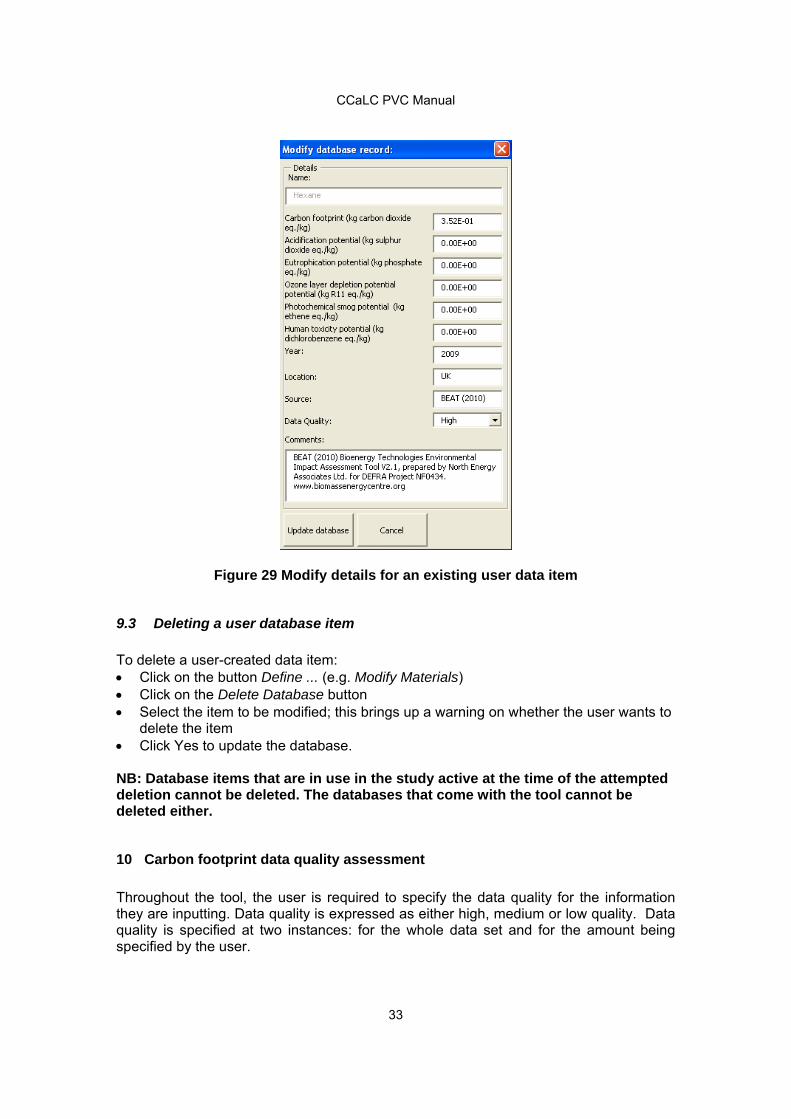
9.2 Modifying an existing user database item
To modify a user-created data item: Click on the button Define ... (e.g. Modify Materials) Click on the Modify Database button; this will show a list of the existing user-created
items Select the item to be modified and then click on the Modify Details button; this brings
up the form with the details for that item (see Figure 29) Change the details as desired and then press the Update database button.
CCaLC PVC Manual
33
Figure 29 Modify details for an existing user data item
9.3 Deleting a user database item
To delete a user-created data item: Click on the button Define ... (e.g. Modify Materials) Click on the Delete Database button Select the item to be modified; this brings up a warning on whether the user wants to
delete the item Click Yes to update the database. NB: Database items that are in use in the study active at the time of the attempted deletion cannot be deleted. The databases that come with the tool cannot be deleted either.
10 Carbon footprint data quality assessment
Throughout the tool, the user is required to specify the data quality for the information they are inputting. Data quality is expressed as either high, medium or low quality. Data quality is specified at two instances: for the whole data set and for the amount being specified by the user.

CCaLC PVC Manual
34
The data quality for a data set is specified when the data set is created and is not subject to alteration during the analysis. Data quality of the data sets supplied within the tool will largely be high, as they are from trusted sources. For user defined data sets, the user can specify the data quality when they create it. The data quality for the amount of material, energy, travel distance etc. specified by the user has to be specified each time the user adds a new datum to the analysis. The user is required to make a judgment as to how reliable they believe their data are. For instance, if a transport distance is known then the user might choose high quality of data; however, if the distance is only guessed at or generic, then the data quality for this datum will be low. The overall data quality assessment is made by weighting each data point by its contribution to the total carbon footprint. A full description of the data quality model is given in Appendix 3. To examine the data quality for the analysis, click on the View data quality assessment button the top level of the tool. This brings up the data quality assessment sheet (Figure 30) which shows the overall data quality for the analysis as well as the data quality for each individual stage.
Figure 30 (Partial) View of data quality assessment screen

CCaLC PVC Manual
35
11 Loading, saving, deleting or starting a new carbon footprint study
An existing carbon footprinting study can be loaded, saved or deleted by using the PVC study menu option from the CCaLC menu at the top of the screen (see Figure 31). A new study can also be started by using the same menu option.
Figure 31 CF study menu options
11.1 Loading an analysis
An existing analysis can be loaded by selecting Load PVC Study from the PVC Study menu option. The user can then select from a range of either CCaLC or user-defined studies (see Figure 32). Note that user-defined studies can be found under the User-defined section. NB: Loading a PVC study will overwrite any data currently being used. Therefore, users are advised to save their analysis before loading another one.
Figure 32 Load CF study user form
CCaLC PVC Manual
36
11.2 Saving an analysis
To save a study, select Save PVC Study from the PVC Study menu option and type a (unique) name into the drop down box. Alternatively, select a previously saved study to overwrite it with new results. Note: Saving a study saves the specific analysis but it does not save the CCaLC PVC tool. To do the latter, use the Excel File/Save menu. It is recommended that the user saves the CCaLC PVC tool on a regular basis under a different name/names to avoid losing data.
11.3 Starting a new study
A new study can be started by selecting the Start new PVC study item from the PVC Study menu. The user will be asked if they are sure they want to start a new study and will then be given the option of saving the existing study first.
11.4 Deleting an analysis
To delete an existing analysis, select the Delete PVC study optin from the PVC Study menu. This brings up the list of the user-defined studies that can deleted. Select the appropriate study and click the Delete button to delet the study. If no studies are listed, that means that there are no user-defined studies and therefore the deletion is not possible.
12 Carbon footprint summary
A summary of the results of a carbon footprint study can be obtained via the CF Summary/View CF Summary menu option. This takes the user to a page with tables and graphs that summarise the analysis (Figure 33). The summary can be printed out by selecting Print summary from the CF Summary menu option. An inventory of the materials, energy and packaging used in the analysis can be viewed by selecting the CF Summary/View Inventory menu. A partial view of the tables is shown in Figure 34.

CCaLC PVC Manual
37
Figure 33 Partial view of the summary screen
Figure 34 Partial view of the inventory screen
13 Data comparison
Up to four analyses can be compared for either carbon footprint, water footprint, other environmental impacts or value added. This can be carried out via the Comparison
CCaLC PVC Manual
38
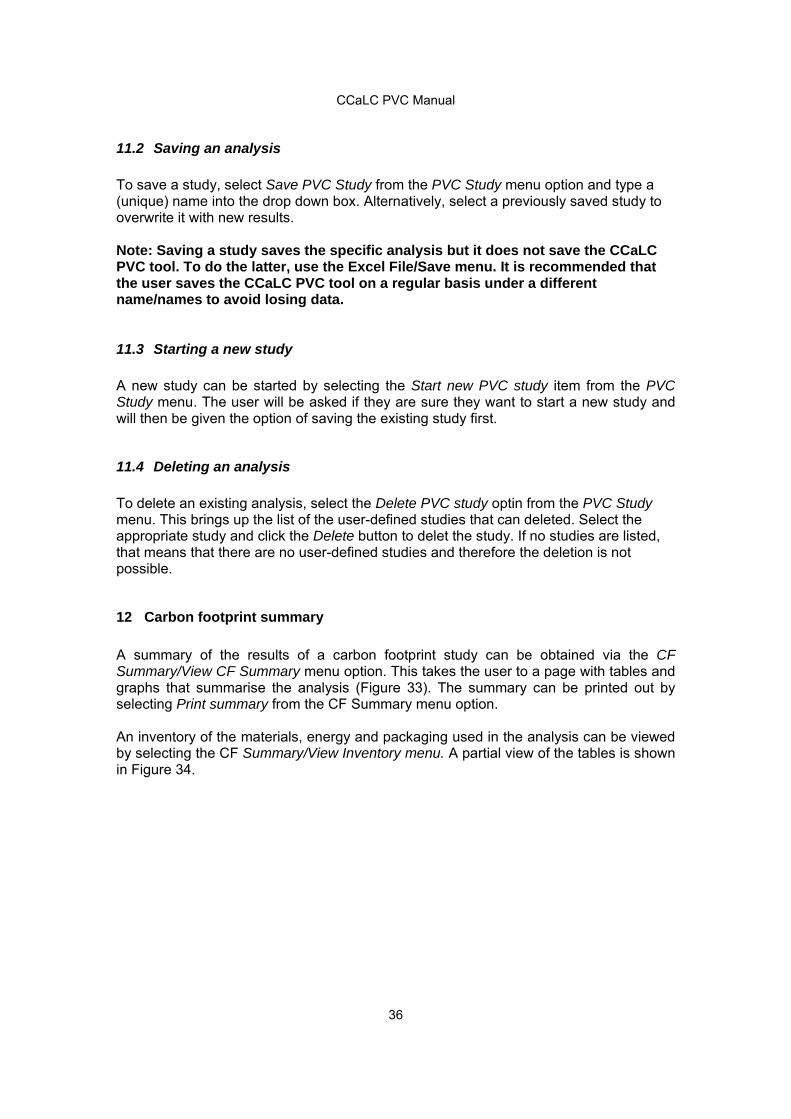
menu and choosing the appropriate option (carbon footprint, water footprint, all impacts or value added). To compare the alternative/different systems: Click the Comparison/Appropriate option from the CCaLC PVC menu option; this
takes the user to the appropriate tables (see Figure 35 showing an example for the carbon footprint)
If any data are shown in the tables that are not part of the desidered comparison analysis, click the Clear data button; this will delete any previous data that the user does not wish to consier
Click the Add current analysis button, to add the data from the current analysis; if there were no other data in the tables, the data will be added to the first table; otherwise, the data will be added to the next empty table
If all four tables are populated by data, the user will be given a choice as to where they would like new comparison added.
A graphical comparison of the data in the tables can be viewed by clicking on the View graphs button at the top of the sheet.
Figure 35 (Partial) View of the carbon footprint comparison sheet
CCaLC PVC Manual
39
14 Sharing user-created studies and results between users
14.1 Importing and exporting studies
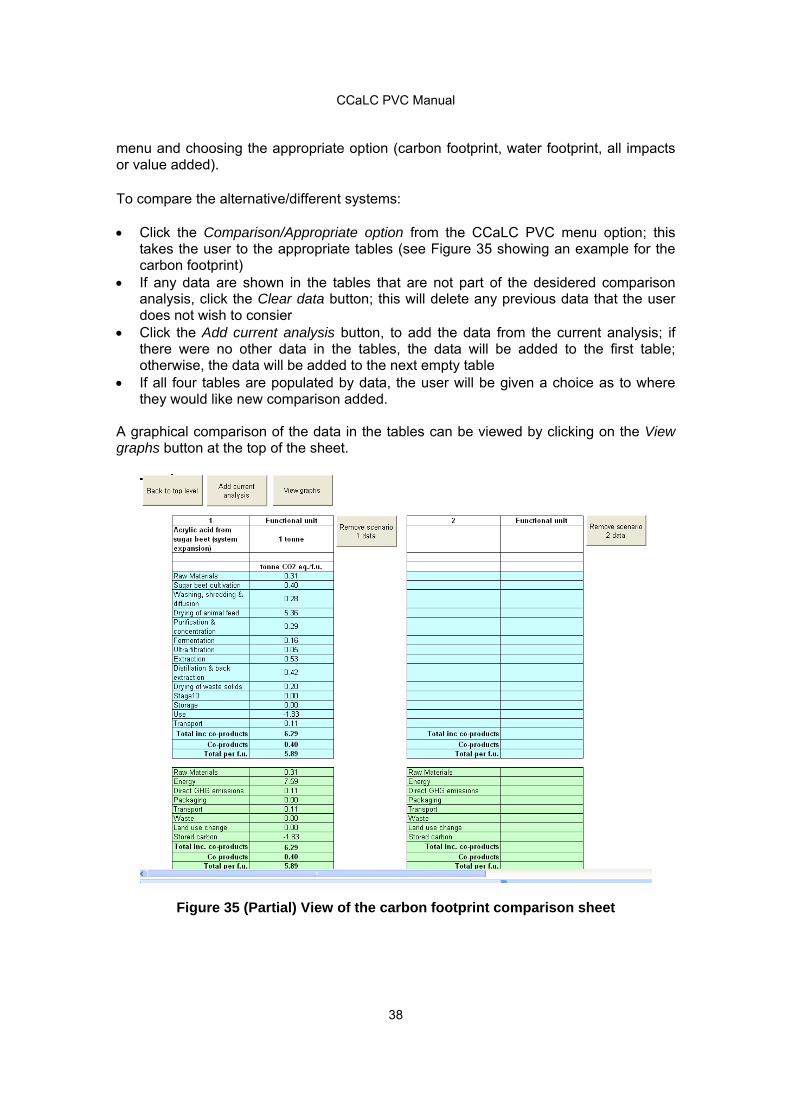
User-created studies can be shared between users via the CCaLC menu option Share data. To export studies, choose the Export study option. This brings up a form shown (Figure 36) that allows the user to select an analysis that has already been saved and then export it. This action will create a new excel file entitled CCaLC_xxxx.xls which the user can then re-name as required and then save. This file contains all of the analyses exported, along with any additions made to the database.
Figure 36 Study export form To import a previously created analysis, the user should select the Share data/Import menu item. This then prompts the user to locate the previously created CCaLC_xxxx.xls (or user renamed) file in the desired directory. Once this is done, the user will be offered a choice of saved analyses to import (Figure 37). Multiple analyses can be selected at the same time.
Figure 37 Data import form

CCaLC PVC Manual
40
Selecting one or more analyses from the list and clicking Import data will import the selected analyses to the tool and update the database accordingly. Imported analyses can then be examined using the Load PVC Study menu item (section 11.1). Note: In order for any of the import/export functions to work, the CCaLC PVC tool must be the first and only excel workbook open. If this is not the case, the user will be prompted to close any other open excel files.
14.2 Exporting comparisons
Data from any comparisons made using the Compare menus can be exported using the Share data/Export comparisons menu. This creates a new workbook Comparison export.xls. This workbook contains all the comparison data as well as the appropriate graphs and can be modified by the user as any other Excel file.
14.3 Exporting graphs
Graphs from the analysis can be exported using the Share data/Export graphs menu. This creates a new workbook Graph_export.xls (which can be renaimed) which contains all the graphs from the analysis. This function enables the user to change the graphs and the related data as they wish.
15 Importing data sets
15.1 Importing data using the CCaLC template
The CCaLC data template can be used to import large amounts of data into the tool. It is more efficient than entering data individually through the user-forms. To import data via the CCaLC import template, click on the Data Import/CCaLC Template menu option at the top of the screen. This brings up the CCaLC template shown in Figure 38. The user has to enter into the template the relevant data for the data sets in question, including which section of the database it is destined for (e.g. material, energy etc.). Instructions for filling out the form correctly are shown at the top of the screen. Note that an entry must be completed (i.e. the cursor must be outside a cell) for the function buttons to work. Once the fields have been filled out correctly, the user should click the Import data button at the top of the screen. If any of the requisite fields are not filled out correctly, the user will receive a warning and the data will not be imported. Once imported, the data are then available for use in the tool. Data can be cleared from the table by clicking on the Clear data button.

CCaLC PVC Manual
41
Figure 38 (Partial) View of the CCaLC data template screen
15.2 Importing ILCD data
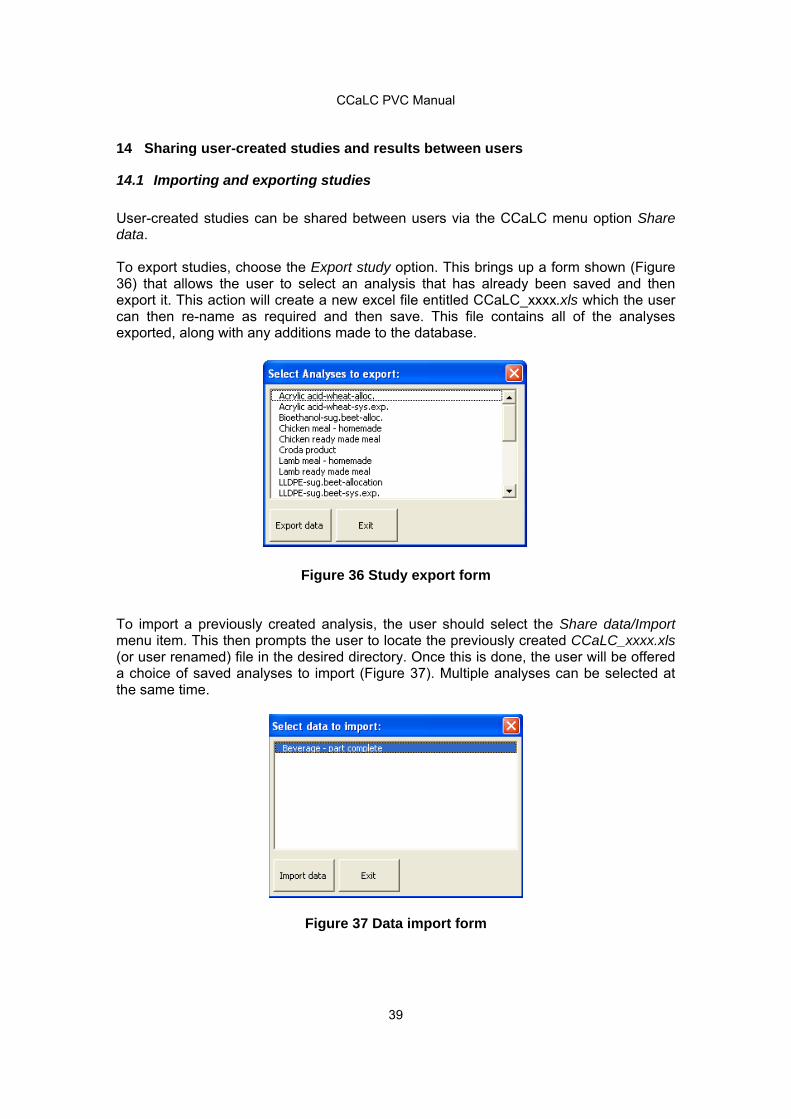
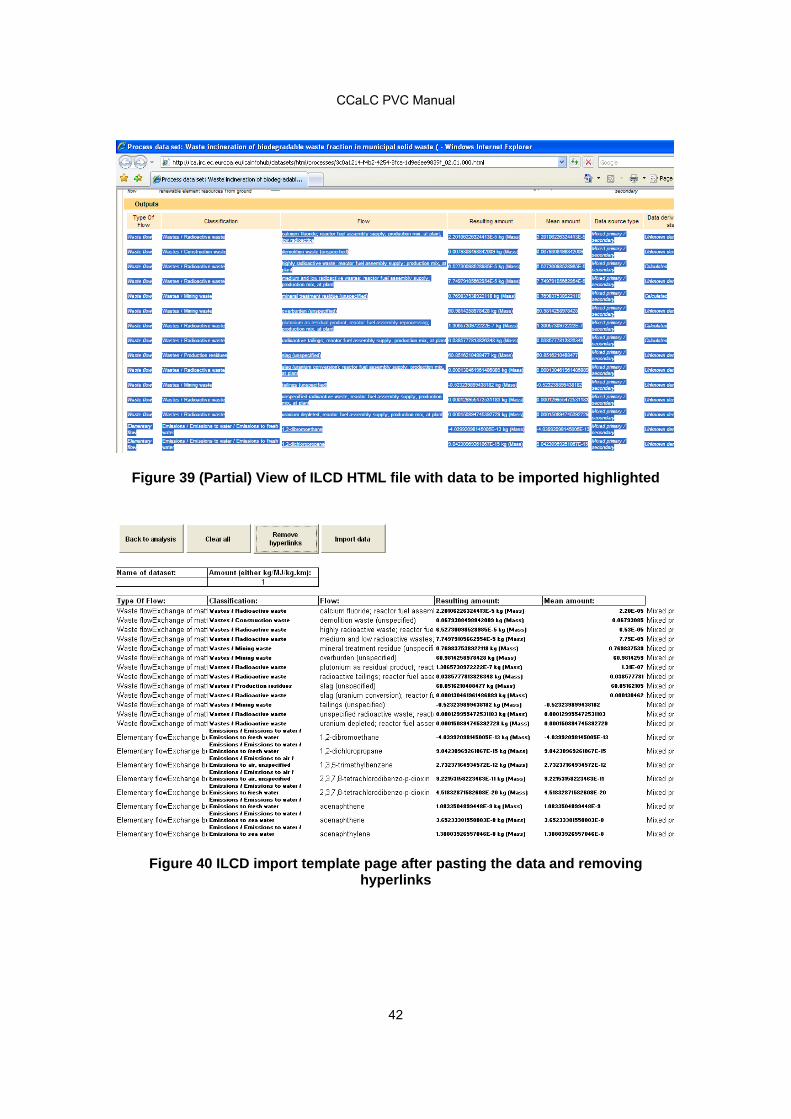
CCaLC contains all available data sets available within the International Life Cycle Database (ILCD) at the time of release of this version of the tool (April 2011). Further ILCD data, when available, can be imported by using the Data Import/ILCD menu option. This takes the user to the ILCD template import page where data from the ILCD data-set should be copy-pasted. ILCD data sets can currently be viewed at: http://lca.jrc.ec.europa.eu/lcainfohub/datasetCategories.vm This assumes that the format of the ILCD data will not change from the format available at the time of the launch of V2 of the CCaLC PVC tool. To import the ILCD data: open the HTML file to be imported and select the entire list of output flows – see
Figure 39 select the cell A10 on the ILCD template sheet and paste the data into it click on the Remove hyperlinks button to remove any links to the HTML file; once this
has been done the template should look like that shown in Figure 40 click on Import data button to import data; this takes a few minutes to import further data sets in the same manner, clear the template by clicking the
Clear All button.
CCaLC PVC Manual
42
Figure 39 (Partial) View of ILCD HTML file with data to be imported highlighted
Figure 40 ILCD import template page after pasting the data and removing hyperlinks
CCaLC PVC Manual
43
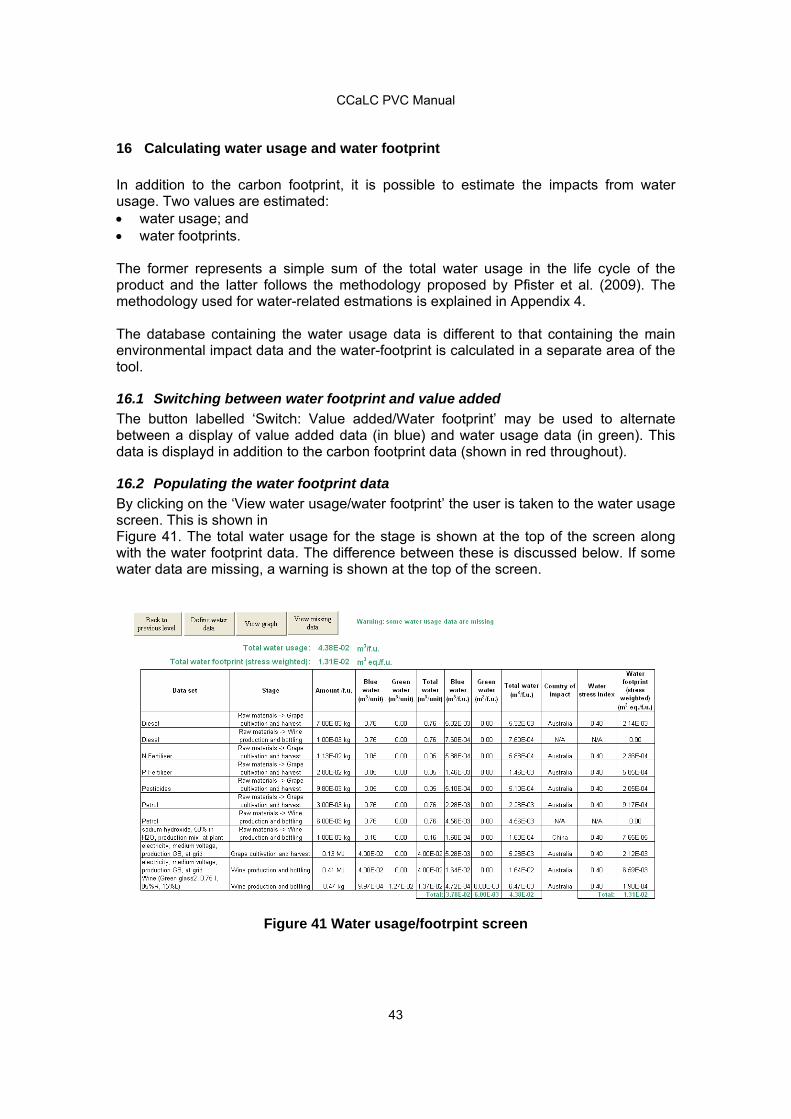
16 Calculating water usage and water footprint
In addition to the carbon footprint, it is possible to estimate the impacts from water usage. Two values are estimated: water usage; and water footprints. The former represents a simple sum of the total water usage in the life cycle of the product and the latter follows the methodology proposed by Pfister et al. (2009). The methodology used for water-related estmations is explained in Appendix 4. The database containing the water usage data is different to that containing the main environmental impact data and the water-footprint is calculated in a separate area of the tool.
16.1 Switching between water footprint and value added
The button labelled ‘Switch: Value added/Water footprint’ may be used to alternate between a display of value added data (in blue) and water usage data (in green). This data is displayd in addition to the carbon footprint data (shown in red throughout).
16.2 Populating the water footprint data
By clicking on the ‘View water usage/water footprint’ the user is taken to the water usage screen. This is shown in Figure 41. The total water usage for the stage is shown at the top of the screen along with the water footprint data. The difference between these is discussed below. If some water data are missing, a warning is shown at the top of the screen.
Figure 41 Water usage/footrpint screen

CCaLC PVC Manual
44
Water usage data are defined using the Define water data button. This brings up the the user form as shown in Figure 42a. By using the drop down menu at the top of the form, the user can select different stages. When a stage is selected, the two list boxes on the form will be populated. The top box will show data sets at this stage that currently have no water footprint data associated with them. The bottom box shows data sets for which water usage has been defined (and may be modified). The user can define data by selecting an item from the relevant list box and clicking the Define water usage button. The Define water usage for data set form is then shown (Figure 42b). This form allows the user to associate water usage with a particular data set. There are two options: to enter user water usage data or to select an item from the CCaLC water use database to associate with the data set. Water is defined as blue and green water, the sum of which represents the total water usage. A brief discussion of the meanings of these terms is given in Appendix 4. The user may choose which method to use by clicking on the radio buttons near the top of the form: if the Define data button is slected, the first section of textboxes will become active
and the user can simply enter water usage data in terms of m3 per unit; if the Select from CCaLC is selected then the user can select an item from the drop-
down menu that approximates the original. Water usage data and references are shown greyed out and cannot be modified.
a) b)
Figure 42 Define water usage form
CCaLC PVC Manual
45
The drop-down menu at the top of the form contains a list of countries that have water-stress index values associated with them. This may be left blank, or a country selected in order to calculate water footprint data from the existing water usage data. The water footprint is the product of the blue water usage for a specific data set and the water stress index. A further discussion of this is given in Appendix 4. When the Update button is clicked, the water usage table is populated with data. The data is also shown in green at each of the stages in the analysis.
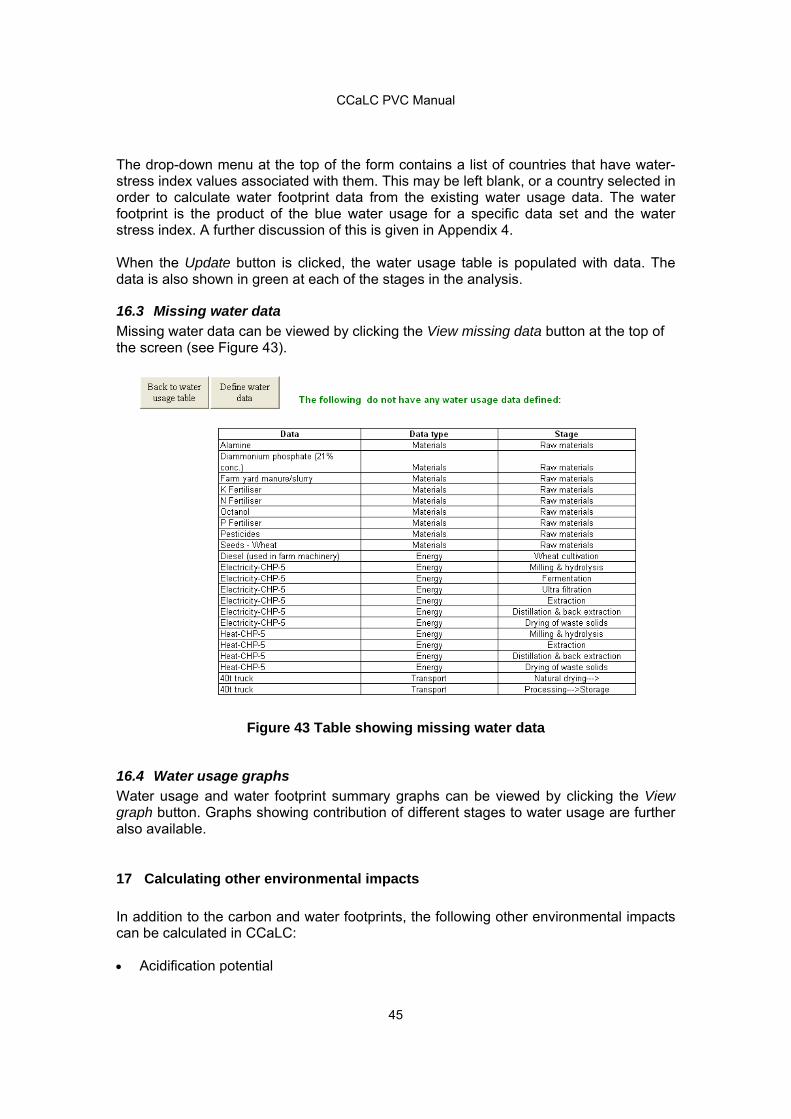
16.3 Missing water data
Missing water data can be viewed by clicking the View missing data button at the top of the screen (see Figure 43).
Figure 43 Table showing missing water data
16.4 Water usage graphs
Water usage and water footprint summary graphs can be viewed by clicking the View graph button. Graphs showing contribution of different stages to water usage are further also available.
17 Calculating other environmental impacts
In addition to the carbon and water footprints, the following other environmental impacts can be calculated in CCaLC: Acidification potential
CCaLC PVC Manual
46
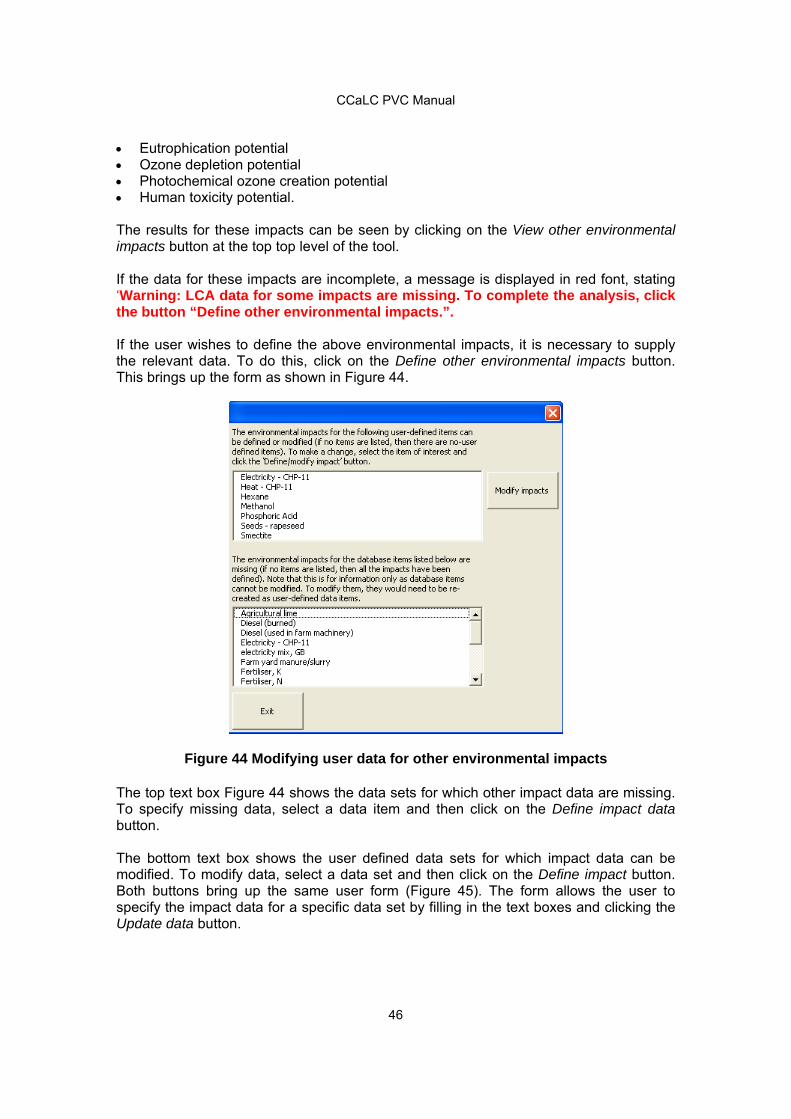
Eutrophication potential Ozone depletion potential Photochemical ozone creation potential Human toxicity potential. The results for these impacts can be seen by clicking on the View other environmental impacts button at the top top level of the tool. If the data for these impacts are incomplete, a message is displayed in red font, stating ‘Warning: LCA data for some impacts are missing. To complete the analysis, click the button “Define other environmental impacts.”. If the user wishes to define the above environmental impacts, it is necessary to supply the relevant data. To do this, click on the Define other environmental impacts button. This brings up the form as shown in Figure 44.
Figure 44 Modifying user data for other environmental impacts The top text box Figure 44 shows the data sets for which other impact data are missing. To specify missing data, select a data item and then click on the Define impact data button. The bottom text box shows the user defined data sets for which impact data can be modified. To modify data, select a data set and then click on the Define impact button. Both buttons bring up the same user form (Figure 45). The form allows the user to specify the impact data for a specific data set by filling in the text boxes and clicking the Update data button.
CCaLC PVC Manual
47
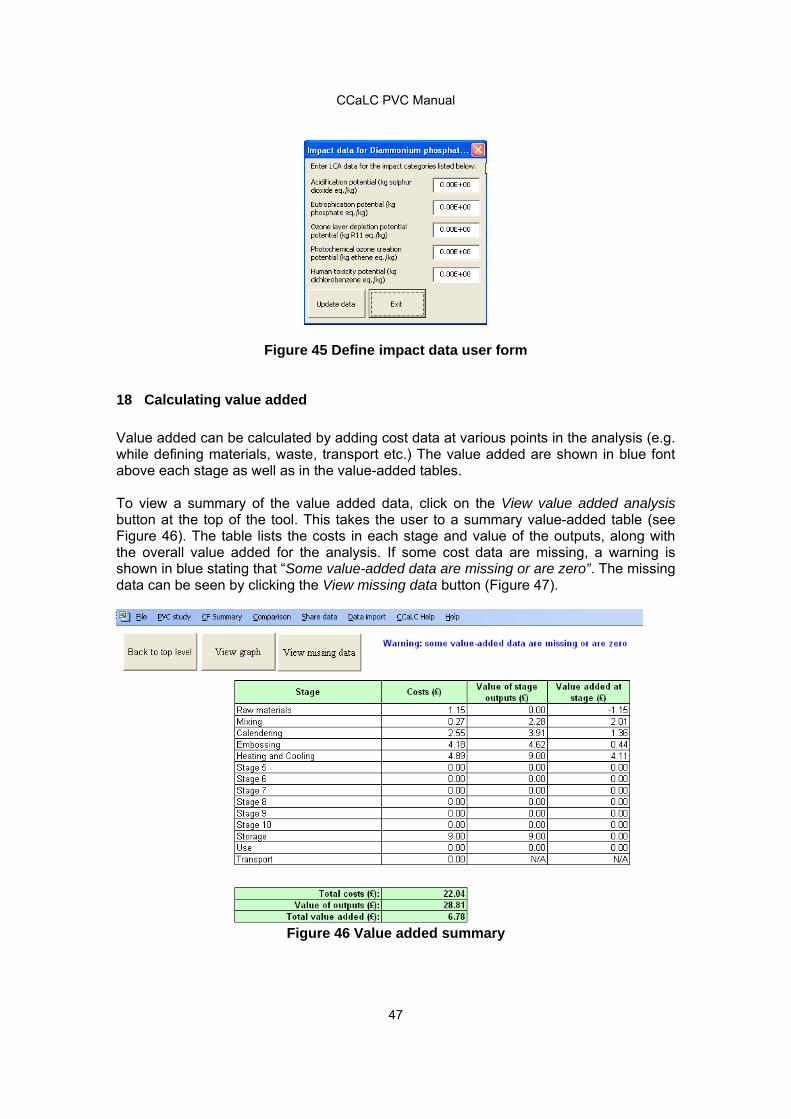
Figure 45 Define impact data user form
18 Calculating value added
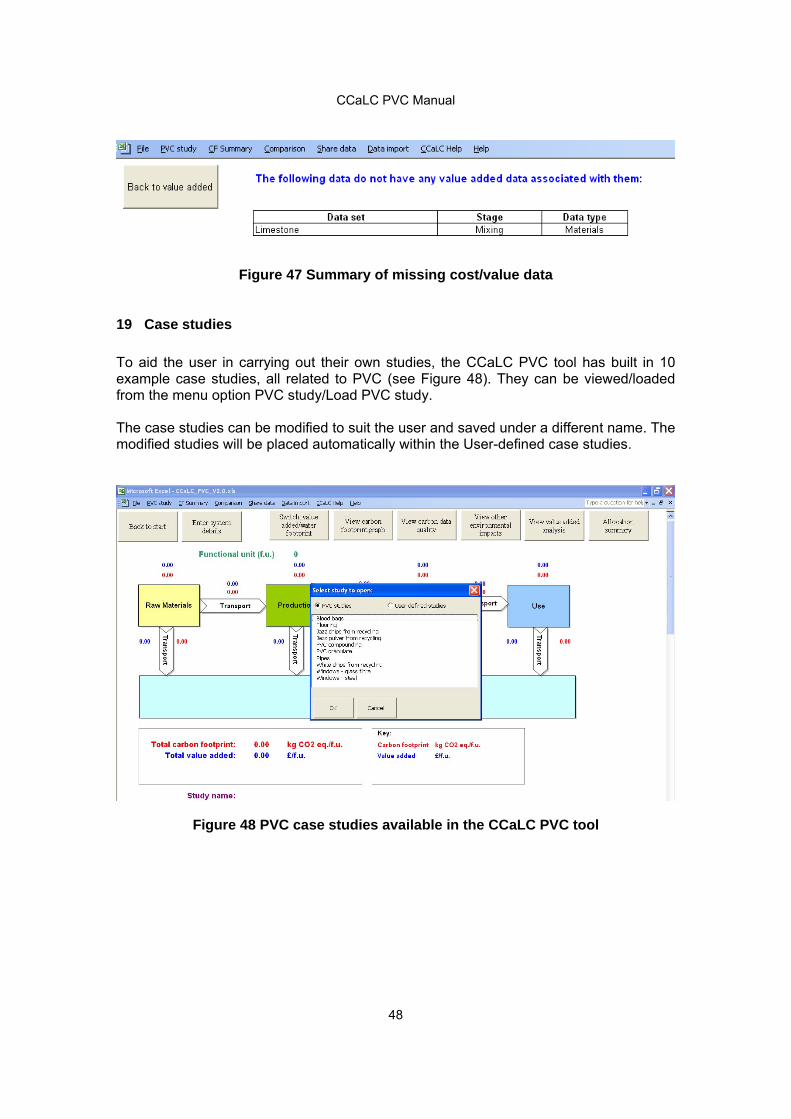
Value added can be calculated by adding cost data at various points in the analysis (e.g. while defining materials, waste, transport etc.) The value added are shown in blue font above each stage as well as in the value-added tables. To view a summary of the value added data, click on the View value added analysis button at the top of the tool. This takes the user to a summary value-added table (see Figure 46). The table lists the costs in each stage and value of the outputs, along with the overall value added for the analysis. If some cost data are missing, a warning is shown in blue stating that “Some value-added data are missing or are zero”. The missing data can be seen by clicking the View missing data button (Figure 47).
Figure 46 Value added summary
CCaLC PVC Manual
48
Figure 47 Summary of missing cost/value data
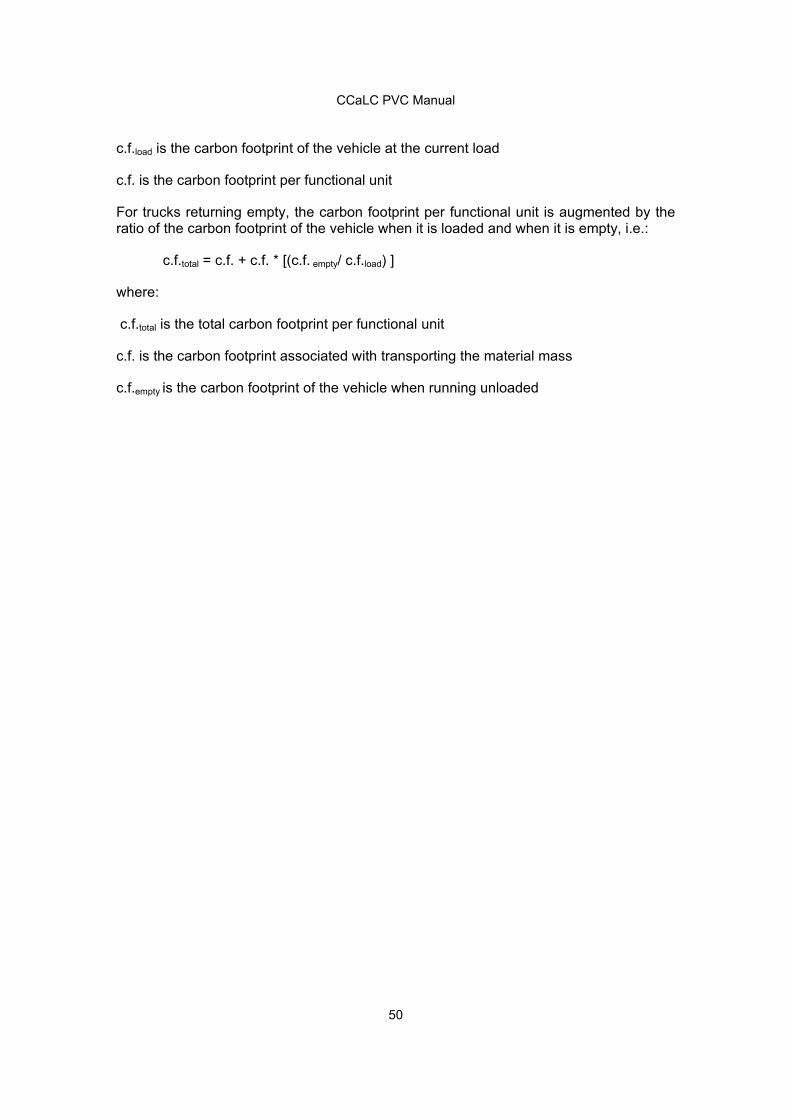
19 Case studies
To aid the user in carrying out their own studies, the CCaLC PVC tool has built in 10 example case studies, all related to PVC (see Figure 48). They can be viewed/loaded from the menu option PVC study/Load PVC study. The case studies can be modified to suit the user and saved under a different name. The modified studies will be placed automatically within the User-defined case studies.
Figure 48 PVC case studies available in the CCaLC PVC tool

CCaLC PVC Manual
49
Appendix 1 – Methodology for calculating the carbon footprint of transport Transport carbon footprint is calculated using the following equations: NB. This applies to datasets within the CCaLC database and does not apply to Ecoinvent data for which limited amount of information is available. For Ecoinvent datasets, the transport density is not variable. The density of the material transported is used to ascertain whether the transport is mass or volume limited: If ρpack < Mmax/Vmax then Volume limited Else, if ρpack > Mmax/Vmax then Mass limited For Volume limited cases the total mass transported per load is: Mtrans = ρpack * Vmax * f For Mass limited cases the total mass transported per load is: Mtrans = Mmax / ρpack * f The number of functional units is then calculated per load:
f.u.load = Mtrans/Mmaterial
The carbon footprint per functional unit is then calculated:
c.f. = c.f.load/f.u.load
where:
ρpack is the packing density as defined by the user
Mmax is the maximum transported mass
Vmax is the maximum transported volume
Mtrans is the total mass transported per load
f is the load factor (i.e. % loaded)
f.u.load is the number of functional units per loaded vehicle
Mmaterial is the mass of material transported per functional unit
CCaLC PVC Manual
50
c.f.load is the carbon footprint of the vehicle at the current load
c.f. is the carbon footprint per functional unit
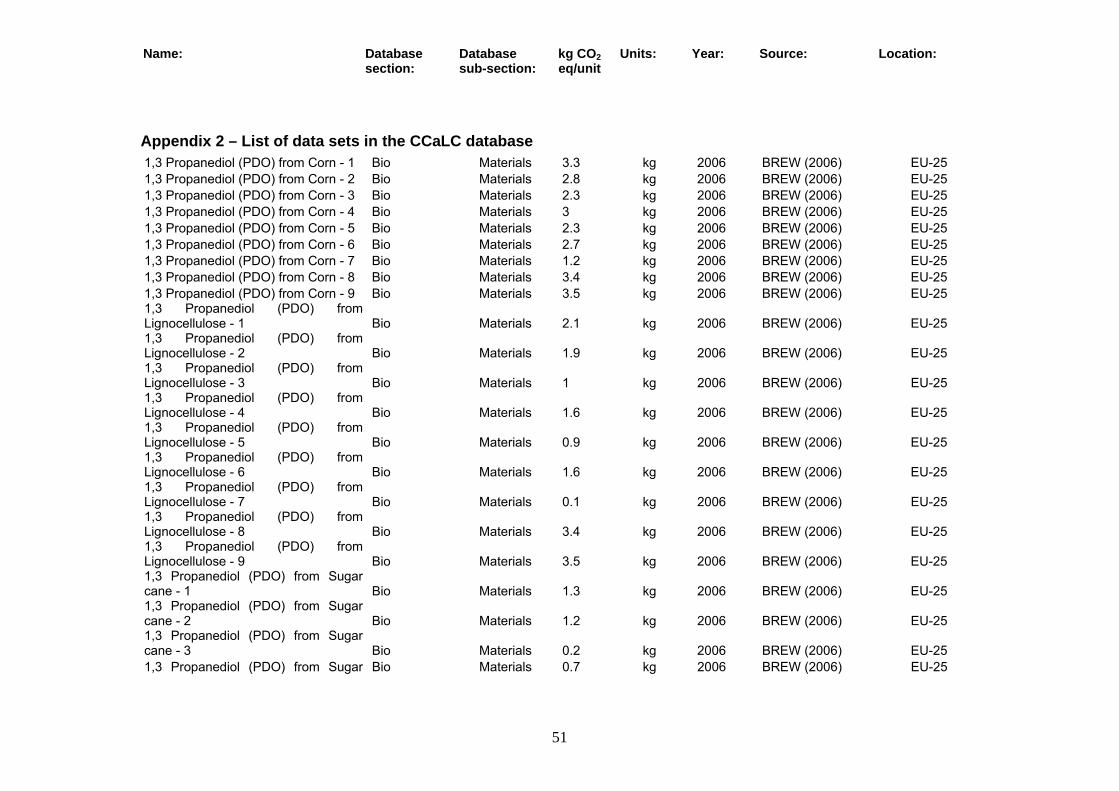
For trucks returning empty, the carbon footprint per functional unit is augmented by the ratio of the carbon footprint of the vehicle when it is loaded and when it is empty, i.e.:
c.f.total = c.f. + c.f. * [(c.f. empty/ c.f.load) ]
where:
c.f.total is the total carbon footprint per functional unit
c.f. is the carbon footprint associated with transporting the material mass
c.f.empty is the carbon footprint of the vehicle when running unloaded
Name: Database section:
Database sub-section:
kg CO2 eq/unit
Units: Year: Source: Location:
51
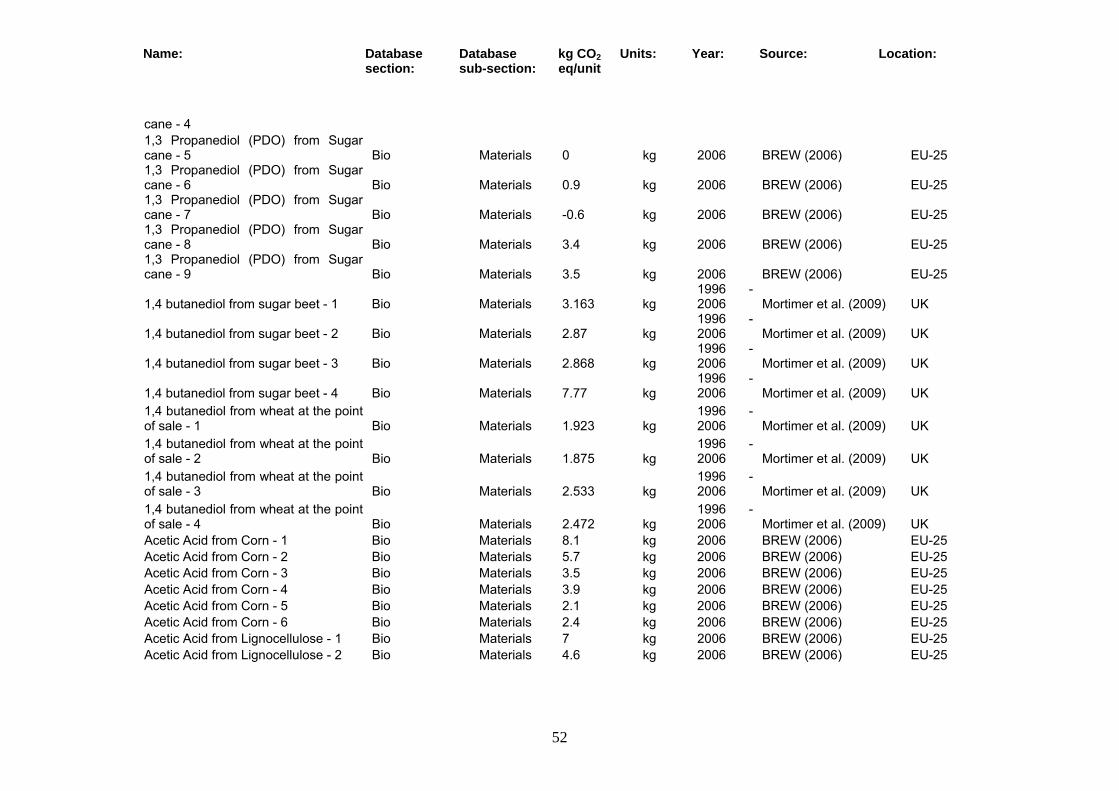
Appendix 2 – List of data sets in the CCaLC database 1,3 Propanediol (PDO) from Corn - 1 Bio Materials 3.3 kg 2006 BREW (2006) EU-25 1,3 Propanediol (PDO) from Corn - 2 Bio Materials 2.8 kg 2006 BREW (2006) EU-25 1,3 Propanediol (PDO) from Corn - 3 Bio Materials 2.3 kg 2006 BREW (2006) EU-25 1,3 Propanediol (PDO) from Corn - 4 Bio Materials 3 kg 2006 BREW (2006) EU-25 1,3 Propanediol (PDO) from Corn - 5 Bio Materials 2.3 kg 2006 BREW (2006) EU-25 1,3 Propanediol (PDO) from Corn - 6 Bio Materials 2.7 kg 2006 BREW (2006) EU-25 1,3 Propanediol (PDO) from Corn - 7 Bio Materials 1.2 kg 2006 BREW (2006) EU-25 1,3 Propanediol (PDO) from Corn - 8 Bio Materials 3.4 kg 2006 BREW (2006) EU-25 1,3 Propanediol (PDO) from Corn - 9 Bio Materials 3.5 kg 2006 BREW (2006) EU-25 1,3 Propanediol (PDO) from Lignocellulose - 1 Bio Materials 2.1 kg 2006 BREW (2006) EU-25 1,3 Propanediol (PDO) from Lignocellulose - 2 Bio Materials 1.9 kg 2006 BREW (2006) EU-25 1,3 Propanediol (PDO) from Lignocellulose - 3 Bio Materials 1 kg 2006 BREW (2006) EU-25 1,3 Propanediol (PDO) from Lignocellulose - 4 Bio Materials 1.6 kg 2006 BREW (2006) EU-25 1,3 Propanediol (PDO) from Lignocellulose - 5 Bio Materials 0.9 kg 2006 BREW (2006) EU-25 1,3 Propanediol (PDO) from Lignocellulose - 6 Bio Materials 1.6 kg 2006 BREW (2006) EU-25 1,3 Propanediol (PDO) from Lignocellulose - 7 Bio Materials 0.1 kg 2006 BREW (2006) EU-25 1,3 Propanediol (PDO) from Lignocellulose - 8 Bio Materials 3.4 kg 2006 BREW (2006) EU-25 1,3 Propanediol (PDO) from Lignocellulose - 9 Bio Materials 3.5 kg 2006 BREW (2006) EU-25 1,3 Propanediol (PDO) from Sugar cane - 1 Bio Materials 1.3 kg 2006 BREW (2006) EU-25 1,3 Propanediol (PDO) from Sugar cane - 2 Bio Materials 1.2 kg 2006 BREW (2006) EU-25 1,3 Propanediol (PDO) from Sugar cane - 3 Bio Materials 0.2 kg 2006 BREW (2006) EU-25 1,3 Propanediol (PDO) from Sugar Bio Materials 0.7 kg 2006 BREW (2006) EU-25
Name: Database section:
Database sub-section:
kg CO2 eq/unit
Units: Year: Source: Location:
52
cane - 4 1,3 Propanediol (PDO) from Sugar cane - 5 Bio Materials 0 kg 2006 BREW (2006) EU-25 1,3 Propanediol (PDO) from Sugar cane - 6 Bio Materials 0.9 kg 2006 BREW (2006) EU-25 1,3 Propanediol (PDO) from Sugar cane - 7 Bio Materials -0.6 kg 2006 BREW (2006) EU-25 1,3 Propanediol (PDO) from Sugar cane - 8 Bio Materials 3.4 kg 2006 BREW (2006) EU-25 1,3 Propanediol (PDO) from Sugar cane - 9 Bio Materials 3.5 kg 2006 BREW (2006) EU-25
1,4 butanediol from sugar beet - 1 Bio Materials 3.163 kg 1996 - 2006 Mortimer et al. (2009) UK
1,4 butanediol from sugar beet - 2 Bio Materials 2.87 kg 1996 - 2006 Mortimer et al. (2009) UK
1,4 butanediol from sugar beet - 3 Bio Materials 2.868 kg 1996 - 2006 Mortimer et al. (2009) UK
1,4 butanediol from sugar beet - 4 Bio Materials 7.77 kg 1996 - 2006 Mortimer et al. (2009) UK
1,4 butanediol from wheat at the point of sale - 1 Bio Materials 1.923 kg
1996 - 2006 Mortimer et al. (2009) UK
1,4 butanediol from wheat at the point of sale - 2 Bio Materials 1.875 kg
1996 - 2006 Mortimer et al. (2009) UK
1,4 butanediol from wheat at the point of sale - 3 Bio Materials 2.533 kg
1996 - 2006 Mortimer et al. (2009) UK
1,4 butanediol from wheat at the point of sale - 4 Bio Materials 2.472 kg
1996 - 2006 Mortimer et al. (2009) UK
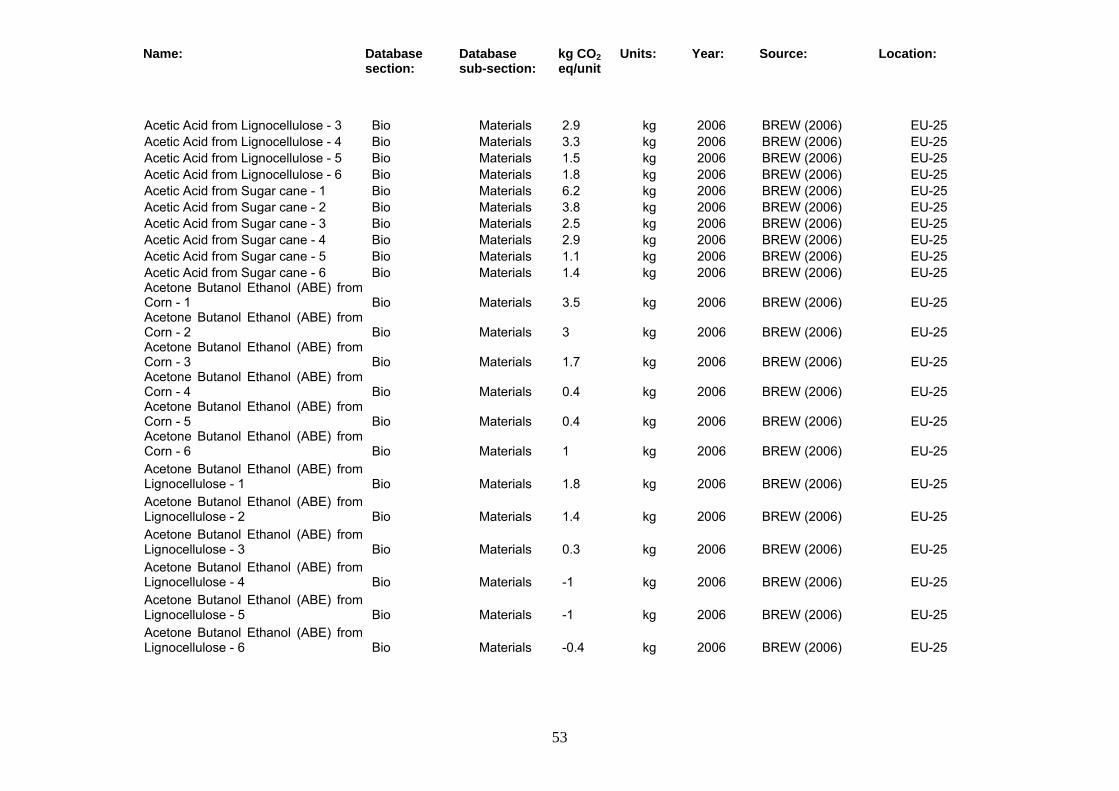
Acetic Acid from Corn - 1 Bio Materials 8.1 kg 2006 BREW (2006) EU-25 Acetic Acid from Corn - 2 Bio Materials 5.7 kg 2006 BREW (2006) EU-25 Acetic Acid from Corn - 3 Bio Materials 3.5 kg 2006 BREW (2006) EU-25 Acetic Acid from Corn - 4 Bio Materials 3.9 kg 2006 BREW (2006) EU-25 Acetic Acid from Corn - 5 Bio Materials 2.1 kg 2006 BREW (2006) EU-25 Acetic Acid from Corn - 6 Bio Materials 2.4 kg 2006 BREW (2006) EU-25 Acetic Acid from Lignocellulose - 1 Bio Materials 7 kg 2006 BREW (2006) EU-25 Acetic Acid from Lignocellulose - 2 Bio Materials 4.6 kg 2006 BREW (2006) EU-25
Name: Database section:
Database sub-section:
kg CO2 eq/unit
Units: Year: Source: Location:
53
Acetic Acid from Lignocellulose - 3 Bio Materials 2.9 kg 2006 BREW (2006) EU-25 Acetic Acid from Lignocellulose - 4 Bio Materials 3.3 kg 2006 BREW (2006) EU-25 Acetic Acid from Lignocellulose - 5 Bio Materials 1.5 kg 2006 BREW (2006) EU-25 Acetic Acid from Lignocellulose - 6 Bio Materials 1.8 kg 2006 BREW (2006) EU-25 Acetic Acid from Sugar cane - 1 Bio Materials 6.2 kg 2006 BREW (2006) EU-25 Acetic Acid from Sugar cane - 2 Bio Materials 3.8 kg 2006 BREW (2006) EU-25 Acetic Acid from Sugar cane - 3 Bio Materials 2.5 kg 2006 BREW (2006) EU-25 Acetic Acid from Sugar cane - 4 Bio Materials 2.9 kg 2006 BREW (2006) EU-25 Acetic Acid from Sugar cane - 5 Bio Materials 1.1 kg 2006 BREW (2006) EU-25 Acetic Acid from Sugar cane - 6 Bio Materials 1.4 kg 2006 BREW (2006) EU-25 Acetone Butanol Ethanol (ABE) from Corn - 1 Bio Materials 3.5 kg 2006 BREW (2006) EU-25 Acetone Butanol Ethanol (ABE) from Corn - 2 Bio Materials 3 kg 2006 BREW (2006) EU-25 Acetone Butanol Ethanol (ABE) from Corn - 3 Bio Materials 1.7 kg 2006 BREW (2006) EU-25 Acetone Butanol Ethanol (ABE) from Corn - 4 Bio Materials 0.4 kg 2006 BREW (2006) EU-25 Acetone Butanol Ethanol (ABE) from Corn - 5 Bio Materials 0.4 kg 2006 BREW (2006) EU-25 Acetone Butanol Ethanol (ABE) from Corn - 6 Bio Materials 1 kg 2006 BREW (2006) EU-25 Acetone Butanol Ethanol (ABE) from Lignocellulose - 1 Bio Materials 1.8 kg 2006 BREW (2006) EU-25 Acetone Butanol Ethanol (ABE) from Lignocellulose - 2 Bio Materials 1.4 kg 2006 BREW (2006) EU-25 Acetone Butanol Ethanol (ABE) from Lignocellulose - 3 Bio Materials 0.3 kg 2006 BREW (2006) EU-25 Acetone Butanol Ethanol (ABE) from Lignocellulose - 4 Bio Materials -1 kg 2006 BREW (2006) EU-25 Acetone Butanol Ethanol (ABE) from Lignocellulose - 5 Bio Materials -1 kg 2006 BREW (2006) EU-25 Acetone Butanol Ethanol (ABE) from Lignocellulose - 6 Bio Materials -0.4 kg 2006 BREW (2006) EU-25
Name: Database section:
Database sub-section:
kg CO2 eq/unit
Units: Year: Source: Location:
54
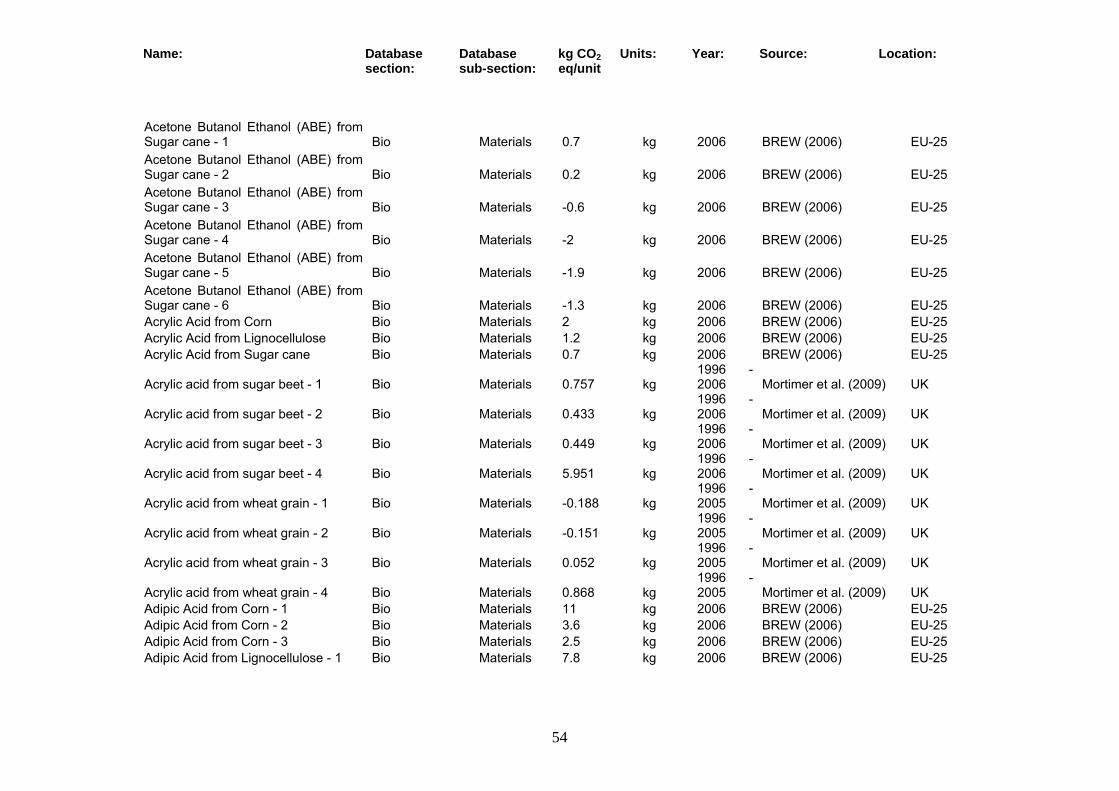
Acetone Butanol Ethanol (ABE) from Sugar cane - 1 Bio Materials 0.7 kg 2006 BREW (2006) EU-25 Acetone Butanol Ethanol (ABE) from Sugar cane - 2 Bio Materials 0.2 kg 2006 BREW (2006) EU-25 Acetone Butanol Ethanol (ABE) from Sugar cane - 3 Bio Materials -0.6 kg 2006 BREW (2006) EU-25 Acetone Butanol Ethanol (ABE) from Sugar cane - 4 Bio Materials -2 kg 2006 BREW (2006) EU-25 Acetone Butanol Ethanol (ABE) from Sugar cane - 5 Bio Materials -1.9 kg 2006 BREW (2006) EU-25 Acetone Butanol Ethanol (ABE) from Sugar cane - 6 Bio Materials -1.3 kg 2006 BREW (2006) EU-25 Acrylic Acid from Corn Bio Materials 2 kg 2006 BREW (2006) EU-25 Acrylic Acid from Lignocellulose Bio Materials 1.2 kg 2006 BREW (2006) EU-25 Acrylic Acid from Sugar cane Bio Materials 0.7 kg 2006 BREW (2006) EU-25
Acrylic acid from sugar beet - 1 Bio Materials 0.757 kg 1996 - 2006 Mortimer et al. (2009) UK
Acrylic acid from sugar beet - 2 Bio Materials 0.433 kg 1996 - 2006 Mortimer et al. (2009) UK
Acrylic acid from sugar beet - 3 Bio Materials 0.449 kg 1996 - 2006 Mortimer et al. (2009) UK
Acrylic acid from sugar beet - 4 Bio Materials 5.951 kg 1996 - 2006 Mortimer et al. (2009) UK
Acrylic acid from wheat grain - 1 Bio Materials -0.188 kg 1996 - 2005 Mortimer et al. (2009) UK
Acrylic acid from wheat grain - 2 Bio Materials -0.151 kg 1996 - 2005 Mortimer et al. (2009) UK
Acrylic acid from wheat grain - 3 Bio Materials 0.052 kg 1996 - 2005 Mortimer et al. (2009) UK
Acrylic acid from wheat grain - 4 Bio Materials 0.868 kg 1996 - 2005 Mortimer et al. (2009) UK
Adipic Acid from Corn - 1 Bio Materials 11 kg 2006 BREW (2006) EU-25 Adipic Acid from Corn - 2 Bio Materials 3.6 kg 2006 BREW (2006) EU-25 Adipic Acid from Corn - 3 Bio Materials 2.5 kg 2006 BREW (2006) EU-25 Adipic Acid from Lignocellulose - 1 Bio Materials 7.8 kg 2006 BREW (2006) EU-25
Name: Database section:
Database sub-section:
kg CO2 eq/unit
Units: Year: Source: Location:
55
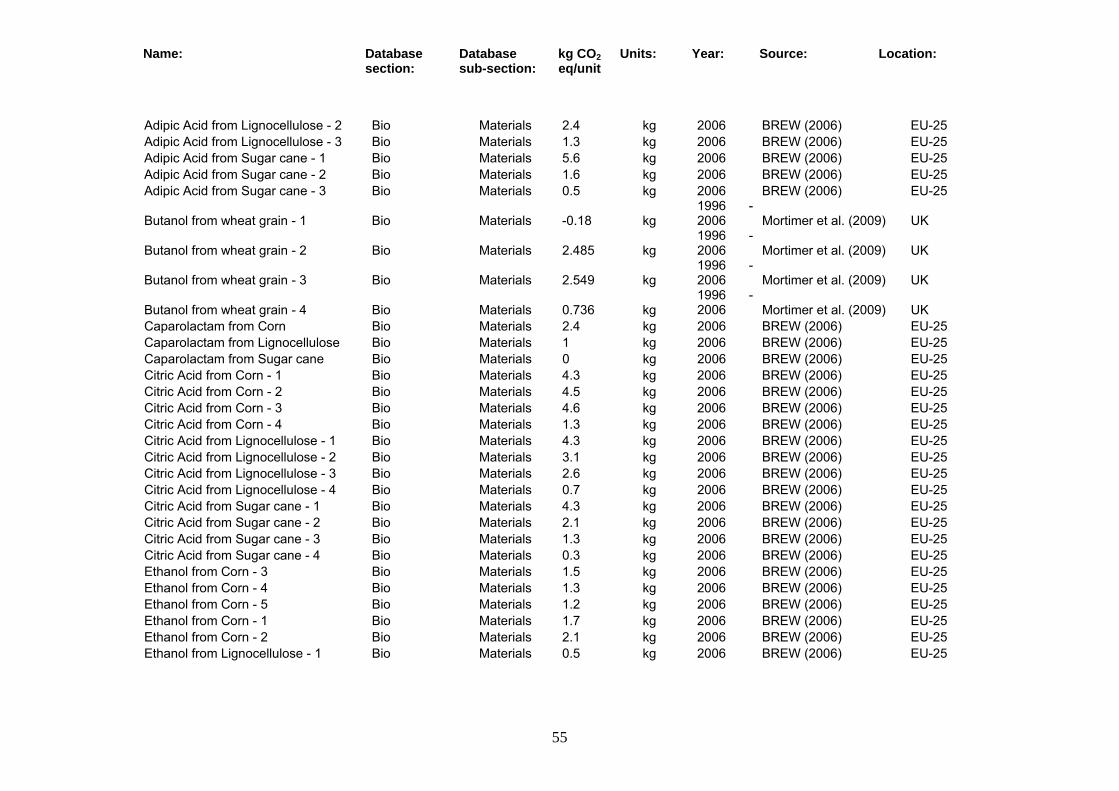
Adipic Acid from Lignocellulose - 2 Bio Materials 2.4 kg 2006 BREW (2006) EU-25 Adipic Acid from Lignocellulose - 3 Bio Materials 1.3 kg 2006 BREW (2006) EU-25 Adipic Acid from Sugar cane - 1 Bio Materials 5.6 kg 2006 BREW (2006) EU-25 Adipic Acid from Sugar cane - 2 Bio Materials 1.6 kg 2006 BREW (2006) EU-25 Adipic Acid from Sugar cane - 3 Bio Materials 0.5 kg 2006 BREW (2006) EU-25
Butanol from wheat grain - 1 Bio Materials -0.18 kg 1996 - 2006 Mortimer et al. (2009) UK
Butanol from wheat grain - 2 Bio Materials 2.485 kg 1996 - 2006 Mortimer et al. (2009) UK
Butanol from wheat grain - 3 Bio Materials 2.549 kg 1996 - 2006 Mortimer et al. (2009) UK
Butanol from wheat grain - 4 Bio Materials 0.736 kg 1996 - 2006 Mortimer et al. (2009) UK
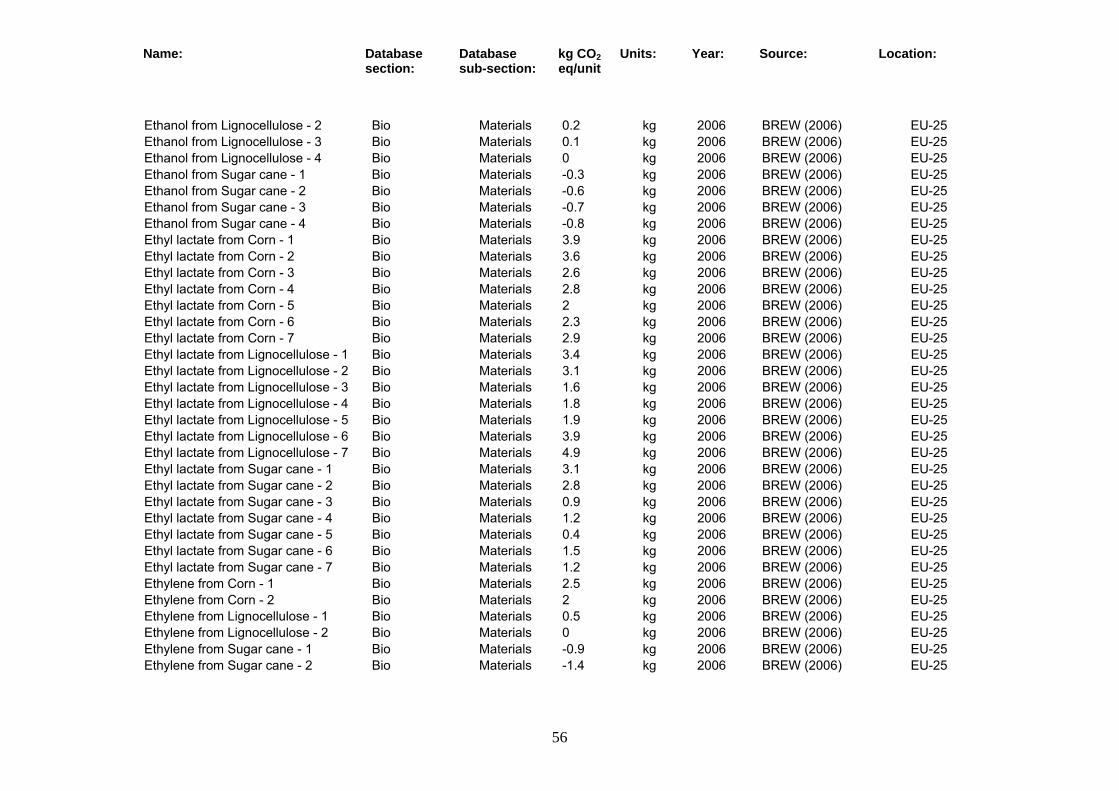
Caparolactam from Corn Bio Materials 2.4 kg 2006 BREW (2006) EU-25 Caparolactam from Lignocellulose Bio Materials 1 kg 2006 BREW (2006) EU-25 Caparolactam from Sugar cane Bio Materials 0 kg 2006 BREW (2006) EU-25 Citric Acid from Corn - 1 Bio Materials 4.3 kg 2006 BREW (2006) EU-25 Citric Acid from Corn - 2 Bio Materials 4.5 kg 2006 BREW (2006) EU-25 Citric Acid from Corn - 3 Bio Materials 4.6 kg 2006 BREW (2006) EU-25 Citric Acid from Corn - 4 Bio Materials 1.3 kg 2006 BREW (2006) EU-25 Citric Acid from Lignocellulose - 1 Bio Materials 4.3 kg 2006 BREW (2006) EU-25 Citric Acid from Lignocellulose - 2 Bio Materials 3.1 kg 2006 BREW (2006) EU-25 Citric Acid from Lignocellulose - 3 Bio Materials 2.6 kg 2006 BREW (2006) EU-25 Citric Acid from Lignocellulose - 4 Bio Materials 0.7 kg 2006 BREW (2006) EU-25 Citric Acid from Sugar cane - 1 Bio Materials 4.3 kg 2006 BREW (2006) EU-25 Citric Acid from Sugar cane - 2 Bio Materials 2.1 kg 2006 BREW (2006) EU-25 Citric Acid from Sugar cane - 3 Bio Materials 1.3 kg 2006 BREW (2006) EU-25 Citric Acid from Sugar cane - 4 Bio Materials 0.3 kg 2006 BREW (2006) EU-25 Ethanol from Corn - 3 Bio Materials 1.5 kg 2006 BREW (2006) EU-25 Ethanol from Corn - 4 Bio Materials 1.3 kg 2006 BREW (2006) EU-25 Ethanol from Corn - 5 Bio Materials 1.2 kg 2006 BREW (2006) EU-25 Ethanol from Corn - 1 Bio Materials 1.7 kg 2006 BREW (2006) EU-25 Ethanol from Corn - 2 Bio Materials 2.1 kg 2006 BREW (2006) EU-25 Ethanol from Lignocellulose - 1 Bio Materials 0.5 kg 2006 BREW (2006) EU-25
Name: Database section:
Database sub-section:
kg CO2 eq/unit
Units: Year: Source: Location:
56
Ethanol from Lignocellulose - 2 Bio Materials 0.2 kg 2006 BREW (2006) EU-25 Ethanol from Lignocellulose - 3 Bio Materials 0.1 kg 2006 BREW (2006) EU-25 Ethanol from Lignocellulose - 4 Bio Materials 0 kg 2006 BREW (2006) EU-25 Ethanol from Sugar cane - 1 Bio Materials -0.3 kg 2006 BREW (2006) EU-25 Ethanol from Sugar cane - 2 Bio Materials -0.6 kg 2006 BREW (2006) EU-25 Ethanol from Sugar cane - 3 Bio Materials -0.7 kg 2006 BREW (2006) EU-25 Ethanol from Sugar cane - 4 Bio Materials -0.8 kg 2006 BREW (2006) EU-25 Ethyl lactate from Corn - 1 Bio Materials 3.9 kg 2006 BREW (2006) EU-25 Ethyl lactate from Corn - 2 Bio Materials 3.6 kg 2006 BREW (2006) EU-25 Ethyl lactate from Corn - 3 Bio Materials 2.6 kg 2006 BREW (2006) EU-25 Ethyl lactate from Corn - 4 Bio Materials 2.8 kg 2006 BREW (2006) EU-25 Ethyl lactate from Corn - 5 Bio Materials 2 kg 2006 BREW (2006) EU-25 Ethyl lactate from Corn - 6 Bio Materials 2.3 kg 2006 BREW (2006) EU-25 Ethyl lactate from Corn - 7 Bio Materials 2.9 kg 2006 BREW (2006) EU-25 Ethyl lactate from Lignocellulose - 1 Bio Materials 3.4 kg 2006 BREW (2006) EU-25 Ethyl lactate from Lignocellulose - 2 Bio Materials 3.1 kg 2006 BREW (2006) EU-25 Ethyl lactate from Lignocellulose - 3 Bio Materials 1.6 kg 2006 BREW (2006) EU-25 Ethyl lactate from Lignocellulose - 4 Bio Materials 1.8 kg 2006 BREW (2006) EU-25 Ethyl lactate from Lignocellulose - 5 Bio Materials 1.9 kg 2006 BREW (2006) EU-25 Ethyl lactate from Lignocellulose - 6 Bio Materials 3.9 kg 2006 BREW (2006) EU-25 Ethyl lactate from Lignocellulose - 7 Bio Materials 4.9 kg 2006 BREW (2006) EU-25 Ethyl lactate from Sugar cane - 1 Bio Materials 3.1 kg 2006 BREW (2006) EU-25 Ethyl lactate from Sugar cane - 2 Bio Materials 2.8 kg 2006 BREW (2006) EU-25 Ethyl lactate from Sugar cane - 3 Bio Materials 0.9 kg 2006 BREW (2006) EU-25 Ethyl lactate from Sugar cane - 4 Bio Materials 1.2 kg 2006 BREW (2006) EU-25 Ethyl lactate from Sugar cane - 5 Bio Materials 0.4 kg 2006 BREW (2006) EU-25 Ethyl lactate from Sugar cane - 6 Bio Materials 1.5 kg 2006 BREW (2006) EU-25 Ethyl lactate from Sugar cane - 7 Bio Materials 1.2 kg 2006 BREW (2006) EU-25 Ethylene from Corn - 1 Bio Materials 2.5 kg 2006 BREW (2006) EU-25 Ethylene from Corn - 2 Bio Materials 2 kg 2006 BREW (2006) EU-25 Ethylene from Lignocellulose - 1 Bio Materials 0.5 kg 2006 BREW (2006) EU-25 Ethylene from Lignocellulose - 2 Bio Materials 0 kg 2006 BREW (2006) EU-25 Ethylene from Sugar cane - 1 Bio Materials -0.9 kg 2006 BREW (2006) EU-25 Ethylene from Sugar cane - 2 Bio Materials -1.4 kg 2006 BREW (2006) EU-25
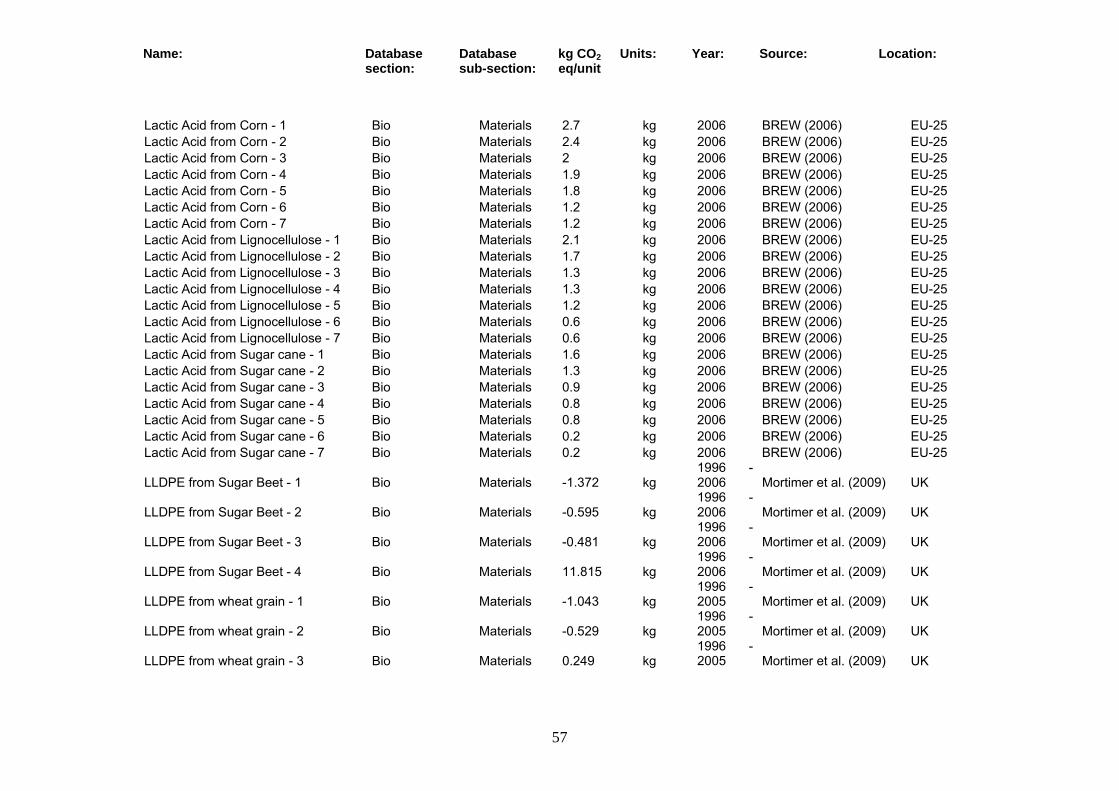
Name: Database section:
Database sub-section:
kg CO2 eq/unit
Units: Year: Source: Location:
57
Lactic Acid from Corn - 1 Bio Materials 2.7 kg 2006 BREW (2006) EU-25 Lactic Acid from Corn - 2 Bio Materials 2.4 kg 2006 BREW (2006) EU-25 Lactic Acid from Corn - 3 Bio Materials 2 kg 2006 BREW (2006) EU-25 Lactic Acid from Corn - 4 Bio Materials 1.9 kg 2006 BREW (2006) EU-25 Lactic Acid from Corn - 5 Bio Materials 1.8 kg 2006 BREW (2006) EU-25 Lactic Acid from Corn - 6 Bio Materials 1.2 kg 2006 BREW (2006) EU-25 Lactic Acid from Corn - 7 Bio Materials 1.2 kg 2006 BREW (2006) EU-25 Lactic Acid from Lignocellulose - 1 Bio Materials 2.1 kg 2006 BREW (2006) EU-25 Lactic Acid from Lignocellulose - 2 Bio Materials 1.7 kg 2006 BREW (2006) EU-25 Lactic Acid from Lignocellulose - 3 Bio Materials 1.3 kg 2006 BREW (2006) EU-25 Lactic Acid from Lignocellulose - 4 Bio Materials 1.3 kg 2006 BREW (2006) EU-25 Lactic Acid from Lignocellulose - 5 Bio Materials 1.2 kg 2006 BREW (2006) EU-25 Lactic Acid from Lignocellulose - 6 Bio Materials 0.6 kg 2006 BREW (2006) EU-25 Lactic Acid from Lignocellulose - 7 Bio Materials 0.6 kg 2006 BREW (2006) EU-25 Lactic Acid from Sugar cane - 1 Bio Materials 1.6 kg 2006 BREW (2006) EU-25 Lactic Acid from Sugar cane - 2 Bio Materials 1.3 kg 2006 BREW (2006) EU-25 Lactic Acid from Sugar cane - 3 Bio Materials 0.9 kg 2006 BREW (2006) EU-25 Lactic Acid from Sugar cane - 4 Bio Materials 0.8 kg 2006 BREW (2006) EU-25 Lactic Acid from Sugar cane - 5 Bio Materials 0.8 kg 2006 BREW (2006) EU-25 Lactic Acid from Sugar cane - 6 Bio Materials 0.2 kg 2006 BREW (2006) EU-25 Lactic Acid from Sugar cane - 7 Bio Materials 0.2 kg 2006 BREW (2006) EU-25
LLDPE from Sugar Beet - 1 Bio Materials -1.372 kg 1996 - 2006 Mortimer et al. (2009) UK
LLDPE from Sugar Beet - 2 Bio Materials -0.595 kg 1996 - 2006 Mortimer et al. (2009) UK
LLDPE from Sugar Beet - 3 Bio Materials -0.481 kg 1996 - 2006 Mortimer et al. (2009) UK
LLDPE from Sugar Beet - 4 Bio Materials 11.815 kg 1996 - 2006 Mortimer et al. (2009) UK
LLDPE from wheat grain - 1 Bio Materials -1.043 kg 1996 - 2005 Mortimer et al. (2009) UK
LLDPE from wheat grain - 2 Bio Materials -0.529 kg 1996 - 2005 Mortimer et al. (2009) UK
LLDPE from wheat grain - 3 Bio Materials 0.249 kg 1996 - 2005 Mortimer et al. (2009) UK
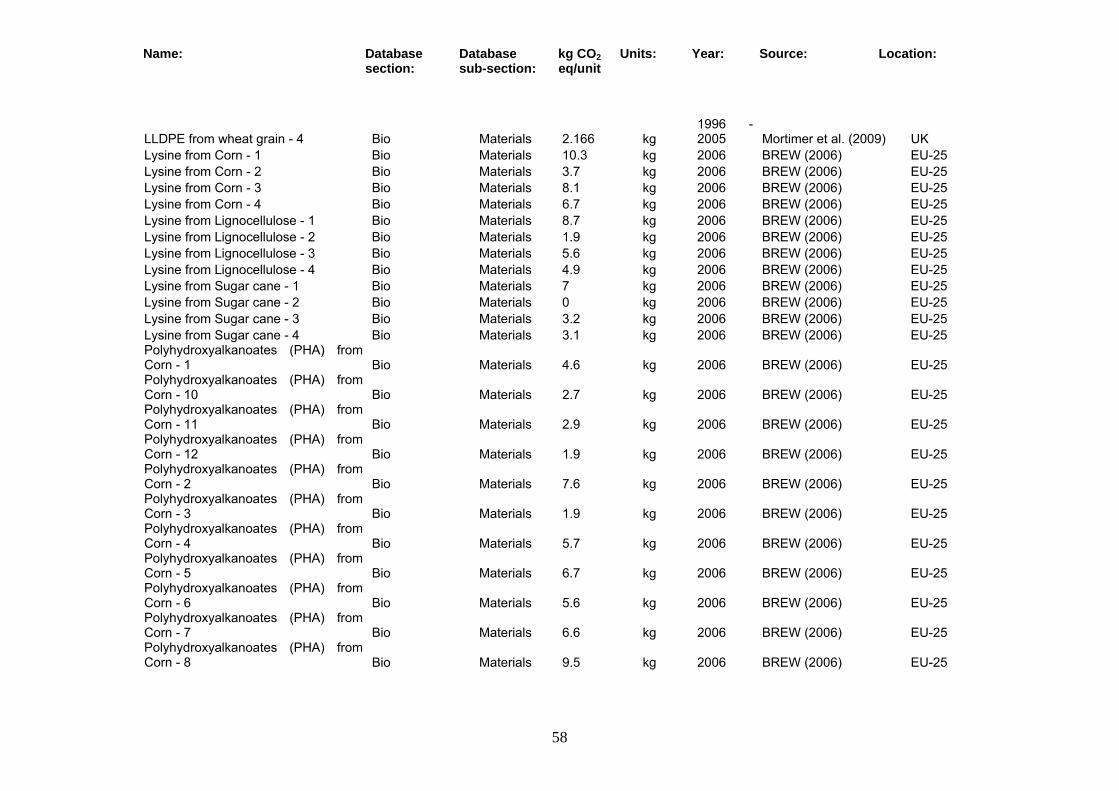
Name: Database section:
Database sub-section:
kg CO2 eq/unit
Units: Year: Source: Location:
58
LLDPE from wheat grain - 4 Bio Materials 2.166 kg 1996 - 2005 Mortimer et al. (2009) UK
Lysine from Corn - 1 Bio Materials 10.3 kg 2006 BREW (2006) EU-25 Lysine from Corn - 2 Bio Materials 3.7 kg 2006 BREW (2006) EU-25 Lysine from Corn - 3 Bio Materials 8.1 kg 2006 BREW (2006) EU-25 Lysine from Corn - 4 Bio Materials 6.7 kg 2006 BREW (2006) EU-25 Lysine from Lignocellulose - 1 Bio Materials 8.7 kg 2006 BREW (2006) EU-25 Lysine from Lignocellulose - 2 Bio Materials 1.9 kg 2006 BREW (2006) EU-25 Lysine from Lignocellulose - 3 Bio Materials 5.6 kg 2006 BREW (2006) EU-25 Lysine from Lignocellulose - 4 Bio Materials 4.9 kg 2006 BREW (2006) EU-25 Lysine from Sugar cane - 1 Bio Materials 7 kg 2006 BREW (2006) EU-25 Lysine from Sugar cane - 2 Bio Materials 0 kg 2006 BREW (2006) EU-25 Lysine from Sugar cane - 3 Bio Materials 3.2 kg 2006 BREW (2006) EU-25 Lysine from Sugar cane - 4 Bio Materials 3.1 kg 2006 BREW (2006) EU-25 Polyhydroxyalkanoates (PHA) from Corn - 1 Bio Materials 4.6 kg 2006 BREW (2006) EU-25 Polyhydroxyalkanoates (PHA) from Corn - 10 Bio Materials 2.7 kg 2006 BREW (2006) EU-25 Polyhydroxyalkanoates (PHA) from Corn - 11 Bio Materials 2.9 kg 2006 BREW (2006) EU-25 Polyhydroxyalkanoates (PHA) from Corn - 12 Bio Materials 1.9 kg 2006 BREW (2006) EU-25 Polyhydroxyalkanoates (PHA) from Corn - 2 Bio Materials 7.6 kg 2006 BREW (2006) EU-25 Polyhydroxyalkanoates (PHA) from Corn - 3 Bio Materials 1.9 kg 2006 BREW (2006) EU-25 Polyhydroxyalkanoates (PHA) from Corn - 4 Bio Materials 5.7 kg 2006 BREW (2006) EU-25 Polyhydroxyalkanoates (PHA) from Corn - 5 Bio Materials 6.7 kg 2006 BREW (2006) EU-25 Polyhydroxyalkanoates (PHA) from Corn - 6 Bio Materials 5.6 kg 2006 BREW (2006) EU-25 Polyhydroxyalkanoates (PHA) from Corn - 7 Bio Materials 6.6 kg 2006 BREW (2006) EU-25 Polyhydroxyalkanoates (PHA) from Corn - 8 Bio Materials 9.5 kg 2006 BREW (2006) EU-25
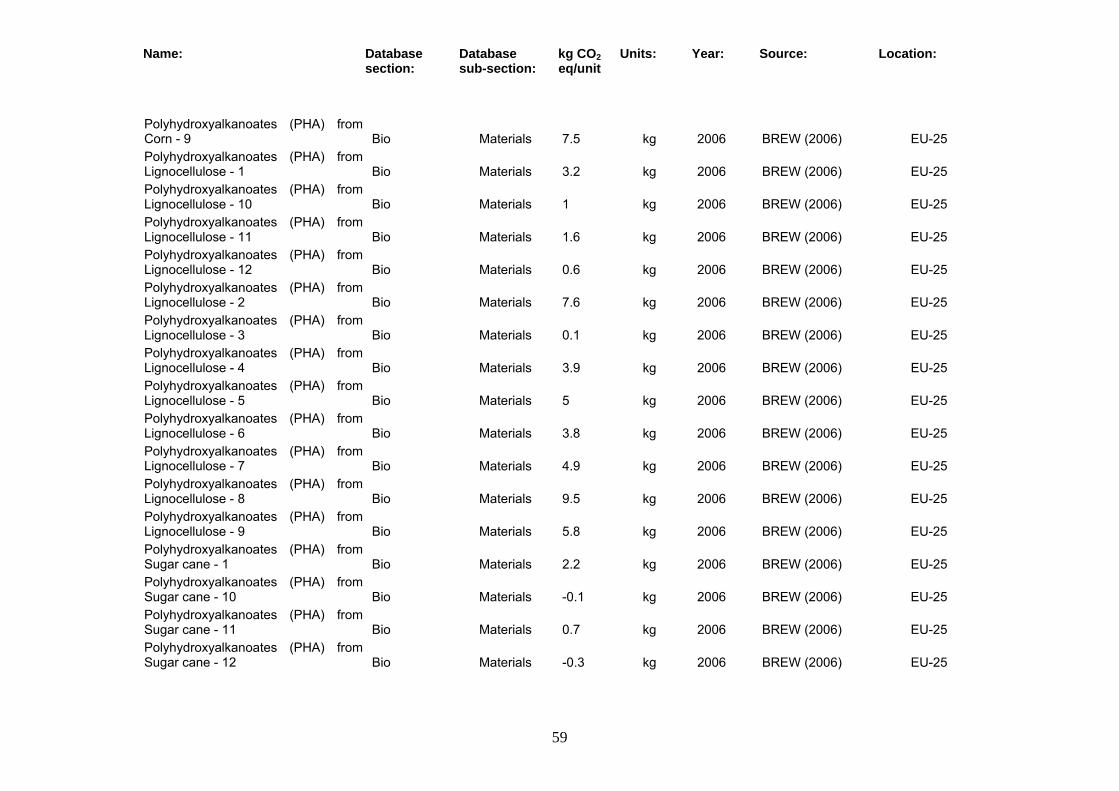
Name: Database section:
Database sub-section:
kg CO2 eq/unit
Units: Year: Source: Location:
59
Polyhydroxyalkanoates (PHA) from Corn - 9 Bio Materials 7.5 kg 2006 BREW (2006) EU-25 Polyhydroxyalkanoates (PHA) from Lignocellulose - 1 Bio Materials 3.2 kg 2006 BREW (2006) EU-25 Polyhydroxyalkanoates (PHA) from Lignocellulose - 10 Bio Materials 1 kg 2006 BREW (2006) EU-25 Polyhydroxyalkanoates (PHA) from Lignocellulose - 11 Bio Materials 1.6 kg 2006 BREW (2006) EU-25 Polyhydroxyalkanoates (PHA) from Lignocellulose - 12 Bio Materials 0.6 kg 2006 BREW (2006) EU-25 Polyhydroxyalkanoates (PHA) from Lignocellulose - 2 Bio Materials 7.6 kg 2006 BREW (2006) EU-25 Polyhydroxyalkanoates (PHA) from Lignocellulose - 3 Bio Materials 0.1 kg 2006 BREW (2006) EU-25 Polyhydroxyalkanoates (PHA) from Lignocellulose - 4 Bio Materials 3.9 kg 2006 BREW (2006) EU-25 Polyhydroxyalkanoates (PHA) from Lignocellulose - 5 Bio Materials 5 kg 2006 BREW (2006) EU-25 Polyhydroxyalkanoates (PHA) from Lignocellulose - 6 Bio Materials 3.8 kg 2006 BREW (2006) EU-25 Polyhydroxyalkanoates (PHA) from Lignocellulose - 7 Bio Materials 4.9 kg 2006 BREW (2006) EU-25 Polyhydroxyalkanoates (PHA) from Lignocellulose - 8 Bio Materials 9.5 kg 2006 BREW (2006) EU-25 Polyhydroxyalkanoates (PHA) from Lignocellulose - 9 Bio Materials 5.8 kg 2006 BREW (2006) EU-25 Polyhydroxyalkanoates (PHA) from Sugar cane - 1 Bio Materials 2.2 kg 2006 BREW (2006) EU-25 Polyhydroxyalkanoates (PHA) from Sugar cane - 10 Bio Materials -0.1 kg 2006 BREW (2006) EU-25 Polyhydroxyalkanoates (PHA) from Sugar cane - 11 Bio Materials 0.7 kg 2006 BREW (2006) EU-25 Polyhydroxyalkanoates (PHA) from Sugar cane - 12 Bio Materials -0.3 kg 2006 BREW (2006) EU-25
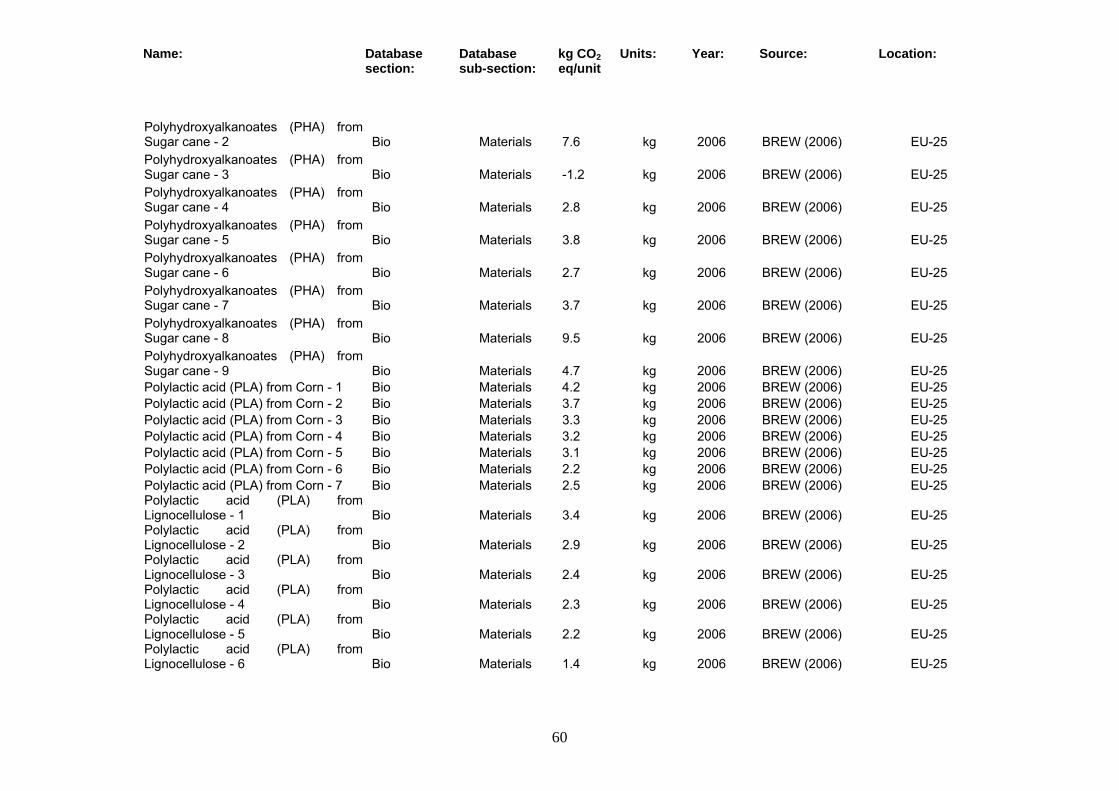
Name: Database section:
Database sub-section:
kg CO2 eq/unit
Units: Year: Source: Location:
60
Polyhydroxyalkanoates (PHA) from Sugar cane - 2 Bio Materials 7.6 kg 2006 BREW (2006) EU-25 Polyhydroxyalkanoates (PHA) from Sugar cane - 3 Bio Materials -1.2 kg 2006 BREW (2006) EU-25 Polyhydroxyalkanoates (PHA) from Sugar cane - 4 Bio Materials 2.8 kg 2006 BREW (2006) EU-25 Polyhydroxyalkanoates (PHA) from Sugar cane - 5 Bio Materials 3.8 kg 2006 BREW (2006) EU-25 Polyhydroxyalkanoates (PHA) from Sugar cane - 6 Bio Materials 2.7 kg 2006 BREW (2006) EU-25 Polyhydroxyalkanoates (PHA) from Sugar cane - 7 Bio Materials 3.7 kg 2006 BREW (2006) EU-25 Polyhydroxyalkanoates (PHA) from Sugar cane - 8 Bio Materials 9.5 kg 2006 BREW (2006) EU-25 Polyhydroxyalkanoates (PHA) from Sugar cane - 9 Bio Materials 4.7 kg 2006 BREW (2006) EU-25 Polylactic acid (PLA) from Corn - 1 Bio Materials 4.2 kg 2006 BREW (2006) EU-25 Polylactic acid (PLA) from Corn - 2 Bio Materials 3.7 kg 2006 BREW (2006) EU-25 Polylactic acid (PLA) from Corn - 3 Bio Materials 3.3 kg 2006 BREW (2006) EU-25 Polylactic acid (PLA) from Corn - 4 Bio Materials 3.2 kg 2006 BREW (2006) EU-25 Polylactic acid (PLA) from Corn - 5 Bio Materials 3.1 kg 2006 BREW (2006) EU-25 Polylactic acid (PLA) from Corn - 6 Bio Materials 2.2 kg 2006 BREW (2006) EU-25 Polylactic acid (PLA) from Corn - 7 Bio Materials 2.5 kg 2006 BREW (2006) EU-25 Polylactic acid (PLA) from Lignocellulose - 1 Bio Materials 3.4 kg 2006 BREW (2006) EU-25 Polylactic acid (PLA) from Lignocellulose - 2 Bio Materials 2.9 kg 2006 BREW (2006) EU-25 Polylactic acid (PLA) from Lignocellulose - 3 Bio Materials 2.4 kg 2006 BREW (2006) EU-25 Polylactic acid (PLA) from Lignocellulose - 4 Bio Materials 2.3 kg 2006 BREW (2006) EU-25 Polylactic acid (PLA) from Lignocellulose - 5 Bio Materials 2.2 kg 2006 BREW (2006) EU-25 Polylactic acid (PLA) from Lignocellulose - 6 Bio Materials 1.4 kg 2006 BREW (2006) EU-25
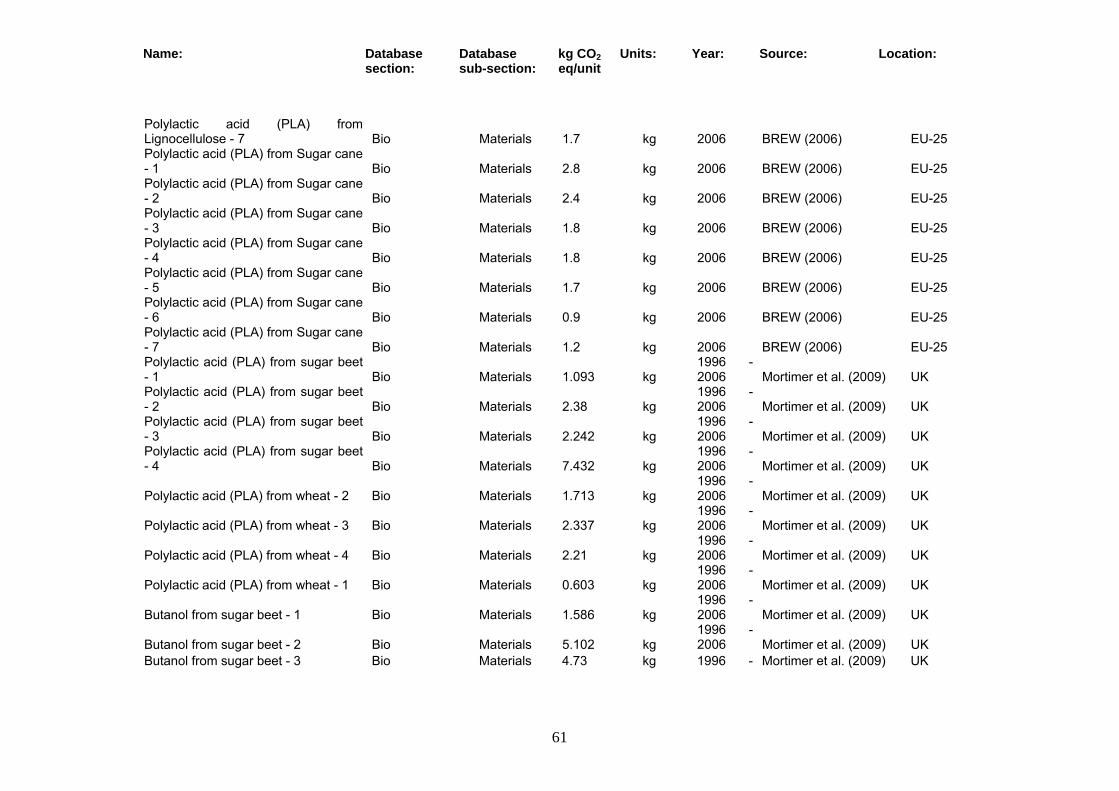
Name: Database section:
Database sub-section:
kg CO2 eq/unit
Units: Year: Source: Location:
61
Polylactic acid (PLA) from Lignocellulose - 7 Bio Materials 1.7 kg 2006 BREW (2006) EU-25 Polylactic acid (PLA) from Sugar cane - 1 Bio Materials 2.8 kg 2006 BREW (2006) EU-25 Polylactic acid (PLA) from Sugar cane - 2 Bio Materials 2.4 kg 2006 BREW (2006) EU-25 Polylactic acid (PLA) from Sugar cane - 3 Bio Materials 1.8 kg 2006 BREW (2006) EU-25 Polylactic acid (PLA) from Sugar cane - 4 Bio Materials 1.8 kg 2006 BREW (2006) EU-25 Polylactic acid (PLA) from Sugar cane - 5 Bio Materials 1.7 kg 2006 BREW (2006) EU-25 Polylactic acid (PLA) from Sugar cane - 6 Bio Materials 0.9 kg 2006 BREW (2006) EU-25 Polylactic acid (PLA) from Sugar cane - 7 Bio Materials 1.2 kg 2006 BREW (2006) EU-25 Polylactic acid (PLA) from sugar beet - 1 Bio Materials 1.093 kg
1996 - 2006 Mortimer et al. (2009) UK
Polylactic acid (PLA) from sugar beet - 2 Bio Materials 2.38 kg
1996 - 2006 Mortimer et al. (2009) UK
Polylactic acid (PLA) from sugar beet - 3 Bio Materials 2.242 kg
1996 - 2006 Mortimer et al. (2009) UK
Polylactic acid (PLA) from sugar beet - 4 Bio Materials 7.432 kg
1996 - 2006 Mortimer et al. (2009) UK
Polylactic acid (PLA) from wheat - 2 Bio Materials 1.713 kg 1996 - 2006 Mortimer et al. (2009) UK
Polylactic acid (PLA) from wheat - 3 Bio Materials 2.337 kg 1996 - 2006 Mortimer et al. (2009) UK
Polylactic acid (PLA) from wheat - 4 Bio Materials 2.21 kg 1996 - 2006 Mortimer et al. (2009) UK
Polylactic acid (PLA) from wheat - 1 Bio Materials 0.603 kg 1996 - 2006 Mortimer et al. (2009) UK
Butanol from sugar beet - 1 Bio Materials 1.586 kg 1996 - 2006 Mortimer et al. (2009) UK
Butanol from sugar beet - 2 Bio Materials 5.102 kg 1996 - 2006 Mortimer et al. (2009) UK
Butanol from sugar beet - 3 Bio Materials 4.73 kg 1996 - Mortimer et al. (2009) UK

Name: Database section:
Database sub-section:
kg CO2 eq/unit
Units: Year: Source: Location:
62
2006
Butanol from sugar beet - 4 Bio Materials 24.942 kg 1996 - 2006 Mortimer et al. (2009) UK
Polytrimethylene terephthalate from Corn - 1 Bio Materials 4.7 kg 2006 BREW (2006) EU-25 Polytrimethylene terephthalate from Corn - 2 Bio Materials 4.9 kg 2006 BREW (2006) EU-25 Polytrimethylene terephthalate from Corn - 3 Bio Materials 4.5 kg 2006 BREW (2006) EU-25 Polytrimethylene terephthalate from Corn - 4 Bio Materials 4.8 kg 2006 BREW (2006) EU-25 Polytrimethylene terephthalate from Corn - 5 Bio Materials 4.5 kg 2006 BREW (2006) EU-25 Polytrimethylene terephthalate from Corn - 6 Bio Materials 4.7 kg 2006 BREW (2006) EU-25 Polytrimethylene terephthalate from Corn - 7 Bio Materials 4.1 kg 2006 BREW (2006) EU-25 Polytrimethylene terephthalate from Corn - 8 Bio Materials 4.9 kg 2006 BREW (2006) EU-25 Polytrimethylene terephthalate from Corn - 9 Bio Materials 5 kg 2006 BREW (2006) EU-25 Polytrimethylene terephthalate from Lignocellulose - 1 Bio Materials 4.4 kg 2006 BREW (2006) EU-25 Polytrimethylene terephthalate from Lignocellulose - 2 Bio Materials 4.4 kg 2006 BREW (2006) EU-25 Polytrimethylene terephthalate from Lignocellulose - 3 Bio Materials 4 kg 2006 BREW (2006) EU-25 Polytrimethylene terephthalate from Lignocellulose - 4 Bio Materials 4.3 kg 2006 BREW (2006) EU-25 Polytrimethylene terephthalate from Lignocellulose - 5 Bio Materials 4 kg 2006 BREW (2006) EU-25 Polytrimethylene terephthalate from Lignocellulose - 6 Bio Materials 4.3 kg 2006 BREW (2006) EU-25 Polytrimethylene terephthalate from Lignocellulose - 7 Bio Materials 3.7 kg 2006 BREW (2006) EU-25
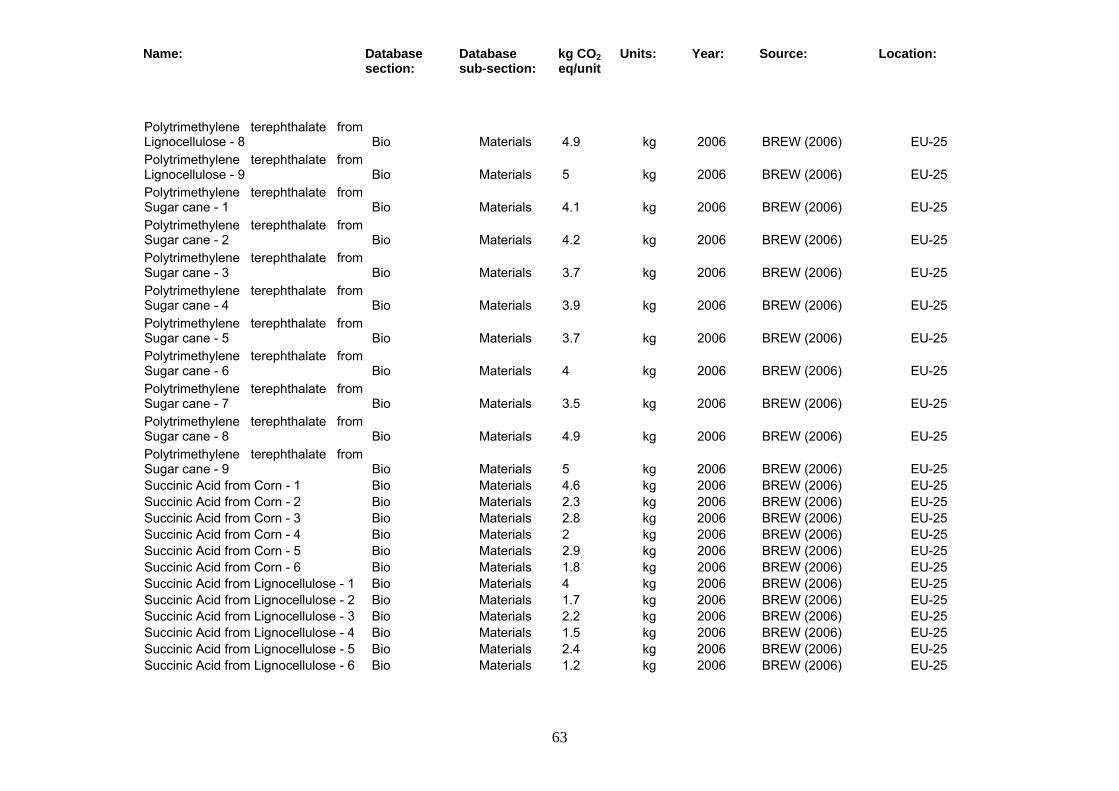
Name: Database section:
Database sub-section:
kg CO2 eq/unit
Units: Year: Source: Location:
63
Polytrimethylene terephthalate from Lignocellulose - 8 Bio Materials 4.9 kg 2006 BREW (2006) EU-25 Polytrimethylene terephthalate from Lignocellulose - 9 Bio Materials 5 kg 2006 BREW (2006) EU-25 Polytrimethylene terephthalate from Sugar cane - 1 Bio Materials 4.1 kg 2006 BREW (2006) EU-25 Polytrimethylene terephthalate from Sugar cane - 2 Bio Materials 4.2 kg 2006 BREW (2006) EU-25 Polytrimethylene terephthalate from Sugar cane - 3 Bio Materials 3.7 kg 2006 BREW (2006) EU-25 Polytrimethylene terephthalate from Sugar cane - 4 Bio Materials 3.9 kg 2006 BREW (2006) EU-25 Polytrimethylene terephthalate from Sugar cane - 5 Bio Materials 3.7 kg 2006 BREW (2006) EU-25 Polytrimethylene terephthalate from Sugar cane - 6 Bio Materials 4 kg 2006 BREW (2006) EU-25 Polytrimethylene terephthalate from Sugar cane - 7 Bio Materials 3.5 kg 2006 BREW (2006) EU-25 Polytrimethylene terephthalate from Sugar cane - 8 Bio Materials 4.9 kg 2006 BREW (2006) EU-25 Polytrimethylene terephthalate from Sugar cane - 9 Bio Materials 5 kg 2006 BREW (2006) EU-25 Succinic Acid from Corn - 1 Bio Materials 4.6 kg 2006 BREW (2006) EU-25 Succinic Acid from Corn - 2 Bio Materials 2.3 kg 2006 BREW (2006) EU-25 Succinic Acid from Corn - 3 Bio Materials 2.8 kg 2006 BREW (2006) EU-25 Succinic Acid from Corn - 4 Bio Materials 2 kg 2006 BREW (2006) EU-25 Succinic Acid from Corn - 5 Bio Materials 2.9 kg 2006 BREW (2006) EU-25 Succinic Acid from Corn - 6 Bio Materials 1.8 kg 2006 BREW (2006) EU-25 Succinic Acid from Lignocellulose - 1 Bio Materials 4 kg 2006 BREW (2006) EU-25 Succinic Acid from Lignocellulose - 2 Bio Materials 1.7 kg 2006 BREW (2006) EU-25 Succinic Acid from Lignocellulose - 3 Bio Materials 2.2 kg 2006 BREW (2006) EU-25 Succinic Acid from Lignocellulose - 4 Bio Materials 1.5 kg 2006 BREW (2006) EU-25 Succinic Acid from Lignocellulose - 5 Bio Materials 2.4 kg 2006 BREW (2006) EU-25 Succinic Acid from Lignocellulose - 6 Bio Materials 1.2 kg 2006 BREW (2006) EU-25

Name: Database section:
Database sub-section:
kg CO2 eq/unit
Units: Year: Source: Location:
64
Succinic Acid from Sugar cane - 1 Bio Materials 3.5 kg 2006 BREW (2006) EU-25 Succinic Acid from Sugar cane - 2 Bio Materials 1.3 kg 2006 BREW (2006) EU-25 Succinic Acid from Sugar cane - 3 Bio Materials 1.8 kg 2006 BREW (2006) EU-25 Succinic Acid from Sugar cane - 4 Bio Materials 1.1 kg 2006 BREW (2006) EU-25 Succinic Acid from Sugar cane - 5 Bio Materials 2.1 kg 2006 BREW (2006) EU-25 Succinic Acid from Sugar cane - 6 Bio Materials 0.9 kg 2006 BREW (2006) EU-25
Aerated concrete block Building materials Materials 0.46675421 kg 2004 ILCD Europe
Aerated concrete block - reinforced Building materials Materials
0.519200362 kg 2004 ILCD Europe
Concrete - pre cast Building materials Materials 0.12089115 kg 2006 ILCD Europe
Concrete block - lightweight Building materials Materials
0.259405727 kg 2004 ILCD Europe
Gravel Building materials Materials
0.003394773 kg 2006 ILCD Europe
Gypsum Building materials Materials
0.002659467 kg 2005 ILCD Germany
Gypsum plaster - alpha hemihydrates Building materials Materials
0.243394883 kg 2002 ILCD Germany
Gypsum plaster - beta hemihydrates Building materials Materials
0.107624694 kg 2002 ILCD Germany
Gypsum2 Building materials Materials 0.04700000 kg 2006
Mortimer, N. et al. (2009) UK
Limestone Building materials Materials 1.06E-01 kg 2001 Natural stone council USA
Oriented strand board Building materials Materials
0.674196666 kg 2005 ILCD EU-27
Particle board - P2 Building materials Materials
0.875251249 kg 2005 ILCD EU-27
Particle board - P5 Building materials Materials
0.911399235 kg 2005 ILCD EU-27
Portland cement Building materials Materials
0.900408262 kg 2006 ILCD Europe
Rock wool Building materials Materials
1.135931511 kg 2006 ILCD Europe
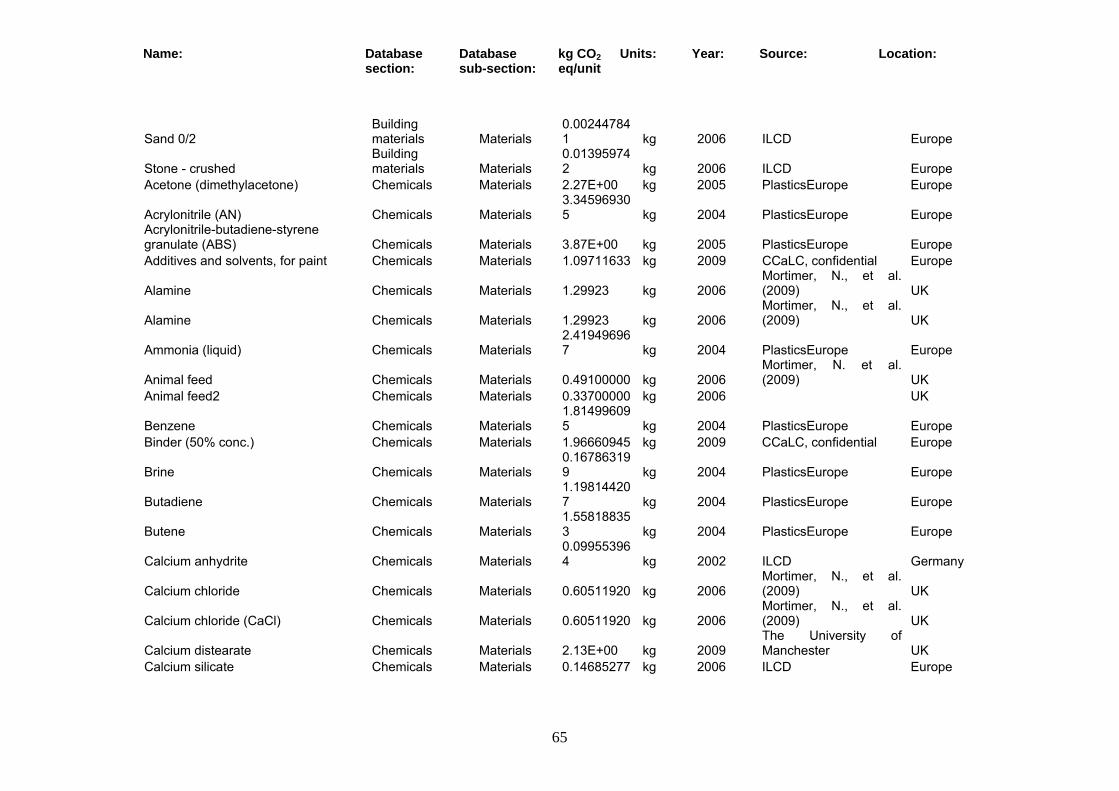
Name: Database section:
Database sub-section:
kg CO2 eq/unit
Units: Year: Source: Location:
65
Sand 0/2 Building materials Materials
0.002447841 kg 2006 ILCD Europe
Stone - crushed Building materials Materials
0.013959742 kg 2006 ILCD Europe
Acetone (dimethylacetone) Chemicals Materials 2.27E+00 kg 2005 PlasticsEurope Europe
Acrylonitrile (AN) Chemicals Materials 3.345969305 kg 2004 PlasticsEurope Europe
Acrylonitrile-butadiene-styrene granulate (ABS) Chemicals Materials 3.87E+00 kg 2005 PlasticsEurope Europe Additives and solvents, for paint Chemicals Materials 1.09711633 kg 2009 CCaLC, confidential Europe
Alamine Chemicals Materials 1.29923 kg 2006 Mortimer, N., et al. (2009) UK
Alamine Chemicals Materials 1.29923 kg 2006 Mortimer, N., et al. (2009) UK
Ammonia (liquid) Chemicals Materials 2.419496967 kg 2004 PlasticsEurope Europe
Animal feed Chemicals Materials 0.49100000 kg 2006 Mortimer, N. et al. (2009) UK
Animal feed2 Chemicals Materials 0.33700000 kg 2006 UK
Benzene Chemicals Materials 1.814996095 kg 2004 PlasticsEurope Europe
Binder (50% conc.) Chemicals Materials 1.96660945 kg 2009 CCaLC, confidential Europe
Brine Chemicals Materials 0.167863199 kg 2004 PlasticsEurope Europe
Butadiene Chemicals Materials 1.198144207 kg 2004 PlasticsEurope Europe
Butene Chemicals Materials 1.558188353 kg 2004 PlasticsEurope Europe
Calcium anhydrite Chemicals Materials 0.099553964 kg 2002 ILCD Germany
Calcium chloride Chemicals Materials 0.60511920 kg 2006 Mortimer, N., et al. (2009) UK
Calcium chloride (CaCl) Chemicals Materials 0.60511920 kg 2006 Mortimer, N., et al. (2009) UK
Calcium distearate Chemicals Materials 2.13E+00 kg 2009 The University of Manchester UK
Calcium silicate Chemicals Materials 0.14685277 kg 2006 ILCD Europe

Name: Database section:
Database sub-section:
kg CO2 eq/unit
Units: Year: Source: Location:
66
6
CaO from calcium carbonate Chemicals Materials 1.08700000 kg 2006 Mortimer, N., et al. (2009) UK
Carbon dioxide Chemicals Materials 0.264863124 kg 2006
Mortimer, N., et al. (2009) UK
Chlorine Chemicals Materials 1.161199651 kg 2004 PlasticsEurope Europe
Coke Chemicals Materials 3.33729200 kg 2006 Mortimer, N., et al. (2009) UK
Crude oil Chemicals Materials 0.197691964 kg 2004 PlasticsEurope Europe
Di (2-ethylhexyl) phthalate (DEHP) Chemicals Materials 1.99E+00 kg 2001 ECPI Europe
Diammonium phosphate (21% conc.) Chemicals Materials 0.06064600 kg 2006 Mortimer, N., et al. (2009) UK
Dichloroethane Chemicals Materials 1.670412184 kg 2004 PlasticsEurope Europe
Diesel Chemicals Materials 0.388080049 kg 2003 ILCD EU-15
Enzyme Alpha Amylase Chemicals Materials 1.59735490 kg 2006 Mortimer, N., et al. (2009) UK
Enzyme AMG Chemicals Materials 2.24955000 kg 2006 Mortimer, N., et al. (2009) UK
Epoxy resin Chemicals Materials 8.318863679 kg 2004 PlasticsEurope Europe
Ethanol Chemicals Materials 2.23383000 kg 2006 UK
Ethene Chemicals Materials 1.424599454 kg 2004 PlasticsEurope Europe
Ethyl benzene Chemicals Materials 1.985824873 kg 2004 PlasticsEurope Europe
Filler Chemicals Materials 0.04955408 kg 2009 CCaLC, confidential Europe
Gasoline Chemicals Materials 0.687659843 kg 2003 ILCD EU-15
Glass wool Chemicals Materials 2.805182957 kg 2006 ILCD Europe
Glass-bottle (100% recycled) Chemicals Materials 0.55616763 kg 2008 CCaLC Europe Glass-bottle (35.5% recycled) Chemicals Materials 0.78758635 kg 2008 CCaLC Europe
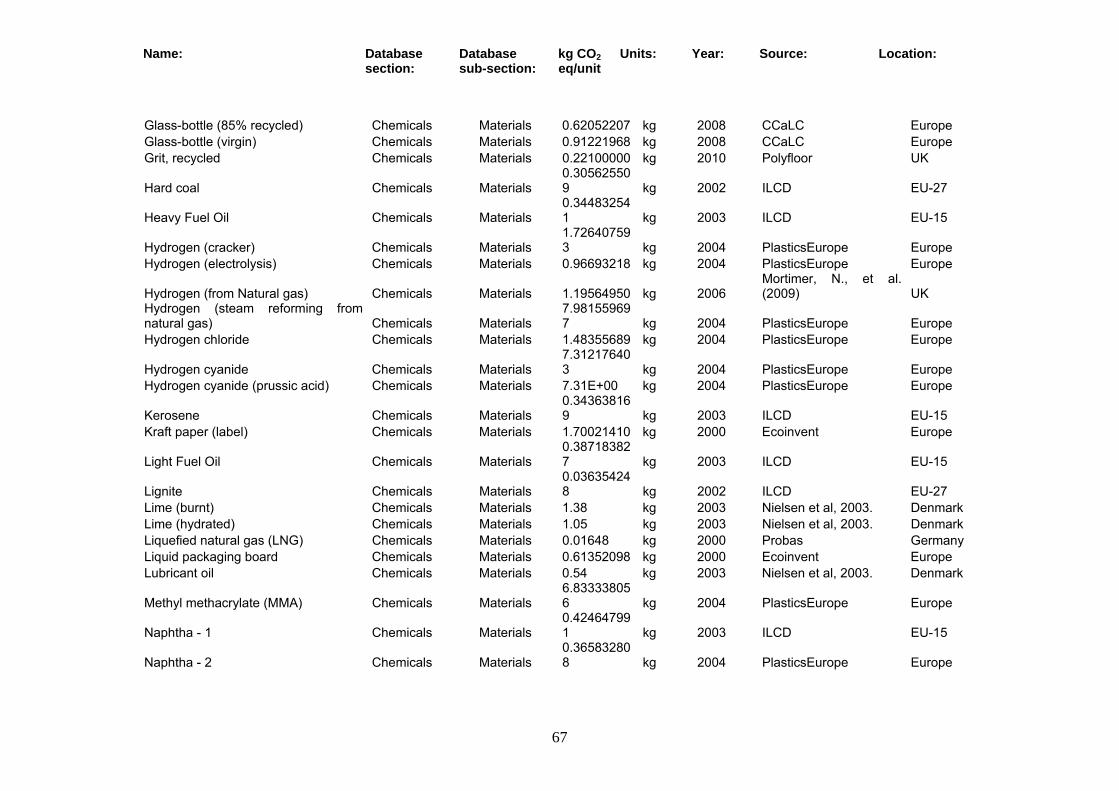
Name: Database section:
Database sub-section:
kg CO2 eq/unit
Units: Year: Source: Location:
67
Glass-bottle (85% recycled) Chemicals Materials 0.62052207 kg 2008 CCaLC Europe Glass-bottle (virgin) Chemicals Materials 0.91221968 kg 2008 CCaLC Europe Grit, recycled Chemicals Materials 0.22100000 kg 2010 Polyfloor UK
Hard coal Chemicals Materials 0.305625509 kg 2002 ILCD EU-27
Heavy Fuel Oil Chemicals Materials 0.344832541 kg 2003 ILCD EU-15
Hydrogen (cracker) Chemicals Materials 1.726407593 kg 2004 PlasticsEurope Europe
Hydrogen (electrolysis) Chemicals Materials 0.96693218 kg 2004 PlasticsEurope Europe
Hydrogen (from Natural gas) Chemicals Materials 1.19564950 kg 2006 Mortimer, N., et al. (2009) UK
Hydrogen (steam reforming from natural gas) Chemicals Materials
7.981559697 kg 2004 PlasticsEurope Europe
Hydrogen chloride Chemicals Materials 1.48355689 kg 2004 PlasticsEurope Europe
Hydrogen cyanide Chemicals Materials 7.312176403 kg 2004 PlasticsEurope Europe
Hydrogen cyanide (prussic acid) Chemicals Materials 7.31E+00 kg 2004 PlasticsEurope Europe
Kerosene Chemicals Materials 0.343638169 kg 2003 ILCD EU-15
Kraft paper (label) Chemicals Materials 1.70021410 kg 2000 Ecoinvent Europe
Light Fuel Oil Chemicals Materials 0.387183827 kg 2003 ILCD EU-15
Lignite Chemicals Materials 0.036354248 kg 2002 ILCD EU-27
Lime (burnt) Chemicals Materials 1.38 kg 2003 Nielsen et al, 2003. Denmark Lime (hydrated) Chemicals Materials 1.05 kg 2003 Nielsen et al, 2003. Denmark Liquefied natural gas (LNG) Chemicals Materials 0.01648 kg 2000 Probas Germany Liquid packaging board Chemicals Materials 0.61352098 kg 2000 Ecoinvent Europe Lubricant oil Chemicals Materials 0.54 kg 2003 Nielsen et al, 2003. Denmark
Methyl methacrylate (MMA) Chemicals Materials 6.833338056 kg 2004 PlasticsEurope Europe
Naphtha - 1 Chemicals Materials 0.424647991 kg 2003 ILCD EU-15
Naphtha - 2 Chemicals Materials 0.365832808 kg 2004 PlasticsEurope Europe
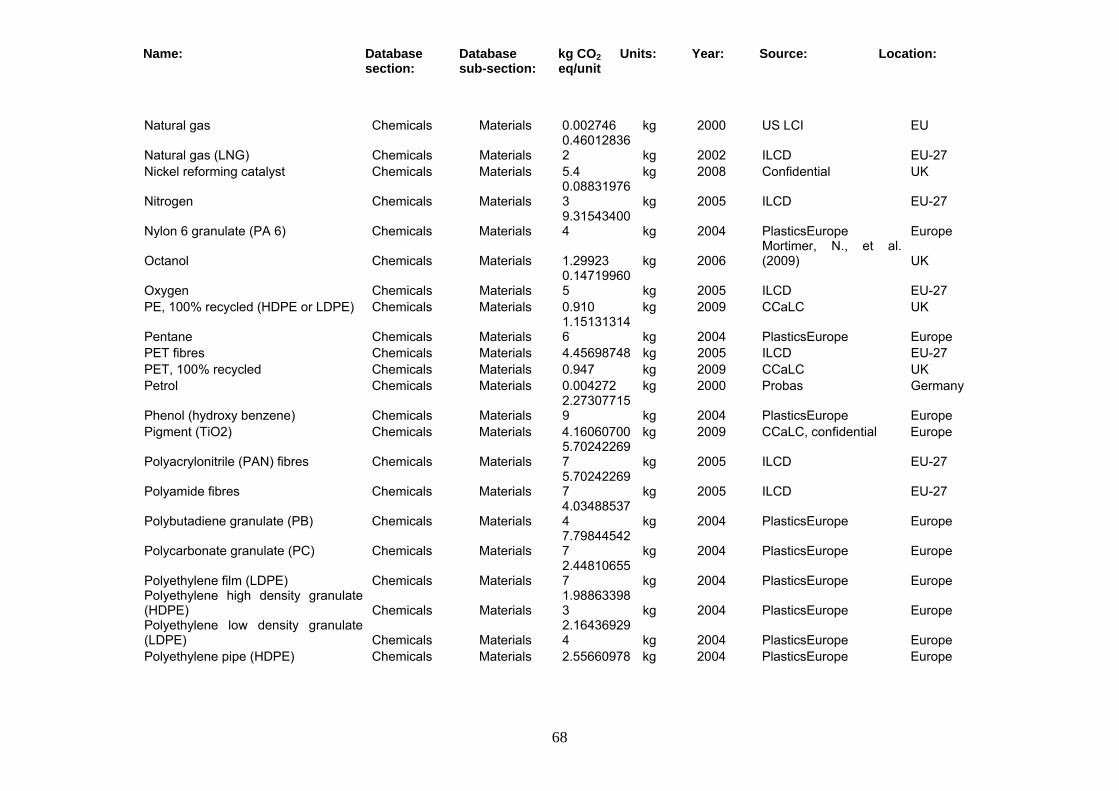
Name: Database section:
Database sub-section:
kg CO2 eq/unit
Units: Year: Source: Location:
68
Natural gas Chemicals Materials 0.002746 kg 2000 US LCI EU
Natural gas (LNG) Chemicals Materials 0.460128362 kg 2002 ILCD EU-27
Nickel reforming catalyst Chemicals Materials 5.4 kg 2008 Confidential UK
Nitrogen Chemicals Materials 0.088319763 kg 2005 ILCD EU-27
Nylon 6 granulate (PA 6) Chemicals Materials 9.315434004 kg 2004 PlasticsEurope Europe
Octanol Chemicals Materials 1.29923 kg 2006 Mortimer, N., et al. (2009) UK
Oxygen Chemicals Materials 0.147199605 kg 2005 ILCD EU-27
PE, 100% recycled (HDPE or LDPE) Chemicals Materials 0.910 kg 2009 CCaLC UK
Pentane Chemicals Materials 1.151313146 kg 2004 PlasticsEurope Europe
PET fibres Chemicals Materials 4.45698748 kg 2005 ILCD EU-27 PET, 100% recycled Chemicals Materials 0.947 kg 2009 CCaLC UK Petrol Chemicals Materials 0.004272 kg 2000 Probas Germany
Phenol (hydroxy benzene) Chemicals Materials 2.273077159 kg 2004 PlasticsEurope Europe
Pigment (TiO2) Chemicals Materials 4.16060700 kg 2009 CCaLC, confidential Europe
Polyacrylonitrile (PAN) fibres Chemicals Materials 5.702422697 kg 2005 ILCD EU-27
Polyamide fibres Chemicals Materials 5.702422697 kg 2005 ILCD EU-27
Polybutadiene granulate (PB) Chemicals Materials 4.034885374 kg 2004 PlasticsEurope Europe
Polycarbonate granulate (PC) Chemicals Materials 7.798445427 kg 2004 PlasticsEurope Europe
Polyethylene film (LDPE) Chemicals Materials 2.448106557 kg 2004 PlasticsEurope Europe
Polyethylene high density granulate (HDPE) Chemicals Materials
1.988633983 kg 2004 PlasticsEurope Europe
Polyethylene low density granulate (LDPE) Chemicals Materials
2.164369294 kg 2004 PlasticsEurope Europe
Polyethylene pipe (HDPE) Chemicals Materials 2.55660978 kg 2004 PlasticsEurope Europe
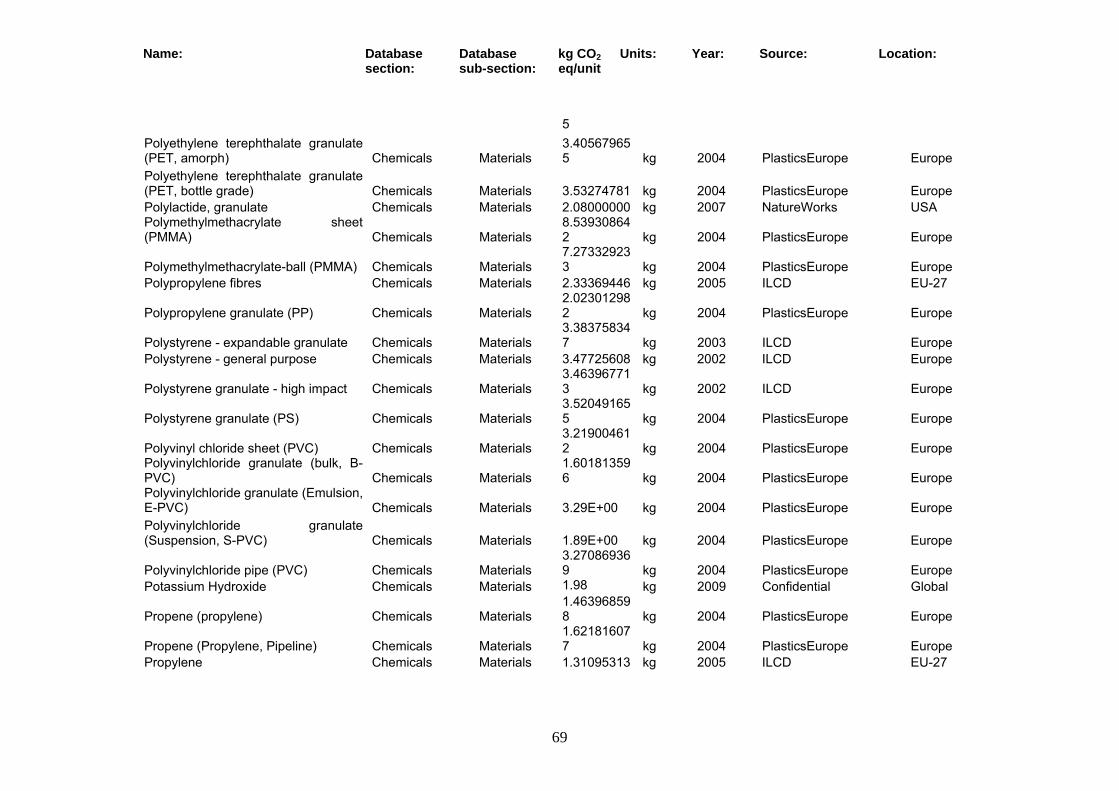
Name: Database section:
Database sub-section:
kg CO2 eq/unit
Units: Year: Source: Location:
69
5
Polyethylene terephthalate granulate (PET, amorph) Chemicals Materials
3.405679655 kg 2004 PlasticsEurope Europe
Polyethylene terephthalate granulate (PET, bottle grade) Chemicals Materials 3.53274781 kg 2004 PlasticsEurope Europe Polylactide, granulate Chemicals Materials 2.08000000 kg 2007 NatureWorks USA Polymethylmethacrylate sheet (PMMA) Chemicals Materials
8.539308642 kg 2004 PlasticsEurope Europe
Polymethylmethacrylate-ball (PMMA) Chemicals Materials 7.273329233 kg 2004 PlasticsEurope Europe
Polypropylene fibres Chemicals Materials 2.33369446 kg 2005 ILCD EU-27
Polypropylene granulate (PP) Chemicals Materials 2.023012982 kg 2004 PlasticsEurope Europe
Polystyrene - expandable granulate Chemicals Materials 3.383758347 kg 2003 ILCD Europe
Polystyrene - general purpose Chemicals Materials 3.47725608 kg 2002 ILCD Europe
Polystyrene granulate - high impact Chemicals Materials 3.463967713 kg 2002 ILCD Europe
Polystyrene granulate (PS) Chemicals Materials 3.520491655 kg 2004 PlasticsEurope Europe
Polyvinyl chloride sheet (PVC) Chemicals Materials 3.219004612 kg 2004 PlasticsEurope Europe
Polyvinylchloride granulate (bulk, B-PVC) Chemicals Materials
1.601813596 kg 2004 PlasticsEurope Europe
Polyvinylchloride granulate (Emulsion, E-PVC) Chemicals Materials 3.29E+00 kg 2004 PlasticsEurope Europe Polyvinylchloride granulate (Suspension, S-PVC) Chemicals Materials 1.89E+00 kg 2004 PlasticsEurope Europe
Polyvinylchloride pipe (PVC) Chemicals Materials 3.270869369 kg 2004 PlasticsEurope Europe
Potassium Hydroxide Chemicals Materials 1.98 kg 2009 Confidential Global
Propene (propylene) Chemicals Materials 1.463968598 kg 2004 PlasticsEurope Europe
Propene (Propylene, Pipeline) Chemicals Materials 1.621816077 kg 2004 PlasticsEurope Europe
Propylene Chemicals Materials 1.31095313 kg 2005 ILCD EU-27

Name: Database section:
Database sub-section:
kg CO2 eq/unit
Units: Year: Source: Location:
70
PVC chips (jazz from recycling) Chemicals Materials 0.048421395 kg 2009
The University of Manchester UK
PVC chips (white from recycling) Chemicals Materials 0.06083369 kg 2009 The University of Manchester UK
PVC pellets (black from recycling) Chemicals Materials 0.190278513 kg 2009
The University of Manchester UK
PVC pulver (jazz from recycling) Chemicals Materials 0.078867473 kg 2009
The University of Manchester UK
PVC, recycled - 2mm granule Chemicals Materials 0.37450000 kg 2010 Polyfloor UK PVC, recycled - 6mm granule Chemicals Materials 0.22160000 kg 2010 Polyfloor UK Rapeseed oil Chemicals Materials 1.207 kg 2009 Confidential Germany
Silica sand (flour) Chemicals Materials 0.311326746 kg 2005 ILCD Germany
Sodium Chloride Chemicals Materials 2.01E-01 kg 2005 PlasticsEurope Europe Sodium hydroxide (100%; caustic soda) Chemicals Materials
1.424593288 kg 2004 PlasticsEurope Europe
Sodium hydroxide (Caustic soda 49% conc.) Chemicals Materials 1.20406310 kg 2006
Mortimer, N., et al. (2009) UK
Solvent-based white paint (0.75 l packaging) Chemicals Materials 3.54835547 kg 2009 Confidential UK Solvent-based white paint (2.5 l packaging) Chemicals Materials 3.54469967 kg 2009 Confidential UK Solvent-free white paint (10 l packaging)-1 Chemicals Materials 1.63653147 kg 2009 Confidential UK Solvent-free white paint (10 l packaging)-2 Chemicals Materials 1.68368850 kg 2009 Confidential UK Solvent-free white paint (2.5 l packaging) Chemicals Materials 1.73706402 kg 2009 Confidential UK Solvent-free white paint (2.5 l PP packaging) Chemicals Materials 4.20613180 litre 2008 Confidential UK Soya bean oil Chemicals Materials 5.89E-01 kg 2009 USLCI USA
Styrene Chemicals Materials 3.139958676 kg 2004 PlasticsEurope Europe
Sulphur Chemicals Materials 0.550277285 kg 2003 ILCD EU-15
Sulphuric acid (93% conc.) Chemicals Materials 0.13680960 kg 2006 Mortimer, N., et al. (2009) UK

Name: Database section:
Database sub-section:
kg CO2 eq/unit
Units: Year: Source: Location:
71
Toluene (methyl benzene) Chemicals Materials 1.521953026 kg 2004 PlasticsEurope Europe
Vinasses Chemicals Materials 0.63700000 kg 2006 Mortimer et al. (2009) UK
Vinyl chloride (VCM; Chloroethane) Chemicals Materials 2.105323946 kg 2004 PlasticsEurope Europe
Xylene (dimethyl benzene) Chemicals Materials 1.661019547 kg 2004 PlasticsEurope Europe
Zinc stearate Chemicals Materials 1.646010557 kg 2009
The University of Manchester UK
Carbon dioxide (CO2) Chemicals & related Materials 0.26486310 kg 2006
Mortimer, N., et al. (2009) UK
Bio-diesel from rape-seed Energy 0.05835 MJ 2010 HGCA UK Bio-ethanol from corn Energy 0.0643 MJ 2010 HGCA UK
Diesel (used in farm machinery) Energy 0.07800000 MJ 2006 Mortimer, N., et al. (2009) UK
Electricity - hydro Energy 0.006774731 MJ 2002 ILCD Europe
Electricity - wind Energy 0.001832095 MJ 2002 ILCD Europe
Electricity (high voltage) - AT grid Energy 0.089969726 MJ 2002 ILCD Austria
Electricity (high voltage) - BE grid Energy 0.110190978 MJ 2002 ILCD Belgium
Electricity (high voltage) - CH grid Energy 0.022616745 MJ 2002 ILCD Switzerland
Electricity (high voltage) - CZ grid Energy 0.212463866 MJ 2002 ILCD Czech Rep.
Electricity (high voltage) - DE grid Energy 0.190541087 MJ 2002 ILCD Germany
Electricity (high voltage) - DK grid Energy 0.20981789 MJ 2002 ILCD Denmark
Electricity (high voltage) - EE grid Energy 0.386982391 MJ 2002 ILCD Estonia
Electricity (high voltage) - ES grid Energy 0.175528933 MJ 2002 ILCD Spain
Electricity (high voltage) - FI grid Energy 0.139126081 MJ 2002 ILCD Finland
Electricity (high voltage) - FR grid Energy 0.04046066 MJ 2002 ILCD France

Name: Database section:
Database sub-section:
kg CO2 eq/unit
Units: Year: Source: Location:
72
1
Electricity (high voltage) - GR grid Energy 0.306782899 MJ 2002 ILCD Greece
Electricity (high voltage) - HU grid Energy 0.173482309 MJ 2002 ILCD Hungary
Electricity (high voltage) - IE grid Energy 0.227691644 MJ 2002 ILCD Ireland
Electricity (high voltage) - IS grid Energy 0.00623 MJ 2002 ILCD Iceland
Electricity (high voltage) - IT grid Energy 0.188657907 MJ 2002 ILCD Italy
Electricity (high voltage) - LT grid Energy 0.049589751 MJ 2002 ILCD Lithuania
Electricity (high voltage) - LU grid Energy 0.162705291 MJ 2002 ILCD
Luxembourg
Electricity (high voltage) - LV grid Energy 0.14358736 MJ 2002 ILCD Latvia
Electricity (high voltage) - NL grid Energy 0.197594215 MJ 2002 ILCD
Netherlands
Electricity (high voltage) - NO grid Energy 0.00813593 MJ 2002 ILCD Norway
Electricity (high voltage) - PO grid Energy 0.303011353 MJ 2002 ILCD Poland
Electricity (high voltage) - PT grid Energy 0.211454346 MJ 2002 ILCD Portugal
Electricity (high voltage) - SE grid Energy 0.029327746 MJ 2002 ILCD Sweden
Electricity (high voltage) - SI grid Energy 0.163362301 MJ 2002 ILCD Slovenia
Electricity (high voltage) - SK grid Energy 0.095964396 MJ 2002 ILCD Slovakia
Electricity (high voltage) - UK grid Energy 0.173566397 MJ 2002 ILCD UK
Electricity (high voltage) - European grid Energy
0.155210997 MJ 2002 ILCD EU-27
Electricity (imported) Energy 0.13100000 MJ 2010 Confidential UK
Electricity (low voltage) - BE grid Energy 0.112627411 MJ 2002 ILCD Belgium
Electricity (low voltage) - CH grid Energy 0.023978008 MJ 2002 ILCD Switzerland
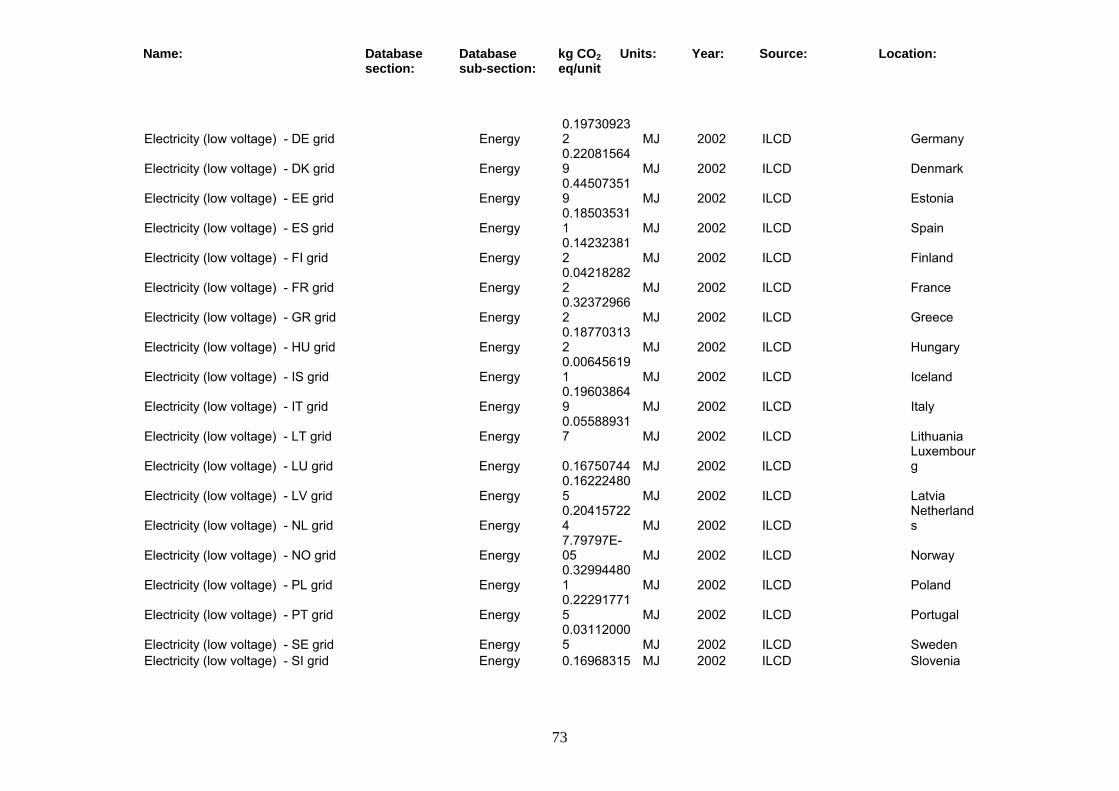
Name: Database section:
Database sub-section:
kg CO2 eq/unit
Units: Year: Source: Location:
73
Electricity (low voltage) - DE grid Energy 0.197309232 MJ 2002 ILCD Germany
Electricity (low voltage) - DK grid Energy 0.220815649 MJ 2002 ILCD Denmark
Electricity (low voltage) - EE grid Energy 0.445073519 MJ 2002 ILCD Estonia
Electricity (low voltage) - ES grid Energy 0.185035311 MJ 2002 ILCD Spain
Electricity (low voltage) - FI grid Energy 0.142323812 MJ 2002 ILCD Finland
Electricity (low voltage) - FR grid Energy 0.042182822 MJ 2002 ILCD France
Electricity (low voltage) - GR grid Energy 0.323729662 MJ 2002 ILCD Greece
Electricity (low voltage) - HU grid Energy 0.187703132 MJ 2002 ILCD Hungary
Electricity (low voltage) - IS grid Energy 0.006456191 MJ 2002 ILCD Iceland
Electricity (low voltage) - IT grid Energy 0.196038649 MJ 2002 ILCD Italy
Electricity (low voltage) - LT grid Energy 0.055889317 MJ 2002 ILCD Lithuania
Electricity (low voltage) - LU grid Energy 0.16750744 MJ 2002 ILCD Luxembourg
Electricity (low voltage) - LV grid Energy 0.162224805 MJ 2002 ILCD Latvia
Electricity (low voltage) - NL grid Energy 0.204157224 MJ 2002 ILCD
Netherlands
Electricity (low voltage) - NO grid Energy 7.79797E-05 MJ 2002 ILCD Norway
Electricity (low voltage) - PL grid Energy 0.329944801 MJ 2002 ILCD Poland
Electricity (low voltage) - PT grid Energy 0.222917715 MJ 2002 ILCD Portugal
Electricity (low voltage) - SE grid Energy 0.031120005 MJ 2002 ILCD Sweden
Electricity (low voltage) - SI grid Energy 0.16968315 MJ 2002 ILCD Slovenia
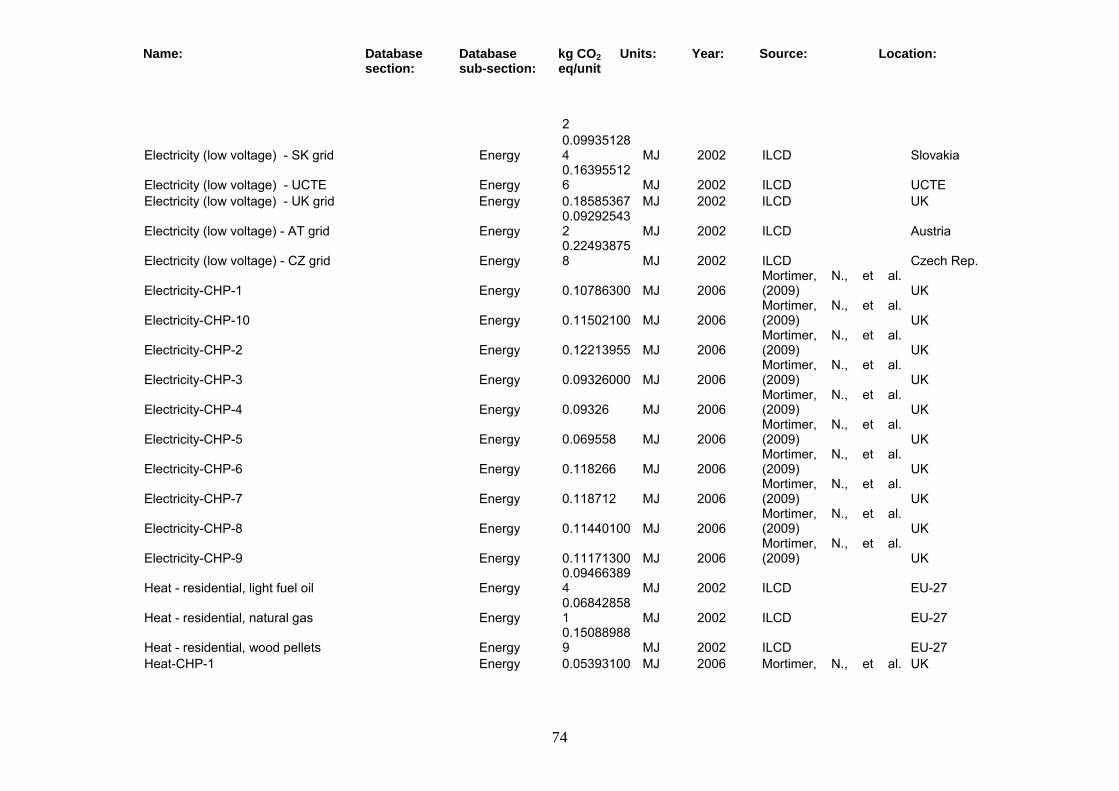
Name: Database section:
Database sub-section:
kg CO2 eq/unit
Units: Year: Source: Location:
74
2
Electricity (low voltage) - SK grid Energy 0.099351284 MJ 2002 ILCD Slovakia
Electricity (low voltage) - UCTE Energy 0.163955126 MJ 2002 ILCD UCTE
Electricity (low voltage) - UK grid Energy 0.18585367 MJ 2002 ILCD UK
Electricity (low voltage) - AT grid Energy 0.092925432 MJ 2002 ILCD Austria
Electricity (low voltage) - CZ grid Energy 0.224938758 MJ 2002 ILCD Czech Rep.
Electricity-CHP-1 Energy 0.10786300 MJ 2006 Mortimer, N., et al. (2009) UK
Electricity-CHP-10 Energy 0.11502100 MJ 2006 Mortimer, N., et al. (2009) UK
Electricity-CHP-2 Energy 0.12213955 MJ 2006 Mortimer, N., et al. (2009) UK
Electricity-CHP-3 Energy 0.09326000 MJ 2006 Mortimer, N., et al. (2009) UK
Electricity-CHP-4 Energy 0.09326 MJ 2006 Mortimer, N., et al. (2009) UK
Electricity-CHP-5 Energy 0.069558 MJ 2006 Mortimer, N., et al. (2009) UK
Electricity-CHP-6 Energy 0.118266 MJ 2006 Mortimer, N., et al. (2009) UK
Electricity-CHP-7 Energy 0.118712 MJ 2006 Mortimer, N., et al. (2009) UK
Electricity-CHP-8 Energy 0.11440100 MJ 2006 Mortimer, N., et al. (2009) UK
Electricity-CHP-9 Energy 0.11171300 MJ 2006 Mortimer, N., et al. (2009) UK
Heat - residential, light fuel oil Energy 0.094663894 MJ 2002 ILCD EU-27
Heat - residential, natural gas Energy 0.068428581 MJ 2002 ILCD EU-27
Heat - residential, wood pellets Energy 0.150889889 MJ 2002 ILCD EU-27
Heat-CHP-1 Energy 0.05393100 MJ 2006 Mortimer, N., et al. UK
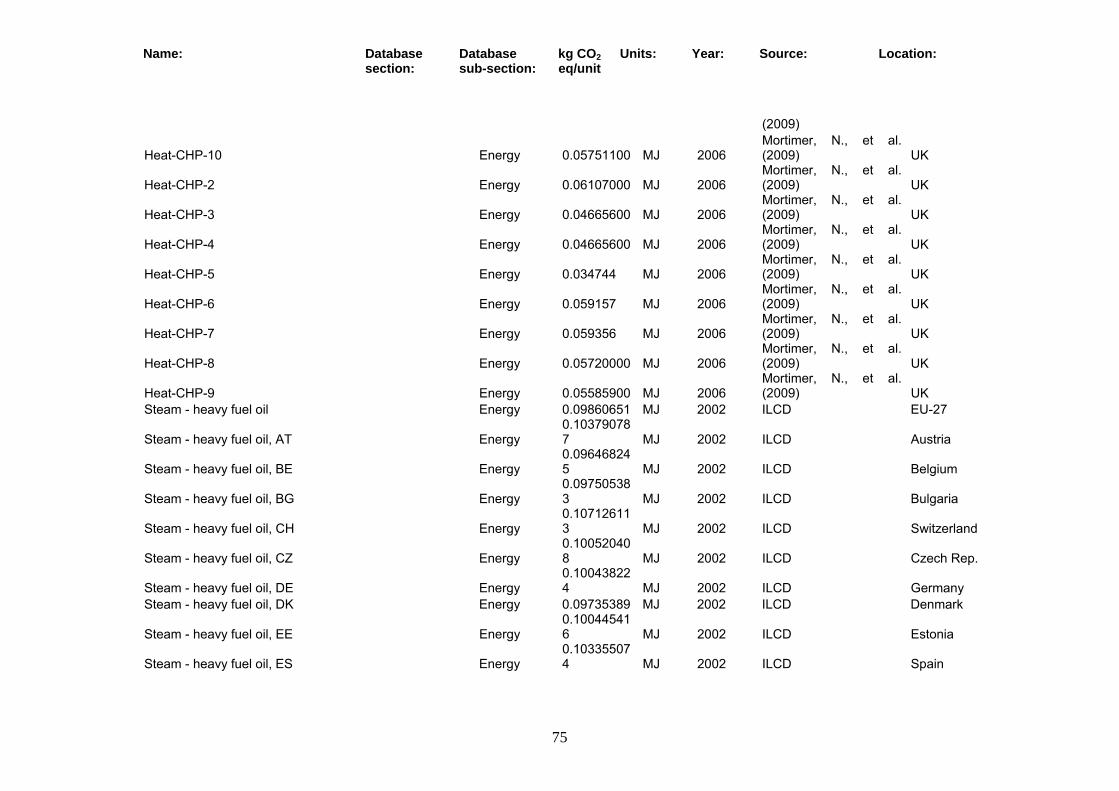
Name: Database section:
Database sub-section:
kg CO2 eq/unit
Units: Year: Source: Location:
75
(2009)
Heat-CHP-10 Energy 0.05751100 MJ 2006 Mortimer, N., et al. (2009) UK
Heat-CHP-2 Energy 0.06107000 MJ 2006 Mortimer, N., et al. (2009) UK
Heat-CHP-3 Energy 0.04665600 MJ 2006 Mortimer, N., et al. (2009) UK
Heat-CHP-4 Energy 0.04665600 MJ 2006 Mortimer, N., et al. (2009) UK
Heat-CHP-5 Energy 0.034744 MJ 2006 Mortimer, N., et al. (2009) UK
Heat-CHP-6 Energy 0.059157 MJ 2006 Mortimer, N., et al. (2009) UK
Heat-CHP-7 Energy 0.059356 MJ 2006 Mortimer, N., et al. (2009) UK
Heat-CHP-8 Energy 0.05720000 MJ 2006 Mortimer, N., et al. (2009) UK
Heat-CHP-9 Energy 0.05585900 MJ 2006 Mortimer, N., et al. (2009) UK
Steam - heavy fuel oil Energy 0.09860651 MJ 2002 ILCD EU-27
Steam - heavy fuel oil, AT Energy 0.103790787 MJ 2002 ILCD Austria
Steam - heavy fuel oil, BE Energy 0.096468245 MJ 2002 ILCD Belgium
Steam - heavy fuel oil, BG Energy 0.097505383 MJ 2002 ILCD Bulgaria
Steam - heavy fuel oil, CH Energy 0.107126113 MJ 2002 ILCD Switzerland
Steam - heavy fuel oil, CZ Energy 0.100520408 MJ 2002 ILCD Czech Rep.
Steam - heavy fuel oil, DE Energy 0.100438224 MJ 2002 ILCD Germany
Steam - heavy fuel oil, DK Energy 0.09735389 MJ 2002 ILCD Denmark
Steam - heavy fuel oil, EE Energy 0.100445416 MJ 2002 ILCD Estonia
Steam - heavy fuel oil, ES Energy 0.103355074 MJ 2002 ILCD Spain

Name: Database section:
Database sub-section:
kg CO2 eq/unit
Units: Year: Source: Location:
76
Steam - heavy fuel oil, FI Energy 0.098307817 MJ 2002 ILCD Finland
Steam - heavy fuel oil, FR Energy 0.098566521 MJ 2002 ILCD France
Steam - heavy fuel oil, GR Energy 0.099799941 MJ 2002 ILCD Greece
Steam - heavy fuel oil, HU Energy 0.09987564 MJ 2002 ILCD Hungary
Steam - heavy fuel oil, IE Energy 0.094183898 MJ 2002 ILCD Ireland
Steam - heavy fuel oil, IT Energy 0.100813481 MJ 2002 ILCD Italy
Steam - heavy fuel oil, LT Energy 0.099887398 MJ 2002 ILCD Lithuania
Steam - heavy fuel oil, LV Energy 0.099887396 MJ 2002 ILCD Latvia
Steam - heavy fuel oil, NL Energy 0.097289353 MJ 2002 ILCD
Netherlands
Steam - heavy fuel oil, NO Energy 0.093758523 MJ 2002 ILCD Norway
Steam - heavy fuel oil, PO Energy 0.100451303 MJ 2002 ILCD Poland
Steam - heavy fuel oil, PT Energy 0.103012425 MJ 2002 ILCD Portugal
Steam - heavy fuel oil, RO Energy 0.097573174 MJ 2002 ILCD Romania
Steam - heavy fuel oil, SE Energy 0.096308168 MJ 2002 ILCD Sweden
Steam - heavy fuel oil, SI Energy 0.098433618 MJ 2002 ILCD Slovenia
Steam - heavy fuel oil, SK Energy 0.100064426 MJ 2002 ILCD Slovakia
Steam - heavy fuel oil, UK Energy 0.094937684 MJ 2002 ILCD GB
Steam - light fuel oil Energy 0.092831144 MJ 2002 ILCD EU-27
Steam - light fuel oil, AT Energy 0.093417093 MJ 2002 ILCD Austria
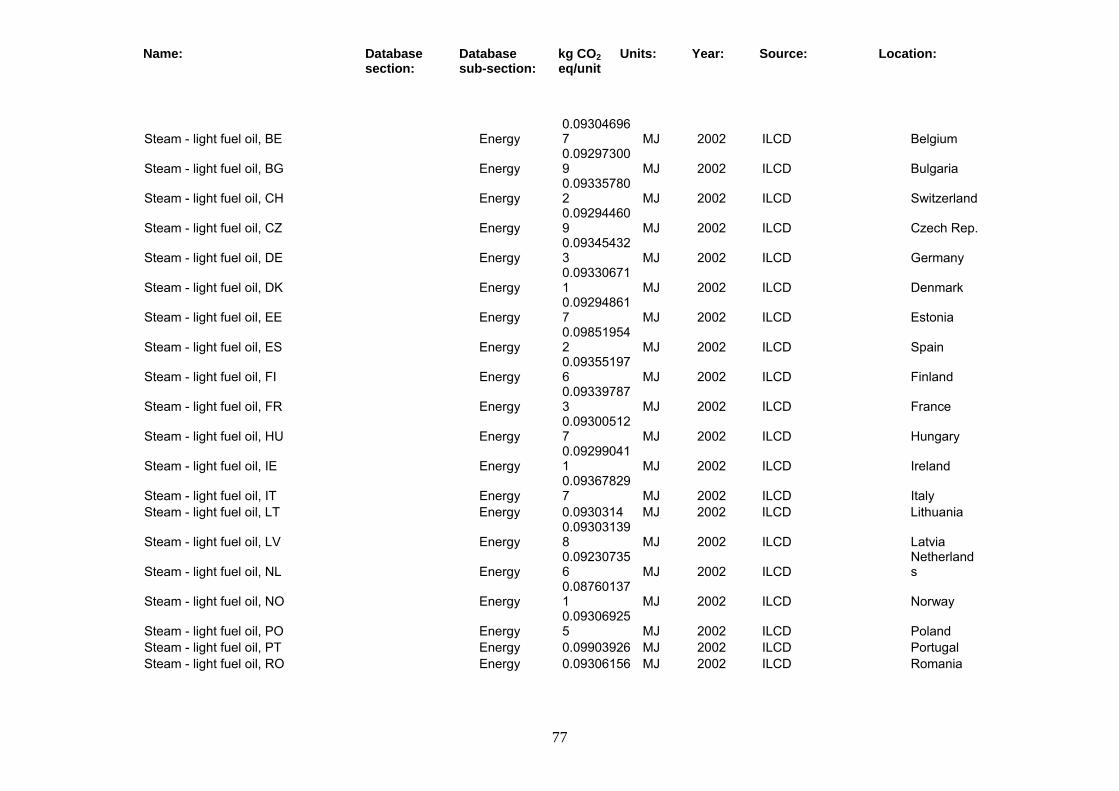
Name: Database section:
Database sub-section:
kg CO2 eq/unit
Units: Year: Source: Location:
77
Steam - light fuel oil, BE Energy 0.093046967 MJ 2002 ILCD Belgium
Steam - light fuel oil, BG Energy 0.092973009 MJ 2002 ILCD Bulgaria
Steam - light fuel oil, CH Energy 0.093357802 MJ 2002 ILCD Switzerland
Steam - light fuel oil, CZ Energy 0.092944609 MJ 2002 ILCD Czech Rep.
Steam - light fuel oil, DE Energy 0.093454323 MJ 2002 ILCD Germany
Steam - light fuel oil, DK Energy 0.093306711 MJ 2002 ILCD Denmark
Steam - light fuel oil, EE Energy 0.092948617 MJ 2002 ILCD Estonia
Steam - light fuel oil, ES Energy 0.098519542 MJ 2002 ILCD Spain
Steam - light fuel oil, FI Energy 0.093551976 MJ 2002 ILCD Finland
Steam - light fuel oil, FR Energy 0.093397873 MJ 2002 ILCD France
Steam - light fuel oil, HU Energy 0.093005127 MJ 2002 ILCD Hungary
Steam - light fuel oil, IE Energy 0.092990411 MJ 2002 ILCD Ireland
Steam - light fuel oil, IT Energy 0.093678297 MJ 2002 ILCD Italy
Steam - light fuel oil, LT Energy 0.0930314 MJ 2002 ILCD Lithuania
Steam - light fuel oil, LV Energy 0.093031398 MJ 2002 ILCD Latvia
Steam - light fuel oil, NL Energy 0.092307356 MJ 2002 ILCD
Netherlands
Steam - light fuel oil, NO Energy 0.087601371 MJ 2002 ILCD Norway
Steam - light fuel oil, PO Energy 0.093069255 MJ 2002 ILCD Poland
Steam - light fuel oil, PT Energy 0.09903926 MJ 2002 ILCD Portugal Steam - light fuel oil, RO Energy 0.09306156 MJ 2002 ILCD Romania

Name: Database section:
Database sub-section:
kg CO2 eq/unit
Units: Year: Source: Location:
78
4
Steam - light fuel oil, SE Energy 0.090385919 MJ 2002 ILCD Sweden
Steam - light fuel oil, SI Energy 0.09305668 MJ 2002 ILCD Slovenia
Steam - light fuel oil, SK Energy 0.092991945 MJ 2002 ILCD Slovakia
Steam - light fuel oil, UK Energy 0.090515645 MJ 2002 ILCD GB
Steam - natural gas Energy 0.072460414 MJ 2002 ILCD EU-27
Steam - natural gas, AT Energy 0.076223884 MJ 2002 ILCD Austria
Steam - natural gas, BE Energy 0.070403056 MJ 2002 ILCD Belgium
Steam - natural gas, BG Energy 0.074393048 MJ 2002 ILCD Bulgaria
Steam - natural gas, CH Energy 0.069254553 MJ 2002 ILCD Switzerland
Steam - natural gas, CZ Energy 0.07908639 MJ 2002 ILCD Czech Rep.
Steam - natural gas, DE Energy 0.071754351 MJ 2002 ILCD Germany
Steam - natural gas, DK Energy 0.068562343 MJ 2002 ILCD Denmark
Steam - natural gas, EE Energy 0.077712161 MJ 2002 ILCD Estonia
Steam - natural gas, ES Energy 0.082370147 MJ 2002 ILCD Spain
Steam - natural gas, FI Energy 0.077452915 MJ 2002 ILCD Finland
Steam - natural gas, FR Energy 0.076812499 MJ 2002 ILCD France
Steam - natural gas, GR Energy 0.078362537 MJ 2002 ILCD Greece
Steam - natural gas, HU Energy 0.07823031 MJ 2002 ILCD Hungary
Steam - natural gas, IE Energy 0.068383405 MJ 2002 ILCD Ireland
Steam - natural gas, IT Energy 0.07974463 MJ 2002 ILCD Italy
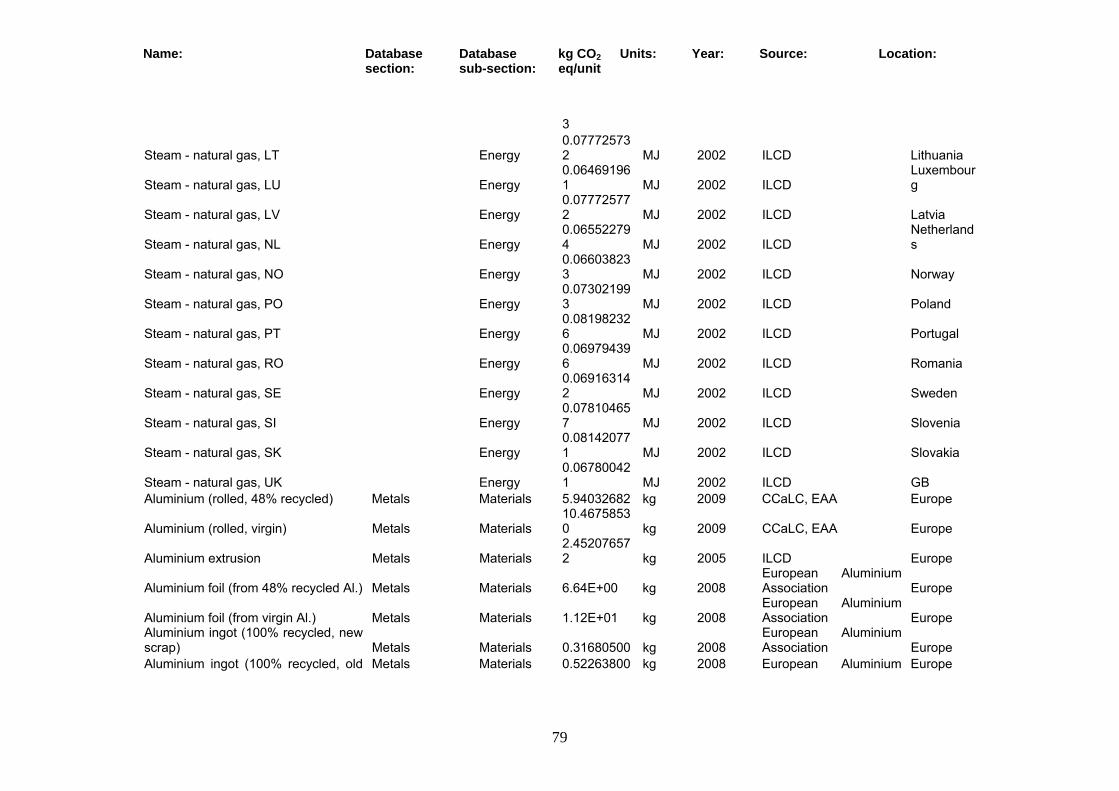
Name: Database section:
Database sub-section:
kg CO2 eq/unit
Units: Year: Source: Location:
79
3
Steam - natural gas, LT Energy 0.077725732 MJ 2002 ILCD Lithuania
Steam - natural gas, LU Energy 0.064691961 MJ 2002 ILCD
Luxembourg
Steam - natural gas, LV Energy 0.077725772 MJ 2002 ILCD Latvia
Steam - natural gas, NL Energy 0.065522794 MJ 2002 ILCD
Netherlands
Steam - natural gas, NO Energy 0.066038233 MJ 2002 ILCD Norway
Steam - natural gas, PO Energy 0.073021993 MJ 2002 ILCD Poland
Steam - natural gas, PT Energy 0.081982326 MJ 2002 ILCD Portugal
Steam - natural gas, RO Energy 0.069794396 MJ 2002 ILCD Romania
Steam - natural gas, SE Energy 0.069163142 MJ 2002 ILCD Sweden
Steam - natural gas, SI Energy 0.078104657 MJ 2002 ILCD Slovenia
Steam - natural gas, SK Energy 0.081420771 MJ 2002 ILCD Slovakia
Steam - natural gas, UK Energy 0.067800421 MJ 2002 ILCD GB
Aluminium (rolled, 48% recycled) Metals Materials 5.94032682 kg 2009 CCaLC, EAA Europe
Aluminium (rolled, virgin) Metals Materials 10.46758530 kg 2009 CCaLC, EAA Europe
Aluminium extrusion Metals Materials 2.452076572 kg 2005 ILCD Europe
Aluminium foil (from 48% recycled Al.) Metals Materials 6.64E+00 kg 2008 European Aluminium Association Europe
Aluminium foil (from virgin Al.) Metals Materials 1.12E+01 kg 2008 European Aluminium Association Europe
Aluminium ingot (100% recycled, new scrap) Metals Materials 0.31680500 kg 2008
European Aluminium Association Europe
Aluminium ingot (100% recycled, old Metals Materials 0.52263800 kg 2008 European Aluminium Europe
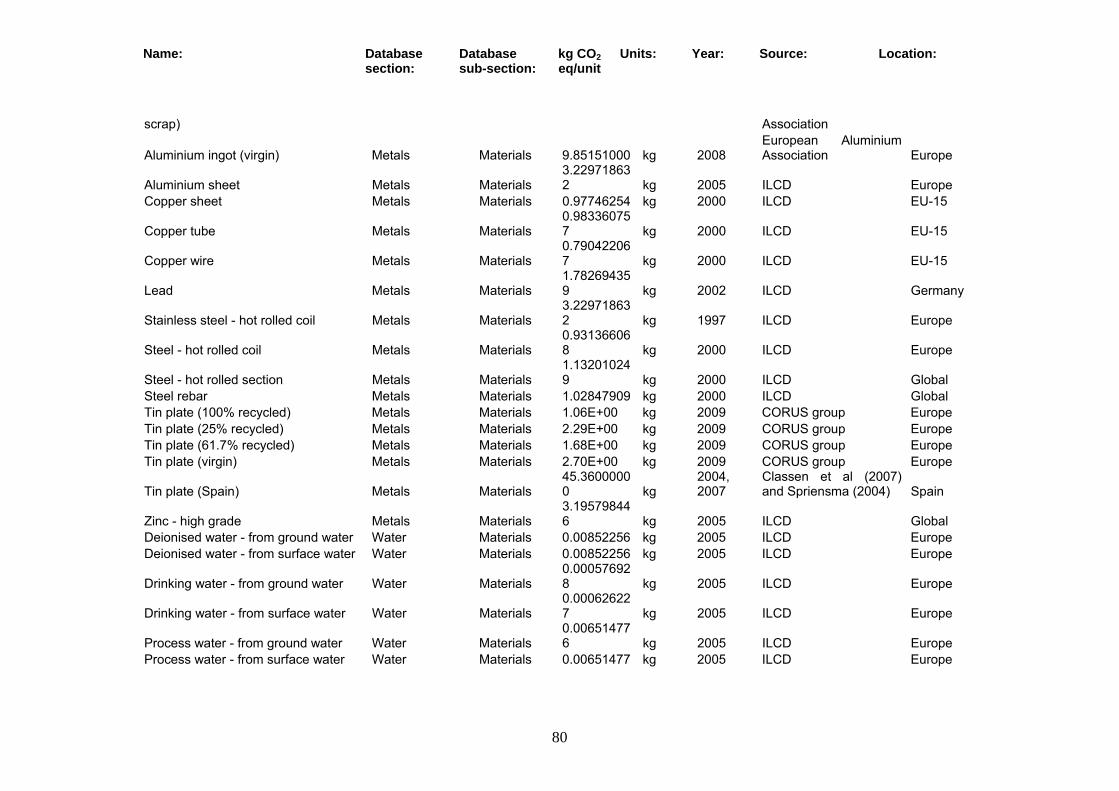
Name: Database section:
Database sub-section:
kg CO2 eq/unit
Units: Year: Source: Location:
80
scrap) Association
Aluminium ingot (virgin) Metals Materials 9.85151000 kg 2008 European Aluminium Association Europe
Aluminium sheet Metals Materials 3.229718632 kg 2005 ILCD Europe
Copper sheet Metals Materials 0.97746254 kg 2000 ILCD EU-15
Copper tube Metals Materials 0.983360757 kg 2000 ILCD EU-15
Copper wire Metals Materials 0.790422067 kg 2000 ILCD EU-15
Lead Metals Materials 1.782694359 kg 2002 ILCD Germany
Stainless steel - hot rolled coil Metals Materials 3.229718632 kg 1997 ILCD Europe
Steel - hot rolled coil Metals Materials 0.931366068 kg 2000 ILCD Europe
Steel - hot rolled section Metals Materials 1.132010249 kg 2000 ILCD Global
Steel rebar Metals Materials 1.02847909 kg 2000 ILCD Global Tin plate (100% recycled) Metals Materials 1.06E+00 kg 2009 CORUS group Europe Tin plate (25% recycled) Metals Materials 2.29E+00 kg 2009 CORUS group Europe Tin plate (61.7% recycled) Metals Materials 1.68E+00 kg 2009 CORUS group Europe Tin plate (virgin) Metals Materials 2.70E+00 kg 2009 CORUS group Europe
Tin plate (Spain) Metals Materials 45.36000000 kg
2004, 2007
Classen et al (2007) and Spriensma (2004) Spain
Zinc - high grade Metals Materials 3.195798446 kg 2005 ILCD Global
Deionised water - from ground water Water Materials 0.00852256 kg 2005 ILCD Europe Deionised water - from surface water Water Materials 0.00852256 kg 2005 ILCD Europe
Drinking water - from ground water Water Materials 0.000576928 kg 2005 ILCD Europe
Drinking water - from surface water Water Materials 0.000626227 kg 2005 ILCD Europe
Process water - from ground water Water Materials 0.006514776 kg 2005 ILCD Europe
Process water - from surface water Water Materials 0.00651477 kg 2005 ILCD Europe
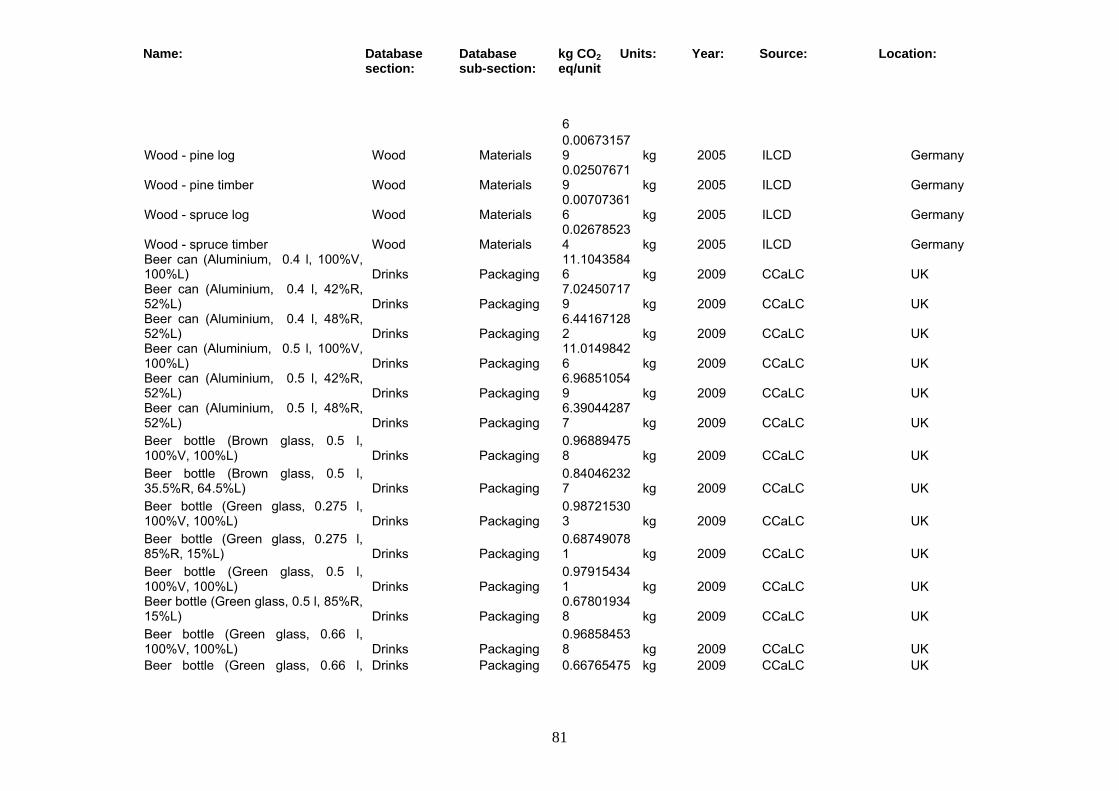
Name: Database section:
Database sub-section:
kg CO2 eq/unit
Units: Year: Source: Location:
81
6
Wood - pine log Wood Materials 0.006731579 kg 2005 ILCD Germany
Wood - pine timber Wood Materials 0.025076719 kg 2005 ILCD Germany
Wood - spruce log Wood Materials 0.007073616 kg 2005 ILCD Germany
Wood - spruce timber Wood Materials 0.026785234 kg 2005 ILCD Germany
Beer can (Aluminium, 0.4 l, 100%V, 100%L) Drinks Packaging
11.10435846 kg 2009 CCaLC UK
Beer can (Aluminium, 0.4 l, 42%R, 52%L) Drinks Packaging
7.024507179 kg 2009 CCaLC UK
Beer can (Aluminium, 0.4 l, 48%R, 52%L) Drinks Packaging
6.441671282 kg 2009 CCaLC UK
Beer can (Aluminium, 0.5 l, 100%V, 100%L) Drinks Packaging
11.01498426 kg 2009 CCaLC UK
Beer can (Aluminium, 0.5 l, 42%R, 52%L) Drinks Packaging
6.968510549 kg 2009 CCaLC UK
Beer can (Aluminium, 0.5 l, 48%R, 52%L) Drinks Packaging
6.390442877 kg 2009 CCaLC UK
Beer bottle (Brown glass, 0.5 l, 100%V, 100%L) Drinks Packaging
0.968894758 kg 2009 CCaLC UK
Beer bottle (Brown glass, 0.5 l, 35.5%R, 64.5%L) Drinks Packaging
0.840462327 kg 2009 CCaLC UK
Beer bottle (Green glass, 0.275 l, 100%V, 100%L) Drinks Packaging
0.987215303 kg 2009 CCaLC UK
Beer bottle (Green glass, 0.275 l, 85%R, 15%L) Drinks Packaging
0.687490781 kg 2009 CCaLC UK
Beer bottle (Green glass, 0.5 l, 100%V, 100%L) Drinks Packaging
0.979154341 kg 2009 CCaLC UK
Beer bottle (Green glass, 0.5 l, 85%R, 15%L) Drinks Packaging
0.678019348 kg 2009 CCaLC UK
Beer bottle (Green glass, 0.66 l, 100%V, 100%L) Drinks Packaging
0.968584538 kg 2009 CCaLC UK
Beer bottle (Green glass, 0.66 l, Drinks Packaging 0.66765475 kg 2009 CCaLC UK

Name: Database section:
Database sub-section:
kg CO2 eq/unit
Units: Year: Source: Location:
82
85%R, 15%L) 9 Beer can (Steel, 0.5 l, 100%V, 100%L) Drinks Packaging
3.850086606 kg 2009 CCaLC UK
Beer can (Steel, 0.5 l, 25%R body, 48%R top, 75%L) Drinks Packaging
3.046319533 kg 2009 CCaLC UK
Beer can (Steel, 0.5 l, 61.7%R body, 48%R top, 38.3%L) Drinks Packaging
2.443257931 kg 2009 CCaLC UK
Cider bottle (PET, 2 l, 100%V, 100%L) Drinks Packaging
4.511058189 kg 2009 CCaLC UK
Cider bottle (PET, 2 l, 100%V, 91% L, 9%I) Drinks Packaging
4.684083997 kg 2009 CCaLC UK
Cider bottle (PET, 2 l, 100%V, 91% L, 9%IER) Drinks Packaging
4.625235839 kg 2009 CCaLC UK
Fizzy drink can (Aluminium, 0.33 l, 100%V, 100%L) Drinks Packaging
11.00246078 kg 2009 CCaLC UK
Fizzy drink can (Aluminium, 0.33 l, 42%R, 58%L) Drinks Packaging
6.955987074 kg 2009 CCaLC UK
Fizzy drink can (Aluminium, 0.33 l, 48%R, 52%L) Drinks Packaging
6.377919402 kg 2009 CCaLC UK
Fizzy drink bottle (Brown glass, 0.33 l, 100%V, 100%L) Drinks Packaging
0.999086481 kg 2009 CCaLC UK
Fizzy drink bottle (Brown glass, 0.33 l, 35.5%R, 64.5%L) Drinks Packaging
0.871392347 kg 2009 CCaLC UK
Fizzy drink bottle (PET, 0.38 l, 100%V, 100%L) Drinks Packaging
4.499053358 kg 2009 CCaLC UK
Fizzy drink bottle (PET, 0.38 l, 100%V, 91%L, 9%I) Drinks Packaging
4.693222379 kg 2009 CCaLC UK
Fizzy drink bottle (PET, 0.38 l, 100%V, 91%L, 9%IER) Drinks Packaging
4.625322266 kg 2009 CCaLC UK
Fizzy drink bottle1 (PET, 0.5 l, 100%V, 100L) Drinks Packaging
4.603373795 kg 2009 CCaLC UK
Fizzy drink bottle1 (PET, 0.5 l, 100%V, 91%L, 9%I) Drinks Packaging
4.793260433 kg 2009 CCaLC UK
Fizzy drink bottle1 (PET, 0.5 l, 100%V, 91%L, 9%IER) Drinks Packaging
4.729321081 kg 2009 CCaLC UK
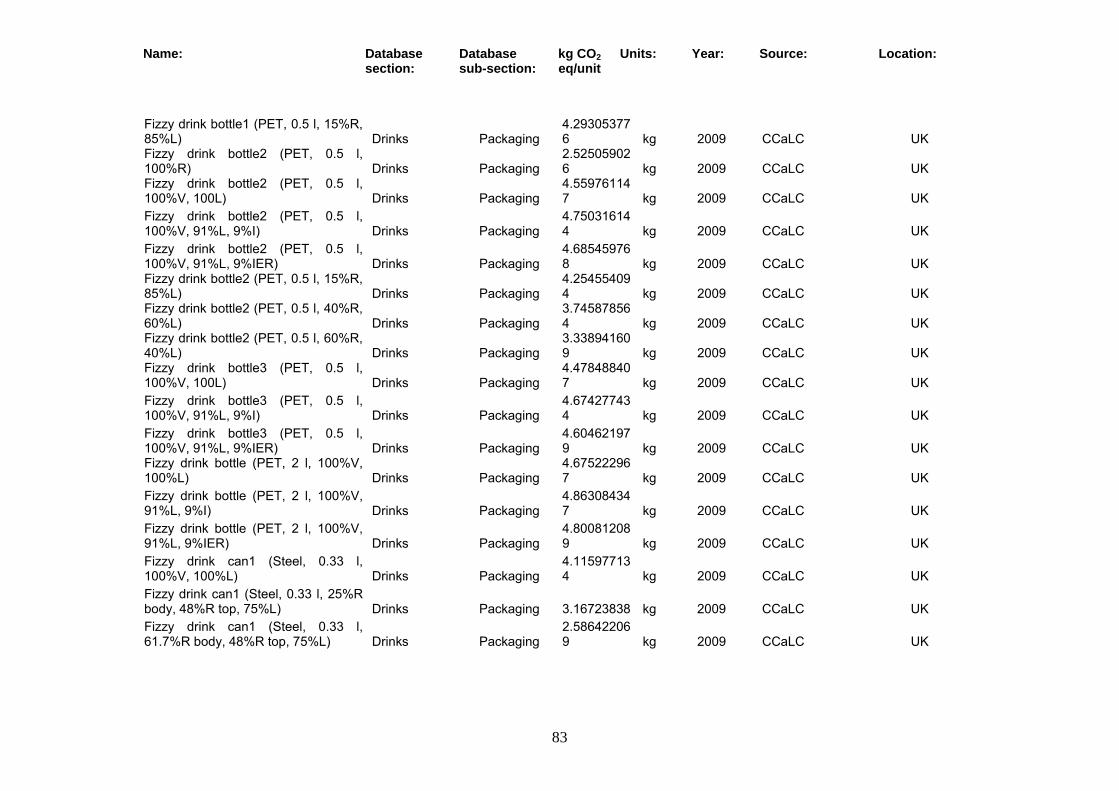
Name: Database section:
Database sub-section:
kg CO2 eq/unit
Units: Year: Source: Location:
83
Fizzy drink bottle1 (PET, 0.5 l, 15%R, 85%L) Drinks Packaging
4.293053776 kg 2009 CCaLC UK
Fizzy drink bottle2 (PET, 0.5 l, 100%R) Drinks Packaging
2.525059026 kg 2009 CCaLC UK
Fizzy drink bottle2 (PET, 0.5 l, 100%V, 100L) Drinks Packaging
4.559761147 kg 2009 CCaLC UK
Fizzy drink bottle2 (PET, 0.5 l, 100%V, 91%L, 9%I) Drinks Packaging
4.750316144 kg 2009 CCaLC UK
Fizzy drink bottle2 (PET, 0.5 l, 100%V, 91%L, 9%IER) Drinks Packaging
4.685459768 kg 2009 CCaLC UK
Fizzy drink bottle2 (PET, 0.5 l, 15%R, 85%L) Drinks Packaging
4.254554094 kg 2009 CCaLC UK
Fizzy drink bottle2 (PET, 0.5 l, 40%R, 60%L) Drinks Packaging
3.745878564 kg 2009 CCaLC UK
Fizzy drink bottle2 (PET, 0.5 l, 60%R, 40%L) Drinks Packaging
3.338941609 kg 2009 CCaLC UK
Fizzy drink bottle3 (PET, 0.5 l, 100%V, 100L) Drinks Packaging
4.478488407 kg 2009 CCaLC UK
Fizzy drink bottle3 (PET, 0.5 l, 100%V, 91%L, 9%I) Drinks Packaging
4.674277434 kg 2009 CCaLC UK
Fizzy drink bottle3 (PET, 0.5 l, 100%V, 91%L, 9%IER) Drinks Packaging
4.604621979 kg 2009 CCaLC UK
Fizzy drink bottle (PET, 2 l, 100%V, 100%L) Drinks Packaging
4.675222967 kg 2009 CCaLC UK
Fizzy drink bottle (PET, 2 l, 100%V, 91%L, 9%I) Drinks Packaging
4.863084347 kg 2009 CCaLC UK
Fizzy drink bottle (PET, 2 l, 100%V, 91%L, 9%IER) Drinks Packaging
4.800812089 kg 2009 CCaLC UK
Fizzy drink can1 (Steel, 0.33 l, 100%V, 100%L) Drinks Packaging
4.115977134 kg 2009 CCaLC UK
Fizzy drink can1 (Steel, 0.33 l, 25%R body, 48%R top, 75%L) Drinks Packaging 3.16723838 kg 2009 CCaLC UK Fizzy drink can1 (Steel, 0.33 l, 61.7%R body, 48%R top, 75%L) Drinks Packaging
2.586422069 kg 2009 CCaLC UK

Name: Database section:
Database sub-section:
kg CO2 eq/unit
Units: Year: Source: Location:
84
Fizzy drink can2 (Steel, 0.33 l, 100%V, 100%L) Drinks Packaging
4.109570713 kg 2009 CCaLC UK
Fizzy drink can2 (Steel, 0.33 l, 25%R body, 48%R top, 75%L) Drinks Packaging
3.160868458 kg 2009 CCaLC UK
Fizzy drink can2 (Steel, 0.33 l, 61.7%R body, 48%R top, 75%L) Drinks Packaging
2.579993196 kg 2009 CCaLC UK
Glass bottle - 1 re-use Drinks Packaging 0.671158275 kg 2009 CCaLC UK
Glass bottle - 10 re-uses Drinks Packaging 0.187786919 kg 2009 CCaLC UK
Glass bottle - 11 re-uses Drinks Packaging 0.181805945 kg 2009 CCaLC UK
Glass bottle - 2 re-uses Drinks Packaging 0.399295913 kg 2009 CCaLC UK
Glass bottle - 3 re-uses Drinks Packaging 0.313387375 kg 2009 CCaLC UK
Glass bottle - 4 re-uses Drinks Packaging 0.308493851 kg 2009 CCaLC UK
Glass bottle - 5 re-uses Drinks Packaging 0.263364683 kg 2009 CCaLC UK
Glass bottle - 6 re-uses Drinks Packaging 0.236178437 kg 2009 CCaLC UK
Glass bottle - 7 re-uses Drinks Packaging 0.218235514 kg 2009 CCaLC UK
Glass bottle - 8 re-uses Drinks Packaging 0.205186116 kg 2009 CCaLC UK
Glass bottle - 9 re-uses Drinks Packaging 0.195399068 kg 2009 CCaLC UK
Juice bottle (Green glass, 0.75 l, 100%V, 100%L) Drinks Packaging
0.971914298 kg 2009 CCaLC UK
Juice bottle (PET, 0.33 l, 100%V, 91%L, 9%I) Drinks Packaging 4.75169769 kg 2009 CCaLC UK Juice bottle (PET, 0.33 l, 100%V, 91%L, 9%IER) Drinks Packaging
4.686648218 kg 2009 CCaLC UK
Juice bottle (PET, 0.33 l, 100%V,100%L) Drinks Packaging
4.560585426 kg 2009 CCaLC UK
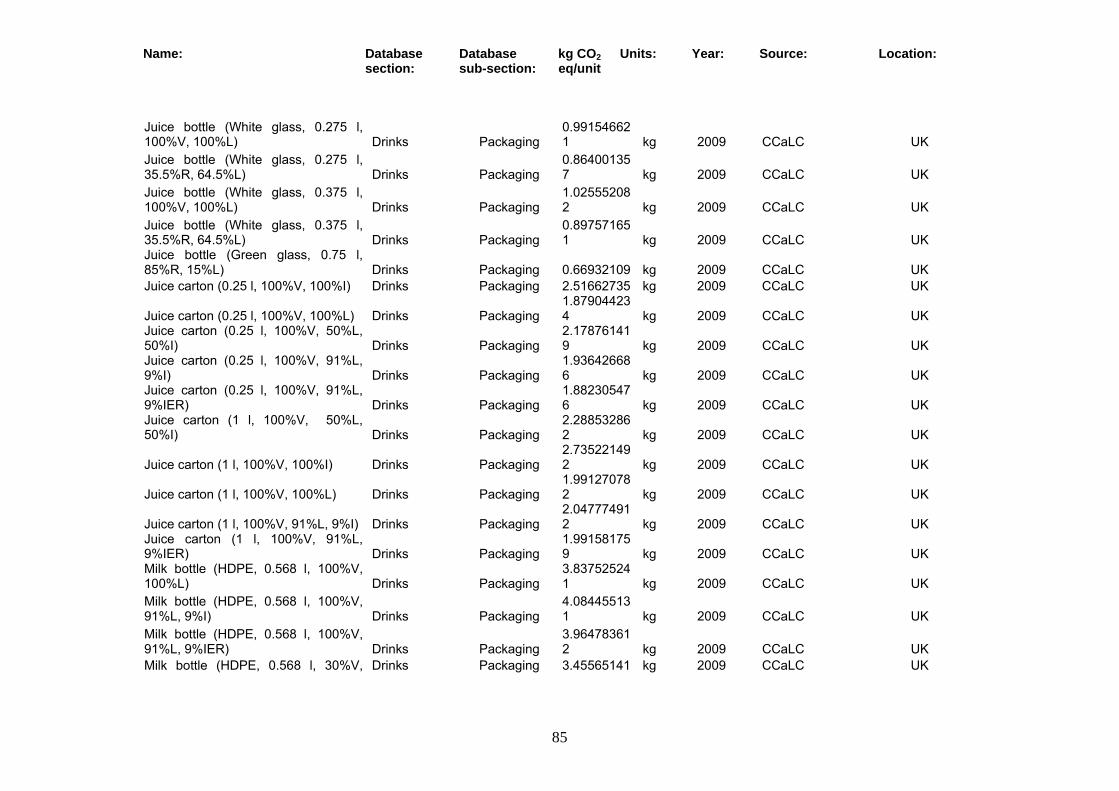
Name: Database section:
Database sub-section:
kg CO2 eq/unit
Units: Year: Source: Location:
85
Juice bottle (White glass, 0.275 l, 100%V, 100%L) Drinks Packaging
0.991546621 kg 2009 CCaLC UK
Juice bottle (White glass, 0.275 l, 35.5%R, 64.5%L) Drinks Packaging
0.864001357 kg 2009 CCaLC UK
Juice bottle (White glass, 0.375 l, 100%V, 100%L) Drinks Packaging
1.025552082 kg 2009 CCaLC UK
Juice bottle (White glass, 0.375 l, 35.5%R, 64.5%L) Drinks Packaging
0.897571651 kg 2009 CCaLC UK
Juice bottle (Green glass, 0.75 l, 85%R, 15%L) Drinks Packaging 0.66932109 kg 2009 CCaLC UK Juice carton (0.25 l, 100%V, 100%I) Drinks Packaging 2.51662735 kg 2009 CCaLC UK
Juice carton (0.25 l, 100%V, 100%L) Drinks Packaging 1.879044234 kg 2009 CCaLC UK
Juice carton (0.25 l, 100%V, 50%L, 50%I) Drinks Packaging
2.178761419 kg 2009 CCaLC UK
Juice carton (0.25 l, 100%V, 91%L, 9%I) Drinks Packaging
1.936426686 kg 2009 CCaLC UK
Juice carton (0.25 l, 100%V, 91%L, 9%IER) Drinks Packaging
1.882305476 kg 2009 CCaLC UK
Juice carton (1 l, 100%V, 50%L, 50%I) Drinks Packaging
2.288532862 kg 2009 CCaLC UK
Juice carton (1 l, 100%V, 100%I) Drinks Packaging 2.735221492 kg 2009 CCaLC UK
Juice carton (1 l, 100%V, 100%L) Drinks Packaging 1.991270782 kg 2009 CCaLC UK
Juice carton (1 l, 100%V, 91%L, 9%I) Drinks Packaging 2.047774912 kg 2009 CCaLC UK
Juice carton (1 l, 100%V, 91%L, 9%IER) Drinks Packaging
1.991581759 kg 2009 CCaLC UK
Milk bottle (HDPE, 0.568 l, 100%V, 100%L) Drinks Packaging
3.837525241 kg 2009 CCaLC UK
Milk bottle (HDPE, 0.568 l, 100%V, 91%L, 9%I) Drinks Packaging
4.084455131 kg 2009 CCaLC UK
Milk bottle (HDPE, 0.568 l, 100%V, 91%L, 9%IER) Drinks Packaging
3.964783612 kg 2009 CCaLC UK
Milk bottle (HDPE, 0.568 l, 30%V, Drinks Packaging 3.45565141 kg 2009 CCaLC UK

Name: Database section:
Database sub-section:
kg CO2 eq/unit
Units: Year: Source: Location:
86
70%L) 3 Milk bottle (HDPE, 1.136 l, 100%V, 100%L) Drinks Packaging
3.868590231 kg 2009 CCaLC UK
Milk bottle (HDPE, 1.136 l, 100%V, 91%L, 9%I) Drinks Packaging
4.115478092 kg 2009 CCaLC UK
Milk bottle (HDPE, 1.136 l, 100%V, 91%L, 9%IER) Drinks Packaging
3.995807521 kg 2009 CCaLC UK
Milk bottle (HDPE, 1.136 l, 30%V, 70%L) Drinks Packaging
3.475327223 kg 2009 CCaLC UK
Milk bottle (HDPE, 2.272 l, 100%V, 100%L) Drinks Packaging
3.885094762 kg 2009 CCaLC UK
Milk bottle (HDPE, 2.272 l, 100%V, 91%L, 9%I) Drinks Packaging
4.131963552 kg 2009 CCaLC UK
Milk bottle (HDPE, 2.272 l, 100%V, 91%L, 9%IER) Drinks Packaging 4.01228914 kg 2009 CCaLC UK Milk bottle (HDPE, 2.272 l, 30%R, 70%L) Drinks Packaging
3.485330788 kg 2009 CCaLC UK
Milk bottle (White glass, 0.568 l, 100%V, 100%L) Drinks Packaging
0.974286658 kg 2009 CCaLC UK
Milk bottle (White glass, 0.568 l, 35.5%R, 64.5%L) Drinks Packaging
0.844742987 kg 2009 CCaLC UK
Milk bottle (White glass, 0.568 l, 35.5%R, 64.5%L, r13) Drinks Packaging
0.374928624 kg 2009 CCaLC UK
Milk bottle (White glass, 0.568 l, 35.5%R, 64.5%L, r20) Drinks Packaging
0.358148938 kg 2009 CCaLC UK
Milk bottle (White glass, 0.568 l, 35.5%R, 64.5%L, r24) Drinks Packaging
0.352955965 kg 2009 CCaLC UK
Milk bottle (White glass, 0.568 l, 35.5%R, 64.5%L, r30) Drinks Packaging
0.347760941 kg 2009 CCaLC UK
Milk bottle (White glass, 0.568 l, 35.5%R, 64.5%L, r5) Drinks Packaging
0.451633882 kg 2009 CCaLC UK
Milk carton (1 l, 100%V, 100%I) Drinks Packaging 2.772296943 kg 2009 CCaLC UK
Milk carton (1 l, 100%V, 100%L) Drinks Packaging 2.008467742 kg 2009 CCaLC UK
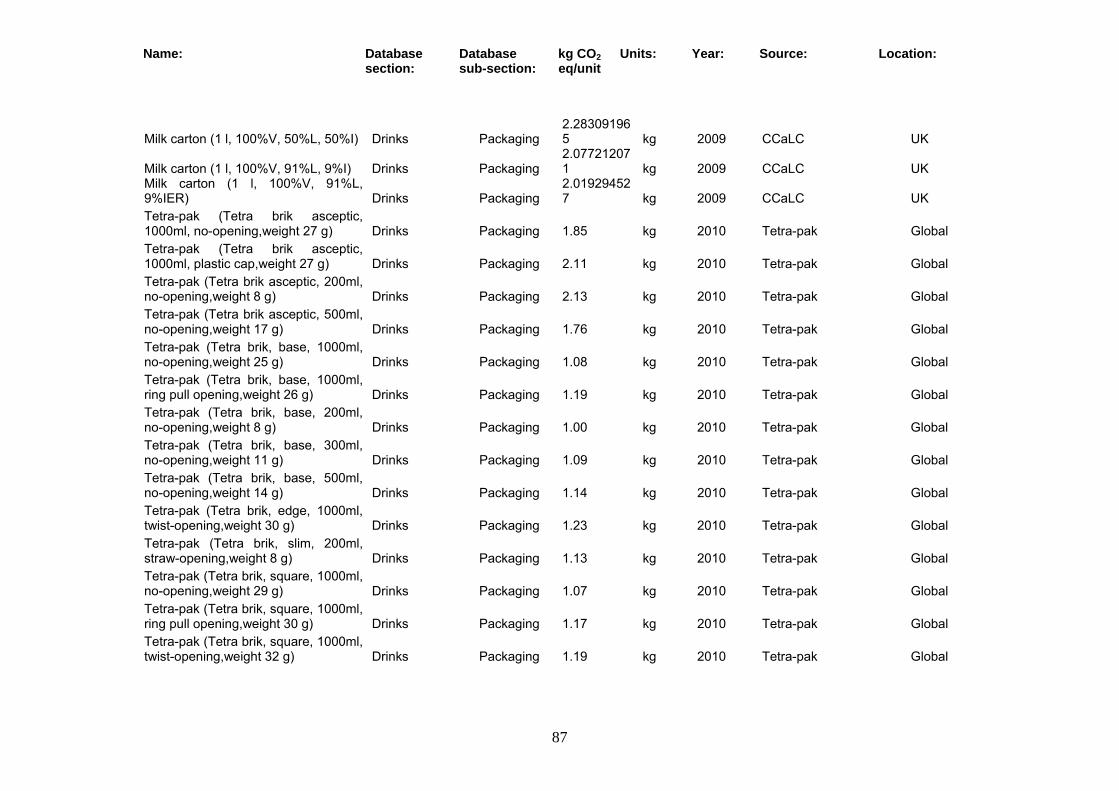
Name: Database section:
Database sub-section:
kg CO2 eq/unit
Units: Year: Source: Location:
87
Milk carton (1 l, 100%V, 50%L, 50%I) Drinks Packaging 2.283091965 kg 2009 CCaLC UK
Milk carton (1 l, 100%V, 91%L, 9%I) Drinks Packaging 2.077212071 kg 2009 CCaLC UK
Milk carton (1 l, 100%V, 91%L, 9%IER) Drinks Packaging
2.019294527 kg 2009 CCaLC UK
Tetra-pak (Tetra brik asceptic, 1000ml, no-opening,weight 27 g) Drinks Packaging 1.85 kg 2010 Tetra-pak Global Tetra-pak (Tetra brik asceptic, 1000ml, plastic cap,weight 27 g) Drinks Packaging 2.11 kg 2010 Tetra-pak Global Tetra-pak (Tetra brik asceptic, 200ml, no-opening,weight 8 g) Drinks Packaging 2.13 kg 2010 Tetra-pak Global Tetra-pak (Tetra brik asceptic, 500ml, no-opening,weight 17 g) Drinks Packaging 1.76 kg 2010 Tetra-pak Global Tetra-pak (Tetra brik, base, 1000ml, no-opening,weight 25 g) Drinks Packaging 1.08 kg 2010 Tetra-pak Global Tetra-pak (Tetra brik, base, 1000ml, ring pull opening,weight 26 g) Drinks Packaging 1.19 kg 2010 Tetra-pak Global Tetra-pak (Tetra brik, base, 200ml, no-opening,weight 8 g) Drinks Packaging 1.00 kg 2010 Tetra-pak Global Tetra-pak (Tetra brik, base, 300ml, no-opening,weight 11 g) Drinks Packaging 1.09 kg 2010 Tetra-pak Global Tetra-pak (Tetra brik, base, 500ml, no-opening,weight 14 g) Drinks Packaging 1.14 kg 2010 Tetra-pak Global Tetra-pak (Tetra brik, edge, 1000ml, twist-opening,weight 30 g) Drinks Packaging 1.23 kg 2010 Tetra-pak Global Tetra-pak (Tetra brik, slim, 200ml, straw-opening,weight 8 g) Drinks Packaging 1.13 kg 2010 Tetra-pak Global Tetra-pak (Tetra brik, square, 1000ml, no-opening,weight 29 g) Drinks Packaging 1.07 kg 2010 Tetra-pak Global Tetra-pak (Tetra brik, square, 1000ml, ring pull opening,weight 30 g) Drinks Packaging 1.17 kg 2010 Tetra-pak Global Tetra-pak (Tetra brik, square, 1000ml, twist-opening,weight 32 g) Drinks Packaging 1.19 kg 2010 Tetra-pak Global
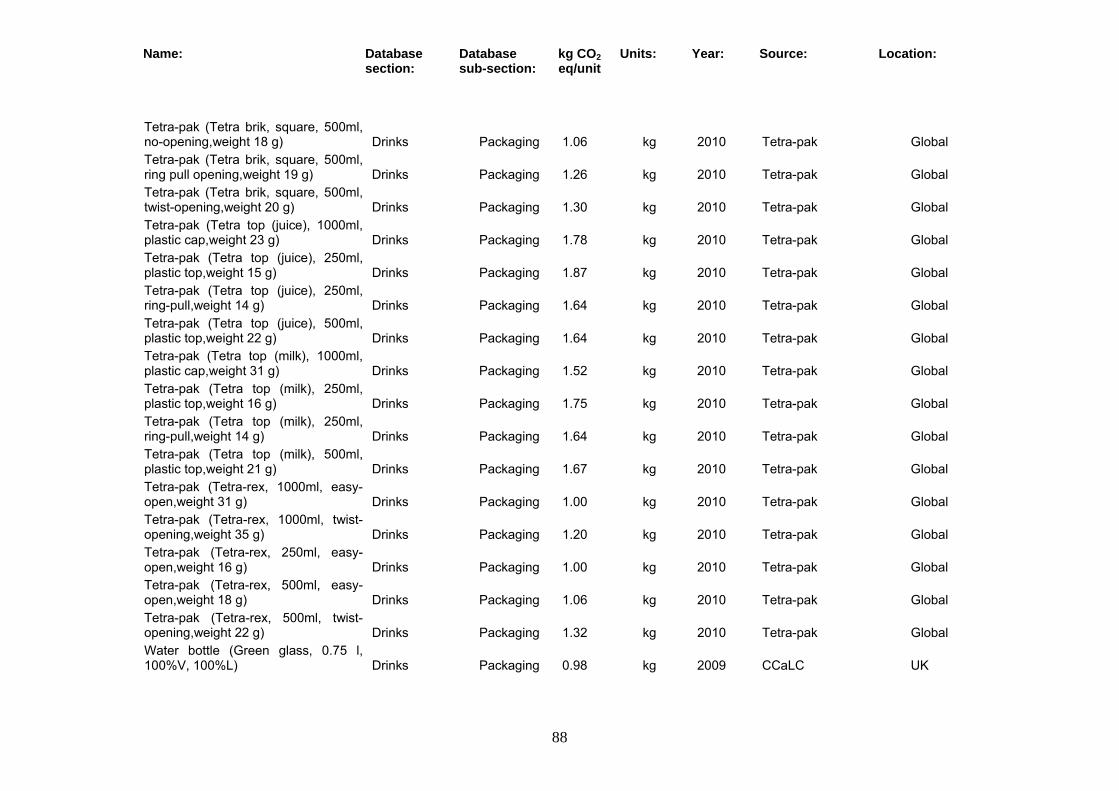
Name: Database section:
Database sub-section:
kg CO2 eq/unit
Units: Year: Source: Location:
88
Tetra-pak (Tetra brik, square, 500ml, no-opening,weight 18 g) Drinks Packaging 1.06 kg 2010 Tetra-pak Global Tetra-pak (Tetra brik, square, 500ml, ring pull opening,weight 19 g) Drinks Packaging 1.26 kg 2010 Tetra-pak Global Tetra-pak (Tetra brik, square, 500ml, twist-opening,weight 20 g) Drinks Packaging 1.30 kg 2010 Tetra-pak Global Tetra-pak (Tetra top (juice), 1000ml, plastic cap,weight 23 g) Drinks Packaging 1.78 kg 2010 Tetra-pak Global Tetra-pak (Tetra top (juice), 250ml, plastic top,weight 15 g) Drinks Packaging 1.87 kg 2010 Tetra-pak Global Tetra-pak (Tetra top (juice), 250ml, ring-pull,weight 14 g) Drinks Packaging 1.64 kg 2010 Tetra-pak Global Tetra-pak (Tetra top (juice), 500ml, plastic top,weight 22 g) Drinks Packaging 1.64 kg 2010 Tetra-pak Global Tetra-pak (Tetra top (milk), 1000ml, plastic cap,weight 31 g) Drinks Packaging 1.52 kg 2010 Tetra-pak Global Tetra-pak (Tetra top (milk), 250ml, plastic top,weight 16 g) Drinks Packaging 1.75 kg 2010 Tetra-pak Global Tetra-pak (Tetra top (milk), 250ml, ring-pull,weight 14 g) Drinks Packaging 1.64 kg 2010 Tetra-pak Global Tetra-pak (Tetra top (milk), 500ml, plastic top,weight 21 g) Drinks Packaging 1.67 kg 2010 Tetra-pak Global Tetra-pak (Tetra-rex, 1000ml, easy-open,weight 31 g) Drinks Packaging 1.00 kg 2010 Tetra-pak Global Tetra-pak (Tetra-rex, 1000ml, twist-opening,weight 35 g) Drinks Packaging 1.20 kg 2010 Tetra-pak Global Tetra-pak (Tetra-rex, 250ml, easy-open,weight 16 g) Drinks Packaging 1.00 kg 2010 Tetra-pak Global Tetra-pak (Tetra-rex, 500ml, easy-open,weight 18 g) Drinks Packaging 1.06 kg 2010 Tetra-pak Global Tetra-pak (Tetra-rex, 500ml, twist-opening,weight 22 g) Drinks Packaging 1.32 kg 2010 Tetra-pak Global Water bottle (Green glass, 0.75 l, 100%V, 100%L) Drinks Packaging 0.98 kg 2009 CCaLC UK
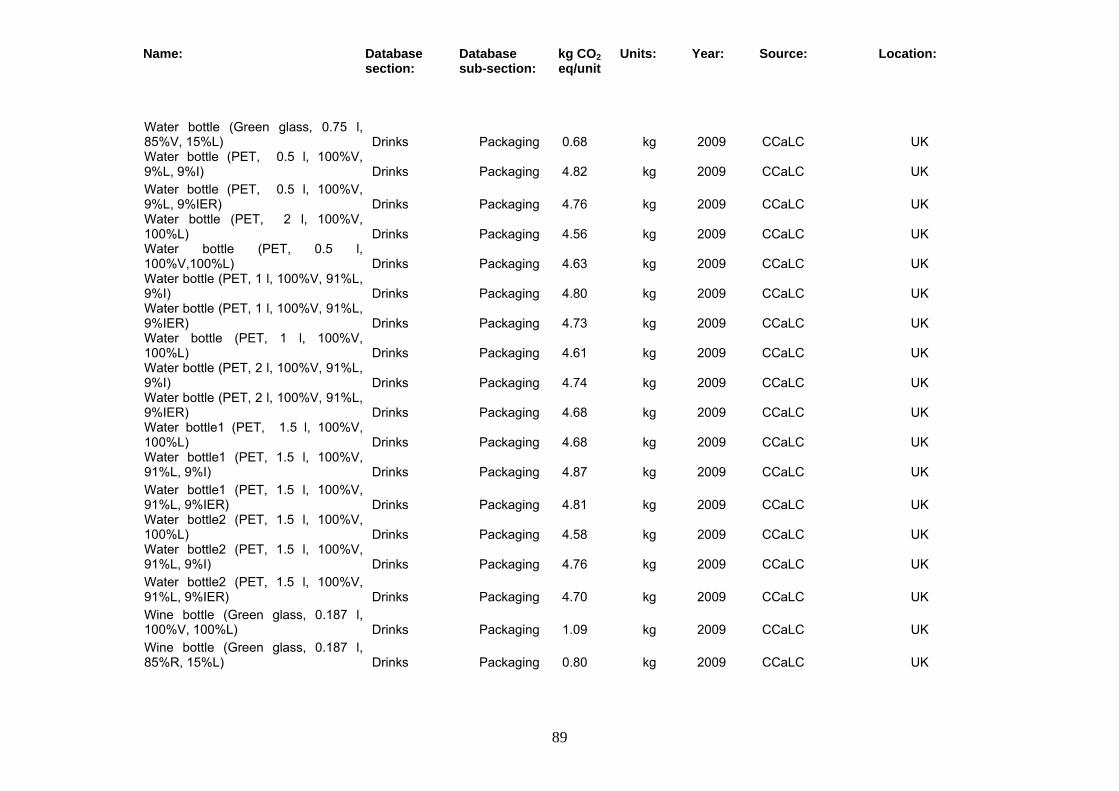
Name: Database section:
Database sub-section:
kg CO2 eq/unit
Units: Year: Source: Location:
89
Water bottle (Green glass, 0.75 l, 85%V, 15%L) Drinks Packaging 0.68 kg 2009 CCaLC UK Water bottle (PET, 0.5 l, 100%V, 9%L, 9%I) Drinks Packaging 4.82 kg 2009 CCaLC UK Water bottle (PET, 0.5 l, 100%V, 9%L, 9%IER) Drinks Packaging 4.76 kg 2009 CCaLC UK Water bottle (PET, 2 l, 100%V, 100%L) Drinks Packaging 4.56 kg 2009 CCaLC UK Water bottle (PET, 0.5 l, 100%V,100%L) Drinks Packaging 4.63 kg 2009 CCaLC UK Water bottle (PET, 1 l, 100%V, 91%L, 9%I) Drinks Packaging 4.80 kg 2009 CCaLC UK Water bottle (PET, 1 l, 100%V, 91%L, 9%IER) Drinks Packaging 4.73 kg 2009 CCaLC UK Water bottle (PET, 1 l, 100%V, 100%L) Drinks Packaging 4.61 kg 2009 CCaLC UK Water bottle (PET, 2 l, 100%V, 91%L, 9%I) Drinks Packaging 4.74 kg 2009 CCaLC UK Water bottle (PET, 2 l, 100%V, 91%L, 9%IER) Drinks Packaging 4.68 kg 2009 CCaLC UK Water bottle1 (PET, 1.5 l, 100%V, 100%L) Drinks Packaging 4.68 kg 2009 CCaLC UK Water bottle1 (PET, 1.5 l, 100%V, 91%L, 9%I) Drinks Packaging 4.87 kg 2009 CCaLC UK Water bottle1 (PET, 1.5 l, 100%V, 91%L, 9%IER) Drinks Packaging 4.81 kg 2009 CCaLC UK Water bottle2 (PET, 1.5 l, 100%V, 100%L) Drinks Packaging 4.58 kg 2009 CCaLC UK Water bottle2 (PET, 1.5 l, 100%V, 91%L, 9%I) Drinks Packaging 4.76 kg 2009 CCaLC UK Water bottle2 (PET, 1.5 l, 100%V, 91%L, 9%IER) Drinks Packaging 4.70 kg 2009 CCaLC UK Wine bottle (Green glass, 0.187 l, 100%V, 100%L) Drinks Packaging 1.09 kg 2009 CCaLC UK Wine bottle (Green glass, 0.187 l, 85%R, 15%L) Drinks Packaging 0.80 kg 2009 CCaLC UK
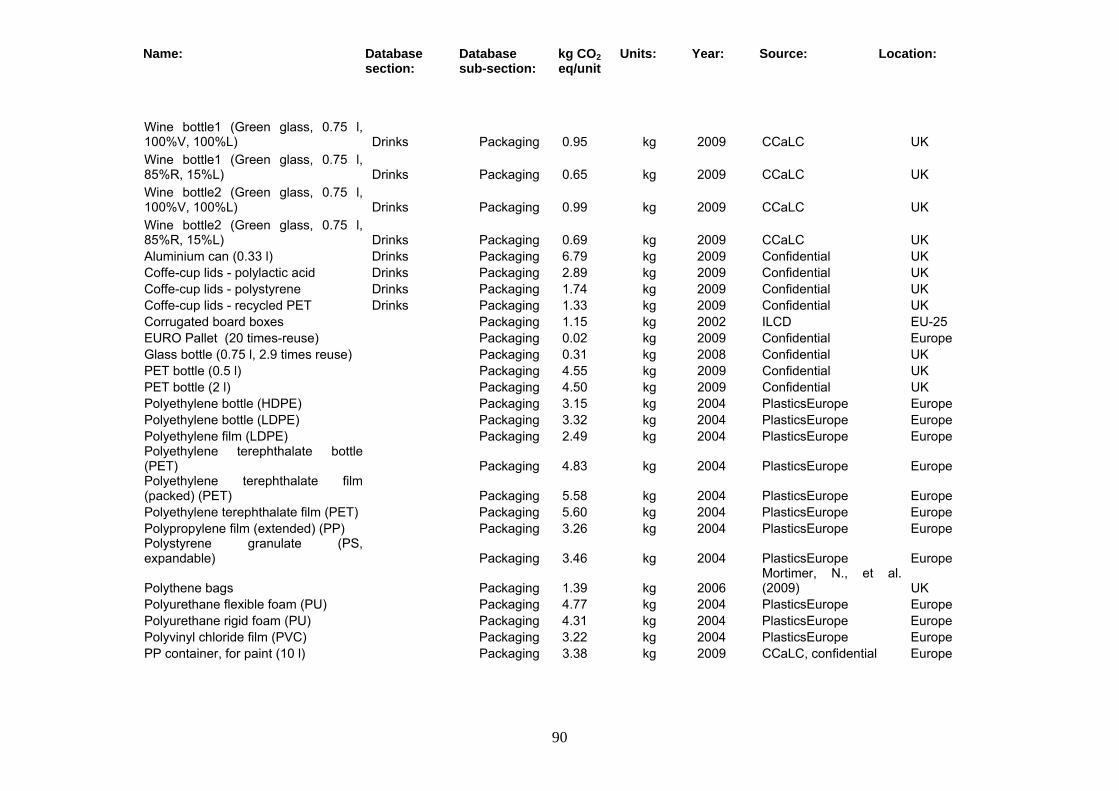
Name: Database section:
Database sub-section:
kg CO2 eq/unit
Units: Year: Source: Location:
90
Wine bottle1 (Green glass, 0.75 l, 100%V, 100%L) Drinks Packaging 0.95 kg 2009 CCaLC UK Wine bottle1 (Green glass, 0.75 l, 85%R, 15%L) Drinks Packaging 0.65 kg 2009 CCaLC UK Wine bottle2 (Green glass, 0.75 l, 100%V, 100%L) Drinks Packaging 0.99 kg 2009 CCaLC UK Wine bottle2 (Green glass, 0.75 l, 85%R, 15%L) Drinks Packaging 0.69 kg 2009 CCaLC UK Aluminium can (0.33 l) Drinks Packaging 6.79 kg 2009 Confidential UK Coffe-cup lids - polylactic acid Drinks Packaging 2.89 kg 2009 Confidential UK Coffe-cup lids - polystyrene Drinks Packaging 1.74 kg 2009 Confidential UK Coffe-cup lids - recycled PET Drinks Packaging 1.33 kg 2009 Confidential UK Corrugated board boxes Packaging 1.15 kg 2002 ILCD EU-25 EURO Pallet (20 times-reuse) Packaging 0.02 kg 2009 Confidential Europe Glass bottle (0.75 l, 2.9 times reuse) Packaging 0.31 kg 2008 Confidential UK PET bottle (0.5 l) Packaging 4.55 kg 2009 Confidential UK PET bottle (2 l) Packaging 4.50 kg 2009 Confidential UK Polyethylene bottle (HDPE) Packaging 3.15 kg 2004 PlasticsEurope Europe Polyethylene bottle (LDPE) Packaging 3.32 kg 2004 PlasticsEurope Europe Polyethylene film (LDPE) Packaging 2.49 kg 2004 PlasticsEurope Europe Polyethylene terephthalate bottle (PET) Packaging 4.83 kg 2004 PlasticsEurope Europe Polyethylene terephthalate film (packed) (PET) Packaging 5.58 kg 2004 PlasticsEurope Europe Polyethylene terephthalate film (PET) Packaging 5.60 kg 2004 PlasticsEurope Europe Polypropylene film (extended) (PP) Packaging 3.26 kg 2004 PlasticsEurope Europe Polystyrene granulate (PS, expandable) Packaging 3.46 kg 2004 PlasticsEurope Europe
Polythene bags Packaging 1.39 kg 2006 Mortimer, N., et al. (2009) UK
Polyurethane flexible foam (PU) Packaging 4.77 kg 2004 PlasticsEurope Europe Polyurethane rigid foam (PU) Packaging 4.31 kg 2004 PlasticsEurope Europe Polyvinyl chloride film (PVC) Packaging 3.22 kg 2004 PlasticsEurope Europe PP container, for paint (10 l) Packaging 3.38 kg 2009 CCaLC, confidential Europe
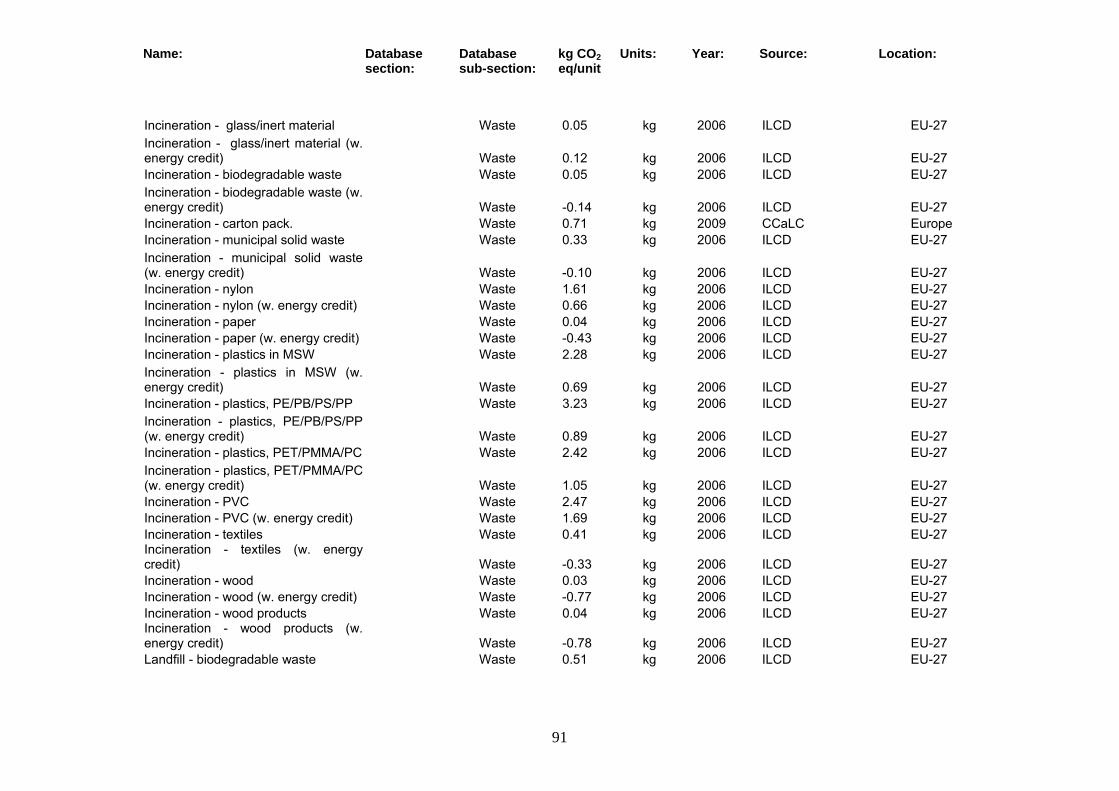
Name: Database section:
Database sub-section:
kg CO2 eq/unit
Units: Year: Source: Location:
91
Incineration - glass/inert material Waste 0.05 kg 2006 ILCD EU-27 Incineration - glass/inert material (w. energy credit) Waste 0.12 kg 2006 ILCD EU-27 Incineration - biodegradable waste Waste 0.05 kg 2006 ILCD EU-27 Incineration - biodegradable waste (w. energy credit) Waste -0.14 kg 2006 ILCD EU-27 Incineration - carton pack. Waste 0.71 kg 2009 CCaLC Europe Incineration - municipal solid waste Waste 0.33 kg 2006 ILCD EU-27 Incineration - municipal solid waste (w. energy credit) Waste -0.10 kg 2006 ILCD EU-27 Incineration - nylon Waste 1.61 kg 2006 ILCD EU-27 Incineration - nylon (w. energy credit) Waste 0.66 kg 2006 ILCD EU-27 Incineration - paper Waste 0.04 kg 2006 ILCD EU-27 Incineration - paper (w. energy credit) Waste -0.43 kg 2006 ILCD EU-27 Incineration - plastics in MSW Waste 2.28 kg 2006 ILCD EU-27 Incineration - plastics in MSW (w. energy credit) Waste 0.69 kg 2006 ILCD EU-27 Incineration - plastics, PE/PB/PS/PP Waste 3.23 kg 2006 ILCD EU-27 Incineration - plastics, PE/PB/PS/PP (w. energy credit) Waste 0.89 kg 2006 ILCD EU-27 Incineration - plastics, PET/PMMA/PC Waste 2.42 kg 2006 ILCD EU-27 Incineration - plastics, PET/PMMA/PC (w. energy credit) Waste 1.05 kg 2006 ILCD EU-27 Incineration - PVC Waste 2.47 kg 2006 ILCD EU-27 Incineration - PVC (w. energy credit) Waste 1.69 kg 2006 ILCD EU-27 Incineration - textiles Waste 0.41 kg 2006 ILCD EU-27 Incineration - textiles (w. energy credit) Waste -0.33 kg 2006 ILCD EU-27 Incineration - wood Waste 0.03 kg 2006 ILCD EU-27 Incineration - wood (w. energy credit) Waste -0.77 kg 2006 ILCD EU-27 Incineration - wood products Waste 0.04 kg 2006 ILCD EU-27 Incineration - wood products (w. energy credit) Waste -0.78 kg 2006 ILCD EU-27 Landfill - biodegradable waste Waste 0.51 kg 2006 ILCD EU-27
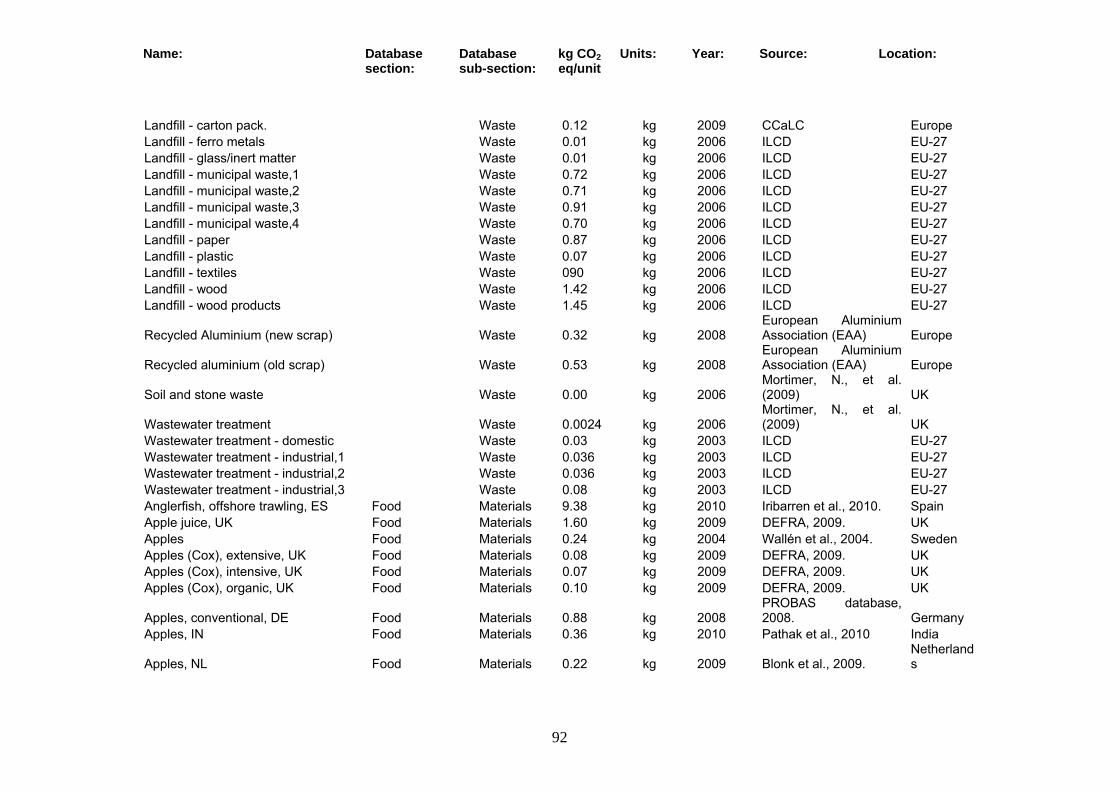
Name: Database section:
Database sub-section:
kg CO2 eq/unit
Units: Year: Source: Location:
92
Landfill - carton pack. Waste 0.12 kg 2009 CCaLC Europe Landfill - ferro metals Waste 0.01 kg 2006 ILCD EU-27 Landfill - glass/inert matter Waste 0.01 kg 2006 ILCD EU-27 Landfill - municipal waste,1 Waste 0.72 kg 2006 ILCD EU-27 Landfill - municipal waste,2 Waste 0.71 kg 2006 ILCD EU-27 Landfill - municipal waste,3 Waste 0.91 kg 2006 ILCD EU-27 Landfill - municipal waste,4 Waste 0.70 kg 2006 ILCD EU-27 Landfill - paper Waste 0.87 kg 2006 ILCD EU-27 Landfill - plastic Waste 0.07 kg 2006 ILCD EU-27 Landfill - textiles Waste 090 kg 2006 ILCD EU-27 Landfill - wood Waste 1.42 kg 2006 ILCD EU-27 Landfill - wood products Waste 1.45 kg 2006 ILCD EU-27
Recycled Aluminium (new scrap) Waste 0.32 kg 2008 European Aluminium Association (EAA) Europe
Recycled aluminium (old scrap) Waste 0.53 kg 2008 European Aluminium Association (EAA) Europe
Soil and stone waste Waste 0.00 kg 2006 Mortimer, N., et al. (2009) UK
Wastewater treatment Waste 0.0024 kg 2006 Mortimer, N., et al. (2009) UK
Wastewater treatment - domestic Waste 0.03 kg 2003 ILCD EU-27 Wastewater treatment - industrial,1 Waste 0.036 kg 2003 ILCD EU-27 Wastewater treatment - industrial,2 Waste 0.036 kg 2003 ILCD EU-27 Wastewater treatment - industrial,3 Waste 0.08 kg 2003 ILCD EU-27 Anglerfish, offshore trawling, ES Food Materials 9.38 kg 2010 Iribarren et al., 2010. Spain Apple juice, UK Food Materials 1.60 kg 2009 DEFRA, 2009. UK Apples Food Materials 0.24 kg 2004 Wallén et al., 2004. Sweden Apples (Cox), extensive, UK Food Materials 0.08 kg 2009 DEFRA, 2009. UK Apples (Cox), intensive, UK Food Materials 0.07 kg 2009 DEFRA, 2009. UK Apples (Cox), organic, UK Food Materials 0.10 kg 2009 DEFRA, 2009. UK
Apples, conventional, DE Food Materials 0.88 kg 2008 PROBAS database, 2008. Germany
Apples, IN Food Materials 0.36 kg 2010 Pathak et al., 2010 India
Apples, NL Food Materials 0.22 kg 2009 Blonk et al., 2009. Netherlands
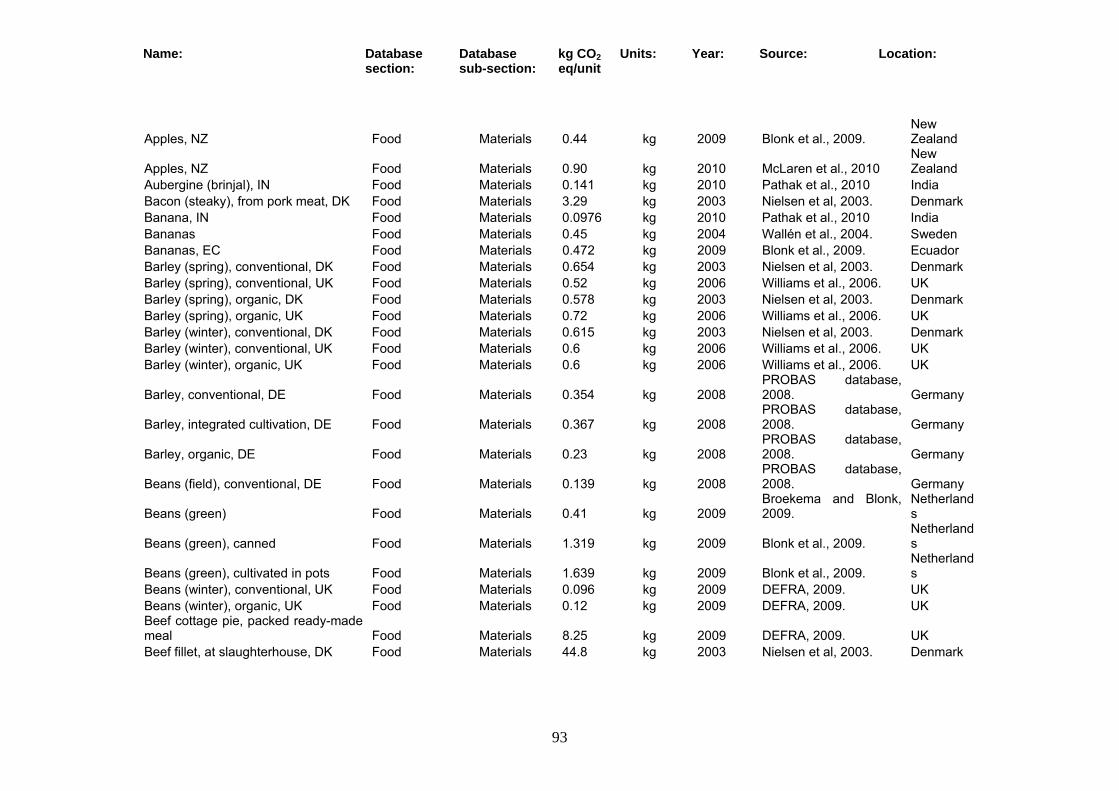
Name: Database section:
Database sub-section:
kg CO2 eq/unit
Units: Year: Source: Location:
93
Apples, NZ Food Materials 0.44 kg 2009 Blonk et al., 2009. New Zealand
Apples, NZ Food Materials 0.90 kg 2010 McLaren et al., 2010 New Zealand
Aubergine (brinjal), IN Food Materials 0.141 kg 2010 Pathak et al., 2010 India Bacon (steaky), from pork meat, DK Food Materials 3.29 kg 2003 Nielsen et al, 2003. Denmark Banana, IN Food Materials 0.0976 kg 2010 Pathak et al., 2010 India Bananas Food Materials 0.45 kg 2004 Wallén et al., 2004. Sweden Bananas, EC Food Materials 0.472 kg 2009 Blonk et al., 2009. Ecuador Barley (spring), conventional, DK Food Materials 0.654 kg 2003 Nielsen et al, 2003. Denmark Barley (spring), conventional, UK Food Materials 0.52 kg 2006 Williams et al., 2006. UK Barley (spring), organic, DK Food Materials 0.578 kg 2003 Nielsen et al, 2003. Denmark Barley (spring), organic, UK Food Materials 0.72 kg 2006 Williams et al., 2006. UK Barley (winter), conventional, DK Food Materials 0.615 kg 2003 Nielsen et al, 2003. Denmark Barley (winter), conventional, UK Food Materials 0.6 kg 2006 Williams et al., 2006. UK Barley (winter), organic, UK Food Materials 0.6 kg 2006 Williams et al., 2006. UK
Barley, conventional, DE Food Materials 0.354 kg 2008 PROBAS database, 2008. Germany
Barley, integrated cultivation, DE Food Materials 0.367 kg 2008 PROBAS database, 2008. Germany
Barley, organic, DE Food Materials 0.23 kg 2008 PROBAS database, 2008. Germany
Beans (field), conventional, DE Food Materials 0.139 kg 2008 PROBAS database, 2008. Germany
Beans (green) Food Materials 0.41 kg 2009 Broekema and Blonk, 2009.
Netherlands
Beans (green), canned Food Materials 1.319 kg 2009 Blonk et al., 2009. Netherlands
Beans (green), cultivated in pots Food Materials 1.639 kg 2009 Blonk et al., 2009. Netherlands
Beans (winter), conventional, UK Food Materials 0.096 kg 2009 DEFRA, 2009. UK Beans (winter), organic, UK Food Materials 0.12 kg 2009 DEFRA, 2009. UK Beef cottage pie, packed ready-made meal Food Materials 8.25 kg 2009 DEFRA, 2009. UK Beef fillet, at slaughterhouse, DK Food Materials 44.8 kg 2003 Nielsen et al, 2003. Denmark
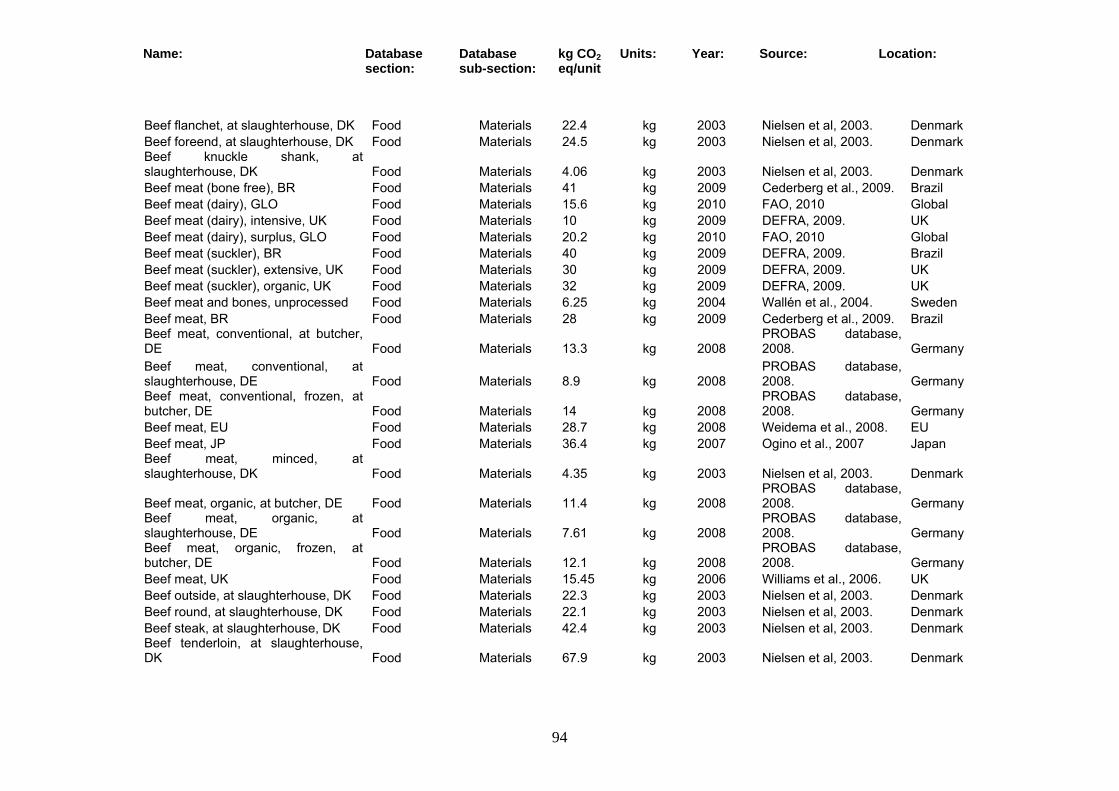
Name: Database section:
Database sub-section:
kg CO2 eq/unit
Units: Year: Source: Location:
94
Beef flanchet, at slaughterhouse, DK Food Materials 22.4 kg 2003 Nielsen et al, 2003. Denmark Beef foreend, at slaughterhouse, DK Food Materials 24.5 kg 2003 Nielsen et al, 2003. Denmark Beef knuckle shank, at slaughterhouse, DK Food Materials 4.06 kg 2003 Nielsen et al, 2003. Denmark Beef meat (bone free), BR Food Materials 41 kg 2009 Cederberg et al., 2009. Brazil Beef meat (dairy), GLO Food Materials 15.6 kg 2010 FAO, 2010 Global Beef meat (dairy), intensive, UK Food Materials 10 kg 2009 DEFRA, 2009. UK Beef meat (dairy), surplus, GLO Food Materials 20.2 kg 2010 FAO, 2010 Global Beef meat (suckler), BR Food Materials 40 kg 2009 DEFRA, 2009. Brazil Beef meat (suckler), extensive, UK Food Materials 30 kg 2009 DEFRA, 2009. UK Beef meat (suckler), organic, UK Food Materials 32 kg 2009 DEFRA, 2009. UK Beef meat and bones, unprocessed Food Materials 6.25 kg 2004 Wallén et al., 2004. Sweden Beef meat, BR Food Materials 28 kg 2009 Cederberg et al., 2009. Brazil Beef meat, conventional, at butcher, DE Food Materials 13.3 kg 2008
PROBAS database, 2008. Germany
Beef meat, conventional, at slaughterhouse, DE Food Materials 8.9 kg 2008
PROBAS database, 2008. Germany
Beef meat, conventional, frozen, at butcher, DE Food Materials 14 kg 2008
PROBAS database, 2008. Germany
Beef meat, EU Food Materials 28.7 kg 2008 Weidema et al., 2008. EU Beef meat, JP Food Materials 36.4 kg 2007 Ogino et al., 2007 Japan Beef meat, minced, at slaughterhouse, DK Food Materials 4.35 kg 2003 Nielsen et al, 2003. Denmark
Beef meat, organic, at butcher, DE Food Materials 11.4 kg 2008 PROBAS database, 2008. Germany
Beef meat, organic, at slaughterhouse, DE Food Materials 7.61 kg 2008
PROBAS database, 2008. Germany
Beef meat, organic, frozen, at butcher, DE Food Materials 12.1 kg 2008
PROBAS database, 2008. Germany
Beef meat, UK Food Materials 15.45 kg 2006 Williams et al., 2006. UK Beef outside, at slaughterhouse, DK Food Materials 22.3 kg 2003 Nielsen et al, 2003. Denmark Beef round, at slaughterhouse, DK Food Materials 22.1 kg 2003 Nielsen et al, 2003. Denmark Beef steak, at slaughterhouse, DK Food Materials 42.4 kg 2003 Nielsen et al, 2003. Denmark Beef tenderloin, at slaughterhouse, DK Food Materials 67.9 kg 2003 Nielsen et al, 2003. Denmark
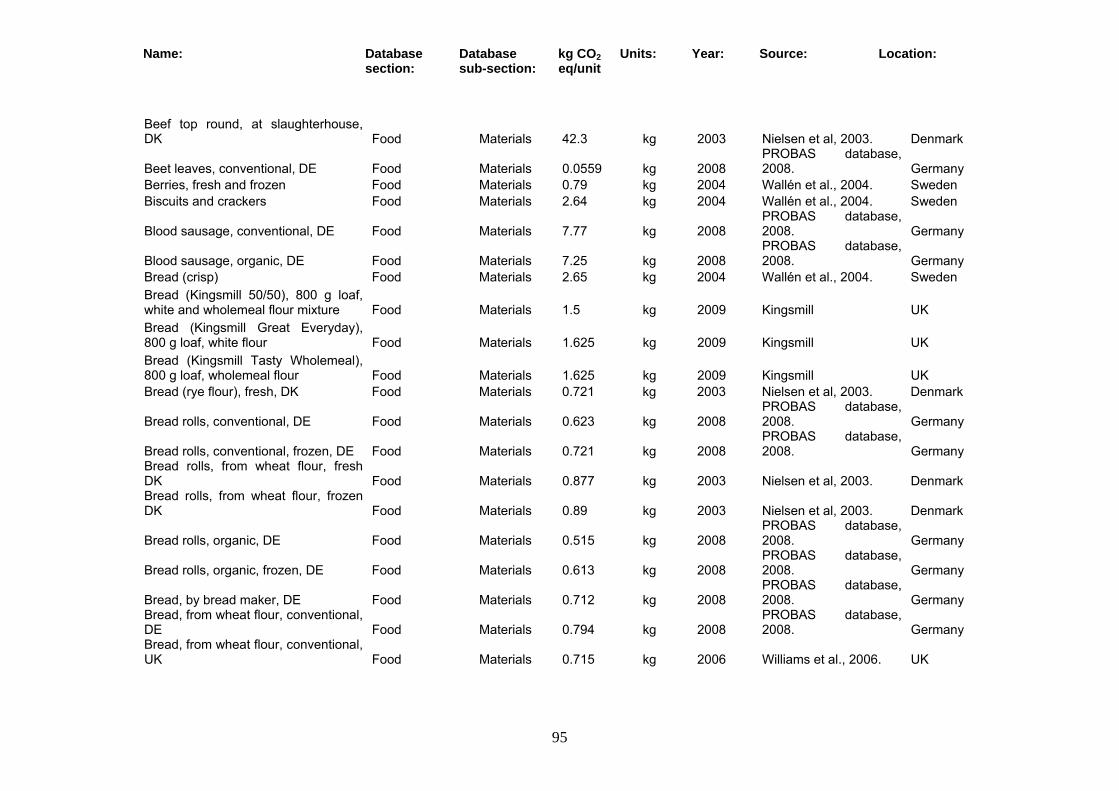
Name: Database section:
Database sub-section:
kg CO2 eq/unit
Units: Year: Source: Location:
95
Beef top round, at slaughterhouse, DK Food Materials 42.3 kg 2003 Nielsen et al, 2003. Denmark
Beet leaves, conventional, DE Food Materials 0.0559 kg 2008 PROBAS database, 2008. Germany
Berries, fresh and frozen Food Materials 0.79 kg 2004 Wallén et al., 2004. Sweden Biscuits and crackers Food Materials 2.64 kg 2004 Wallén et al., 2004. Sweden
Blood sausage, conventional, DE Food Materials 7.77 kg 2008 PROBAS database, 2008. Germany
Blood sausage, organic, DE Food Materials 7.25 kg 2008 PROBAS database, 2008. Germany
Bread (crisp) Food Materials 2.65 kg 2004 Wallén et al., 2004. Sweden Bread (Kingsmill 50/50), 800 g loaf, white and wholemeal flour mixture Food Materials 1.5 kg 2009 Kingsmill UK Bread (Kingsmill Great Everyday), 800 g loaf, white flour Food Materials 1.625 kg 2009 Kingsmill UK Bread (Kingsmill Tasty Wholemeal), 800 g loaf, wholemeal flour Food Materials 1.625 kg 2009 Kingsmill UK Bread (rye flour), fresh, DK Food Materials 0.721 kg 2003 Nielsen et al, 2003. Denmark
Bread rolls, conventional, DE Food Materials 0.623 kg 2008 PROBAS database, 2008. Germany
Bread rolls, conventional, frozen, DE Food Materials 0.721 kg 2008 PROBAS database, 2008. Germany
Bread rolls, from wheat flour, fresh DK Food Materials 0.877 kg 2003 Nielsen et al, 2003. Denmark Bread rolls, from wheat flour, frozen DK Food Materials 0.89 kg 2003 Nielsen et al, 2003. Denmark
Bread rolls, organic, DE Food Materials 0.515 kg 2008 PROBAS database, 2008. Germany
Bread rolls, organic, frozen, DE Food Materials 0.613 kg 2008 PROBAS database, 2008. Germany
Bread, by bread maker, DE Food Materials 0.712 kg 2008 PROBAS database, 2008. Germany
Bread, from wheat flour, conventional, DE Food Materials 0.794 kg 2008
PROBAS database, 2008. Germany
Bread, from wheat flour, conventional, UK Food Materials 0.715 kg 2006 Williams et al., 2006. UK

Name: Database section:
Database sub-section:
kg CO2 eq/unit
Units: Year: Source: Location:
96
Bread, from wheat flour, DK Food Materials 0.847 kg 2003 Nielsen et al, 2003. Denmark Bread, from wheat flour, fresh DK Food Materials 0.789 kg 2003 Nielsen et al, 2003. Denmark Bread, from wheat flour, frozen DK Food Materials 0.802 kg 2003 Nielsen et al, 2003. Denmark
Bread, from wheat flour, organic, DE Food Materials 0.678 kg 2008 PROBAS database, 2008. Germany
Bread, from wheat flour, organic, UK Food Materials 0.782 kg 2006 Williams et al., 2006. UK Bread, from wheat flour, SE Food Materials 0.76 kg 2004 Wallén et al., 2004. Sweden Bread, from white flour, UK Food Materials 0.726 kg 2009 DEFRA, 2009. UK Bread, IN Food Materials 0.2572 kg 2010 Pathak et al., 2010 India
Bread, organic, by bread maker , DE Food Materials 0.6 kg 2008 PROBAS database, 2008. Germany
Breadcrumbs Food Materials 3.055 kg 2009 Broekema and Blonk, 2009.
Netherlands
Breakfast cereals Food Materials 1 kg 2004 Wallén et al., 2004. Sweden Buns and cakes Food Materials 0.91 kg 2004 Wallén et al., 2004. Sweden Burger, IN Food Materials 0.2043 kg 2010 Pathak et al., 2010 India Butter Food Materials 0.98 kg 2004 Wallén et al., 2004. Sweden
Butter, conventional, DE Food Materials 23.7 kg 2008 PROBAS database, 2008. Germany
Butter, IN Food Materials 0.9974 kg 2010 Pathak et al., 2010 India
Butter, organic, DE Food Materials 22 kg 2008 PROBAS database, 2008. Germany
Cabbage (white), conventional, DE Food Materials 0.0303 kg 2008 PROBAS database, 2008. Germany
Cabbages Food Materials 0.5 kg 2004 Wallén et al., 2004. Sweden
Cacao beans Food Materials 0.32286 kg 2009 Ntiamoah and Afrane, 2008. Ghana
Carrot, conventional, NL Food Materials 0.035 kg 2009 Broekema and Blonk, 2009.
Netherlands
Carrot, organic, NL Food Materials 0.065 kg 2009 Broekema and Blonk, 2009.
Netherlands
Carrot, UK Food Materials 0.35 kg 2009 DEFRA, 2009. UK Cauliflower (early crop), conventional, NL Food Materials 0.333 kg 2009 Blonk et al., 2009.
Netherlands
Cauliflower (early crop), organic, NL Food Materials 0.389 kg 2009 Blonk et al., 2009. Netherlands
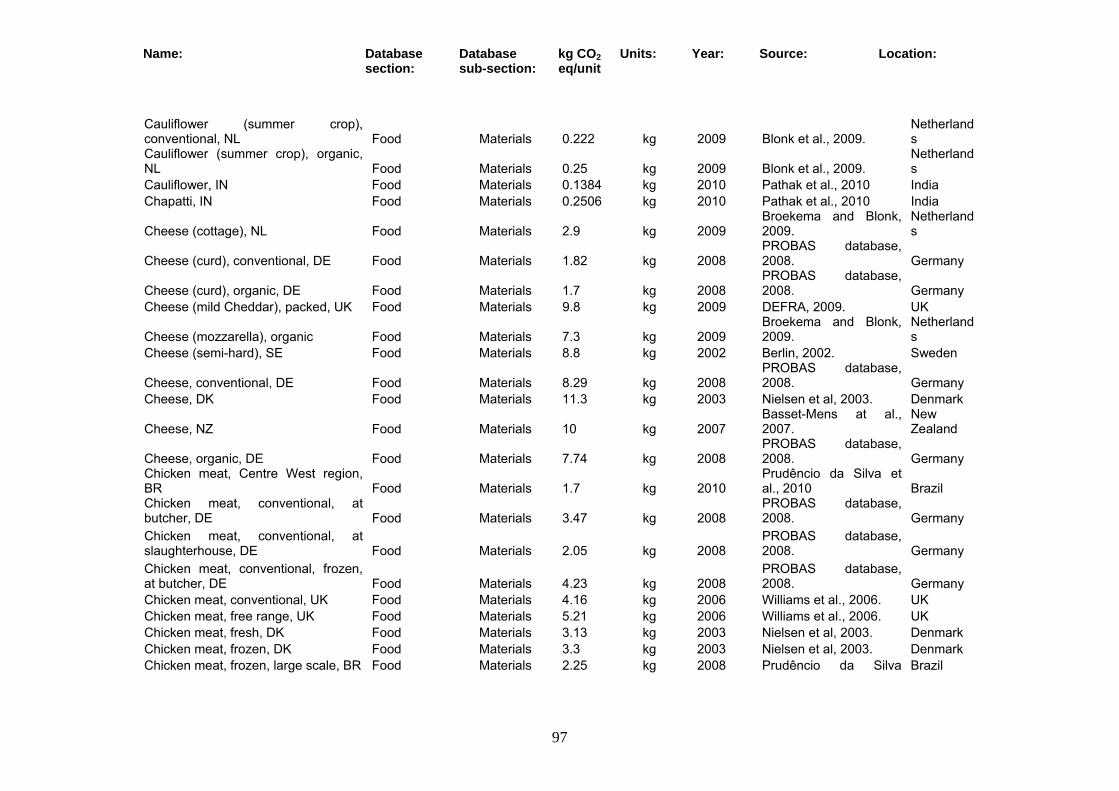
Name: Database section:
Database sub-section:
kg CO2 eq/unit
Units: Year: Source: Location:
97
Cauliflower (summer crop), conventional, NL Food Materials 0.222 kg 2009 Blonk et al., 2009.
Netherlands
Cauliflower (summer crop), organic, NL Food Materials 0.25 kg 2009 Blonk et al., 2009.
Netherlands
Cauliflower, IN Food Materials 0.1384 kg 2010 Pathak et al., 2010 India Chapatti, IN Food Materials 0.2506 kg 2010 Pathak et al., 2010 India
Cheese (cottage), NL Food Materials 2.9 kg 2009 Broekema and Blonk, 2009.
Netherlands
Cheese (curd), conventional, DE Food Materials 1.82 kg 2008 PROBAS database, 2008. Germany
Cheese (curd), organic, DE Food Materials 1.7 kg 2008 PROBAS database, 2008. Germany
Cheese (mild Cheddar), packed, UK Food Materials 9.8 kg 2009 DEFRA, 2009. UK
Cheese (mozzarella), organic Food Materials 7.3 kg 2009 Broekema and Blonk, 2009.
Netherlands
Cheese (semi-hard), SE Food Materials 8.8 kg 2002 Berlin, 2002. Sweden
Cheese, conventional, DE Food Materials 8.29 kg 2008 PROBAS database, 2008. Germany
Cheese, DK Food Materials 11.3 kg 2003 Nielsen et al, 2003. Denmark
Cheese, NZ Food Materials 10 kg 2007 Basset-Mens at al., 2007.
New Zealand
Cheese, organic, DE Food Materials 7.74 kg 2008 PROBAS database, 2008. Germany
Chicken meat, Centre West region, BR Food Materials 1.7 kg 2010
Prudêncio da Silva et al., 2010 Brazil
Chicken meat, conventional, at butcher, DE Food Materials 3.47 kg 2008
PROBAS database, 2008. Germany
Chicken meat, conventional, at slaughterhouse, DE Food Materials 2.05 kg 2008
PROBAS database, 2008. Germany
Chicken meat, conventional, frozen, at butcher, DE Food Materials 4.23 kg 2008
PROBAS database, 2008. Germany
Chicken meat, conventional, UK Food Materials 4.16 kg 2006 Williams et al., 2006. UK Chicken meat, free range, UK Food Materials 5.21 kg 2006 Williams et al., 2006. UK Chicken meat, fresh, DK Food Materials 3.13 kg 2003 Nielsen et al, 2003. Denmark Chicken meat, frozen, DK Food Materials 3.3 kg 2003 Nielsen et al, 2003. Denmark Chicken meat, frozen, large scale, BR Food Materials 2.25 kg 2008 Prudêncio da Silva Brazil
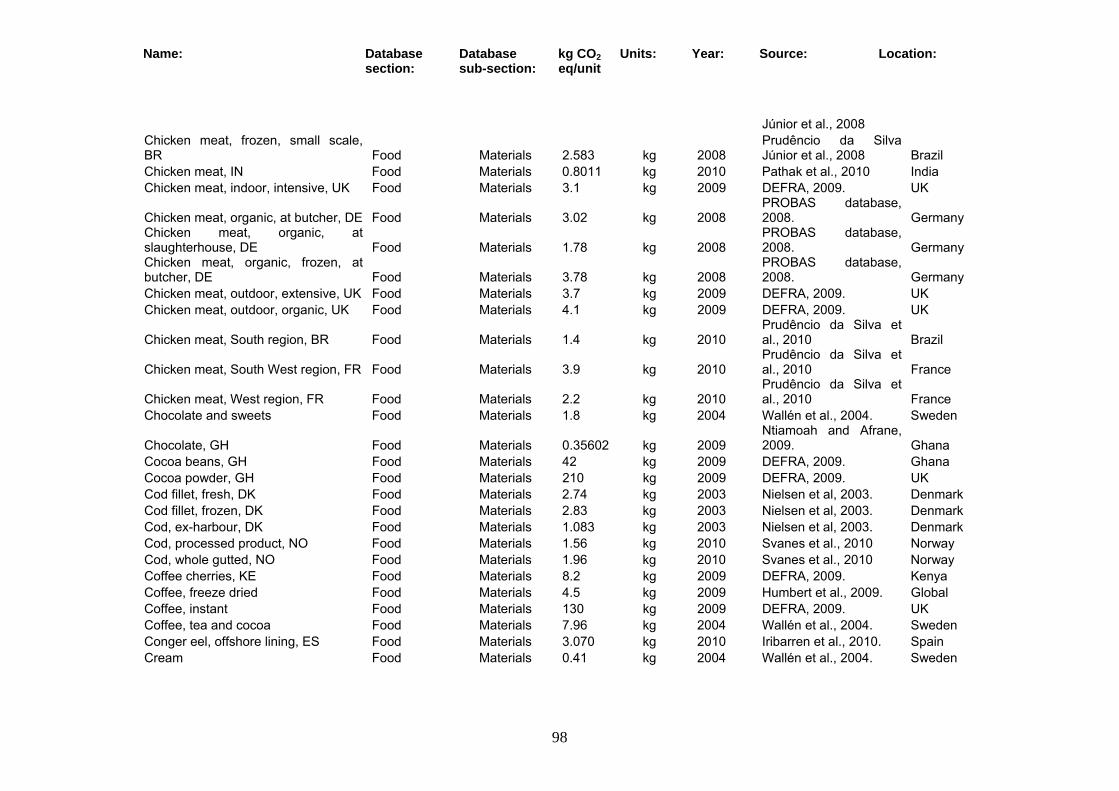
Name: Database section:
Database sub-section:
kg CO2 eq/unit
Units: Year: Source: Location:
98
Júnior et al., 2008 Chicken meat, frozen, small scale, BR Food Materials 2.583 kg 2008
Prudêncio da Silva Júnior et al., 2008 Brazil
Chicken meat, IN Food Materials 0.8011 kg 2010 Pathak et al., 2010 India Chicken meat, indoor, intensive, UK Food Materials 3.1 kg 2009 DEFRA, 2009. UK
Chicken meat, organic, at butcher, DE Food Materials 3.02 kg 2008 PROBAS database, 2008. Germany
Chicken meat, organic, at slaughterhouse, DE Food Materials 1.78 kg 2008
PROBAS database, 2008. Germany
Chicken meat, organic, frozen, at butcher, DE Food Materials 3.78 kg 2008
PROBAS database, 2008. Germany
Chicken meat, outdoor, extensive, UK Food Materials 3.7 kg 2009 DEFRA, 2009. UK Chicken meat, outdoor, organic, UK Food Materials 4.1 kg 2009 DEFRA, 2009. UK
Chicken meat, South region, BR Food Materials 1.4 kg 2010 Prudêncio da Silva et al., 2010 Brazil
Chicken meat, South West region, FR Food Materials 3.9 kg 2010 Prudêncio da Silva et al., 2010 France
Chicken meat, West region, FR Food Materials 2.2 kg 2010 Prudêncio da Silva et al., 2010 France
Chocolate and sweets Food Materials 1.8 kg 2004 Wallén et al., 2004. Sweden
Chocolate, GH Food Materials 0.35602 kg 2009 Ntiamoah and Afrane, 2009. Ghana
Cocoa beans, GH Food Materials 42 kg 2009 DEFRA, 2009. Ghana Cocoa powder, GH Food Materials 210 kg 2009 DEFRA, 2009. UK Cod fillet, fresh, DK Food Materials 2.74 kg 2003 Nielsen et al, 2003. Denmark Cod fillet, frozen, DK Food Materials 2.83 kg 2003 Nielsen et al, 2003. Denmark Cod, ex-harbour, DK Food Materials 1.083 kg 2003 Nielsen et al, 2003. Denmark Cod, processed product, NO Food Materials 1.56 kg 2010 Svanes et al., 2010 Norway Cod, whole gutted, NO Food Materials 1.96 kg 2010 Svanes et al., 2010 Norway Coffee cherries, KE Food Materials 8.2 kg 2009 DEFRA, 2009. Kenya Coffee, freeze dried Food Materials 4.5 kg 2009 Humbert et al., 2009. Global Coffee, instant Food Materials 130 kg 2009 DEFRA, 2009. UK Coffee, tea and cocoa Food Materials 7.96 kg 2004 Wallén et al., 2004. Sweden Conger eel, offshore lining, ES Food Materials 3.070 kg 2010 Iribarren et al., 2010. Spain Cream Food Materials 0.41 kg 2004 Wallén et al., 2004. Sweden
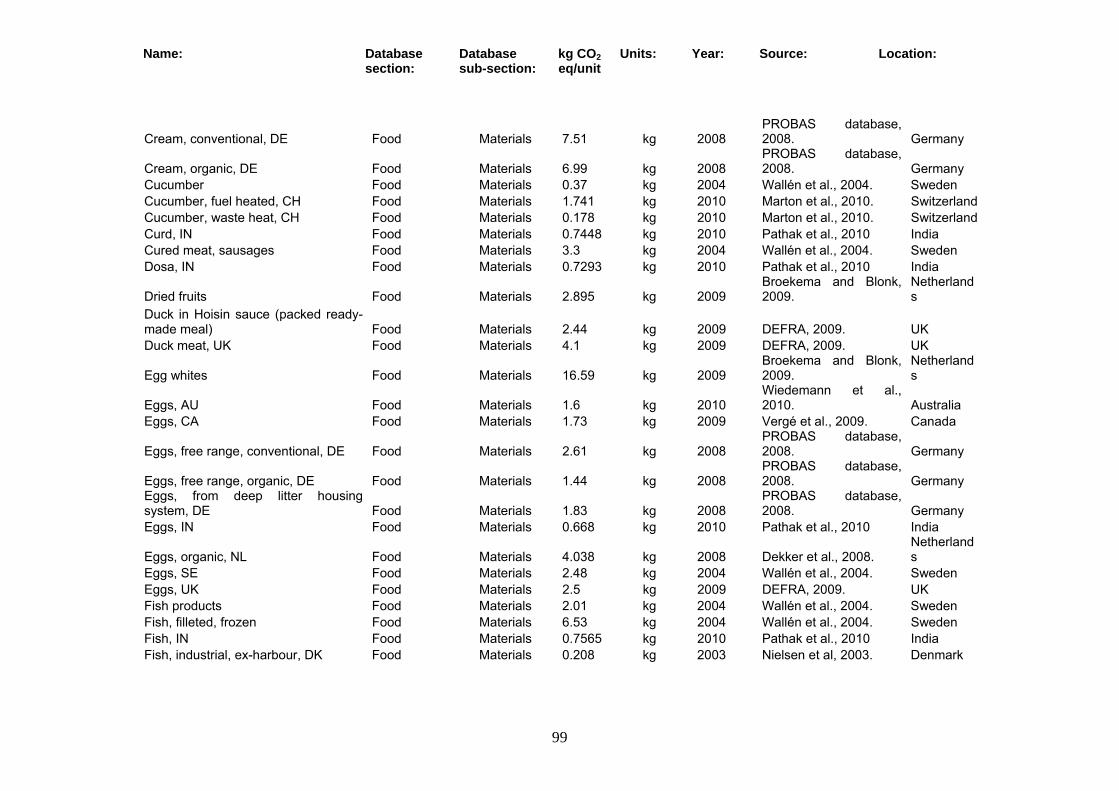
Name: Database section:
Database sub-section:
kg CO2 eq/unit
Units: Year: Source: Location:
99
Cream, conventional, DE Food Materials 7.51 kg 2008 PROBAS database, 2008. Germany
Cream, organic, DE Food Materials 6.99 kg 2008 PROBAS database, 2008. Germany
Cucumber Food Materials 0.37 kg 2004 Wallén et al., 2004. Sweden Cucumber, fuel heated, CH Food Materials 1.741 kg 2010 Marton et al., 2010. SwitzerlandCucumber, waste heat, CH Food Materials 0.178 kg 2010 Marton et al., 2010. SwitzerlandCurd, IN Food Materials 0.7448 kg 2010 Pathak et al., 2010 India Cured meat, sausages Food Materials 3.3 kg 2004 Wallén et al., 2004. Sweden Dosa, IN Food Materials 0.7293 kg 2010 Pathak et al., 2010 India
Dried fruits Food Materials 2.895 kg 2009 Broekema and Blonk, 2009.
Netherlands
Duck in Hoisin sauce (packed ready-made meal) Food Materials 2.44 kg 2009 DEFRA, 2009. UK Duck meat, UK Food Materials 4.1 kg 2009 DEFRA, 2009. UK
Egg whites Food Materials 16.59 kg 2009 Broekema and Blonk, 2009.
Netherlands
Eggs, AU Food Materials 1.6 kg 2010 Wiedemann et al., 2010. Australia
Eggs, CA Food Materials 1.73 kg 2009 Vergé et al., 2009. Canada
Eggs, free range, conventional, DE Food Materials 2.61 kg 2008 PROBAS database, 2008. Germany
Eggs, free range, organic, DE Food Materials 1.44 kg 2008 PROBAS database, 2008. Germany
Eggs, from deep litter housing system, DE Food Materials 1.83 kg 2008
PROBAS database, 2008. Germany
Eggs, IN Food Materials 0.668 kg 2010 Pathak et al., 2010 India
Eggs, organic, NL Food Materials 4.038 kg 2008 Dekker et al., 2008. Netherlands
Eggs, SE Food Materials 2.48 kg 2004 Wallén et al., 2004. Sweden Eggs, UK Food Materials 2.5 kg 2009 DEFRA, 2009. UK Fish products Food Materials 2.01 kg 2004 Wallén et al., 2004. Sweden Fish, filleted, frozen Food Materials 6.53 kg 2004 Wallén et al., 2004. Sweden Fish, IN Food Materials 0.7565 kg 2010 Pathak et al., 2010 India Fish, industrial, ex-harbour, DK Food Materials 0.208 kg 2003 Nielsen et al, 2003. Denmark
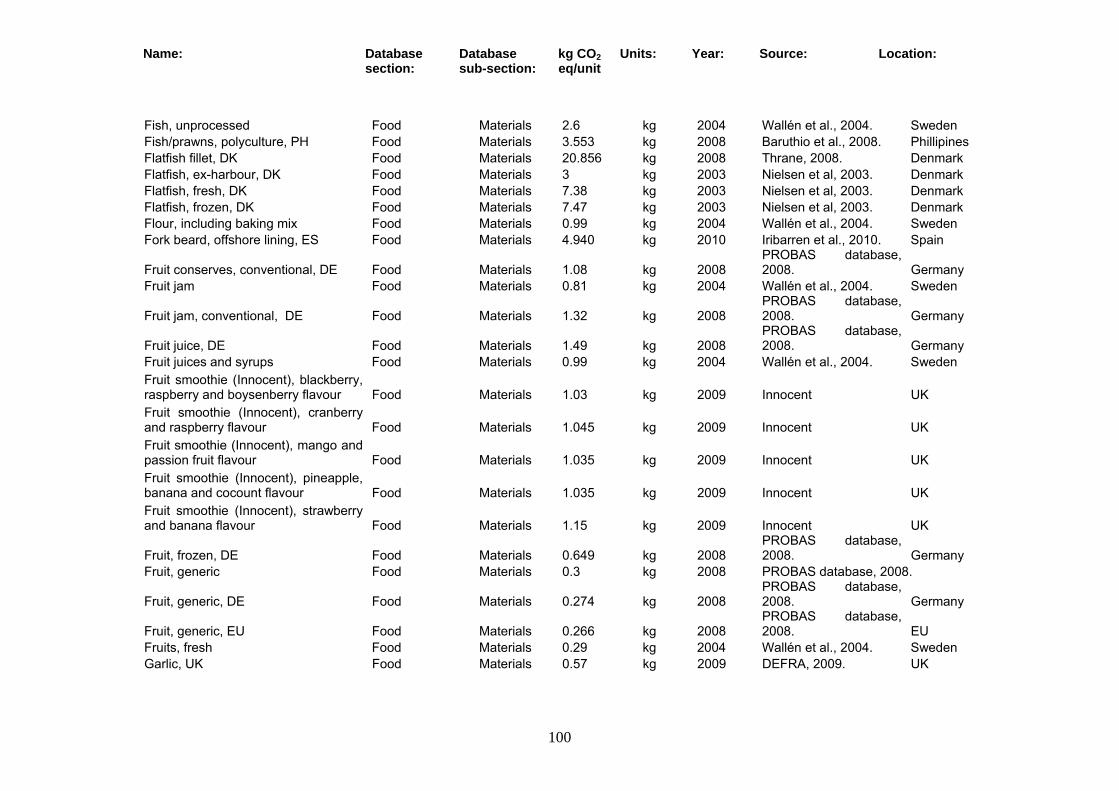
Name: Database section:
Database sub-section:
kg CO2 eq/unit
Units: Year: Source: Location:
100
Fish, unprocessed Food Materials 2.6 kg 2004 Wallén et al., 2004. Sweden Fish/prawns, polyculture, PH Food Materials 3.553 kg 2008 Baruthio et al., 2008. Phillipines Flatfish fillet, DK Food Materials 20.856 kg 2008 Thrane, 2008. Denmark Flatfish, ex-harbour, DK Food Materials 3 kg 2003 Nielsen et al, 2003. Denmark Flatfish, fresh, DK Food Materials 7.38 kg 2003 Nielsen et al, 2003. Denmark Flatfish, frozen, DK Food Materials 7.47 kg 2003 Nielsen et al, 2003. Denmark Flour, including baking mix Food Materials 0.99 kg 2004 Wallén et al., 2004. Sweden Fork beard, offshore lining, ES Food Materials 4.940 kg 2010 Iribarren et al., 2010. Spain
Fruit conserves, conventional, DE Food Materials 1.08 kg 2008 PROBAS database, 2008. Germany
Fruit jam Food Materials 0.81 kg 2004 Wallén et al., 2004. Sweden
Fruit jam, conventional, DE Food Materials 1.32 kg 2008 PROBAS database, 2008. Germany
Fruit juice, DE Food Materials 1.49 kg 2008 PROBAS database, 2008. Germany
Fruit juices and syrups Food Materials 0.99 kg 2004 Wallén et al., 2004. Sweden Fruit smoothie (Innocent), blackberry, raspberry and boysenberry flavour Food Materials 1.03 kg 2009 Innocent UK Fruit smoothie (Innocent), cranberry and raspberry flavour Food Materials 1.045 kg 2009 Innocent UK Fruit smoothie (Innocent), mango and passion fruit flavour Food Materials 1.035 kg 2009 Innocent UK Fruit smoothie (Innocent), pineapple, banana and cocount flavour Food Materials 1.035 kg 2009 Innocent UK Fruit smoothie (Innocent), strawberry and banana flavour Food Materials 1.15 kg 2009 Innocent UK
Fruit, frozen, DE Food Materials 0.649 kg 2008 PROBAS database, 2008. Germany
Fruit, generic Food Materials 0.3 kg 2008 PROBAS database, 2008.
Fruit, generic, DE Food Materials 0.274 kg 2008 PROBAS database, 2008. Germany
Fruit, generic, EU Food Materials 0.266 kg 2008 PROBAS database, 2008. EU
Fruits, fresh Food Materials 0.29 kg 2004 Wallén et al., 2004. Sweden Garlic, UK Food Materials 0.57 kg 2009 DEFRA, 2009. UK
Name: Database section:
Database sub-section:
kg CO2 eq/unit
Units: Year: Source: Location:
101
Hake, coastal trawling, ES Food Materials 3.99 kg 2010 Iribarren et al., 2010. Spain Hake, offshore lining, ES Food Materials 5.700 kg 2010 Iribarren et al., 2010. Spain Hake, offshore trawling, ES Food Materials 6.260 kg 2010 Iribarren et al., 2010. Spain
Ham, conventional, DE Food Materials 4.6 kg 2008 PROBAS database, 2008. Germany
Ham, DK Food Materials 3.29 kg 2003 Nielsen et al, 2003. Denmark
Ham, organic, DE Food Materials 4.31 kg 2008 PROBAS database, 2008. Germany
Hens (spent), conventional, at slaughterhouse, DE Food Materials 0.531 kg 2008
PROBAS database, 2008. Germany
Hens (spent), free range, at slaughterhouse, DE Food Materials 0.839 kg 2008
PROBAS database, 2008. Germany
Herring fillet, fresh, DK Food Materials 1.28 kg 2003 Nielsen et al, 2003. Denmark Herring fillet, frozen, DK Food Materials 1.43 kg 2003 Nielsen et al, 2003. Denmark Herring, ex-harbour, DK Food Materials 0.562 kg 2003 Nielsen et al, 2003. Denmark Honey (Mey Selections), glass jar, 227 g, UK Food Materials 3.3 kg 2009 Mey Selections UK Honey (Mey Selections), kilner glass jar, UK Food Materials 1.8 kg 2009 Mey Selections UK Honey (Mey Selections), small glass jar, UK Food Materials 5.58 kg 2009 Mey Selections UK Ice-cream Food Materials 0.64 kg 2004 Wallén et al., 2004. Sweden Idli, IN Food Materials 0.6825 kg 2010 Pathak et al., 2010 India Jaffa cakes, UK Food Materials 2.55 kg 2009 DEFRA, 2009. UK
Kiwi, NZ Food Materials 1.27 kg 2010 McLaren et al., 2010 New Zealand
Lamb meat (lowland), intensive, UK Food Materials 28 kg 2009 DEFRA, 2009. UK Lamb meat (lowland), organic, UK Food Materials 27 kg 2009 DEFRA, 2009. UK Lamb meat (upland), extensive, UK Food Materials 39 kg 2009 DEFRA, 2009. UK
Lamb meat, NZ Food Materials 33 kg 2009 DEFRA, 2009. New Zealand
Lamb meat, UK Food Materials 14.73 kg 2006 Williams et al., 2006. UK Lamb shanks and roasted potatoes, packed ready-made meal Food Materials 19.23 kg 2009 DEFRA, 2009. UK Lassi, IN Food Materials 0.3453 kg 2010 Pathak et al., 2010 India

Name: Database section:
Database sub-section:
kg CO2 eq/unit
Units: Year: Source: Location:
102
Leek, NL Food Materials 0.17 kg 2009 Broekema and Blonk, 2009.
Netherlands
Lemon essential oil, IT Food Materials 43.8 kg 2009 Beccali et al., 2009. Italy Lemon juice (concentrated), IT Food Materials 4 kg 2009 Beccali et al., 2009. Italy Lemon juice (natural), IT Food Materials 0.7 kg 2009 Beccali et al., 2009. Italy Lettuce, fuel heated, CH Food Materials 4.507 kg 2010 Marton et al., 2010. SwitzerlandLettuce, waste heat, CH Food Materials 0.453 kg 2010 Marton et al., 2010. SwitzerlandLing (common), offshore lining, ES Food Materials 2.470 kg 2010 Iribarren et al., 2010. Spain Lobster (Norway), ex harbour Food Materials 18.36 kg 2003 Nielsen et al, 2003. Denmark Lobster (Norway), offshore trawling, ES Food Materials 25.483 kg 2010 Iribarren et al., 2010. Spain Mackerel (Atlantic horse), coastal seining, ES Food Materials 0.929 kg 2010 Iribarren et al., 2010. Spain Mackerel (Atlantic horse), coastal trawling, ES Food Materials 0.88 kg 2010 Iribarren et al., 2010. Spain Mackerel (Atlantic), coastal seining, ES Food Materials 0.578 kg 2010 Iribarren et al., 2010. Spain Mackerel (Atlantic), coastal trawling, ES Food Materials 0.547 kg 2010 Iribarren et al., 2010. Spain Mackerel (chub), coastal seining, ES Food Materials 0.739 kg 2010 Iribarren et al., 2010. Spain Mackerel fillet, fresh, DK Food Materials 0.46 kg 2003 Nielsen et al, 2003. Denmark Mackerel fillet, frozen, DK Food Materials 0.621 kg 2003 Nielsen et al, 2003. Denmark Mackerel, ex harbour, DK Food Materials 0.169 kg 2003 Nielsen et al, 2003. Denmark Maize (corn grain), Codington, South Dakota, US Food Materials 0.289 kg 2009 Kim et al., 2009. USA Maize (corn grain), Freeborn, Minnesota, US Food Materials 0.416 kg 2009 Kim et al., 2009. USA Maize (corn grain), Fulton, Illinois, US Food Materials 0.389 kg 2009 Kim et al., 2009. USA Maize (corn grain), Hamilton, Nebraska, US Food Materials 0.37 kg 2009 Kim et al., 2009. USA Maize (corn grain), Hardin, Iowa, US Food Materials 0.254 kg 2009 Kim et al., 2009. USA Maize (corn grain), Macon, Missouri, US Food Materials 0.825 kg 2009 Kim et al., 2009. USA Maize (corn grain), Morrison, Minnesota, US Food Materials 0.442 kg 2009 Kim et al., 2009. USA

Name: Database section:
Database sub-section:
kg CO2 eq/unit
Units: Year: Source: Location:
103
Maize (corn grain), Tuscola, Michigan, US Food Materials 0.401 kg 2009 Kim et al., 2009. USA
Maize (corn) Food Materials 0.29 kg 2009 Broekema and Blonk, 2009.
Netherlands
Maize (corn), organic Food Materials 0.32 kg 2009 Broekema and Blonk, 2009.
Netherlands
Maize, UK Food Materials 0.34 kg 2009 DEFRA, 2009. UK
Malt, from conventional barley, DE Food Materials 0.649 kg 2008 PROBAS database, 2008. Germany
Malt, from organic barley, DE Food Materials 0.495 kg 2008 PROBAS database, 2008. Germany
Malted barley, NL Food Materials 0.705 kg 2009 Broekema and Blonk, 2009.
Netherlands
Margarine Food Materials 2.12 kg 2004 Wallén et al., 2004. Sweden
Margarine, conventional, DE Food Materials 0.649 kg 2008 PROBAS database, 2008. Germany
Margarine, organic, DE Food Materials 0.497 kg 2008 PROBAS database, 2008. Germany
Meal (1), homemade, DK Food Materials 4.6 kg 2007 Dalgaard et al., 2007. Denmark Meal (1), homemade, ES Food Materials 1.77 kg 2008 Davis et al., 2008. Spain Meal (1), homemade, SE Food Materials 1.19 kg 2008 Davis et al., 2008. Sweden Meal (2), homemade, DK Food Materials 3.4 kg 2007 Dalgaard et al., 2007. Denmark Meal (2), homemade, ES Food Materials 1.76 kg 2008 Davis et al., 2008. Spain Meal (2), homemade, SE Food Materials 1.15 kg 2008 Davis et al., 2008. Sweden Meal (3), homemade, DK Food Materials 3.8 kg 2007 Dalgaard et al., 2007. Denmark Meal (3), homemade, ES Food Materials 1.74 kg 2008 Davis et al., 2008. Spain Meal (3), homemade, SE Food Materials 1.22 kg 2008 Davis et al., 2008. Sweden
Meal (ready-made), conventional, DE Food Materials 1.47 kg 2008 PROBAS database, 2008. Germany
Meal (ready-made), organic, DE Food Materials 1.32 kg 2008 PROBAS database, 2008. Germany
Meal, homemade, vegetarian, ES Food Materials 1.16 kg 2008 Davis et al., 2008. Spain Meal, homemade, vegetarian, SE Food Materials 0.54 kg 2008 Davis et al., 2008. Sweden Meat products, frozen Food Materials 0.2 kg 2004 Wallén et al., 2004. Sweden

Name: Database section:
Database sub-section:
kg CO2 eq/unit
Units: Year: Source: Location:
104
Meat substitute made from milk (Valess, Milner 30+) Food Materials 5.64 kg 2009
Broekema and Blonk, 2009.
Netherlands
Meat, cultured in vitro Food Materials 1.508 kg 2010 Tuomisto and Teixeira de Mattos, 2010. Italy
Meats and bones Food Materials 2.36 kg 2004 Wallén et al., 2004. Sweden Megrim, offshore trawling, ES Food Materials 7.570 kg 2010 Iribarren et al., 2010. Spain Melon, IT Food Materials 1.375 kg 2010 Cellura et al., 2010. Italy
Milk (condensed), conventional, DE Food Materials 2.43 kg 2008 PROBAS database, 2008. Germany
Milk (condensed), organic, DE Food Materials 2.29 kg 2008 PROBAS database, 2008. Germany
Milk (goat), conventional, FR Food Materials 1.272 kg 2008 Kanyarushoki et al., 2008. France
Milk (sour), processed Food Materials 0.4 kg 2004 Wallén et al., 2004. Sweden Milk (Tesco), semi-skimmed, UK Food Materials 1.38 kg 2009 Tesco UK Milk (Tesco), skimmed, UK Food Materials 1.26 kg 2009 Tesco UK Milk (Tesco), whole, UK Food Materials 1.61 kg 2009 Tesco UK
Milk powder, conventional, DE Food Materials 7.97 kg 2008 PROBAS database, 2008. Germany
Milk powder, DK Food Materials 8.69 kg 2003 Nielsen et al, 2003. Denmark
Milk powder, organic, DE Food Materials 7.51 kg 2008 PROBAS database, 2008. Germany
Milk, conventional (1), farm gate, FR Food Materials 0.88 kg 2008 Kanyarushoki et al., 2008. France
Milk, conventional (2), farm gate, FR Food Materials 1.033 kg 2008 Kanyarushoki et al., 2008. France
Milk, conventional, DE Food Materials 0.845 kg 2008 PROBAS database, 2008. Germany
Milk, conventional, FR Food Materials 0.942 kg 2008 Corson and van der Werf, 2008. France
Milk, conventional, high yield, SE Food Materials 0.896 kg 2004 Cederberg and Flysjö, 2004. Sweden
Milk, conventional, medium yield, SE Food Materials 1.037 kg 2004 Cederberg and Flysjö, 2004. Sweden
Milk, conventional, NL Food Materials 1.4 kg 2008 Thomassen et al., 2008. Netherlands
Name: Database section:
Database sub-section:
kg CO2 eq/unit
Units: Year: Source: Location:
105
Milk, conventional, processing plant gate, FR Food Materials 1.167 kg 2009
Kanyarushoki et al., 2008. France
Milk, conventional, SE Food Materials 0.95 kg 2000 Cederberg & Mattsson, 2000. Sweden
Milk, East midland, US Food Materials 1.104 kg 2010 Thoma et al., 2010. USA Milk, ES Food Materials 1.05 kg 2003 Hospido et al., 2003. Spain Milk, EU Food Materials 2.4 kg 2008 Weidema et al., 2008. EU Milk, extensive, DE Food Materials 1.3 kg 2001 Hass et al., 2001 Germany Milk, extensive, low yield, UK Food Materials 1.442 kg 2009 DEFRA, 2009. UK Milk, GLO Food Materials 2.4 kg 2010 FAO, 2010 Global Milk, high quality, IT Food Materials 1.54 kg 2010 Fantin et al., 2010 Italy
Milk, IE Food Materials 1.3 kg 2005 Casey and Holden, 2005. Ireland
Milk, IN Food Materials 0.7668 kg 2010 Pathak et al., 2010 India Milk, intensive, DE Food Materials 1.3 kg 2001 Hass et al., 2001 Germany Milk, intensive, high yield, UK Food Materials 1.236 kg 2009 DEFRA, 2009. UK Milk, Italian Alps (1), IT Food Materials 1.05 kg 2010 Penati et al, 2010. Italy Milk, Italian Alps (2), IT Food Materials 1.09 kg 2010 Penati et al, 2010. Italy Milk, Italian Alps (3), IT Food Materials 1.08 kg 2010 Penati et al, 2010. Italy Milk, Italian Alps (4), IT Food Materials 1.11 kg 2010 Penati et al, 2010. Italy Milk, Italian Alps (5), IT Food Materials 1.15 kg 2010 Penati et al, 2010. Italy Milk, low fat, DK Food Materials 1.16 kg 2003 Nielsen et al, 2003. Denmark Milk, North East, US Food Materials 1.042 kg 2010 Thoma et al., 2010. USA
Milk, NZ Food Materials 0.856 kg 2008 Basset-Mens et al., 2008.
New Zealand
Milk, organic (1), DE Food Materials 0.788 kg 2008 PROBAS database, 2008. Germany
Milk, organic (1), SE Food Materials 1.1 kg 2000 Cederberg & Mattsson, 2000. Sweden
Milk, organic (2), DE Food Materials 1 kg 2001 Hass et al., 2001 Germany
Milk, organic (2), SE Food Materials 0.938 kg 2004 Cederberg and Flysjö, 2004. Sweden
Milk, organic, FR Food Materials 1.012 kg 2008 Corson and van der Werf, 2008. France
Milk, organic, NL Food Materials 1.5 kg 2008 Thomassen et al., 2008. Netherland
Name: Database section:
Database sub-section:
kg CO2 eq/unit
Units: Year: Source: Location:
106
s Milk, organic, UK Food Materials 1.339 kg 2009 DEFRA, 2009. UK Milk, organic, US Food Materials 1.71 kg 2008 Heller et al., 2008. USA Milk, SE Food Materials 0.41 kg 2004 Wallén et al., 2004. Sweden
Milk, semi-skimmed, NL Food Materials 1.01 kg 2009 Broekema and Blonk, 2009.
Netherlands
Milk, skimmed, DK Food Materials 1.2 kg 2003 Nielsen et al, 2003. Denmark
Milk, skimmed, NL Food Materials 1.01 kg 2009 Broekema and Blonk, 2009.
Netherlands
Milk, South East, US Food Materials 1.449 kg 2010 Thoma et al., 2010. USA Milk, South Santa Catarina, BR Food Materials 1.42 kg 2010 de Leis et al., 2010 Brazil Milk, West coast, US Food Materials 1.207 kg 2010 Thoma et al., 2010. USA Milk, West midland, US Food Materials 1.471 kg 2010 Thoma et al., 2010. USA Milk, West Santa Catarina, BR Food Materials 1.692 kg 2010 de Leis et al., 2010 Brazil Milk, whole, DK Food Materials 1.09 kg 2003 Nielsen et al, 2003. Denmark
Mushrooms, hand picked, fresh Food Materials 1.972 kg 2009 Blonk et al., 2009. Netherlands
Mushrooms, machine harvested, canned Food Materials 2.944 kg 2009 Blonk et al., 2009.
Netherlands
Mushrooms, machine harvested, fresh Food Materials 1.625 kg 2009 Blonk et al., 2009.
Netherlands
Mushrooms, machine harvested, glass bottle Food Materials 2.917 kg 2009 Blonk et al., 2009.
Netherlands
Mussels, aquaculture, ES Food Materials 0.083 kg 2010 Iribarren et al., 2010. Spain Mussels, ex-harbour, DK Food Materials 0.0394 kg 2003 Nielsen et al, 2003. Denmark Mutton meat, IN Food Materials 9.1493 kg 2010 Pathak et al., 2010 India
Mycoprotein Food Materials 0.605 kg 2009 Broekema and Blonk, 2009.
Netherlands
Mycoprotein (Quorn), minced (1) Food Materials 2.3 kg 2009 Broekema and Blonk, 2009.
Netherlands
Mycoprotein (Quorn), minced (2) Food Materials 6.84 kg 2010 Finnigan et al., 2010 UK Oat flakes (Quaker Oatso Simple), pre-cooked Food Materials 2.59 kg 2009 Pepsi Co. UK Oat flakes (Quaker) Food Materials 2.5 kg 2009 Pepsi Co. UK Oat flakes, DK Food Materials 0.662 kg 2003 Nielsen et al, 2003. Denmark
Name: Database section:
Database sub-section:
kg CO2 eq/unit
Units: Year: Source: Location:
107
Oatmeal and other grains Food Materials 1 kg 2004 Wallén et al., 2004. Sweden
Oats, conventional, DE Food Materials 0.349 kg 2008 PROBAS database, 2008. Germany
Oats, conventional, DK Food Materials 0.566 kg 2003 Nielsen et al, 2003. Denmark Oats, organic DK Food Materials 0.58 kg 2003 Nielsen et al, 2003. Denmark
Oats, organic, DE Food Materials 0.109 kg 2008 PROBAS database, 2008. Germany
Olive oil, CY Food Materials 7.25 kg 2006 Avraamides and Fatta, 2006. CY
Olive oil, GR Food Materials 12.7 kg 2005 Papadakis et al., 2005 Greece
Olive oil, organic Food Materials 0.795 kg 2009 Broekema and Blonk, 2009.
Netherlands
Onion, fried, organic, NL Food Materials 0.265 kg 2009 Broekema and Blonk, 2009.
Netherlands
Onions Food Materials 0.5 kg 2004 Wallén et al., 2004. Sweden Onions (spring), UK Food Materials 0.23 kg 2009 DEFRA, 2009. UK Onions, conventional, UK Food Materials 0.42 kg 2009 DEFRA, 2009. UK
Onions, NL Food Materials 0.165 kg 2009 Broekema and Blonk, 2009.
Netherlands
Onions, organic, NL Food Materials 0.23 kg 2009 Broekema and Blonk, 2009.
Netherlands
Onions, organic, UK Food Materials 0.59 kg 2009 DEFRA, 2009. UK Orange essential oil, IT Food Materials 74.4 kg 2009 Beccali et al., 2009. Italy Orange juice (concentrated), IT Food Materials 6 kg 2009 Beccali et al., 2009. Italy Orange juice (natural), IT Food Materials 1 kg 2009 Beccali et al., 2009. Italy Orange juice (Tesco), 100% pure, squeezed Food Materials 1.44 kg 2009 Tesco UK Orange juice (Tesco), pure, 1 l Food Materials 0.96 kg 2009 Tesco UK Orange juice (Tesco), pure, 3 x 200 ml pack Food Materials 0.88 kg 2009 Tesco UK Orange juice (Tesco), pure, from concentrate Food Materials 1.04 kg 2009 Tesco UK Orange juice (Tropicana), pure, premium quality Food Materials 0.949 kg 2009 Pepsi Co. UK Oranges Food Materials 0.25 kg 2004 Wallén et al., 2004. Sweden
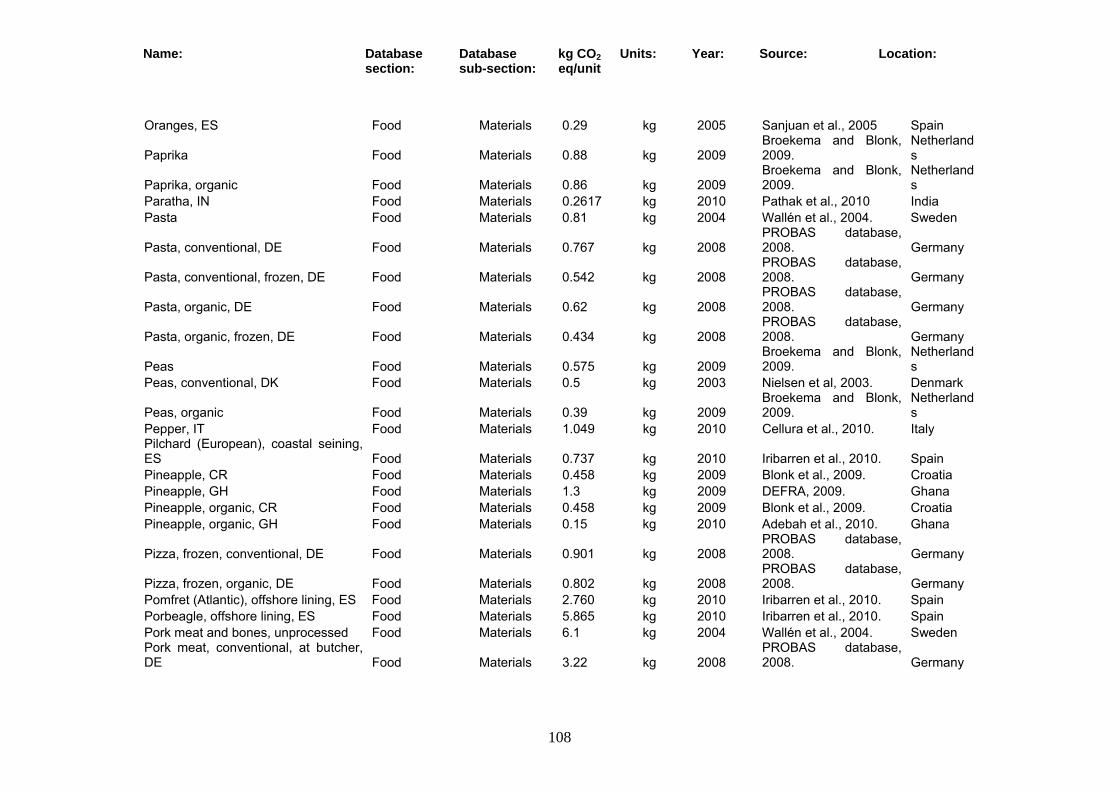
Name: Database section:
Database sub-section:
kg CO2 eq/unit
Units: Year: Source: Location:
108
Oranges, ES Food Materials 0.29 kg 2005 Sanjuan et al., 2005 Spain
Paprika Food Materials 0.88 kg 2009 Broekema and Blonk, 2009.
Netherlands
Paprika, organic Food Materials 0.86 kg 2009 Broekema and Blonk, 2009.
Netherlands
Paratha, IN Food Materials 0.2617 kg 2010 Pathak et al., 2010 India Pasta Food Materials 0.81 kg 2004 Wallén et al., 2004. Sweden
Pasta, conventional, DE Food Materials 0.767 kg 2008 PROBAS database, 2008. Germany
Pasta, conventional, frozen, DE Food Materials 0.542 kg 2008 PROBAS database, 2008. Germany
Pasta, organic, DE Food Materials 0.62 kg 2008 PROBAS database, 2008. Germany
Pasta, organic, frozen, DE Food Materials 0.434 kg 2008 PROBAS database, 2008. Germany
Peas Food Materials 0.575 kg 2009 Broekema and Blonk, 2009.
Netherlands
Peas, conventional, DK Food Materials 0.5 kg 2003 Nielsen et al, 2003. Denmark
Peas, organic Food Materials 0.39 kg 2009 Broekema and Blonk, 2009.
Netherlands
Pepper, IT Food Materials 1.049 kg 2010 Cellura et al., 2010. Italy Pilchard (European), coastal seining, ES Food Materials 0.737 kg 2010 Iribarren et al., 2010. Spain Pineapple, CR Food Materials 0.458 kg 2009 Blonk et al., 2009. Croatia Pineapple, GH Food Materials 1.3 kg 2009 DEFRA, 2009. Ghana Pineapple, organic, CR Food Materials 0.458 kg 2009 Blonk et al., 2009. Croatia Pineapple, organic, GH Food Materials 0.15 kg 2010 Adebah et al., 2010. Ghana
Pizza, frozen, conventional, DE Food Materials 0.901 kg 2008 PROBAS database, 2008. Germany
Pizza, frozen, organic, DE Food Materials 0.802 kg 2008 PROBAS database, 2008. Germany
Pomfret (Atlantic), offshore lining, ES Food Materials 2.760 kg 2010 Iribarren et al., 2010. Spain Porbeagle, offshore lining, ES Food Materials 5.865 kg 2010 Iribarren et al., 2010. Spain Pork meat and bones, unprocessed Food Materials 6.1 kg 2004 Wallén et al., 2004. Sweden Pork meat, conventional, at butcher, DE Food Materials 3.22 kg 2008
PROBAS database, 2008. Germany
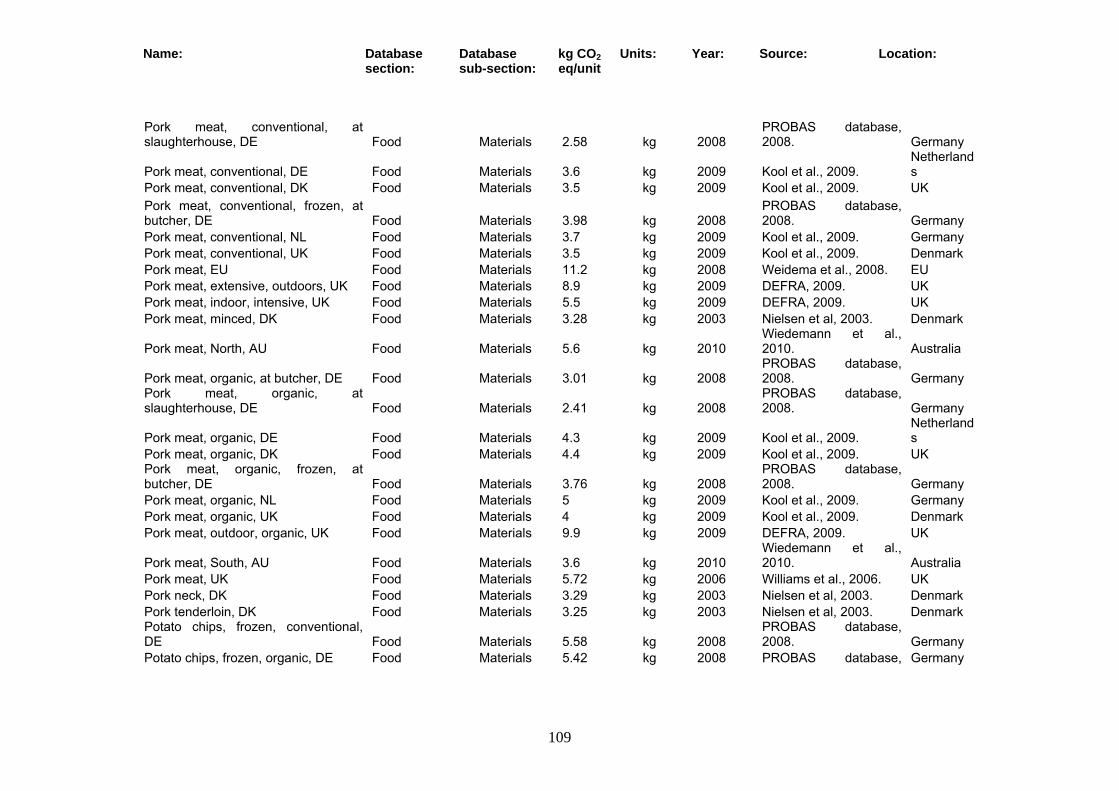
Name: Database section:
Database sub-section:
kg CO2 eq/unit
Units: Year: Source: Location:
109
Pork meat, conventional, at slaughterhouse, DE Food Materials 2.58 kg 2008
PROBAS database, 2008. Germany
Pork meat, conventional, DE Food Materials 3.6 kg 2009 Kool et al., 2009. Netherlands
Pork meat, conventional, DK Food Materials 3.5 kg 2009 Kool et al., 2009. UK Pork meat, conventional, frozen, at butcher, DE Food Materials 3.98 kg 2008
PROBAS database, 2008. Germany
Pork meat, conventional, NL Food Materials 3.7 kg 2009 Kool et al., 2009. Germany Pork meat, conventional, UK Food Materials 3.5 kg 2009 Kool et al., 2009. Denmark Pork meat, EU Food Materials 11.2 kg 2008 Weidema et al., 2008. EU Pork meat, extensive, outdoors, UK Food Materials 8.9 kg 2009 DEFRA, 2009. UK Pork meat, indoor, intensive, UK Food Materials 5.5 kg 2009 DEFRA, 2009. UK Pork meat, minced, DK Food Materials 3.28 kg 2003 Nielsen et al, 2003. Denmark
Pork meat, North, AU Food Materials 5.6 kg 2010 Wiedemann et al., 2010. Australia
Pork meat, organic, at butcher, DE Food Materials 3.01 kg 2008 PROBAS database, 2008. Germany
Pork meat, organic, at slaughterhouse, DE Food Materials 2.41 kg 2008
PROBAS database, 2008. Germany
Pork meat, organic, DE Food Materials 4.3 kg 2009 Kool et al., 2009. Netherlands
Pork meat, organic, DK Food Materials 4.4 kg 2009 Kool et al., 2009. UK Pork meat, organic, frozen, at butcher, DE Food Materials 3.76 kg 2008
PROBAS database, 2008. Germany
Pork meat, organic, NL Food Materials 5 kg 2009 Kool et al., 2009. Germany Pork meat, organic, UK Food Materials 4 kg 2009 Kool et al., 2009. Denmark Pork meat, outdoor, organic, UK Food Materials 9.9 kg 2009 DEFRA, 2009. UK
Pork meat, South, AU Food Materials 3.6 kg 2010 Wiedemann et al., 2010. Australia
Pork meat, UK Food Materials 5.72 kg 2006 Williams et al., 2006. UK Pork neck, DK Food Materials 3.29 kg 2003 Nielsen et al, 2003. Denmark Pork tenderloin, DK Food Materials 3.25 kg 2003 Nielsen et al, 2003. Denmark Potato chips, frozen, conventional, DE Food Materials 5.58 kg 2008
PROBAS database, 2008. Germany
Potato chips, frozen, organic, DE Food Materials 5.42 kg 2008 PROBAS database, Germany
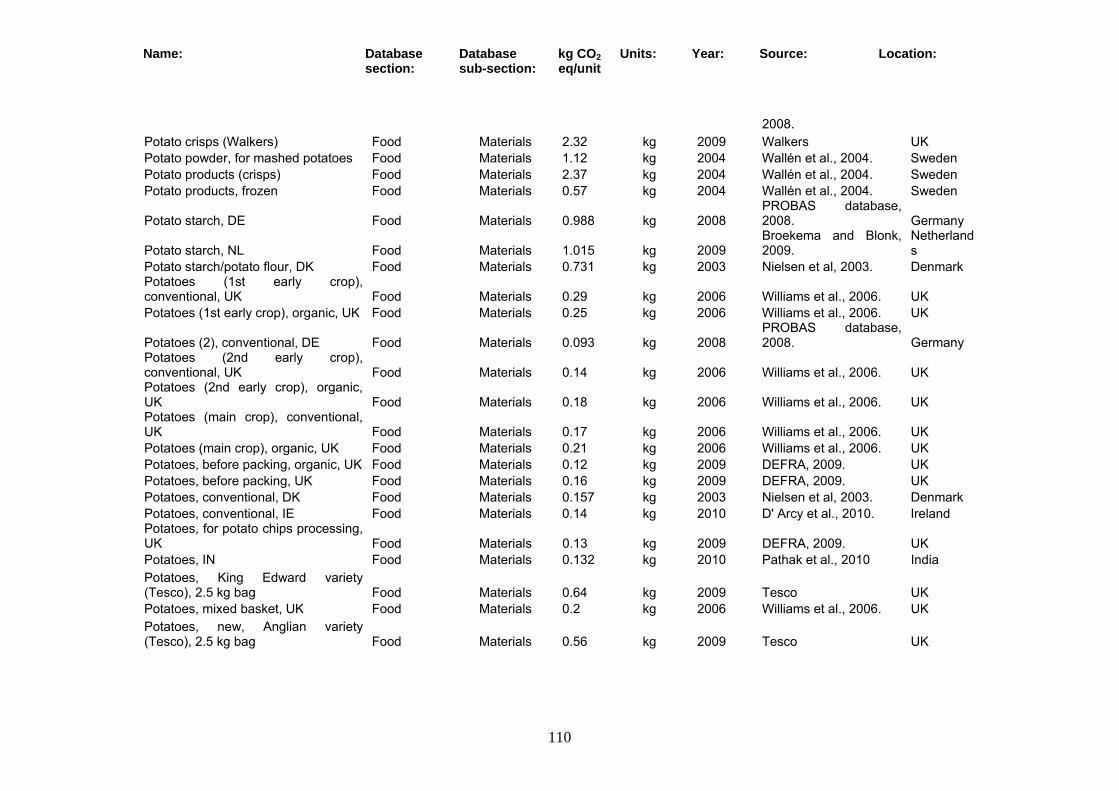
Name: Database section:
Database sub-section:
kg CO2 eq/unit
Units: Year: Source: Location:
110
2008. Potato crisps (Walkers) Food Materials 2.32 kg 2009 Walkers UK Potato powder, for mashed potatoes Food Materials 1.12 kg 2004 Wallén et al., 2004. Sweden Potato products (crisps) Food Materials 2.37 kg 2004 Wallén et al., 2004. Sweden Potato products, frozen Food Materials 0.57 kg 2004 Wallén et al., 2004. Sweden
Potato starch, DE Food Materials 0.988 kg 2008 PROBAS database, 2008. Germany
Potato starch, NL Food Materials 1.015 kg 2009 Broekema and Blonk, 2009.
Netherlands
Potato starch/potato flour, DK Food Materials 0.731 kg 2003 Nielsen et al, 2003. Denmark Potatoes (1st early crop), conventional, UK Food Materials 0.29 kg 2006 Williams et al., 2006. UK Potatoes (1st early crop), organic, UK Food Materials 0.25 kg 2006 Williams et al., 2006. UK
Potatoes (2), conventional, DE Food Materials 0.093 kg 2008 PROBAS database, 2008. Germany
Potatoes (2nd early crop), conventional, UK Food Materials 0.14 kg 2006 Williams et al., 2006. UK Potatoes (2nd early crop), organic, UK Food Materials 0.18 kg 2006 Williams et al., 2006. UK Potatoes (main crop), conventional, UK Food Materials 0.17 kg 2006 Williams et al., 2006. UK Potatoes (main crop), organic, UK Food Materials 0.21 kg 2006 Williams et al., 2006. UK Potatoes, before packing, organic, UK Food Materials 0.12 kg 2009 DEFRA, 2009. UK Potatoes, before packing, UK Food Materials 0.16 kg 2009 DEFRA, 2009. UK Potatoes, conventional, DK Food Materials 0.157 kg 2003 Nielsen et al, 2003. Denmark Potatoes, conventional, IE Food Materials 0.14 kg 2010 D' Arcy et al., 2010. Ireland Potatoes, for potato chips processing, UK Food Materials 0.13 kg 2009 DEFRA, 2009. UK Potatoes, IN Food Materials 0.132 kg 2010 Pathak et al., 2010 India Potatoes, King Edward variety (Tesco), 2.5 kg bag Food Materials 0.64 kg 2009 Tesco UK Potatoes, mixed basket, UK Food Materials 0.2 kg 2006 Williams et al., 2006. UK Potatoes, new, Anglian variety (Tesco), 2.5 kg bag Food Materials 0.56 kg 2009 Tesco UK
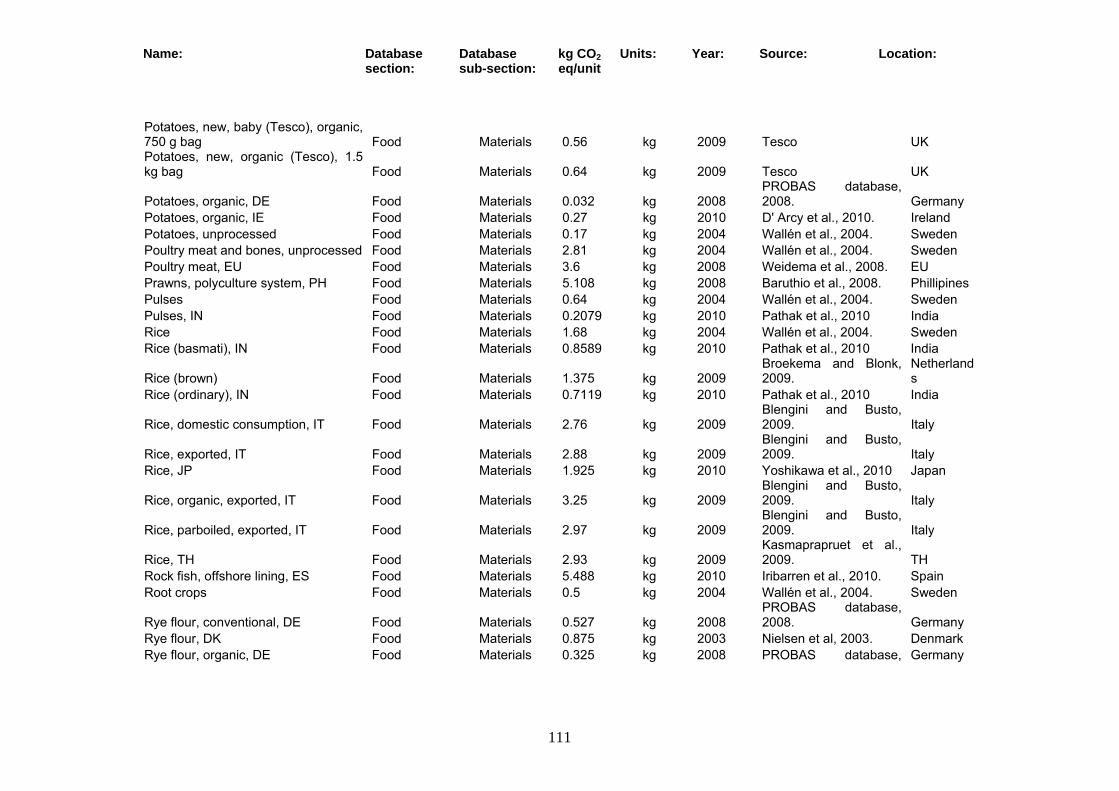
Name: Database section:
Database sub-section:
kg CO2 eq/unit
Units: Year: Source: Location:
111
Potatoes, new, baby (Tesco), organic, 750 g bag Food Materials 0.56 kg 2009 Tesco UK Potatoes, new, organic (Tesco), 1.5 kg bag Food Materials 0.64 kg 2009 Tesco UK
Potatoes, organic, DE Food Materials 0.032 kg 2008 PROBAS database, 2008. Germany
Potatoes, organic, IE Food Materials 0.27 kg 2010 D' Arcy et al., 2010. Ireland Potatoes, unprocessed Food Materials 0.17 kg 2004 Wallén et al., 2004. Sweden Poultry meat and bones, unprocessed Food Materials 2.81 kg 2004 Wallén et al., 2004. Sweden Poultry meat, EU Food Materials 3.6 kg 2008 Weidema et al., 2008. EU Prawns, polyculture system, PH Food Materials 5.108 kg 2008 Baruthio et al., 2008. Phillipines Pulses Food Materials 0.64 kg 2004 Wallén et al., 2004. Sweden Pulses, IN Food Materials 0.2079 kg 2010 Pathak et al., 2010 India Rice Food Materials 1.68 kg 2004 Wallén et al., 2004. Sweden Rice (basmati), IN Food Materials 0.8589 kg 2010 Pathak et al., 2010 India
Rice (brown) Food Materials 1.375 kg 2009 Broekema and Blonk, 2009.
Netherlands
Rice (ordinary), IN Food Materials 0.7119 kg 2010 Pathak et al., 2010 India
Rice, domestic consumption, IT Food Materials 2.76 kg 2009 Blengini and Busto, 2009. Italy
Rice, exported, IT Food Materials 2.88 kg 2009 Blengini and Busto, 2009. Italy
Rice, JP Food Materials 1.925 kg 2010 Yoshikawa et al., 2010 Japan
Rice, organic, exported, IT Food Materials 3.25 kg 2009 Blengini and Busto, 2009. Italy
Rice, parboiled, exported, IT Food Materials 2.97 kg 2009 Blengini and Busto, 2009. Italy
Rice, TH Food Materials 2.93 kg 2009 Kasmaprapruet et al., 2009. TH
Rock fish, offshore lining, ES Food Materials 5.488 kg 2010 Iribarren et al., 2010. Spain Root crops Food Materials 0.5 kg 2004 Wallén et al., 2004. Sweden
Rye flour, conventional, DE Food Materials 0.527 kg 2008 PROBAS database, 2008. Germany
Rye flour, DK Food Materials 0.875 kg 2003 Nielsen et al, 2003. Denmark Rye flour, organic, DE Food Materials 0.325 kg 2008 PROBAS database, Germany
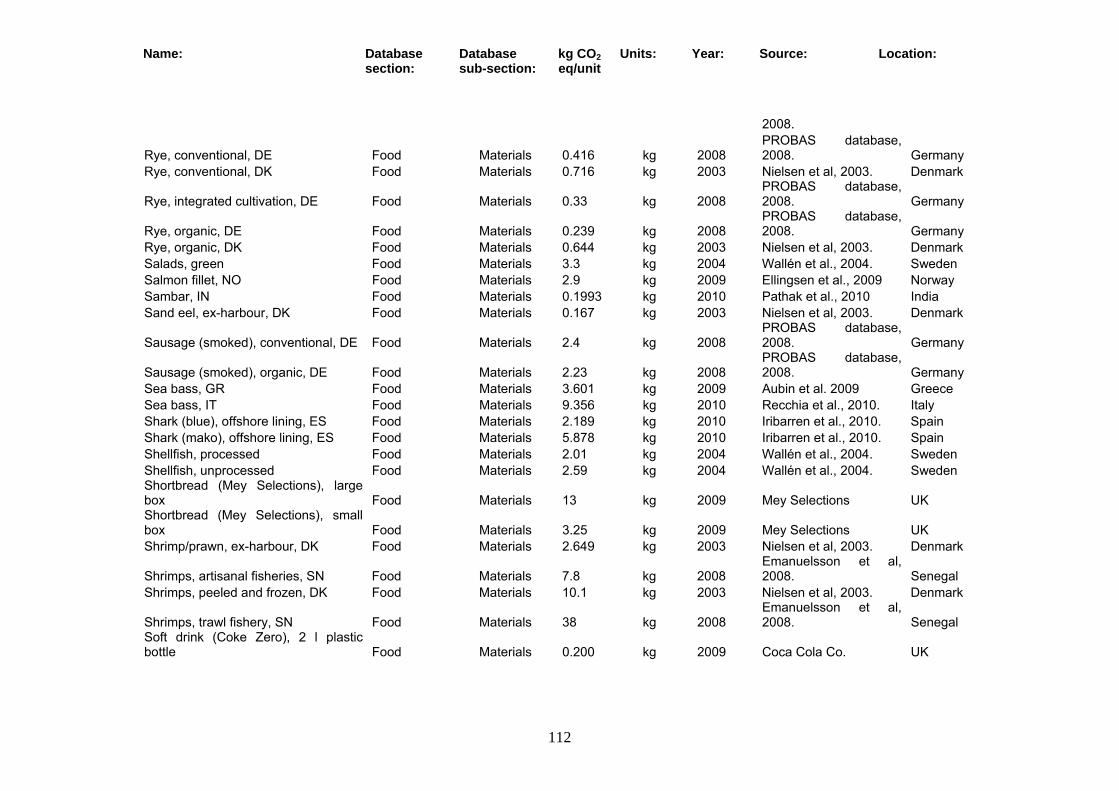
Name: Database section:
Database sub-section:
kg CO2 eq/unit
Units: Year: Source: Location:
112
2008.
Rye, conventional, DE Food Materials 0.416 kg 2008 PROBAS database, 2008. Germany
Rye, conventional, DK Food Materials 0.716 kg 2003 Nielsen et al, 2003. Denmark
Rye, integrated cultivation, DE Food Materials 0.33 kg 2008 PROBAS database, 2008. Germany
Rye, organic, DE Food Materials 0.239 kg 2008 PROBAS database, 2008. Germany
Rye, organic, DK Food Materials 0.644 kg 2003 Nielsen et al, 2003. Denmark Salads, green Food Materials 3.3 kg 2004 Wallén et al., 2004. Sweden Salmon fillet, NO Food Materials 2.9 kg 2009 Ellingsen et al., 2009 Norway Sambar, IN Food Materials 0.1993 kg 2010 Pathak et al., 2010 India Sand eel, ex-harbour, DK Food Materials 0.167 kg 2003 Nielsen et al, 2003. Denmark
Sausage (smoked), conventional, DE Food Materials 2.4 kg 2008 PROBAS database, 2008. Germany
Sausage (smoked), organic, DE Food Materials 2.23 kg 2008 PROBAS database, 2008. Germany
Sea bass, GR Food Materials 3.601 kg 2009 Aubin et al. 2009 Greece Sea bass, IT Food Materials 9.356 kg 2010 Recchia et al., 2010. Italy Shark (blue), offshore lining, ES Food Materials 2.189 kg 2010 Iribarren et al., 2010. Spain Shark (mako), offshore lining, ES Food Materials 5.878 kg 2010 Iribarren et al., 2010. Spain Shellfish, processed Food Materials 2.01 kg 2004 Wallén et al., 2004. Sweden Shellfish, unprocessed Food Materials 2.59 kg 2004 Wallén et al., 2004. Sweden Shortbread (Mey Selections), large box Food Materials 13 kg 2009 Mey Selections UK Shortbread (Mey Selections), small box Food Materials 3.25 kg 2009 Mey Selections UK Shrimp/prawn, ex-harbour, DK Food Materials 2.649 kg 2003 Nielsen et al, 2003. Denmark
Shrimps, artisanal fisheries, SN Food Materials 7.8 kg 2008 Emanuelsson et al, 2008. Senegal
Shrimps, peeled and frozen, DK Food Materials 10.1 kg 2003 Nielsen et al, 2003. Denmark
Shrimps, trawl fishery, SN Food Materials 38 kg 2008 Emanuelsson et al, 2008. Senegal
Soft drink (Coke Zero), 2 l plastic bottle Food Materials 0.200 kg 2009 Coca Cola Co. UK
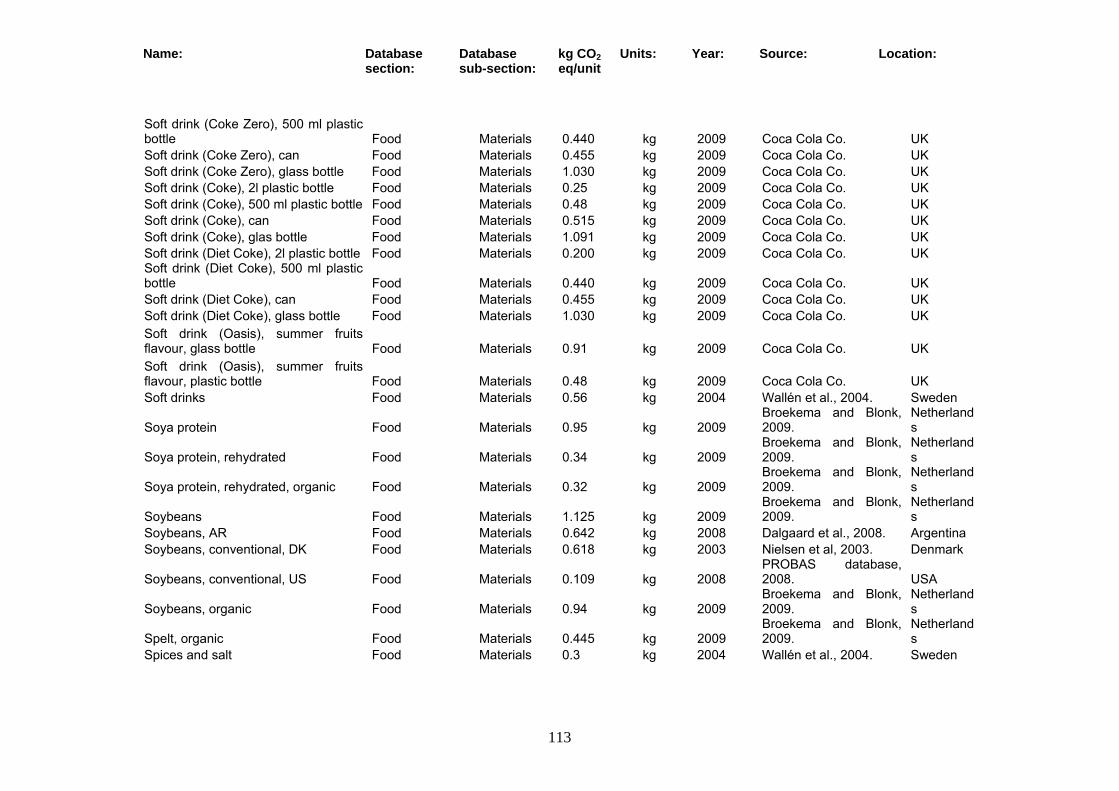
Name: Database section:
Database sub-section:
kg CO2 eq/unit
Units: Year: Source: Location:
113
Soft drink (Coke Zero), 500 ml plastic bottle Food Materials 0.440 kg 2009 Coca Cola Co. UK Soft drink (Coke Zero), can Food Materials 0.455 kg 2009 Coca Cola Co. UK Soft drink (Coke Zero), glass bottle Food Materials 1.030 kg 2009 Coca Cola Co. UK Soft drink (Coke), 2l plastic bottle Food Materials 0.25 kg 2009 Coca Cola Co. UK Soft drink (Coke), 500 ml plastic bottle Food Materials 0.48 kg 2009 Coca Cola Co. UK Soft drink (Coke), can Food Materials 0.515 kg 2009 Coca Cola Co. UK Soft drink (Coke), glas bottle Food Materials 1.091 kg 2009 Coca Cola Co. UK Soft drink (Diet Coke), 2l plastic bottle Food Materials 0.200 kg 2009 Coca Cola Co. UK Soft drink (Diet Coke), 500 ml plastic bottle Food Materials 0.440 kg 2009 Coca Cola Co. UK Soft drink (Diet Coke), can Food Materials 0.455 kg 2009 Coca Cola Co. UK Soft drink (Diet Coke), glass bottle Food Materials 1.030 kg 2009 Coca Cola Co. UK Soft drink (Oasis), summer fruits flavour, glass bottle Food Materials 0.91 kg 2009 Coca Cola Co. UK Soft drink (Oasis), summer fruits flavour, plastic bottle Food Materials 0.48 kg 2009 Coca Cola Co. UK Soft drinks Food Materials 0.56 kg 2004 Wallén et al., 2004. Sweden
Soya protein Food Materials 0.95 kg 2009 Broekema and Blonk, 2009.
Netherlands
Soya protein, rehydrated Food Materials 0.34 kg 2009 Broekema and Blonk, 2009.
Netherlands
Soya protein, rehydrated, organic Food Materials 0.32 kg 2009 Broekema and Blonk, 2009.
Netherlands
Soybeans Food Materials 1.125 kg 2009 Broekema and Blonk, 2009.
Netherlands
Soybeans, AR Food Materials 0.642 kg 2008 Dalgaard et al., 2008. Argentina Soybeans, conventional, DK Food Materials 0.618 kg 2003 Nielsen et al, 2003. Denmark
Soybeans, conventional, US Food Materials 0.109 kg 2008 PROBAS database, 2008. USA
Soybeans, organic Food Materials 0.94 kg 2009 Broekema and Blonk, 2009.
Netherlands
Spelt, organic Food Materials 0.445 kg 2009 Broekema and Blonk, 2009.
Netherlands
Spices and salt Food Materials 0.3 kg 2004 Wallén et al., 2004. Sweden
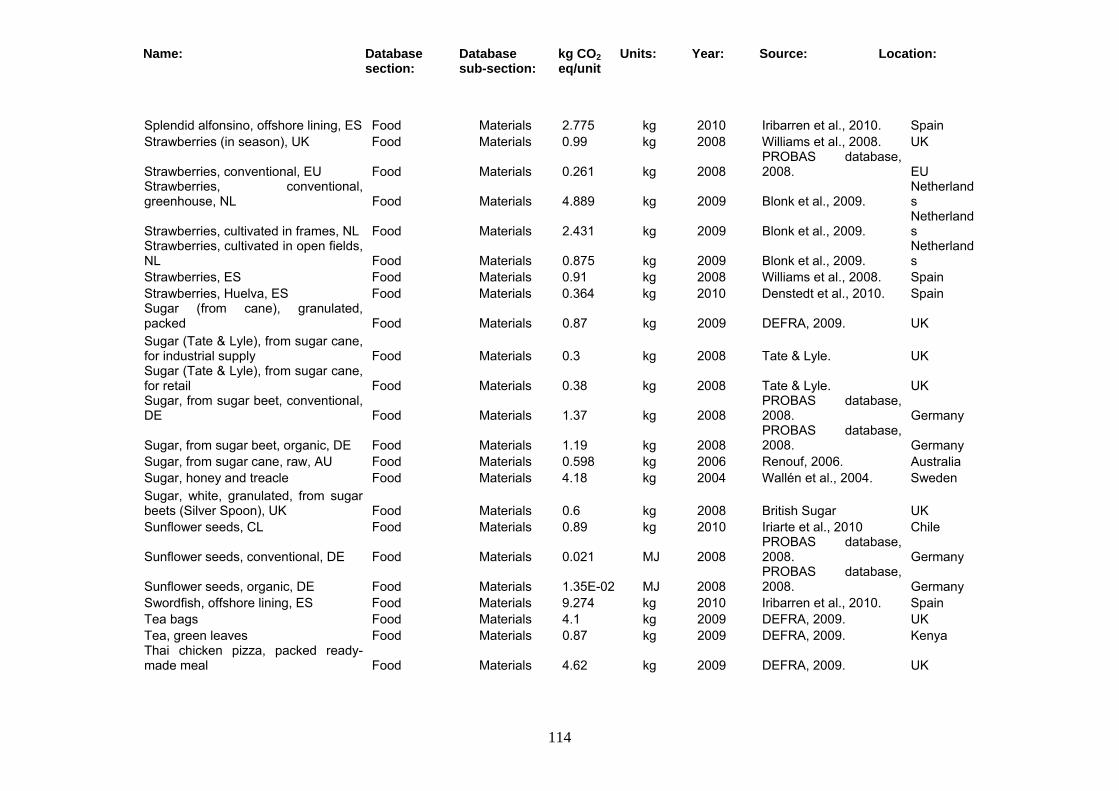
Name: Database section:
Database sub-section:
kg CO2 eq/unit
Units: Year: Source: Location:
114
Splendid alfonsino, offshore lining, ES Food Materials 2.775 kg 2010 Iribarren et al., 2010. Spain Strawberries (in season), UK Food Materials 0.99 kg 2008 Williams et al., 2008. UK
Strawberries, conventional, EU Food Materials 0.261 kg 2008 PROBAS database, 2008. EU
Strawberries, conventional, greenhouse, NL Food Materials 4.889 kg 2009 Blonk et al., 2009.
Netherlands
Strawberries, cultivated in frames, NL Food Materials 2.431 kg 2009 Blonk et al., 2009. Netherlands
Strawberries, cultivated in open fields, NL Food Materials 0.875 kg 2009 Blonk et al., 2009.
Netherlands
Strawberries, ES Food Materials 0.91 kg 2008 Williams et al., 2008. Spain Strawberries, Huelva, ES Food Materials 0.364 kg 2010 Denstedt et al., 2010. Spain Sugar (from cane), granulated, packed Food Materials 0.87 kg 2009 DEFRA, 2009. UK Sugar (Tate & Lyle), from sugar cane, for industrial supply Food Materials 0.3 kg 2008 Tate & Lyle. UK Sugar (Tate & Lyle), from sugar cane, for retail Food Materials 0.38 kg 2008 Tate & Lyle. UK Sugar, from sugar beet, conventional, DE Food Materials 1.37 kg 2008
PROBAS database, 2008. Germany
Sugar, from sugar beet, organic, DE Food Materials 1.19 kg 2008 PROBAS database, 2008. Germany
Sugar, from sugar cane, raw, AU Food Materials 0.598 kg 2006 Renouf, 2006. Australia Sugar, honey and treacle Food Materials 4.18 kg 2004 Wallén et al., 2004. Sweden Sugar, white, granulated, from sugar beets (Silver Spoon), UK Food Materials 0.6 kg 2008 British Sugar UK Sunflower seeds, CL Food Materials 0.89 kg 2010 Iriarte et al., 2010 Chile
Sunflower seeds, conventional, DE Food Materials 0.021 MJ 2008 PROBAS database, 2008. Germany
Sunflower seeds, organic, DE Food Materials 1.35E-02 MJ 2008 PROBAS database, 2008. Germany
Swordfish, offshore lining, ES Food Materials 9.274 kg 2010 Iribarren et al., 2010. Spain Tea bags Food Materials 4.1 kg 2009 DEFRA, 2009. UK Tea, green leaves Food Materials 0.87 kg 2009 DEFRA, 2009. Kenya Thai chicken pizza, packed ready-made meal Food Materials 4.62 kg 2009 DEFRA, 2009. UK
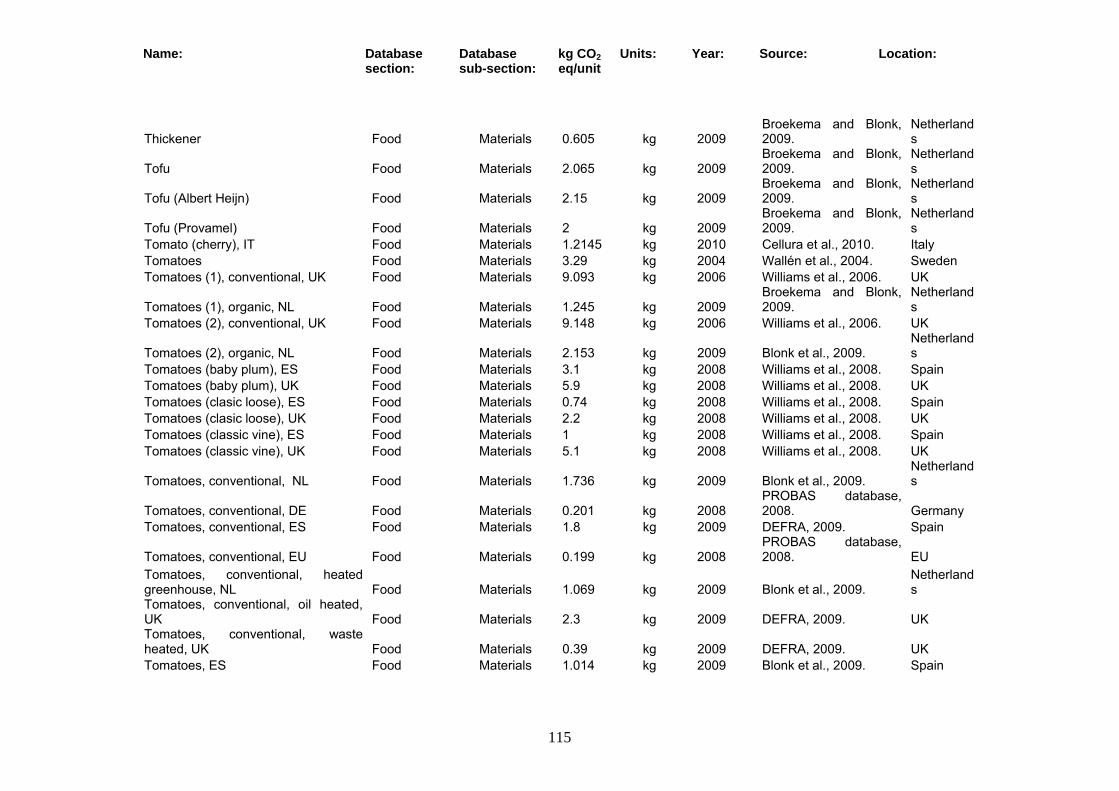
Name: Database section:
Database sub-section:
kg CO2 eq/unit
Units: Year: Source: Location:
115
Thickener Food Materials 0.605 kg 2009 Broekema and Blonk, 2009.
Netherlands
Tofu Food Materials 2.065 kg 2009 Broekema and Blonk, 2009.
Netherlands
Tofu (Albert Heijn) Food Materials 2.15 kg 2009 Broekema and Blonk, 2009.
Netherlands
Tofu (Provamel) Food Materials 2 kg 2009 Broekema and Blonk, 2009.
Netherlands
Tomato (cherry), IT Food Materials 1.2145 kg 2010 Cellura et al., 2010. Italy Tomatoes Food Materials 3.29 kg 2004 Wallén et al., 2004. Sweden Tomatoes (1), conventional, UK Food Materials 9.093 kg 2006 Williams et al., 2006. UK
Tomatoes (1), organic, NL Food Materials 1.245 kg 2009 Broekema and Blonk, 2009.
Netherlands
Tomatoes (2), conventional, UK Food Materials 9.148 kg 2006 Williams et al., 2006. UK
Tomatoes (2), organic, NL Food Materials 2.153 kg 2009 Blonk et al., 2009. Netherlands
Tomatoes (baby plum), ES Food Materials 3.1 kg 2008 Williams et al., 2008. Spain Tomatoes (baby plum), UK Food Materials 5.9 kg 2008 Williams et al., 2008. UK Tomatoes (clasic loose), ES Food Materials 0.74 kg 2008 Williams et al., 2008. Spain Tomatoes (clasic loose), UK Food Materials 2.2 kg 2008 Williams et al., 2008. UK Tomatoes (classic vine), ES Food Materials 1 kg 2008 Williams et al., 2008. Spain Tomatoes (classic vine), UK Food Materials 5.1 kg 2008 Williams et al., 2008. UK
Tomatoes, conventional, NL Food Materials 1.736 kg 2009 Blonk et al., 2009. Netherlands
Tomatoes, conventional, DE Food Materials 0.201 kg 2008 PROBAS database, 2008. Germany
Tomatoes, conventional, ES Food Materials 1.8 kg 2009 DEFRA, 2009. Spain
Tomatoes, conventional, EU Food Materials 0.199 kg 2008 PROBAS database, 2008. EU
Tomatoes, conventional, heated greenhouse, NL Food Materials 1.069 kg 2009 Blonk et al., 2009.
Netherlands
Tomatoes, conventional, oil heated, UK Food Materials 2.3 kg 2009 DEFRA, 2009. UK Tomatoes, conventional, waste heated, UK Food Materials 0.39 kg 2009 DEFRA, 2009. UK Tomatoes, ES Food Materials 1.014 kg 2009 Blonk et al., 2009. Spain
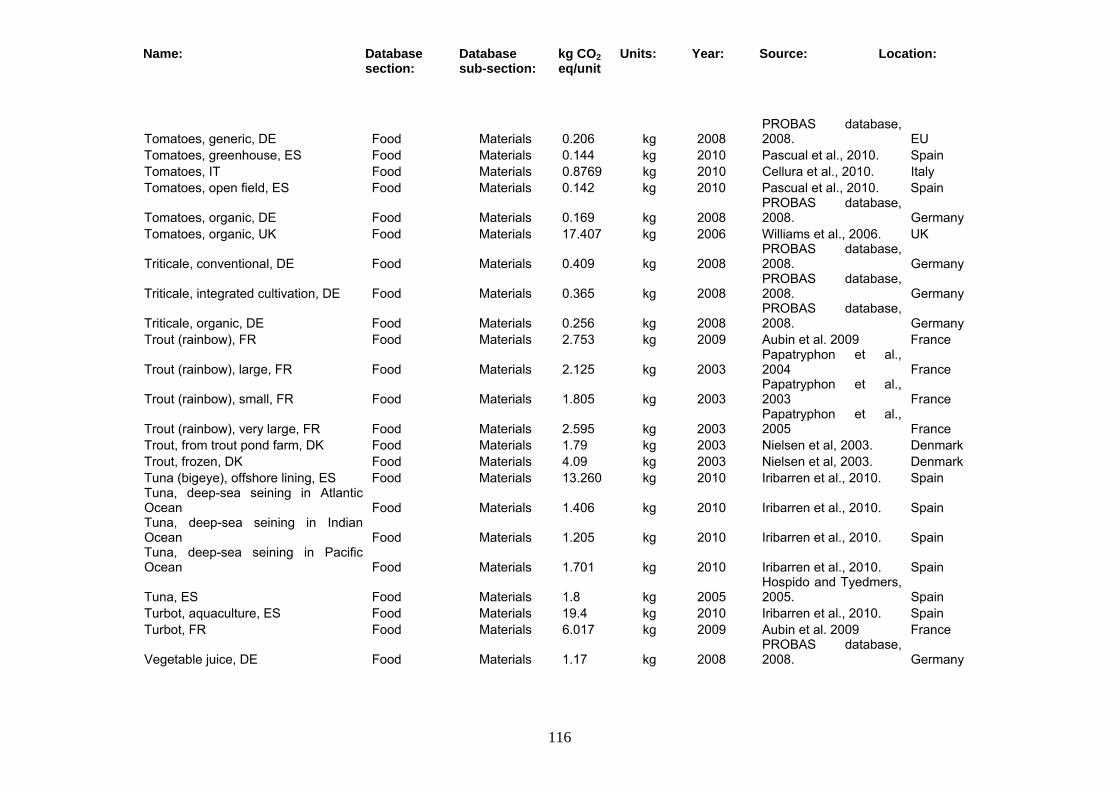
Name: Database section:
Database sub-section:
kg CO2 eq/unit
Units: Year: Source: Location:
116
Tomatoes, generic, DE Food Materials 0.206 kg 2008 PROBAS database, 2008. EU
Tomatoes, greenhouse, ES Food Materials 0.144 kg 2010 Pascual et al., 2010. Spain Tomatoes, IT Food Materials 0.8769 kg 2010 Cellura et al., 2010. Italy Tomatoes, open field, ES Food Materials 0.142 kg 2010 Pascual et al., 2010. Spain
Tomatoes, organic, DE Food Materials 0.169 kg 2008 PROBAS database, 2008. Germany
Tomatoes, organic, UK Food Materials 17.407 kg 2006 Williams et al., 2006. UK
Triticale, conventional, DE Food Materials 0.409 kg 2008 PROBAS database, 2008. Germany
Triticale, integrated cultivation, DE Food Materials 0.365 kg 2008 PROBAS database, 2008. Germany
Triticale, organic, DE Food Materials 0.256 kg 2008 PROBAS database, 2008. Germany
Trout (rainbow), FR Food Materials 2.753 kg 2009 Aubin et al. 2009 France
Trout (rainbow), large, FR Food Materials 2.125 kg 2003 Papatryphon et al., 2004 France
Trout (rainbow), small, FR Food Materials 1.805 kg 2003 Papatryphon et al., 2003 France
Trout (rainbow), very large, FR Food Materials 2.595 kg 2003 Papatryphon et al., 2005 France
Trout, from trout pond farm, DK Food Materials 1.79 kg 2003 Nielsen et al, 2003. Denmark Trout, frozen, DK Food Materials 4.09 kg 2003 Nielsen et al, 2003. Denmark Tuna (bigeye), offshore lining, ES Food Materials 13.260 kg 2010 Iribarren et al., 2010. Spain Tuna, deep-sea seining in Atlantic Ocean Food Materials 1.406 kg 2010 Iribarren et al., 2010. Spain Tuna, deep-sea seining in Indian Ocean Food Materials 1.205 kg 2010 Iribarren et al., 2010. Spain Tuna, deep-sea seining in Pacific Ocean Food Materials 1.701 kg 2010 Iribarren et al., 2010. Spain
Tuna, ES Food Materials 1.8 kg 2005 Hospido and Tyedmers, 2005. Spain
Turbot, aquaculture, ES Food Materials 19.4 kg 2010 Iribarren et al., 2010. Spain Turbot, FR Food Materials 6.017 kg 2009 Aubin et al. 2009 France
Vegetable juice, DE Food Materials 1.17 kg 2008 PROBAS database, 2008. Germany
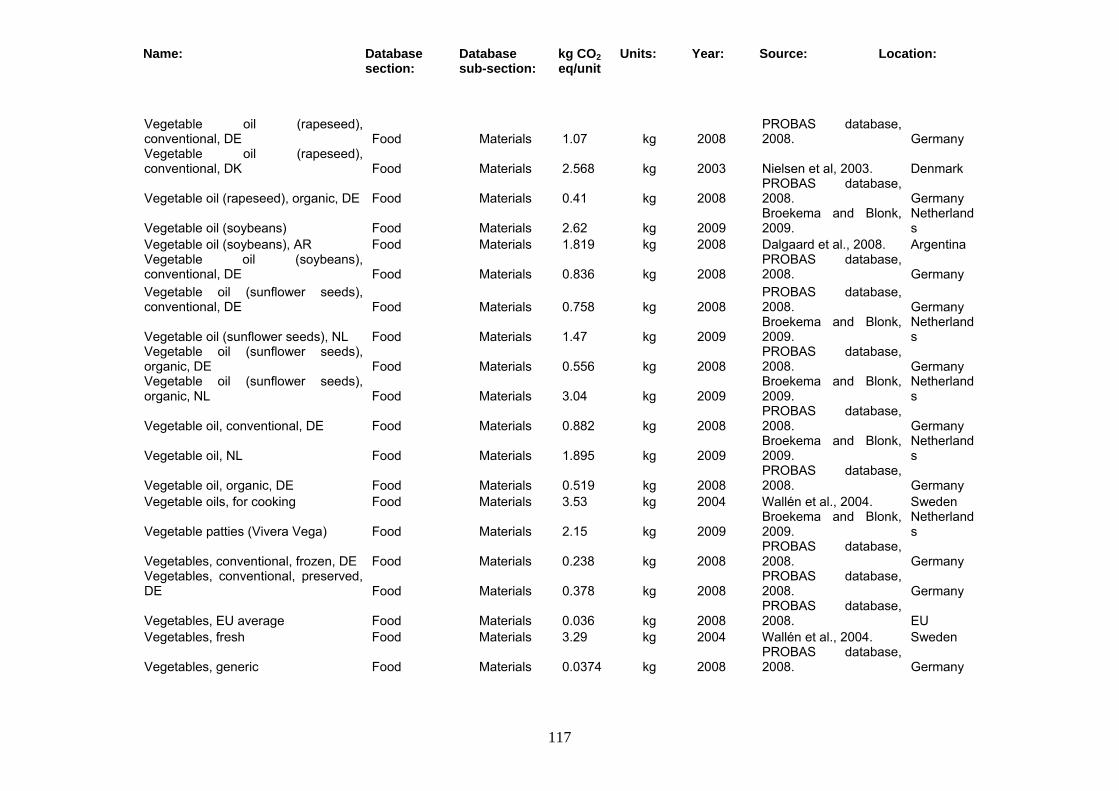
Name: Database section:
Database sub-section:
kg CO2 eq/unit
Units: Year: Source: Location:
117
Vegetable oil (rapeseed), conventional, DE Food Materials 1.07 kg 2008
PROBAS database, 2008. Germany
Vegetable oil (rapeseed), conventional, DK Food Materials 2.568 kg 2003 Nielsen et al, 2003. Denmark
Vegetable oil (rapeseed), organic, DE Food Materials 0.41 kg 2008 PROBAS database, 2008. Germany
Vegetable oil (soybeans) Food Materials 2.62 kg 2009 Broekema and Blonk, 2009.
Netherlands
Vegetable oil (soybeans), AR Food Materials 1.819 kg 2008 Dalgaard et al., 2008. Argentina Vegetable oil (soybeans), conventional, DE Food Materials 0.836 kg 2008
PROBAS database, 2008. Germany
Vegetable oil (sunflower seeds), conventional, DE Food Materials 0.758 kg 2008
PROBAS database, 2008. Germany
Vegetable oil (sunflower seeds), NL Food Materials 1.47 kg 2009 Broekema and Blonk, 2009.
Netherlands
Vegetable oil (sunflower seeds), organic, DE Food Materials 0.556 kg 2008
PROBAS database, 2008. Germany
Vegetable oil (sunflower seeds), organic, NL Food Materials 3.04 kg 2009
Broekema and Blonk, 2009.
Netherlands
Vegetable oil, conventional, DE Food Materials 0.882 kg 2008 PROBAS database, 2008. Germany
Vegetable oil, NL Food Materials 1.895 kg 2009 Broekema and Blonk, 2009.
Netherlands
Vegetable oil, organic, DE Food Materials 0.519 kg 2008 PROBAS database, 2008. Germany
Vegetable oils, for cooking Food Materials 3.53 kg 2004 Wallén et al., 2004. Sweden
Vegetable patties (Vivera Vega) Food Materials 2.15 kg 2009 Broekema and Blonk, 2009.
Netherlands
Vegetables, conventional, frozen, DE Food Materials 0.238 kg 2008 PROBAS database, 2008. Germany
Vegetables, conventional, preserved, DE Food Materials 0.378 kg 2008
PROBAS database, 2008. Germany
Vegetables, EU average Food Materials 0.036 kg 2008 PROBAS database, 2008. EU
Vegetables, fresh Food Materials 3.29 kg 2004 Wallén et al., 2004. Sweden
Vegetables, generic Food Materials 0.0374 kg 2008 PROBAS database, 2008. Germany
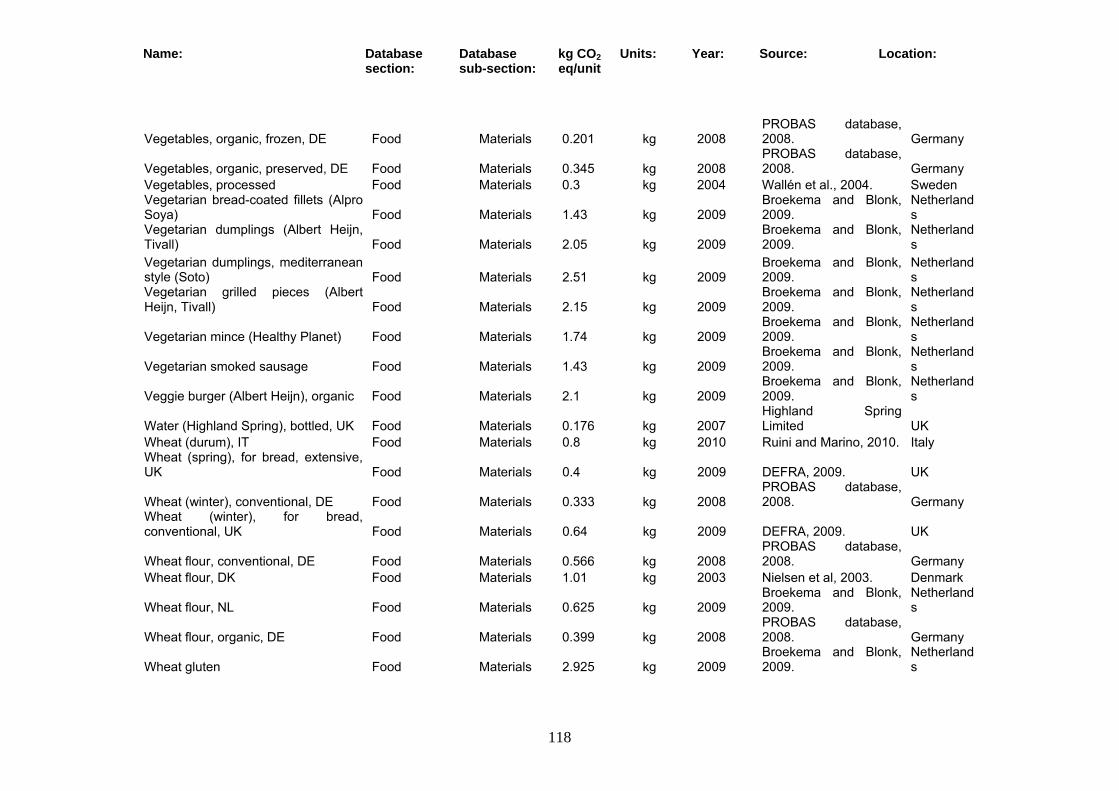
Name: Database section:
Database sub-section:
kg CO2 eq/unit
Units: Year: Source: Location:
118
Vegetables, organic, frozen, DE Food Materials 0.201 kg 2008 PROBAS database, 2008. Germany
Vegetables, organic, preserved, DE Food Materials 0.345 kg 2008 PROBAS database, 2008. Germany
Vegetables, processed Food Materials 0.3 kg 2004 Wallén et al., 2004. Sweden Vegetarian bread-coated fillets (Alpro Soya) Food Materials 1.43 kg 2009
Broekema and Blonk, 2009.
Netherlands
Vegetarian dumplings (Albert Heijn, Tivall) Food Materials 2.05 kg 2009
Broekema and Blonk, 2009.
Netherlands
Vegetarian dumplings, mediterranean style (Soto) Food Materials 2.51 kg 2009
Broekema and Blonk, 2009.
Netherlands
Vegetarian grilled pieces (Albert Heijn, Tivall) Food Materials 2.15 kg 2009
Broekema and Blonk, 2009.
Netherlands
Vegetarian mince (Healthy Planet) Food Materials 1.74 kg 2009 Broekema and Blonk, 2009.
Netherlands
Vegetarian smoked sausage Food Materials 1.43 kg 2009 Broekema and Blonk, 2009.
Netherlands
Veggie burger (Albert Heijn), organic Food Materials 2.1 kg 2009 Broekema and Blonk, 2009.
Netherlands
Water (Highland Spring), bottled, UK Food Materials 0.176 kg 2007 Highland Spring Limited UK
Wheat (durum), IT Food Materials 0.8 kg 2010 Ruini and Marino, 2010. Italy Wheat (spring), for bread, extensive, UK Food Materials 0.4 kg 2009 DEFRA, 2009. UK
Wheat (winter), conventional, DE Food Materials 0.333 kg 2008 PROBAS database, 2008. Germany
Wheat (winter), for bread, conventional, UK Food Materials 0.64 kg 2009 DEFRA, 2009. UK
Wheat flour, conventional, DE Food Materials 0.566 kg 2008 PROBAS database, 2008. Germany
Wheat flour, DK Food Materials 1.01 kg 2003 Nielsen et al, 2003. Denmark
Wheat flour, NL Food Materials 0.625 kg 2009 Broekema and Blonk, 2009.
Netherlands
Wheat flour, organic, DE Food Materials 0.399 kg 2008 PROBAS database, 2008. Germany
Wheat gluten Food Materials 2.925 kg 2009 Broekema and Blonk, 2009.
Netherlands
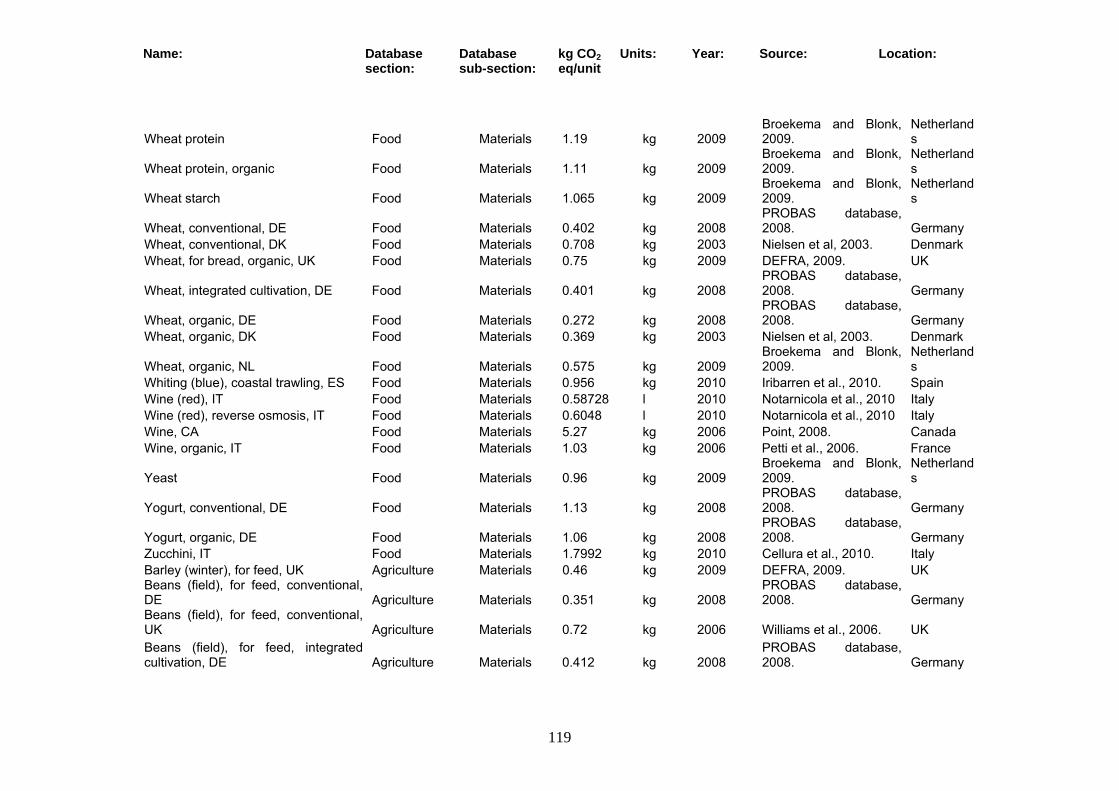
Name: Database section:
Database sub-section:
kg CO2 eq/unit
Units: Year: Source: Location:
119
Wheat protein Food Materials 1.19 kg 2009 Broekema and Blonk, 2009.
Netherlands
Wheat protein, organic Food Materials 1.11 kg 2009 Broekema and Blonk, 2009.
Netherlands
Wheat starch Food Materials 1.065 kg 2009 Broekema and Blonk, 2009.
Netherlands
Wheat, conventional, DE Food Materials 0.402 kg 2008 PROBAS database, 2008. Germany
Wheat, conventional, DK Food Materials 0.708 kg 2003 Nielsen et al, 2003. Denmark Wheat, for bread, organic, UK Food Materials 0.75 kg 2009 DEFRA, 2009. UK
Wheat, integrated cultivation, DE Food Materials 0.401 kg 2008 PROBAS database, 2008. Germany
Wheat, organic, DE Food Materials 0.272 kg 2008 PROBAS database, 2008. Germany
Wheat, organic, DK Food Materials 0.369 kg 2003 Nielsen et al, 2003. Denmark
Wheat, organic, NL Food Materials 0.575 kg 2009 Broekema and Blonk, 2009.
Netherlands
Whiting (blue), coastal trawling, ES Food Materials 0.956 kg 2010 Iribarren et al., 2010. Spain Wine (red), IT Food Materials 0.58728 l 2010 Notarnicola et al., 2010 Italy Wine (red), reverse osmosis, IT Food Materials 0.6048 l 2010 Notarnicola et al., 2010 Italy Wine, CA Food Materials 5.27 kg 2006 Point, 2008. Canada Wine, organic, IT Food Materials 1.03 kg 2006 Petti et al., 2006. France
Yeast Food Materials 0.96 kg 2009 Broekema and Blonk, 2009.
Netherlands
Yogurt, conventional, DE Food Materials 1.13 kg 2008 PROBAS database, 2008. Germany
Yogurt, organic, DE Food Materials 1.06 kg 2008 PROBAS database, 2008. Germany
Zucchini, IT Food Materials 1.7992 kg 2010 Cellura et al., 2010. Italy Barley (winter), for feed, UK Agriculture Materials 0.46 kg 2009 DEFRA, 2009. UK Beans (field), for feed, conventional, DE Agriculture Materials 0.351 kg 2008
PROBAS database, 2008. Germany
Beans (field), for feed, conventional, UK Agriculture Materials 0.72 kg 2006 Williams et al., 2006. UK Beans (field), for feed, integrated cultivation, DE Agriculture Materials 0.412 kg 2008
PROBAS database, 2008. Germany
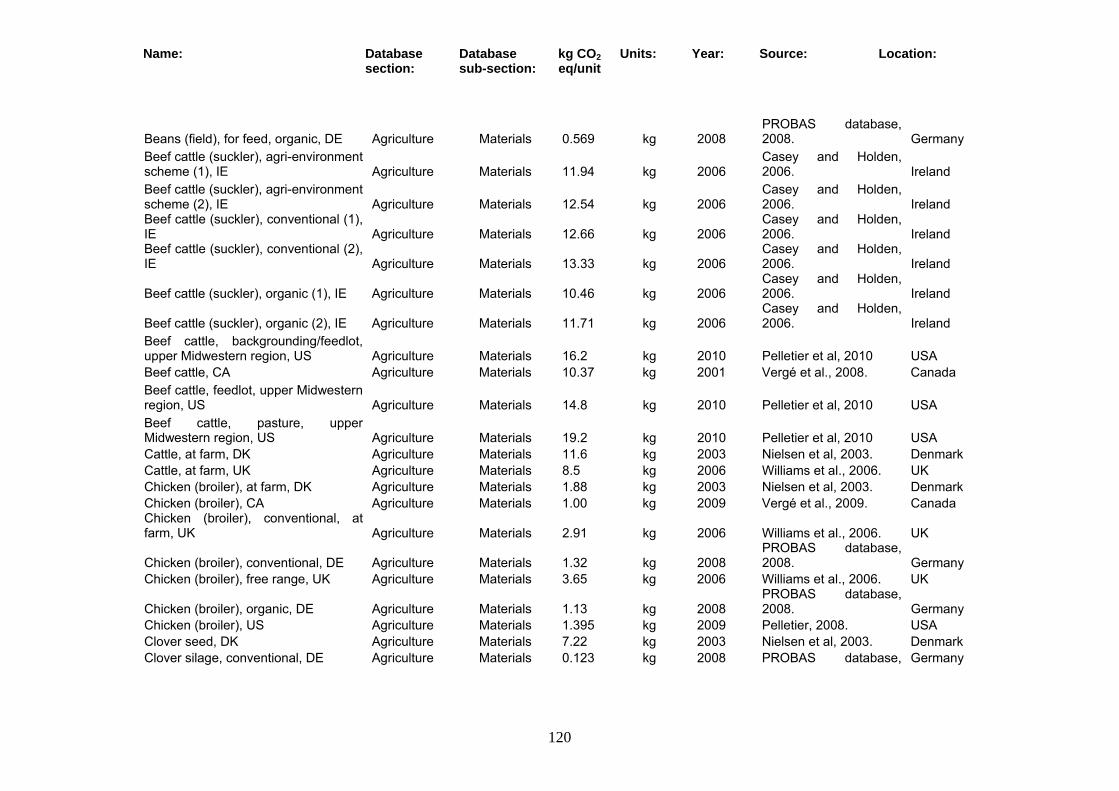
Name: Database section:
Database sub-section:
kg CO2 eq/unit
Units: Year: Source: Location:
120
Beans (field), for feed, organic, DE Agriculture Materials 0.569 kg 2008 PROBAS database, 2008. Germany
Beef cattle (suckler), agri-environment scheme (1), IE Agriculture Materials 11.94 kg 2006
Casey and Holden, 2006. Ireland
Beef cattle (suckler), agri-environment scheme (2), IE Agriculture Materials 12.54 kg 2006
Casey and Holden, 2006. Ireland
Beef cattle (suckler), conventional (1), IE Agriculture Materials 12.66 kg 2006
Casey and Holden, 2006. Ireland
Beef cattle (suckler), conventional (2), IE Agriculture Materials 13.33 kg 2006
Casey and Holden, 2006. Ireland
Beef cattle (suckler), organic (1), IE Agriculture Materials 10.46 kg 2006 Casey and Holden, 2006. Ireland
Beef cattle (suckler), organic (2), IE Agriculture Materials 11.71 kg 2006 Casey and Holden, 2006. Ireland
Beef cattle, backgrounding/feedlot, upper Midwestern region, US Agriculture Materials 16.2 kg 2010 Pelletier et al, 2010 USA Beef cattle, CA Agriculture Materials 10.37 kg 2001 Vergé et al., 2008. Canada Beef cattle, feedlot, upper Midwestern region, US Agriculture Materials 14.8 kg 2010 Pelletier et al, 2010 USA Beef cattle, pasture, upper Midwestern region, US Agriculture Materials 19.2 kg 2010 Pelletier et al, 2010 USA Cattle, at farm, DK Agriculture Materials 11.6 kg 2003 Nielsen et al, 2003. Denmark Cattle, at farm, UK Agriculture Materials 8.5 kg 2006 Williams et al., 2006. UK Chicken (broiler), at farm, DK Agriculture Materials 1.88 kg 2003 Nielsen et al, 2003. Denmark Chicken (broiler), CA Agriculture Materials 1.00 kg 2009 Vergé et al., 2009. Canada Chicken (broiler), conventional, at farm, UK Agriculture Materials 2.91 kg 2006 Williams et al., 2006. UK
Chicken (broiler), conventional, DE Agriculture Materials 1.32 kg 2008 PROBAS database, 2008. Germany
Chicken (broiler), free range, UK Agriculture Materials 3.65 kg 2006 Williams et al., 2006. UK
Chicken (broiler), organic, DE Agriculture Materials 1.13 kg 2008 PROBAS database, 2008. Germany
Chicken (broiler), US Agriculture Materials 1.395 kg 2009 Pelletier, 2008. USA Clover seed, DK Agriculture Materials 7.22 kg 2003 Nielsen et al, 2003. Denmark Clover silage, conventional, DE Agriculture Materials 0.123 kg 2008 PROBAS database, Germany
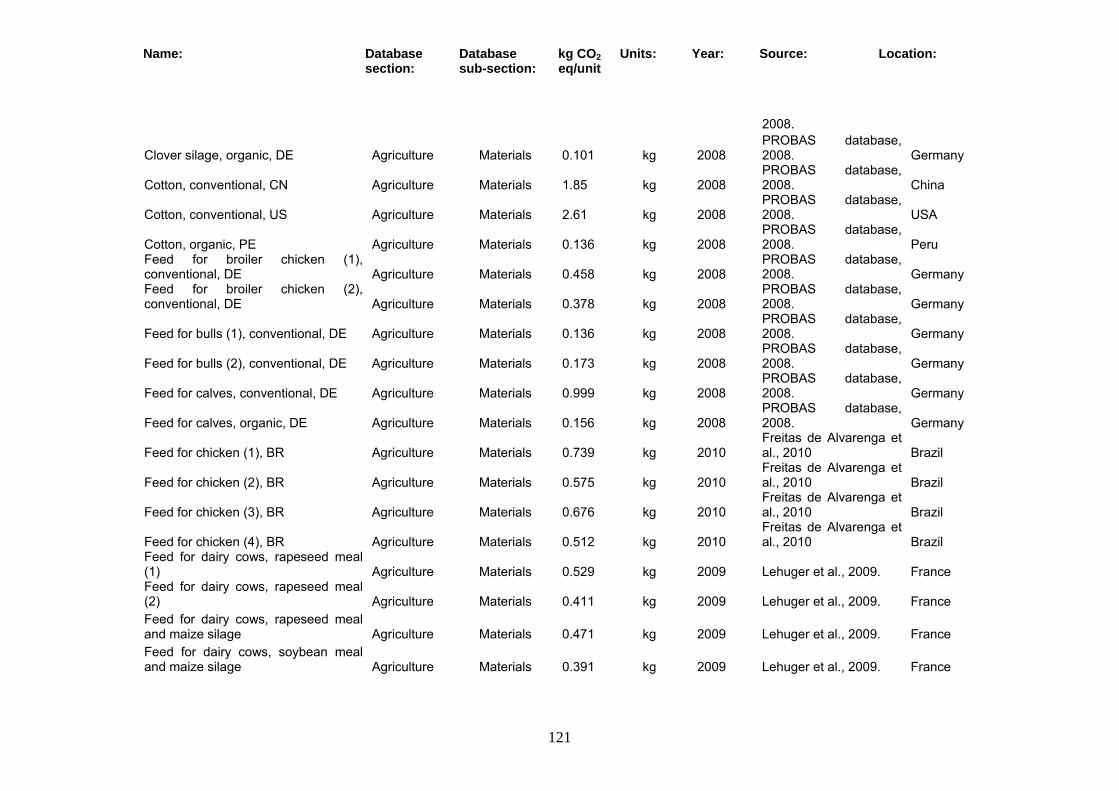
Name: Database section:
Database sub-section:
kg CO2 eq/unit
Units: Year: Source: Location:
121
2008.
Clover silage, organic, DE Agriculture Materials 0.101 kg 2008 PROBAS database, 2008. Germany
Cotton, conventional, CN Agriculture Materials 1.85 kg 2008 PROBAS database, 2008. China
Cotton, conventional, US Agriculture Materials 2.61 kg 2008 PROBAS database, 2008. USA
Cotton, organic, PE Agriculture Materials 0.136 kg 2008 PROBAS database, 2008. Peru
Feed for broiler chicken (1), conventional, DE Agriculture Materials 0.458 kg 2008
PROBAS database, 2008. Germany
Feed for broiler chicken (2), conventional, DE Agriculture Materials 0.378 kg 2008
PROBAS database, 2008. Germany
Feed for bulls (1), conventional, DE Agriculture Materials 0.136 kg 2008 PROBAS database, 2008. Germany
Feed for bulls (2), conventional, DE Agriculture Materials 0.173 kg 2008 PROBAS database, 2008. Germany
Feed for calves, conventional, DE Agriculture Materials 0.999 kg 2008 PROBAS database, 2008. Germany
Feed for calves, organic, DE Agriculture Materials 0.156 kg 2008 PROBAS database, 2008. Germany
Feed for chicken (1), BR Agriculture Materials 0.739 kg 2010 Freitas de Alvarenga et al., 2010 Brazil
Feed for chicken (2), BR Agriculture Materials 0.575 kg 2010 Freitas de Alvarenga et al., 2010 Brazil
Feed for chicken (3), BR Agriculture Materials 0.676 kg 2010 Freitas de Alvarenga et al., 2010 Brazil
Feed for chicken (4), BR Agriculture Materials 0.512 kg 2010 Freitas de Alvarenga et al., 2010 Brazil
Feed for dairy cows, rapeseed meal (1) Agriculture Materials 0.529 kg 2009 Lehuger et al., 2009. France Feed for dairy cows, rapeseed meal (2) Agriculture Materials 0.411 kg 2009 Lehuger et al., 2009. France Feed for dairy cows, rapeseed meal and maize silage Agriculture Materials 0.471 kg 2009 Lehuger et al., 2009. France Feed for dairy cows, soybean meal and maize silage Agriculture Materials 0.391 kg 2009 Lehuger et al., 2009. France

Name: Database section:
Database sub-section:
kg CO2 eq/unit
Units: Year: Source: Location:
122
Feed for oxen, organic, DE Agriculture Materials 0.0995 kg 2008 PROBAS database, 2008. Germany
Feed for piglets, conventional, DE Agriculture Materials 0.382 kg 2008 PROBAS database, 2008. Germany
Feed for piglets, organic, DE Agriculture Materials 0.286 kg 2008 PROBAS database, 2008. Germany
Feed for pigs (1), conventional, DE Agriculture Materials 0.491 kg 2009 Kool et al., 2009. Germany Feed for pigs (1), organic, DE Agriculture Materials 0.388 kg 2009 Kool et al., 2009. Germany
Feed for pigs (2), conventional, DE Agriculture Materials 0.401 kg 2008 PROBAS database, 2008. Germany
Feed for pigs (2), organic, DE Agriculture Materials 0.319 kg 2008 PROBAS database, 2008. Germany
Feed for pigs, conventional, DK Agriculture Materials 0.521 kg 2009 Kool et al., 2009. Denmark
Feed for pigs, conventional, NL Agriculture Materials 0.505 kg 2009 Kool et al., 2009. Netherlands
Feed for pigs, conventional, UK Agriculture Materials 0.52 kg 2009 Kool et al., 2009. UK Feed for pigs, integrated agricultural practices, DE Agriculture Materials 0.436 kg 2008
PROBAS database, 2008. Germany
Feed for pigs, organic, DK Agriculture Materials 0.413 kg 2009 Kool et al., 2009. Denmark
Feed for pigs, organic, NL Agriculture Materials 0.465 kg 2009 Kool et al., 2009. Netherlands
Feed for pigs, organic, UK Agriculture Materials 0.412 kg 2009 Kool et al., 2009. UK
Feed for sows, conventional, DE Agriculture Materials 0.391 kg 2008 PROBAS database, 2008. Germany
Feed for sows, organic, DE Agriculture Materials 0.263 kg 2008 PROBAS database, 2008. Germany
Feed for young cattle, organic, DE Agriculture Materials 0.0859 kg 2008 PROBAS database, 2008. Germany
Forage, extensive, DE Agriculture Materials 0.0833 kg 2008 PROBAS database, 2008. Germany
Grass (permanent), extensive, UK Agriculture Materials 0.16 kg 2009 DEFRA (2009) UK
Grass (permanent), NZ Agriculture Materials 0.03 kg 2009 DEFRA (2009) New Zealand
Grass (permanent), organic, UK Agriculture Materials 0.067 kg 2009 DEFRA (2009) UK Grass seed, DK Agriculture Materials 2.66 kg 2003 Nielsen et al, 2003. Denmark Grass silage, 10-year ley, extensive, Agriculture Materials 0.25 kg 2009 DEFRA (2009) UK
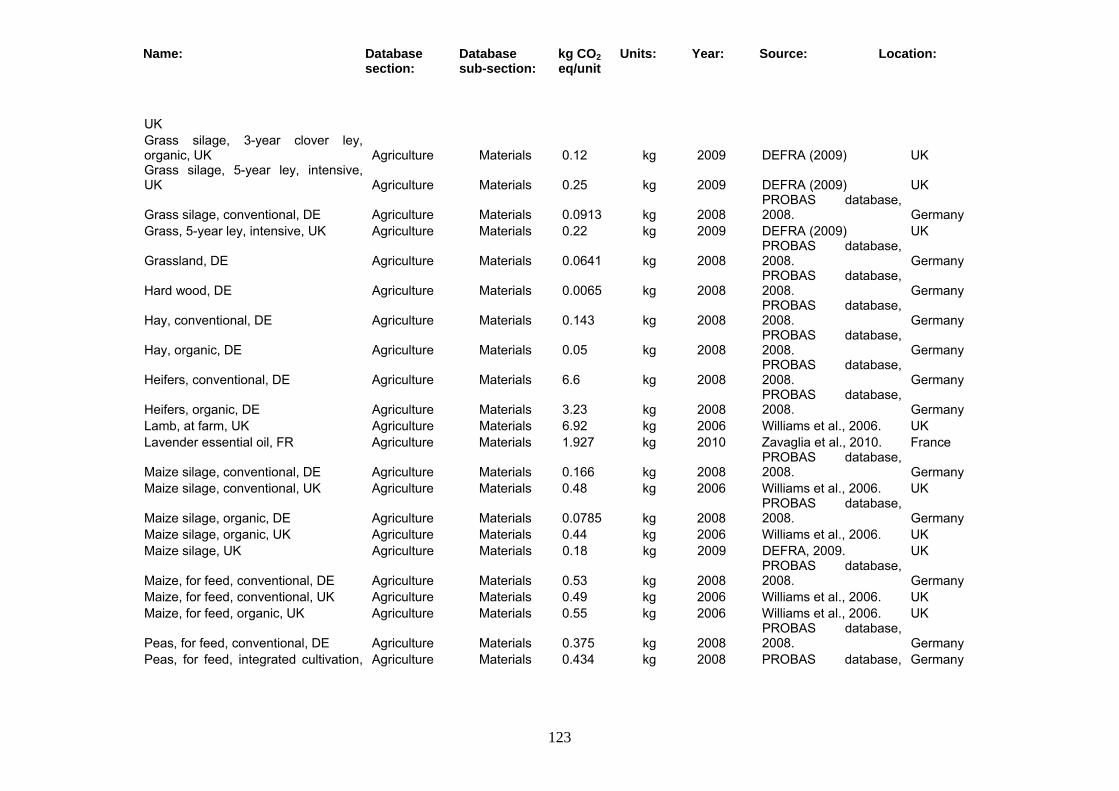
Name: Database section:
Database sub-section:
kg CO2 eq/unit
Units: Year: Source: Location:
123
UK Grass silage, 3-year clover ley, organic, UK Agriculture Materials 0.12 kg 2009 DEFRA (2009) UK Grass silage, 5-year ley, intensive, UK Agriculture Materials 0.25 kg 2009 DEFRA (2009) UK
Grass silage, conventional, DE Agriculture Materials 0.0913 kg 2008 PROBAS database, 2008. Germany
Grass, 5-year ley, intensive, UK Agriculture Materials 0.22 kg 2009 DEFRA (2009) UK
Grassland, DE Agriculture Materials 0.0641 kg 2008 PROBAS database, 2008. Germany
Hard wood, DE Agriculture Materials 0.0065 kg 2008 PROBAS database, 2008. Germany
Hay, conventional, DE Agriculture Materials 0.143 kg 2008 PROBAS database, 2008. Germany
Hay, organic, DE Agriculture Materials 0.05 kg 2008 PROBAS database, 2008. Germany
Heifers, conventional, DE Agriculture Materials 6.6 kg 2008 PROBAS database, 2008. Germany
Heifers, organic, DE Agriculture Materials 3.23 kg 2008 PROBAS database, 2008. Germany
Lamb, at farm, UK Agriculture Materials 6.92 kg 2006 Williams et al., 2006. UK Lavender essential oil, FR Agriculture Materials 1.927 kg 2010 Zavaglia et al., 2010. France
Maize silage, conventional, DE Agriculture Materials 0.166 kg 2008 PROBAS database, 2008. Germany
Maize silage, conventional, UK Agriculture Materials 0.48 kg 2006 Williams et al., 2006. UK
Maize silage, organic, DE Agriculture Materials 0.0785 kg 2008 PROBAS database, 2008. Germany
Maize silage, organic, UK Agriculture Materials 0.44 kg 2006 Williams et al., 2006. UK Maize silage, UK Agriculture Materials 0.18 kg 2009 DEFRA, 2009. UK
Maize, for feed, conventional, DE Agriculture Materials 0.53 kg 2008 PROBAS database, 2008. Germany
Maize, for feed, conventional, UK Agriculture Materials 0.49 kg 2006 Williams et al., 2006. UK Maize, for feed, organic, UK Agriculture Materials 0.55 kg 2006 Williams et al., 2006. UK
Peas, for feed, conventional, DE Agriculture Materials 0.375 kg 2008 PROBAS database, 2008. Germany
Peas, for feed, integrated cultivation, Agriculture Materials 0.434 kg 2008 PROBAS database, Germany
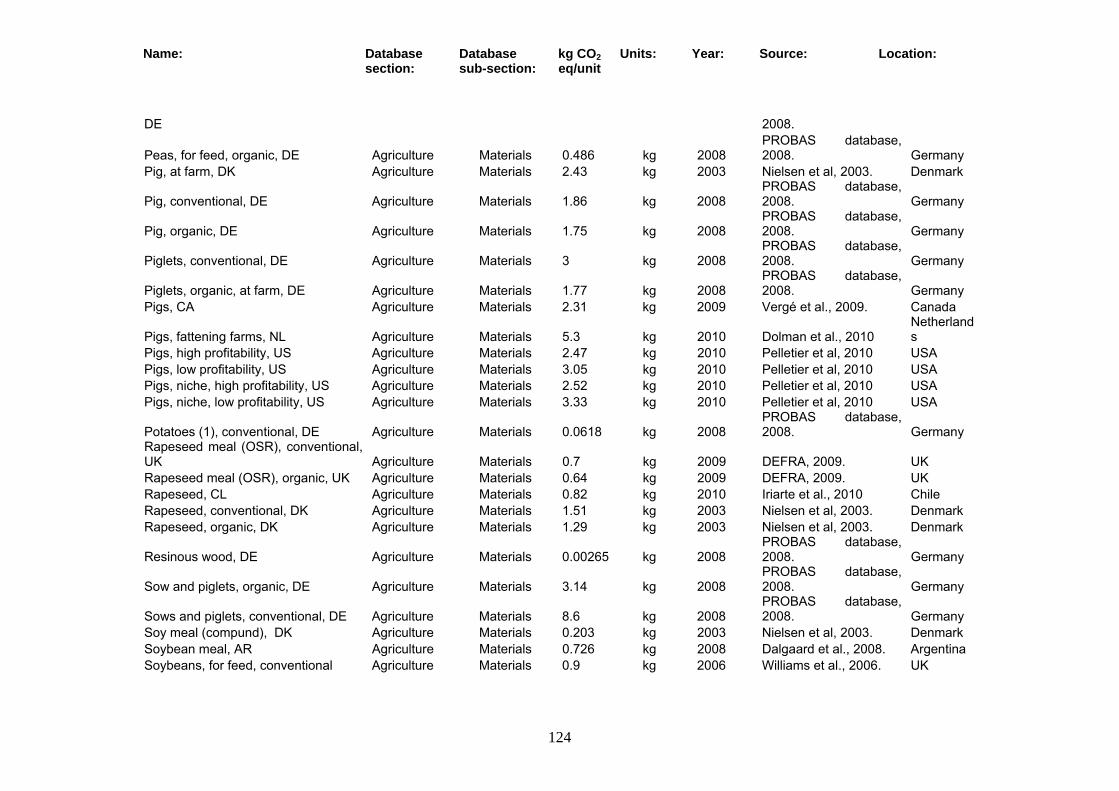
Name: Database section:
Database sub-section:
kg CO2 eq/unit
Units: Year: Source: Location:
124
DE 2008.
Peas, for feed, organic, DE Agriculture Materials 0.486 kg 2008 PROBAS database, 2008. Germany
Pig, at farm, DK Agriculture Materials 2.43 kg 2003 Nielsen et al, 2003. Denmark
Pig, conventional, DE Agriculture Materials 1.86 kg 2008 PROBAS database, 2008. Germany
Pig, organic, DE Agriculture Materials 1.75 kg 2008 PROBAS database, 2008. Germany
Piglets, conventional, DE Agriculture Materials 3 kg 2008 PROBAS database, 2008. Germany
Piglets, organic, at farm, DE Agriculture Materials 1.77 kg 2008 PROBAS database, 2008. Germany
Pigs, CA Agriculture Materials 2.31 kg 2009 Vergé et al., 2009. Canada
Pigs, fattening farms, NL Agriculture Materials 5.3 kg 2010 Dolman et al., 2010 Netherlands
Pigs, high profitability, US Agriculture Materials 2.47 kg 2010 Pelletier et al, 2010 USA Pigs, low profitability, US Agriculture Materials 3.05 kg 2010 Pelletier et al, 2010 USA Pigs, niche, high profitability, US Agriculture Materials 2.52 kg 2010 Pelletier et al, 2010 USA Pigs, niche, low profitability, US Agriculture Materials 3.33 kg 2010 Pelletier et al, 2010 USA
Potatoes (1), conventional, DE Agriculture Materials 0.0618 kg 2008 PROBAS database, 2008. Germany
Rapeseed meal (OSR), conventional, UK Agriculture Materials 0.7 kg 2009 DEFRA, 2009. UK Rapeseed meal (OSR), organic, UK Agriculture Materials 0.64 kg 2009 DEFRA, 2009. UK Rapeseed, CL Agriculture Materials 0.82 kg 2010 Iriarte et al., 2010 Chile Rapeseed, conventional, DK Agriculture Materials 1.51 kg 2003 Nielsen et al, 2003. Denmark Rapeseed, organic, DK Agriculture Materials 1.29 kg 2003 Nielsen et al, 2003. Denmark
Resinous wood, DE Agriculture Materials 0.00265 kg 2008 PROBAS database, 2008. Germany
Sow and piglets, organic, DE Agriculture Materials 3.14 kg 2008 PROBAS database, 2008. Germany
Sows and piglets, conventional, DE Agriculture Materials 8.6 kg 2008 PROBAS database, 2008. Germany
Soy meal (compund), DK Agriculture Materials 0.203 kg 2003 Nielsen et al, 2003. Denmark Soybean meal, AR Agriculture Materials 0.726 kg 2008 Dalgaard et al., 2008. Argentina Soybeans, for feed, conventional Agriculture Materials 0.9 kg 2006 Williams et al., 2006. UK

Name: Database section:
Database sub-section:
kg CO2 eq/unit
Units: Year: Source: Location:
125
Soybeans, for feed, organic Agriculture Materials 1.03 kg 2006 Williams et al., 2006. UK Sugar beet, DK Agriculture Materials 0.0575 kg 2003 Nielsen et al, 2003. Denmark
Sugar beet, organic, DE Agriculture Materials 0.0196 kg 2008 PROBAS database, 2008. Germany
Sugar cane, BR Agriculture Materials 0.0459 kg 2008 PROBAS database, 2008. Brazil
Sugar cane. ZM Agriculture Materials 0.05 kg 2009 DEFRA, 2009. Zambia Turkey, CA Agriculture Materials 1.44 kg 2009 Vergé et al., 2009. Canada Turnips (stubble), organic, UK Agriculture Materials 0.0043 kg 2009 DEFRA, 2009. UK Wheat (spring), for feed, extensive, UK Agriculture Materials 0.39 kg 2009 DEFRA, 2009. UK Wheat (winter), for feed, intensive, UK Agriculture Materials 0.55 kg 2009 DEFRA, 2009. UK
Wheat straw, DE Agriculture Materials 0.323 kg 2008 PROBAS database, 2008. Germany
Wheat, for feed, conventional, UK Agriculture Materials 0.64 kg 2006 Williams et al., 2006. UK Wheat, for feed, organic, UK Agriculture Materials 0.74 kg 2009 DEFRA, 2009. UK Wheat, for feed, organic, UK Agriculture Materials 0.68 kg 2006 Williams et al., 2006. UK LimeX Agriculture Materials 0.049 kg 2006 Mortimer et al. (2009) UK Farm yard manure/slurry
Agriculture Materials 0.004 kg 2006 Mortimer, N., et al. (2009) UK
Fertiliser, K Agriculture Materials 1.768 kg 2006
Mortimer, N., et al. (2009) UK
Fertiliser, N Agriculture Materials 6.980 kg 2006 Mortimer, N., et al. (2009) UK
Fertiliser, P Agriculture Materials 1.860 kg 2006
Mortimer, N., et al. (2009) UK
Pesticides Agriculture Materials 5.375 kg 2006
Mortimer, N., et al. (2009) UK
Sugar beet, seeds Agriculture Materials 2.123 kg 2006 Mortimer, N., et al. (2009) UK
Wheat, seeds Agriculture Materials 0.249 kg 2006 Mortimer, N., et al. (2009) UK
Agricultural lime Agriculture Materials 0.04900000 kg 2006 Mortimer, N. et al. (2009) UK
Animal feed Agriculture Materials 0.49100000 kg 2006 Mortimer, N. et al. (2009) UK
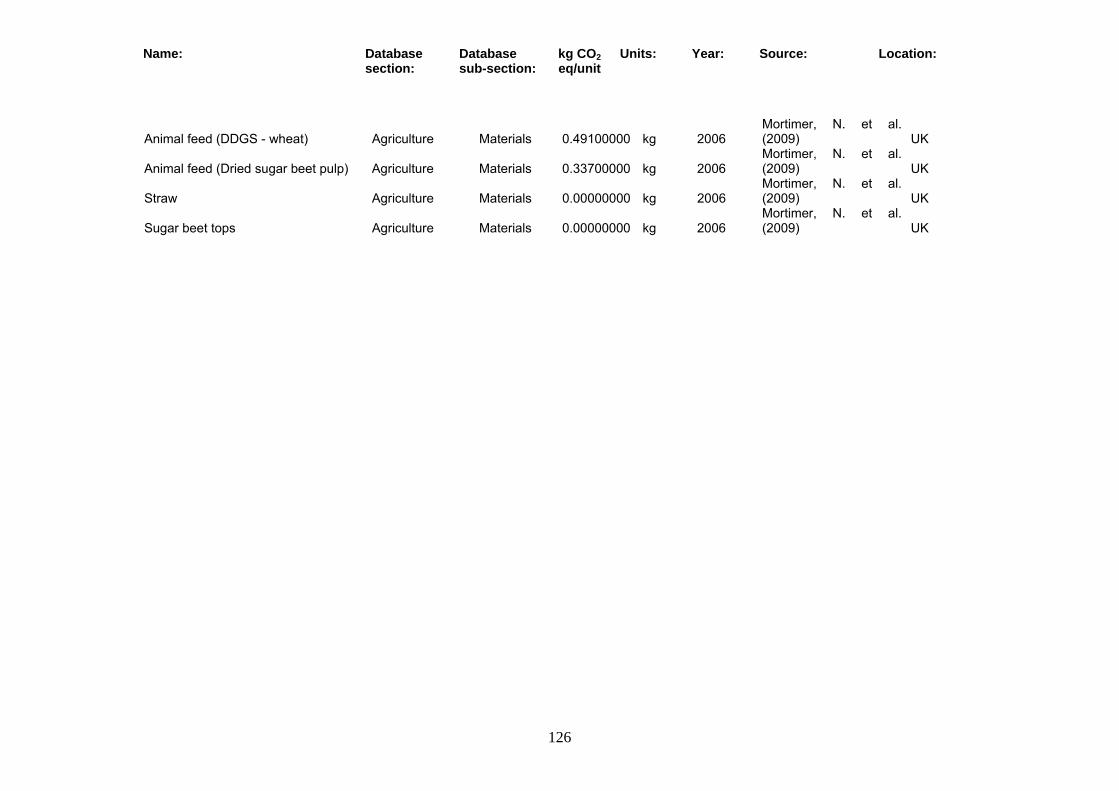
Name: Database section:
Database sub-section:
kg CO2 eq/unit
Units: Year: Source: Location:
126
Animal feed (DDGS - wheat) Agriculture Materials 0.49100000 kg 2006 Mortimer, N. et al. (2009) UK
Animal feed (Dried sugar beet pulp) Agriculture Materials 0.33700000 kg 2006 Mortimer, N. et al. (2009) UK
Straw Agriculture Materials 0.00000000 kg 2006 Mortimer, N. et al. (2009) UK
Sugar beet tops Agriculture Materials 0.00000000 kg 2006 Mortimer, N. et al. (2009) UK

Name: Database section:
Database sub-section:
kg CO2 eq/unit
Units: Year: Source: Location:
127
Appendix 3 – List of data sets in the Ecoinvent database anthracite, burned in stove 5-15kW Energy 1.07E-01 MJ 1992 Ecoinvent data V2.2 (2010) Europe blast furnace gas, burned in power plant Energy 2.00E-01 MJ 2000 Ecoinvent data V2.2 (2010) Europe coke oven gas, at plant, DE Energy 1.87E-02 MJ 1992 Ecoinvent data V2.2 (2010) Germany coke oven gas, at plant, Global Energy 2.45E-02 MJ 1998 Ecoinvent data V2.2 (2010) Global coke oven gas, burned in power plant Energy 7.51E-02 MJ 2000 Ecoinvent data V2.2 (2010) Europe cooling energy, natural gas, at cogen unit with absorption chiller 100 kW
Energy 5.71E-02 MJ 2005 Ecoinvent data V2.2 (2010) Switzerland
diesel, burned in building machine Energy 9.20E-02 MJ 2001 Ecoinvent data V2.2 (2010) Global diesel, burned in chopper Energy 9.85E-02 MJ 2002 Ecoinvent data V2.2 (2010) Europe diesel, burned in cogen 200kWe diesel SCR Energy 9.34E-02 MJ 2000 Ecoinvent data V2.2 (2010) Switzerland diesel, burned in diesel-electric generating set Energy 8.82E-02 MJ 2000 Ecoinvent data V2.2 (2010) Global electricity mix, aluminium industry Energy 9.31E-02 MJ 2002 Ecoinvent data V2.2 (2010) Global electricity mix, AT Energy 1.08E-01 MJ 2004 Ecoinvent data V2.2 (2010) Austria electricity mix, BA Energy 1.84E-01 MJ 2004 Ecoinvent data V2.2 (2010) Bosnia and
Herzegovina electricity mix, BE Energy 9.18E-02 MJ 2004 Ecoinvent data V2.2 (2010) Belgium electricity mix, BG Energy 1.65E-01 MJ 2004 Ecoinvent data V2.2 (2010) Bulgaria electricity mix, BR Energy 6.02E-02 MJ 2004 Ecoinvent data V2.2 (2010) Brazil electricity mix, CH Energy 3.48E-02 MJ 2007 Ecoinvent data V2.2 (2010) Switzerland electricity mix, CN Energy 3.19E-01 MJ 2005 Ecoinvent data V2.2 (2010) China electricity mix, CZ Energy 2.21E-01 MJ 2004 Ecoinvent data V2.2 (2010) Switzerland electricity mix, DE Energy 1.78E-01 MJ 2004 Ecoinvent data V2.2 (2010) Germany electricity mix, DK Energy 1.56E-01 MJ 2004 Ecoinvent data V2.2 (2010) Denmark electricity mix, ES Energy 1.39E-01 MJ 2004 Ecoinvent data V2.2 (2010) Spain electricity mix, FI Energy 1.22E-01 MJ 2004 Ecoinvent data V2.2 (2010) Finland electricity mix, FR Energy 2.49E-02 MJ 2004 Ecoinvent data V2.2 (2010) France electricity mix, GB Energy 1.62E-01 MJ 2004 Ecoinvent data V2.2 (2010) United
Kingdom electricity mix, GR Energy 2.71E-01 MJ 2004 Ecoinvent data V2.2 (2010) Greece electricity mix, HR Energy 1.30E-01 MJ 2004 Ecoinvent data V2.2 (2010) Croatia electricity mix, HU Energy 1.72E-01 MJ 2004 Ecoinvent data V2.2 (2010) Hungary
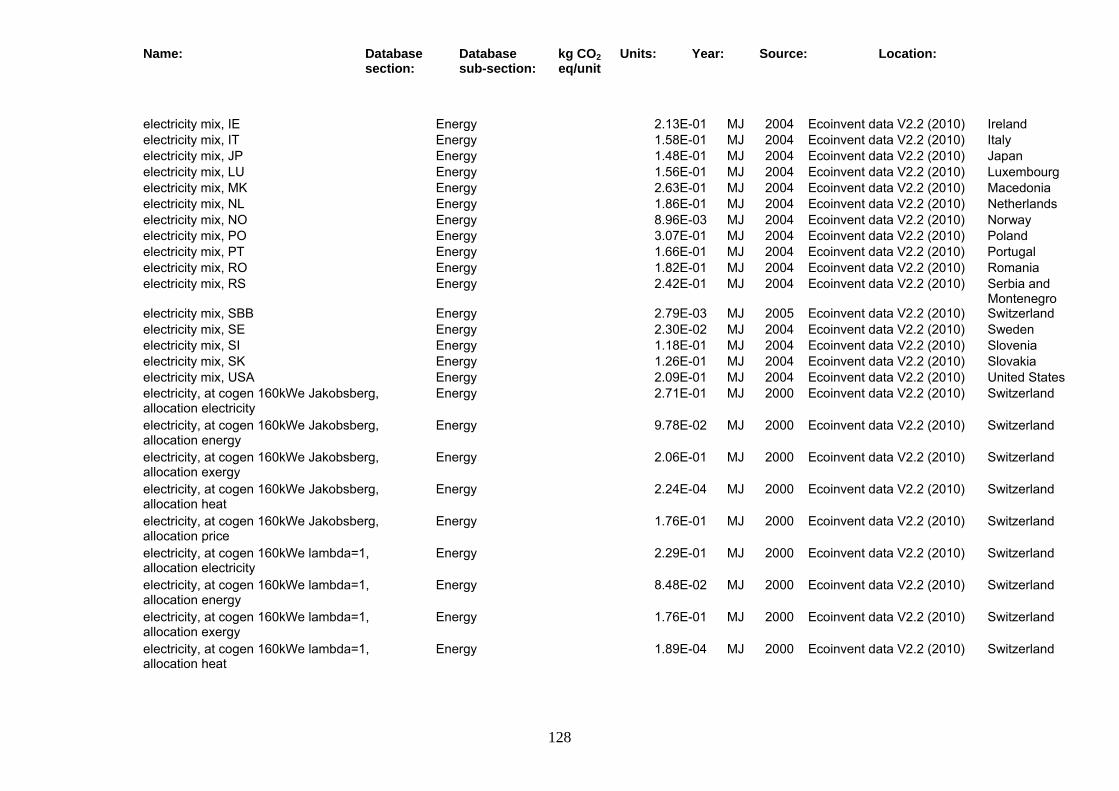
Name: Database section:
Database sub-section:
kg CO2 eq/unit
Units: Year: Source: Location:
128
electricity mix, IE Energy 2.13E-01 MJ 2004 Ecoinvent data V2.2 (2010) Ireland electricity mix, IT Energy 1.58E-01 MJ 2004 Ecoinvent data V2.2 (2010) Italy electricity mix, JP Energy 1.48E-01 MJ 2004 Ecoinvent data V2.2 (2010) Japan electricity mix, LU Energy 1.56E-01 MJ 2004 Ecoinvent data V2.2 (2010) Luxembourg electricity mix, MK Energy 2.63E-01 MJ 2004 Ecoinvent data V2.2 (2010) Macedonia electricity mix, NL Energy 1.86E-01 MJ 2004 Ecoinvent data V2.2 (2010) Netherlands electricity mix, NO Energy 8.96E-03 MJ 2004 Ecoinvent data V2.2 (2010) Norway electricity mix, PO Energy 3.07E-01 MJ 2004 Ecoinvent data V2.2 (2010) Poland electricity mix, PT Energy 1.66E-01 MJ 2004 Ecoinvent data V2.2 (2010) Portugal electricity mix, RO Energy 1.82E-01 MJ 2004 Ecoinvent data V2.2 (2010) Romania electricity mix, RS Energy 2.42E-01 MJ 2004 Ecoinvent data V2.2 (2010) Serbia and
Montenegro electricity mix, SBB Energy 2.79E-03 MJ 2005 Ecoinvent data V2.2 (2010) Switzerland electricity mix, SE Energy 2.30E-02 MJ 2004 Ecoinvent data V2.2 (2010) Sweden electricity mix, SI Energy 1.18E-01 MJ 2004 Ecoinvent data V2.2 (2010) Slovenia electricity mix, SK Energy 1.26E-01 MJ 2004 Ecoinvent data V2.2 (2010) Slovakia electricity mix, USA Energy 2.09E-01 MJ 2004 Ecoinvent data V2.2 (2010) United States electricity, at cogen 160kWe Jakobsberg, allocation electricity
Energy 2.71E-01 MJ 2000 Ecoinvent data V2.2 (2010) Switzerland
electricity, at cogen 160kWe Jakobsberg, allocation energy
Energy 9.78E-02 MJ 2000 Ecoinvent data V2.2 (2010) Switzerland
electricity, at cogen 160kWe Jakobsberg, allocation exergy
Energy 2.06E-01 MJ 2000 Ecoinvent data V2.2 (2010) Switzerland
electricity, at cogen 160kWe Jakobsberg, allocation heat
Energy 2.24E-04 MJ 2000 Ecoinvent data V2.2 (2010) Switzerland
electricity, at cogen 160kWe Jakobsberg, allocation price
Energy 1.76E-01 MJ 2000 Ecoinvent data V2.2 (2010) Switzerland
electricity, at cogen 160kWe lambda=1, allocation electricity
Energy 2.29E-01 MJ 2000 Ecoinvent data V2.2 (2010) Switzerland
electricity, at cogen 160kWe lambda=1, allocation energy
Energy 8.48E-02 MJ 2000 Ecoinvent data V2.2 (2010) Switzerland
electricity, at cogen 160kWe lambda=1, allocation exergy
Energy 1.76E-01 MJ 2000 Ecoinvent data V2.2 (2010) Switzerland
electricity, at cogen 160kWe lambda=1, allocation heat
Energy 1.89E-04 MJ 2000 Ecoinvent data V2.2 (2010) Switzerland
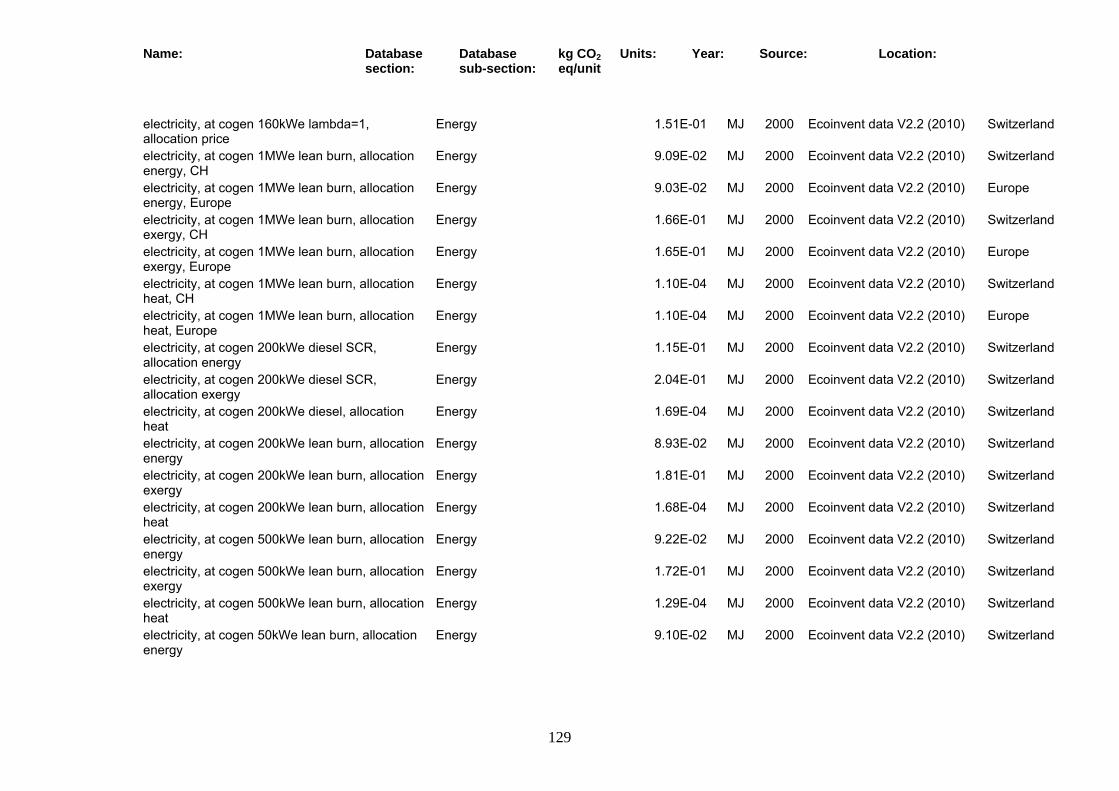
Name: Database section:
Database sub-section:
kg CO2 eq/unit
Units: Year: Source: Location:
129
electricity, at cogen 160kWe lambda=1, allocation price
Energy 1.51E-01 MJ 2000 Ecoinvent data V2.2 (2010) Switzerland
electricity, at cogen 1MWe lean burn, allocation energy, CH
Energy 9.09E-02 MJ 2000 Ecoinvent data V2.2 (2010) Switzerland
electricity, at cogen 1MWe lean burn, allocation energy, Europe
Energy 9.03E-02 MJ 2000 Ecoinvent data V2.2 (2010) Europe
electricity, at cogen 1MWe lean burn, allocation exergy, CH
Energy 1.66E-01 MJ 2000 Ecoinvent data V2.2 (2010) Switzerland
electricity, at cogen 1MWe lean burn, allocation exergy, Europe
Energy 1.65E-01 MJ 2000 Ecoinvent data V2.2 (2010) Europe
electricity, at cogen 1MWe lean burn, allocation heat, CH
Energy 1.10E-04 MJ 2000 Ecoinvent data V2.2 (2010) Switzerland
electricity, at cogen 1MWe lean burn, allocation heat, Europe
Energy 1.10E-04 MJ 2000 Ecoinvent data V2.2 (2010) Europe
electricity, at cogen 200kWe diesel SCR, allocation energy
Energy 1.15E-01 MJ 2000 Ecoinvent data V2.2 (2010) Switzerland
electricity, at cogen 200kWe diesel SCR, allocation exergy
Energy 2.04E-01 MJ 2000 Ecoinvent data V2.2 (2010) Switzerland
electricity, at cogen 200kWe diesel, allocation heat
Energy 1.69E-04 MJ 2000 Ecoinvent data V2.2 (2010) Switzerland
electricity, at cogen 200kWe lean burn, allocation energy
Energy 8.93E-02 MJ 2000 Ecoinvent data V2.2 (2010) Switzerland
electricity, at cogen 200kWe lean burn, allocation exergy
Energy 1.81E-01 MJ 2000 Ecoinvent data V2.2 (2010) Switzerland
electricity, at cogen 200kWe lean burn, allocation heat
Energy 1.68E-04 MJ 2000 Ecoinvent data V2.2 (2010) Switzerland
electricity, at cogen 500kWe lean burn, allocation energy
Energy 9.22E-02 MJ 2000 Ecoinvent data V2.2 (2010) Switzerland
electricity, at cogen 500kWe lean burn, allocation exergy
Energy 1.72E-01 MJ 2000 Ecoinvent data V2.2 (2010) Switzerland
electricity, at cogen 500kWe lean burn, allocation heat
Energy 1.29E-04 MJ 2000 Ecoinvent data V2.2 (2010) Switzerland
electricity, at cogen 50kWe lean burn, allocation energy
Energy 9.10E-02 MJ 2000 Ecoinvent data V2.2 (2010) Switzerland
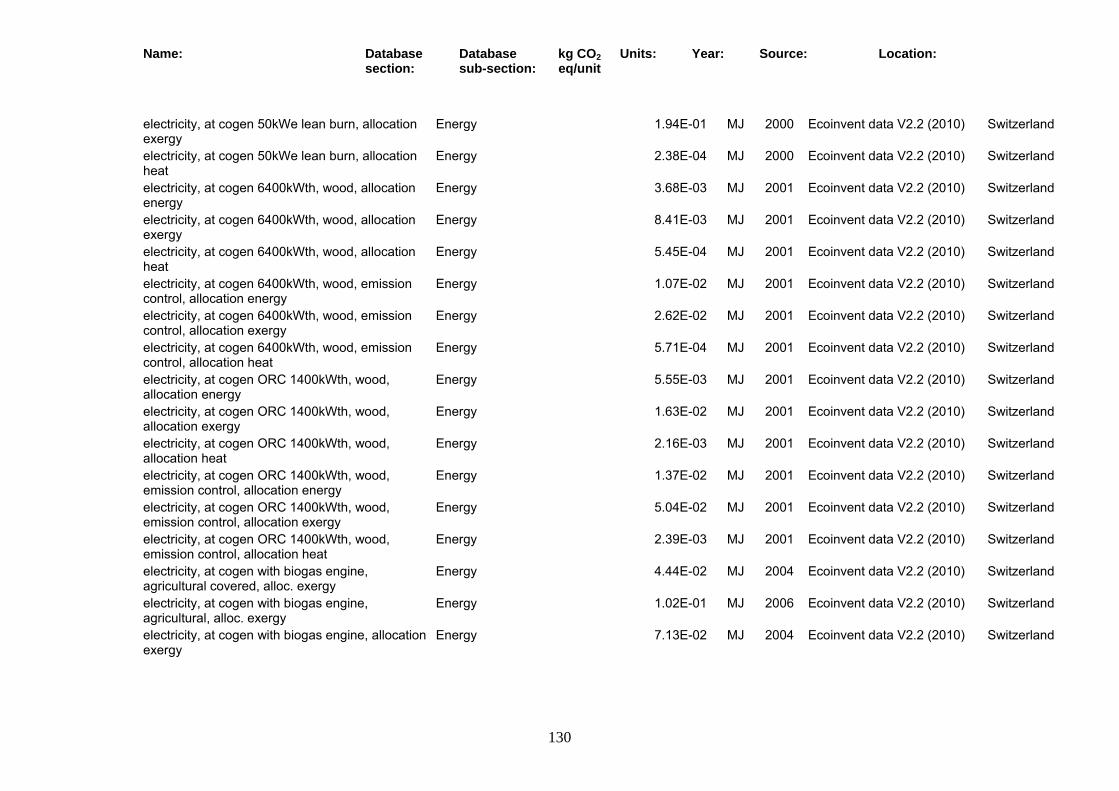
Name: Database section:
Database sub-section:
kg CO2 eq/unit
Units: Year: Source: Location:
130
electricity, at cogen 50kWe lean burn, allocation exergy
Energy 1.94E-01 MJ 2000 Ecoinvent data V2.2 (2010) Switzerland
electricity, at cogen 50kWe lean burn, allocation heat
Energy 2.38E-04 MJ 2000 Ecoinvent data V2.2 (2010) Switzerland
electricity, at cogen 6400kWth, wood, allocation energy
Energy 3.68E-03 MJ 2001 Ecoinvent data V2.2 (2010) Switzerland
electricity, at cogen 6400kWth, wood, allocation exergy
Energy 8.41E-03 MJ 2001 Ecoinvent data V2.2 (2010) Switzerland
electricity, at cogen 6400kWth, wood, allocation heat
Energy 5.45E-04 MJ 2001 Ecoinvent data V2.2 (2010) Switzerland
electricity, at cogen 6400kWth, wood, emission control, allocation energy
Energy 1.07E-02 MJ 2001 Ecoinvent data V2.2 (2010) Switzerland
electricity, at cogen 6400kWth, wood, emission control, allocation exergy
Energy 2.62E-02 MJ 2001 Ecoinvent data V2.2 (2010) Switzerland
electricity, at cogen 6400kWth, wood, emission control, allocation heat
Energy 5.71E-04 MJ 2001 Ecoinvent data V2.2 (2010) Switzerland
electricity, at cogen ORC 1400kWth, wood, allocation energy
Energy 5.55E-03 MJ 2001 Ecoinvent data V2.2 (2010) Switzerland
electricity, at cogen ORC 1400kWth, wood, allocation exergy
Energy 1.63E-02 MJ 2001 Ecoinvent data V2.2 (2010) Switzerland
electricity, at cogen ORC 1400kWth, wood, allocation heat
Energy 2.16E-03 MJ 2001 Ecoinvent data V2.2 (2010) Switzerland
electricity, at cogen ORC 1400kWth, wood, emission control, allocation energy
Energy 1.37E-02 MJ 2001 Ecoinvent data V2.2 (2010) Switzerland
electricity, at cogen ORC 1400kWth, wood, emission control, allocation exergy
Energy 5.04E-02 MJ 2001 Ecoinvent data V2.2 (2010) Switzerland
electricity, at cogen ORC 1400kWth, wood, emission control, allocation heat
Energy 2.39E-03 MJ 2001 Ecoinvent data V2.2 (2010) Switzerland
electricity, at cogen with biogas engine, agricultural covered, alloc. exergy
Energy 4.44E-02 MJ 2004 Ecoinvent data V2.2 (2010) Switzerland
electricity, at cogen with biogas engine, agricultural, alloc. exergy
Energy 1.02E-01 MJ 2006 Ecoinvent data V2.2 (2010) Switzerland
electricity, at cogen with biogas engine, allocation exergy
Energy 7.13E-02 MJ 2004 Ecoinvent data V2.2 (2010) Switzerland
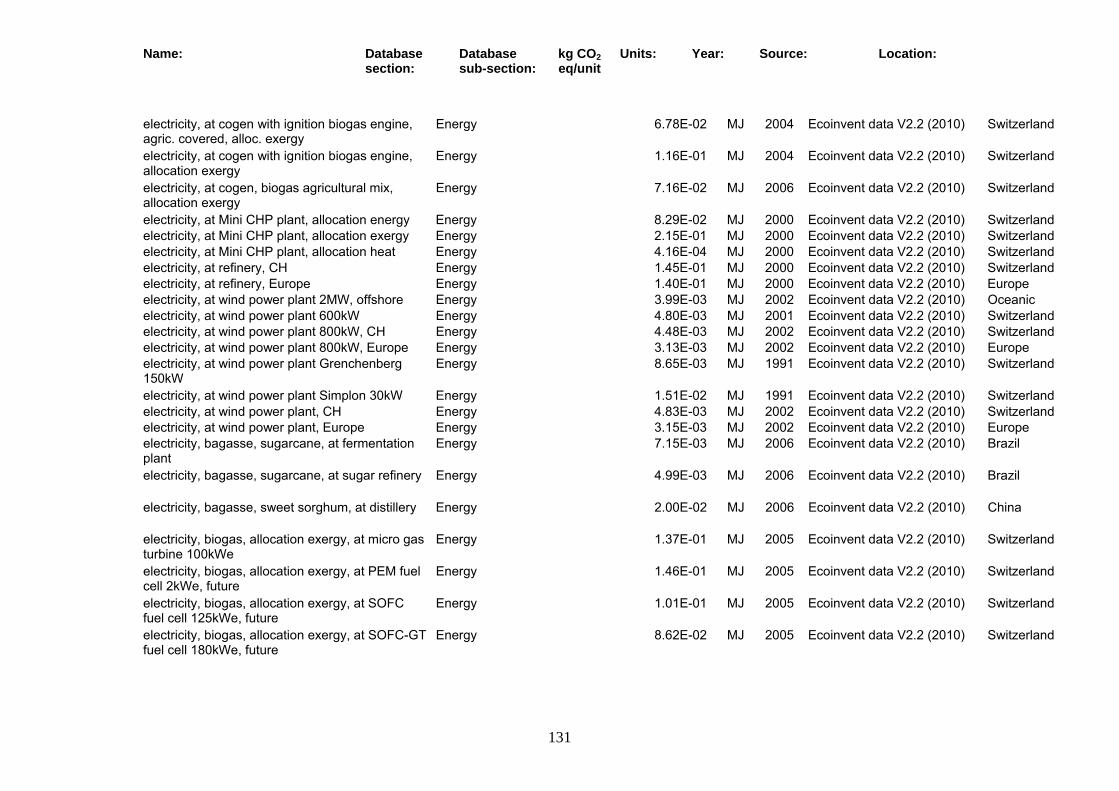
Name: Database section:
Database sub-section:
kg CO2 eq/unit
Units: Year: Source: Location:
131
electricity, at cogen with ignition biogas engine, agric. covered, alloc. exergy
Energy 6.78E-02 MJ 2004 Ecoinvent data V2.2 (2010) Switzerland
electricity, at cogen with ignition biogas engine, allocation exergy
Energy 1.16E-01 MJ 2004 Ecoinvent data V2.2 (2010) Switzerland
electricity, at cogen, biogas agricultural mix, allocation exergy
Energy 7.16E-02 MJ 2006 Ecoinvent data V2.2 (2010) Switzerland
electricity, at Mini CHP plant, allocation energy Energy 8.29E-02 MJ 2000 Ecoinvent data V2.2 (2010) Switzerland electricity, at Mini CHP plant, allocation exergy Energy 2.15E-01 MJ 2000 Ecoinvent data V2.2 (2010) Switzerland electricity, at Mini CHP plant, allocation heat Energy 4.16E-04 MJ 2000 Ecoinvent data V2.2 (2010) Switzerland electricity, at refinery, CH Energy 1.45E-01 MJ 2000 Ecoinvent data V2.2 (2010) Switzerland electricity, at refinery, Europe Energy 1.40E-01 MJ 2000 Ecoinvent data V2.2 (2010) Europe electricity, at wind power plant 2MW, offshore Energy 3.99E-03 MJ 2002 Ecoinvent data V2.2 (2010) Oceanic electricity, at wind power plant 600kW Energy 4.80E-03 MJ 2001 Ecoinvent data V2.2 (2010) Switzerland electricity, at wind power plant 800kW, CH Energy 4.48E-03 MJ 2002 Ecoinvent data V2.2 (2010) Switzerland electricity, at wind power plant 800kW, Europe Energy 3.13E-03 MJ 2002 Ecoinvent data V2.2 (2010) Europe electricity, at wind power plant Grenchenberg 150kW
Energy 8.65E-03 MJ 1991 Ecoinvent data V2.2 (2010) Switzerland
electricity, at wind power plant Simplon 30kW Energy 1.51E-02 MJ 1991 Ecoinvent data V2.2 (2010) Switzerland electricity, at wind power plant, CH Energy 4.83E-03 MJ 2002 Ecoinvent data V2.2 (2010) Switzerland electricity, at wind power plant, Europe Energy 3.15E-03 MJ 2002 Ecoinvent data V2.2 (2010) Europe electricity, bagasse, sugarcane, at fermentation plant
Energy 7.15E-03 MJ 2006 Ecoinvent data V2.2 (2010) Brazil
electricity, bagasse, sugarcane, at sugar refinery Energy 4.99E-03 MJ 2006 Ecoinvent data V2.2 (2010) Brazil
electricity, bagasse, sweet sorghum, at distillery Energy 2.00E-02 MJ 2006 Ecoinvent data V2.2 (2010) China
electricity, biogas, allocation exergy, at micro gas turbine 100kWe
Energy 1.37E-01 MJ 2005 Ecoinvent data V2.2 (2010) Switzerland
electricity, biogas, allocation exergy, at PEM fuel cell 2kWe, future
Energy 1.46E-01 MJ 2005 Ecoinvent data V2.2 (2010) Switzerland
electricity, biogas, allocation exergy, at SOFC fuel cell 125kWe, future
Energy 1.01E-01 MJ 2005 Ecoinvent data V2.2 (2010) Switzerland
electricity, biogas, allocation exergy, at SOFC-GT fuel cell 180kWe, future
Energy 8.62E-02 MJ 2005 Ecoinvent data V2.2 (2010) Switzerland
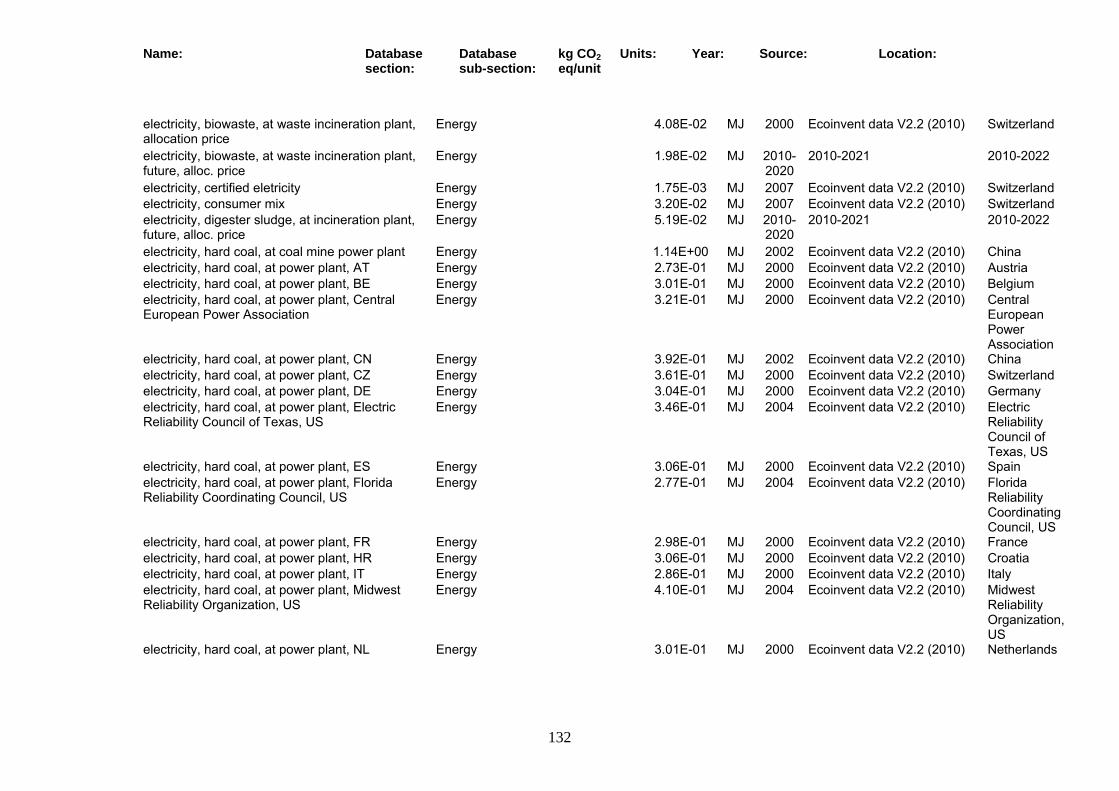
Name: Database section:
Database sub-section:
kg CO2 eq/unit
Units: Year: Source: Location:
132
electricity, biowaste, at waste incineration plant, allocation price
Energy 4.08E-02 MJ 2000 Ecoinvent data V2.2 (2010) Switzerland
electricity, biowaste, at waste incineration plant, future, alloc. price
Energy 1.98E-02 MJ 2010-2020
2010-2021 2010-2022
electricity, certified eletricity Energy 1.75E-03 MJ 2007 Ecoinvent data V2.2 (2010) Switzerland electricity, consumer mix Energy 3.20E-02 MJ 2007 Ecoinvent data V2.2 (2010) Switzerland electricity, digester sludge, at incineration plant, future, alloc. price
Energy 5.19E-02 MJ 2010-2020
2010-2021 2010-2022
electricity, hard coal, at coal mine power plant Energy 1.14E+00 MJ 2002 Ecoinvent data V2.2 (2010) China electricity, hard coal, at power plant, AT Energy 2.73E-01 MJ 2000 Ecoinvent data V2.2 (2010) Austria electricity, hard coal, at power plant, BE Energy 3.01E-01 MJ 2000 Ecoinvent data V2.2 (2010) Belgium electricity, hard coal, at power plant, Central European Power Association
Energy 3.21E-01 MJ 2000 Ecoinvent data V2.2 (2010) Central European Power Association
electricity, hard coal, at power plant, CN Energy 3.92E-01 MJ 2002 Ecoinvent data V2.2 (2010) China electricity, hard coal, at power plant, CZ Energy 3.61E-01 MJ 2000 Ecoinvent data V2.2 (2010) Switzerland electricity, hard coal, at power plant, DE Energy 3.04E-01 MJ 2000 Ecoinvent data V2.2 (2010) Germany electricity, hard coal, at power plant, Electric Reliability Council of Texas, US
Energy 3.46E-01 MJ 2004 Ecoinvent data V2.2 (2010) Electric Reliability Council of Texas, US
electricity, hard coal, at power plant, ES Energy 3.06E-01 MJ 2000 Ecoinvent data V2.2 (2010) Spain electricity, hard coal, at power plant, Florida Reliability Coordinating Council, US
Energy 2.77E-01 MJ 2004 Ecoinvent data V2.2 (2010) Florida Reliability Coordinating Council, US
electricity, hard coal, at power plant, FR Energy 2.98E-01 MJ 2000 Ecoinvent data V2.2 (2010) France electricity, hard coal, at power plant, HR Energy 3.06E-01 MJ 2000 Ecoinvent data V2.2 (2010) Croatia electricity, hard coal, at power plant, IT Energy 2.86E-01 MJ 2000 Ecoinvent data V2.2 (2010) Italy electricity, hard coal, at power plant, Midwest Reliability Organization, US
Energy 4.10E-01 MJ 2004 Ecoinvent data V2.2 (2010) Midwest Reliability Organization, US
electricity, hard coal, at power plant, NL Energy 3.01E-01 MJ 2000 Ecoinvent data V2.2 (2010) Netherlands
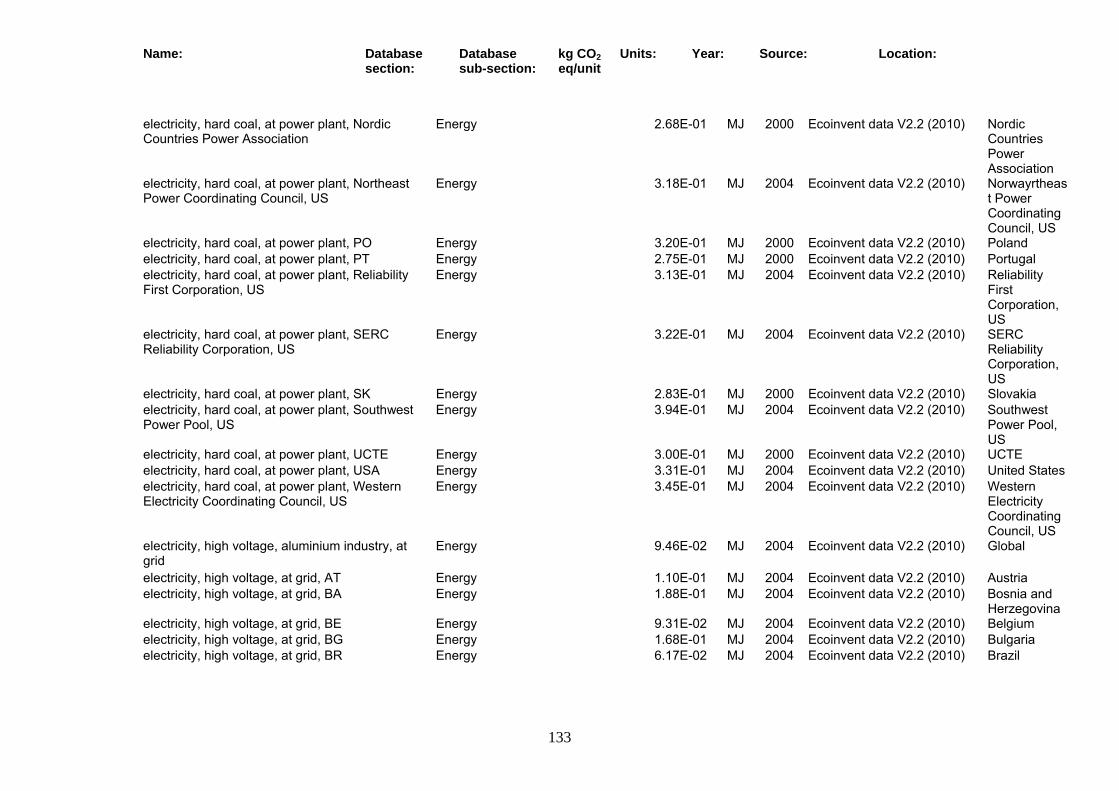
Name: Database section:
Database sub-section:
kg CO2 eq/unit
Units: Year: Source: Location:
133
electricity, hard coal, at power plant, Nordic Countries Power Association
Energy 2.68E-01 MJ 2000 Ecoinvent data V2.2 (2010) Nordic Countries Power Association
electricity, hard coal, at power plant, Northeast Power Coordinating Council, US
Energy 3.18E-01 MJ 2004 Ecoinvent data V2.2 (2010) Norwayrtheast Power Coordinating Council, US
electricity, hard coal, at power plant, PO Energy 3.20E-01 MJ 2000 Ecoinvent data V2.2 (2010) Poland electricity, hard coal, at power plant, PT Energy 2.75E-01 MJ 2000 Ecoinvent data V2.2 (2010) Portugal electricity, hard coal, at power plant, Reliability First Corporation, US
Energy 3.13E-01 MJ 2004 Ecoinvent data V2.2 (2010) Reliability First Corporation, US
electricity, hard coal, at power plant, SERC Reliability Corporation, US
Energy 3.22E-01 MJ 2004 Ecoinvent data V2.2 (2010) SERC Reliability Corporation, US
electricity, hard coal, at power plant, SK Energy 2.83E-01 MJ 2000 Ecoinvent data V2.2 (2010) Slovakia electricity, hard coal, at power plant, Southwest Power Pool, US
Energy 3.94E-01 MJ 2004 Ecoinvent data V2.2 (2010) Southwest Power Pool, US
electricity, hard coal, at power plant, UCTE Energy 3.00E-01 MJ 2000 Ecoinvent data V2.2 (2010) UCTE electricity, hard coal, at power plant, USA Energy 3.31E-01 MJ 2004 Ecoinvent data V2.2 (2010) United States electricity, hard coal, at power plant, Western Electricity Coordinating Council, US
Energy 3.45E-01 MJ 2004 Ecoinvent data V2.2 (2010) Western Electricity Coordinating Council, US
electricity, high voltage, aluminium industry, at grid
Energy 9.46E-02 MJ 2004 Ecoinvent data V2.2 (2010) Global
electricity, high voltage, at grid, AT Energy 1.10E-01 MJ 2004 Ecoinvent data V2.2 (2010) Austria electricity, high voltage, at grid, BA Energy 1.88E-01 MJ 2004 Ecoinvent data V2.2 (2010) Bosnia and
Herzegovina electricity, high voltage, at grid, BE Energy 9.31E-02 MJ 2004 Ecoinvent data V2.2 (2010) Belgium electricity, high voltage, at grid, BG Energy 1.68E-01 MJ 2004 Ecoinvent data V2.2 (2010) Bulgaria electricity, high voltage, at grid, BR Energy 6.17E-02 MJ 2004 Ecoinvent data V2.2 (2010) Brazil
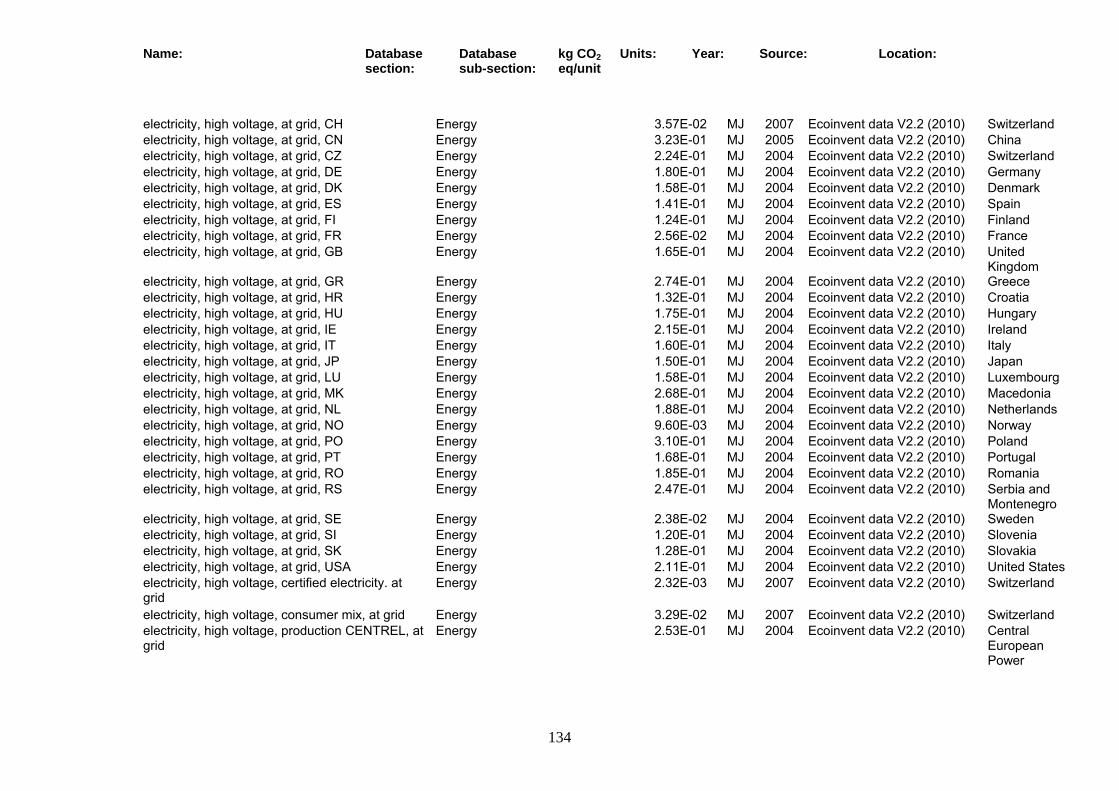
Name: Database section:
Database sub-section:
kg CO2 eq/unit
Units: Year: Source: Location:
134
electricity, high voltage, at grid, CH Energy 3.57E-02 MJ 2007 Ecoinvent data V2.2 (2010) Switzerland electricity, high voltage, at grid, CN Energy 3.23E-01 MJ 2005 Ecoinvent data V2.2 (2010) China electricity, high voltage, at grid, CZ Energy 2.24E-01 MJ 2004 Ecoinvent data V2.2 (2010) Switzerland electricity, high voltage, at grid, DE Energy 1.80E-01 MJ 2004 Ecoinvent data V2.2 (2010) Germany electricity, high voltage, at grid, DK Energy 1.58E-01 MJ 2004 Ecoinvent data V2.2 (2010) Denmark electricity, high voltage, at grid, ES Energy 1.41E-01 MJ 2004 Ecoinvent data V2.2 (2010) Spain electricity, high voltage, at grid, FI Energy 1.24E-01 MJ 2004 Ecoinvent data V2.2 (2010) Finland electricity, high voltage, at grid, FR Energy 2.56E-02 MJ 2004 Ecoinvent data V2.2 (2010) France electricity, high voltage, at grid, GB Energy 1.65E-01 MJ 2004 Ecoinvent data V2.2 (2010) United
Kingdom electricity, high voltage, at grid, GR Energy 2.74E-01 MJ 2004 Ecoinvent data V2.2 (2010) Greece electricity, high voltage, at grid, HR Energy 1.32E-01 MJ 2004 Ecoinvent data V2.2 (2010) Croatia electricity, high voltage, at grid, HU Energy 1.75E-01 MJ 2004 Ecoinvent data V2.2 (2010) Hungary electricity, high voltage, at grid, IE Energy 2.15E-01 MJ 2004 Ecoinvent data V2.2 (2010) Ireland electricity, high voltage, at grid, IT Energy 1.60E-01 MJ 2004 Ecoinvent data V2.2 (2010) Italy electricity, high voltage, at grid, JP Energy 1.50E-01 MJ 2004 Ecoinvent data V2.2 (2010) Japan electricity, high voltage, at grid, LU Energy 1.58E-01 MJ 2004 Ecoinvent data V2.2 (2010) Luxembourg electricity, high voltage, at grid, MK Energy 2.68E-01 MJ 2004 Ecoinvent data V2.2 (2010) Macedonia electricity, high voltage, at grid, NL Energy 1.88E-01 MJ 2004 Ecoinvent data V2.2 (2010) Netherlands electricity, high voltage, at grid, NO Energy 9.60E-03 MJ 2004 Ecoinvent data V2.2 (2010) Norway electricity, high voltage, at grid, PO Energy 3.10E-01 MJ 2004 Ecoinvent data V2.2 (2010) Poland electricity, high voltage, at grid, PT Energy 1.68E-01 MJ 2004 Ecoinvent data V2.2 (2010) Portugal electricity, high voltage, at grid, RO Energy 1.85E-01 MJ 2004 Ecoinvent data V2.2 (2010) Romania electricity, high voltage, at grid, RS Energy 2.47E-01 MJ 2004 Ecoinvent data V2.2 (2010) Serbia and
Montenegro electricity, high voltage, at grid, SE Energy 2.38E-02 MJ 2004 Ecoinvent data V2.2 (2010) Sweden electricity, high voltage, at grid, SI Energy 1.20E-01 MJ 2004 Ecoinvent data V2.2 (2010) Slovenia electricity, high voltage, at grid, SK Energy 1.28E-01 MJ 2004 Ecoinvent data V2.2 (2010) Slovakia electricity, high voltage, at grid, USA Energy 2.11E-01 MJ 2004 Ecoinvent data V2.2 (2010) United States electricity, high voltage, certified electricity. at grid
Energy 2.32E-03 MJ 2007 Ecoinvent data V2.2 (2010) Switzerland
electricity, high voltage, consumer mix, at grid Energy 3.29E-02 MJ 2007 Ecoinvent data V2.2 (2010) Switzerland electricity, high voltage, production CENTREL, at grid
Energy 2.53E-01 MJ 2004 Ecoinvent data V2.2 (2010) Central European Power
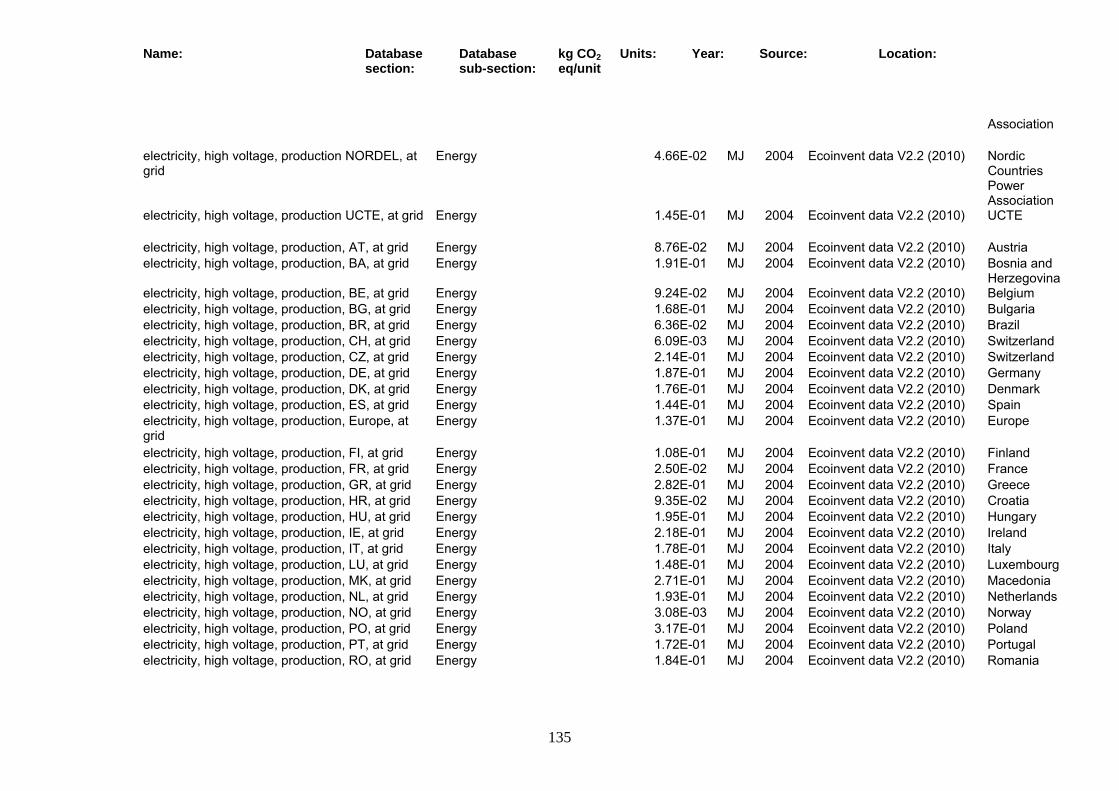
Name: Database section:
Database sub-section:
kg CO2 eq/unit
Units: Year: Source: Location:
135
Association
electricity, high voltage, production NORDEL, at grid
Energy 4.66E-02 MJ 2004 Ecoinvent data V2.2 (2010) Nordic Countries Power Association
electricity, high voltage, production UCTE, at grid Energy 1.45E-01 MJ 2004 Ecoinvent data V2.2 (2010) UCTE
electricity, high voltage, production, AT, at grid Energy 8.76E-02 MJ 2004 Ecoinvent data V2.2 (2010) Austria electricity, high voltage, production, BA, at grid Energy 1.91E-01 MJ 2004 Ecoinvent data V2.2 (2010) Bosnia and
Herzegovina electricity, high voltage, production, BE, at grid Energy 9.24E-02 MJ 2004 Ecoinvent data V2.2 (2010) Belgium electricity, high voltage, production, BG, at grid Energy 1.68E-01 MJ 2004 Ecoinvent data V2.2 (2010) Bulgaria electricity, high voltage, production, BR, at grid Energy 6.36E-02 MJ 2004 Ecoinvent data V2.2 (2010) Brazil electricity, high voltage, production, CH, at grid Energy 6.09E-03 MJ 2004 Ecoinvent data V2.2 (2010) Switzerland electricity, high voltage, production, CZ, at grid Energy 2.14E-01 MJ 2004 Ecoinvent data V2.2 (2010) Switzerland electricity, high voltage, production, DE, at grid Energy 1.87E-01 MJ 2004 Ecoinvent data V2.2 (2010) Germany electricity, high voltage, production, DK, at grid Energy 1.76E-01 MJ 2004 Ecoinvent data V2.2 (2010) Denmark electricity, high voltage, production, ES, at grid Energy 1.44E-01 MJ 2004 Ecoinvent data V2.2 (2010) Spain electricity, high voltage, production, Europe, at grid
Energy 1.37E-01 MJ 2004 Ecoinvent data V2.2 (2010) Europe
electricity, high voltage, production, FI, at grid Energy 1.08E-01 MJ 2004 Ecoinvent data V2.2 (2010) Finland electricity, high voltage, production, FR, at grid Energy 2.50E-02 MJ 2004 Ecoinvent data V2.2 (2010) France electricity, high voltage, production, GR, at grid Energy 2.82E-01 MJ 2004 Ecoinvent data V2.2 (2010) Greece electricity, high voltage, production, HR, at grid Energy 9.35E-02 MJ 2004 Ecoinvent data V2.2 (2010) Croatia electricity, high voltage, production, HU, at grid Energy 1.95E-01 MJ 2004 Ecoinvent data V2.2 (2010) Hungary electricity, high voltage, production, IE, at grid Energy 2.18E-01 MJ 2004 Ecoinvent data V2.2 (2010) Ireland electricity, high voltage, production, IT, at grid Energy 1.78E-01 MJ 2004 Ecoinvent data V2.2 (2010) Italy electricity, high voltage, production, LU, at grid Energy 1.48E-01 MJ 2004 Ecoinvent data V2.2 (2010) Luxembourg electricity, high voltage, production, MK, at grid Energy 2.71E-01 MJ 2004 Ecoinvent data V2.2 (2010) Macedonia electricity, high voltage, production, NL, at grid Energy 1.93E-01 MJ 2004 Ecoinvent data V2.2 (2010) Netherlands electricity, high voltage, production, NO, at grid Energy 3.08E-03 MJ 2004 Ecoinvent data V2.2 (2010) Norway electricity, high voltage, production, PO, at grid Energy 3.17E-01 MJ 2004 Ecoinvent data V2.2 (2010) Poland electricity, high voltage, production, PT, at grid Energy 1.72E-01 MJ 2004 Ecoinvent data V2.2 (2010) Portugal electricity, high voltage, production, RO, at grid Energy 1.84E-01 MJ 2004 Ecoinvent data V2.2 (2010) Romania
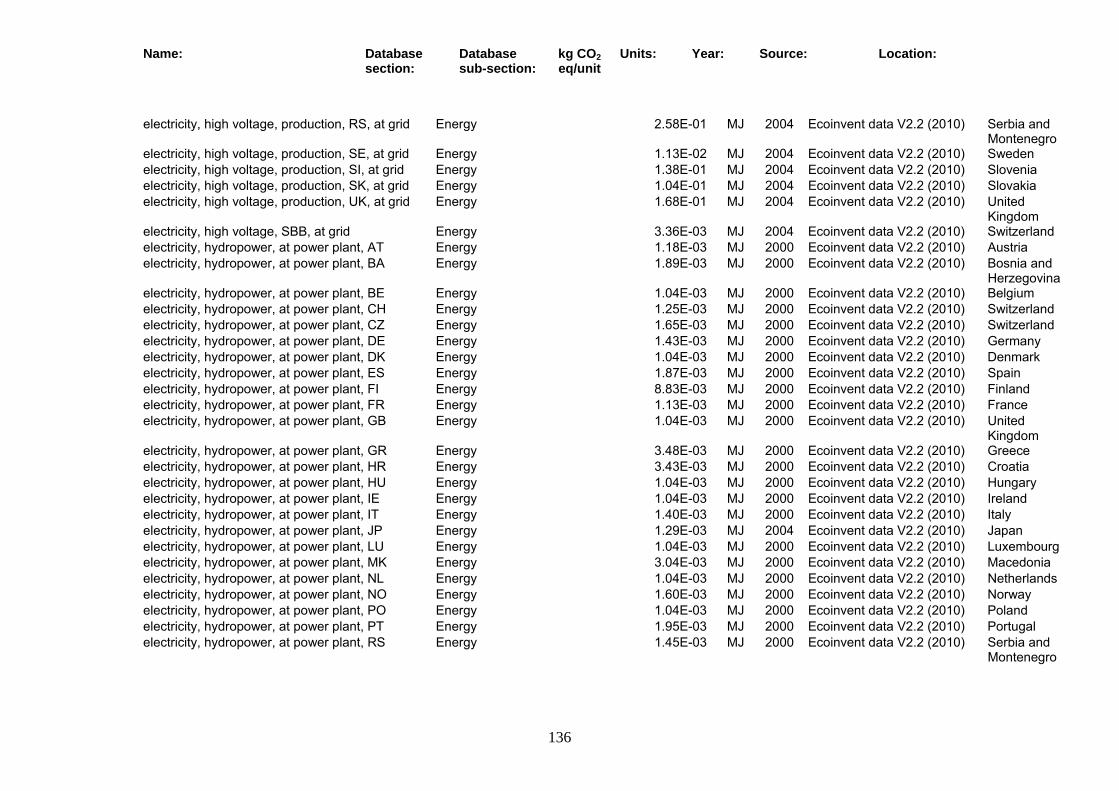
Name: Database section:
Database sub-section:
kg CO2 eq/unit
Units: Year: Source: Location:
136
electricity, high voltage, production, RS, at grid Energy 2.58E-01 MJ 2004 Ecoinvent data V2.2 (2010) Serbia and Montenegro
electricity, high voltage, production, SE, at grid Energy 1.13E-02 MJ 2004 Ecoinvent data V2.2 (2010) Sweden electricity, high voltage, production, SI, at grid Energy 1.38E-01 MJ 2004 Ecoinvent data V2.2 (2010) Slovenia electricity, high voltage, production, SK, at grid Energy 1.04E-01 MJ 2004 Ecoinvent data V2.2 (2010) Slovakia electricity, high voltage, production, UK, at grid Energy 1.68E-01 MJ 2004 Ecoinvent data V2.2 (2010) United
Kingdom electricity, high voltage, SBB, at grid Energy 3.36E-03 MJ 2004 Ecoinvent data V2.2 (2010) Switzerland electricity, hydropower, at power plant, AT Energy 1.18E-03 MJ 2000 Ecoinvent data V2.2 (2010) Austria electricity, hydropower, at power plant, BA Energy 1.89E-03 MJ 2000 Ecoinvent data V2.2 (2010) Bosnia and
Herzegovina electricity, hydropower, at power plant, BE Energy 1.04E-03 MJ 2000 Ecoinvent data V2.2 (2010) Belgium electricity, hydropower, at power plant, CH Energy 1.25E-03 MJ 2000 Ecoinvent data V2.2 (2010) Switzerland electricity, hydropower, at power plant, CZ Energy 1.65E-03 MJ 2000 Ecoinvent data V2.2 (2010) Switzerland electricity, hydropower, at power plant, DE Energy 1.43E-03 MJ 2000 Ecoinvent data V2.2 (2010) Germany electricity, hydropower, at power plant, DK Energy 1.04E-03 MJ 2000 Ecoinvent data V2.2 (2010) Denmark electricity, hydropower, at power plant, ES Energy 1.87E-03 MJ 2000 Ecoinvent data V2.2 (2010) Spain electricity, hydropower, at power plant, FI Energy 8.83E-03 MJ 2000 Ecoinvent data V2.2 (2010) Finland electricity, hydropower, at power plant, FR Energy 1.13E-03 MJ 2000 Ecoinvent data V2.2 (2010) France electricity, hydropower, at power plant, GB Energy 1.04E-03 MJ 2000 Ecoinvent data V2.2 (2010) United
Kingdom electricity, hydropower, at power plant, GR Energy 3.48E-03 MJ 2000 Ecoinvent data V2.2 (2010) Greece electricity, hydropower, at power plant, HR Energy 3.43E-03 MJ 2000 Ecoinvent data V2.2 (2010) Croatia electricity, hydropower, at power plant, HU Energy 1.04E-03 MJ 2000 Ecoinvent data V2.2 (2010) Hungary electricity, hydropower, at power plant, IE Energy 1.04E-03 MJ 2000 Ecoinvent data V2.2 (2010) Ireland electricity, hydropower, at power plant, IT Energy 1.40E-03 MJ 2000 Ecoinvent data V2.2 (2010) Italy electricity, hydropower, at power plant, JP Energy 1.29E-03 MJ 2004 Ecoinvent data V2.2 (2010) Japan electricity, hydropower, at power plant, LU Energy 1.04E-03 MJ 2000 Ecoinvent data V2.2 (2010) Luxembourg electricity, hydropower, at power plant, MK Energy 3.04E-03 MJ 2000 Ecoinvent data V2.2 (2010) Macedonia electricity, hydropower, at power plant, NL Energy 1.04E-03 MJ 2000 Ecoinvent data V2.2 (2010) Netherlands electricity, hydropower, at power plant, NO Energy 1.60E-03 MJ 2000 Ecoinvent data V2.2 (2010) Norway electricity, hydropower, at power plant, PO Energy 1.04E-03 MJ 2000 Ecoinvent data V2.2 (2010) Poland electricity, hydropower, at power plant, PT Energy 1.95E-03 MJ 2000 Ecoinvent data V2.2 (2010) Portugal electricity, hydropower, at power plant, RS Energy 1.45E-03 MJ 2000 Ecoinvent data V2.2 (2010) Serbia and
Montenegro
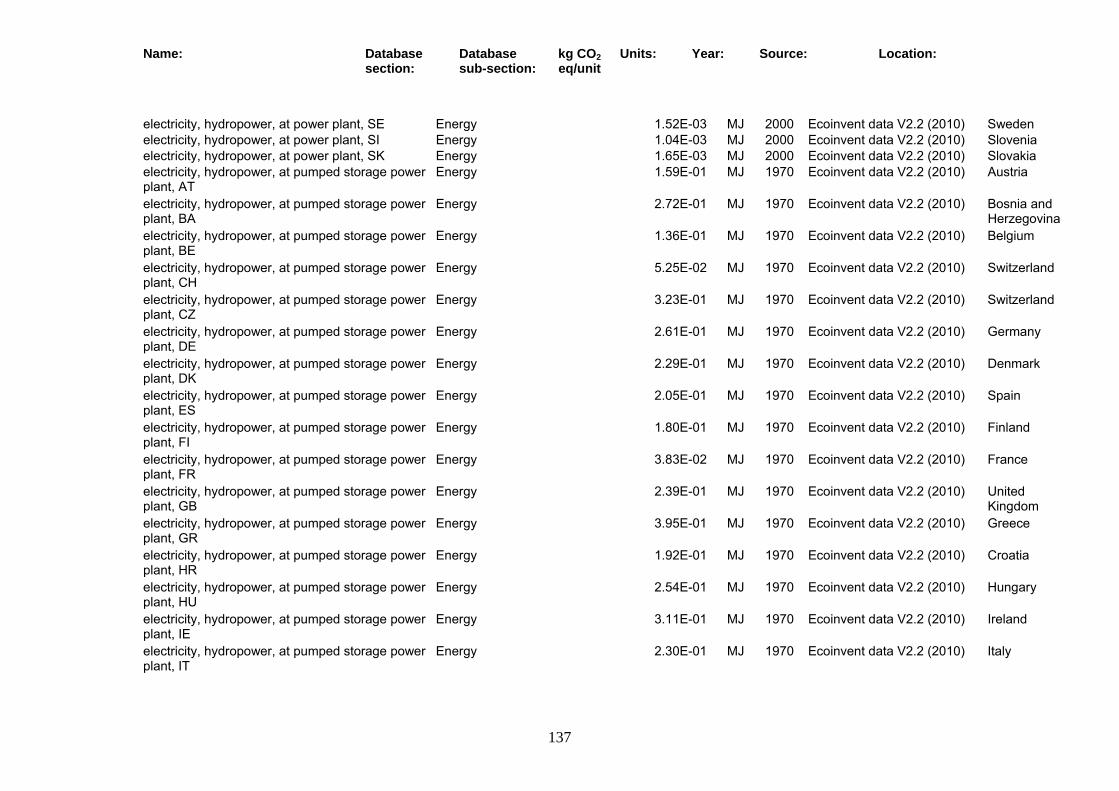
Name: Database section:
Database sub-section:
kg CO2 eq/unit
Units: Year: Source: Location:
137
electricity, hydropower, at power plant, SE Energy 1.52E-03 MJ 2000 Ecoinvent data V2.2 (2010) Sweden electricity, hydropower, at power plant, SI Energy 1.04E-03 MJ 2000 Ecoinvent data V2.2 (2010) Slovenia electricity, hydropower, at power plant, SK Energy 1.65E-03 MJ 2000 Ecoinvent data V2.2 (2010) Slovakia electricity, hydropower, at pumped storage power plant, AT
Energy 1.59E-01 MJ 1970 Ecoinvent data V2.2 (2010) Austria
electricity, hydropower, at pumped storage power plant, BA
Energy 2.72E-01 MJ 1970 Ecoinvent data V2.2 (2010) Bosnia and Herzegovina
electricity, hydropower, at pumped storage power plant, BE
Energy 1.36E-01 MJ 1970 Ecoinvent data V2.2 (2010) Belgium
electricity, hydropower, at pumped storage power plant, CH
Energy 5.25E-02 MJ 1970 Ecoinvent data V2.2 (2010) Switzerland
electricity, hydropower, at pumped storage power plant, CZ
Energy 3.23E-01 MJ 1970 Ecoinvent data V2.2 (2010) Switzerland
electricity, hydropower, at pumped storage power plant, DE
Energy 2.61E-01 MJ 1970 Ecoinvent data V2.2 (2010) Germany
electricity, hydropower, at pumped storage power plant, DK
Energy 2.29E-01 MJ 1970 Ecoinvent data V2.2 (2010) Denmark
electricity, hydropower, at pumped storage power plant, ES
Energy 2.05E-01 MJ 1970 Ecoinvent data V2.2 (2010) Spain
electricity, hydropower, at pumped storage power plant, FI
Energy 1.80E-01 MJ 1970 Ecoinvent data V2.2 (2010) Finland
electricity, hydropower, at pumped storage power plant, FR
Energy 3.83E-02 MJ 1970 Ecoinvent data V2.2 (2010) France
electricity, hydropower, at pumped storage power plant, GB
Energy 2.39E-01 MJ 1970 Ecoinvent data V2.2 (2010) United Kingdom
electricity, hydropower, at pumped storage power plant, GR
Energy 3.95E-01 MJ 1970 Ecoinvent data V2.2 (2010) Greece
electricity, hydropower, at pumped storage power plant, HR
Energy 1.92E-01 MJ 1970 Ecoinvent data V2.2 (2010) Croatia
electricity, hydropower, at pumped storage power plant, HU
Energy 2.54E-01 MJ 1970 Ecoinvent data V2.2 (2010) Hungary
electricity, hydropower, at pumped storage power plant, IE
Energy 3.11E-01 MJ 1970 Ecoinvent data V2.2 (2010) Ireland
electricity, hydropower, at pumped storage power plant, IT
Energy 2.30E-01 MJ 1970 Ecoinvent data V2.2 (2010) Italy

Name: Database section:
Database sub-section:
kg CO2 eq/unit
Units: Year: Source: Location:
138
electricity, hydropower, at pumped storage power plant, JP
Energy 2.18E-01 MJ 2002 Ecoinvent data V2.2 (2010) Japan
electricity, hydropower, at pumped storage power plant, LU
Energy 2.26E-01 MJ 1970 Ecoinvent data V2.2 (2010) Luxembourg
electricity, hydropower, at pumped storage power plant, MK
Energy 3.87E-01 MJ 1970 Ecoinvent data V2.2 (2010) Macedonia
electricity, hydropower, at pumped storage power plant, NL
Energy 2.72E-01 MJ 1970 Ecoinvent data V2.2 (2010) Netherlands
electricity, hydropower, at pumped storage power plant, NO
Energy 1.69E-02 MJ 1970 Ecoinvent data V2.2 (2010) Norway
electricity, hydropower, at pumped storage power plant, PO
Energy 4.47E-01 MJ 1970 Ecoinvent data V2.2 (2010) Poland
electricity, hydropower, at pumped storage power plant, PT
Energy 2.43E-01 MJ 1970 Ecoinvent data V2.2 (2010) Portugal
electricity, hydropower, at pumped storage power plant, RS
Energy 3.56E-01 MJ 1970 Ecoinvent data V2.2 (2010) Serbia and Montenegro
electricity, hydropower, at pumped storage power plant, SE
Energy 3.72E-02 MJ 1970 Ecoinvent data V2.2 (2010) Sweden
electricity, hydropower, at pumped storage power plant, SI
Energy 1.75E-01 MJ 1970 Ecoinvent data V2.2 (2010) Slovenia
electricity, hydropower, at pumped storage power plant, SK
Energy 1.86E-01 MJ 1970 Ecoinvent data V2.2 (2010) Slovakia
electricity, hydropower, at pumped storage power plant, USA
Energy 3.05E-01 MJ 1970 Ecoinvent data V2.2 (2010) United States
electricity, hydropower, at reservoir power plant, alpine region
Energy 1.60E-03 MJ 1970 Ecoinvent data V2.2 (2010) Europe
electricity, hydropower, at reservoir power plant, BR
Energy 4.41E-02 MJ 2005 Ecoinvent data V2.2 (2010) Brazil
electricity, hydropower, at reservoir power plant, CH
Energy 1.47E-03 MJ 2000 Ecoinvent data V2.2 (2010) Switzerland
electricity, hydropower, at reservoir power plant, FI
Energy 1.14E-02 MJ 1970 Ecoinvent data V2.2 (2010) Finland
electricity, hydropower, at reservoir power plant, non alpine regions
Energy 3.48E-03 MJ 2000 Ecoinvent data V2.2 (2010) Europe
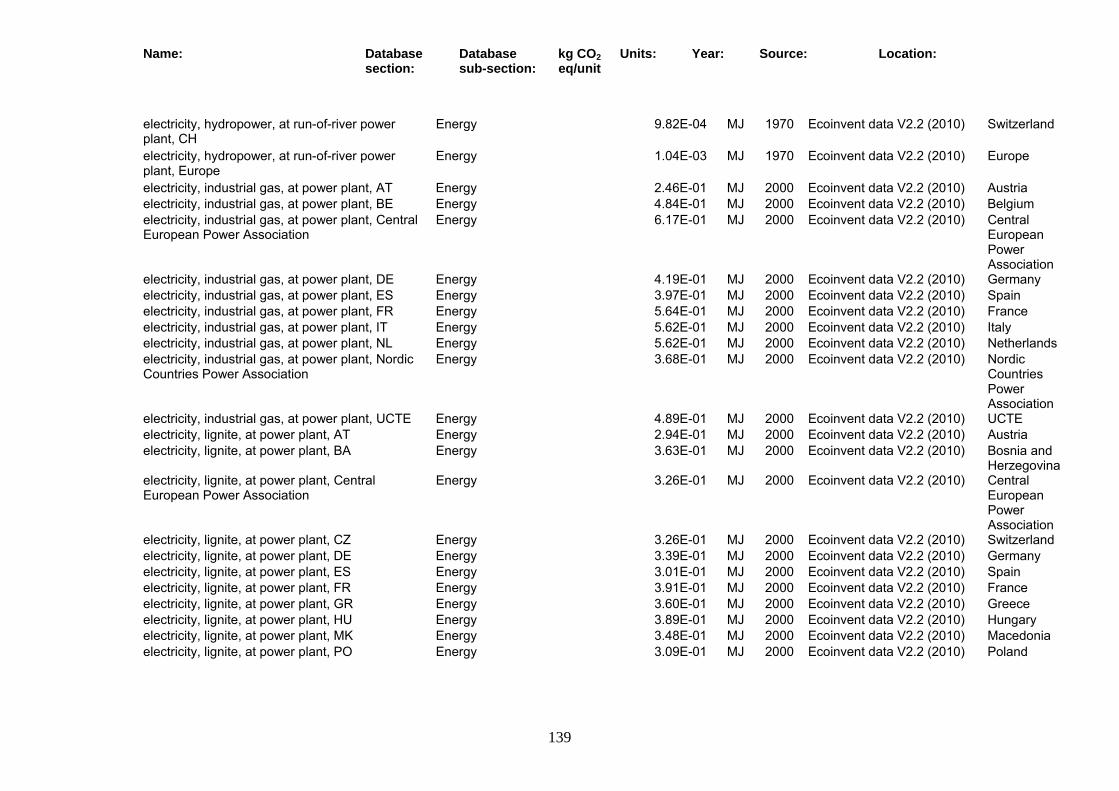
Name: Database section:
Database sub-section:
kg CO2 eq/unit
Units: Year: Source: Location:
139
electricity, hydropower, at run-of-river power plant, CH
Energy 9.82E-04 MJ 1970 Ecoinvent data V2.2 (2010) Switzerland
electricity, hydropower, at run-of-river power plant, Europe
Energy 1.04E-03 MJ 1970 Ecoinvent data V2.2 (2010) Europe
electricity, industrial gas, at power plant, AT Energy 2.46E-01 MJ 2000 Ecoinvent data V2.2 (2010) Austria electricity, industrial gas, at power plant, BE Energy 4.84E-01 MJ 2000 Ecoinvent data V2.2 (2010) Belgium electricity, industrial gas, at power plant, Central European Power Association
Energy 6.17E-01 MJ 2000 Ecoinvent data V2.2 (2010) Central European Power Association
electricity, industrial gas, at power plant, DE Energy 4.19E-01 MJ 2000 Ecoinvent data V2.2 (2010) Germany electricity, industrial gas, at power plant, ES Energy 3.97E-01 MJ 2000 Ecoinvent data V2.2 (2010) Spain electricity, industrial gas, at power plant, FR Energy 5.64E-01 MJ 2000 Ecoinvent data V2.2 (2010) France electricity, industrial gas, at power plant, IT Energy 5.62E-01 MJ 2000 Ecoinvent data V2.2 (2010) Italy electricity, industrial gas, at power plant, NL Energy 5.62E-01 MJ 2000 Ecoinvent data V2.2 (2010) Netherlands electricity, industrial gas, at power plant, Nordic Countries Power Association
Energy 3.68E-01 MJ 2000 Ecoinvent data V2.2 (2010) Nordic Countries Power Association
electricity, industrial gas, at power plant, UCTE Energy 4.89E-01 MJ 2000 Ecoinvent data V2.2 (2010) UCTE electricity, lignite, at power plant, AT Energy 2.94E-01 MJ 2000 Ecoinvent data V2.2 (2010) Austria electricity, lignite, at power plant, BA Energy 3.63E-01 MJ 2000 Ecoinvent data V2.2 (2010) Bosnia and
Herzegovina electricity, lignite, at power plant, Central European Power Association
Energy 3.26E-01 MJ 2000 Ecoinvent data V2.2 (2010) Central European Power Association
electricity, lignite, at power plant, CZ Energy 3.26E-01 MJ 2000 Ecoinvent data V2.2 (2010) Switzerland electricity, lignite, at power plant, DE Energy 3.39E-01 MJ 2000 Ecoinvent data V2.2 (2010) Germany electricity, lignite, at power plant, ES Energy 3.01E-01 MJ 2000 Ecoinvent data V2.2 (2010) Spain electricity, lignite, at power plant, FR Energy 3.91E-01 MJ 2000 Ecoinvent data V2.2 (2010) France electricity, lignite, at power plant, GR Energy 3.60E-01 MJ 2000 Ecoinvent data V2.2 (2010) Greece electricity, lignite, at power plant, HU Energy 3.89E-01 MJ 2000 Ecoinvent data V2.2 (2010) Hungary electricity, lignite, at power plant, MK Energy 3.48E-01 MJ 2000 Ecoinvent data V2.2 (2010) Macedonia electricity, lignite, at power plant, PO Energy 3.09E-01 MJ 2000 Ecoinvent data V2.2 (2010) Poland
Name: Database section:
Database sub-section:
kg CO2 eq/unit
Units: Year: Source: Location:
140
electricity, lignite, at power plant, RS Energy 3.72E-01 MJ 2000 Ecoinvent data V2.2 (2010) Serbia and Montenegro
electricity, lignite, at power plant, SI Energy 3.31E-01 MJ 2000 Ecoinvent data V2.2 (2010) Slovenia electricity, lignite, at power plant, SK Energy 4.70E-01 MJ 2000 Ecoinvent data V2.2 (2010) Slovakia electricity, lignite, at power plant, UCTE Energy 3.42E-01 MJ 2000 Ecoinvent data V2.2 (2010) UCTE electricity, low voltage, at grid, AT Energy 1.23E-01 MJ 2004 Ecoinvent data V2.2 (2010) Austria electricity, low voltage, at grid, BA Energy 2.60E-01 MJ 2004 Ecoinvent data V2.2 (2010) Bosnia and
Herzegovina electricity, low voltage, at grid, BE Energy 1.02E-01 MJ 2004 Ecoinvent data V2.2 (2010) Belgium electricity, low voltage, at grid, BG Energy 2.19E-01 MJ 2004 Ecoinvent data V2.2 (2010) Bulgaria electricity, low voltage, at grid, BR Energy 8.06E-02 MJ 2004 Ecoinvent data V2.2 (2010) Brazil electricity, low voltage, at grid, CH Energy 4.13E-02 MJ 2007 Ecoinvent data V2.2 (2010) Switzerland electricity, low voltage, at grid, CN Energy 4.17E-01 MJ 2005 Ecoinvent data V2.2 (2010) China electricity, low voltage, at grid, CZ Energy 2.57E-01 MJ 2004 Ecoinvent data V2.2 (2010) Switzerland electricity, low voltage, at grid, DE Energy 2.00E-01 MJ 2004 Ecoinvent data V2.2 (2010) Germany electricity, low voltage, at grid, DK Energy 1.73E-01 MJ 2004 Ecoinvent data V2.2 (2010) Denmark electricity, low voltage, at grid, ES Energy 1.65E-01 MJ 2004 Ecoinvent data V2.2 (2010) Spain electricity, low voltage, at grid, FI Energy 1.39E-01 MJ 2004 Ecoinvent data V2.2 (2010) Finland electricity, low voltage, at grid, FR Energy 2.99E-02 MJ 2004 Ecoinvent data V2.2 (2010) France electricity, low voltage, at grid, GB Energy 1.90E-01 MJ 2004 Ecoinvent data V2.2 (2010) United
Kingdom electricity, low voltage, at grid, GR Energy 3.18E-01 MJ 2004 Ecoinvent data V2.2 (2010) Greece electricity, low voltage, at grid, HR Energy 1.65E-01 MJ 2004 Ecoinvent data V2.2 (2010) Croatia electricity, low voltage, at grid, HU Energy 2.08E-01 MJ 2004 Ecoinvent data V2.2 (2010) Hungary electricity, low voltage, at grid, IE Energy 2.46E-01 MJ 2004 Ecoinvent data V2.2 (2010) Ireland electricity, low voltage, at grid, IT Energy 1.78E-01 MJ 2004 Ecoinvent data V2.2 (2010) Italy electricity, low voltage, at grid, JP Energy 1.64E-01 MJ 2004 Ecoinvent data V2.2 (2010) Japan electricity, low voltage, at grid, LU Energy 1.78E-01 MJ 2004 Ecoinvent data V2.2 (2010) Luxembourg electricity, low voltage, at grid, MK Energy 3.54E-01 MJ 2004 Ecoinvent data V2.2 (2010) Macedonia electricity, low voltage, at grid, NL Energy 2.02E-01 MJ 2004 Ecoinvent data V2.2 (2010) Netherlands electricity, low voltage, at grid, NO Energy 1.23E-02 MJ 2004 Ecoinvent data V2.2 (2010) Norway electricity, low voltage, at grid, PO Energy 3.31E-01 MJ 2004 Ecoinvent data V2.2 (2010) Poland electricity, low voltage, at grid, PT Energy 1.93E-01 MJ 2004 Ecoinvent data V2.2 (2010) Portugal electricity, low voltage, at grid, RO Energy 2.24E-01 MJ 2004 Ecoinvent data V2.2 (2010) Romania electricity, low voltage, at grid, RS Energy 3.19E-01 MJ 2004 Ecoinvent data V2.2 (2010) Serbia and
Name: Database section:
Database sub-section:
kg CO2 eq/unit
Units: Year: Source: Location:
141
Montenegro electricity, low voltage, at grid, SE Energy 2.83E-02 MJ 2004 Ecoinvent data V2.2 (2010) Sweden electricity, low voltage, at grid, SI Energy 1.35E-01 MJ 2004 Ecoinvent data V2.2 (2010) Slovenia electricity, low voltage, at grid, SK Energy 1.40E-01 MJ 2004 Ecoinvent data V2.2 (2010) Slovakia electricity, low voltage, at grid, USA Energy 2.33E-01 MJ 2004 Ecoinvent data V2.2 (2010) United States electricity, low voltage, certified electricity, at grid Energy 4.08E-03 MJ 2007 Ecoinvent data V2.2 (2010) Switzerland
electricity, low voltage, consumer mix, at grid Energy 3.81E-02 MJ 2007 Ecoinvent data V2.2 (2010) Switzerland electricity, low voltage, production CENTREL, at grid
Energy 2.96E-01 MJ 2004 Ecoinvent data V2.2 (2010) Central European Power Association
electricity, low voltage, production NORDEL, at grid
Energy 5.30E-02 MJ 2004 Ecoinvent data V2.2 (2010) Nordic Countries Power Association
electricity, low voltage, production UCTE, at grid Energy 1.65E-01 MJ 2004 Ecoinvent data V2.2 (2010) UCTE
electricity, low voltage, production, AT, at grid Energy 9.86E-02 MJ 2004 Ecoinvent data V2.2 (2010) Austria electricity, low voltage, production, BA, at grid Energy 2.64E-01 MJ 2004 Ecoinvent data V2.2 (2010) Bosnia and
Herzegovina electricity, low voltage, production, BE, at grid Energy 1.01E-01 MJ 2004 Ecoinvent data V2.2 (2010) Belgium electricity, low voltage, production, BG, at grid Energy 2.19E-01 MJ 2004 Ecoinvent data V2.2 (2010) Bulgaria electricity, low voltage, production, BR, at grid Energy 8.29E-02 MJ 2004 Ecoinvent data V2.2 (2010) Brazil electricity, low voltage, production, CH, at grid Energy 8.30E-03 MJ 2004 Ecoinvent data V2.2 (2010) Switzerland electricity, low voltage, production, CZ, at grid Energy 2.45E-01 MJ 2004 Ecoinvent data V2.2 (2010) Switzerland electricity, low voltage, production, DE, at grid Energy 2.07E-01 MJ 2004 Ecoinvent data V2.2 (2010) Germany electricity, low voltage, production, DK, at grid Energy 1.92E-01 MJ 2004 Ecoinvent data V2.2 (2010) Denmark electricity, low voltage, production, ES, at grid Energy 1.68E-01 MJ 2004 Ecoinvent data V2.2 (2010) Spain electricity, low voltage, production, Europe, at grid
Energy 1.56E-01 MJ 2004 Ecoinvent data V2.2 (2010) Europe
electricity, low voltage, production, FI, at grid Energy 1.21E-01 MJ 2004 Ecoinvent data V2.2 (2010) Finland electricity, low voltage, production, FR, at grid Energy 2.93E-02 MJ 2004 Ecoinvent data V2.2 (2010) France electricity, low voltage, production, GR, at grid Energy 3.27E-01 MJ 2004 Ecoinvent data V2.2 (2010) Greece electricity, low voltage, production, HR, at grid Energy 1.17E-01 MJ 2004 Ecoinvent data V2.2 (2010) Croatia
Name: Database section:
Database sub-section:
kg CO2 eq/unit
Units: Year: Source: Location:
142
electricity, low voltage, production, HU, at grid Energy 2.31E-01 MJ 2004 Ecoinvent data V2.2 (2010) Hungary electricity, low voltage, production, IE, at grid Energy 2.49E-01 MJ 2004 Ecoinvent data V2.2 (2010) Ireland electricity, low voltage, production, IT, at grid Energy 1.99E-01 MJ 2004 Ecoinvent data V2.2 (2010) Italy electricity, low voltage, production, LU, at grid Energy 1.67E-01 MJ 2004 Ecoinvent data V2.2 (2010) Luxembourg electricity, low voltage, production, MK, at grid Energy 3.58E-01 MJ 2004 Ecoinvent data V2.2 (2010) Macedonia electricity, low voltage, production, NL, at grid Energy 2.06E-01 MJ 2004 Ecoinvent data V2.2 (2010) Netherlands electricity, low voltage, production, NO, at grid Energy 4.97E-03 MJ 2004 Ecoinvent data V2.2 (2010) Norway electricity, low voltage, production, PO, at grid Energy 3.79E-01 MJ 2004 Ecoinvent data V2.2 (2010) Poland electricity, low voltage, production, PT, at grid Energy 1.98E-01 MJ 2004 Ecoinvent data V2.2 (2010) Portugal electricity, low voltage, production, RO, at grid Energy 2.23E-01 MJ 2004 Ecoinvent data V2.2 (2010) Romania electricity, low voltage, production, RS, at grid Energy 3.33E-01 MJ 2004 Ecoinvent data V2.2 (2010) Serbia and
Montenegro electricity, low voltage, production, SE, at grid Energy 1.42E-02 MJ 2004 Ecoinvent data V2.2 (2010) Sweden electricity, low voltage, production, SI, at grid Energy 1.55E-01 MJ 2004 Ecoinvent data V2.2 (2010) Slovenia electricity, low voltage, production, SK, at grid Energy 1.14E-01 MJ 2004 Ecoinvent data V2.2 (2010) Slovakia electricity, low voltage, production, UK, at grid Energy 1.94E-01 MJ 2004 Ecoinvent data V2.2 (2010) United
Kingdom electricity, medium voltage, aluminium industry, at grid
Energy 9.67E-02 MJ 2004 Ecoinvent data V2.2 (2010) Global
electricity, medium voltage, at grid, AT Energy 1.11E-01 MJ 2004 Ecoinvent data V2.2 (2010) Austria electricity, medium voltage, at grid, BA Energy 1.95E-01 MJ 2004 Ecoinvent data V2.2 (2010) Bosnia and
Herzegovina electricity, medium voltage, at grid, BE Energy 9.44E-02 MJ 2004 Ecoinvent data V2.2 (2010) Belgium electricity, medium voltage, at grid, BG Energy 1.73E-01 MJ 2004 Ecoinvent data V2.2 (2010) Bulgaria electricity, medium voltage, at grid, BR Energy 6.34E-02 MJ 2004 Ecoinvent data V2.2 (2010) Brazil electricity, medium voltage, at grid, CH Energy 3.64E-02 MJ 2007 Ecoinvent data V2.2 (2010) Switzerland electricity, medium voltage, at grid, CN Energy 3.27E-01 MJ 2005 Ecoinvent data V2.2 (2010) China electricity, medium voltage, at grid, CZ Energy 2.27E-01 MJ 2004 Ecoinvent data V2.2 (2010) Switzerland electricity, medium voltage, at grid, DE Energy 1.83E-01 MJ 2004 Ecoinvent data V2.2 (2010) Germany electricity, medium voltage, at grid, DK Energy 1.59E-01 MJ 2004 Ecoinvent data V2.2 (2010) Denmark electricity, medium voltage, at grid, ES Energy 1.44E-01 MJ 2004 Ecoinvent data V2.2 (2010) Spain electricity, medium voltage, at grid, FI Energy 1.25E-01 MJ 2004 Ecoinvent data V2.2 (2010) Finland electricity, medium voltage, at grid, FR Energy 2.63E-02 MJ 2004 Ecoinvent data V2.2 (2010) France electricity, medium voltage, at grid, GB Energy 1.68E-01 MJ 2004 Ecoinvent data V2.2 (2010) United
Kingdom
Name: Database section:
Database sub-section:
kg CO2 eq/unit
Units: Year: Source: Location:
143
electricity, medium voltage, at grid, GR Energy 2.79E-01 MJ 2004 Ecoinvent data V2.2 (2010) Greece electricity, medium voltage, at grid, HR Energy 1.35E-01 MJ 2004 Ecoinvent data V2.2 (2010) Croatia electricity, medium voltage, at grid, HU Energy 1.78E-01 MJ 2004 Ecoinvent data V2.2 (2010) Hungary electricity, medium voltage, at grid, IE Energy 2.19E-01 MJ 2004 Ecoinvent data V2.2 (2010) Ireland electricity, medium voltage, at grid, IT Energy 1.62E-01 MJ 2004 Ecoinvent data V2.2 (2010) Italy electricity, medium voltage, at grid, JP Energy 1.52E-01 MJ 2004 Ecoinvent data V2.2 (2010) Japan electricity, medium voltage, at grid, LU Energy 1.60E-01 MJ 2004 Ecoinvent data V2.2 (2010) Luxembourg electricity, medium voltage, at grid, MK Energy 2.77E-01 MJ 2004 Ecoinvent data V2.2 (2010) Macedonia electricity, medium voltage, at grid, NL Energy 1.90E-01 MJ 2004 Ecoinvent data V2.2 (2010) Netherlands electricity, medium voltage, at grid, NO Energy 1.01E-02 MJ 2004 Ecoinvent data V2.2 (2010) Norway electricity, medium voltage, at grid, PO Energy 3.12E-01 MJ 2004 Ecoinvent data V2.2 (2010) Poland electricity, medium voltage, at grid, PT Energy 1.71E-01 MJ 2004 Ecoinvent data V2.2 (2010) Portugal electricity, medium voltage, at grid, RO Energy 1.89E-01 MJ 2004 Ecoinvent data V2.2 (2010) Romania electricity, medium voltage, at grid, RS Energy 2.53E-01 MJ 2004 Ecoinvent data V2.2 (2010) Serbia and
Montenegro electricity, medium voltage, at grid, SE Energy 2.44E-02 MJ 2004 Ecoinvent data V2.2 (2010) Sweden electricity, medium voltage, at grid, SI Energy 1.22E-01 MJ 2004 Ecoinvent data V2.2 (2010) Slovenia electricity, medium voltage, at grid, SK Energy 1.29E-01 MJ 2004 Ecoinvent data V2.2 (2010) Slovakia electricity, medium voltage, at grid, USA Energy 2.14E-01 MJ 2004 Ecoinvent data V2.2 (2010) United States electricity, medium voltage, certified electricity, at grid
Energy 2.74E-03 MJ 2007 Ecoinvent data V2.2 (2010) Switzerland
electricity, medium voltage, consumer mix, at grid Energy 3.36E-02 MJ 2007 Ecoinvent data V2.2 (2010) Switzerland
electricity, medium voltage, production CENTREL, at grid
Energy 2.57E-01 MJ 2004 Ecoinvent data V2.2 (2010) Central European Power Association
electricity, medium voltage, production NORDEL, at grid
Energy 4.74E-02 MJ 2004 Ecoinvent data V2.2 (2010) Nordic Countries Power Association
electricity, medium voltage, production UCTE, at grid
Energy 1.48E-01 MJ 2004 Ecoinvent data V2.2 (2010) UCTE
electricity, medium voltage, production, AT, at grid
Energy 8.90E-02 MJ 2004 Ecoinvent data V2.2 (2010) Austria
Name: Database section:
Database sub-section:
kg CO2 eq/unit
Units: Year: Source: Location:
144
electricity, medium voltage, production, BA, at grid
Energy 1.98E-01 MJ 2004 Ecoinvent data V2.2 (2010) Bosnia and Herzegovina
electricity, medium voltage, production, BE, at grid
Energy 9.37E-02 MJ 2004 Ecoinvent data V2.2 (2010) Belgium
electricity, medium voltage, production, BG, at grid
Energy 1.72E-01 MJ 2004 Ecoinvent data V2.2 (2010) Bulgaria
electricity, medium voltage, production, BR, at grid
Energy 6.53E-02 MJ 2004 Ecoinvent data V2.2 (2010) Brazil
electricity, medium voltage, production, CH, at grid
Energy 6.56E-03 MJ 2004 Ecoinvent data V2.2 (2010) Switzerland
electricity, medium voltage, production, CZ, at grid
Energy 2.17E-01 MJ 2004 Ecoinvent data V2.2 (2010) Switzerland
electricity, medium voltage, production, DE, at grid
Energy 1.89E-01 MJ 2004 Ecoinvent data V2.2 (2010) Germany
electricity, medium voltage, production, DK, at grid
Energy 1.78E-01 MJ 2004 Ecoinvent data V2.2 (2010) Denmark
electricity, medium voltage, production, ES, at grid
Energy 1.46E-01 MJ 2004 Ecoinvent data V2.2 (2010) Spain
electricity, medium voltage, production, Europe, at grid
Energy 1.40E-01 MJ 2004 Ecoinvent data V2.2 (2010) Europe
electricity, medium voltage, production, FI, at grid Energy 1.09E-01 MJ 2004 Ecoinvent data V2.2 (2010) Finland
electricity, medium voltage, production, FR, at grid
Energy 2.57E-02 MJ 2004 Ecoinvent data V2.2 (2010) France
electricity, medium voltage, production, GR, at grid
Energy 2.86E-01 MJ 2004 Ecoinvent data V2.2 (2010) Greece
electricity, medium voltage, production, HR, at grid
Energy 9.60E-02 MJ 2004 Ecoinvent data V2.2 (2010) Croatia
electricity, medium voltage, production, HU, at grid
Energy 1.98E-01 MJ 2004 Ecoinvent data V2.2 (2010) Hungary
electricity, medium voltage, production, IE, at grid Energy 2.22E-01 MJ 2004 Ecoinvent data V2.2 (2010) Ireland
electricity, medium voltage, production, IT, at grid Energy 1.81E-01 MJ 2004 Ecoinvent data V2.2 (2010) Italy
Name: Database section:
Database sub-section:
kg CO2 eq/unit
Units: Year: Source: Location:
145
electricity, medium voltage, production, LU, at grid
Energy 1.50E-01 MJ 2004 Ecoinvent data V2.2 (2010) Luxembourg
electricity, medium voltage, production, MK, at grid
Energy 2.80E-01 MJ 2004 Ecoinvent data V2.2 (2010) Macedonia
electricity, medium voltage, production, NL, at grid
Energy 1.94E-01 MJ 2004 Ecoinvent data V2.2 (2010) Netherlands
electricity, medium voltage, production, NO, at grid
Energy 3.52E-03 MJ 2004 Ecoinvent data V2.2 (2010) Norway
electricity, medium voltage, production, PO, at grid
Energy 3.23E-01 MJ 2004 Ecoinvent data V2.2 (2010) Poland
electricity, medium voltage, production, PT, at grid
Energy 1.75E-01 MJ 2004 Ecoinvent data V2.2 (2010) Portugal
electricity, medium voltage, production, RO, at grid
Energy 1.88E-01 MJ 2004 Ecoinvent data V2.2 (2010) Romania
electricity, medium voltage, production, RS, at grid
Energy 2.64E-01 MJ 2004 Ecoinvent data V2.2 (2010) Serbia and Montenegro
electricity, medium voltage, production, SE, at grid
Energy 1.18E-02 MJ 2004 Ecoinvent data V2.2 (2010) Sweden
electricity, medium voltage, production, SI, at grid Energy 1.40E-01 MJ 2004 Ecoinvent data V2.2 (2010) Slovenia
electricity, medium voltage, production, SK, at grid
Energy 1.05E-01 MJ 2004 Ecoinvent data V2.2 (2010) Slovakia
electricity, medium voltage, production, UK, at grid
Energy 1.72E-01 MJ 2004 Ecoinvent data V2.2 (2010) United Kingdom
electricity, natural gas, allocation exergy, at micro gas turbine 100kWe
Energy 1.96E-01 MJ 2005 Ecoinvent data V2.2 (2010) Switzerland
electricity, natural gas, allocation exergy, at PEM fuel cell 2kWe, future
Energy 2.00E-01 MJ 2005 Ecoinvent data V2.2 (2010) Switzerland
electricity, natural gas, allocation exergy, at SOFC fuel cell 125kWe, future
Energy 1.39E-01 MJ 2005 Ecoinvent data V2.2 (2010) Switzerland
electricity, natural gas, allocation exergy, at SOFC-GT fuel cell 180kWe, future
Energy 1.18E-01 MJ 2005 Ecoinvent data V2.2 (2010) Switzerland
electricity, natural gas, at combined cycle plant, best technology
Energy 1.18E-01 MJ 2002 Ecoinvent data V2.2 (2010) Europe
Name: Database section:
Database sub-section:
kg CO2 eq/unit
Units: Year: Source: Location:
146
electricity, natural gas, at power plant, Alaska Systems Coordinating Council, US
Energy 2.27E-01 MJ 2004 Ecoinvent data V2.2 (2010) Alaska Systems Coordinating Council, US
electricity, natural gas, at power plant, AT Energy 2.24E-01 MJ 2000 Ecoinvent data V2.2 (2010) Austria electricity, natural gas, at power plant, BE Energy 1.46E-01 MJ 2000 Ecoinvent data V2.2 (2010) Belgium electricity, natural gas, at power plant, Central European Power Association
Energy 2.54E-01 MJ 2000 Ecoinvent data V2.2 (2010) Central European Power Association
electricity, natural gas, at power plant, DE Energy 1.56E-01 MJ 2000 Ecoinvent data V2.2 (2010) Germany electricity, natural gas, at power plant, Electric Reliability Council of Texas, US
Energy 1.85E-01 MJ 2004 Ecoinvent data V2.2 (2010) Electric Reliability Council of Texas, US
electricity, natural gas, at power plant, ES Energy 1.43E-01 MJ 2000 Ecoinvent data V2.2 (2010) Spain electricity, natural gas, at power plant, Florida Reliability Coordinating Council, US
Energy 2.59E-01 MJ 2004 Ecoinvent data V2.2 (2010) Florida Reliability Coordinating Council, US
electricity, natural gas, at power plant, FR Energy 1.35E-01 MJ 2000 Ecoinvent data V2.2 (2010) France electricity, natural gas, at power plant, GB Energy 1.34E-01 MJ 2000 Ecoinvent data V2.2 (2010) United
Kingdom electricity, natural gas, at power plant, IT Energy 1.83E-01 MJ 2000 Ecoinvent data V2.2 (2010) Italy electricity, natural gas, at power plant, JP Energy 1.92E-01 MJ 2005 Ecoinvent data V2.2 (2010) Japan electricity, natural gas, at power plant, LU Energy 2.77E-01 MJ 2000 Ecoinvent data V2.2 (2010) Luxembourg electricity, natural gas, at power plant, Midwest Reliability Organization, US
Energy 2.30E-01 MJ 2004 Ecoinvent data V2.2 (2010) Midwest Reliability Organization, US
electricity, natural gas, at power plant, NL Energy 1.63E-01 MJ 2000 Ecoinvent data V2.2 (2010) Netherlands electricity, natural gas, at power plant, Nordic Countries Power Association
Energy 1.66E-01 MJ 2000 Ecoinvent data V2.2 (2010) Nordic Countries Power Association
Name: Database section:
Database sub-section:
kg CO2 eq/unit
Units: Year: Source: Location:
147
electricity, natural gas, at power plant, Northeast Power Coordinating Council, US
Energy 1.90E-01 MJ 2004 Ecoinvent data V2.2 (2010) Norwayrtheast Power Coordinating Council, US
electricity, natural gas, at power plant, Reliability First Corporation, US
Energy 1.97E-01 MJ 2004 Ecoinvent data V2.2 (2010) Reliability First Corporation, US
electricity, natural gas, at power plant, SERC Reliability Corporation, US
Energy 1.85E-01 MJ 2004 Ecoinvent data V2.2 (2010) SERC Reliability Corporation, US
electricity, natural gas, at power plant, Southwest Power Pool, US
Energy 1.83E-01 MJ 2004 Ecoinvent data V2.2 (2010) Southwest Power Pool, US
electricity, natural gas, at power plant, UCTE Energy 1.79E-01 MJ 2000 Ecoinvent data V2.2 (2010) UCTE electricity, natural gas, at power plant, USA Energy 1.90E-01 MJ 2004 Ecoinvent data V2.2 (2010) United States electricity, natural gas, at power plant, Western Electricity Coordinating Council, US
Energy 1.88E-01 MJ 2004 Ecoinvent data V2.2 (2010) Western Electricity Coordinating Council, US
electricity, natural gas, at turbine, 10MW Energy 2.03E-01 MJ 2000 Ecoinvent data V2.2 (2010) Global electricity, nuclear, at power plant boiling water reactor, CH
Energy 2.94E-03 MJ 2002 Ecoinvent data V2.2 (2010) Switzerland
electricity, nuclear, at power plant boiling water reactor, DE
Energy 2.88E-03 MJ 1999 Ecoinvent data V2.2 (2010) Germany
electricity, nuclear, at power plant boiling water reactor, UCTE
Energy 2.10E-03 MJ 1999 Ecoinvent data V2.2 (2010) UCTE
electricity, nuclear, at power plant boiling water reactor, USA
Energy 3.35E-03 MJ 2006 Ecoinvent data V2.2 (2010) United States
electricity, nuclear, at power plant pressure water reactor, CH
Energy 1.47E-03 MJ 2002 Ecoinvent data V2.2 (2010) Switzerland
electricity, nuclear, at power plant pressure water reactor, CN
Energy 3.04E-03 MJ 2003 Ecoinvent data V2.2 (2010) China
electricity, nuclear, at power plant pressure water reactor, DE
Energy 2.65E-03 MJ 1999 Ecoinvent data V2.2 (2010) Germany

Name: Database section:
Database sub-section:
kg CO2 eq/unit
Units: Year: Source: Location:
148
electricity, nuclear, at power plant pressure water reactor, FR
Energy 1.69E-03 MJ 1999 Ecoinvent data V2.2 (2010) France
electricity, nuclear, at power plant pressure water reactor, UCTE
Energy 2.18E-03 MJ 1999 Ecoinvent data V2.2 (2010) UCTE
electricity, nuclear, at power plant pressure water reactor, USA
Energy 3.67E-03 MJ 2006 Ecoinvent data V2.2 (2010) United States
electricity, nuclear, at power plant, CH Energy 2.14E-03 MJ 2002 Ecoinvent data V2.2 (2010) Switzerland electricity, nuclear, at power plant, DE Energy 2.72E-03 MJ 1999 Ecoinvent data V2.2 (2010) Germany electricity, nuclear, at power plant, UCTE Energy 2.17E-03 MJ 1999 Ecoinvent data V2.2 (2010) UCTE electricity, nuclear, at power plant, USA Energy 3.56E-03 MJ 2006 Ecoinvent data V2.2 (2010) United States electricity, nuclear, at pressure water reactor, centrifugal enrichment
Energy 1.48E-03 MJ 2002 Ecoinvent data V2.2 (2010) Switzerland
electricity, oil, at power plant, AT Energy 2.28E-01 MJ 2000 Ecoinvent data V2.2 (2010) Austria electricity, oil, at power plant, BE Energy 2.56E-01 MJ 1995 Ecoinvent data V2.2 (2010) Belgium electricity, oil, at power plant, CZ Energy 3.35E-01 MJ 2000 Ecoinvent data V2.2 (2010) Switzerland electricity, oil, at power plant, DE Energy 3.14E-01 MJ 1996 Ecoinvent data V2.2 (2010) Germany electricity, oil, at power plant, DK Energy 2.28E-01 MJ 1996 Ecoinvent data V2.2 (2010) Denmark electricity, oil, at power plant, ES Energy 2.70E-01 MJ 2000 Ecoinvent data V2.2 (2010) Spain electricity, oil, at power plant, FI Energy 1.45E-01 MJ 2000 Ecoinvent data V2.2 (2010) Finland electricity, oil, at power plant, FR Energy 2.10E-01 MJ 1996 Ecoinvent data V2.2 (2010) France electricity, oil, at power plant, GB Energy 3.20E-01 MJ 2000 Ecoinvent data V2.2 (2010) United
Kingdom electricity, oil, at power plant, GR Energy 2.46E-01 MJ 1985 Ecoinvent data V2.2 (2010) Greece electricity, oil, at power plant, HR Energy 2.68E-01 MJ 2000 Ecoinvent data V2.2 (2010) Croatia electricity, oil, at power plant, HU Energy 2.40E-01 MJ 2000 Ecoinvent data V2.2 (2010) Hungary electricity, oil, at power plant, IE Energy 2.40E-01 MJ 2000 Ecoinvent data V2.2 (2010) Ireland electricity, oil, at power plant, IT Energy 2.45E-01 MJ 2000 Ecoinvent data V2.2 (2010) Italy electricity, oil, at power plant, NL Energy 1.98E-01 MJ 1993 Ecoinvent data V2.2 (2010) Netherlands electricity, oil, at power plant, PT Energy 2.53E-01 MJ 2000 Ecoinvent data V2.2 (2010) Portugal electricity, oil, at power plant, RS Energy 2.72E-01 MJ 2000 Ecoinvent data V2.2 (2010) Serbia and
Montenegro electricity, oil, at power plant, SE Energy 1.68E-01 MJ 2000 Ecoinvent data V2.2 (2010) Sweden electricity, oil, at power plant, SI Energy 2.28E-01 MJ 2000 Ecoinvent data V2.2 (2010) Slovenia electricity, oil, at power plant, SK Energy 2.56E-01 MJ 2000 Ecoinvent data V2.2 (2010) Slovakia electricity, oil, at power plant, UCTE Energy 2.46E-01 MJ 2000 Ecoinvent data V2.2 (2010) UCTE
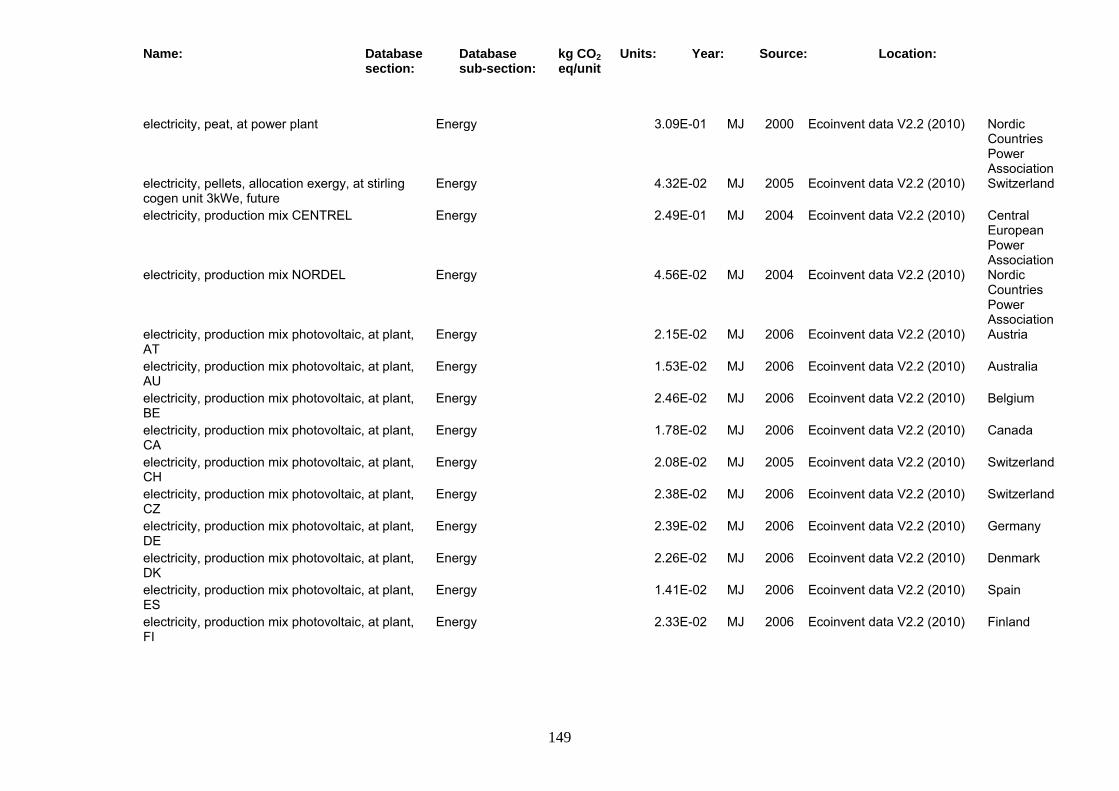
Name: Database section:
Database sub-section:
kg CO2 eq/unit
Units: Year: Source: Location:
149
electricity, peat, at power plant Energy 3.09E-01 MJ 2000 Ecoinvent data V2.2 (2010) Nordic Countries Power Association
electricity, pellets, allocation exergy, at stirling cogen unit 3kWe, future
Energy 4.32E-02 MJ 2005 Ecoinvent data V2.2 (2010) Switzerland
electricity, production mix CENTREL Energy 2.49E-01 MJ 2004 Ecoinvent data V2.2 (2010) Central European Power Association
electricity, production mix NORDEL Energy 4.56E-02 MJ 2004 Ecoinvent data V2.2 (2010) Nordic Countries Power Association
electricity, production mix photovoltaic, at plant, AT
Energy 2.15E-02 MJ 2006 Ecoinvent data V2.2 (2010) Austria
electricity, production mix photovoltaic, at plant, AU
Energy 1.53E-02 MJ 2006 Ecoinvent data V2.2 (2010) Australia
electricity, production mix photovoltaic, at plant, BE
Energy 2.46E-02 MJ 2006 Ecoinvent data V2.2 (2010) Belgium
electricity, production mix photovoltaic, at plant, CA
Energy 1.78E-02 MJ 2006 Ecoinvent data V2.2 (2010) Canada
electricity, production mix photovoltaic, at plant, CH
Energy 2.08E-02 MJ 2005 Ecoinvent data V2.2 (2010) Switzerland
electricity, production mix photovoltaic, at plant, CZ
Energy 2.38E-02 MJ 2006 Ecoinvent data V2.2 (2010) Switzerland
electricity, production mix photovoltaic, at plant, DE
Energy 2.39E-02 MJ 2006 Ecoinvent data V2.2 (2010) Germany
electricity, production mix photovoltaic, at plant, DK
Energy 2.26E-02 MJ 2006 Ecoinvent data V2.2 (2010) Denmark
electricity, production mix photovoltaic, at plant, ES
Energy 1.41E-02 MJ 2006 Ecoinvent data V2.2 (2010) Spain
electricity, production mix photovoltaic, at plant, FI
Energy 2.33E-02 MJ 2006 Ecoinvent data V2.2 (2010) Finland
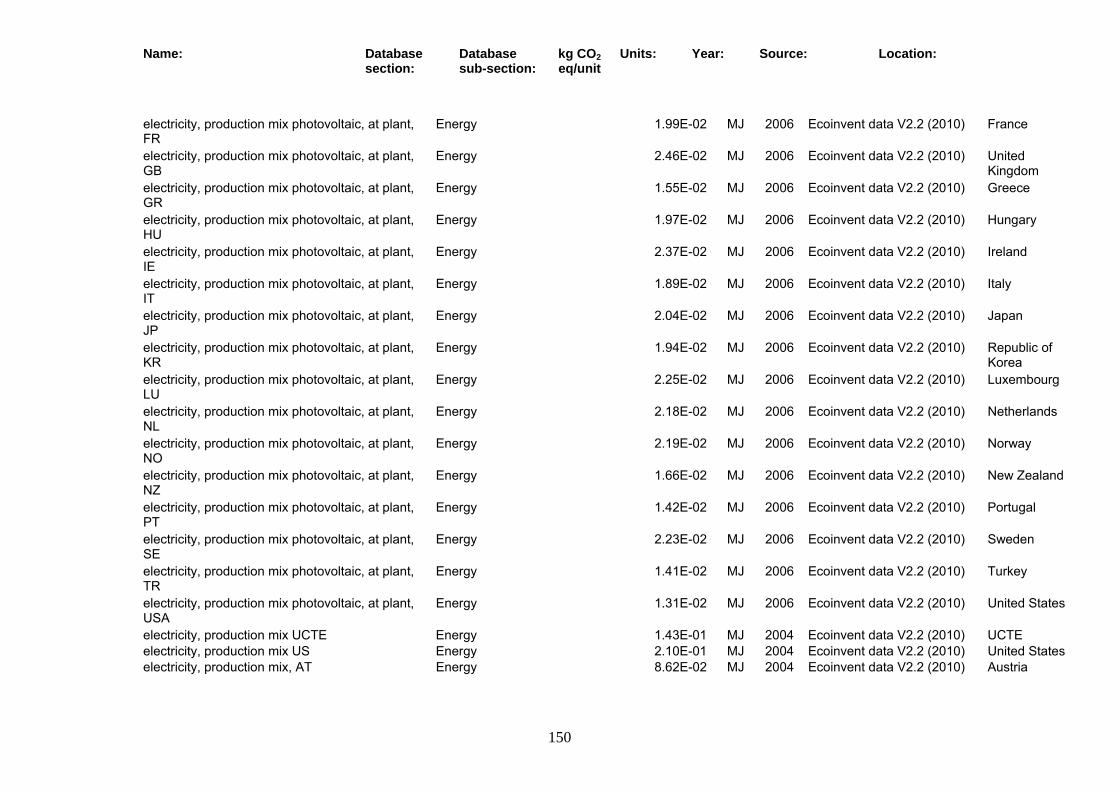
Name: Database section:
Database sub-section:
kg CO2 eq/unit
Units: Year: Source: Location:
150
electricity, production mix photovoltaic, at plant, FR
Energy 1.99E-02 MJ 2006 Ecoinvent data V2.2 (2010) France
electricity, production mix photovoltaic, at plant, GB
Energy 2.46E-02 MJ 2006 Ecoinvent data V2.2 (2010) United Kingdom
electricity, production mix photovoltaic, at plant, GR
Energy 1.55E-02 MJ 2006 Ecoinvent data V2.2 (2010) Greece
electricity, production mix photovoltaic, at plant, HU
Energy 1.97E-02 MJ 2006 Ecoinvent data V2.2 (2010) Hungary
electricity, production mix photovoltaic, at plant, IE
Energy 2.37E-02 MJ 2006 Ecoinvent data V2.2 (2010) Ireland
electricity, production mix photovoltaic, at plant, IT
Energy 1.89E-02 MJ 2006 Ecoinvent data V2.2 (2010) Italy
electricity, production mix photovoltaic, at plant, JP
Energy 2.04E-02 MJ 2006 Ecoinvent data V2.2 (2010) Japan
electricity, production mix photovoltaic, at plant, KR
Energy 1.94E-02 MJ 2006 Ecoinvent data V2.2 (2010) Republic of Korea
electricity, production mix photovoltaic, at plant, LU
Energy 2.25E-02 MJ 2006 Ecoinvent data V2.2 (2010) Luxembourg
electricity, production mix photovoltaic, at plant, NL
Energy 2.18E-02 MJ 2006 Ecoinvent data V2.2 (2010) Netherlands
electricity, production mix photovoltaic, at plant, NO
Energy 2.19E-02 MJ 2006 Ecoinvent data V2.2 (2010) Norway
electricity, production mix photovoltaic, at plant, NZ
Energy 1.66E-02 MJ 2006 Ecoinvent data V2.2 (2010) New Zealand
electricity, production mix photovoltaic, at plant, PT
Energy 1.42E-02 MJ 2006 Ecoinvent data V2.2 (2010) Portugal
electricity, production mix photovoltaic, at plant, SE
Energy 2.23E-02 MJ 2006 Ecoinvent data V2.2 (2010) Sweden
electricity, production mix photovoltaic, at plant, TR
Energy 1.41E-02 MJ 2006 Ecoinvent data V2.2 (2010) Turkey
electricity, production mix photovoltaic, at plant, USA
Energy 1.31E-02 MJ 2006 Ecoinvent data V2.2 (2010) United States
electricity, production mix UCTE Energy 1.43E-01 MJ 2004 Ecoinvent data V2.2 (2010) UCTE electricity, production mix US Energy 2.10E-01 MJ 2004 Ecoinvent data V2.2 (2010) United States electricity, production mix, AT Energy 8.62E-02 MJ 2004 Ecoinvent data V2.2 (2010) Austria

Name: Database section:
Database sub-section:
kg CO2 eq/unit
Units: Year: Source: Location:
151
electricity, production mix, BA Energy 1.86E-01 MJ 2004 Ecoinvent data V2.2 (2010) Bosnia and Herzegovina
electricity, production mix, BE Energy 9.11E-02 MJ 2004 Ecoinvent data V2.2 (2010) Belgium electricity, production mix, BG Energy 1.64E-01 MJ 2004 Ecoinvent data V2.2 (2010) Bulgaria electricity, production mix, BR Energy 6.20E-02 MJ 2004 Ecoinvent data V2.2 (2010) Brazil electricity, production mix, CH Energy 5.49E-03 MJ 2004 Ecoinvent data V2.2 (2010) Switzerland electricity, production mix, CN Energy 3.19E-01 MJ 2004 Ecoinvent data V2.2 (2010) China electricity, production mix, CZ Energy 2.11E-01 MJ 2004 Ecoinvent data V2.2 (2010) Switzerland electricity, production mix, DE Energy 1.84E-01 MJ 2004 Ecoinvent data V2.2 (2010) Germany electricity, production mix, DK Energy 1.74E-01 MJ 2004 Ecoinvent data V2.2 (2010) Denmark electricity, production mix, ES Energy 1.41E-01 MJ 2004 Ecoinvent data V2.2 (2010) Spain electricity, production mix, Europe Energy 1.35E-01 MJ 2004 Ecoinvent data V2.2 (2010) Europe electricity, production mix, FI Energy 1.07E-01 MJ 2004 Ecoinvent data V2.2 (2010) Finland electricity, production mix, FR Energy 2.43E-02 MJ 2004 Ecoinvent data V2.2 (2010) France electricity, production mix, GR Energy 2.78E-01 MJ 2004 Ecoinvent data V2.2 (2010) Greece electricity, production mix, HR Energy 9.16E-02 MJ 2004 Ecoinvent data V2.2 (2010) Croatia electricity, production mix, HU Energy 1.92E-01 MJ 2004 Ecoinvent data V2.2 (2010) Hungary electricity, production mix, IE Energy 2.16E-01 MJ 2004 Ecoinvent data V2.2 (2010) Ireland electricity, production mix, IT Energy 1.76E-01 MJ 2004 Ecoinvent data V2.2 (2010) Italy electricity, production mix, JP Energy 1.48E-01 MJ 2004 Ecoinvent data V2.2 (2010) Japan electricity, production mix, LU Energy 1.46E-01 MJ 2004 Ecoinvent data V2.2 (2010) Luxembourg electricity, production mix, MK Energy 2.66E-01 MJ 2004 Ecoinvent data V2.2 (2010) Macedonia electricity, production mix, NL Energy 1.91E-01 MJ 2004 Ecoinvent data V2.2 (2010) Netherlands electricity, production mix, NO Energy 2.51E-03 MJ 2004 Ecoinvent data V2.2 (2010) Norway electricity, production mix, PO Energy 3.13E-01 MJ 2004 Ecoinvent data V2.2 (2010) Poland electricity, production mix, PT Energy 1.70E-01 MJ 2004 Ecoinvent data V2.2 (2010) Portugal electricity, production mix, RO Energy 1.81E-01 MJ 2004 Ecoinvent data V2.2 (2010) Romania electricity, production mix, RS Energy 2.53E-01 MJ 2004 Ecoinvent data V2.2 (2010) Serbia and
Montenegro electricity, production mix, SE Energy 1.06E-02 MJ 2004 Ecoinvent data V2.2 (2010) Sweden electricity, production mix, SI Energy 1.36E-01 MJ 2004 Ecoinvent data V2.2 (2010) Slovenia electricity, production mix, SK Energy 1.03E-01 MJ 2004 Ecoinvent data V2.2 (2010) Slovakia electricity, production mix, UK Energy 1.66E-01 MJ 2004 Ecoinvent data V2.2 (2010) United
Kingdom
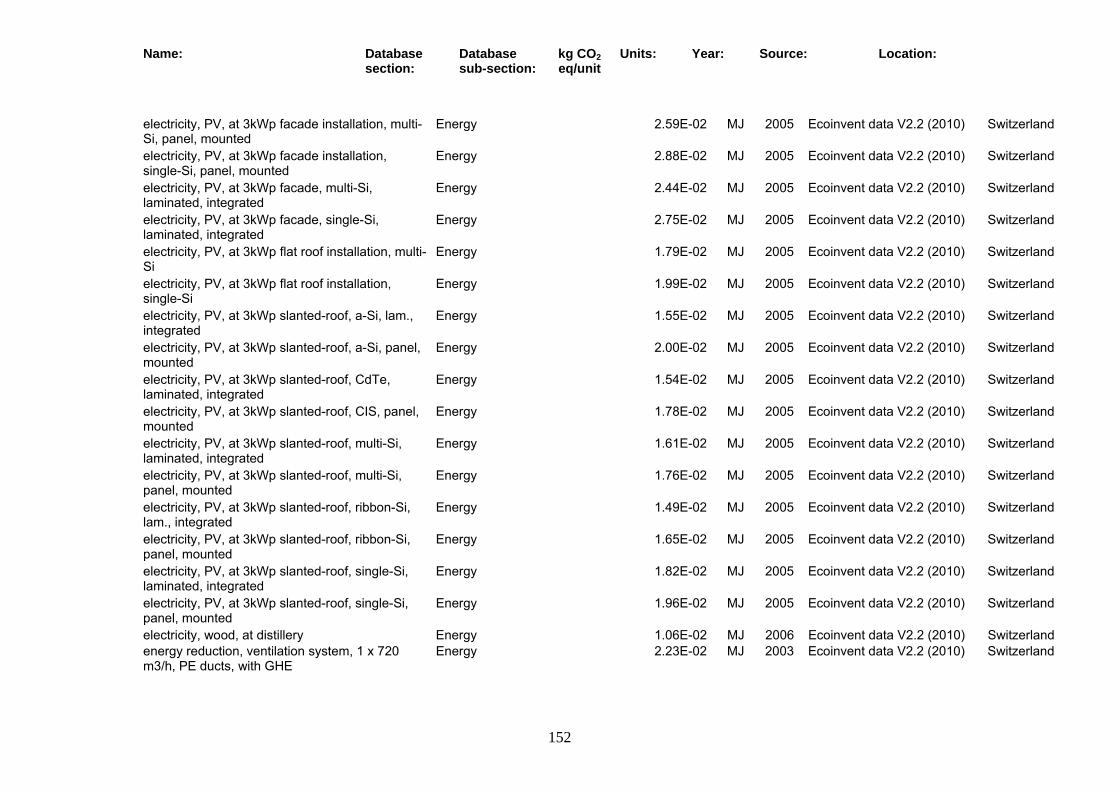
Name: Database section:
Database sub-section:
kg CO2 eq/unit
Units: Year: Source: Location:
152
electricity, PV, at 3kWp facade installation, multi-Si, panel, mounted
Energy 2.59E-02 MJ 2005 Ecoinvent data V2.2 (2010) Switzerland
electricity, PV, at 3kWp facade installation, single-Si, panel, mounted
Energy 2.88E-02 MJ 2005 Ecoinvent data V2.2 (2010) Switzerland
electricity, PV, at 3kWp facade, multi-Si, laminated, integrated
Energy 2.44E-02 MJ 2005 Ecoinvent data V2.2 (2010) Switzerland
electricity, PV, at 3kWp facade, single-Si, laminated, integrated
Energy 2.75E-02 MJ 2005 Ecoinvent data V2.2 (2010) Switzerland
electricity, PV, at 3kWp flat roof installation, multi-Si
Energy 1.79E-02 MJ 2005 Ecoinvent data V2.2 (2010) Switzerland
electricity, PV, at 3kWp flat roof installation, single-Si
Energy 1.99E-02 MJ 2005 Ecoinvent data V2.2 (2010) Switzerland
electricity, PV, at 3kWp slanted-roof, a-Si, lam., integrated
Energy 1.55E-02 MJ 2005 Ecoinvent data V2.2 (2010) Switzerland
electricity, PV, at 3kWp slanted-roof, a-Si, panel, mounted
Energy 2.00E-02 MJ 2005 Ecoinvent data V2.2 (2010) Switzerland
electricity, PV, at 3kWp slanted-roof, CdTe, laminated, integrated
Energy 1.54E-02 MJ 2005 Ecoinvent data V2.2 (2010) Switzerland
electricity, PV, at 3kWp slanted-roof, CIS, panel, mounted
Energy 1.78E-02 MJ 2005 Ecoinvent data V2.2 (2010) Switzerland
electricity, PV, at 3kWp slanted-roof, multi-Si, laminated, integrated
Energy 1.61E-02 MJ 2005 Ecoinvent data V2.2 (2010) Switzerland
electricity, PV, at 3kWp slanted-roof, multi-Si, panel, mounted
Energy 1.76E-02 MJ 2005 Ecoinvent data V2.2 (2010) Switzerland
electricity, PV, at 3kWp slanted-roof, ribbon-Si, lam., integrated
Energy 1.49E-02 MJ 2005 Ecoinvent data V2.2 (2010) Switzerland
electricity, PV, at 3kWp slanted-roof, ribbon-Si, panel, mounted
Energy 1.65E-02 MJ 2005 Ecoinvent data V2.2 (2010) Switzerland
electricity, PV, at 3kWp slanted-roof, single-Si, laminated, integrated
Energy 1.82E-02 MJ 2005 Ecoinvent data V2.2 (2010) Switzerland
electricity, PV, at 3kWp slanted-roof, single-Si, panel, mounted
Energy 1.96E-02 MJ 2005 Ecoinvent data V2.2 (2010) Switzerland
electricity, wood, at distillery Energy 1.06E-02 MJ 2006 Ecoinvent data V2.2 (2010) Switzerland energy reduction, ventilation system, 1 x 720 m3/h, PE ducts, with GHE
Energy 2.23E-02 MJ 2003 Ecoinvent data V2.2 (2010) Switzerland
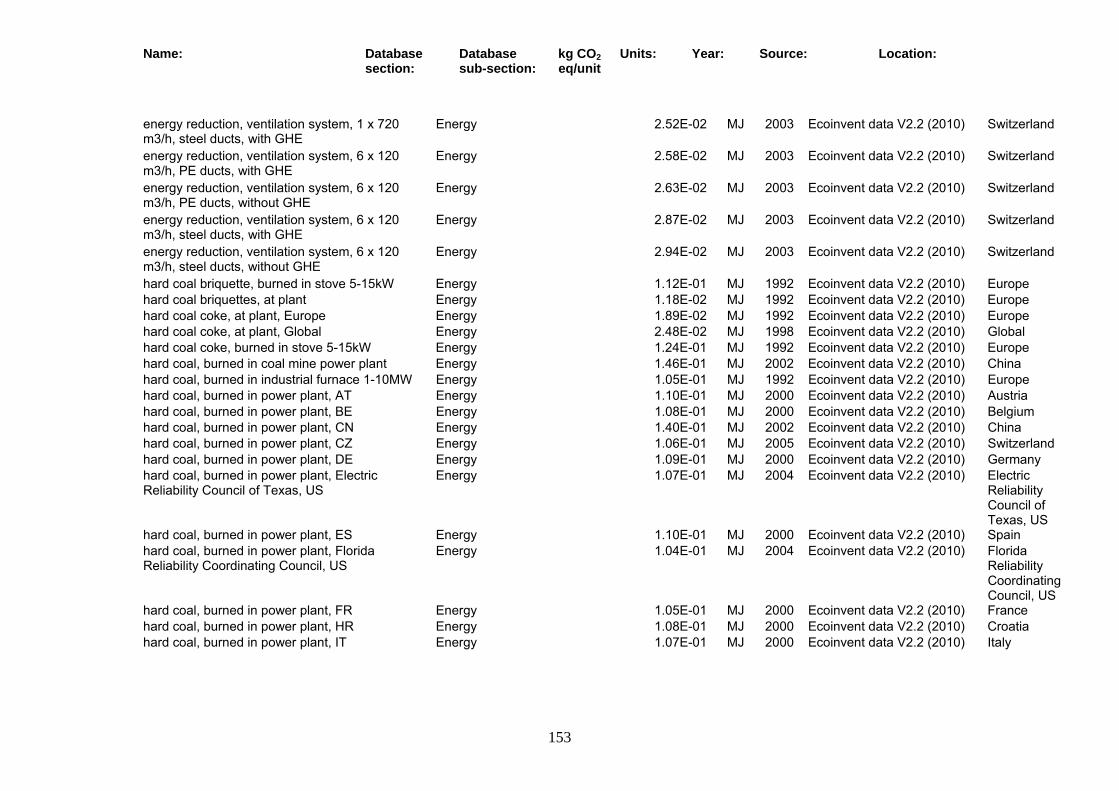
Name: Database section:
Database sub-section:
kg CO2 eq/unit
Units: Year: Source: Location:
153
energy reduction, ventilation system, 1 x 720 m3/h, steel ducts, with GHE
Energy 2.52E-02 MJ 2003 Ecoinvent data V2.2 (2010) Switzerland
energy reduction, ventilation system, 6 x 120 m3/h, PE ducts, with GHE
Energy 2.58E-02 MJ 2003 Ecoinvent data V2.2 (2010) Switzerland
energy reduction, ventilation system, 6 x 120 m3/h, PE ducts, without GHE
Energy 2.63E-02 MJ 2003 Ecoinvent data V2.2 (2010) Switzerland
energy reduction, ventilation system, 6 x 120 m3/h, steel ducts, with GHE
Energy 2.87E-02 MJ 2003 Ecoinvent data V2.2 (2010) Switzerland
energy reduction, ventilation system, 6 x 120 m3/h, steel ducts, without GHE
Energy 2.94E-02 MJ 2003 Ecoinvent data V2.2 (2010) Switzerland
hard coal briquette, burned in stove 5-15kW Energy 1.12E-01 MJ 1992 Ecoinvent data V2.2 (2010) Europe hard coal briquettes, at plant Energy 1.18E-02 MJ 1992 Ecoinvent data V2.2 (2010) Europe hard coal coke, at plant, Europe Energy 1.89E-02 MJ 1992 Ecoinvent data V2.2 (2010) Europe hard coal coke, at plant, Global Energy 2.48E-02 MJ 1998 Ecoinvent data V2.2 (2010) Global hard coal coke, burned in stove 5-15kW Energy 1.24E-01 MJ 1992 Ecoinvent data V2.2 (2010) Europe hard coal, burned in coal mine power plant Energy 1.46E-01 MJ 2002 Ecoinvent data V2.2 (2010) China hard coal, burned in industrial furnace 1-10MW Energy 1.05E-01 MJ 1992 Ecoinvent data V2.2 (2010) Europe hard coal, burned in power plant, AT Energy 1.10E-01 MJ 2000 Ecoinvent data V2.2 (2010) Austria hard coal, burned in power plant, BE Energy 1.08E-01 MJ 2000 Ecoinvent data V2.2 (2010) Belgium hard coal, burned in power plant, CN Energy 1.40E-01 MJ 2002 Ecoinvent data V2.2 (2010) China hard coal, burned in power plant, CZ Energy 1.06E-01 MJ 2005 Ecoinvent data V2.2 (2010) Switzerland hard coal, burned in power plant, DE Energy 1.09E-01 MJ 2000 Ecoinvent data V2.2 (2010) Germany hard coal, burned in power plant, Electric Reliability Council of Texas, US
Energy 1.07E-01 MJ 2004 Ecoinvent data V2.2 (2010) Electric Reliability Council of Texas, US
hard coal, burned in power plant, ES Energy 1.10E-01 MJ 2000 Ecoinvent data V2.2 (2010) Spain hard coal, burned in power plant, Florida Reliability Coordinating Council, US
Energy 1.04E-01 MJ 2004 Ecoinvent data V2.2 (2010) Florida Reliability Coordinating Council, US
hard coal, burned in power plant, FR Energy 1.05E-01 MJ 2000 Ecoinvent data V2.2 (2010) France hard coal, burned in power plant, HR Energy 1.08E-01 MJ 2000 Ecoinvent data V2.2 (2010) Croatia hard coal, burned in power plant, IT Energy 1.07E-01 MJ 2000 Ecoinvent data V2.2 (2010) Italy

Name: Database section:
Database sub-section:
kg CO2 eq/unit
Units: Year: Source: Location:
154
hard coal, burned in power plant, Midwest Reliability Organization, US
Energy 1.07E-01 MJ 2004 Ecoinvent data V2.2 (2010) Midwest Reliability Organization, US
hard coal, burned in power plant, NL Energy 1.06E-01 MJ 2000 Ecoinvent data V2.2 (2010) Netherlands hard coal, burned in power plant, Nordic Countries Power Association
Energy 1.11E-01 MJ 2000 Ecoinvent data V2.2 (2010) Nordic Countries Power Association
hard coal, burned in power plant, Northeast Power Coordinating Council, US
Energy 1.03E-01 MJ 2004 Ecoinvent data V2.2 (2010) Norwayrtheast Power Coordinating Council, US
hard coal, burned in power plant, Poland Energy 1.07E-01 MJ 2005 Ecoinvent data V2.2 (2010) Poland hard coal, burned in power plant, PT Energy 1.03E-01 MJ 2000 Ecoinvent data V2.2 (2010) Portugal hard coal, burned in power plant, Reliability First Corporation, US
Energy 1.04E-01 MJ 2004 Ecoinvent data V2.2 (2010) Reliability First Corporation, US
hard coal, burned in power plant, SERC Reliability Corporation, US
Energy 1.05E-01 MJ 2004 Ecoinvent data V2.2 (2010) SERC Reliability Corporation, US
hard coal, burned in power plant, SK Energy 1.09E-01 MJ 2005 Ecoinvent data V2.2 (2010) Slovakia hard coal, burned in power plant, Southwest Power Pool, US
Energy 1.05E-01 MJ 2004 Ecoinvent data V2.2 (2010) Southwest Power Pool, US
hard coal, burned in power plant, Western Electricity Coordinating Council, US
Energy 1.07E-01 MJ 2004 Ecoinvent data V2.2 (2010) Western Electricity Coordinating Council, US
heat, air-water heat pump 10kW, at heat radiator, CH
Energy 2.58E-02 MJ 2000 Ecoinvent data V2.2 (2010) Switzerland
heat, air-water heat pump 10kW, at heat radiator, Europe
Energy 7.23E-02 MJ 2000 Ecoinvent data V2.2 (2010) Europe
heat, anthracite, at stove 5-15kW Energy 1.53E-01 MJ 1992 Ecoinvent data V2.2 (2010) Europe

Name: Database section:
Database sub-section:
kg CO2 eq/unit
Units: Year: Source: Location:
155
heat, at air-water heat pump 10kW, CH Energy 2.27E-02 MJ 2000 Ecoinvent data V2.2 (2010) Switzerland heat, at air-water heat pump 10kW, Europe Energy 6.70E-02 MJ 2000 Ecoinvent data V2.2 (2010) Europe heat, at cogen 160kWe Jakobsberg, allocation electricity
Energy 1.69E-04 MJ 2000 Ecoinvent data V2.2 (2010) Switzerland
heat, at cogen 160kWe Jakobsberg, allocation energy
Energy 9.57E-02 MJ 2000 Ecoinvent data V2.2 (2010) Switzerland
heat, at cogen 160kWe Jakobsberg, allocation exergy
Energy 3.60E-02 MJ 2000 Ecoinvent data V2.2 (2010) Switzerland
heat, at cogen 160kWe Jakobsberg, allocation heat
Energy 1.49E-01 MJ 2000 Ecoinvent data V2.2 (2010) Switzerland
heat, at cogen 160kWe Jakobsberg, allocation price
Energy 5.24E-02 MJ 2000 Ecoinvent data V2.2 (2010) Switzerland
heat, at cogen 160kWe lambda=1, allocation electricity
Energy 1.50E-04 MJ 2000 Ecoinvent data V2.2 (2010) Switzerland
heat, at cogen 160kWe lambda=1, allocation energy
Energy 8.39E-02 MJ 2000 Ecoinvent data V2.2 (2010) Switzerland
heat, at cogen 160kWe lambda=1, allocation exergy
Energy 3.07E-02 MJ 2000 Ecoinvent data V2.2 (2010) Switzerland
heat, at cogen 160kWe lambda=1, allocation heat
Energy 1.33E-01 MJ 2000 Ecoinvent data V2.2 (2010) Switzerland
heat, at cogen 160kWe lambda=1, allocation price
Energy 4.54E-02 MJ 2000 Ecoinvent data V2.2 (2010) Switzerland
heat, at cogen 1MWe lean burn, allocation energy, CH
Energy 9.25E-02 MJ 2000 Ecoinvent data V2.2 (2010) Switzerland
heat, at cogen 1MWe lean burn, allocation energy, Europe
Energy 9.19E-02 MJ 2000 Ecoinvent data V2.2 (2010) Europe
heat, at cogen 1MWe lean burn, allocation exergy, CH
Energy 2.75E-02 MJ 2000 Ecoinvent data V2.2 (2010) Switzerland
heat, at cogen 1MWe lean burn, allocation exergy, Europe
Energy 2.73E-02 MJ 2000 Ecoinvent data V2.2 (2010) Europe
heat, at cogen 1MWe lean burn, allocation heat, CH
Energy 1.71E-01 MJ 2000 Ecoinvent data V2.2 (2010) Switzerland
heat, at cogen 1MWe lean burn, allocation heat, Europe
Energy 1.70E-01 MJ 2000 Ecoinvent data V2.2 (2010) Europe
Name: Database section:
Database sub-section:
kg CO2 eq/unit
Units: Year: Source: Location:
156
heat, at cogen 200kWe diesel SCR, allocation energy
Energy 1.13E-01 MJ 2000 Ecoinvent data V2.2 (2010) Switzerland
heat, at cogen 200kWe diesel SCR, allocation exergy
Energy 3.27E-02 MJ 2000 Ecoinvent data V2.2 (2010) Switzerland
heat, at cogen 200kWe diesel, allocation heat Energy 2.17E-01 MJ 2000 Ecoinvent data V2.2 (2010) Switzerland heat, at cogen 200kWe lean burn, allocation energy
Energy 8.86E-02 MJ 2000 Ecoinvent data V2.2 (2010) Switzerland
heat, at cogen 200kWe lean burn, allocation exergy
Energy 3.06E-02 MJ 2000 Ecoinvent data V2.2 (2010) Switzerland
heat, at cogen 200kWe lean burn, allocation heat Energy 1.45E-01 MJ 2000 Ecoinvent data V2.2 (2010) Switzerland
heat, at cogen 500kWe lean burn, allocation energy
Energy 9.18E-02 MJ 2000 Ecoinvent data V2.2 (2010) Switzerland
heat, at cogen 500kWe lean burn, allocation exergy
Energy 2.96E-02 MJ 2000 Ecoinvent data V2.2 (2010) Switzerland
heat, at cogen 500kWe lean burn, allocation heat Energy 1.64E-01 MJ 2000 Ecoinvent data V2.2 (2010) Switzerland
heat, at cogen 50kWe lean burn, allocation energy
Energy 8.98E-02 MJ 2000 Ecoinvent data V2.2 (2010) Switzerland
heat, at cogen 50kWe lean burn, allocation exergy
Energy 3.24E-02 MJ 2000 Ecoinvent data V2.2 (2010) Switzerland
heat, at cogen 50kWe lean burn, allocation heat Energy 1.40E-01 MJ 2000 Ecoinvent data V2.2 (2010) Switzerland
heat, at cogen 6400kWth, wood, allocation energy
Energy 3.15E-03 MJ 2001 Ecoinvent data V2.2 (2010) Switzerland
heat, at cogen 6400kWth, wood, allocation exergy
Energy 2.64E-03 MJ 2001 Ecoinvent data V2.2 (2010) Switzerland
heat, at cogen 6400kWth, wood, allocation heat Energy 3.49E-03 MJ 2001 Ecoinvent data V2.2 (2010) Switzerland
heat, at cogen 6400kWth, wood, emission control, allocation energy
Energy 1.02E-02 MJ 2001 Ecoinvent data V2.2 (2010) Switzerland
heat, at cogen 6400kWth, wood, emission control, allocation exergy
Energy 8.62E-03 MJ 2001 Ecoinvent data V2.2 (2010) Switzerland
heat, at cogen 6400kWth, wood, emission control, allocation heat
Energy 1.13E-02 MJ 2001 Ecoinvent data V2.2 (2010) Switzerland
Name: Database section:
Database sub-section:
kg CO2 eq/unit
Units: Year: Source: Location:
157
heat, at cogen ORC 1400kWth, wood, allocation energy
Energy 3.40E-03 MJ 2001 Ecoinvent data V2.2 (2010) Switzerland
heat, at cogen ORC 1400kWth, wood, allocation exergy
Energy 2.95E-03 MJ 2001 Ecoinvent data V2.2 (2010) Switzerland
heat, at cogen ORC 1400kWth, wood, allocation heat
Energy 3.54E-03 MJ 2001 Ecoinvent data V2.2 (2010) Switzerland
heat, at cogen ORC 1400kWth, wood, emission control, allocation energy
Energy 1.09E-02 MJ 2001 Ecoinvent data V2.2 (2010) Switzerland
heat, at cogen ORC 1400kWth, wood, emission control, allocation exergy
Energy 9.51E-03 MJ 2001 Ecoinvent data V2.2 (2010) Switzerland
heat, at cogen ORC 1400kWth, wood, emission control, allocation heat
Energy 1.13E-02 MJ 2001 Ecoinvent data V2.2 (2010) Switzerland
heat, at cogen with biogas engine, agricultural covered, allocation exergy
Energy 4.29E-03 MJ 2004 Ecoinvent data V2.2 (2010) Switzerland
heat, at cogen with biogas engine, agricultural, allocation exergy
Energy 9.70E-03 MJ 2006 Ecoinvent data V2.2 (2010) Switzerland
heat, at cogen with biogas engine, allocation exergy
Energy 1.22E-02 MJ 2004 Ecoinvent data V2.2 (2010) Switzerland
heat, at cogen with ignition biogas engine, agricultural covered, alloc. exergy
Energy 6.84E-03 MJ 2004 Ecoinvent data V2.2 (2010) Switzerland
heat, at cogen with ignition biogas engine, allocation exergy
Energy 2.00E-02 MJ 2004 Ecoinvent data V2.2 (2010) Switzerland
heat, at cogen, biogas agricultural mix, allocation exergy
Energy 9.39E-03 MJ 2006 Ecoinvent data V2.2 (2010) Switzerland
heat, at flat plate collector, multiple dwelling, for hot water
Energy 2.91E-03 MJ 2002 Ecoinvent data V2.2 (2010) Switzerland
heat, at flat plate collector, one-family house, for combined system
Energy 7.76E-03 MJ 2002 Ecoinvent data V2.2 (2010) Switzerland
heat, at flat plate collector, one-family house, for hot water
Energy 1.02E-02 MJ 2002 Ecoinvent data V2.2 (2010) Switzerland
heat, at hard coal industrial furnace 1-10MW Energy 1.31E-01 MJ 1992 Ecoinvent data V2.2 (2010) Europe heat, at heat pump 30kW, allocation electricity Energy 6.10E-02 MJ 2000 Ecoinvent data V2.2 (2010) Switzerland heat, at heat pump 30kW, allocation energy Energy 2.25E-02 MJ 2000 Ecoinvent data V2.2 (2010) Switzerland heat, at heat pump 30kW, allocation exergy Energy 4.65E-02 MJ 2000 Ecoinvent data V2.2 (2010) Switzerland heat, at heat pump 30kW, allocation heat Energy 7.87E-04 MJ 2000 Ecoinvent data V2.2 (2010) Switzerland
Name: Database section:
Database sub-section:
kg CO2 eq/unit
Units: Year: Source: Location:
158
heat, at heat pump 30kW, allocation price Energy 3.99E-02 MJ 2000 Ecoinvent data V2.2 (2010) Switzerland heat, at hot water tank, solar+electric, flat plate, multiple dwelling
Energy 3.55E-02 MJ 2002 Ecoinvent data V2.2 (2010) Switzerland
heat, at hot water tank, solar+gas, flat plate, multiple dwelling
Energy 6.13E-02 MJ 2002 Ecoinvent data V2.2 (2010) Switzerland
heat, at hot water tank, solar+gas, flat plate, one-family house
Energy 3.92E-02 MJ 2002 Ecoinvent data V2.2 (2010) Switzerland
heat, at local distribution cogen 160kWe Jakobsberg, allocation electricity
Energy 4.89E-02 MJ 2000 Ecoinvent data V2.2 (2010) Switzerland
heat, at local distribution cogen 160kWe Jakobsberg, allocation energy
Energy 9.10E-02 MJ 2000 Ecoinvent data V2.2 (2010) Switzerland
heat, at local distribution cogen 160kWe Jakobsberg, allocation exergy
Energy 6.47E-02 MJ 2000 Ecoinvent data V2.2 (2010) Switzerland
heat, at local distribution cogen 160kWe Jakobsberg, allocation heat
Energy 1.15E-01 MJ 2000 Ecoinvent data V2.2 (2010) Switzerland
heat, at local distribution cogen 160kWe Jakobsberg, allocation price
Energy 7.19E-02 MJ 2000 Ecoinvent data V2.2 (2010) Switzerland
heat, at Mini CHP plant, allocation energy Energy 8.28E-02 MJ 2000 Ecoinvent data V2.2 (2010) Switzerland heat, at Mini CHP plant, allocation exergy Energy 3.19E-02 MJ 2000 Ecoinvent data V2.2 (2010) Switzerland heat, at Mini CHP plant, allocation heat Energy 1.15E-01 MJ 2000 Ecoinvent data V2.2 (2010) Switzerland heat, at module cogen 160kWe Jakobsberg, allocation electricity
Energy 1.34E-02 MJ 2000 Ecoinvent data V2.2 (2010) Switzerland
heat, at module cogen 160kWe Jakobsberg, allocation energy
Energy 7.97E-02 MJ 2000 Ecoinvent data V2.2 (2010) Switzerland
heat, at module cogen 160kWe Jakobsberg, allocation exergy
Energy 3.83E-02 MJ 2000 Ecoinvent data V2.2 (2010) Switzerland
heat, at module cogen 160kWe Jakobsberg, allocation heat
Energy 1.17E-01 MJ 2000 Ecoinvent data V2.2 (2010) Switzerland
heat, at module cogen 160kWe Jakobsberg, allocation price
Energy 4.97E-02 MJ 2000 Ecoinvent data V2.2 (2010) Switzerland
heat, at solar+gas heating, flat plate, one-family house, combined system
Energy 5.74E-02 MJ 2002 Ecoinvent data V2.2 (2010) Switzerland
heat, at solar+gas heating, tube collector, one-family house, combined system
Energy 5.68E-02 MJ 2002 Ecoinvent data V2.2 (2010) Switzerland
Name: Database section:
Database sub-section:
kg CO2 eq/unit
Units: Year: Source: Location:
159
heat, at solar+wood heating, flat plate, one-family house, combined system
Energy 7.61E-03 MJ 2002 Ecoinvent data V2.2 (2010) Switzerland
heat, at system cogen 160kWe Jakobsberg, allocation electricity
Energy 4.56E-02 MJ 2000 Ecoinvent data V2.2 (2010) Switzerland
heat, at system cogen 160kWe Jakobsberg, allocation energy
Energy 8.54E-02 MJ 2000 Ecoinvent data V2.2 (2010) Switzerland
heat, at system cogen 160kWe Jakobsberg, allocation exergy
Energy 6.05E-02 MJ 2000 Ecoinvent data V2.2 (2010) Switzerland
heat, at system cogen 160kWe Jakobsberg, allocation heat
Energy 1.08E-01 MJ 2000 Ecoinvent data V2.2 (2010) Switzerland
heat, at system cogen 160kWe Jakobsberg, allocation price
Energy 6.74E-02 MJ 2000 Ecoinvent data V2.2 (2010) Switzerland
heat, at tube collector, one-family house, for combined system
Energy 6.83E-03 MJ 2002 Ecoinvent data V2.2 (2010) Switzerland
heat, biogas, allocation exergy, at micro gas turbine 100kWe
Energy 2.46E-02 MJ 2005 Ecoinvent data V2.2 (2010) Switzerland
heat, biogas, allocation exergy, at PEM fuel cell 2kWe, future
Energy 1.55E-02 MJ 2005 Ecoinvent data V2.2 (2010) Switzerland
heat, biogas, allocation exergy, at SOFC fuel cell 125kWe, future
Energy 1.73E-02 MJ 2005 Ecoinvent data V2.2 (2010) Switzerland
heat, biogas, allocation exergy, at SOFC-GT fuel cell 180kWe, future
Energy 1.47E-02 MJ 2005 Ecoinvent data V2.2 (2010) Switzerland
heat, biogas, at diffusion absorption heat pump 4kW, future
Energy 4.08E-02 MJ 2005 Ecoinvent data V2.2 (2010) Switzerland
heat, biowaste, at waste incineration plant, allocation price
Energy 1.40E-02 MJ 2000 Ecoinvent data V2.2 (2010) Switzerland
heat, biowaste, at waste incineration plant, future, allocation price
Energy 6.77E-03 MJ 2010-2020
Ecoinvent data V2.2 (2010) Switzerland
heat, borehole heat exchanger, at brine-water heat pump 10kW, CH
Energy 4.81E-02 MJ 2000 Ecoinvent data V2.2 (2010) Europe
heat, borehole heat exchanger, at brine-water heat pump 10kW, Europe
Energy 1.64E-02 MJ 2000 Ecoinvent data V2.2 (2010) Switzerland
heat, borehole heat exchanger, brine-water heat pump 10kW, at heat radiator, CH
Energy 1.91E-02 MJ 2000 Ecoinvent data V2.2 (2010) Switzerland

Name: Database section:
Database sub-section:
kg CO2 eq/unit
Units: Year: Source: Location:
160
heat, borehole heat exchanger, brine-water heat pump 10kW, at heat radiator, Europe
Energy 5.25E-02 MJ 2000 Ecoinvent data V2.2 (2010) Europe
heat, digester sludge, at incineration plant, future, allocation price
Energy 1.78E-02 MJ 2010-2020
Ecoinvent data V2.2 (2010) Switzerland
heat, hard coal briquette, at stove 5-15kW Energy 1.60E-01 MJ 1992 Ecoinvent data V2.2 (2010) Europe heat, hard coal coke, at stove 5-15kW Energy 1.78E-01 MJ 1992 Ecoinvent data V2.2 (2010) Europe heat, hardwood chips from forest, at furnace 1000kW
Energy 4.11E-03 MJ 2001 Ecoinvent data V2.2 (2010) Switzerland
heat, hardwood chips from forest, at furnace 300kW
Energy 4.33E-03 MJ 2001 Ecoinvent data V2.2 (2010) Switzerland
heat, hardwood chips from forest, at furnace 50kW
Energy 5.65E-03 MJ 2001 Ecoinvent data V2.2 (2010) Switzerland
heat, hardwood chips from industry, at furnace 1000kW
Energy 3.25E-03 MJ 2001 Ecoinvent data V2.2 (2010) Switzerland
heat, hardwood chips from industry, at furnace 300kW
Energy 3.50E-03 MJ 2001 Ecoinvent data V2.2 (2010) Switzerland
heat, hardwood chips from industry, at furnace 50kW
Energy 4.80E-03 MJ 2001 Ecoinvent data V2.2 (2010) Switzerland
heat, hardwood logs, at furnace 100kW Energy 4.68E-03 MJ 2001 Ecoinvent data V2.2 (2010) Switzerland heat, hardwood logs, at furnace 30kW Energy 5.49E-03 MJ 2001 Ecoinvent data V2.2 (2010) Switzerland heat, hardwood logs, at wood heater 6kW Energy 5.91E-03 MJ 2001 Ecoinvent data V2.2 (2010) Switzerland heat, heavy fuel oil, at industrial furnace 1MW, CH
Energy 9.97E-02 MJ 2000 Ecoinvent data V2.2 (2010) Switzerland
heat, heavy fuel oil, at industrial furnace 1MW, Europe
Energy 9.49E-02 MJ 2000 Ecoinvent data V2.2 (2010) Europe
heat, light fuel oil, at boiler 100kW condensing, non-modulating
Energy 8.86E-02 MJ 2000 Ecoinvent data V2.2 (2010) Switzerland
heat, light fuel oil, at boiler 100kW, non-modulating
Energy 9.39E-02 MJ 2000 Ecoinvent data V2.2 (2010) Switzerland
heat, light fuel oil, at boiler 10kW condensing, non-modulating
Energy 8.93E-02 MJ 2000 Ecoinvent data V2.2 (2010) Switzerland
heat, light fuel oil, at boiler 10kW, non-modulating Energy 9.47E-02 MJ 2000 Ecoinvent data V2.2 (2010) Switzerland
heat, light fuel oil, at industrial furnace 1MW, CH Energy 9.27E-02 MJ 2000 Ecoinvent data V2.2 (2010) Switzerland

Name: Database section:
Database sub-section:
kg CO2 eq/unit
Units: Year: Source: Location:
161
heat, light fuel oil, at industrial furnace 1MW, Europe
Energy 9.10E-02 MJ 2000 Ecoinvent data V2.2 (2010) Europe
heat, lignite briquette, at stove 5-15kW Energy 2.01E-01 MJ 1992 Ecoinvent data V2.2 (2010) Europe heat, mixed chips from forest, at furnace 1000kW Energy 4.60E-03 MJ 2001 Ecoinvent data V2.2 (2010) Switzerland
heat, mixed chips from forest, at furnace 300kW Energy 4.83E-03 MJ 2001 Ecoinvent data V2.2 (2010) Switzerland
heat, mixed chips from forest, at furnace 50kW Energy 6.36E-03 MJ 2001 Ecoinvent data V2.2 (2010) Switzerland heat, mixed chips from industry, at furnace 1000kW
Energy 3.37E-03 MJ 2001 Ecoinvent data V2.2 (2010) Switzerland
heat, mixed chips from industry, at furnace 300kW
Energy 3.68E-03 MJ 2001 Ecoinvent data V2.2 (2010) Switzerland
heat, mixed chips from industry, at furnace 50kW Energy 5.17E-03 MJ 2001 Ecoinvent data V2.2 (2010) Switzerland
heat, mixed logs, at furnace 100kW Energy 5.39E-03 MJ 2001 Ecoinvent data V2.2 (2010) Switzerland heat, mixed logs, at furnace 30kW Energy 6.23E-03 MJ 2001 Ecoinvent data V2.2 (2010) Switzerland heat, mixed logs, at wood heater 6kW Energy 6.58E-03 MJ 2001 Ecoinvent data V2.2 (2010) Switzerland heat, natural gas, allocation exergy, at micro gas turbine 100kWe
Energy 3.33E-02 MJ 2005 Ecoinvent data V2.2 (2010) Switzerland
heat, natural gas, allocation exergy, at PEM fuel cell 2kWe, future
Energy 2.05E-02 MJ 2005 Ecoinvent data V2.2 (2010) Switzerland
heat, natural gas, allocation exergy, at SOFC fuel cell 125kWe, future
Energy 2.36E-02 MJ 2005 Ecoinvent data V2.2 (2010) Switzerland
heat, natural gas, allocation exergy, at SOFC-GT fuel cell 180kWe, future
Energy 2.01E-02 MJ 2005 Ecoinvent data V2.2 (2010) Switzerland
heat, natural gas, at boiler atm. low-NOx condensing non-modulating <100kW
Energy 7.50E-02 MJ 2000 Ecoinvent data V2.2 (2010) Europe
heat, natural gas, at boiler atmospheric low-NOx non-modulating <100kW
Energy 8.18E-02 MJ 2000 Ecoinvent data V2.2 (2010) Europe
heat, natural gas, at boiler atmospheric non-modulating <100kW
Energy 7.72E-02 MJ 2000 Ecoinvent data V2.2 (2010) Europe
heat, natural gas, at boiler condensing modulating <100kW
Energy 7.19E-02 MJ 2000 Ecoinvent data V2.2 (2010) Europe
heat, natural gas, at boiler condensing modulating >100kW
Energy 6.70E-02 MJ 2000 Ecoinvent data V2.2 (2010) Europe

Name: Database section:
Database sub-section:
kg CO2 eq/unit
Units: Year: Source: Location:
162
heat, natural gas, at boiler fan burner low-NOx non-modulating <100kW
Energy 8.51E-02 MJ 2000 Ecoinvent data V2.2 (2010) Europe
heat, natural gas, at boiler fan burner non-modulating <100kW
Energy 7.77E-02 MJ 2000 Ecoinvent data V2.2 (2010) Europe
heat, natural gas, at boiler modulating <100kW Energy 7.63E-02 MJ 2000 Ecoinvent data V2.2 (2010) Europe heat, natural gas, at boiler modulating >100kW Energy 7.10E-02 MJ 2000 Ecoinvent data V2.2 (2010) Europe heat, natural gas, at diffusion absorption heat pump 4kW, future
Energy 5.58E-02 MJ 2005 Ecoinvent data V2.2 (2010) Switzerland
heat, natural gas, at industrial furnace >100kW Energy 7.16E-02 MJ 2000 Ecoinvent data V2.2 (2010) Europe heat, natural gas, at industrial furnace low-NOx >100kW
Energy 7.77E-02 MJ 2000 Ecoinvent data V2.2 (2010) Europe
heat, pellets, allocation exergy, at stirling cogen unit 3kWe, future
Energy 5.10E-03 MJ 2005 Ecoinvent data V2.2 (2010) Switzerland
heat, softwood chips from forest, at furnace 1000kW
Energy 4.85E-03 MJ 2001 Ecoinvent data V2.2 (2010) Switzerland
heat, softwood chips from forest, at furnace 300kW
Energy 5.09E-03 MJ 2001 Ecoinvent data V2.2 (2010) Switzerland
heat, softwood chips from forest, at furnace 50kW
Energy 6.69E-03 MJ 2001 Ecoinvent data V2.2 (2010) Switzerland
heat, softwood chips from industry, at furnace 1000kW
Energy 3.44E-03 MJ 2001 Ecoinvent data V2.2 (2010) Switzerland
heat, softwood chips from industry, at furnace 300kW
Energy 3.77E-03 MJ 2001 Ecoinvent data V2.2 (2010) Switzerland
heat, softwood chips from industry, at furnace 50kW
Energy 5.34E-03 MJ 2001 Ecoinvent data V2.2 (2010) Switzerland
heat, softwood logs, at furnace 100kW Energy 5.80E-03 MJ 2001 Ecoinvent data V2.2 (2010) Switzerland heat, softwood logs, at furnace 30kW Energy 6.65E-03 MJ 2001 Ecoinvent data V2.2 (2010) Switzerland heat, softwood logs, at wood heater 6kW Energy 6.96E-03 MJ 2001 Ecoinvent data V2.2 (2010) Switzerland heat, unspecific, in chemical plant Energy 9.96E-02 MJ 1997 Ecoinvent data V2.2 (2010) Europe heat, wood pellets, at furnace 15kW Energy 1.54E-02 MJ 2001 Ecoinvent data V2.2 (2010) Switzerland heat, wood pellets, at furnace 50kW Energy 1.40E-02 MJ 2001 Ecoinvent data V2.2 (2010) Switzerland heavy fuel oil, burned in industrial furnace 1MW, non-modulating, CH
Energy 9.49E-02 MJ 2000 Ecoinvent data V2.2 (2010) Switzerland
heavy fuel oil, burned in industrial furnace 1MW, non-modulating, Europe
Energy 9.03E-02 MJ 2000 Ecoinvent data V2.2 (2010) Europe

Name: Database section:
Database sub-section:
kg CO2 eq/unit
Units: Year: Source: Location:
163
heavy fuel oil, burned in power plant, AT Energy 8.98E-02 MJ 2000 Ecoinvent data V2.2 (2010) Austria heavy fuel oil, burned in power plant, BE Energy 9.02E-02 MJ 1995 Ecoinvent data V2.2 (2010) Belgium heavy fuel oil, burned in power plant, CZ Energy 9.13E-02 MJ 2000 Ecoinvent data V2.2 (2010) Switzerland heavy fuel oil, burned in power plant, DE Energy 9.03E-02 MJ 1996 Ecoinvent data V2.2 (2010) Germany heavy fuel oil, burned in power plant, DK Energy 9.23E-02 MJ 1996 Ecoinvent data V2.2 (2010) Denmark heavy fuel oil, burned in power plant, ES Energy 9.16E-02 MJ 2000 Ecoinvent data V2.2 (2010) Spain heavy fuel oil, burned in power plant, Europe Energy 9.13E-02 MJ 2000 Ecoinvent data V2.2 (2010) Europe heavy fuel oil, burned in power plant, FI Energy 8.96E-02 MJ 2000 Ecoinvent data V2.2 (2010) Finland heavy fuel oil, burned in power plant, FR Energy 9.15E-02 MJ 1996 Ecoinvent data V2.2 (2010) France heavy fuel oil, burned in power plant, GB Energy 9.14E-02 MJ 2000 Ecoinvent data V2.2 (2010) United
Kingdom heavy fuel oil, burned in power plant, GR Energy 9.31E-02 MJ 1985 Ecoinvent data V2.2 (2010) Greece heavy fuel oil, burned in power plant, HR Energy 9.00E-02 MJ 2000 Ecoinvent data V2.2 (2010) Croatia heavy fuel oil, burned in power plant, HU Energy 8.94E-02 MJ 2000 Ecoinvent data V2.2 (2010) Hungary heavy fuel oil, burned in power plant, IE Energy 9.18E-02 MJ 2000 Ecoinvent data V2.2 (2010) Ireland heavy fuel oil, burned in power plant, IT Energy 9.37E-02 MJ 2000 Ecoinvent data V2.2 (2010) Italy heavy fuel oil, burned in power plant, NL Energy 8.74E-02 MJ 1993 Ecoinvent data V2.2 (2010) Netherlands heavy fuel oil, burned in power plant, PT Energy 9.03E-02 MJ 2000 Ecoinvent data V2.2 (2010) Portugal heavy fuel oil, burned in power plant, RS Energy 9.16E-02 MJ 2000 Ecoinvent data V2.2 (2010) Serbia and
Montenegro heavy fuel oil, burned in power plant, SE Energy 8.98E-02 MJ 2000 Ecoinvent data V2.2 (2010) Sweden heavy fuel oil, burned in power plant, SI Energy 9.13E-02 MJ 2000 Ecoinvent data V2.2 (2010) Slovenia heavy fuel oil, burned in power plant, SK Energy 9.12E-02 MJ 2000 Ecoinvent data V2.2 (2010) Slovakia heavy fuel oil, burned in refinery furnace, CH Energy 9.28E-02 MJ 2000 Ecoinvent data V2.2 (2010) Switzerland heavy fuel oil, burned in refinery furnace, Europe Energy 8.61E-02 MJ 2000 Ecoinvent data V2.2 (2010) Europe
light fuel oil, burned in boiler 100kW condensing, non-modulating
Energy 8.86E-02 MJ 2000 Ecoinvent data V2.2 (2010) Switzerland
light fuel oil, burned in boiler 100kW, non-modulating
Energy 8.86E-02 MJ 2000 Ecoinvent data V2.2 (2010) Switzerland
light fuel oil, burned in boiler 10kW condensing, non-modulating
Energy 8.93E-02 MJ 2000 Ecoinvent data V2.2 (2010) Switzerland
light fuel oil, burned in boiler 10kW, non-modulating
Energy 8.93E-02 MJ 2000 Ecoinvent data V2.2 (2010) Switzerland

Name: Database section:
Database sub-section:
kg CO2 eq/unit
Units: Year: Source: Location:
164
light fuel oil, burned in industrial furnace 1MW, non-modulating, CH
Energy 8.82E-02 MJ 2000 Ecoinvent data V2.2 (2010) Switzerland
light fuel oil, burned in industrial furnace 1MW, non-modulating, Europe
Energy 8.67E-02 MJ 2000 Ecoinvent data V2.2 (2010) Europe
lignite briquette, burned in stove 5-15kW Energy 1.41E-01 MJ 1992 Ecoinvent data V2.2 (2010) Europe lignite briquettes, at plant Energy 3.29E-02 MJ 1992 Ecoinvent data V2.2 (2010) Germany lignite, burned in power plant, AT Energy 1.09E-01 MJ 2000 Ecoinvent data V2.2 (2010) Austria lignite, burned in power plant, BA Energy 1.07E-01 MJ 2000 Ecoinvent data V2.2 (2010) Bosnia and
Herzegovina lignite, burned in power plant, CZ Energy 1.09E-01 MJ 2005 Ecoinvent data V2.2 (2010) Switzerland lignite, burned in power plant, DE Energy 1.12E-01 MJ 2000 Ecoinvent data V2.2 (2010) Germany lignite, burned in power plant, ES Energy 1.08E-01 MJ 2000 Ecoinvent data V2.2 (2010) Spain lignite, burned in power plant, FR Energy 1.10E-01 MJ 2000 Ecoinvent data V2.2 (2010) France lignite, burned in power plant, GR Energy 1.27E-01 MJ 2000 Ecoinvent data V2.2 (2010) Greece lignite, burned in power plant, HU Energy 1.09E-01 MJ 2005 Ecoinvent data V2.2 (2010) Hungary lignite, burned in power plant, MK Energy 1.13E-01 MJ 2000 Ecoinvent data V2.2 (2010) Macedonia lignite, burned in power plant, Poland Energy 1.08E-01 MJ 2005 Ecoinvent data V2.2 (2010) Poland lignite, burned in power plant, RS Energy 1.11E-01 MJ 2000 Ecoinvent data V2.2 (2010) Serbia and
Montenegro lignite, burned in power plant, SI Energy 1.07E-01 MJ 2000 Ecoinvent data V2.2 (2010) Slovenia lignite, burned in power plant, SK Energy 1.08E-01 MJ 2005 Ecoinvent data V2.2 (2010) Slovakia logs, hardwood, burned in furnace 100kW Energy 3.27E-03 MJ 2001 Ecoinvent data V2.2 (2010) Switzerland logs, hardwood, burned in furnace 30kW Energy 3.74E-03 MJ 2001 Ecoinvent data V2.2 (2010) Switzerland logs, hardwood, burned in wood heater 6kW Energy 4.44E-03 MJ 2001 Ecoinvent data V2.2 (2010) Switzerland logs, mixed, burned in furnace 100kW Energy 3.77E-03 MJ 2001 Ecoinvent data V2.2 (2010) Switzerland logs, mixed, burned in furnace 30kW Energy 4.24E-03 MJ 2001 Ecoinvent data V2.2 (2010) Switzerland logs, mixed, burned in wood heater 6kW Energy 4.94E-03 MJ 2001 Ecoinvent data V2.2 (2010) Switzerland logs, softwood, burned in furnace 100kW Energy 4.06E-03 MJ 2001 Ecoinvent data V2.2 (2010) Switzerland logs, softwood, burned in furnace 30kW Energy 4.52E-03 MJ 2001 Ecoinvent data V2.2 (2010) Switzerland logs, softwood, burned in wood heater 6kW Energy 5.23E-03 MJ 2001 Ecoinvent data V2.2 (2010) Switzerland methane, 96 vol-%, from biogas, high pressure, at consumer
Energy 4.72E-02 MJ 2000 Ecoinvent data V2.2 (2010) Switzerland
methane, 96 vol-%, from biogas, low pressure, at consumer
Energy 5.14E-02 MJ 2000 Ecoinvent data V2.2 (2010) Switzerland
natural gas, at consumer Energy 1.40E-02 MJ 2005 Ecoinvent data V2.2 (2010) North
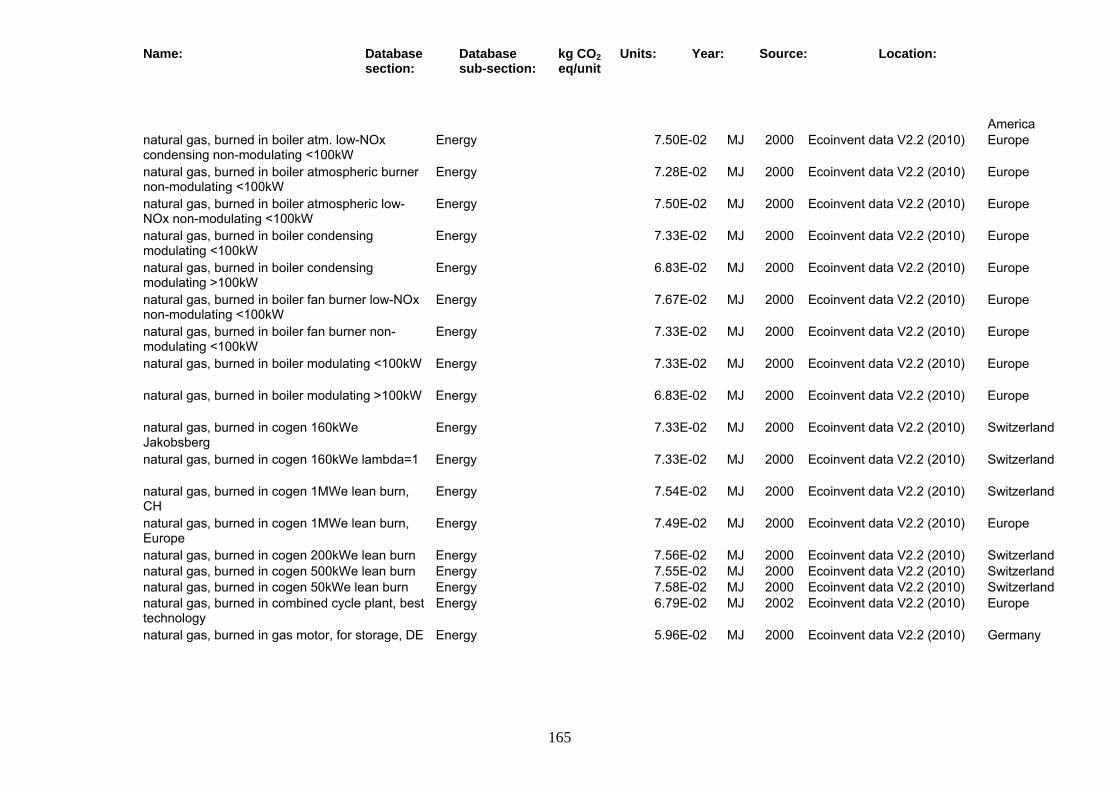
Name: Database section:
Database sub-section:
kg CO2 eq/unit
Units: Year: Source: Location:
165
America natural gas, burned in boiler atm. low-NOx condensing non-modulating <100kW
Energy 7.50E-02 MJ 2000 Ecoinvent data V2.2 (2010) Europe
natural gas, burned in boiler atmospheric burner non-modulating <100kW
Energy 7.28E-02 MJ 2000 Ecoinvent data V2.2 (2010) Europe
natural gas, burned in boiler atmospheric low-NOx non-modulating <100kW
Energy 7.50E-02 MJ 2000 Ecoinvent data V2.2 (2010) Europe
natural gas, burned in boiler condensing modulating <100kW
Energy 7.33E-02 MJ 2000 Ecoinvent data V2.2 (2010) Europe
natural gas, burned in boiler condensing modulating >100kW
Energy 6.83E-02 MJ 2000 Ecoinvent data V2.2 (2010) Europe
natural gas, burned in boiler fan burner low-NOx non-modulating <100kW
Energy 7.67E-02 MJ 2000 Ecoinvent data V2.2 (2010) Europe
natural gas, burned in boiler fan burner non-modulating <100kW
Energy 7.33E-02 MJ 2000 Ecoinvent data V2.2 (2010) Europe
natural gas, burned in boiler modulating <100kW Energy 7.33E-02 MJ 2000 Ecoinvent data V2.2 (2010) Europe
natural gas, burned in boiler modulating >100kW Energy 6.83E-02 MJ 2000 Ecoinvent data V2.2 (2010) Europe
natural gas, burned in cogen 160kWe Jakobsberg
Energy 7.33E-02 MJ 2000 Ecoinvent data V2.2 (2010) Switzerland
natural gas, burned in cogen 160kWe lambda=1 Energy 7.33E-02 MJ 2000 Ecoinvent data V2.2 (2010) Switzerland
natural gas, burned in cogen 1MWe lean burn, CH
Energy 7.54E-02 MJ 2000 Ecoinvent data V2.2 (2010) Switzerland
natural gas, burned in cogen 1MWe lean burn, Europe
Energy 7.49E-02 MJ 2000 Ecoinvent data V2.2 (2010) Europe
natural gas, burned in cogen 200kWe lean burn Energy 7.56E-02 MJ 2000 Ecoinvent data V2.2 (2010) Switzerland natural gas, burned in cogen 500kWe lean burn Energy 7.55E-02 MJ 2000 Ecoinvent data V2.2 (2010) Switzerland natural gas, burned in cogen 50kWe lean burn Energy 7.58E-02 MJ 2000 Ecoinvent data V2.2 (2010) Switzerland natural gas, burned in combined cycle plant, best technology
Energy 6.79E-02 MJ 2002 Ecoinvent data V2.2 (2010) Europe
natural gas, burned in gas motor, for storage, DE Energy 5.96E-02 MJ 2000 Ecoinvent data V2.2 (2010) Germany
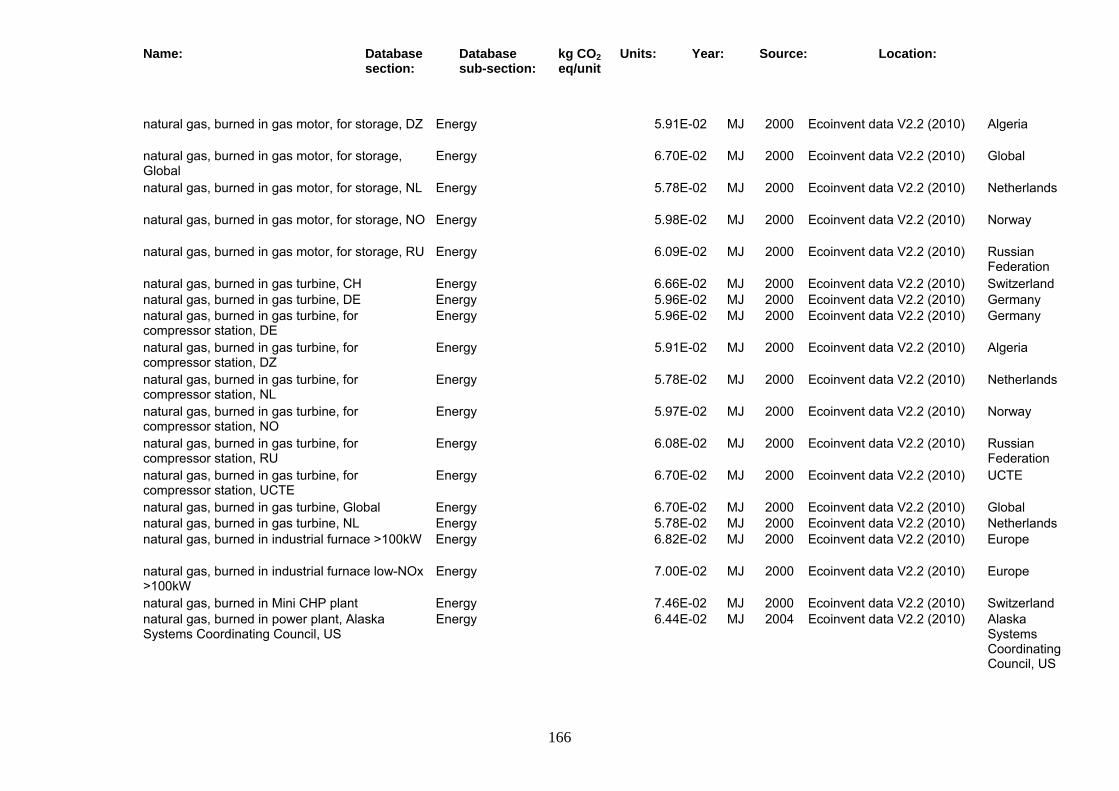
Name: Database section:
Database sub-section:
kg CO2 eq/unit
Units: Year: Source: Location:
166
natural gas, burned in gas motor, for storage, DZ Energy 5.91E-02 MJ 2000 Ecoinvent data V2.2 (2010) Algeria
natural gas, burned in gas motor, for storage, Global
Energy 6.70E-02 MJ 2000 Ecoinvent data V2.2 (2010) Global
natural gas, burned in gas motor, for storage, NL Energy 5.78E-02 MJ 2000 Ecoinvent data V2.2 (2010) Netherlands
natural gas, burned in gas motor, for storage, NO Energy 5.98E-02 MJ 2000 Ecoinvent data V2.2 (2010) Norway
natural gas, burned in gas motor, for storage, RU Energy 6.09E-02 MJ 2000 Ecoinvent data V2.2 (2010) Russian Federation
natural gas, burned in gas turbine, CH Energy 6.66E-02 MJ 2000 Ecoinvent data V2.2 (2010) Switzerland natural gas, burned in gas turbine, DE Energy 5.96E-02 MJ 2000 Ecoinvent data V2.2 (2010) Germany natural gas, burned in gas turbine, for compressor station, DE
Energy 5.96E-02 MJ 2000 Ecoinvent data V2.2 (2010) Germany
natural gas, burned in gas turbine, for compressor station, DZ
Energy 5.91E-02 MJ 2000 Ecoinvent data V2.2 (2010) Algeria
natural gas, burned in gas turbine, for compressor station, NL
Energy 5.78E-02 MJ 2000 Ecoinvent data V2.2 (2010) Netherlands
natural gas, burned in gas turbine, for compressor station, NO
Energy 5.97E-02 MJ 2000 Ecoinvent data V2.2 (2010) Norway
natural gas, burned in gas turbine, for compressor station, RU
Energy 6.08E-02 MJ 2000 Ecoinvent data V2.2 (2010) Russian Federation
natural gas, burned in gas turbine, for compressor station, UCTE
Energy 6.70E-02 MJ 2000 Ecoinvent data V2.2 (2010) UCTE
natural gas, burned in gas turbine, Global Energy 6.70E-02 MJ 2000 Ecoinvent data V2.2 (2010) Global natural gas, burned in gas turbine, NL Energy 5.78E-02 MJ 2000 Ecoinvent data V2.2 (2010) Netherlands natural gas, burned in industrial furnace >100kW Energy 6.82E-02 MJ 2000 Ecoinvent data V2.2 (2010) Europe
natural gas, burned in industrial furnace low-NOx >100kW
Energy 7.00E-02 MJ 2000 Ecoinvent data V2.2 (2010) Europe
natural gas, burned in Mini CHP plant Energy 7.46E-02 MJ 2000 Ecoinvent data V2.2 (2010) Switzerland natural gas, burned in power plant, Alaska Systems Coordinating Council, US
Energy 6.44E-02 MJ 2004 Ecoinvent data V2.2 (2010) Alaska Systems Coordinating Council, US
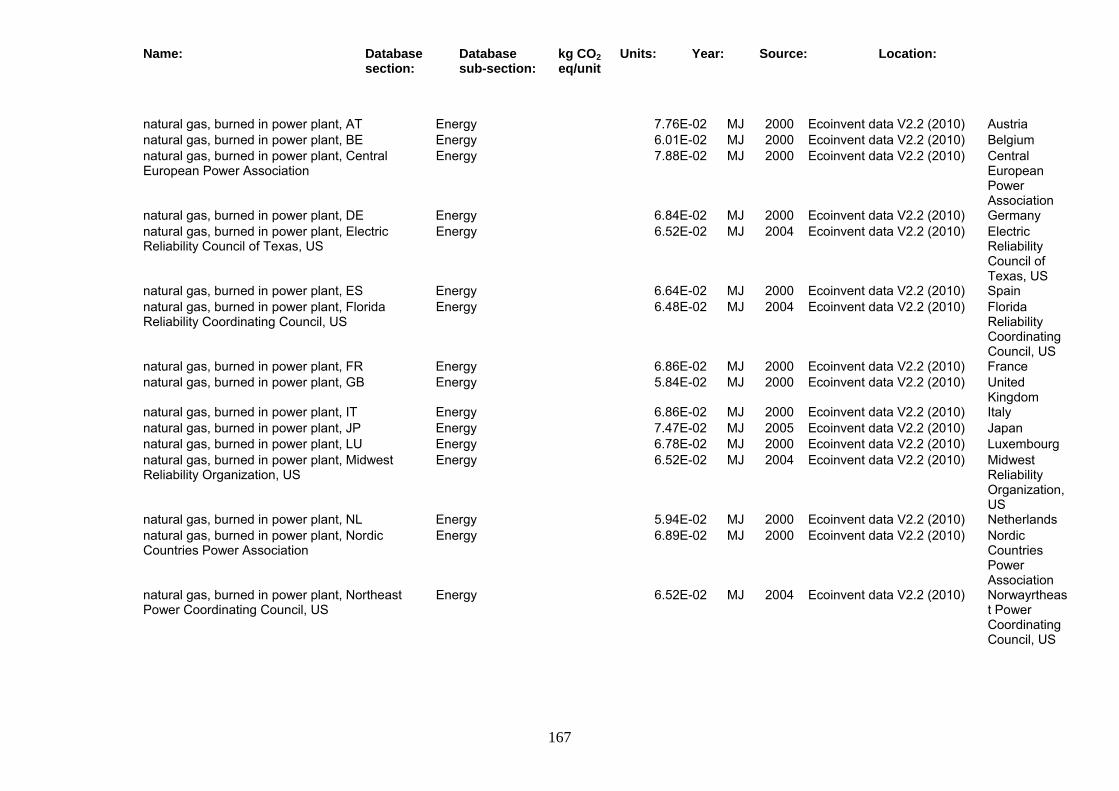
Name: Database section:
Database sub-section:
kg CO2 eq/unit
Units: Year: Source: Location:
167
natural gas, burned in power plant, AT Energy 7.76E-02 MJ 2000 Ecoinvent data V2.2 (2010) Austria natural gas, burned in power plant, BE Energy 6.01E-02 MJ 2000 Ecoinvent data V2.2 (2010) Belgium natural gas, burned in power plant, Central European Power Association
Energy 7.88E-02 MJ 2000 Ecoinvent data V2.2 (2010) Central European Power Association
natural gas, burned in power plant, DE Energy 6.84E-02 MJ 2000 Ecoinvent data V2.2 (2010) Germany natural gas, burned in power plant, Electric Reliability Council of Texas, US
Energy 6.52E-02 MJ 2004 Ecoinvent data V2.2 (2010) Electric Reliability Council of Texas, US
natural gas, burned in power plant, ES Energy 6.64E-02 MJ 2000 Ecoinvent data V2.2 (2010) Spain natural gas, burned in power plant, Florida Reliability Coordinating Council, US
Energy 6.48E-02 MJ 2004 Ecoinvent data V2.2 (2010) Florida Reliability Coordinating Council, US
natural gas, burned in power plant, FR Energy 6.86E-02 MJ 2000 Ecoinvent data V2.2 (2010) France natural gas, burned in power plant, GB Energy 5.84E-02 MJ 2000 Ecoinvent data V2.2 (2010) United
Kingdom natural gas, burned in power plant, IT Energy 6.86E-02 MJ 2000 Ecoinvent data V2.2 (2010) Italy natural gas, burned in power plant, JP Energy 7.47E-02 MJ 2005 Ecoinvent data V2.2 (2010) Japan natural gas, burned in power plant, LU Energy 6.78E-02 MJ 2000 Ecoinvent data V2.2 (2010) Luxembourg natural gas, burned in power plant, Midwest Reliability Organization, US
Energy 6.52E-02 MJ 2004 Ecoinvent data V2.2 (2010) Midwest Reliability Organization, US
natural gas, burned in power plant, NL Energy 5.94E-02 MJ 2000 Ecoinvent data V2.2 (2010) Netherlands natural gas, burned in power plant, Nordic Countries Power Association
Energy 6.89E-02 MJ 2000 Ecoinvent data V2.2 (2010) Nordic Countries Power Association
natural gas, burned in power plant, Northeast Power Coordinating Council, US
Energy 6.52E-02 MJ 2004 Ecoinvent data V2.2 (2010) Norwayrtheast Power Coordinating Council, US
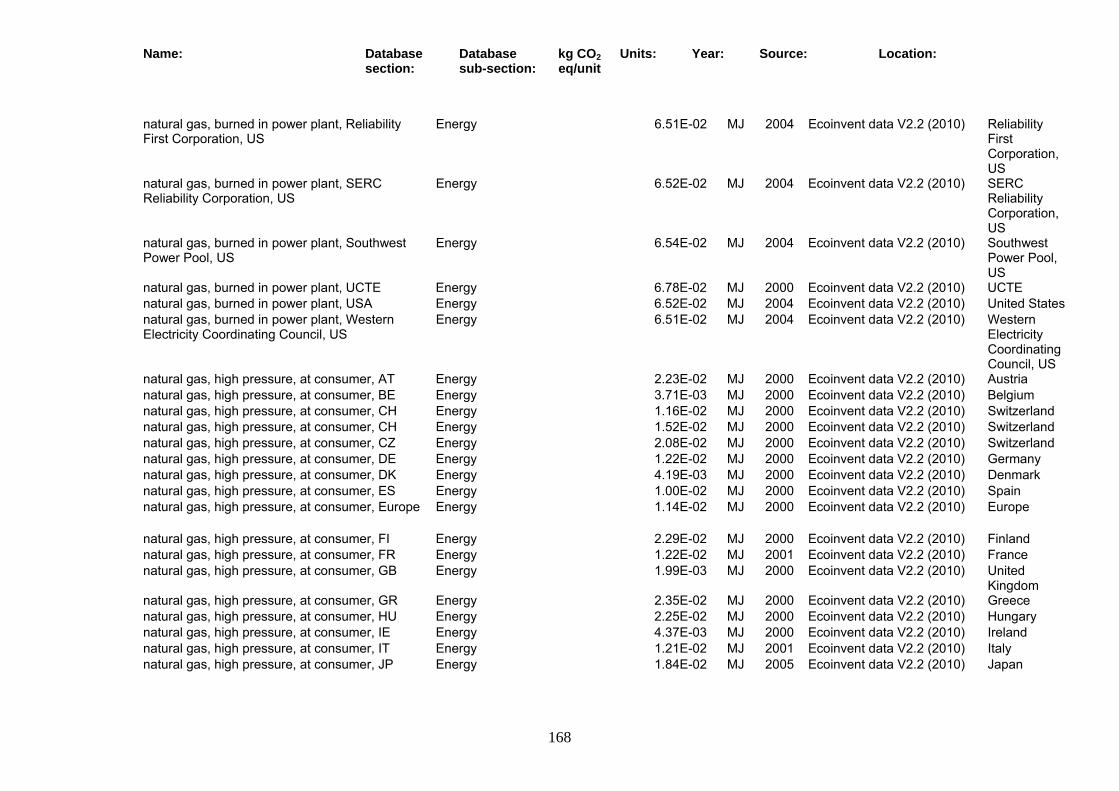
Name: Database section:
Database sub-section:
kg CO2 eq/unit
Units: Year: Source: Location:
168
natural gas, burned in power plant, Reliability First Corporation, US
Energy 6.51E-02 MJ 2004 Ecoinvent data V2.2 (2010) Reliability First Corporation, US
natural gas, burned in power plant, SERC Reliability Corporation, US
Energy 6.52E-02 MJ 2004 Ecoinvent data V2.2 (2010) SERC Reliability Corporation, US
natural gas, burned in power plant, Southwest Power Pool, US
Energy 6.54E-02 MJ 2004 Ecoinvent data V2.2 (2010) Southwest Power Pool, US
natural gas, burned in power plant, UCTE Energy 6.78E-02 MJ 2000 Ecoinvent data V2.2 (2010) UCTE natural gas, burned in power plant, USA Energy 6.52E-02 MJ 2004 Ecoinvent data V2.2 (2010) United States natural gas, burned in power plant, Western Electricity Coordinating Council, US
Energy 6.51E-02 MJ 2004 Ecoinvent data V2.2 (2010) Western Electricity Coordinating Council, US
natural gas, high pressure, at consumer, AT Energy 2.23E-02 MJ 2000 Ecoinvent data V2.2 (2010) Austria natural gas, high pressure, at consumer, BE Energy 3.71E-03 MJ 2000 Ecoinvent data V2.2 (2010) Belgium natural gas, high pressure, at consumer, CH Energy 1.16E-02 MJ 2000 Ecoinvent data V2.2 (2010) Switzerland natural gas, high pressure, at consumer, CH Energy 1.52E-02 MJ 2000 Ecoinvent data V2.2 (2010) Switzerland natural gas, high pressure, at consumer, CZ Energy 2.08E-02 MJ 2000 Ecoinvent data V2.2 (2010) Switzerland natural gas, high pressure, at consumer, DE Energy 1.22E-02 MJ 2000 Ecoinvent data V2.2 (2010) Germany natural gas, high pressure, at consumer, DK Energy 4.19E-03 MJ 2000 Ecoinvent data V2.2 (2010) Denmark natural gas, high pressure, at consumer, ES Energy 1.00E-02 MJ 2000 Ecoinvent data V2.2 (2010) Spain natural gas, high pressure, at consumer, Europe Energy 1.14E-02 MJ 2000 Ecoinvent data V2.2 (2010) Europe
natural gas, high pressure, at consumer, FI Energy 2.29E-02 MJ 2000 Ecoinvent data V2.2 (2010) Finland natural gas, high pressure, at consumer, FR Energy 1.22E-02 MJ 2001 Ecoinvent data V2.2 (2010) France natural gas, high pressure, at consumer, GB Energy 1.99E-03 MJ 2000 Ecoinvent data V2.2 (2010) United
Kingdom natural gas, high pressure, at consumer, GR Energy 2.35E-02 MJ 2000 Ecoinvent data V2.2 (2010) Greece natural gas, high pressure, at consumer, HU Energy 2.25E-02 MJ 2000 Ecoinvent data V2.2 (2010) Hungary natural gas, high pressure, at consumer, IE Energy 4.37E-03 MJ 2000 Ecoinvent data V2.2 (2010) Ireland natural gas, high pressure, at consumer, IT Energy 1.21E-02 MJ 2001 Ecoinvent data V2.2 (2010) Italy natural gas, high pressure, at consumer, JP Energy 1.84E-02 MJ 2005 Ecoinvent data V2.2 (2010) Japan
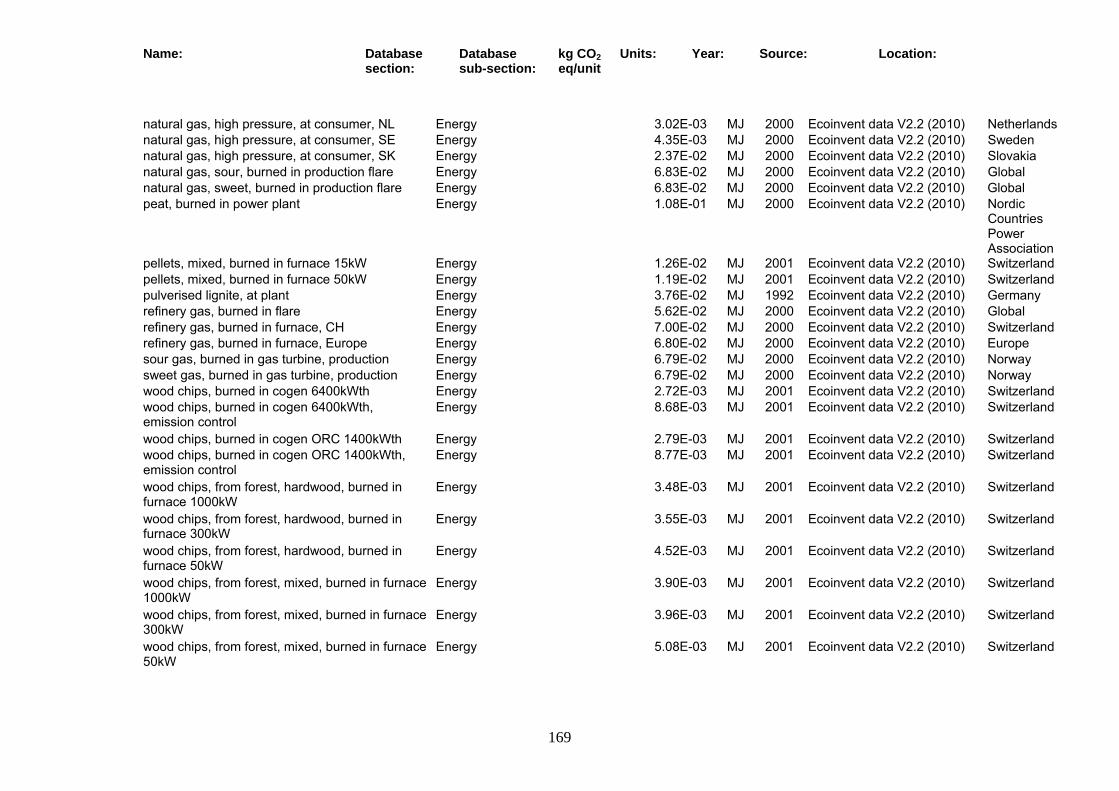
Name: Database section:
Database sub-section:
kg CO2 eq/unit
Units: Year: Source: Location:
169
natural gas, high pressure, at consumer, NL Energy 3.02E-03 MJ 2000 Ecoinvent data V2.2 (2010) Netherlands natural gas, high pressure, at consumer, SE Energy 4.35E-03 MJ 2000 Ecoinvent data V2.2 (2010) Sweden natural gas, high pressure, at consumer, SK Energy 2.37E-02 MJ 2000 Ecoinvent data V2.2 (2010) Slovakia natural gas, sour, burned in production flare Energy 6.83E-02 MJ 2000 Ecoinvent data V2.2 (2010) Global natural gas, sweet, burned in production flare Energy 6.83E-02 MJ 2000 Ecoinvent data V2.2 (2010) Global peat, burned in power plant Energy 1.08E-01 MJ 2000 Ecoinvent data V2.2 (2010) Nordic
Countries Power Association
pellets, mixed, burned in furnace 15kW Energy 1.26E-02 MJ 2001 Ecoinvent data V2.2 (2010) Switzerland pellets, mixed, burned in furnace 50kW Energy 1.19E-02 MJ 2001 Ecoinvent data V2.2 (2010) Switzerland pulverised lignite, at plant Energy 3.76E-02 MJ 1992 Ecoinvent data V2.2 (2010) Germany refinery gas, burned in flare Energy 5.62E-02 MJ 2000 Ecoinvent data V2.2 (2010) Global refinery gas, burned in furnace, CH Energy 7.00E-02 MJ 2000 Ecoinvent data V2.2 (2010) Switzerland refinery gas, burned in furnace, Europe Energy 6.80E-02 MJ 2000 Ecoinvent data V2.2 (2010) Europe sour gas, burned in gas turbine, production Energy 6.79E-02 MJ 2000 Ecoinvent data V2.2 (2010) Norway sweet gas, burned in gas turbine, production Energy 6.79E-02 MJ 2000 Ecoinvent data V2.2 (2010) Norway wood chips, burned in cogen 6400kWth Energy 2.72E-03 MJ 2001 Ecoinvent data V2.2 (2010) Switzerland wood chips, burned in cogen 6400kWth, emission control
Energy 8.68E-03 MJ 2001 Ecoinvent data V2.2 (2010) Switzerland
wood chips, burned in cogen ORC 1400kWth Energy 2.79E-03 MJ 2001 Ecoinvent data V2.2 (2010) Switzerland wood chips, burned in cogen ORC 1400kWth, emission control
Energy 8.77E-03 MJ 2001 Ecoinvent data V2.2 (2010) Switzerland
wood chips, from forest, hardwood, burned in furnace 1000kW
Energy 3.48E-03 MJ 2001 Ecoinvent data V2.2 (2010) Switzerland
wood chips, from forest, hardwood, burned in furnace 300kW
Energy 3.55E-03 MJ 2001 Ecoinvent data V2.2 (2010) Switzerland
wood chips, from forest, hardwood, burned in furnace 50kW
Energy 4.52E-03 MJ 2001 Ecoinvent data V2.2 (2010) Switzerland
wood chips, from forest, mixed, burned in furnace 1000kW
Energy 3.90E-03 MJ 2001 Ecoinvent data V2.2 (2010) Switzerland
wood chips, from forest, mixed, burned in furnace 300kW
Energy 3.96E-03 MJ 2001 Ecoinvent data V2.2 (2010) Switzerland
wood chips, from forest, mixed, burned in furnace 50kW
Energy 5.08E-03 MJ 2001 Ecoinvent data V2.2 (2010) Switzerland
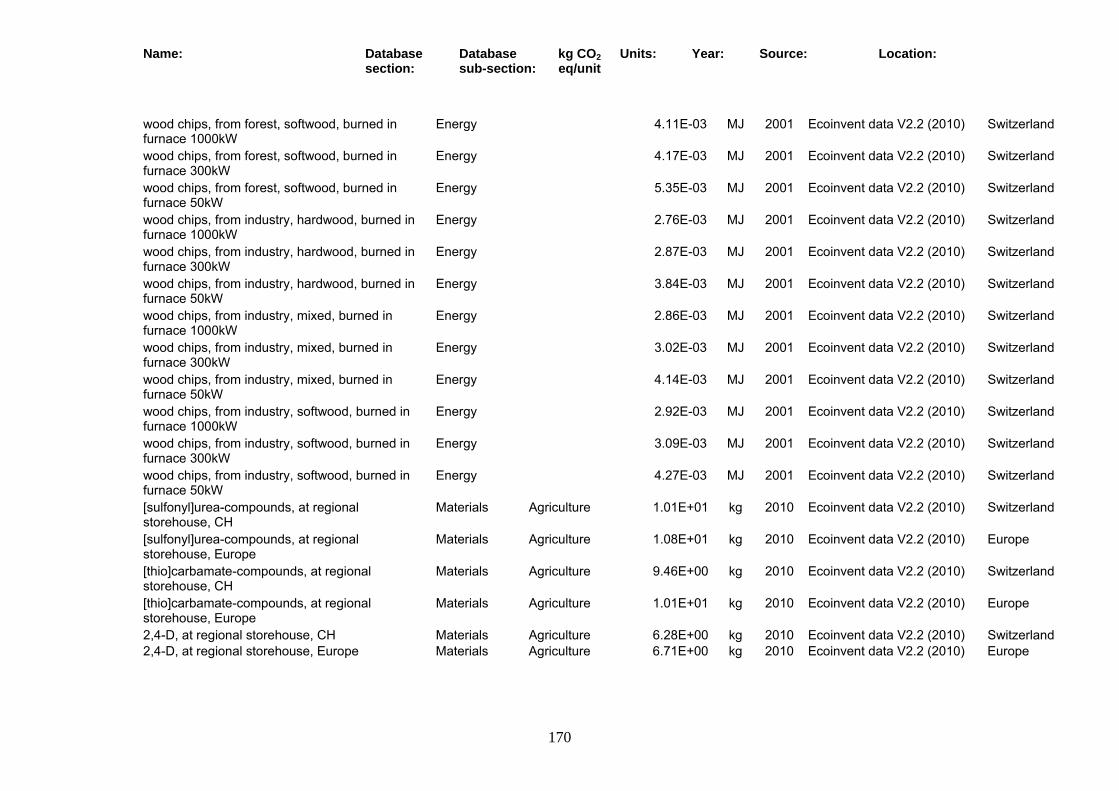
Name: Database section:
Database sub-section:
kg CO2 eq/unit
Units: Year: Source: Location:
170
wood chips, from forest, softwood, burned in furnace 1000kW
Energy 4.11E-03 MJ 2001 Ecoinvent data V2.2 (2010) Switzerland
wood chips, from forest, softwood, burned in furnace 300kW
Energy 4.17E-03 MJ 2001 Ecoinvent data V2.2 (2010) Switzerland
wood chips, from forest, softwood, burned in furnace 50kW
Energy 5.35E-03 MJ 2001 Ecoinvent data V2.2 (2010) Switzerland
wood chips, from industry, hardwood, burned in furnace 1000kW
Energy 2.76E-03 MJ 2001 Ecoinvent data V2.2 (2010) Switzerland
wood chips, from industry, hardwood, burned in furnace 300kW
Energy 2.87E-03 MJ 2001 Ecoinvent data V2.2 (2010) Switzerland
wood chips, from industry, hardwood, burned in furnace 50kW
Energy 3.84E-03 MJ 2001 Ecoinvent data V2.2 (2010) Switzerland
wood chips, from industry, mixed, burned in furnace 1000kW
Energy 2.86E-03 MJ 2001 Ecoinvent data V2.2 (2010) Switzerland
wood chips, from industry, mixed, burned in furnace 300kW
Energy 3.02E-03 MJ 2001 Ecoinvent data V2.2 (2010) Switzerland
wood chips, from industry, mixed, burned in furnace 50kW
Energy 4.14E-03 MJ 2001 Ecoinvent data V2.2 (2010) Switzerland
wood chips, from industry, softwood, burned in furnace 1000kW
Energy 2.92E-03 MJ 2001 Ecoinvent data V2.2 (2010) Switzerland
wood chips, from industry, softwood, burned in furnace 300kW
Energy 3.09E-03 MJ 2001 Ecoinvent data V2.2 (2010) Switzerland
wood chips, from industry, softwood, burned in furnace 50kW
Energy 4.27E-03 MJ 2001 Ecoinvent data V2.2 (2010) Switzerland
[sulfonyl]urea-compounds, at regional storehouse, CH
Materials Agriculture 1.01E+01 kg 2010 Ecoinvent data V2.2 (2010) Switzerland
[sulfonyl]urea-compounds, at regional storehouse, Europe
Materials Agriculture 1.08E+01 kg 2010 Ecoinvent data V2.2 (2010) Europe
[thio]carbamate-compounds, at regional storehouse, CH
Materials Agriculture 9.46E+00 kg 2010 Ecoinvent data V2.2 (2010) Switzerland
[thio]carbamate-compounds, at regional storehouse, Europe
Materials Agriculture 1.01E+01 kg 2010 Ecoinvent data V2.2 (2010) Europe
2,4-D, at regional storehouse, CH Materials Agriculture 6.28E+00 kg 2010 Ecoinvent data V2.2 (2010) Switzerland 2,4-D, at regional storehouse, Europe Materials Agriculture 6.71E+00 kg 2010 Ecoinvent data V2.2 (2010) Europe
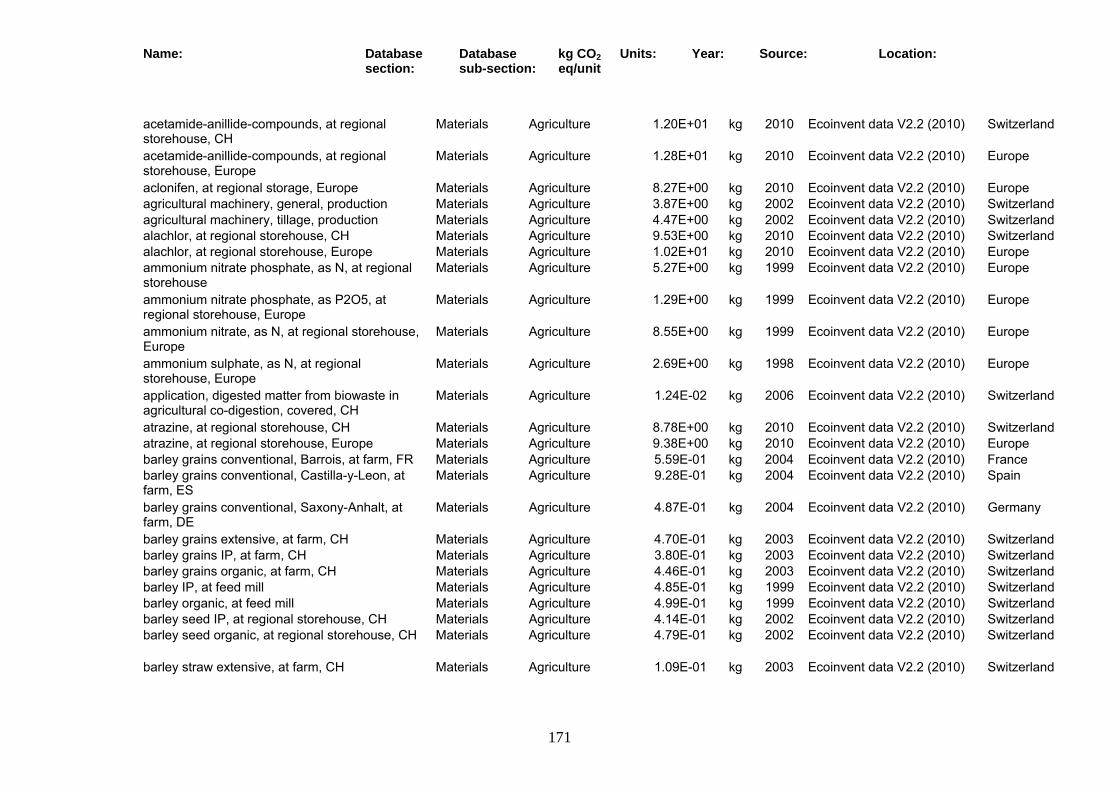
Name: Database section:
Database sub-section:
kg CO2 eq/unit
Units: Year: Source: Location:
171
acetamide-anillide-compounds, at regional storehouse, CH
Materials Agriculture 1.20E+01 kg 2010 Ecoinvent data V2.2 (2010) Switzerland
acetamide-anillide-compounds, at regional storehouse, Europe
Materials Agriculture 1.28E+01 kg 2010 Ecoinvent data V2.2 (2010) Europe
aclonifen, at regional storage, Europe Materials Agriculture 8.27E+00 kg 2010 Ecoinvent data V2.2 (2010) Europe agricultural machinery, general, production Materials Agriculture 3.87E+00 kg 2002 Ecoinvent data V2.2 (2010) Switzerland agricultural machinery, tillage, production Materials Agriculture 4.47E+00 kg 2002 Ecoinvent data V2.2 (2010) Switzerland alachlor, at regional storehouse, CH Materials Agriculture 9.53E+00 kg 2010 Ecoinvent data V2.2 (2010) Switzerland alachlor, at regional storehouse, Europe Materials Agriculture 1.02E+01 kg 2010 Ecoinvent data V2.2 (2010) Europe ammonium nitrate phosphate, as N, at regional storehouse
Materials Agriculture 5.27E+00 kg 1999 Ecoinvent data V2.2 (2010) Europe
ammonium nitrate phosphate, as P2O5, at regional storehouse, Europe
Materials Agriculture 1.29E+00 kg 1999 Ecoinvent data V2.2 (2010) Europe
ammonium nitrate, as N, at regional storehouse, Europe
Materials Agriculture 8.55E+00 kg 1999 Ecoinvent data V2.2 (2010) Europe
ammonium sulphate, as N, at regional storehouse, Europe
Materials Agriculture 2.69E+00 kg 1998 Ecoinvent data V2.2 (2010) Europe
application, digested matter from biowaste in agricultural co-digestion, covered, CH
Materials Agriculture 1.24E-02 kg 2006 Ecoinvent data V2.2 (2010) Switzerland
atrazine, at regional storehouse, CH Materials Agriculture 8.78E+00 kg 2010 Ecoinvent data V2.2 (2010) Switzerland atrazine, at regional storehouse, Europe Materials Agriculture 9.38E+00 kg 2010 Ecoinvent data V2.2 (2010) Europe barley grains conventional, Barrois, at farm, FR Materials Agriculture 5.59E-01 kg 2004 Ecoinvent data V2.2 (2010) France barley grains conventional, Castilla-y-Leon, at farm, ES
Materials Agriculture 9.28E-01 kg 2004 Ecoinvent data V2.2 (2010) Spain
barley grains conventional, Saxony-Anhalt, at farm, DE
Materials Agriculture 4.87E-01 kg 2004 Ecoinvent data V2.2 (2010) Germany
barley grains extensive, at farm, CH Materials Agriculture 4.70E-01 kg 2003 Ecoinvent data V2.2 (2010) Switzerland barley grains IP, at farm, CH Materials Agriculture 3.80E-01 kg 2003 Ecoinvent data V2.2 (2010) Switzerland barley grains organic, at farm, CH Materials Agriculture 4.46E-01 kg 2003 Ecoinvent data V2.2 (2010) Switzerland barley IP, at feed mill Materials Agriculture 4.85E-01 kg 1999 Ecoinvent data V2.2 (2010) Switzerland barley organic, at feed mill Materials Agriculture 4.99E-01 kg 1999 Ecoinvent data V2.2 (2010) Switzerland barley seed IP, at regional storehouse, CH Materials Agriculture 4.14E-01 kg 2002 Ecoinvent data V2.2 (2010) Switzerland barley seed organic, at regional storehouse, CH Materials Agriculture 4.79E-01 kg 2002 Ecoinvent data V2.2 (2010) Switzerland
barley straw extensive, at farm, CH Materials Agriculture 1.09E-01 kg 2003 Ecoinvent data V2.2 (2010) Switzerland

Name: Database section:
Database sub-section:
kg CO2 eq/unit
Units: Year: Source: Location:
172
barley straw IP, at farm, CH Materials Agriculture 9.03E-02 kg 2003 Ecoinvent data V2.2 (2010) Switzerland barley straw organic, at farm, CH Materials Agriculture 7.10E-02 kg 2003 Ecoinvent data V2.2 (2010) Switzerland benzimidazole-compounds, at regional storehouse, CH
Materials Agriculture 6.89E+00 kg 2010 Ecoinvent data V2.2 (2010) Switzerland
benzimidazole-compounds, at regional storehouse, Europe
Materials Agriculture 7.54E+00 kg 2010 Ecoinvent data V2.2 (2010) Europe
benzo[thia]diazole-compounds, at regional storehouse, CH
Materials Agriculture 1.02E+01 kg 2010 Ecoinvent data V2.2 (2010) Switzerland
benzo[thia]diazole-compounds, at regional storehouse, Europe
Materials Agriculture 1.02E+01 kg 2010 Ecoinvent data V2.2 (2010) Europe
benzoic-compounds, at regional storehouse, CH Materials Agriculture 9.53E+00 kg 2010 Ecoinvent data V2.2 (2010) Switzerland
benzoic-compounds, at regional storehouse, Europe
Materials Agriculture 1.02E+01 kg 2010 Ecoinvent data V2.2 (2010) Europe
bipyridylium-compounds, at regional storehouse, CH
Materials Agriculture 9.53E+00 kg 2010 Ecoinvent data V2.2 (2010) Switzerland
bipyridylium-compounds, at regional storehouse, Europe
Materials Agriculture 1.02E+01 kg 2010 Ecoinvent data V2.2 (2010) Europe
calcium ammonium nitrate, as N, at regional storehouse, Europe
Materials Agriculture 8.66E+00 kg 1999 Ecoinvent data V2.2 (2010) Europe
calcium nitrate, as N, at regional storehouse, Europe
Materials Agriculture 3.85E+00 kg 1998 Ecoinvent data V2.2 (2010) Europe
captan, at regional storage, Europe Materials Agriculture 3.92E+00 kg 2010 Ecoinvent data V2.2 (2010) Europe carbofuran, at regional storehouse, CH Materials Agriculture 9.46E+00 kg 2010 Ecoinvent data V2.2 (2010) Switzerland carbofuran, at regional storehouse, Europe Materials Agriculture 1.01E+01 kg 2010 Ecoinvent data V2.2 (2010) Europe chlorothalonil, at regional storage, Europe Materials Agriculture 3.62E+00 kg 2010 Ecoinvent data V2.2 (2010) Europe chlorotoluron, at regional storage, Europe Materials Agriculture 6.89E+00 kg 2010 Ecoinvent data V2.2 (2010) Europe clover seed IP, at farm, CH Materials Agriculture 3.32E+00 kg 2000 Ecoinvent data V2.2 (2010) Switzerland clover seed IP, at regional storehouse, CH Materials Agriculture 3.45E+00 kg 2002 Ecoinvent data V2.2 (2010) Switzerland compost, at plant, CH Materials Agriculture 3.62E-01 kg 1999 Ecoinvent data V2.2 (2010) Switzerland corn, at farm, USA Materials Agriculture 4.33E-01 kg 2006 Ecoinvent data V2.2 (2010) United States cotton fibres, at farm, USA Materials Agriculture 3.07E+00 kg 2006 Ecoinvent data V2.2 (2010) United States cotton fibres, ginned, at farm, CN Materials Agriculture 3.48E+00 kg 2007 Ecoinvent data V2.2 (2010) China cotton seed, at farm, CN Materials Agriculture 3.49E-01 kg 2007 Ecoinvent data V2.2 (2010) China cotton seed, at farm, USA Materials Agriculture 3.04E-01 kg 2006 Ecoinvent data V2.2 (2010) United States

Name: Database section:
Database sub-section:
kg CO2 eq/unit
Units: Year: Source: Location:
173
cotton seed, at regional storehouse, USA Materials Agriculture 3.85E-01 kg 2006 Ecoinvent data V2.2 (2010) United States cyanazine, at regional storehouse, CH Materials Agriculture 9.39E+00 kg 2010 Ecoinvent data V2.2 (2010) Switzerland cyanazine, at regional storehouse, Europe Materials Agriculture 9.96E+00 kg 2010 Ecoinvent data V2.2 (2010) Europe cyclic N-compounds, at regional storehouse, CH Materials Agriculture 1.44E+01 kg 2010 Ecoinvent data V2.2 (2010) Switzerland
cyclic N-compounds, at regional storehouse, Europe
Materials Agriculture 1.53E+01 kg 2010 Ecoinvent data V2.2 (2010) Europe
diammonium phosphate, as N, at regional storehouse, Europe
Materials Agriculture 2.80E+00 kg 1999 Ecoinvent data V2.2 (2010) Europe
diammonium phosphate, as P2O5, at regional storehouse, Europe
Materials Agriculture 1.57E+00 kg 1999 Ecoinvent data V2.2 (2010) Europe
diazine-compounds, at regional storehouse, Europe
Materials Agriculture 1.44E+01 kg 2010 Ecoinvent data V2.2 (2010) Europe
diazole-compounds, at regional storehouse, Europe
Materials Agriculture 1.68E+01 kg 2010 Ecoinvent data V2.2 (2010) Europe
dicamba, at regional storehouse, CH Materials Agriculture 7.13E+00 kg 2010 Ecoinvent data V2.2 (2010) Switzerland dicamba, at regional storehouse, Europe Materials Agriculture 7.72E+00 kg 2010 Ecoinvent data V2.2 (2010) Europe dimethenamide, at regional storage, Europe Materials Agriculture 1.52E+01 kg 2010 Ecoinvent data V2.2 (2010) Europe dinitroaniline-compounds, at regional storehouse, CH
Materials Agriculture 6.64E+00 kg 2010 Ecoinvent data V2.2 (2010) Switzerland
dinitroaniline-compounds, at regional storehouse, Europe
Materials Agriculture 6.95E+00 kg 2010 Ecoinvent data V2.2 (2010) Europe
diphenylether-compounds, at regional storehouse, CH
Materials Agriculture 1.13E+01 kg 2010 Ecoinvent data V2.2 (2010) Switzerland
diphenylether-compounds, at regional storehouse, Europe
Materials Agriculture 1.21E+01 kg 2010 Ecoinvent data V2.2 (2010) Europe
dithiocarbamate-compounds, at regional storehouse, CH
Materials Agriculture 4.69E+00 kg 2010 Ecoinvent data V2.2 (2010) Switzerland
dithiocarbamate-compounds, at regional storehouse, Europe
Materials Agriculture 5.27E+00 kg 2010 Ecoinvent data V2.2 (2010) Europe
diuron, at regional storehouse, CH Materials Agriculture 1.01E+01 kg 2010 Ecoinvent data V2.2 (2010) Switzerland diuron, at regional storehouse, Europe Materials Agriculture 1.08E+01 kg 2010 Ecoinvent data V2.2 (2010) Europe dried roughage store, air dried, solar, operation Materials Agriculture 3.44E-02 kg 2002 Ecoinvent data V2.2 (2010) Switzerland dried roughage store, cold-air dried, conventional, operation
Materials Agriculture 3.79E-02 kg 2002 Ecoinvent data V2.2 (2010) Switzerland
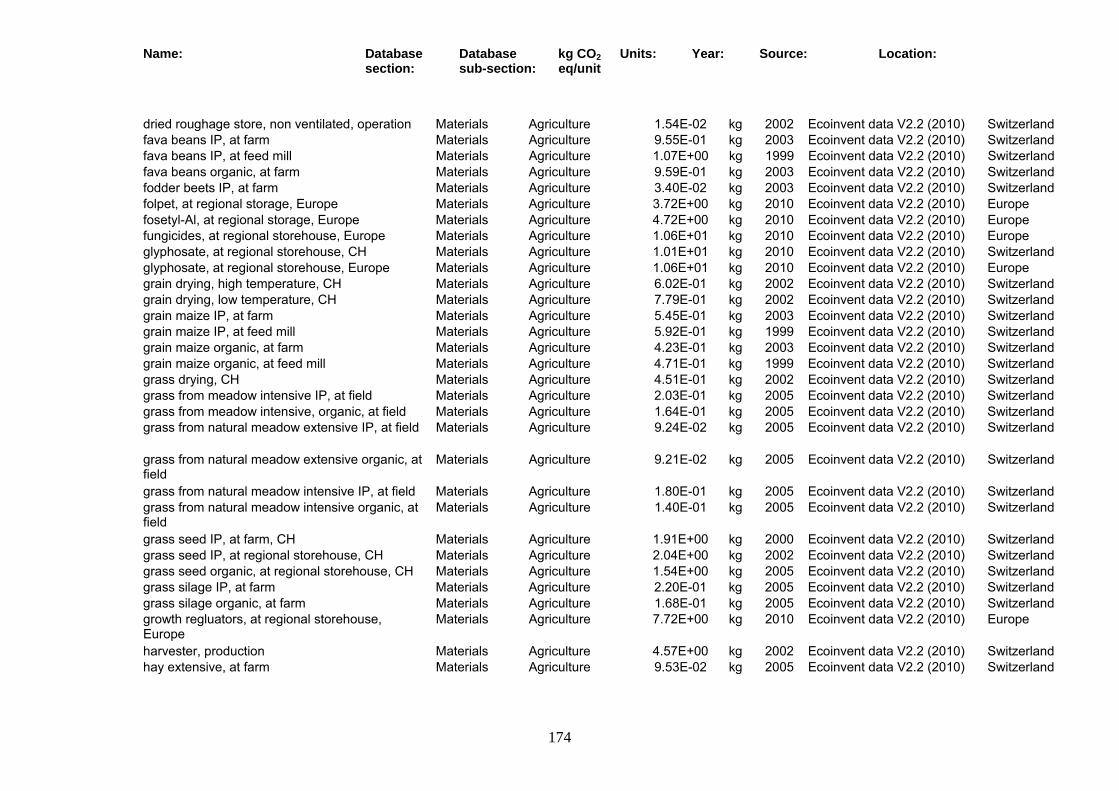
Name: Database section:
Database sub-section:
kg CO2 eq/unit
Units: Year: Source: Location:
174
dried roughage store, non ventilated, operation Materials Agriculture 1.54E-02 kg 2002 Ecoinvent data V2.2 (2010) Switzerland fava beans IP, at farm Materials Agriculture 9.55E-01 kg 2003 Ecoinvent data V2.2 (2010) Switzerland fava beans IP, at feed mill Materials Agriculture 1.07E+00 kg 1999 Ecoinvent data V2.2 (2010) Switzerland fava beans organic, at farm Materials Agriculture 9.59E-01 kg 2003 Ecoinvent data V2.2 (2010) Switzerland fodder beets IP, at farm Materials Agriculture 3.40E-02 kg 2003 Ecoinvent data V2.2 (2010) Switzerland folpet, at regional storage, Europe Materials Agriculture 3.72E+00 kg 2010 Ecoinvent data V2.2 (2010) Europe fosetyl-Al, at regional storage, Europe Materials Agriculture 4.72E+00 kg 2010 Ecoinvent data V2.2 (2010) Europe fungicides, at regional storehouse, Europe Materials Agriculture 1.06E+01 kg 2010 Ecoinvent data V2.2 (2010) Europe glyphosate, at regional storehouse, CH Materials Agriculture 1.01E+01 kg 2010 Ecoinvent data V2.2 (2010) Switzerland glyphosate, at regional storehouse, Europe Materials Agriculture 1.06E+01 kg 2010 Ecoinvent data V2.2 (2010) Europe grain drying, high temperature, CH Materials Agriculture 6.02E-01 kg 2002 Ecoinvent data V2.2 (2010) Switzerland grain drying, low temperature, CH Materials Agriculture 7.79E-01 kg 2002 Ecoinvent data V2.2 (2010) Switzerland grain maize IP, at farm Materials Agriculture 5.45E-01 kg 2003 Ecoinvent data V2.2 (2010) Switzerland grain maize IP, at feed mill Materials Agriculture 5.92E-01 kg 1999 Ecoinvent data V2.2 (2010) Switzerland grain maize organic, at farm Materials Agriculture 4.23E-01 kg 2003 Ecoinvent data V2.2 (2010) Switzerland grain maize organic, at feed mill Materials Agriculture 4.71E-01 kg 1999 Ecoinvent data V2.2 (2010) Switzerland grass drying, CH Materials Agriculture 4.51E-01 kg 2002 Ecoinvent data V2.2 (2010) Switzerland grass from meadow intensive IP, at field Materials Agriculture 2.03E-01 kg 2005 Ecoinvent data V2.2 (2010) Switzerland grass from meadow intensive, organic, at field Materials Agriculture 1.64E-01 kg 2005 Ecoinvent data V2.2 (2010) Switzerland grass from natural meadow extensive IP, at field Materials Agriculture 9.24E-02 kg 2005 Ecoinvent data V2.2 (2010) Switzerland
grass from natural meadow extensive organic, at field
Materials Agriculture 9.21E-02 kg 2005 Ecoinvent data V2.2 (2010) Switzerland
grass from natural meadow intensive IP, at field Materials Agriculture 1.80E-01 kg 2005 Ecoinvent data V2.2 (2010) Switzerland grass from natural meadow intensive organic, at field
Materials Agriculture 1.40E-01 kg 2005 Ecoinvent data V2.2 (2010) Switzerland
grass seed IP, at farm, CH Materials Agriculture 1.91E+00 kg 2000 Ecoinvent data V2.2 (2010) Switzerland grass seed IP, at regional storehouse, CH Materials Agriculture 2.04E+00 kg 2002 Ecoinvent data V2.2 (2010) Switzerland grass seed organic, at regional storehouse, CH Materials Agriculture 1.54E+00 kg 2005 Ecoinvent data V2.2 (2010) Switzerland grass silage IP, at farm Materials Agriculture 2.20E-01 kg 2005 Ecoinvent data V2.2 (2010) Switzerland grass silage organic, at farm Materials Agriculture 1.68E-01 kg 2005 Ecoinvent data V2.2 (2010) Switzerland growth regluators, at regional storehouse, Europe
Materials Agriculture 7.72E+00 kg 2010 Ecoinvent data V2.2 (2010) Europe
harvester, production Materials Agriculture 4.57E+00 kg 2002 Ecoinvent data V2.2 (2010) Switzerland hay extensive, at farm Materials Agriculture 9.53E-02 kg 2005 Ecoinvent data V2.2 (2010) Switzerland

Name: Database section:
Database sub-section:
kg CO2 eq/unit
Units: Year: Source: Location:
175
hay intensive IP, at farm Materials Agriculture 2.24E-01 kg 2005 Ecoinvent data V2.2 (2010) Switzerland hay intensive organic, at farm Materials Agriculture 1.90E-01 kg 2005 Ecoinvent data V2.2 (2010) Switzerland herbicides, at regional storehouse, Europe Materials Agriculture 1.02E+01 kg 2010 Ecoinvent data V2.2 (2010) Europe horn meal, at regional storehouse, CH Materials Agriculture 2.93E-01 kg 1993 Ecoinvent data V2.2 (2010) Switzerland husked nuts harvesting, at farm Materials Agriculture 6.15E-05 kg 1995 Ecoinvent data V2.2 (2010) Philippines insecticides, at regional storehouse, Europe Materials Agriculture 1.67E+01 kg 2010 Ecoinvent data V2.2 (2010) Europe isoproturon, at regional storage, Europe Materials Agriculture 7.18E+00 kg 2010 Ecoinvent data V2.2 (2010) Europe jute fibres, irrigated system, at farm Materials Agriculture 6.14E-01 kg 2007 Ecoinvent data V2.2 (2010) India jute fibres, rainfed system, at farm Materials Agriculture 5.72E-01 kg 2007 Ecoinvent data V2.2 (2010) India jute stalks, from fibre production, irrigated system, at farm
Materials Agriculture 1.90E-02 kg 2007 Ecoinvent data V2.2 (2010) India
jute stalks, from fibre production, rainfed system, at farm
Materials Agriculture 1.77E-02 kg 2007 Ecoinvent data V2.2 (2010) India
kenaf fibres, at farm Materials Agriculture 5.78E-01 kg 2007 Ecoinvent data V2.2 (2010) India kenaf stalks, from fibre production, at farm Materials Agriculture 1.79E-02 kg 2007 Ecoinvent data V2.2 (2010) India lime, algae, at regional storehouse, CH Materials Agriculture 2.05E-01 kg 2002 Ecoinvent data V2.2 (2010) Switzerland lime, from carbonation, at regional storehouse, CH
Materials Agriculture 1.17E-02 kg 2000 Ecoinvent data V2.2 (2010) Switzerland
linuron, at regional storehouse, CH Materials Agriculture 1.01E+01 kg 2010 Ecoinvent data V2.2 (2010) Switzerland linuron, at regional storehouse, Europe Materials Agriculture 1.08E+01 kg 2010 Ecoinvent data V2.2 (2010) Europe maize drying, CH Materials Agriculture 2.75E-01 kg 2002 Ecoinvent data V2.2 (2010) Switzerland maize seed IP, at farm, CH Materials Agriculture 1.80E+00 kg 2000 Ecoinvent data V2.2 (2010) Switzerland maize seed IP, at regional storehouse, CH Materials Agriculture 1.93E+00 kg 2002 Ecoinvent data V2.2 (2010) Switzerland maize seed organic, at farm, CH Materials Agriculture 1.25E+00 kg 2000 Ecoinvent data V2.2 (2010) Switzerland maize seed organic, at regional storehouse, CH Materials Agriculture 1.37E+00 kg 2002 Ecoinvent data V2.2 (2010) Switzerland
maize starch, at plant Materials Agriculture 1.21E+00 kg 2002 Ecoinvent data V2.2 (2010) Germany mancozeb, at regional storage, Europe Materials Agriculture 5.27E+00 kg 2010 Ecoinvent data V2.2 (2010) Europe maneb, at regional storehouse, CH Materials Agriculture 4.69E+00 kg 2010 Ecoinvent data V2.2 (2010) Switzerland maneb, at regional storehouse, Europe Materials Agriculture 5.27E+00 kg 2010 Ecoinvent data V2.2 (2010) Europe MCPA, at regional storehouse, CH Materials Agriculture 6.28E+00 kg 2010 Ecoinvent data V2.2 (2010) Switzerland MCPA, at regional storehouse, Europe Materials Agriculture 6.71E+00 kg 2010 Ecoinvent data V2.2 (2010) Europe mecoprop, at regional storage, Europe Materials Agriculture 5.43E+00 kg 2010 Ecoinvent data V2.2 (2010) Europe metaldehyde, at regional storage, Europe Materials Agriculture 1.91E+00 kg 2010 Ecoinvent data V2.2 (2010) Europe metamitron, at regional storage, Europe Materials Agriculture 6.31E+00 kg 2010 Ecoinvent data V2.2 (2010) Europe
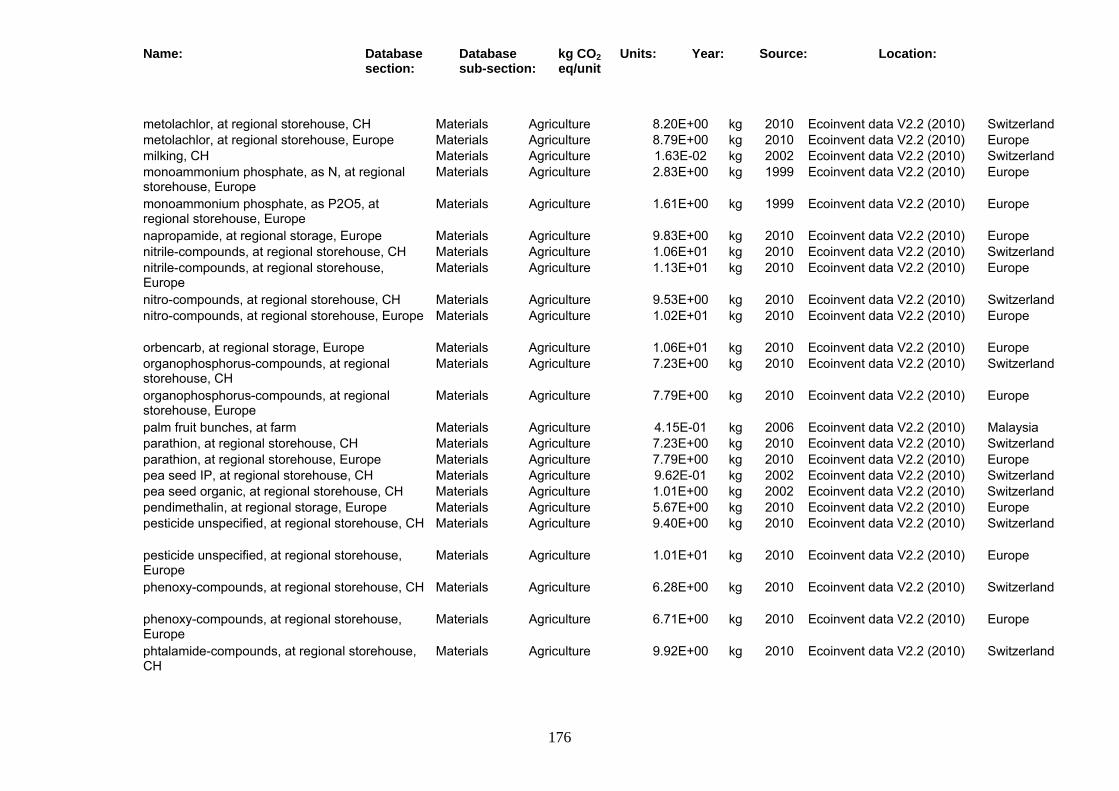
Name: Database section:
Database sub-section:
kg CO2 eq/unit
Units: Year: Source: Location:
176
metolachlor, at regional storehouse, CH Materials Agriculture 8.20E+00 kg 2010 Ecoinvent data V2.2 (2010) Switzerland metolachlor, at regional storehouse, Europe Materials Agriculture 8.79E+00 kg 2010 Ecoinvent data V2.2 (2010) Europe milking, CH Materials Agriculture 1.63E-02 kg 2002 Ecoinvent data V2.2 (2010) Switzerland monoammonium phosphate, as N, at regional storehouse, Europe
Materials Agriculture 2.83E+00 kg 1999 Ecoinvent data V2.2 (2010) Europe
monoammonium phosphate, as P2O5, at regional storehouse, Europe
Materials Agriculture 1.61E+00 kg 1999 Ecoinvent data V2.2 (2010) Europe
napropamide, at regional storage, Europe Materials Agriculture 9.83E+00 kg 2010 Ecoinvent data V2.2 (2010) Europe nitrile-compounds, at regional storehouse, CH Materials Agriculture 1.06E+01 kg 2010 Ecoinvent data V2.2 (2010) Switzerland nitrile-compounds, at regional storehouse, Europe
Materials Agriculture 1.13E+01 kg 2010 Ecoinvent data V2.2 (2010) Europe
nitro-compounds, at regional storehouse, CH Materials Agriculture 9.53E+00 kg 2010 Ecoinvent data V2.2 (2010) Switzerland nitro-compounds, at regional storehouse, Europe Materials Agriculture 1.02E+01 kg 2010 Ecoinvent data V2.2 (2010) Europe
orbencarb, at regional storage, Europe Materials Agriculture 1.06E+01 kg 2010 Ecoinvent data V2.2 (2010) Europe organophosphorus-compounds, at regional storehouse, CH
Materials Agriculture 7.23E+00 kg 2010 Ecoinvent data V2.2 (2010) Switzerland
organophosphorus-compounds, at regional storehouse, Europe
Materials Agriculture 7.79E+00 kg 2010 Ecoinvent data V2.2 (2010) Europe
palm fruit bunches, at farm Materials Agriculture 4.15E-01 kg 2006 Ecoinvent data V2.2 (2010) Malaysia parathion, at regional storehouse, CH Materials Agriculture 7.23E+00 kg 2010 Ecoinvent data V2.2 (2010) Switzerland parathion, at regional storehouse, Europe Materials Agriculture 7.79E+00 kg 2010 Ecoinvent data V2.2 (2010) Europe pea seed IP, at regional storehouse, CH Materials Agriculture 9.62E-01 kg 2002 Ecoinvent data V2.2 (2010) Switzerland pea seed organic, at regional storehouse, CH Materials Agriculture 1.01E+00 kg 2002 Ecoinvent data V2.2 (2010) Switzerland pendimethalin, at regional storage, Europe Materials Agriculture 5.67E+00 kg 2010 Ecoinvent data V2.2 (2010) Europe pesticide unspecified, at regional storehouse, CH Materials Agriculture 9.40E+00 kg 2010 Ecoinvent data V2.2 (2010) Switzerland
pesticide unspecified, at regional storehouse, Europe
Materials Agriculture 1.01E+01 kg 2010 Ecoinvent data V2.2 (2010) Europe
phenoxy-compounds, at regional storehouse, CH Materials Agriculture 6.28E+00 kg 2010 Ecoinvent data V2.2 (2010) Switzerland
phenoxy-compounds, at regional storehouse, Europe
Materials Agriculture 6.71E+00 kg 2010 Ecoinvent data V2.2 (2010) Europe
phtalamide-compounds, at regional storehouse, CH
Materials Agriculture 9.92E+00 kg 2010 Ecoinvent data V2.2 (2010) Switzerland
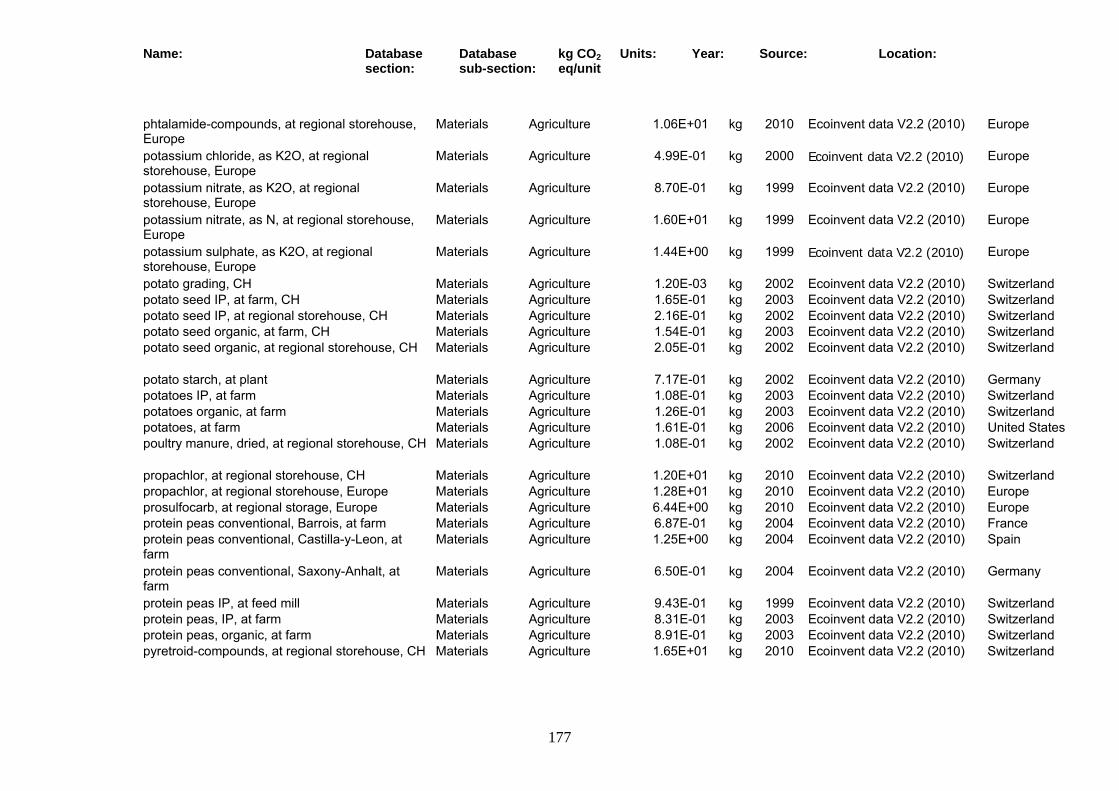
Name: Database section:
Database sub-section:
kg CO2 eq/unit
Units: Year: Source: Location:
177
phtalamide-compounds, at regional storehouse, Europe
Materials Agriculture 1.06E+01 kg 2010 Ecoinvent data V2.2 (2010) Europe
potassium chloride, as K2O, at regional storehouse, Europe
Materials Agriculture 4.99E-01 kg 2000 Ecoinvent data V2.2 (2010) Europe
potassium nitrate, as K2O, at regional storehouse, Europe
Materials Agriculture 8.70E-01 kg 1999 Ecoinvent data V2.2 (2010) Europe
potassium nitrate, as N, at regional storehouse, Europe
Materials Agriculture 1.60E+01 kg 1999 Ecoinvent data V2.2 (2010) Europe
potassium sulphate, as K2O, at regional storehouse, Europe
Materials Agriculture 1.44E+00 kg 1999 Ecoinvent data V2.2 (2010) Europe
potato grading, CH Materials Agriculture 1.20E-03 kg 2002 Ecoinvent data V2.2 (2010) Switzerland potato seed IP, at farm, CH Materials Agriculture 1.65E-01 kg 2003 Ecoinvent data V2.2 (2010) Switzerland potato seed IP, at regional storehouse, CH Materials Agriculture 2.16E-01 kg 2002 Ecoinvent data V2.2 (2010) Switzerland potato seed organic, at farm, CH Materials Agriculture 1.54E-01 kg 2003 Ecoinvent data V2.2 (2010) Switzerland potato seed organic, at regional storehouse, CH Materials Agriculture 2.05E-01 kg 2002 Ecoinvent data V2.2 (2010) Switzerland
potato starch, at plant Materials Agriculture 7.17E-01 kg 2002 Ecoinvent data V2.2 (2010) Germany potatoes IP, at farm Materials Agriculture 1.08E-01 kg 2003 Ecoinvent data V2.2 (2010) Switzerland potatoes organic, at farm Materials Agriculture 1.26E-01 kg 2003 Ecoinvent data V2.2 (2010) Switzerland potatoes, at farm Materials Agriculture 1.61E-01 kg 2006 Ecoinvent data V2.2 (2010) United States poultry manure, dried, at regional storehouse, CH Materials Agriculture 1.08E-01 kg 2002 Ecoinvent data V2.2 (2010) Switzerland
propachlor, at regional storehouse, CH Materials Agriculture 1.20E+01 kg 2010 Ecoinvent data V2.2 (2010) Switzerland propachlor, at regional storehouse, Europe Materials Agriculture 1.28E+01 kg 2010 Ecoinvent data V2.2 (2010) Europe prosulfocarb, at regional storage, Europe Materials Agriculture 6.44E+00 kg 2010 Ecoinvent data V2.2 (2010) Europe protein peas conventional, Barrois, at farm Materials Agriculture 6.87E-01 kg 2004 Ecoinvent data V2.2 (2010) France protein peas conventional, Castilla-y-Leon, at farm
Materials Agriculture 1.25E+00 kg 2004 Ecoinvent data V2.2 (2010) Spain
protein peas conventional, Saxony-Anhalt, at farm
Materials Agriculture 6.50E-01 kg 2004 Ecoinvent data V2.2 (2010) Germany
protein peas IP, at feed mill Materials Agriculture 9.43E-01 kg 1999 Ecoinvent data V2.2 (2010) Switzerland protein peas, IP, at farm Materials Agriculture 8.31E-01 kg 2003 Ecoinvent data V2.2 (2010) Switzerland protein peas, organic, at farm Materials Agriculture 8.91E-01 kg 2003 Ecoinvent data V2.2 (2010) Switzerland pyretroid-compounds, at regional storehouse, CH Materials Agriculture 1.65E+01 kg 2010 Ecoinvent data V2.2 (2010) Switzerland
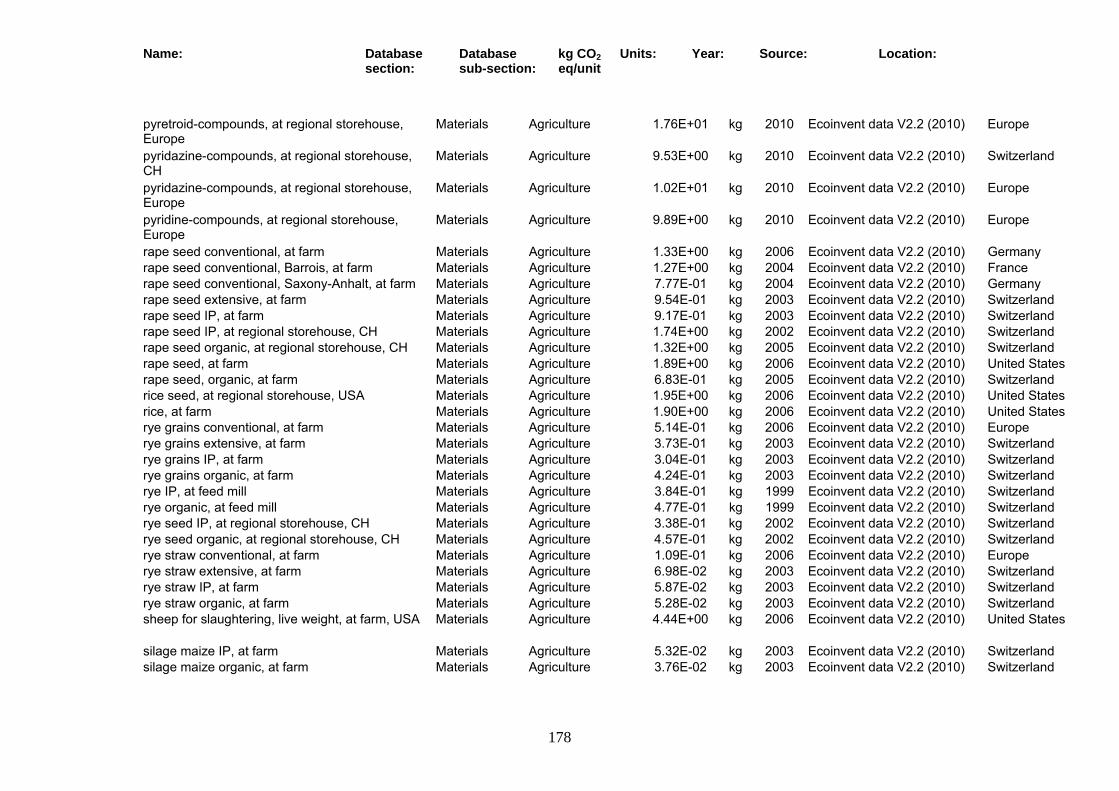
Name: Database section:
Database sub-section:
kg CO2 eq/unit
Units: Year: Source: Location:
178
pyretroid-compounds, at regional storehouse, Europe
Materials Agriculture 1.76E+01 kg 2010 Ecoinvent data V2.2 (2010) Europe
pyridazine-compounds, at regional storehouse, CH
Materials Agriculture 9.53E+00 kg 2010 Ecoinvent data V2.2 (2010) Switzerland
pyridazine-compounds, at regional storehouse, Europe
Materials Agriculture 1.02E+01 kg 2010 Ecoinvent data V2.2 (2010) Europe
pyridine-compounds, at regional storehouse, Europe
Materials Agriculture 9.89E+00 kg 2010 Ecoinvent data V2.2 (2010) Europe
rape seed conventional, at farm Materials Agriculture 1.33E+00 kg 2006 Ecoinvent data V2.2 (2010) Germany rape seed conventional, Barrois, at farm Materials Agriculture 1.27E+00 kg 2004 Ecoinvent data V2.2 (2010) France rape seed conventional, Saxony-Anhalt, at farm Materials Agriculture 7.77E-01 kg 2004 Ecoinvent data V2.2 (2010) Germany rape seed extensive, at farm Materials Agriculture 9.54E-01 kg 2003 Ecoinvent data V2.2 (2010) Switzerland rape seed IP, at farm Materials Agriculture 9.17E-01 kg 2003 Ecoinvent data V2.2 (2010) Switzerland rape seed IP, at regional storehouse, CH Materials Agriculture 1.74E+00 kg 2002 Ecoinvent data V2.2 (2010) Switzerland rape seed organic, at regional storehouse, CH Materials Agriculture 1.32E+00 kg 2005 Ecoinvent data V2.2 (2010) Switzerland rape seed, at farm Materials Agriculture 1.89E+00 kg 2006 Ecoinvent data V2.2 (2010) United States rape seed, organic, at farm Materials Agriculture 6.83E-01 kg 2005 Ecoinvent data V2.2 (2010) Switzerland rice seed, at regional storehouse, USA Materials Agriculture 1.95E+00 kg 2006 Ecoinvent data V2.2 (2010) United States rice, at farm Materials Agriculture 1.90E+00 kg 2006 Ecoinvent data V2.2 (2010) United States rye grains conventional, at farm Materials Agriculture 5.14E-01 kg 2006 Ecoinvent data V2.2 (2010) Europe rye grains extensive, at farm Materials Agriculture 3.73E-01 kg 2003 Ecoinvent data V2.2 (2010) Switzerland rye grains IP, at farm Materials Agriculture 3.04E-01 kg 2003 Ecoinvent data V2.2 (2010) Switzerland rye grains organic, at farm Materials Agriculture 4.24E-01 kg 2003 Ecoinvent data V2.2 (2010) Switzerland rye IP, at feed mill Materials Agriculture 3.84E-01 kg 1999 Ecoinvent data V2.2 (2010) Switzerland rye organic, at feed mill Materials Agriculture 4.77E-01 kg 1999 Ecoinvent data V2.2 (2010) Switzerland rye seed IP, at regional storehouse, CH Materials Agriculture 3.38E-01 kg 2002 Ecoinvent data V2.2 (2010) Switzerland rye seed organic, at regional storehouse, CH Materials Agriculture 4.57E-01 kg 2002 Ecoinvent data V2.2 (2010) Switzerland rye straw conventional, at farm Materials Agriculture 1.09E-01 kg 2006 Ecoinvent data V2.2 (2010) Europe rye straw extensive, at farm Materials Agriculture 6.98E-02 kg 2003 Ecoinvent data V2.2 (2010) Switzerland rye straw IP, at farm Materials Agriculture 5.87E-02 kg 2003 Ecoinvent data V2.2 (2010) Switzerland rye straw organic, at farm Materials Agriculture 5.28E-02 kg 2003 Ecoinvent data V2.2 (2010) Switzerland sheep for slaughtering, live weight, at farm, USA Materials Agriculture 4.44E+00 kg 2006 Ecoinvent data V2.2 (2010) United States
silage maize IP, at farm Materials Agriculture 5.32E-02 kg 2003 Ecoinvent data V2.2 (2010) Switzerland silage maize organic, at farm Materials Agriculture 3.76E-02 kg 2003 Ecoinvent data V2.2 (2010) Switzerland
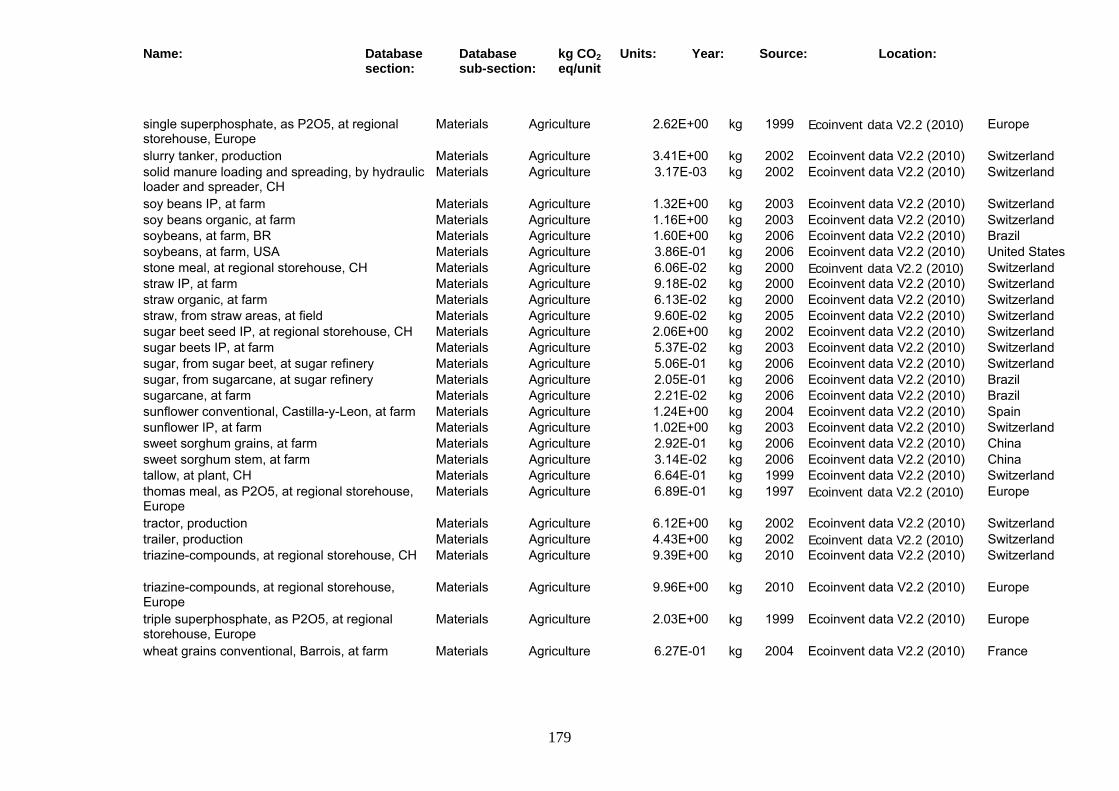
Name: Database section:
Database sub-section:
kg CO2 eq/unit
Units: Year: Source: Location:
179
single superphosphate, as P2O5, at regional storehouse, Europe
Materials Agriculture 2.62E+00 kg 1999 Ecoinvent data V2.2 (2010) Europe
slurry tanker, production Materials Agriculture 3.41E+00 kg 2002 Ecoinvent data V2.2 (2010) Switzerland solid manure loading and spreading, by hydraulic loader and spreader, CH
Materials Agriculture 3.17E-03 kg 2002 Ecoinvent data V2.2 (2010) Switzerland
soy beans IP, at farm Materials Agriculture 1.32E+00 kg 2003 Ecoinvent data V2.2 (2010) Switzerland soy beans organic, at farm Materials Agriculture 1.16E+00 kg 2003 Ecoinvent data V2.2 (2010) Switzerland soybeans, at farm, BR Materials Agriculture 1.60E+00 kg 2006 Ecoinvent data V2.2 (2010) Brazil soybeans, at farm, USA Materials Agriculture 3.86E-01 kg 2006 Ecoinvent data V2.2 (2010) United States stone meal, at regional storehouse, CH Materials Agriculture 6.06E-02 kg 2000 Ecoinvent data V2.2 (2010) Switzerland straw IP, at farm Materials Agriculture 9.18E-02 kg 2000 Ecoinvent data V2.2 (2010) Switzerland straw organic, at farm Materials Agriculture 6.13E-02 kg 2000 Ecoinvent data V2.2 (2010) Switzerland straw, from straw areas, at field Materials Agriculture 9.60E-02 kg 2005 Ecoinvent data V2.2 (2010) Switzerland sugar beet seed IP, at regional storehouse, CH Materials Agriculture 2.06E+00 kg 2002 Ecoinvent data V2.2 (2010) Switzerland sugar beets IP, at farm Materials Agriculture 5.37E-02 kg 2003 Ecoinvent data V2.2 (2010) Switzerland sugar, from sugar beet, at sugar refinery Materials Agriculture 5.06E-01 kg 2006 Ecoinvent data V2.2 (2010) Switzerland sugar, from sugarcane, at sugar refinery Materials Agriculture 2.05E-01 kg 2006 Ecoinvent data V2.2 (2010) Brazil sugarcane, at farm Materials Agriculture 2.21E-02 kg 2006 Ecoinvent data V2.2 (2010) Brazil sunflower conventional, Castilla-y-Leon, at farm Materials Agriculture 1.24E+00 kg 2004 Ecoinvent data V2.2 (2010) Spain sunflower IP, at farm Materials Agriculture 1.02E+00 kg 2003 Ecoinvent data V2.2 (2010) Switzerland sweet sorghum grains, at farm Materials Agriculture 2.92E-01 kg 2006 Ecoinvent data V2.2 (2010) China sweet sorghum stem, at farm Materials Agriculture 3.14E-02 kg 2006 Ecoinvent data V2.2 (2010) China tallow, at plant, CH Materials Agriculture 6.64E-01 kg 1999 Ecoinvent data V2.2 (2010) Switzerland thomas meal, as P2O5, at regional storehouse, Europe
Materials Agriculture 6.89E-01 kg 1997 Ecoinvent data V2.2 (2010) Europe
tractor, production Materials Agriculture 6.12E+00 kg 2002 Ecoinvent data V2.2 (2010) Switzerland trailer, production Materials Agriculture 4.43E+00 kg 2002 Ecoinvent data V2.2 (2010) Switzerland triazine-compounds, at regional storehouse, CH Materials Agriculture 9.39E+00 kg 2010 Ecoinvent data V2.2 (2010) Switzerland
triazine-compounds, at regional storehouse, Europe
Materials Agriculture 9.96E+00 kg 2010 Ecoinvent data V2.2 (2010) Europe
triple superphosphate, as P2O5, at regional storehouse, Europe
Materials Agriculture 2.03E+00 kg 1999 Ecoinvent data V2.2 (2010) Europe
wheat grains conventional, Barrois, at farm Materials Agriculture 6.27E-01 kg 2004 Ecoinvent data V2.2 (2010) France
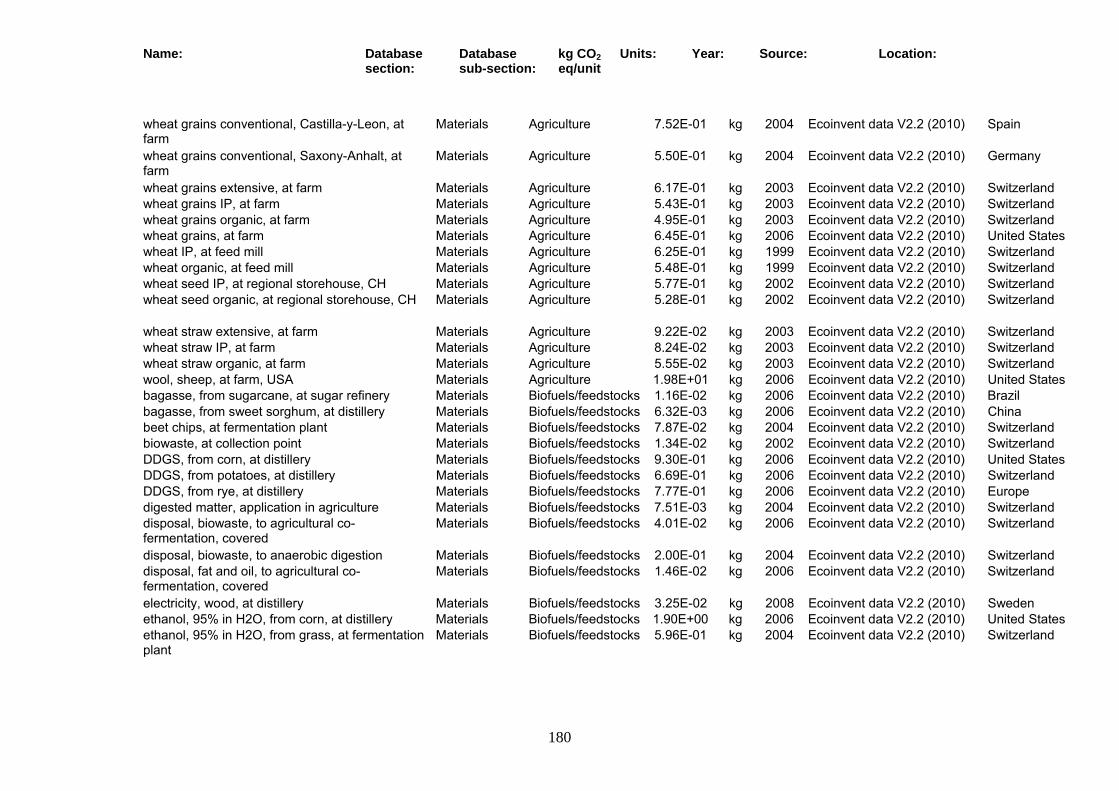
Name: Database section:
Database sub-section:
kg CO2 eq/unit
Units: Year: Source: Location:
180
wheat grains conventional, Castilla-y-Leon, at farm
Materials Agriculture 7.52E-01 kg 2004 Ecoinvent data V2.2 (2010) Spain
wheat grains conventional, Saxony-Anhalt, at farm
Materials Agriculture 5.50E-01 kg 2004 Ecoinvent data V2.2 (2010) Germany
wheat grains extensive, at farm Materials Agriculture 6.17E-01 kg 2003 Ecoinvent data V2.2 (2010) Switzerland wheat grains IP, at farm Materials Agriculture 5.43E-01 kg 2003 Ecoinvent data V2.2 (2010) Switzerland wheat grains organic, at farm Materials Agriculture 4.95E-01 kg 2003 Ecoinvent data V2.2 (2010) Switzerland wheat grains, at farm Materials Agriculture 6.45E-01 kg 2006 Ecoinvent data V2.2 (2010) United States wheat IP, at feed mill Materials Agriculture 6.25E-01 kg 1999 Ecoinvent data V2.2 (2010) Switzerland wheat organic, at feed mill Materials Agriculture 5.48E-01 kg 1999 Ecoinvent data V2.2 (2010) Switzerland wheat seed IP, at regional storehouse, CH Materials Agriculture 5.77E-01 kg 2002 Ecoinvent data V2.2 (2010) Switzerland wheat seed organic, at regional storehouse, CH Materials Agriculture 5.28E-01 kg 2002 Ecoinvent data V2.2 (2010) Switzerland
wheat straw extensive, at farm Materials Agriculture 9.22E-02 kg 2003 Ecoinvent data V2.2 (2010) Switzerland wheat straw IP, at farm Materials Agriculture 8.24E-02 kg 2003 Ecoinvent data V2.2 (2010) Switzerland wheat straw organic, at farm Materials Agriculture 5.55E-02 kg 2003 Ecoinvent data V2.2 (2010) Switzerland wool, sheep, at farm, USA Materials Agriculture 1.98E+01 kg 2006 Ecoinvent data V2.2 (2010) United States bagasse, from sugarcane, at sugar refinery Materials Biofuels/feedstocks 1.16E-02 kg 2006 Ecoinvent data V2.2 (2010) Brazil bagasse, from sweet sorghum, at distillery Materials Biofuels/feedstocks 6.32E-03 kg 2006 Ecoinvent data V2.2 (2010) China beet chips, at fermentation plant Materials Biofuels/feedstocks 7.87E-02 kg 2004 Ecoinvent data V2.2 (2010) Switzerland biowaste, at collection point Materials Biofuels/feedstocks 1.34E-02 kg 2002 Ecoinvent data V2.2 (2010) Switzerland DDGS, from corn, at distillery Materials Biofuels/feedstocks 9.30E-01 kg 2006 Ecoinvent data V2.2 (2010) United States DDGS, from potatoes, at distillery Materials Biofuels/feedstocks 6.69E-01 kg 2006 Ecoinvent data V2.2 (2010) Switzerland DDGS, from rye, at distillery Materials Biofuels/feedstocks 7.77E-01 kg 2006 Ecoinvent data V2.2 (2010) Europe digested matter, application in agriculture Materials Biofuels/feedstocks 7.51E-03 kg 2004 Ecoinvent data V2.2 (2010) Switzerland disposal, biowaste, to agricultural co-fermentation, covered
Materials Biofuels/feedstocks 4.01E-02 kg 2006 Ecoinvent data V2.2 (2010) Switzerland
disposal, biowaste, to anaerobic digestion Materials Biofuels/feedstocks 2.00E-01 kg 2004 Ecoinvent data V2.2 (2010) Switzerland disposal, fat and oil, to agricultural co-fermentation, covered
Materials Biofuels/feedstocks 1.46E-02 kg 2006 Ecoinvent data V2.2 (2010) Switzerland
electricity, wood, at distillery Materials Biofuels/feedstocks 3.25E-02 kg 2008 Ecoinvent data V2.2 (2010) Sweden ethanol, 95% in H2O, from corn, at distillery Materials Biofuels/feedstocks 1.90E+00 kg 2006 Ecoinvent data V2.2 (2010) United States ethanol, 95% in H2O, from grass, at fermentation plant
Materials Biofuels/feedstocks 5.96E-01 kg 2004 Ecoinvent data V2.2 (2010) Switzerland
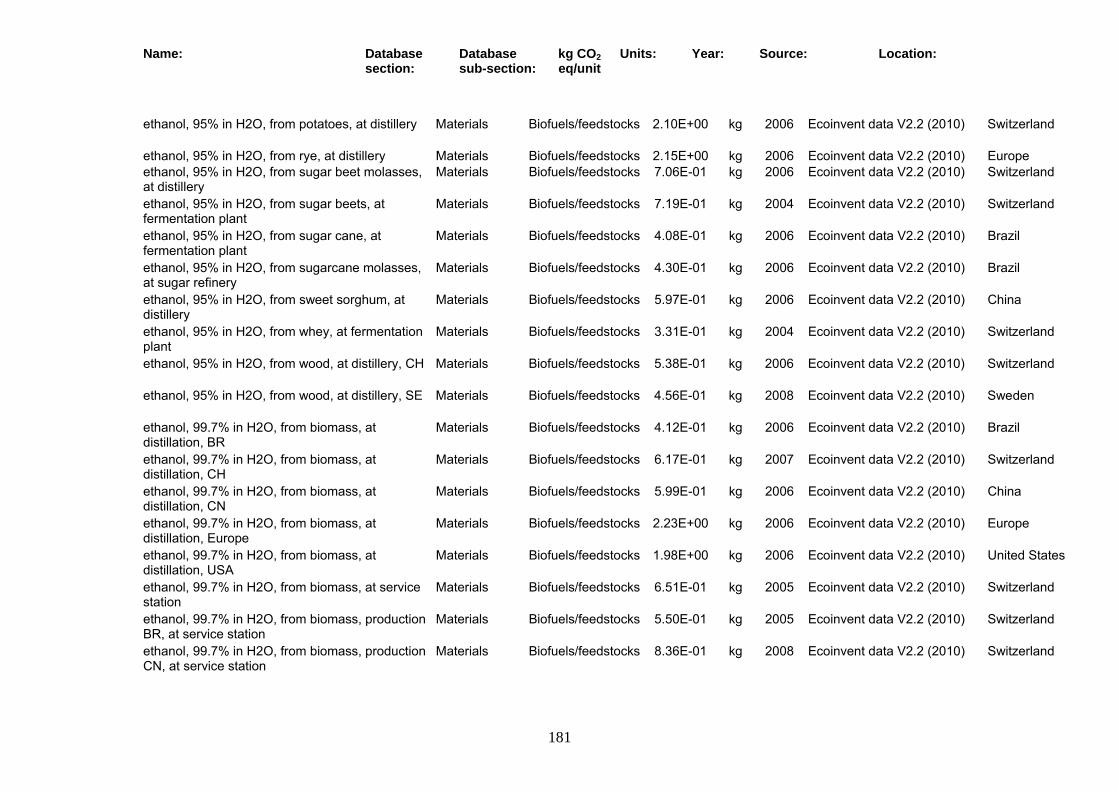
Name: Database section:
Database sub-section:
kg CO2 eq/unit
Units: Year: Source: Location:
181
ethanol, 95% in H2O, from potatoes, at distillery Materials Biofuels/feedstocks 2.10E+00 kg 2006 Ecoinvent data V2.2 (2010) Switzerland
ethanol, 95% in H2O, from rye, at distillery Materials Biofuels/feedstocks 2.15E+00 kg 2006 Ecoinvent data V2.2 (2010) Europe ethanol, 95% in H2O, from sugar beet molasses, at distillery
Materials Biofuels/feedstocks 7.06E-01 kg 2006 Ecoinvent data V2.2 (2010) Switzerland
ethanol, 95% in H2O, from sugar beets, at fermentation plant
Materials Biofuels/feedstocks 7.19E-01 kg 2004 Ecoinvent data V2.2 (2010) Switzerland
ethanol, 95% in H2O, from sugar cane, at fermentation plant
Materials Biofuels/feedstocks 4.08E-01 kg 2006 Ecoinvent data V2.2 (2010) Brazil
ethanol, 95% in H2O, from sugarcane molasses, at sugar refinery
Materials Biofuels/feedstocks 4.30E-01 kg 2006 Ecoinvent data V2.2 (2010) Brazil
ethanol, 95% in H2O, from sweet sorghum, at distillery
Materials Biofuels/feedstocks 5.97E-01 kg 2006 Ecoinvent data V2.2 (2010) China
ethanol, 95% in H2O, from whey, at fermentation plant
Materials Biofuels/feedstocks 3.31E-01 kg 2004 Ecoinvent data V2.2 (2010) Switzerland
ethanol, 95% in H2O, from wood, at distillery, CH Materials Biofuels/feedstocks 5.38E-01 kg 2006 Ecoinvent data V2.2 (2010) Switzerland
ethanol, 95% in H2O, from wood, at distillery, SE Materials Biofuels/feedstocks 4.56E-01 kg 2008 Ecoinvent data V2.2 (2010) Sweden
ethanol, 99.7% in H2O, from biomass, at distillation, BR
Materials Biofuels/feedstocks 4.12E-01 kg 2006 Ecoinvent data V2.2 (2010) Brazil
ethanol, 99.7% in H2O, from biomass, at distillation, CH
Materials Biofuels/feedstocks 6.17E-01 kg 2007 Ecoinvent data V2.2 (2010) Switzerland
ethanol, 99.7% in H2O, from biomass, at distillation, CN
Materials Biofuels/feedstocks 5.99E-01 kg 2006 Ecoinvent data V2.2 (2010) China
ethanol, 99.7% in H2O, from biomass, at distillation, Europe
Materials Biofuels/feedstocks 2.23E+00 kg 2006 Ecoinvent data V2.2 (2010) Europe
ethanol, 99.7% in H2O, from biomass, at distillation, USA
Materials Biofuels/feedstocks 1.98E+00 kg 2006 Ecoinvent data V2.2 (2010) United States
ethanol, 99.7% in H2O, from biomass, at service station
Materials Biofuels/feedstocks 6.51E-01 kg 2005 Ecoinvent data V2.2 (2010) Switzerland
ethanol, 99.7% in H2O, from biomass, production BR, at service station
Materials Biofuels/feedstocks 5.50E-01 kg 2005 Ecoinvent data V2.2 (2010) Switzerland
ethanol, 99.7% in H2O, from biomass, production CN, at service station
Materials Biofuels/feedstocks 8.36E-01 kg 2008 Ecoinvent data V2.2 (2010) Switzerland

Name: Database section:
Database sub-section:
kg CO2 eq/unit
Units: Year: Source: Location:
182
ethanol, 99.7% in H2O, from biomass, production US, at service station
Materials Biofuels/feedstocks 2.17E+00 kg 2008 Ecoinvent data V2.2 (2010) Switzerland
ethanol, 99.7% in H2O, from biomass, production, Europe, at service station
Materials Biofuels/feedstocks 2.31E+00 kg 2008 Ecoinvent data V2.2 (2010) Switzerland
ethanol, 99.7% in H2O, from Swedish wood, at service station
Materials Biofuels/feedstocks 6.50E-01 kg 2008 Ecoinvent data V2.2 (2010) Switzerland
ethanol, 99.7% in H2O, from wood, at distillation Materials Biofuels/feedstocks 5.30E-01 kg 2008 Ecoinvent data V2.2 (2010) Sweden
ethyl tert-butyl ether, from bioethanol, at plant Materials Biofuels/feedstocks 1.50E+00 kg 2006 Ecoinvent data V2.2 (2010) Europe grass fibres, at digestion Materials Biofuels/feedstocks 1.06E+00 kg 2003 Ecoinvent data V2.2 (2010) Switzerland grass fibres, at fermentation Materials Biofuels/feedstocks 5.54E-01 kg 2004 Ecoinvent data V2.2 (2010) Switzerland methane, 96 vol-%, from biogas, from high pressure network, at service station
Materials Biofuels/feedstocks 2.20E+00 kg 2001 Ecoinvent data V2.2 (2010) Switzerland
methane, 96 vol-%, from biogas, from low pressure network, at service station
Materials Biofuels/feedstocks 2.46E+00 kg 2001 Ecoinvent data V2.2 (2010) Switzerland
methane, 96 vol-%, from biogas, from medium pressure network, at service station
Materials Biofuels/feedstocks 2.22E+00 kg 2001 Ecoinvent data V2.2 (2010) Switzerland
methane, 96 vol-%, from biogas, production mix, at service station
Materials Biofuels/feedstocks 2.21E+00 kg 2001 Ecoinvent data V2.2 (2010) Switzerland
methanol, from biomass, at regional storage Materials Biofuels/feedstocks 3.03E-01 kg 2006 Ecoinvent data V2.2 (2010) Switzerland methanol, from synthetic gas, at plant Materials Biofuels/feedstocks 2.69E-01 kg 2006 Ecoinvent data V2.2 (2010) Switzerland molasses, from sugar beet, at sugar refinery Materials Biofuels/feedstocks 1.08E-01 kg 2006 Ecoinvent data V2.2 (2010) Switzerland palm kernel meal, at oil mill Materials Biofuels/feedstocks 1.98E-01 kg 2006 Ecoinvent data V2.2 (2010) Malaysia palm methyl ester, at esterification plant Materials Biofuels/feedstocks 1.69E+00 kg 2006 Ecoinvent data V2.2 (2010) Malaysia palm methyl ester, production Malaysia, at service station
Materials Biofuels/feedstocks 1.83E+00 kg 2008 Ecoinvent data V2.2 (2010) Switzerland
petrol, 85% vol. ethanol, from biomass, at service station
Materials Biofuels/feedstocks 1.17E+00 kg 2008 Ecoinvent data V2.2 (2010) Switzerland
petrol, 85% vol. ethanol, from Swedish wood, at service station
Materials Biofuels/feedstocks 6.70E-01 kg 2008 Ecoinvent data V2.2 (2010) Switzerland
protein concentrate, from whey, at fermentation Materials Biofuels/feedstocks 1.23E-01 kg 2004 Ecoinvent data V2.2 (2010) Switzerland protInsulators, from grass, at digestion Materials Biofuels/feedstocks 1.22E+00 kg 2003 Ecoinvent data V2.2 (2010) Switzerland protInsulators, from grass, at fermentation Materials Biofuels/feedstocks 4.01E-01 kg 2004 Ecoinvent data V2.2 (2010) Switzerland pulps, from sugar beet, at sugar refinery Materials Biofuels/feedstocks 1.38E-02 kg 2006 Ecoinvent data V2.2 (2010) Switzerland rape meal, at oil mill, CH Materials Biofuels/feedstocks 4.02E-01 kg 2006 Ecoinvent data V2.2 (2010) Switzerland

Name: Database section:
Database sub-section:
kg CO2 eq/unit
Units: Year: Source: Location:
183
rape meal, at oil mill, Europe Materials Biofuels/feedstocks 5.82E-01 kg 2006 Ecoinvent data V2.2 (2010) Europe rape methyl ester, at esterification plant, CH Materials Biofuels/feedstocks 2.06E+00 kg 2006 Ecoinvent data V2.2 (2010) Switzerland rape methyl ester, at esterification plant, Europe Materials Biofuels/feedstocks 2.62E+00 kg 2006 Ecoinvent data V2.2 (2010) Europe
rape methyl ester, at regional storage Materials Biofuels/feedstocks 2.09E+00 kg 2008 Ecoinvent data V2.2 (2010) Switzerland rape methyl ester, production, Europe, at service station
Materials Biofuels/feedstocks 2.70E+00 kg 2008 Ecoinvent data V2.2 (2010) Switzerland
rape oil, at oil mill, CH Materials Biofuels/feedstocks 1.88E+00 kg 2006 Ecoinvent data V2.2 (2010) Switzerland rape oil, at oil mill, Europe Materials Biofuels/feedstocks 2.73E+00 kg 2006 Ecoinvent data V2.2 (2010) Europe rape oil, at regional storage Materials Biofuels/feedstocks 1.91E+00 kg 2008 Ecoinvent data V2.2 (2010) Switzerland soybean meal, at oil mill, BR Materials Biofuels/feedstocks 1.36E+00 kg 2006 Ecoinvent data V2.2 (2010) Brazil soybean meal, at oil mill, USA Materials Biofuels/feedstocks 4.56E-01 kg 2006 Ecoinvent data V2.2 (2010) United States soybean methyl ester, at esterification plant, BR Materials Biofuels/feedstocks 3.75E+00 kg 2006 Ecoinvent data V2.2 (2010) Brazil
soybean methyl ester, at esterification plant, USA Materials Biofuels/feedstocks 1.07E+00 kg 2006 Ecoinvent data V2.2 (2010) United States
soybean methyl ester, production BR, at service station
Materials Biofuels/feedstocks 3.92E+00 kg 2008 Ecoinvent data V2.2 (2010) Switzerland
soybean methyl ester, production US, at service station
Materials Biofuels/feedstocks 1.25E+00 kg 2008 Ecoinvent data V2.2 (2010) Switzerland
soybean oil, at oil mill, BR Materials Biofuels/feedstocks 3.77E+00 kg 2006 Ecoinvent data V2.2 (2010) Brazil soybean oil, at oil mill, USA Materials Biofuels/feedstocks 9.20E-01 kg 2006 Ecoinvent data V2.2 (2010) United States syrup, from sugar beet molasses, at distillery Materials Biofuels/feedstocks 2.88E-01 kg 2006 Ecoinvent data V2.2 (2010) Switzerland vegetable oil methyl ester, at esterification plant Materials Biofuels/feedstocks 3.08E-01 kg 2006 Ecoinvent data V2.2 (2010) France
vegetable oil methyl ester, production FR, at service station
Materials Biofuels/feedstocks 3.72E-01 kg 2008 Ecoinvent data V2.2 (2010) Switzerland
vegetable oil, from waste cooking oil, at plant, CH Materials Biofuels/feedstocks 4.14E-01 kg 2006 Ecoinvent data V2.2 (2010) Switzerland
vegetable oil, from waste cooking oil, at plant, FR Materials Biofuels/feedstocks 1.59E-01 kg 2006 Ecoinvent data V2.2 (2010) France
vinasse, at fermentation plant Materials Biofuels/feedstocks 2.05E-02 kg 2004 Ecoinvent data V2.2 (2010) Switzerland yeast paste, from whey, at fermentation Materials Biofuels/feedstocks 1.04E+00 kg 2004 Ecoinvent data V2.2 (2010) Switzerland 1,1-difluoroethane, HFC-152a, at plant Materials Chemicals 5.45E+00 kg 2006 Ecoinvent data V2.2 (2010) United States
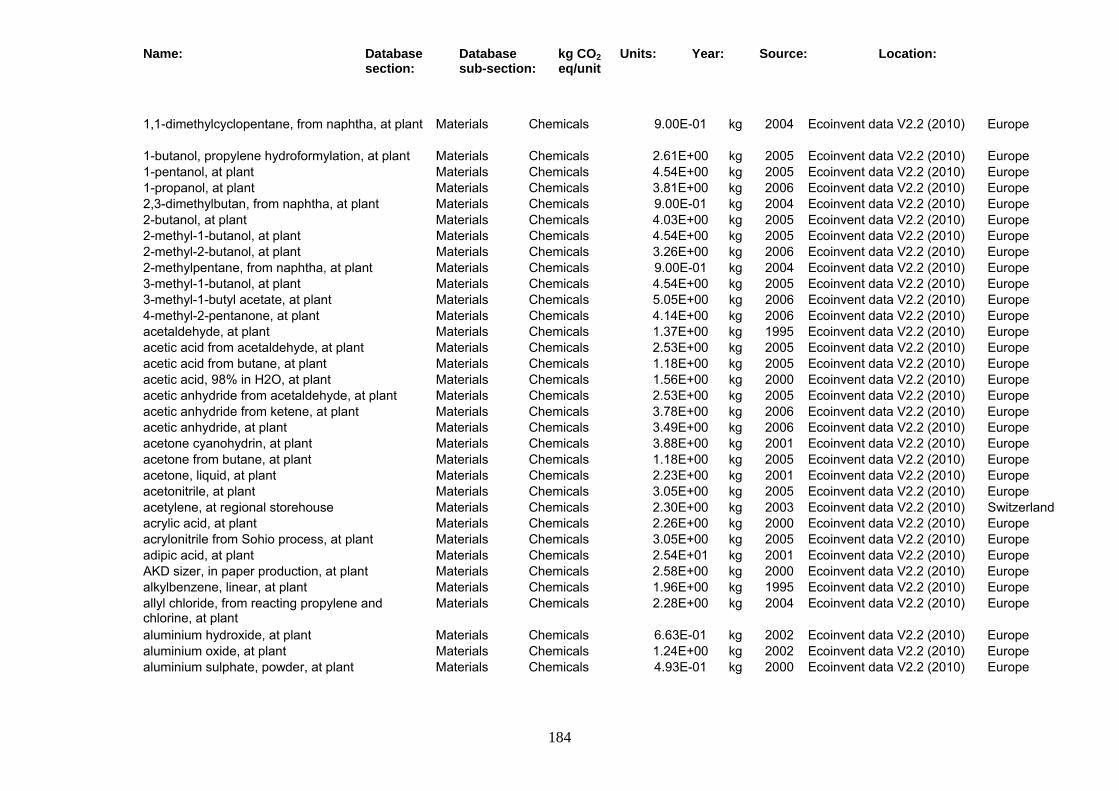
Name: Database section:
Database sub-section:
kg CO2 eq/unit
Units: Year: Source: Location:
184
1,1-dimethylcyclopentane, from naphtha, at plant Materials Chemicals 9.00E-01 kg 2004 Ecoinvent data V2.2 (2010) Europe
1-butanol, propylene hydroformylation, at plant Materials Chemicals 2.61E+00 kg 2005 Ecoinvent data V2.2 (2010) Europe 1-pentanol, at plant Materials Chemicals 4.54E+00 kg 2005 Ecoinvent data V2.2 (2010) Europe 1-propanol, at plant Materials Chemicals 3.81E+00 kg 2006 Ecoinvent data V2.2 (2010) Europe 2,3-dimethylbutan, from naphtha, at plant Materials Chemicals 9.00E-01 kg 2004 Ecoinvent data V2.2 (2010) Europe 2-butanol, at plant Materials Chemicals 4.03E+00 kg 2005 Ecoinvent data V2.2 (2010) Europe 2-methyl-1-butanol, at plant Materials Chemicals 4.54E+00 kg 2005 Ecoinvent data V2.2 (2010) Europe 2-methyl-2-butanol, at plant Materials Chemicals 3.26E+00 kg 2006 Ecoinvent data V2.2 (2010) Europe 2-methylpentane, from naphtha, at plant Materials Chemicals 9.00E-01 kg 2004 Ecoinvent data V2.2 (2010) Europe 3-methyl-1-butanol, at plant Materials Chemicals 4.54E+00 kg 2005 Ecoinvent data V2.2 (2010) Europe 3-methyl-1-butyl acetate, at plant Materials Chemicals 5.05E+00 kg 2006 Ecoinvent data V2.2 (2010) Europe 4-methyl-2-pentanone, at plant Materials Chemicals 4.14E+00 kg 2006 Ecoinvent data V2.2 (2010) Europe acetaldehyde, at plant Materials Chemicals 1.37E+00 kg 1995 Ecoinvent data V2.2 (2010) Europe acetic acid from acetaldehyde, at plant Materials Chemicals 2.53E+00 kg 2005 Ecoinvent data V2.2 (2010) Europe acetic acid from butane, at plant Materials Chemicals 1.18E+00 kg 2005 Ecoinvent data V2.2 (2010) Europe acetic acid, 98% in H2O, at plant Materials Chemicals 1.56E+00 kg 2000 Ecoinvent data V2.2 (2010) Europe acetic anhydride from acetaldehyde, at plant Materials Chemicals 2.53E+00 kg 2005 Ecoinvent data V2.2 (2010) Europe acetic anhydride from ketene, at plant Materials Chemicals 3.78E+00 kg 2006 Ecoinvent data V2.2 (2010) Europe acetic anhydride, at plant Materials Chemicals 3.49E+00 kg 2006 Ecoinvent data V2.2 (2010) Europe acetone cyanohydrin, at plant Materials Chemicals 3.88E+00 kg 2001 Ecoinvent data V2.2 (2010) Europe acetone from butane, at plant Materials Chemicals 1.18E+00 kg 2005 Ecoinvent data V2.2 (2010) Europe acetone, liquid, at plant Materials Chemicals 2.23E+00 kg 2001 Ecoinvent data V2.2 (2010) Europe acetonitrile, at plant Materials Chemicals 3.05E+00 kg 2005 Ecoinvent data V2.2 (2010) Europe acetylene, at regional storehouse Materials Chemicals 2.30E+00 kg 2003 Ecoinvent data V2.2 (2010) Switzerland acrylic acid, at plant Materials Chemicals 2.26E+00 kg 2000 Ecoinvent data V2.2 (2010) Europe acrylonitrile from Sohio process, at plant Materials Chemicals 3.05E+00 kg 2005 Ecoinvent data V2.2 (2010) Europe adipic acid, at plant Materials Chemicals 2.54E+01 kg 2001 Ecoinvent data V2.2 (2010) Europe AKD sizer, in paper production, at plant Materials Chemicals 2.58E+00 kg 2000 Ecoinvent data V2.2 (2010) Europe alkylbenzene, linear, at plant Materials Chemicals 1.96E+00 kg 1995 Ecoinvent data V2.2 (2010) Europe allyl chloride, from reacting propylene and chlorine, at plant
Materials Chemicals 2.28E+00 kg 2004 Ecoinvent data V2.2 (2010) Europe
aluminium hydroxide, at plant Materials Chemicals 6.63E-01 kg 2002 Ecoinvent data V2.2 (2010) Europe aluminium oxide, at plant Materials Chemicals 1.24E+00 kg 2002 Ecoinvent data V2.2 (2010) Europe aluminium sulphate, powder, at plant Materials Chemicals 4.93E-01 kg 2000 Ecoinvent data V2.2 (2010) Europe

Name: Database section:
Database sub-section:
kg CO2 eq/unit
Units: Year: Source: Location:
185
ammonia, liquid, at regional storehouse, CH Materials Chemicals 2.10E+00 kg 2000 Ecoinvent data V2.2 (2010) Switzerland ammonia, liquid, at regional storehouse, Europe Materials Chemicals 2.10E+00 kg 2000 Ecoinvent data V2.2 (2010) Europe
ammonia, partial oxidation, liquid, at plant Materials Chemicals 2.90E+00 kg 2000 Ecoinvent data V2.2 (2010) Europe ammonia, steam reforming, liquid, at plant Materials Chemicals 1.91E+00 kg 2000 Ecoinvent data V2.2 (2010) Europe ammonium bicarbonate, at plant Materials Chemicals 1.18E+00 kg 1995 Ecoinvent data V2.2 (2010) Europe ammonium carbonate, at plant Materials Chemicals 1.55E+00 kg 2000 Ecoinvent data V2.2 (2010) Europe ammonium chloride from chlorosilane, at plant Materials Chemicals 3.06E+00 kg 2006 Ecoinvent data V2.2 (2010) Global ammonium chloride, at plant Materials Chemicals 1.05E+00 kg 2006 Ecoinvent data V2.2 (2010) Global ammonium thiocyanate, at plant Materials Chemicals 2.05E+00 kg 2006 Ecoinvent data V2.2 (2010) Global aniline, at plant Materials Chemicals 4.88E+00 kg 2000 Ecoinvent data V2.2 (2010) Europe anionic resin, at plant Materials Chemicals 3.78E+00 kg 2002 Ecoinvent data V2.2 (2010) Switzerland anthraquinone, at plant Materials Chemicals 1.88E+01 kg 2000 Ecoinvent data V2.2 (2010) Europe argon, crude, liquid, at plant Materials Chemicals 2.74E-01 kg 2001 Ecoinvent data V2.2 (2010) Europe argon, liquid, at plant Materials Chemicals 3.13E-01 kg 2001 Ecoinvent data V2.2 (2010) Europe arsine, at plant Materials Chemicals 6.70E+00 kg 2006 Ecoinvent data V2.2 (2010) Global barite, at plant Materials Chemicals 1.88E-01 kg 1978 Ecoinvent data V2.2 (2010) Europe benzal chloride, at plant Materials Chemicals 2.61E+00 kg 2006 Ecoinvent data V2.2 (2010) Europe benzaldehyde, at plant Materials Chemicals 4.95E+00 kg 2006 Ecoinvent data V2.2 (2010) Europe benzene, at plant Materials Chemicals 1.79E+00 kg 2002 Ecoinvent data V2.2 (2010) Europe benzyl alcohol, at plant Materials Chemicals 4.15E+00 kg 2006 Ecoinvent data V2.2 (2010) Europe benzyl chloride, at plant Materials Chemicals 2.52E+00 kg 2006 Ecoinvent data V2.2 (2010) Europe biocides, for paper production, unspecified, at plant
Materials Chemicals 5.65E+00 kg 2000 Ecoinvent data V2.2 (2010) Europe
bisphenol A, powder, at plant Materials Chemicals 4.88E+00 kg 2000 Ecoinvent data V2.2 (2010) Europe Borax, anhydrous, powder, at plant Materials Chemicals 1.65E+00 kg 2000 Ecoinvent data V2.2 (2010) Europe boric acid, anhydrous, powder, at plant Materials Chemicals 7.13E-01 kg 2000 Ecoinvent data V2.2 (2010) Europe boric oxide, at plant Materials Chemicals 1.77E+00 kg 2006 Ecoinvent data V2.2 (2010) Global boron carbide, at plant Materials Chemicals 1.40E+01 kg 2006 Ecoinvent data V2.2 (2010) Global boron trifluoride, at plant Materials Chemicals 3.62E+00 kg 2006 Ecoinvent data V2.2 (2010) Global butane-1,4-diol, at plant Materials Chemicals 4.35E+00 kg 2006 Ecoinvent data V2.2 (2010) Europe butanes from butenes, at plant Materials Chemicals 4.03E+00 kg 2005 Ecoinvent data V2.2 (2010) Europe butyl acetate, at plant Materials Chemicals 3.55E+00 kg 2006 Ecoinvent data V2.2 (2010) Europe butyl acrylate, at plant Materials Chemicals 4.34E+00 kg 1995 Ecoinvent data V2.2 (2010) Europe butyrolactone Materials Chemicals 3.29E+00 kg 2007 Ecoinvent data V2.2 (2010) Global

Name: Database section:
Database sub-section:
kg CO2 eq/unit
Units: Year: Source: Location:
186
calcium borates, at plant Materials Chemicals 8.18E-02 kg 2000 Ecoinvent data V2.2 (2010) Turkey calcium carbide, technical grade, at plant Materials Chemicals 3.71E+00 kg 2000 Ecoinvent data V2.2 (2010) Europe calcium chloride, CaCl2, at plant Materials Chemicals 8.54E-01 kg 1999 Ecoinvent data V2.2 (2010) Europe calcium chloride, CaCl2, at regional storage Materials Chemicals 8.98E-01 kg 2000 Ecoinvent data V2.2 (2010) Switzerland calcium chloride, from hypochlorination of allyl chloride, at plant
Materials Chemicals 4.83E-01 kg 2004 Ecoinvent data V2.2 (2010) Europe
carbon black, at plant Materials Chemicals 2.37E+00 kg 2000 Ecoinvent data V2.2 (2010) Global carbon dioxide liquid, at plant Materials Chemicals 8.16E-01 kg 1999 Ecoinvent data V2.2 (2010) Europe carbon disulfide, at plant Materials Chemicals 8.39E-01 kg 2006 Ecoinvent data V2.2 (2010) Global carbon monoxide, CO, at plant Materials Chemicals 1.55E+00 kg 2000 Ecoinvent data V2.2 (2010) Europe carbon tetrachloride, at plant Materials Chemicals 1.64E+00 kg 1997 Ecoinvent data V2.2 (2010) Europe cationic resin, at plant Materials Chemicals 1.41E+00 kg 2002 Ecoinvent data V2.2 (2010) Switzerland cerium concentrate, 60% cerium oxide, at plant Materials Chemicals 8.31E+00 kg 2005 Ecoinvent data V2.2 (2010) China
chemicals inorganic, at plant Materials Chemicals 1.86E+00 kg 2000 Ecoinvent data V2.2 (2010) Global chemicals organic, at plant Materials Chemicals 1.90E+00 kg 2000 Ecoinvent data V2.2 (2010) Global chlorine dioxide, at plant Materials Chemicals 6.24E+00 kg 2000 Ecoinvent data V2.2 (2010) Europe chlorine, gaseous, diaphragm cell, at plant Materials Chemicals 9.47E-01 kg 2000 Ecoinvent data V2.2 (2010) Europe chlorine, gaseous, lithium chloride electrolysis, at plant
Materials Chemicals 2.11E+01 kg 2006 Ecoinvent data V2.2 (2010) Global
chlorine, gaseous, membrane cell, at plant Materials Chemicals 9.22E-01 kg 2000 Ecoinvent data V2.2 (2010) Europe chlorine, gaseous, mercury cell, at plant Materials Chemicals 1.09E+00 kg 2000 Ecoinvent data V2.2 (2010) Europe chlorine, liquid, production mix, at plant Materials Chemicals 1.06E+00 kg 2000 Ecoinvent data V2.2 (2010) Europe chloroacetic acid, at plant Materials Chemicals 2.15E+00 kg 2000 Ecoinvent data V2.2 (2010) Europe chlorodifluoromethane, at plant Materials Chemicals 7.53E+01 kg 1999 Ecoinvent data V2.2 (2010) Netherlands chloromethyl methyl ether, at plant Materials Chemicals 1.65E+00 kg 2002 Ecoinvent data V2.2 (2010) Europe chromium oxide, flakes, at plant Materials Chemicals 7.04E+00 kg 2000 Ecoinvent data V2.2 (2010) Europe concentrated lithium brine (6.7 % Li), at plant Materials Chemicals 1.79E-02 kg 2010 Ecoinvent data V2.2 (2010) Global copper carbonate, at plant Materials Chemicals 1.88E+00 kg 2000 Ecoinvent data V2.2 (2010) Europe copper oxide, at plant Materials Chemicals 1.95E+00 kg 2000 Ecoinvent data V2.2 (2010) Europe crude coconut oil, at plant Materials Chemicals 1.87E-01 kg 1995 Ecoinvent data V2.2 (2010) Philippines cryolite, at plant Materials Chemicals 2.94E+00 kg 2000 Ecoinvent data V2.2 (2010) Europe cumene, at plant Materials Chemicals 2.31E+00 kg 2000 Ecoinvent data V2.2 (2010) Europe cyclohexane, at plant Materials Chemicals 2.31E+00 kg 2006 Ecoinvent data V2.2 (2010) Europe cyclohexanol, at plant Materials Chemicals 3.09E+00 kg 2000 Ecoinvent data V2.2 (2010) Europe
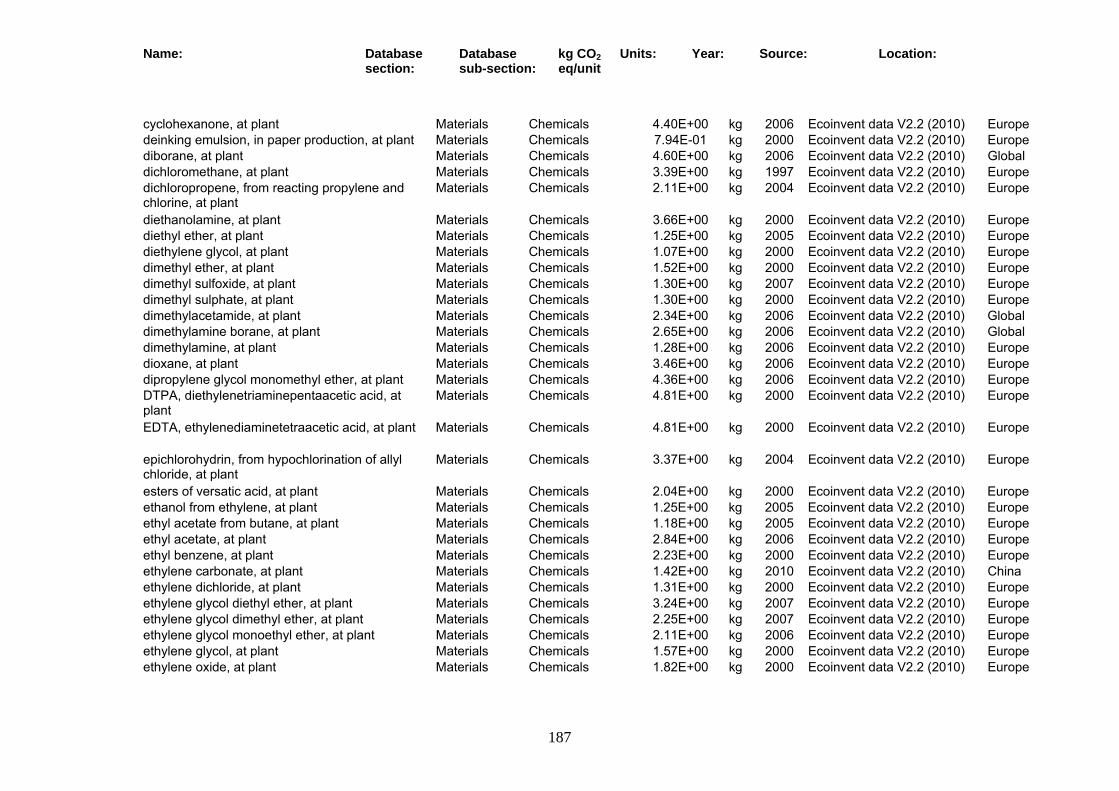
Name: Database section:
Database sub-section:
kg CO2 eq/unit
Units: Year: Source: Location:
187
cyclohexanone, at plant Materials Chemicals 4.40E+00 kg 2006 Ecoinvent data V2.2 (2010) Europe deinking emulsion, in paper production, at plant Materials Chemicals 7.94E-01 kg 2000 Ecoinvent data V2.2 (2010) Europe diborane, at plant Materials Chemicals 4.60E+00 kg 2006 Ecoinvent data V2.2 (2010) Global dichloromethane, at plant Materials Chemicals 3.39E+00 kg 1997 Ecoinvent data V2.2 (2010) Europe dichloropropene, from reacting propylene and chlorine, at plant
Materials Chemicals 2.11E+00 kg 2004 Ecoinvent data V2.2 (2010) Europe
diethanolamine, at plant Materials Chemicals 3.66E+00 kg 2000 Ecoinvent data V2.2 (2010) Europe diethyl ether, at plant Materials Chemicals 1.25E+00 kg 2005 Ecoinvent data V2.2 (2010) Europe diethylene glycol, at plant Materials Chemicals 1.07E+00 kg 2000 Ecoinvent data V2.2 (2010) Europe dimethyl ether, at plant Materials Chemicals 1.52E+00 kg 2000 Ecoinvent data V2.2 (2010) Europe dimethyl sulfoxide, at plant Materials Chemicals 1.30E+00 kg 2007 Ecoinvent data V2.2 (2010) Europe dimethyl sulphate, at plant Materials Chemicals 1.30E+00 kg 2000 Ecoinvent data V2.2 (2010) Europe dimethylacetamide, at plant Materials Chemicals 2.34E+00 kg 2006 Ecoinvent data V2.2 (2010) Global dimethylamine borane, at plant Materials Chemicals 2.65E+00 kg 2006 Ecoinvent data V2.2 (2010) Global dimethylamine, at plant Materials Chemicals 1.28E+00 kg 2006 Ecoinvent data V2.2 (2010) Europe dioxane, at plant Materials Chemicals 3.46E+00 kg 2006 Ecoinvent data V2.2 (2010) Europe dipropylene glycol monomethyl ether, at plant Materials Chemicals 4.36E+00 kg 2006 Ecoinvent data V2.2 (2010) Europe DTPA, diethylenetriaminepentaacetic acid, at plant
Materials Chemicals 4.81E+00 kg 2000 Ecoinvent data V2.2 (2010) Europe
EDTA, ethylenediaminetetraacetic acid, at plant Materials Chemicals 4.81E+00 kg 2000 Ecoinvent data V2.2 (2010) Europe
epichlorohydrin, from hypochlorination of allyl chloride, at plant
Materials Chemicals 3.37E+00 kg 2004 Ecoinvent data V2.2 (2010) Europe
esters of versatic acid, at plant Materials Chemicals 2.04E+00 kg 2000 Ecoinvent data V2.2 (2010) Europe ethanol from ethylene, at plant Materials Chemicals 1.25E+00 kg 2005 Ecoinvent data V2.2 (2010) Europe ethyl acetate from butane, at plant Materials Chemicals 1.18E+00 kg 2005 Ecoinvent data V2.2 (2010) Europe ethyl acetate, at plant Materials Chemicals 2.84E+00 kg 2006 Ecoinvent data V2.2 (2010) Europe ethyl benzene, at plant Materials Chemicals 2.23E+00 kg 2000 Ecoinvent data V2.2 (2010) Europe ethylene carbonate, at plant Materials Chemicals 1.42E+00 kg 2010 Ecoinvent data V2.2 (2010) China ethylene dichloride, at plant Materials Chemicals 1.31E+00 kg 2000 Ecoinvent data V2.2 (2010) Europe ethylene glycol diethyl ether, at plant Materials Chemicals 3.24E+00 kg 2007 Ecoinvent data V2.2 (2010) Europe ethylene glycol dimethyl ether, at plant Materials Chemicals 2.25E+00 kg 2007 Ecoinvent data V2.2 (2010) Europe ethylene glycol monoethyl ether, at plant Materials Chemicals 2.11E+00 kg 2006 Ecoinvent data V2.2 (2010) Europe ethylene glycol, at plant Materials Chemicals 1.57E+00 kg 2000 Ecoinvent data V2.2 (2010) Europe ethylene oxide, at plant Materials Chemicals 1.82E+00 kg 2000 Ecoinvent data V2.2 (2010) Europe
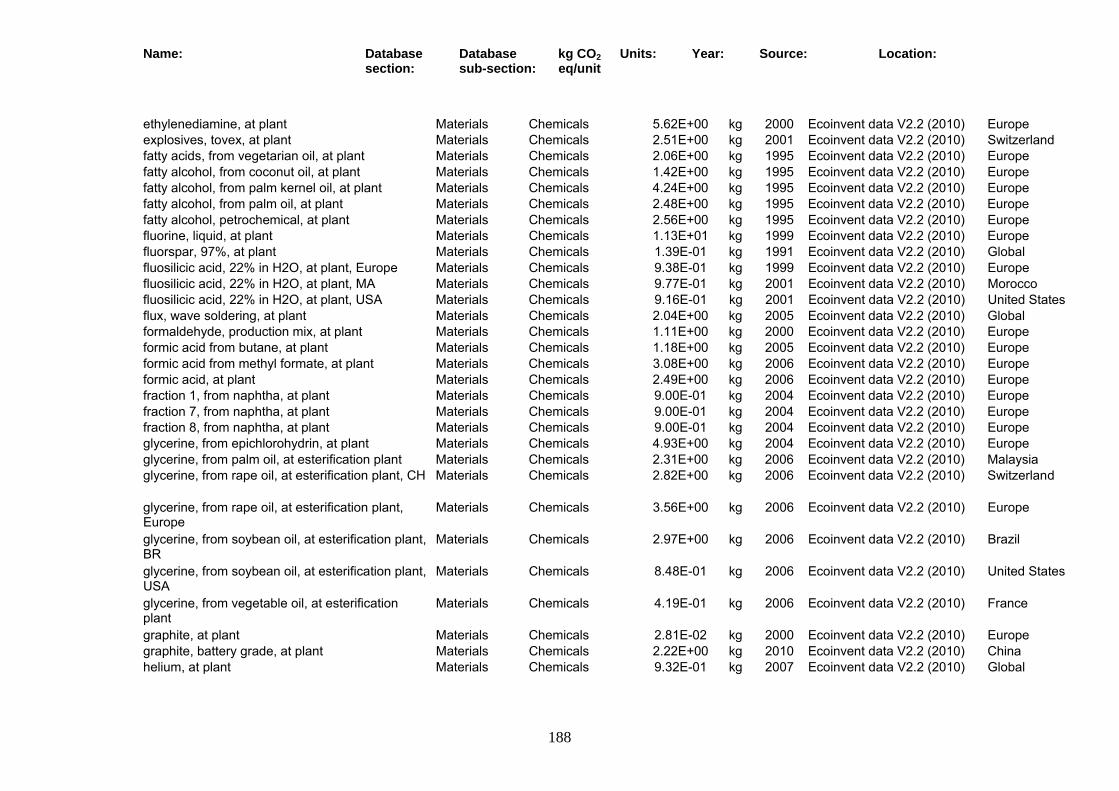
Name: Database section:
Database sub-section:
kg CO2 eq/unit
Units: Year: Source: Location:
188
ethylenediamine, at plant Materials Chemicals 5.62E+00 kg 2000 Ecoinvent data V2.2 (2010) Europe explosives, tovex, at plant Materials Chemicals 2.51E+00 kg 2001 Ecoinvent data V2.2 (2010) Switzerland fatty acids, from vegetarian oil, at plant Materials Chemicals 2.06E+00 kg 1995 Ecoinvent data V2.2 (2010) Europe fatty alcohol, from coconut oil, at plant Materials Chemicals 1.42E+00 kg 1995 Ecoinvent data V2.2 (2010) Europe fatty alcohol, from palm kernel oil, at plant Materials Chemicals 4.24E+00 kg 1995 Ecoinvent data V2.2 (2010) Europe fatty alcohol, from palm oil, at plant Materials Chemicals 2.48E+00 kg 1995 Ecoinvent data V2.2 (2010) Europe fatty alcohol, petrochemical, at plant Materials Chemicals 2.56E+00 kg 1995 Ecoinvent data V2.2 (2010) Europe fluorine, liquid, at plant Materials Chemicals 1.13E+01 kg 1999 Ecoinvent data V2.2 (2010) Europe fluorspar, 97%, at plant Materials Chemicals 1.39E-01 kg 1991 Ecoinvent data V2.2 (2010) Global fluosilicic acid, 22% in H2O, at plant, Europe Materials Chemicals 9.38E-01 kg 1999 Ecoinvent data V2.2 (2010) Europe fluosilicic acid, 22% in H2O, at plant, MA Materials Chemicals 9.77E-01 kg 2001 Ecoinvent data V2.2 (2010) Morocco fluosilicic acid, 22% in H2O, at plant, USA Materials Chemicals 9.16E-01 kg 2001 Ecoinvent data V2.2 (2010) United States flux, wave soldering, at plant Materials Chemicals 2.04E+00 kg 2005 Ecoinvent data V2.2 (2010) Global formaldehyde, production mix, at plant Materials Chemicals 1.11E+00 kg 2000 Ecoinvent data V2.2 (2010) Europe formic acid from butane, at plant Materials Chemicals 1.18E+00 kg 2005 Ecoinvent data V2.2 (2010) Europe formic acid from methyl formate, at plant Materials Chemicals 3.08E+00 kg 2006 Ecoinvent data V2.2 (2010) Europe formic acid, at plant Materials Chemicals 2.49E+00 kg 2006 Ecoinvent data V2.2 (2010) Europe fraction 1, from naphtha, at plant Materials Chemicals 9.00E-01 kg 2004 Ecoinvent data V2.2 (2010) Europe fraction 7, from naphtha, at plant Materials Chemicals 9.00E-01 kg 2004 Ecoinvent data V2.2 (2010) Europe fraction 8, from naphtha, at plant Materials Chemicals 9.00E-01 kg 2004 Ecoinvent data V2.2 (2010) Europe glycerine, from epichlorohydrin, at plant Materials Chemicals 4.93E+00 kg 2004 Ecoinvent data V2.2 (2010) Europe glycerine, from palm oil, at esterification plant Materials Chemicals 2.31E+00 kg 2006 Ecoinvent data V2.2 (2010) Malaysia glycerine, from rape oil, at esterification plant, CH Materials Chemicals 2.82E+00 kg 2006 Ecoinvent data V2.2 (2010) Switzerland
glycerine, from rape oil, at esterification plant, Europe
Materials Chemicals 3.56E+00 kg 2006 Ecoinvent data V2.2 (2010) Europe
glycerine, from soybean oil, at esterification plant, BR
Materials Chemicals 2.97E+00 kg 2006 Ecoinvent data V2.2 (2010) Brazil
glycerine, from soybean oil, at esterification plant, USA
Materials Chemicals 8.48E-01 kg 2006 Ecoinvent data V2.2 (2010) United States
glycerine, from vegetable oil, at esterification plant
Materials Chemicals 4.19E-01 kg 2006 Ecoinvent data V2.2 (2010) France
graphite, at plant Materials Chemicals 2.81E-02 kg 2000 Ecoinvent data V2.2 (2010) Europe graphite, battery grade, at plant Materials Chemicals 2.22E+00 kg 2010 Ecoinvent data V2.2 (2010) China helium, at plant Materials Chemicals 9.32E-01 kg 2007 Ecoinvent data V2.2 (2010) Global
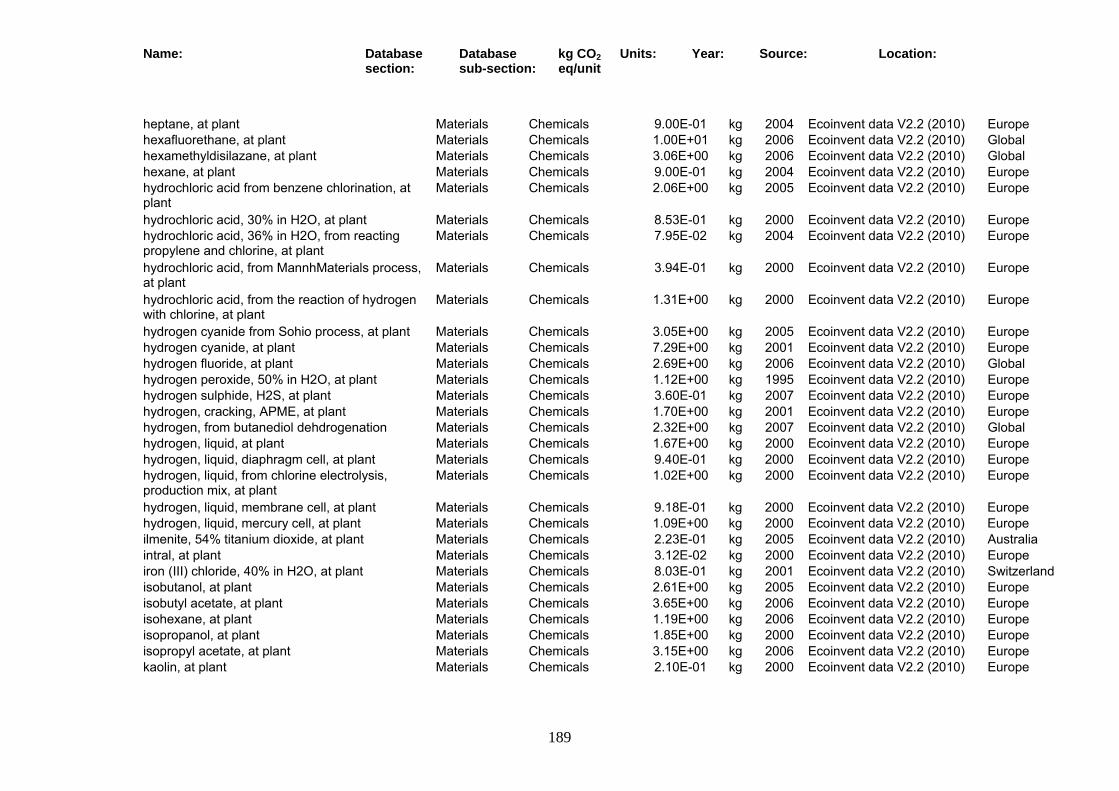
Name: Database section:
Database sub-section:
kg CO2 eq/unit
Units: Year: Source: Location:
189
heptane, at plant Materials Chemicals 9.00E-01 kg 2004 Ecoinvent data V2.2 (2010) Europe hexafluorethane, at plant Materials Chemicals 1.00E+01 kg 2006 Ecoinvent data V2.2 (2010) Global hexamethyldisilazane, at plant Materials Chemicals 3.06E+00 kg 2006 Ecoinvent data V2.2 (2010) Global hexane, at plant Materials Chemicals 9.00E-01 kg 2004 Ecoinvent data V2.2 (2010) Europe hydrochloric acid from benzene chlorination, at plant
Materials Chemicals 2.06E+00 kg 2005 Ecoinvent data V2.2 (2010) Europe
hydrochloric acid, 30% in H2O, at plant Materials Chemicals 8.53E-01 kg 2000 Ecoinvent data V2.2 (2010) Europe hydrochloric acid, 36% in H2O, from reacting propylene and chlorine, at plant
Materials Chemicals 7.95E-02 kg 2004 Ecoinvent data V2.2 (2010) Europe
hydrochloric acid, from MannhMaterials process, at plant
Materials Chemicals 3.94E-01 kg 2000 Ecoinvent data V2.2 (2010) Europe
hydrochloric acid, from the reaction of hydrogen with chlorine, at plant
Materials Chemicals 1.31E+00 kg 2000 Ecoinvent data V2.2 (2010) Europe
hydrogen cyanide from Sohio process, at plant Materials Chemicals 3.05E+00 kg 2005 Ecoinvent data V2.2 (2010) Europe hydrogen cyanide, at plant Materials Chemicals 7.29E+00 kg 2001 Ecoinvent data V2.2 (2010) Europe hydrogen fluoride, at plant Materials Chemicals 2.69E+00 kg 2006 Ecoinvent data V2.2 (2010) Global hydrogen peroxide, 50% in H2O, at plant Materials Chemicals 1.12E+00 kg 1995 Ecoinvent data V2.2 (2010) Europe hydrogen sulphide, H2S, at plant Materials Chemicals 3.60E-01 kg 2007 Ecoinvent data V2.2 (2010) Europe hydrogen, cracking, APME, at plant Materials Chemicals 1.70E+00 kg 2001 Ecoinvent data V2.2 (2010) Europe hydrogen, from butanediol dehdrogenation Materials Chemicals 2.32E+00 kg 2007 Ecoinvent data V2.2 (2010) Global hydrogen, liquid, at plant Materials Chemicals 1.67E+00 kg 2000 Ecoinvent data V2.2 (2010) Europe hydrogen, liquid, diaphragm cell, at plant Materials Chemicals 9.40E-01 kg 2000 Ecoinvent data V2.2 (2010) Europe hydrogen, liquid, from chlorine electrolysis, production mix, at plant
Materials Chemicals 1.02E+00 kg 2000 Ecoinvent data V2.2 (2010) Europe
hydrogen, liquid, membrane cell, at plant Materials Chemicals 9.18E-01 kg 2000 Ecoinvent data V2.2 (2010) Europe hydrogen, liquid, mercury cell, at plant Materials Chemicals 1.09E+00 kg 2000 Ecoinvent data V2.2 (2010) Europe ilmenite, 54% titanium dioxide, at plant Materials Chemicals 2.23E-01 kg 2005 Ecoinvent data V2.2 (2010) Australia intral, at plant Materials Chemicals 3.12E-02 kg 2000 Ecoinvent data V2.2 (2010) Europe iron (III) chloride, 40% in H2O, at plant Materials Chemicals 8.03E-01 kg 2001 Ecoinvent data V2.2 (2010) Switzerland isobutanol, at plant Materials Chemicals 2.61E+00 kg 2005 Ecoinvent data V2.2 (2010) Europe isobutyl acetate, at plant Materials Chemicals 3.65E+00 kg 2006 Ecoinvent data V2.2 (2010) Europe isohexane, at plant Materials Chemicals 1.19E+00 kg 2006 Ecoinvent data V2.2 (2010) Europe isopropanol, at plant Materials Chemicals 1.85E+00 kg 2000 Ecoinvent data V2.2 (2010) Europe isopropyl acetate, at plant Materials Chemicals 3.15E+00 kg 2006 Ecoinvent data V2.2 (2010) Europe kaolin, at plant Materials Chemicals 2.10E-01 kg 2000 Ecoinvent data V2.2 (2010) Europe
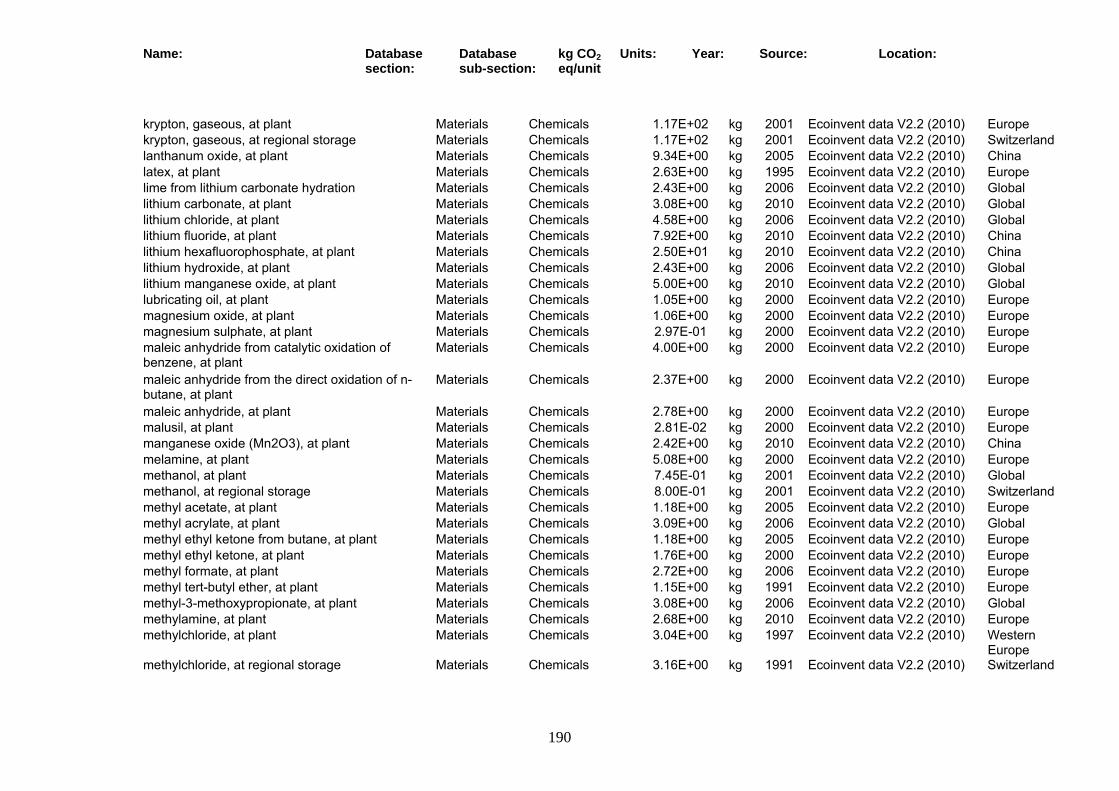
Name: Database section:
Database sub-section:
kg CO2 eq/unit
Units: Year: Source: Location:
190
krypton, gaseous, at plant Materials Chemicals 1.17E+02 kg 2001 Ecoinvent data V2.2 (2010) Europe krypton, gaseous, at regional storage Materials Chemicals 1.17E+02 kg 2001 Ecoinvent data V2.2 (2010) Switzerland lanthanum oxide, at plant Materials Chemicals 9.34E+00 kg 2005 Ecoinvent data V2.2 (2010) China latex, at plant Materials Chemicals 2.63E+00 kg 1995 Ecoinvent data V2.2 (2010) Europe lime from lithium carbonate hydration Materials Chemicals 2.43E+00 kg 2006 Ecoinvent data V2.2 (2010) Global lithium carbonate, at plant Materials Chemicals 3.08E+00 kg 2010 Ecoinvent data V2.2 (2010) Global lithium chloride, at plant Materials Chemicals 4.58E+00 kg 2006 Ecoinvent data V2.2 (2010) Global lithium fluoride, at plant Materials Chemicals 7.92E+00 kg 2010 Ecoinvent data V2.2 (2010) China lithium hexafluorophosphate, at plant Materials Chemicals 2.50E+01 kg 2010 Ecoinvent data V2.2 (2010) China lithium hydroxide, at plant Materials Chemicals 2.43E+00 kg 2006 Ecoinvent data V2.2 (2010) Global lithium manganese oxide, at plant Materials Chemicals 5.00E+00 kg 2010 Ecoinvent data V2.2 (2010) Global lubricating oil, at plant Materials Chemicals 1.05E+00 kg 2000 Ecoinvent data V2.2 (2010) Europe magnesium oxide, at plant Materials Chemicals 1.06E+00 kg 2000 Ecoinvent data V2.2 (2010) Europe magnesium sulphate, at plant Materials Chemicals 2.97E-01 kg 2000 Ecoinvent data V2.2 (2010) Europe maleic anhydride from catalytic oxidation of benzene, at plant
Materials Chemicals 4.00E+00 kg 2000 Ecoinvent data V2.2 (2010) Europe
maleic anhydride from the direct oxidation of n-butane, at plant
Materials Chemicals 2.37E+00 kg 2000 Ecoinvent data V2.2 (2010) Europe
maleic anhydride, at plant Materials Chemicals 2.78E+00 kg 2000 Ecoinvent data V2.2 (2010) Europe malusil, at plant Materials Chemicals 2.81E-02 kg 2000 Ecoinvent data V2.2 (2010) Europe manganese oxide (Mn2O3), at plant Materials Chemicals 2.42E+00 kg 2010 Ecoinvent data V2.2 (2010) China melamine, at plant Materials Chemicals 5.08E+00 kg 2000 Ecoinvent data V2.2 (2010) Europe methanol, at plant Materials Chemicals 7.45E-01 kg 2001 Ecoinvent data V2.2 (2010) Global methanol, at regional storage Materials Chemicals 8.00E-01 kg 2001 Ecoinvent data V2.2 (2010) Switzerland methyl acetate, at plant Materials Chemicals 1.18E+00 kg 2005 Ecoinvent data V2.2 (2010) Europe methyl acrylate, at plant Materials Chemicals 3.09E+00 kg 2006 Ecoinvent data V2.2 (2010) Global methyl ethyl ketone from butane, at plant Materials Chemicals 1.18E+00 kg 2005 Ecoinvent data V2.2 (2010) Europe methyl ethyl ketone, at plant Materials Chemicals 1.76E+00 kg 2000 Ecoinvent data V2.2 (2010) Europe methyl formate, at plant Materials Chemicals 2.72E+00 kg 2006 Ecoinvent data V2.2 (2010) Europe methyl tert-butyl ether, at plant Materials Chemicals 1.15E+00 kg 1991 Ecoinvent data V2.2 (2010) Europe methyl-3-methoxypropionate, at plant Materials Chemicals 3.08E+00 kg 2006 Ecoinvent data V2.2 (2010) Global methylamine, at plant Materials Chemicals 2.68E+00 kg 2010 Ecoinvent data V2.2 (2010) Europe methylchloride, at plant Materials Chemicals 3.04E+00 kg 1997 Ecoinvent data V2.2 (2010) Western
Europe methylchloride, at regional storage Materials Chemicals 3.16E+00 kg 1991 Ecoinvent data V2.2 (2010) Switzerland
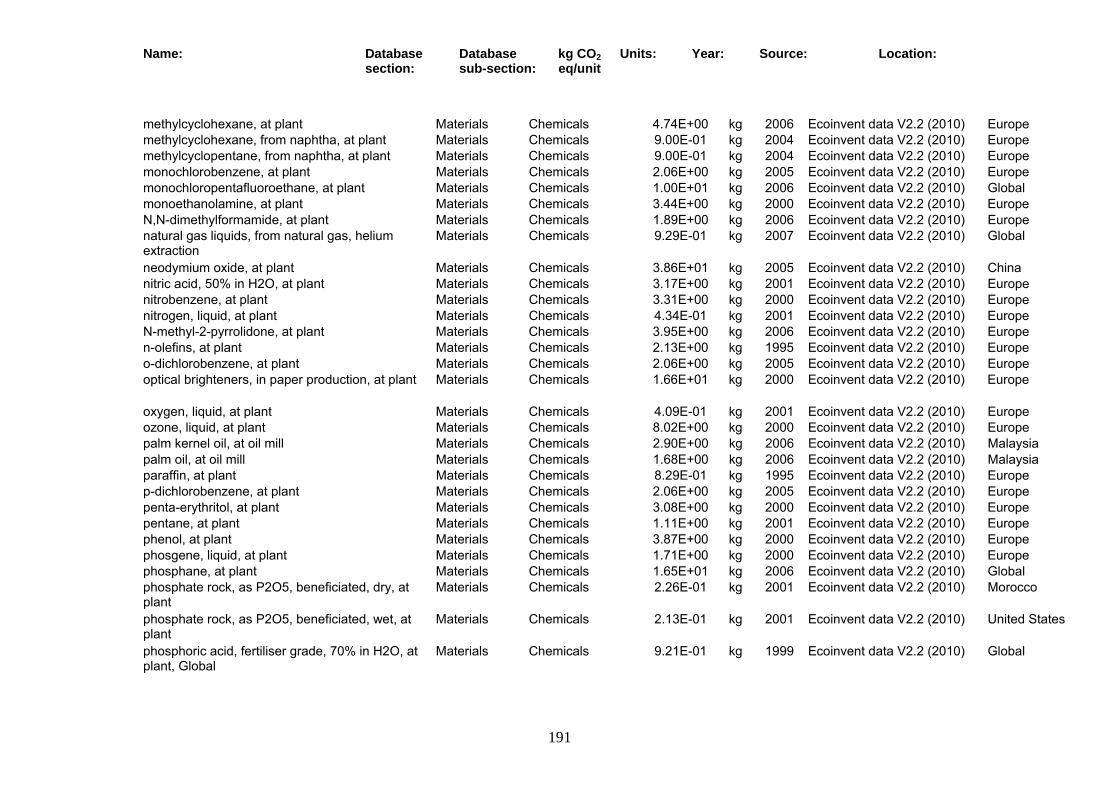
Name: Database section:
Database sub-section:
kg CO2 eq/unit
Units: Year: Source: Location:
191
methylcyclohexane, at plant Materials Chemicals 4.74E+00 kg 2006 Ecoinvent data V2.2 (2010) Europe methylcyclohexane, from naphtha, at plant Materials Chemicals 9.00E-01 kg 2004 Ecoinvent data V2.2 (2010) Europe methylcyclopentane, from naphtha, at plant Materials Chemicals 9.00E-01 kg 2004 Ecoinvent data V2.2 (2010) Europe monochlorobenzene, at plant Materials Chemicals 2.06E+00 kg 2005 Ecoinvent data V2.2 (2010) Europe monochloropentafluoroethane, at plant Materials Chemicals 1.00E+01 kg 2006 Ecoinvent data V2.2 (2010) Global monoethanolamine, at plant Materials Chemicals 3.44E+00 kg 2000 Ecoinvent data V2.2 (2010) Europe N,N-dimethylformamide, at plant Materials Chemicals 1.89E+00 kg 2006 Ecoinvent data V2.2 (2010) Europe natural gas liquids, from natural gas, helium extraction
Materials Chemicals 9.29E-01 kg 2007 Ecoinvent data V2.2 (2010) Global
neodymium oxide, at plant Materials Chemicals 3.86E+01 kg 2005 Ecoinvent data V2.2 (2010) China nitric acid, 50% in H2O, at plant Materials Chemicals 3.17E+00 kg 2001 Ecoinvent data V2.2 (2010) Europe nitrobenzene, at plant Materials Chemicals 3.31E+00 kg 2000 Ecoinvent data V2.2 (2010) Europe nitrogen, liquid, at plant Materials Chemicals 4.34E-01 kg 2001 Ecoinvent data V2.2 (2010) Europe N-methyl-2-pyrrolidone, at plant Materials Chemicals 3.95E+00 kg 2006 Ecoinvent data V2.2 (2010) Europe n-olefins, at plant Materials Chemicals 2.13E+00 kg 1995 Ecoinvent data V2.2 (2010) Europe o-dichlorobenzene, at plant Materials Chemicals 2.06E+00 kg 2005 Ecoinvent data V2.2 (2010) Europe optical brighteners, in paper production, at plant Materials Chemicals 1.66E+01 kg 2000 Ecoinvent data V2.2 (2010) Europe
oxygen, liquid, at plant Materials Chemicals 4.09E-01 kg 2001 Ecoinvent data V2.2 (2010) Europe ozone, liquid, at plant Materials Chemicals 8.02E+00 kg 2000 Ecoinvent data V2.2 (2010) Europe palm kernel oil, at oil mill Materials Chemicals 2.90E+00 kg 2006 Ecoinvent data V2.2 (2010) Malaysia palm oil, at oil mill Materials Chemicals 1.68E+00 kg 2006 Ecoinvent data V2.2 (2010) Malaysia paraffin, at plant Materials Chemicals 8.29E-01 kg 1995 Ecoinvent data V2.2 (2010) Europe p-dichlorobenzene, at plant Materials Chemicals 2.06E+00 kg 2005 Ecoinvent data V2.2 (2010) Europe penta-erythritol, at plant Materials Chemicals 3.08E+00 kg 2000 Ecoinvent data V2.2 (2010) Europe pentane, at plant Materials Chemicals 1.11E+00 kg 2001 Ecoinvent data V2.2 (2010) Europe phenol, at plant Materials Chemicals 3.87E+00 kg 2000 Ecoinvent data V2.2 (2010) Europe phosgene, liquid, at plant Materials Chemicals 1.71E+00 kg 2000 Ecoinvent data V2.2 (2010) Europe phosphane, at plant Materials Chemicals 1.65E+01 kg 2006 Ecoinvent data V2.2 (2010) Global phosphate rock, as P2O5, beneficiated, dry, at plant
Materials Chemicals 2.26E-01 kg 2001 Ecoinvent data V2.2 (2010) Morocco
phosphate rock, as P2O5, beneficiated, wet, at plant
Materials Chemicals 2.13E-01 kg 2001 Ecoinvent data V2.2 (2010) United States
phosphoric acid, fertiliser grade, 70% in H2O, at plant, Global
Materials Chemicals 9.21E-01 kg 1999 Ecoinvent data V2.2 (2010) Global

Name: Database section:
Database sub-section:
kg CO2 eq/unit
Units: Year: Source: Location:
192
phosphoric acid, fertiliser grade, 70% in H2O, at plant, MA
Materials Chemicals 9.59E-01 kg 2001 Ecoinvent data V2.2 (2010) Morocco
phosphoric acid, fertiliser grade, 70% in H2O, at plant, USA
Materials Chemicals 8.99E-01 kg 2001 Ecoinvent data V2.2 (2010) United States
phosphoric acid, industrial grade, 85% in H2O, at plant
Materials Chemicals 1.42E+00 kg 1994 Ecoinvent data V2.2 (2010) Europe
phosphorous chloride, at plant Materials Chemicals 3.36E+00 kg 2000 Ecoinvent data V2.2 (2010) Europe phosphorous pentachloride, at plant Materials Chemicals 2.84E+00 kg 2010 Ecoinvent data V2.2 (2010) China phosphorus, white, liquid, at plant Materials Chemicals 1.00E+01 kg 2000 Ecoinvent data V2.2 (2010) Europe phosphoryl chloride, at plant Materials Chemicals 3.47E+00 kg 2006 Ecoinvent data V2.2 (2010) Europe phthalic anhydride, at plant Materials Chemicals 2.55E+00 kg 1995 Ecoinvent data V2.2 (2010) Europe pigments, paper production, unspecified, at plant Materials Chemicals 1.01E-01 kg 2000 Ecoinvent data V2.2 (2010) Europe
pitch despergents, in paper production, at plant Materials Chemicals 1.05E+00 kg 2000 Ecoinvent data V2.2 (2010) Europe polyvinylfluoride film, at plant Materials Chemicals 2.27E+01 kg 2006 Ecoinvent data V2.2 (2010) United States polyvinylfluoride, at plant Materials Chemicals 1.84E+01 kg 2006 Ecoinvent data V2.2 (2010) United States polyvinylfluoride, dispersion, at plant Materials Chemicals 2.15E+01 kg 2006 Ecoinvent data V2.2 (2010) United States portachrom, at plant Materials Chemicals 5.46E-02 kg 2000 Ecoinvent data V2.2 (2010) Europe portafer, at plant Materials Chemicals 3.12E-02 kg 2000 Ecoinvent data V2.2 (2010) Europe potassium carbonate from manganese dioxide oxidation, at plant
Materials Chemicals 9.75E-01 kg 2009 Ecoinvent data V2.2 (2010) Europe
potassium carbonate, at plant Materials Chemicals 2.33E+00 kg 2006 Ecoinvent data V2.2 (2010) Global potassium hydroxide, at regional storage Materials Chemicals 1.91E+00 kg 2004 Ecoinvent data V2.2 (2010) Europe potassium perchlorate, at plant Materials Chemicals 5.01E+00 kg 2006 Ecoinvent data V2.2 (2010) Global potassium permanganate, at plant Materials Chemicals 1.17E+00 kg 2009 Ecoinvent data V2.2 (2010) Europe potassium sulphate, as K2O, from rape oil, at esterification plant
Materials Chemicals 3.94E-01 kg 2006 Ecoinvent data V2.2 (2010) Europe
praseodymium oxide, at plant Materials Chemicals 4.14E+01 kg 2005 Ecoinvent data V2.2 (2010) China propanal, at plant Materials Chemicals 3.31E+00 kg 2006 Ecoinvent data V2.2 (2010) Europe propylene glycol, liquid, at plant Materials Chemicals 4.07E+00 kg 2000 Ecoinvent data V2.2 (2010) Europe propylene oxide, liquid, at plant Materials Chemicals 4.47E+00 kg 2000 Ecoinvent data V2.2 (2010) Europe rare earth concentrate, 70% REO, from bastnasite, at beneficiation
Materials Chemicals 1.39E+00 kg 2005 Ecoinvent data V2.2 (2010) China
refrigerant R134a, at plant Materials Chemicals 1.03E+02 kg 2000 Ecoinvent data V2.2 (2010) Europe retention aids, in paper production, at plant Materials Chemicals 2.78E+00 kg 2000 Ecoinvent data V2.2 (2010) Europe
Name: Database section:
Database sub-section:
kg CO2 eq/unit
Units: Year: Source: Location:
193
rosin size, in paper production, at plant Materials Chemicals 1.56E+00 kg 2000 Ecoinvent data V2.2 (2010) Europe rutile, 95% titanium dioxide, at plant Materials Chemicals 1.16E+00 kg 2005 Ecoinvent data V2.2 (2010) Australia sales gas, from natural gas, helium extraction Materials Chemicals 9.29E-01 kg 2007 Ecoinvent data V2.2 (2010) Global samarium europium gadolinium concentrate, 94% rare earth oxide, at plant
Materials Chemicals 5.56E+01 kg 2005 Ecoinvent data V2.2 (2010) China
sConstructiondary sulphur, at refinery, CH Materials Chemicals 1.83E-01 kg 2000 Ecoinvent data V2.2 (2010) Switzerland sConstructiondary sulphur, at refinery, Europe Materials Chemicals 3.15E-01 kg 2000 Ecoinvent data V2.2 (2010) Europe selenium, at plant Materials Chemicals 2.65E+00 kg 2000 Ecoinvent data V2.2 (2010) Europe silicon carbide, at plant Materials Chemicals 7.18E+00 kg 2006 Ecoinvent data V2.2 (2010) Europe silicon carbide, recycling, at plant Materials Chemicals 7.19E-01 kg 2006 Ecoinvent data V2.2 (2010) Europe silicon tetrachloride, at plant, DE Materials Chemicals 1.74E+00 kg 2005 Ecoinvent data V2.2 (2010) Germany silicon tetrahydride, at plant, Europe Materials Chemicals 6.15E+01 kg 2007 Ecoinvent data V2.2 (2010) Europe silicone product, at plant Materials Chemicals 2.71E+00 kg 2001 Ecoinvent data V2.2 (2010) Europe soda, powder, at plant Materials Chemicals 4.42E-01 kg 1999 Ecoinvent data V2.2 (2010) Europe sodium arsenide, at plant Materials Chemicals 2.61E+00 kg 2010 Ecoinvent data V2.2 (2010) Global sodium borates, at plant Materials Chemicals 8.18E-02 kg 2000 Ecoinvent data V2.2 (2010) United States sodium carbonate from ammonium chloride production, at plant
Materials Chemicals 1.05E+00 kg 2006 Ecoinvent data V2.2 (2010) Global
sodium chlorate, powder, at plant Materials Chemicals 3.21E+00 kg 1995 Ecoinvent data V2.2 (2010) Europe sodium chloride, brine solution, at plant Materials Chemicals 1.13E-01 kg 1994 Ecoinvent data V2.2 (2010) Europe sodium chloride, powder, at plant Materials Chemicals 1.80E-01 kg 2000 Ecoinvent data V2.2 (2010) Europe sodium cyanide, at plant Materials Chemicals 5.62E+00 kg 2000 Ecoinvent data V2.2 (2010) Europe sodium dichromate, at plant Materials Chemicals 4.82E+00 kg 2000 Ecoinvent data V2.2 (2010) Europe sodium dithionite, anhydrous, at plant Materials Chemicals 3.51E+00 kg 2000 Ecoinvent data V2.2 (2010) Europe sodium formate, reaction of formaldehyde with acetaldehyde, at plant
Materials Chemicals 5.43E-01 kg 2000 Ecoinvent data V2.2 (2010) Europe
sodium hydroxide, 50% in H2O, diaphragm cell, at plant
Materials Chemicals 1.22E+00 kg 2000 Ecoinvent data V2.2 (2010) Europe
sodium hydroxide, 50% in H2O, membrane cell, at plant
Materials Chemicals 1.00E+00 kg 2000 Ecoinvent data V2.2 (2010) Europe
sodium hydroxide, 50% in H2O, mercury cell, at plant
Materials Chemicals 1.08E+00 kg 2000 Ecoinvent data V2.2 (2010) Europe
sodium hydroxide, 50% in H2O, production mix, at plant
Materials Chemicals 1.10E+00 kg 2000 Ecoinvent data V2.2 (2010) Europe
sodium hypochlorite, 15% in H2O, at plant Materials Chemicals 8.88E-01 kg 2000 Ecoinvent data V2.2 (2010) Europe
Name: Database section:
Database sub-section:
kg CO2 eq/unit
Units: Year: Source: Location:
194
sodium methoxide, at plant Materials Chemicals 4.84E+00 kg 2006 Ecoinvent data V2.2 (2010) Global sodium perchlorate, at plant Materials Chemicals 4.54E+00 kg 2006 Ecoinvent data V2.2 (2010) Global sodium persulfate, at plant Materials Chemicals 1.27E+00 kg 2006 Ecoinvent data V2.2 (2010) Global sodium phosphate, at plant Materials Chemicals 2.88E+00 kg 1994 Ecoinvent data V2.2 (2010) Europe sodium silicate, furnace liquor, 37% in H2O, at plant
Materials Chemicals 1.10E+00 kg 1995 Ecoinvent data V2.2 (2010) Europe
sodium silicate, furnace process, pieces, at plant Materials Chemicals 8.42E-01 kg 1995 Ecoinvent data V2.2 (2010) Europe
sodium silicate, hydrothermal liquor, 48% in H2O, at plant
Materials Chemicals 7.48E-01 kg 1995 Ecoinvent data V2.2 (2010) Europe
sodium silicate, spray powder 80%, at plant Materials Chemicals 1.59E+00 kg 1995 Ecoinvent data V2.2 (2010) Europe sodium sulphat from viscose production, at plant Materials Chemicals 3.80E-01 kg 2007 Ecoinvent data V2.2 (2010) Global
sodium sulphate from sulfuric acid digestion of spodumene
Materials Chemicals 7.84E-01 kg 2007 Ecoinvent data V2.2 (2010) Global
sodium sulphate, from MannhMaterials process, at plant
Materials Chemicals 4.73E-01 kg 2000 Ecoinvent data V2.2 (2010) Europe
sodium sulphate, from natural sources, at plant Materials Chemicals 1.32E-01 kg 2000 Ecoinvent data V2.2 (2010) Europe sodium sulphate, powder, production mix, at plant
Materials Chemicals 4.64E-01 kg 2000 Ecoinvent data V2.2 (2010) Europe
sodium tetrafluorborate, at plant Materials Chemicals 4.60E+00 kg 2006 Ecoinvent data V2.2 (2010) Global sodium tetrahydroborate, at plant Materials Chemicals 4.84E+00 kg 2006 Ecoinvent data V2.2 (2010) Global solvents, organic, unspecified, at plant Materials Chemicals 2.44E+00 kg 2000 Ecoinvent data V2.2 (2010) Global soya oil, at plant Materials Chemicals 1.83E+00 kg 1998 Ecoinvent data V2.2 (2010) Europe soya scrap, at plant Materials Chemicals 1.77E+00 kg 1998 Ecoinvent data V2.2 (2010) Europe spodumene, at plant Materials Chemicals 3.12E-02 kg 2000 Ecoinvent data V2.2 (2010) Europe steam from catalytic oxidation of benzene, at plant
Materials Chemicals 6.85E-02 kg 2000 Ecoinvent data V2.2 (2010) Europe
steam from direct oxidation of n-butane, at plant Materials Chemicals 3.76E-02 kg 2000 Ecoinvent data V2.2 (2010) Europe
steam from the production of formaldehyde Materials Chemicals 3.07E-02 kg 2000 Ecoinvent data V2.2 (2010) Europe stibnite ore, 70% stibnite, at mine Materials Chemicals 6.26E+00 kg 2003 Ecoinvent data V2.2 (2010) China sulphite, at plant Materials Chemicals 1.39E+00 kg 2000 Ecoinvent data V2.2 (2010) Europe sulphur dioxide, liquid, at plant Materials Chemicals 4.18E-01 kg 2000 Ecoinvent data V2.2 (2010) Europe sulphur hexafluoride, liquid, at plant Materials Chemicals 1.23E+02 kg 1998 Ecoinvent data V2.2 (2010) Europe

Name: Database section:
Database sub-section:
kg CO2 eq/unit
Units: Year: Source: Location:
195
sulphur trioxide, at plant Materials Chemicals 4.11E-01 kg 2000 Ecoinvent data V2.2 (2010) Europe sulphuric acid from viscose production, at plant Materials Chemicals 2.09E-01 kg 2007 Ecoinvent data V2.2 (2010) Global sulphuric acid, liquid, at plant Materials Chemicals 1.24E-01 kg 2001 Ecoinvent data V2.2 (2010) Europe tetrachloroethylene, at plant Materials Chemicals 3.84E+00 kg 1997 Ecoinvent data V2.2 (2010) Western
Europe tetrachloroethylene, at regional storage Materials Chemicals 3.96E+00 kg 1991 Ecoinvent data V2.2 (2010) Switzerland tetrachlorosilane, at plant Materials Chemicals 6.22E+01 kg 2007 Ecoinvent data V2.2 (2010) Global tetrafluoroethylene film, on glass Materials Chemicals 3.40E+02 kg 2002 Ecoinvent data V2.2 (2010) Europe tetrafluoroethylene, at plant Materials Chemicals 3.23E+02 kg 1999 Ecoinvent data V2.2 (2010) Europe tetrahydrofuran, at plant Materials Chemicals 5.73E+00 kg 2006 Ecoinvent data V2.2 (2010) Europe titanium dioxide at plant, sulphate process, at plant
Materials Chemicals 5.00E+00 kg 2000 Ecoinvent data V2.2 (2010) Europe
titanium dioxide, chloride process, at plant Materials Chemicals 4.13E+00 kg 2000 Ecoinvent data V2.2 (2010) Europe titanium dioxide, production mix, at plant Materials Chemicals 4.57E+00 kg 2000 Ecoinvent data V2.2 (2010) Europe toluene, liquid, at plant Materials Chemicals 1.50E+00 kg 2002 Ecoinvent data V2.2 (2010) Europe trichloroborane, at plant Materials Chemicals 3.19E+00 kg 2006 Ecoinvent data V2.2 (2010) Global trichloroethylene, at plant Materials Chemicals 4.63E-01 kg 1997 Ecoinvent data V2.2 (2010) Western
Europe trichloromethane, at plant Materials Chemicals 3.42E+00 kg 1999 Ecoinvent data V2.2 (2010) Europe trichloropropane, from hypochlorination of allyl chloride, at plant
Materials Chemicals 3.19E+00 kg 2004 Ecoinvent data V2.2 (2010) Europe
triethanolamine, at plant Materials Chemicals 3.75E+00 kg 2000 Ecoinvent data V2.2 (2010) Europe triethylene glycol, at plant Materials Chemicals 3.05E+00 kg 2000 Ecoinvent data V2.2 (2010) Europe triethylene glycol, recycling, at plant Materials Chemicals 7.19E-01 kg 2006 Ecoinvent data V2.2 (2010) Europe trifluoromethane, at plant Materials Chemicals 8.99E+00 kg 2006 Ecoinvent data V2.2 (2010) Global trimethyl borate, at plant Materials Chemicals 1.97E+00 kg 2006 Ecoinvent data V2.2 (2010) Global trimethylamine, at plant Materials Chemicals 2.47E+00 kg 2002 Ecoinvent data V2.2 (2010) Europe urea ammonium nitrate, as N, at regional storehouse
Materials Chemicals 5.84E+00 kg 1999 Ecoinvent data V2.2 (2010) Europe
urea, as N, at regional storehouse Materials Chemicals 3.31E+00 kg 1999 Ecoinvent data V2.2 (2010) Europe vinyl fluoride, at plant Materials Chemicals 1.06E+01 kg 2006 Ecoinvent data V2.2 (2010) United States xenon, gaseous, at plant Materials Chemicals 7.51E+02 kg 2001 Ecoinvent data V2.2 (2010) Europe xenon, gaseous, at regional storage Materials Chemicals 7.51E+02 kg 2001 Ecoinvent data V2.2 (2010) Switzerland xylene, at plant Materials Chemicals 1.64E+00 kg 2002 Ecoinvent data V2.2 (2010) Europe zinc monosulphate, ZnSO4.H2O, at plant Materials Chemicals 1.81E+00 kg 2007 Ecoinvent data V2.2 (2010) Europe

Name: Database section:
Database sub-section:
kg CO2 eq/unit
Units: Year: Source: Location:
196
zinc oxide, at plant Materials Chemicals 2.89E+00 kg 2007 Ecoinvent data V2.2 (2010) Europe zinc sulphide, ZnS, at plant Materials Chemicals 4.08E+00 kg 2007 Ecoinvent data V2.2 (2010) Europe zircon, 50% zirconium, at plant Materials Chemicals 1.12E+00 kg 2005 Ecoinvent data V2.2 (2010) Australia zirconium oxide, at plant Materials Chemicals 3.98E+00 kg 2005 Ecoinvent data V2.2 (2010) Australia benzene, at coke plant, DE Materials Coal/gas 7.51E-01 kg 1992 Ecoinvent data V2.2 (2010) Germany benzene, at coke plant, Global Materials Coal/gas 9.84E-01 kg 1998 Ecoinvent data V2.2 (2010) Global hard coal mix, at regional storage Materials Coal/gas 3.02E-01 kg 1999 Ecoinvent data V2.2 (2010) UCTE hard coal supply mix, AT Materials Coal/gas 3.16E-01 kg 1999 Ecoinvent data V2.2 (2010) Austria hard coal supply mix, at regional storage Materials Coal/gas 1.70E-01 kg 1999 Ecoinvent data V2.2 (2010) United States hard coal supply mix, BE Materials Coal/gas 3.06E-01 kg 1999 Ecoinvent data V2.2 (2010) Belgium hard coal supply mix, CN Materials Coal/gas 9.75E-01 kg 2002 Ecoinvent data V2.2 (2010) China hard coal supply mix, CZ Materials Coal/gas 2.78E-01 kg 1999 Ecoinvent data V2.2 (2010) Switzerland hard coal supply mix, DE Materials Coal/gas 3.60E-01 kg 1999 Ecoinvent data V2.2 (2010) Germany hard coal supply mix, ES Materials Coal/gas 3.18E-01 kg 1999 Ecoinvent data V2.2 (2010) Spain hard coal supply mix, FR Materials Coal/gas 2.77E-01 kg 1999 Ecoinvent data V2.2 (2010) France hard coal supply mix, HR Materials Coal/gas 3.16E-01 kg 1999 Ecoinvent data V2.2 (2010) Croatia hard coal supply mix, IT Materials Coal/gas 2.65E-01 kg 1999 Ecoinvent data V2.2 (2010) Italy hard coal supply mix, NL Materials Coal/gas 2.66E-01 kg 1999 Ecoinvent data V2.2 (2010) Netherlands hard coal supply mix, PO Materials Coal/gas 2.81E-01 kg 1999 Ecoinvent data V2.2 (2010) Poland hard coal supply mix, PT Materials Coal/gas 2.01E-01 kg 1999 Ecoinvent data V2.2 (2010) Portugal hard coal supply mix, SK Materials Coal/gas 3.24E-01 kg 1999 Ecoinvent data V2.2 (2010) Slovakia hard coal, at mine, AU Materials Coal/gas 9.64E-02 kg 2002 Ecoinvent data V2.2 (2010) Australia hard coal, at mine, Central and Eastern Europe Materials Coal/gas 2.50E-01 kg 2002 Ecoinvent data V2.2 (2010) Central and
Eastern Europe
hard coal, at mine, Centrally Planned Asia and CN
Materials Coal/gas 1.03E-01 kg 2002 Ecoinvent data V2.2 (2010) Centrally Planned Asia and China
hard coal, at mine, CN Materials Coal/gas 9.01E-01 kg 2002 Ecoinvent data V2.2 (2010) China hard coal, at mine, Latin American and the Caribbean
Materials Coal/gas 3.04E-02 kg 2002 Ecoinvent data V2.2 (2010) Latin American and the Caribbean
hard coal, at mine, North America Materials Coal/gas 1.05E-01 kg 2002 Ecoinvent data V2.2 (2010) North America
Name: Database section:
Database sub-section:
kg CO2 eq/unit
Units: Year: Source: Location:
197
hard coal, at mine, RU Materials Coal/gas 2.99E-01 kg 2002 Ecoinvent data V2.2 (2010) Russian Federation
hard coal, at mine, SA Materials Coal/gas 1.15E-01 kg 2002 Ecoinvent data V2.2 (2010) South Africa hard coal, at mine, Western Europe Materials Coal/gas 3.79E-01 kg 2002 Ecoinvent data V2.2 (2010) Western
Europe hard coal, at regional storage Materials Coal/gas 3.88E-01 kg 1989 Ecoinvent data V2.2 (2010) Western
Europe hard coal, at regional storage, AU Materials Coal/gas 1.08E-01 kg 1989 Ecoinvent data V2.2 (2010) Australia hard coal, at regional storage, Central and Eastern Europe
Materials Coal/gas 2.71E-01 kg 1989 Ecoinvent data V2.2 (2010) Central and Eastern Europe
hard coal, at regional storage, Centrally Planned Asia and CN
Materials Coal/gas 1.14E-01 kg 1989 Ecoinvent data V2.2 (2010) Centrally Planned Asia and China
hard coal, at regional storage, Latin American and the Caribbean
Materials Coal/gas 4.19E-02 kg 1989 Ecoinvent data V2.2 (2010) Latin American and the Caribbean
hard coal, at regional storage, North America Materials Coal/gas 1.41E-01 kg 1989 Ecoinvent data V2.2 (2010) North America
hard coal, at regional storage, RU Materials Coal/gas 3.22E-01 kg 1989 Ecoinvent data V2.2 (2010) Russian Federation
hard coal, at regional storage, SA Materials Coal/gas 1.42E-01 kg 1989 Ecoinvent data V2.2 (2010) South Africa lignite, at mine Materials Coal/gas 1.82E-02 kg 1994 Ecoinvent data V2.2 (2010) Europe liquefied petroleum gas, at service station Materials Coal/gas 7.05E-01 kg 2008 Ecoinvent data V2.2 (2010) Switzerland natural gas, from high pressure network (1-5 bar), at service station
Materials Coal/gas 5.87E-01 kg 2001 Ecoinvent data V2.2 (2010) Switzerland
natural gas, from low pressure network (<0.1 bar), at service station
Materials Coal/gas 8.30E-01 kg 2001 Ecoinvent data V2.2 (2010) Switzerland
natural gas, from medium pressure network (0.1-1 bar), at service station
Materials Coal/gas 6.07E-01 kg 2001 Ecoinvent data V2.2 (2010) Switzerland
natural gas, production mix, at service station Materials Coal/gas 5.93E-01 kg 2001 Ecoinvent data V2.2 (2010) Switzerland NOx retained, in SCR Materials Coal/gas 7.50E-01 kg 2000 Ecoinvent data V2.2 (2010) Global peat, at mine Materials Coal/gas 1.82E-02 kg 1994 Ecoinvent data V2.2 (2010) Nordic
Countries Power

Name: Database section:
Database sub-section:
kg CO2 eq/unit
Units: Year: Source: Location:
198
Association SOx retained, in hard coal flue gas desulphurisation
Materials Coal/gas 8.37E-01 kg 2000 Ecoinvent data V2.2 (2010) Europe
SOx retained, in lignite flue gas desulphurisation Materials Coal/gas 7.34E-01 kg 2000 Ecoinvent data V2.2 (2010) Global
tar, at coke plant, DE Materials Coal/gas 6.98E-01 kg 1992 Ecoinvent data V2.2 (2010) Germany tar, at coke plant, Global Materials Coal/gas 9.15E-01 kg 1998 Ecoinvent data V2.2 (2010) Global acrylic filler, at plant Materials Construction 4.15E-01 kg 2003 Ecoinvent data V2.2 (2010) Europe adhesive mortar, at plant Materials Construction 1.10E+00 kg 2004 Ecoinvent data V2.2 (2010) Switzerland anhydrite floor, at plant Materials Construction 4.26E-02 kg 2004 Ecoinvent data V2.2 (2010) Switzerland anhydrite rock, at mine Materials Construction 2.05E-03 kg 2003 Ecoinvent data V2.2 (2010) Switzerland anhydrite, at plant Materials Construction 1.45E-02 kg 2003 Ecoinvent data V2.2 (2010) Switzerland anhydrite, burned, at plant Materials Construction 9.26E-02 kg 2003 Ecoinvent data V2.2 (2010) Switzerland asbestos, crysotile type, at plant Materials Construction 2.81E-02 kg 2000 Ecoinvent data V2.2 (2010) Global autoclaved aerated concrete block, at plant Materials Construction 4.12E-01 kg 2000 Ecoinvent data V2.2 (2010) Switzerland basalt, at mine Materials Construction 7.48E-03 kg 2003 Ecoinvent data V2.2 (2010) Europe base plaster, at plant Materials Construction 2.13E-01 kg 2001 Ecoinvent data V2.2 (2010) Switzerland bentonite, at mine Materials Construction 2.66E-02 kg 2000 Ecoinvent data V2.2 (2010) Germany bentonite, at processing Materials Construction 4.96E-01 kg 2000 Ecoinvent data V2.2 (2010) Germany blast furnace slag cement, at plant Materials Construction 4.45E-01 kg 2001 Ecoinvent data V2.2 (2010) Switzerland blasting Materials Construction 2.63E+00 kg 2001 Ecoinvent data V2.2 (2010) Europe brick, at plant Materials Construction 2.39E-01 kg 2002 Ecoinvent data V2.2 (2010) Europe calcareous marl, at plant Materials Construction 2.35E-03 kg 2001 Ecoinvent data V2.2 (2010) Switzerland cement cast plaster floor, at plant Materials Construction 1.70E-01 kg 2001 Ecoinvent data V2.2 (2010) Switzerland cement mortar, at plant Materials Construction 1.91E-01 kg 2001 Ecoinvent data V2.2 (2010) Switzerland cement, unspecified, at plant Materials Construction 7.61E-01 kg 2001 Ecoinvent data V2.2 (2010) Switzerland ceramic tiles, at regional storage Materials Construction 7.82E-01 kg 2002 Ecoinvent data V2.2 (2010) Switzerland clay plaster, at plant Materials Construction 1.91E-02 kg 2001 Ecoinvent data V2.2 (2010) Switzerland clay, at mine Materials Construction 2.94E-03 kg 2002 Ecoinvent data V2.2 (2010) Switzerland clinker, at plant Materials Construction 9.02E-01 kg 2001 Ecoinvent data V2.2 (2010) Switzerland cobwork, at plant Materials Construction 4.06E-03 kg 1995 Ecoinvent data V2.2 (2010) Switzerland concrete block, at plant Materials Construction 1.21E-01 kg 2001 Ecoinvent data V2.2 (2010) Germany concrete roof tile, at plant Materials Construction 2.09E-01 kg 2004 Ecoinvent data V2.2 (2010) Switzerland cover coat, mineral, at plant Materials Construction 8.05E-02 kg 2001 Ecoinvent data V2.2 (2010) Switzerland cover coat, organic, at plant Materials Construction 1.91E-01 kg 2001 Ecoinvent data V2.2 (2010) Switzerland
Name: Database section:
Database sub-section:
kg CO2 eq/unit
Units: Year: Source: Location:
199
crushing, rock Materials Construction 1.20E-05 kg 2001 Ecoinvent data V2.2 (2010) Europe dolomite, at plant Materials Construction 2.81E-02 kg 2000 Ecoinvent data V2.2 (2010) Europe electronics for control units Materials Construction 2.59E+01 kg 2005 Ecoinvent data V2.2 (2010) Europe expanded clay, at plant Materials Construction 3.28E-01 kg 2000 Ecoinvent data V2.2 (2010) Germany expanded vermiculite, at plant Materials Construction 4.20E-01 kg 2000 Ecoinvent data V2.2 (2010) Switzerland facilities, chemical production Materials Construction 6.89E+00 kg 2000 Ecoinvent data V2.2 (2010) Europe feldspar, at plant Materials Construction 3.40E-02 kg 1995 Ecoinvent data V2.2 (2010) Europe fibre cement corrugated slab, at plant Materials Construction 6.83E-01 kg 2001 Ecoinvent data V2.2 (2010) Switzerland fibre cement facing tile, at plant Materials Construction 1.09E+00 kg 2008 Ecoinvent data V2.2 (2010) Switzerland fibre cement facing tile, large format, at plant Materials Construction 1.12E+00 kg 2008 Ecoinvent data V2.2 (2010) Switzerland fibre cement facing tile, small format, at plant Materials Construction 1.03E+00 kg 2008 Ecoinvent data V2.2 (2010) Switzerland fibre cement roof slate, at plant Materials Construction 7.31E-01 kg 2001 Ecoinvent data V2.2 (2010) Switzerland gravel, crushed, at mine Materials Construction 4.40E-03 kg 2001 Ecoinvent data V2.2 (2010) Switzerland gravel, round, at mine Materials Construction 2.41E-03 kg 2001 Ecoinvent data V2.2 (2010) Switzerland gravel, unspecified, at mine Materials Construction 2.82E-03 kg 2001 Ecoinvent data V2.2 (2010) Switzerland gypsum fibre board, at plant Materials Construction 2.93E-01 kg 2003 Ecoinvent data V2.2 (2010) Switzerland gypsum plaster board, at plant Materials Construction 3.54E-01 kg 2003 Ecoinvent data V2.2 (2010) Switzerland gypsum, mineral, at mine Materials Construction 2.05E-03 kg 2003 Ecoinvent data V2.2 (2010) Switzerland industrial machine, heavy, unspecified, at plant Materials Construction 1.96E+00 kg 2001 Ecoinvent data V2.2 (2010) Europe light clay brick, at plant Materials Construction 1.61E-01 kg 1995 Ecoinvent data V2.2 (2010) Germany light mortar, at plant Materials Construction 4.62E-01 kg 2001 Ecoinvent data V2.2 (2010) Switzerland lightweight concrete block, expanded clay, at plant
Materials Construction 4.00E-01 kg 2000 Ecoinvent data V2.2 (2010) Switzerland
lightweight concrete block, expanded perlite, at plant
Materials Construction 1.00E+00 kg 2000 Ecoinvent data V2.2 (2010) Switzerland
lightweight concrete block, expanded vermiculite, at plant
Materials Construction 4.84E-01 kg 2000 Ecoinvent data V2.2 (2010) Switzerland
lightweight concrete block, polystyrene, at plant Materials Construction 1.13E+00 kg 2000 Ecoinvent data V2.2 (2010) Switzerland
lightweight concrete block, pumice, at plant Materials Construction 2.15E-01 kg 2000 Ecoinvent data V2.2 (2010) Germany lime mortar, at plant Materials Construction 6.02E-01 kg 2001 Ecoinvent data V2.2 (2010) Switzerland lime, hydrated, loose, at plant Materials Construction 7.58E-01 kg 2002 Ecoinvent data V2.2 (2010) Switzerland lime, hydrated, packed, at plant Materials Construction 7.64E-01 kg 2002 Ecoinvent data V2.2 (2010) Switzerland lime, hydraulic, at plant Materials Construction 8.33E-01 kg 2001 Ecoinvent data V2.2 (2010) Switzerland limestone, at mine Materials Construction 1.93E-03 kg 2002 Ecoinvent data V2.2 (2010) Switzerland

Name: Database section:
Database sub-section:
kg CO2 eq/unit
Units: Year: Source: Location:
200
limestone, crushed, for mill Materials Construction 2.14E-03 kg 2002 Ecoinvent data V2.2 (2010) Switzerland limestone, crushed, washed Materials Construction 2.15E-03 kg 2002 Ecoinvent data V2.2 (2010) Switzerland limestone, milled, loose, at plant Materials Construction 1.32E-02 kg 2002 Ecoinvent data V2.2 (2010) Switzerland limestone, milled, packed, at plant Materials Construction 1.93E-02 kg 2002 Ecoinvent data V2.2 (2010) Switzerland mastic asphalt, at plant Materials Construction 2.10E-01 kg 2004 Ecoinvent data V2.2 (2010) Switzerland natural stone plate, cut, at regional storage Materials Construction 2.30E-01 kg 2004 Ecoinvent data V2.2 (2010) Switzerland natural stone plate, grounded, at regional storage Materials Construction 3.13E-01 kg 2004 Ecoinvent data V2.2 (2010) Switzerland
natural stone plate, polished, at regional storage Materials Construction 3.80E-01 kg 2004 Ecoinvent data V2.2 (2010) Switzerland
packing, cement Materials Construction 2.88E-03 kg 2001 Ecoinvent data V2.2 (2010) Switzerland packing, clay products Materials Construction 5.62E-03 kg 2002 Ecoinvent data V2.2 (2010) Switzerland packing, fibre cement products Materials Construction 1.13E-02 kg 2001 Ecoinvent data V2.2 (2010) Switzerland packing, lime products Materials Construction 5.97E-03 kg 2002 Ecoinvent data V2.2 (2010) Switzerland perlite, at mine Materials Construction 1.70E-03 kg 2000 Ecoinvent data V2.2 (2010) Germany plaster mixing Materials Construction 1.09E-02 kg 2001 Ecoinvent data V2.2 (2010) Switzerland portland calcareous cement, at plant Materials Construction 7.19E-01 kg 2001 Ecoinvent data V2.2 (2010) Switzerland portland cement, strength class Z 42.5, at plant Materials Construction 8.22E-01 kg 2001 Ecoinvent data V2.2 (2010) Switzerland
portland cement, strength class Z 52.5, at plant Materials Construction 8.33E-01 kg 2001 Ecoinvent data V2.2 (2010) Switzerland
portland slag sand cement, at plant Materials Construction 7.05E-01 kg 2001 Ecoinvent data V2.2 (2010) Switzerland pumice, at mine Materials Construction 7.46E-04 kg 2000 Ecoinvent data V2.2 (2010) Germany quarry tile, at plant Materials Construction 2.27E-01 kg 2004 Ecoinvent data V2.2 (2010) Switzerland quicklime, in pieces, loose, at plant Materials Construction 9.84E-01 kg 2002 Ecoinvent data V2.2 (2010) Switzerland quicklime, milled, loose, at plant Materials Construction 9.86E-01 kg 2002 Ecoinvent data V2.2 (2010) Switzerland quicklime, milled, packed, at plant Materials Construction 9.92E-01 kg 2002 Ecoinvent data V2.2 (2010) Switzerland refractory, basic, packed, at plant Materials Construction 2.32E+00 kg 2001 Ecoinvent data V2.2 (2010) Germany refractory, fireclay, packed, at plant Materials Construction 1.19E+00 kg 2001 Ecoinvent data V2.2 (2010) Germany refractory, high aluminium oxide, packed, at plant Materials Construction 8.92E-01 kg 2001 Ecoinvent data V2.2 (2010) Germany
roof tile, at plant Materials Construction 3.58E-01 kg 2002 Ecoinvent data V2.2 (2010) Europe sand, at mine Materials Construction 2.41E-03 kg 2001 Ecoinvent data V2.2 (2010) Switzerland sand-lime brick, at plant Materials Construction 1.30E-01 kg 2001 Ecoinvent data V2.2 (2010) Germany sanitary ceramics, at regional storage Materials Construction 2.34E+00 kg 2002 Ecoinvent data V2.2 (2010) Switzerland
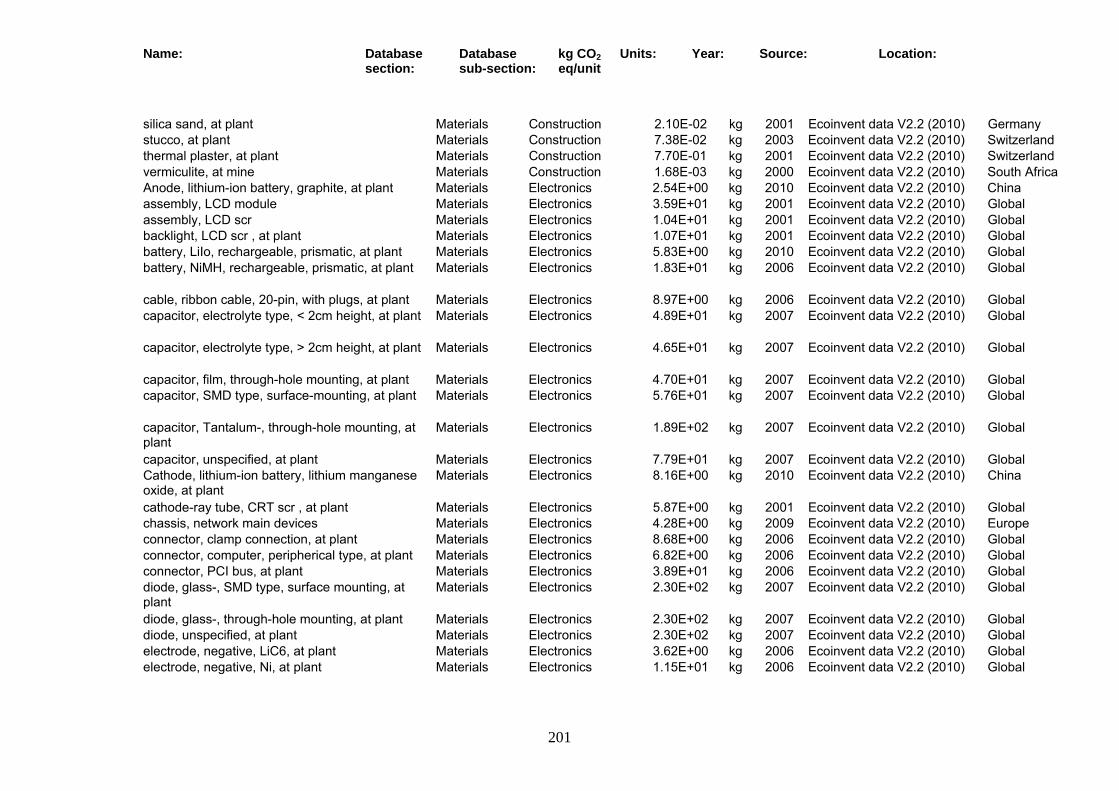
Name: Database section:
Database sub-section:
kg CO2 eq/unit
Units: Year: Source: Location:
201
silica sand, at plant Materials Construction 2.10E-02 kg 2001 Ecoinvent data V2.2 (2010) Germany stucco, at plant Materials Construction 7.38E-02 kg 2003 Ecoinvent data V2.2 (2010) Switzerland thermal plaster, at plant Materials Construction 7.70E-01 kg 2001 Ecoinvent data V2.2 (2010) Switzerland vermiculite, at mine Materials Construction 1.68E-03 kg 2000 Ecoinvent data V2.2 (2010) South Africa Anode, lithium-ion battery, graphite, at plant Materials Electronics 2.54E+00 kg 2010 Ecoinvent data V2.2 (2010) China assembly, LCD module Materials Electronics 3.59E+01 kg 2001 Ecoinvent data V2.2 (2010) Global assembly, LCD scr Materials Electronics 1.04E+01 kg 2001 Ecoinvent data V2.2 (2010) Global backlight, LCD scr , at plant Materials Electronics 1.07E+01 kg 2001 Ecoinvent data V2.2 (2010) Global battery, LiIo, rechargeable, prismatic, at plant Materials Electronics 5.83E+00 kg 2010 Ecoinvent data V2.2 (2010) Global battery, NiMH, rechargeable, prismatic, at plant Materials Electronics 1.83E+01 kg 2006 Ecoinvent data V2.2 (2010) Global
cable, ribbon cable, 20-pin, with plugs, at plant Materials Electronics 8.97E+00 kg 2006 Ecoinvent data V2.2 (2010) Global capacitor, electrolyte type, < 2cm height, at plant Materials Electronics 4.89E+01 kg 2007 Ecoinvent data V2.2 (2010) Global
capacitor, electrolyte type, > 2cm height, at plant Materials Electronics 4.65E+01 kg 2007 Ecoinvent data V2.2 (2010) Global
capacitor, film, through-hole mounting, at plant Materials Electronics 4.70E+01 kg 2007 Ecoinvent data V2.2 (2010) Global capacitor, SMD type, surface-mounting, at plant Materials Electronics 5.76E+01 kg 2007 Ecoinvent data V2.2 (2010) Global
capacitor, Tantalum-, through-hole mounting, at plant
Materials Electronics 1.89E+02 kg 2007 Ecoinvent data V2.2 (2010) Global
capacitor, unspecified, at plant Materials Electronics 7.79E+01 kg 2007 Ecoinvent data V2.2 (2010) Global Cathode, lithium-ion battery, lithium manganese oxide, at plant
Materials Electronics 8.16E+00 kg 2010 Ecoinvent data V2.2 (2010) China
cathode-ray tube, CRT scr , at plant Materials Electronics 5.87E+00 kg 2001 Ecoinvent data V2.2 (2010) Global chassis, network main devices Materials Electronics 4.28E+00 kg 2009 Ecoinvent data V2.2 (2010) Europe connector, clamp connection, at plant Materials Electronics 8.68E+00 kg 2006 Ecoinvent data V2.2 (2010) Global connector, computer, peripherical type, at plant Materials Electronics 6.82E+00 kg 2006 Ecoinvent data V2.2 (2010) Global connector, PCI bus, at plant Materials Electronics 3.89E+01 kg 2006 Ecoinvent data V2.2 (2010) Global diode, glass-, SMD type, surface mounting, at plant
Materials Electronics 2.30E+02 kg 2007 Ecoinvent data V2.2 (2010) Global
diode, glass-, through-hole mounting, at plant Materials Electronics 2.30E+02 kg 2007 Ecoinvent data V2.2 (2010) Global diode, unspecified, at plant Materials Electronics 2.30E+02 kg 2007 Ecoinvent data V2.2 (2010) Global electrode, negative, LiC6, at plant Materials Electronics 3.62E+00 kg 2006 Ecoinvent data V2.2 (2010) Global electrode, negative, Ni, at plant Materials Electronics 1.15E+01 kg 2006 Ecoinvent data V2.2 (2010) Global
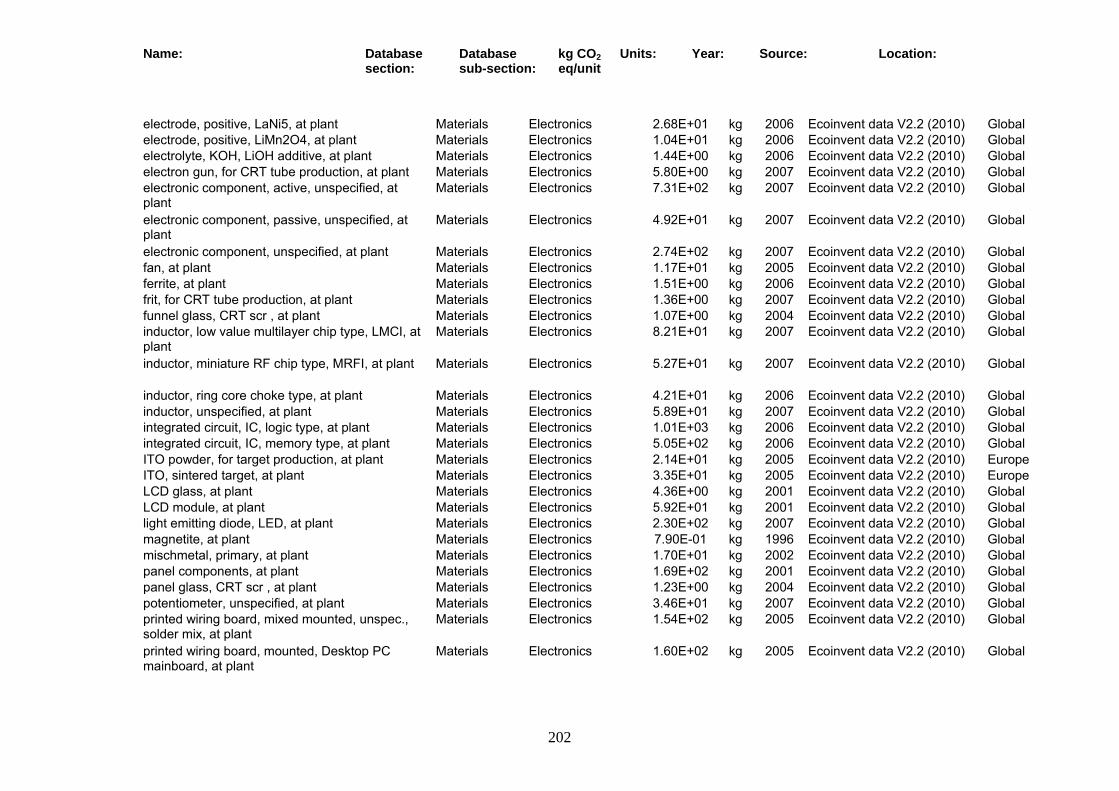
Name: Database section:
Database sub-section:
kg CO2 eq/unit
Units: Year: Source: Location:
202
electrode, positive, LaNi5, at plant Materials Electronics 2.68E+01 kg 2006 Ecoinvent data V2.2 (2010) Global electrode, positive, LiMn2O4, at plant Materials Electronics 1.04E+01 kg 2006 Ecoinvent data V2.2 (2010) Global electrolyte, KOH, LiOH additive, at plant Materials Electronics 1.44E+00 kg 2006 Ecoinvent data V2.2 (2010) Global electron gun, for CRT tube production, at plant Materials Electronics 5.80E+00 kg 2007 Ecoinvent data V2.2 (2010) Global electronic component, active, unspecified, at plant
Materials Electronics 7.31E+02 kg 2007 Ecoinvent data V2.2 (2010) Global
electronic component, passive, unspecified, at plant
Materials Electronics 4.92E+01 kg 2007 Ecoinvent data V2.2 (2010) Global
electronic component, unspecified, at plant Materials Electronics 2.74E+02 kg 2007 Ecoinvent data V2.2 (2010) Global fan, at plant Materials Electronics 1.17E+01 kg 2005 Ecoinvent data V2.2 (2010) Global ferrite, at plant Materials Electronics 1.51E+00 kg 2006 Ecoinvent data V2.2 (2010) Global frit, for CRT tube production, at plant Materials Electronics 1.36E+00 kg 2007 Ecoinvent data V2.2 (2010) Global funnel glass, CRT scr , at plant Materials Electronics 1.07E+00 kg 2004 Ecoinvent data V2.2 (2010) Global inductor, low value multilayer chip type, LMCI, at plant
Materials Electronics 8.21E+01 kg 2007 Ecoinvent data V2.2 (2010) Global
inductor, miniature RF chip type, MRFI, at plant Materials Electronics 5.27E+01 kg 2007 Ecoinvent data V2.2 (2010) Global
inductor, ring core choke type, at plant Materials Electronics 4.21E+01 kg 2006 Ecoinvent data V2.2 (2010) Global inductor, unspecified, at plant Materials Electronics 5.89E+01 kg 2007 Ecoinvent data V2.2 (2010) Global integrated circuit, IC, logic type, at plant Materials Electronics 1.01E+03 kg 2006 Ecoinvent data V2.2 (2010) Global integrated circuit, IC, memory type, at plant Materials Electronics 5.05E+02 kg 2006 Ecoinvent data V2.2 (2010) Global ITO powder, for target production, at plant Materials Electronics 2.14E+01 kg 2005 Ecoinvent data V2.2 (2010) Europe ITO, sintered target, at plant Materials Electronics 3.35E+01 kg 2005 Ecoinvent data V2.2 (2010) Europe LCD glass, at plant Materials Electronics 4.36E+00 kg 2001 Ecoinvent data V2.2 (2010) Global LCD module, at plant Materials Electronics 5.92E+01 kg 2001 Ecoinvent data V2.2 (2010) Global light emitting diode, LED, at plant Materials Electronics 2.30E+02 kg 2007 Ecoinvent data V2.2 (2010) Global magnetite, at plant Materials Electronics 7.90E-01 kg 1996 Ecoinvent data V2.2 (2010) Global mischmetal, primary, at plant Materials Electronics 1.70E+01 kg 2002 Ecoinvent data V2.2 (2010) Global panel components, at plant Materials Electronics 1.69E+02 kg 2001 Ecoinvent data V2.2 (2010) Global panel glass, CRT scr , at plant Materials Electronics 1.23E+00 kg 2004 Ecoinvent data V2.2 (2010) Global potentiometer, unspecified, at plant Materials Electronics 3.46E+01 kg 2007 Ecoinvent data V2.2 (2010) Global printed wiring board, mixed mounted, unspec., solder mix, at plant
Materials Electronics 1.54E+02 kg 2005 Ecoinvent data V2.2 (2010) Global
printed wiring board, mounted, Desktop PC mainboard, at plant
Materials Electronics 1.60E+02 kg 2005 Ecoinvent data V2.2 (2010) Global

Name: Database section:
Database sub-section:
kg CO2 eq/unit
Units: Year: Source: Location:
203
printed wiring board, mounted, Desktop PC mainboard, Pb containing, at plant
Materials Electronics 1.60E+02 kg 2005 Ecoinvent data V2.2 (2010) Global
printed wiring board, mounted, Desktop PC mainboard, Pb free, at plant
Materials Electronics 1.60E+02 kg 2005 Ecoinvent data V2.2 (2010) Global
printed wiring board, mounted, Laptop PC mainboard, at plant
Materials Electronics 2.66E+02 kg 2005 Ecoinvent data V2.2 (2010) Global
printed wiring board, mounted, Laptop PC mainboard, Pb containing, at plant
Materials Electronics 2.66E+02 kg 2005 Ecoinvent data V2.2 (2010) Global
printed wiring board, mounted, Laptop PC mainboard, Pb free, at plant
Materials Electronics 2.66E+02 kg 2005 Ecoinvent data V2.2 (2010) Global
printed wiring board, power supply unit desktop PC, Pb containing, at plant
Materials Electronics 4.17E+01 kg 2005 Ecoinvent data V2.2 (2010) Global
printed wiring board, power supply unit desktop PC, Pb free, at plant
Materials Electronics 4.00E+01 kg 2005 Ecoinvent data V2.2 (2010) Global
printed wiring board, power supply unit desktop PC, solder mix, at plant
Materials Electronics 4.05E+01 kg 2005 Ecoinvent data V2.2 (2010) Global
printed wiring board, surface mounted, unspec., Pb containing, at plant
Materials Electronics 2.50E+02 kg 2005 Ecoinvent data V2.2 (2010) Global
printed wiring board, surface mounted, unspec., Pb free, at plant
Materials Electronics 2.51E+02 kg 2005 Ecoinvent data V2.2 (2010) Global
printed wiring board, surface mounted, unspec., solder mix, at plant
Materials Electronics 2.50E+02 kg 2005 Ecoinvent data V2.2 (2010) Global
printed wiring board, through-hole mounted, unspec., Pb containing, at plant
Materials Electronics 5.86E+01 kg 2005 Ecoinvent data V2.2 (2010) Global
printed wiring board, through-hole mounted, unspec., Pb free, at plant
Materials Electronics 5.66E+01 kg 2005 Ecoinvent data V2.2 (2010) Global
printed wiring board, through-hole mounted, unspec., solder mix, at plant
Materials Electronics 5.72E+01 kg 2005 Ecoinvent data V2.2 (2010) Global
production efforts, capacitors Materials Electronics 3.61E+01 kg 2005 Ecoinvent data V2.2 (2010) Global production efforts, diodes Materials Electronics 2.27E+02 kg 2007 Ecoinvent data V2.2 (2010) Global production efforts, inductor Materials Electronics 3.39E+01 kg 2005 Ecoinvent data V2.2 (2010) Global production efforts, resistors Materials Electronics 2.70E+01 kg 2005 Ecoinvent data V2.2 (2010) Global production efforts, transistors Materials Electronics 1.22E+02 kg 2005 Ecoinvent data V2.2 (2010) Global resistor, metal film type, through-hole mounting, at plant
Materials Electronics 3.08E+01 kg 2007 Ecoinvent data V2.2 (2010) Global
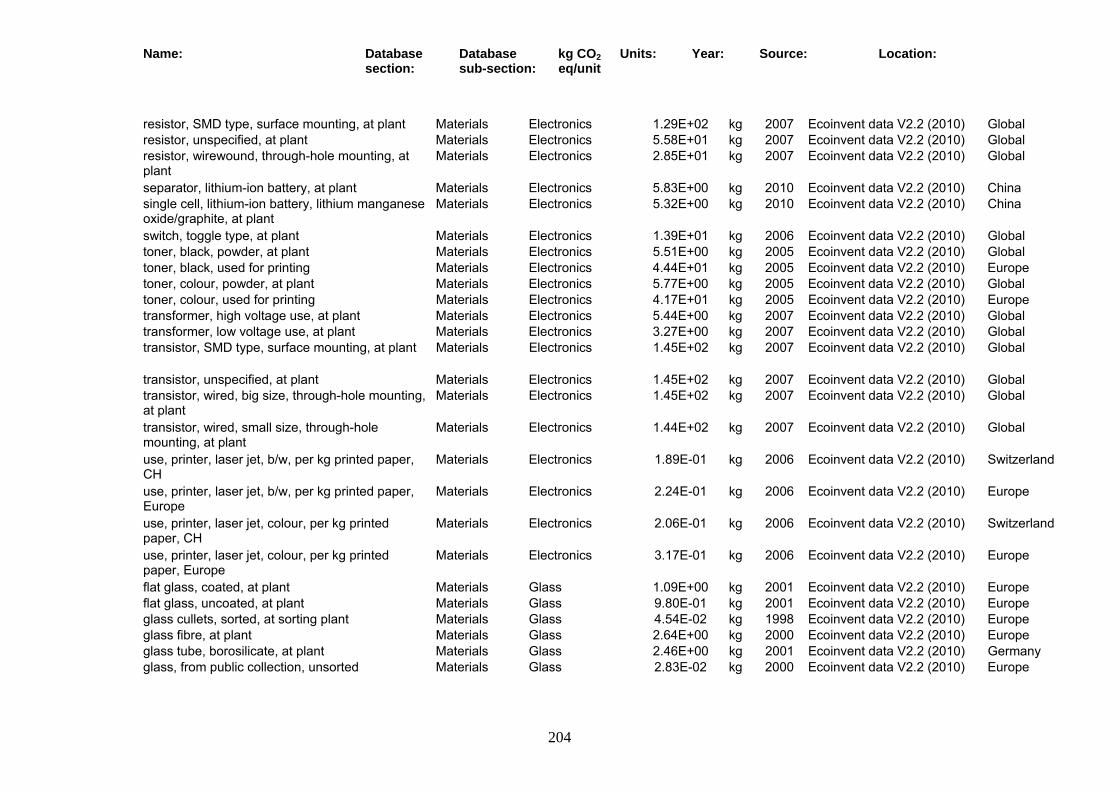
Name: Database section:
Database sub-section:
kg CO2 eq/unit
Units: Year: Source: Location:
204
resistor, SMD type, surface mounting, at plant Materials Electronics 1.29E+02 kg 2007 Ecoinvent data V2.2 (2010) Global resistor, unspecified, at plant Materials Electronics 5.58E+01 kg 2007 Ecoinvent data V2.2 (2010) Global resistor, wirewound, through-hole mounting, at plant
Materials Electronics 2.85E+01 kg 2007 Ecoinvent data V2.2 (2010) Global
separator, lithium-ion battery, at plant Materials Electronics 5.83E+00 kg 2010 Ecoinvent data V2.2 (2010) China single cell, lithium-ion battery, lithium manganese oxide/graphite, at plant
Materials Electronics 5.32E+00 kg 2010 Ecoinvent data V2.2 (2010) China
switch, toggle type, at plant Materials Electronics 1.39E+01 kg 2006 Ecoinvent data V2.2 (2010) Global toner, black, powder, at plant Materials Electronics 5.51E+00 kg 2005 Ecoinvent data V2.2 (2010) Global toner, black, used for printing Materials Electronics 4.44E+01 kg 2005 Ecoinvent data V2.2 (2010) Europe toner, colour, powder, at plant Materials Electronics 5.77E+00 kg 2005 Ecoinvent data V2.2 (2010) Global toner, colour, used for printing Materials Electronics 4.17E+01 kg 2005 Ecoinvent data V2.2 (2010) Europe transformer, high voltage use, at plant Materials Electronics 5.44E+00 kg 2007 Ecoinvent data V2.2 (2010) Global transformer, low voltage use, at plant Materials Electronics 3.27E+00 kg 2007 Ecoinvent data V2.2 (2010) Global transistor, SMD type, surface mounting, at plant Materials Electronics 1.45E+02 kg 2007 Ecoinvent data V2.2 (2010) Global
transistor, unspecified, at plant Materials Electronics 1.45E+02 kg 2007 Ecoinvent data V2.2 (2010) Global transistor, wired, big size, through-hole mounting, at plant
Materials Electronics 1.45E+02 kg 2007 Ecoinvent data V2.2 (2010) Global
transistor, wired, small size, through-hole mounting, at plant
Materials Electronics 1.44E+02 kg 2007 Ecoinvent data V2.2 (2010) Global
use, printer, laser jet, b/w, per kg printed paper, CH
Materials Electronics 1.89E-01 kg 2006 Ecoinvent data V2.2 (2010) Switzerland
use, printer, laser jet, b/w, per kg printed paper, Europe
Materials Electronics 2.24E-01 kg 2006 Ecoinvent data V2.2 (2010) Europe
use, printer, laser jet, colour, per kg printed paper, CH
Materials Electronics 2.06E-01 kg 2006 Ecoinvent data V2.2 (2010) Switzerland
use, printer, laser jet, colour, per kg printed paper, Europe
Materials Electronics 3.17E-01 kg 2006 Ecoinvent data V2.2 (2010) Europe
flat glass, coated, at plant Materials Glass 1.09E+00 kg 2001 Ecoinvent data V2.2 (2010) Europe flat glass, uncoated, at plant Materials Glass 9.80E-01 kg 2001 Ecoinvent data V2.2 (2010) Europe glass cullets, sorted, at sorting plant Materials Glass 4.54E-02 kg 1998 Ecoinvent data V2.2 (2010) Europe glass fibre, at plant Materials Glass 2.64E+00 kg 2000 Ecoinvent data V2.2 (2010) Europe glass tube, borosilicate, at plant Materials Glass 2.46E+00 kg 2001 Ecoinvent data V2.2 (2010) Germany glass, from public collection, unsorted Materials Glass 2.83E-02 kg 2000 Ecoinvent data V2.2 (2010) Europe
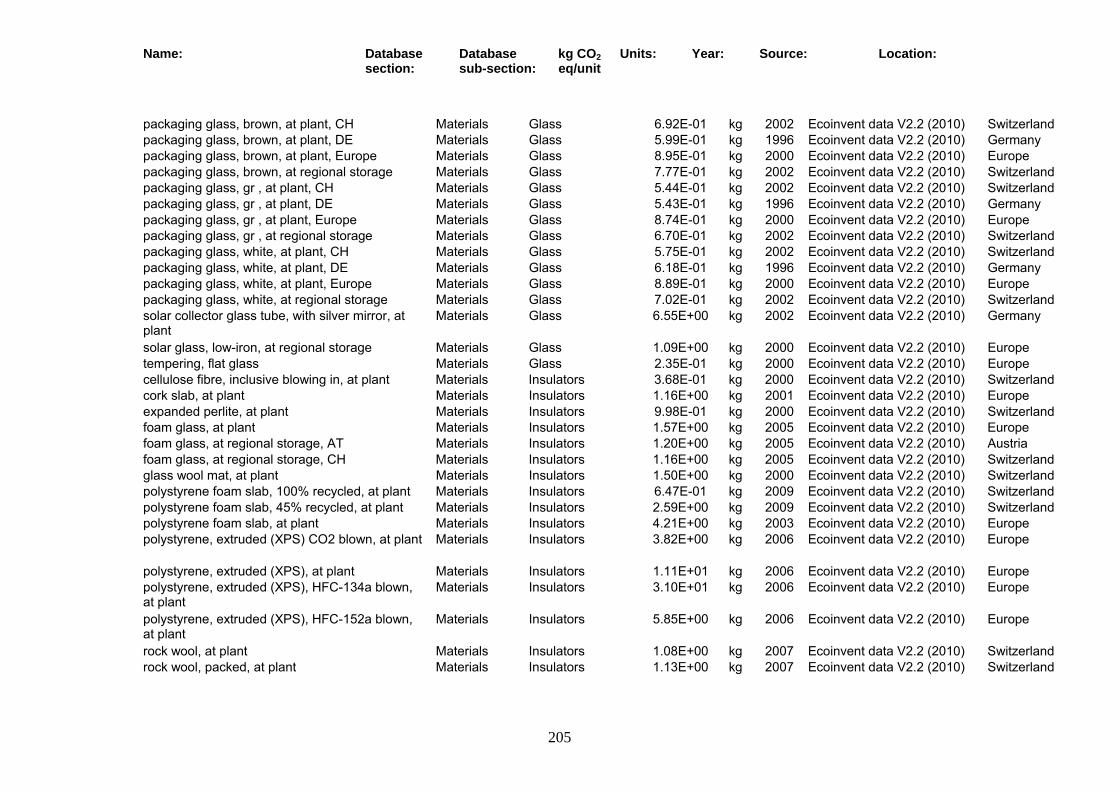
Name: Database section:
Database sub-section:
kg CO2 eq/unit
Units: Year: Source: Location:
205
packaging glass, brown, at plant, CH Materials Glass 6.92E-01 kg 2002 Ecoinvent data V2.2 (2010) Switzerland packaging glass, brown, at plant, DE Materials Glass 5.99E-01 kg 1996 Ecoinvent data V2.2 (2010) Germany packaging glass, brown, at plant, Europe Materials Glass 8.95E-01 kg 2000 Ecoinvent data V2.2 (2010) Europe packaging glass, brown, at regional storage Materials Glass 7.77E-01 kg 2002 Ecoinvent data V2.2 (2010) Switzerland packaging glass, gr , at plant, CH Materials Glass 5.44E-01 kg 2002 Ecoinvent data V2.2 (2010) Switzerland packaging glass, gr , at plant, DE Materials Glass 5.43E-01 kg 1996 Ecoinvent data V2.2 (2010) Germany packaging glass, gr , at plant, Europe Materials Glass 8.74E-01 kg 2000 Ecoinvent data V2.2 (2010) Europe packaging glass, gr , at regional storage Materials Glass 6.70E-01 kg 2002 Ecoinvent data V2.2 (2010) Switzerland packaging glass, white, at plant, CH Materials Glass 5.75E-01 kg 2002 Ecoinvent data V2.2 (2010) Switzerland packaging glass, white, at plant, DE Materials Glass 6.18E-01 kg 1996 Ecoinvent data V2.2 (2010) Germany packaging glass, white, at plant, Europe Materials Glass 8.89E-01 kg 2000 Ecoinvent data V2.2 (2010) Europe packaging glass, white, at regional storage Materials Glass 7.02E-01 kg 2002 Ecoinvent data V2.2 (2010) Switzerland solar collector glass tube, with silver mirror, at plant
Materials Glass 6.55E+00 kg 2002 Ecoinvent data V2.2 (2010) Germany
solar glass, low-iron, at regional storage Materials Glass 1.09E+00 kg 2000 Ecoinvent data V2.2 (2010) Europe tempering, flat glass Materials Glass 2.35E-01 kg 2000 Ecoinvent data V2.2 (2010) Europe cellulose fibre, inclusive blowing in, at plant Materials Insulators 3.68E-01 kg 2000 Ecoinvent data V2.2 (2010) Switzerland cork slab, at plant Materials Insulators 1.16E+00 kg 2001 Ecoinvent data V2.2 (2010) Europe expanded perlite, at plant Materials Insulators 9.98E-01 kg 2000 Ecoinvent data V2.2 (2010) Switzerland foam glass, at plant Materials Insulators 1.57E+00 kg 2005 Ecoinvent data V2.2 (2010) Europe foam glass, at regional storage, AT Materials Insulators 1.20E+00 kg 2005 Ecoinvent data V2.2 (2010) Austria foam glass, at regional storage, CH Materials Insulators 1.16E+00 kg 2005 Ecoinvent data V2.2 (2010) Switzerland glass wool mat, at plant Materials Insulators 1.50E+00 kg 2000 Ecoinvent data V2.2 (2010) Switzerland polystyrene foam slab, 100% recycled, at plant Materials Insulators 6.47E-01 kg 2009 Ecoinvent data V2.2 (2010) Switzerland polystyrene foam slab, 45% recycled, at plant Materials Insulators 2.59E+00 kg 2009 Ecoinvent data V2.2 (2010) Switzerland polystyrene foam slab, at plant Materials Insulators 4.21E+00 kg 2003 Ecoinvent data V2.2 (2010) Europe polystyrene, extruded (XPS) CO2 blown, at plant Materials Insulators 3.82E+00 kg 2006 Ecoinvent data V2.2 (2010) Europe
polystyrene, extruded (XPS), at plant Materials Insulators 1.11E+01 kg 2006 Ecoinvent data V2.2 (2010) Europe polystyrene, extruded (XPS), HFC-134a blown, at plant
Materials Insulators 3.10E+01 kg 2006 Ecoinvent data V2.2 (2010) Europe
polystyrene, extruded (XPS), HFC-152a blown, at plant
Materials Insulators 5.85E+00 kg 2006 Ecoinvent data V2.2 (2010) Europe
rock wool, at plant Materials Insulators 1.08E+00 kg 2007 Ecoinvent data V2.2 (2010) Switzerland rock wool, packed, at plant Materials Insulators 1.13E+00 kg 2007 Ecoinvent data V2.2 (2010) Switzerland

Name: Database section:
Database sub-section:
kg CO2 eq/unit
Units: Year: Source: Location:
206
tube insulation, elastomere, at plant Materials Insulators 4.49E+00 kg 1999 Ecoinvent data V2.2 (2010) Germany urea formaldehyde foam slab, hard, at plant Materials Insulators 2.91E+00 kg 2003 Ecoinvent data V2.2 (2010) Switzerland urea formaldehyde foam, in situ foaming, at plant Materials Insulators 3.05E+00 kg 2003 Ecoinvent data V2.2 (2010) Switzerland
aluminium alloy, AlMg3, at plant Materials Metals 5.87E+00 kg 1998 Ecoinvent data V2.2 (2010) Europe aluminium fluoride, at plant Materials Metals 1.18E+00 kg 2000 Ecoinvent data V2.2 (2010) Europe aluminium product manufacturing, average metal working
Materials Metals 3.32E+00 kg 2007 Ecoinvent data V2.2 (2010) Europe
aluminium scrap, new, at plant Materials Metals 2.13E-02 kg 2002 Ecoinvent data V2.2 (2010) Europe aluminium scrap, old, at plant Materials Metals 2.53E-01 kg 2002 Ecoinvent data V2.2 (2010) Europe aluminium, primary, at plant Materials Metals 1.20E+01 kg 2002 Ecoinvent data V2.2 (2010) Europe aluminium, primary, liquid, at plant Materials Metals 1.19E+01 kg 2002 Ecoinvent data V2.2 (2010) Europe aluminium, production mix, at plant Materials Metals 8.42E+00 kg 2002 Ecoinvent data V2.2 (2010) Europe aluminium, production mix, cast alloy, at plant Materials Metals 3.06E+00 kg 2002 Ecoinvent data V2.2 (2010) Europe aluminium, production mix, wrought alloy, at plant Materials Metals 1.09E+01 kg 2002 Ecoinvent data V2.2 (2010) Europe
aluminium, sConstructiondary, from new scrap, at plant
Materials Metals 4.20E-01 kg 2002 Ecoinvent data V2.2 (2010) Europe
aluminium, sConstructiondary, from old scrap, at plant
Materials Metals 1.38E+00 kg 2002 Ecoinvent data V2.2 (2010) Europe
anode slime, silver and tellurium containing, primary copper production
Materials Metals 3.83E+00 kg 2003 Ecoinvent data V2.2 (2010) Global
anode, aluminium electrolysis Materials Metals 1.00E+00 kg 2002 Ecoinvent data V2.2 (2010) Europe antimony, at refinery Materials Metals 1.29E+01 kg 2003 Ecoinvent data V2.2 (2010) China bauxite, at mine Materials Metals 7.96E-03 kg 2002 Ecoinvent data V2.2 (2010) Global brass, at plant Materials Metals 2.46E+00 kg 2000 Ecoinvent data V2.2 (2010) Switzerland brazing solder, cadmium free, at plant Materials Metals 2.60E+00 kg 2000 Ecoinvent data V2.2 (2010) Europe bronze, at plant Materials Metals 2.78E+00 kg 2000 Ecoinvent data V2.2 (2010) Switzerland cadmium chloride, semiconductor-grade, at plant Materials Metals 2.96E+00 kg 2005 Ecoinvent data V2.2 (2010) United States
cadmium sulphide, semiconductor-grade, at plant Materials Metals 4.12E+00 kg 1999 Ecoinvent data V2.2 (2010) United States
cadmium telluride, semiconductor-grade, at plant Materials Metals 1.58E+01 kg 2005 Ecoinvent data V2.2 (2010) United States
cadmium, primary, at plant Materials Metals 8.01E-01 kg 2005 Ecoinvent data V2.2 (2010) Global
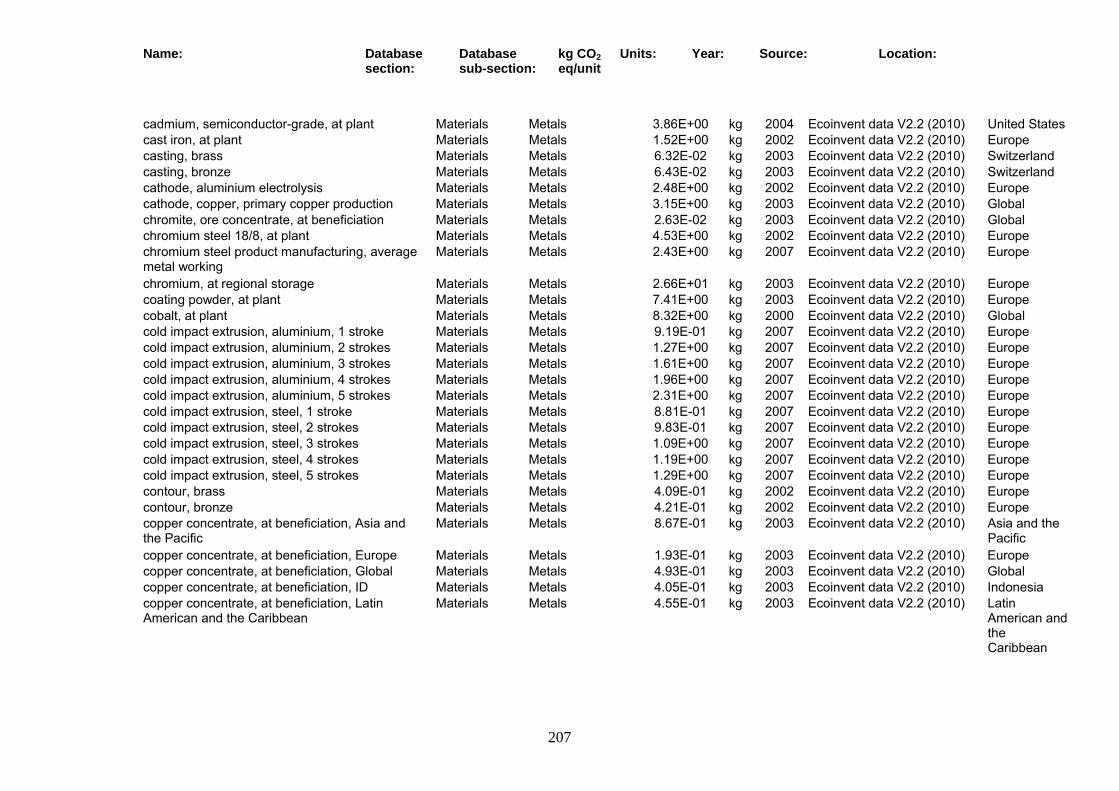
Name: Database section:
Database sub-section:
kg CO2 eq/unit
Units: Year: Source: Location:
207
cadmium, semiconductor-grade, at plant Materials Metals 3.86E+00 kg 2004 Ecoinvent data V2.2 (2010) United States cast iron, at plant Materials Metals 1.52E+00 kg 2002 Ecoinvent data V2.2 (2010) Europe casting, brass Materials Metals 6.32E-02 kg 2003 Ecoinvent data V2.2 (2010) Switzerland casting, bronze Materials Metals 6.43E-02 kg 2003 Ecoinvent data V2.2 (2010) Switzerland cathode, aluminium electrolysis Materials Metals 2.48E+00 kg 2002 Ecoinvent data V2.2 (2010) Europe cathode, copper, primary copper production Materials Metals 3.15E+00 kg 2003 Ecoinvent data V2.2 (2010) Global chromite, ore concentrate, at beneficiation Materials Metals 2.63E-02 kg 2003 Ecoinvent data V2.2 (2010) Global chromium steel 18/8, at plant Materials Metals 4.53E+00 kg 2002 Ecoinvent data V2.2 (2010) Europe chromium steel product manufacturing, average metal working
Materials Metals 2.43E+00 kg 2007 Ecoinvent data V2.2 (2010) Europe
chromium, at regional storage Materials Metals 2.66E+01 kg 2003 Ecoinvent data V2.2 (2010) Europe coating powder, at plant Materials Metals 7.41E+00 kg 2003 Ecoinvent data V2.2 (2010) Europe cobalt, at plant Materials Metals 8.32E+00 kg 2000 Ecoinvent data V2.2 (2010) Global cold impact extrusion, aluminium, 1 stroke Materials Metals 9.19E-01 kg 2007 Ecoinvent data V2.2 (2010) Europe cold impact extrusion, aluminium, 2 strokes Materials Metals 1.27E+00 kg 2007 Ecoinvent data V2.2 (2010) Europe cold impact extrusion, aluminium, 3 strokes Materials Metals 1.61E+00 kg 2007 Ecoinvent data V2.2 (2010) Europe cold impact extrusion, aluminium, 4 strokes Materials Metals 1.96E+00 kg 2007 Ecoinvent data V2.2 (2010) Europe cold impact extrusion, aluminium, 5 strokes Materials Metals 2.31E+00 kg 2007 Ecoinvent data V2.2 (2010) Europe cold impact extrusion, steel, 1 stroke Materials Metals 8.81E-01 kg 2007 Ecoinvent data V2.2 (2010) Europe cold impact extrusion, steel, 2 strokes Materials Metals 9.83E-01 kg 2007 Ecoinvent data V2.2 (2010) Europe cold impact extrusion, steel, 3 strokes Materials Metals 1.09E+00 kg 2007 Ecoinvent data V2.2 (2010) Europe cold impact extrusion, steel, 4 strokes Materials Metals 1.19E+00 kg 2007 Ecoinvent data V2.2 (2010) Europe cold impact extrusion, steel, 5 strokes Materials Metals 1.29E+00 kg 2007 Ecoinvent data V2.2 (2010) Europe contour, brass Materials Metals 4.09E-01 kg 2002 Ecoinvent data V2.2 (2010) Europe contour, bronze Materials Metals 4.21E-01 kg 2002 Ecoinvent data V2.2 (2010) Europe copper concentrate, at beneficiation, Asia and the Pacific
Materials Metals 8.67E-01 kg 2003 Ecoinvent data V2.2 (2010) Asia and the Pacific
copper concentrate, at beneficiation, Europe Materials Metals 1.93E-01 kg 2003 Ecoinvent data V2.2 (2010) Europe copper concentrate, at beneficiation, Global Materials Metals 4.93E-01 kg 2003 Ecoinvent data V2.2 (2010) Global copper concentrate, at beneficiation, ID Materials Metals 4.05E-01 kg 2003 Ecoinvent data V2.2 (2010) Indonesia copper concentrate, at beneficiation, Latin American and the Caribbean
Materials Metals 4.55E-01 kg 2003 Ecoinvent data V2.2 (2010) Latin American and the Caribbean

Name: Database section:
Database sub-section:
kg CO2 eq/unit
Units: Year: Source: Location:
208
copper concentrate, at beneficiation, North America
Materials Metals 8.59E-01 kg 2003 Ecoinvent data V2.2 (2010) North America
copper concentrate, couple production Mo Materials Metals 4.50E-01 kg 2003 Ecoinvent data V2.2 (2010) Global copper product manufacturing, average metal working
Materials Metals 1.84E+00 kg 2007 Ecoinvent data V2.2 (2010) Europe
copper telluride cement, from copper production Materials Metals 5.70E-01 kg 2005 Ecoinvent data V2.2 (2010) Global
copper, at regional storage Materials Metals 1.89E+00 kg 2003 Ecoinvent data V2.2 (2010) Europe copper, blister-copper, at primary smelter Materials Metals 1.60E+00 kg 2003 Ecoinvent data V2.2 (2010) Europe copper, from combined metal production, at beneficiation
Materials Metals 9.87E-01 kg 2006 Ecoinvent data V2.2 (2010) Sweden
copper, from combined metal production, at refinery
Materials Metals 1.93E+00 kg 2006 Ecoinvent data V2.2 (2010) Sweden
copper, from imported concentrates, at refinery Materials Metals 1.05E+00 kg 2003 Ecoinvent data V2.2 (2010) Germany copper, primary, at refinery, Asia and the Pacific Materials Metals 4.79E+00 kg 2003 Ecoinvent data V2.2 (2010) Asia and the
Pacific copper, primary, at refinery, Europe Materials Metals 1.85E+00 kg 2003 Ecoinvent data V2.2 (2010) Europe copper, primary, at refinery, Global Materials Metals 3.15E+00 kg 2003 Ecoinvent data V2.2 (2010) Global copper, primary, at refinery, ID Materials Metals 2.88E+00 kg 2003 Ecoinvent data V2.2 (2010) Indonesia copper, primary, at refinery, Latin American and the Caribbean
Materials Metals 3.24E+00 kg 2003 Ecoinvent data V2.2 (2010) Latin American and the Caribbean
copper, primary, at refinery, North America Materials Metals 4.87E+00 kg 2003 Ecoinvent data V2.2 (2010) North America
copper, primary, couple production nickel Materials Metals 5.07E+00 kg 2003 Ecoinvent data V2.2 (2010) Global copper, primary, from platinum group metal production, RU
Materials Metals 2.00E+00 kg 2002 Ecoinvent data V2.2 (2010) Russian Federation
copper, primary, from platinum group metal production, SA
Materials Metals 2.18E+00 kg 2002 Ecoinvent data V2.2 (2010) South Africa
copper, sConstructiondary, at refinery Materials Metals 1.79E+00 kg 2003 Ecoinvent data V2.2 (2010) Europe copper, sConstructiondary, from electronic and electric scrap recycling, at refinery
Materials Metals 1.04E-01 kg 2005 Ecoinvent data V2.2 (2010) Sweden
copper, SX-EW, at refinery Materials Metals 5.23E+00 kg 2003 Ecoinvent data V2.2 (2010) Global
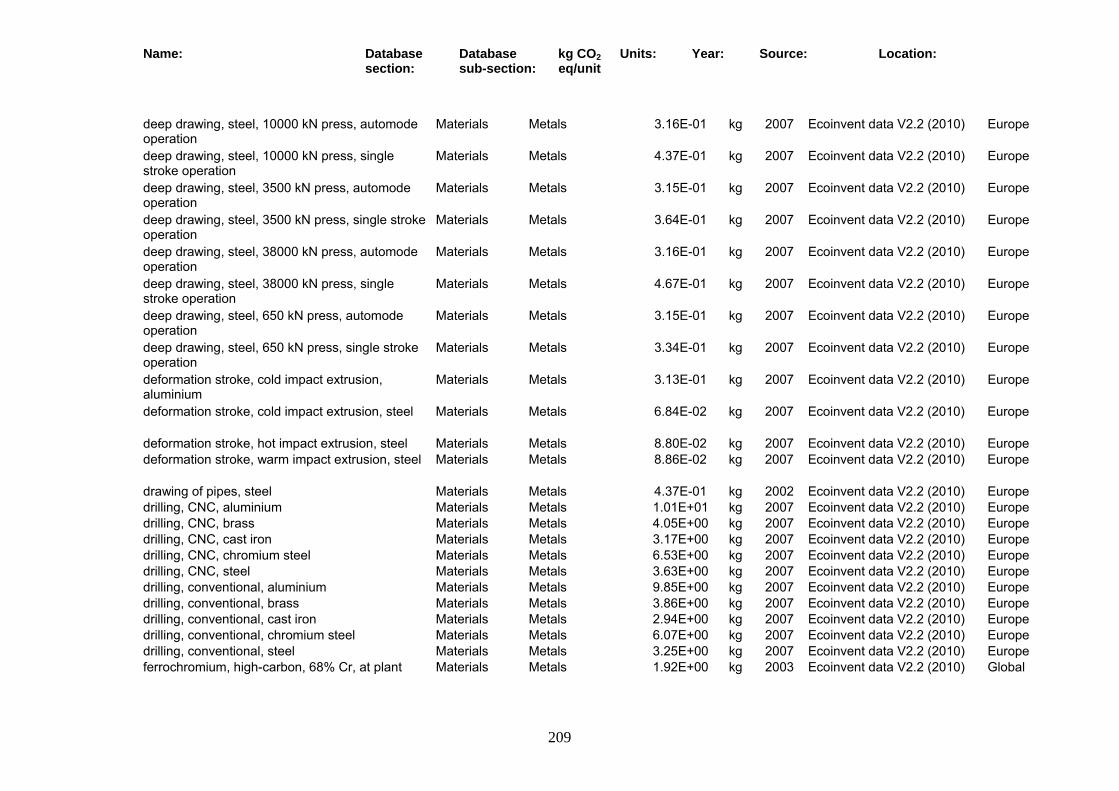
Name: Database section:
Database sub-section:
kg CO2 eq/unit
Units: Year: Source: Location:
209
deep drawing, steel, 10000 kN press, automode operation
Materials Metals 3.16E-01 kg 2007 Ecoinvent data V2.2 (2010) Europe
deep drawing, steel, 10000 kN press, single stroke operation
Materials Metals 4.37E-01 kg 2007 Ecoinvent data V2.2 (2010) Europe
deep drawing, steel, 3500 kN press, automode operation
Materials Metals 3.15E-01 kg 2007 Ecoinvent data V2.2 (2010) Europe
deep drawing, steel, 3500 kN press, single stroke operation
Materials Metals 3.64E-01 kg 2007 Ecoinvent data V2.2 (2010) Europe
deep drawing, steel, 38000 kN press, automode operation
Materials Metals 3.16E-01 kg 2007 Ecoinvent data V2.2 (2010) Europe
deep drawing, steel, 38000 kN press, single stroke operation
Materials Metals 4.67E-01 kg 2007 Ecoinvent data V2.2 (2010) Europe
deep drawing, steel, 650 kN press, automode operation
Materials Metals 3.15E-01 kg 2007 Ecoinvent data V2.2 (2010) Europe
deep drawing, steel, 650 kN press, single stroke operation
Materials Metals 3.34E-01 kg 2007 Ecoinvent data V2.2 (2010) Europe
deformation stroke, cold impact extrusion, aluminium
Materials Metals 3.13E-01 kg 2007 Ecoinvent data V2.2 (2010) Europe
deformation stroke, cold impact extrusion, steel Materials Metals 6.84E-02 kg 2007 Ecoinvent data V2.2 (2010) Europe
deformation stroke, hot impact extrusion, steel Materials Metals 8.80E-02 kg 2007 Ecoinvent data V2.2 (2010) Europe deformation stroke, warm impact extrusion, steel Materials Metals 8.86E-02 kg 2007 Ecoinvent data V2.2 (2010) Europe
drawing of pipes, steel Materials Metals 4.37E-01 kg 2002 Ecoinvent data V2.2 (2010) Europe drilling, CNC, aluminium Materials Metals 1.01E+01 kg 2007 Ecoinvent data V2.2 (2010) Europe drilling, CNC, brass Materials Metals 4.05E+00 kg 2007 Ecoinvent data V2.2 (2010) Europe drilling, CNC, cast iron Materials Metals 3.17E+00 kg 2007 Ecoinvent data V2.2 (2010) Europe drilling, CNC, chromium steel Materials Metals 6.53E+00 kg 2007 Ecoinvent data V2.2 (2010) Europe drilling, CNC, steel Materials Metals 3.63E+00 kg 2007 Ecoinvent data V2.2 (2010) Europe drilling, conventional, aluminium Materials Metals 9.85E+00 kg 2007 Ecoinvent data V2.2 (2010) Europe drilling, conventional, brass Materials Metals 3.86E+00 kg 2007 Ecoinvent data V2.2 (2010) Europe drilling, conventional, cast iron Materials Metals 2.94E+00 kg 2007 Ecoinvent data V2.2 (2010) Europe drilling, conventional, chromium steel Materials Metals 6.07E+00 kg 2007 Ecoinvent data V2.2 (2010) Europe drilling, conventional, steel Materials Metals 3.25E+00 kg 2007 Ecoinvent data V2.2 (2010) Europe ferrochromium, high-carbon, 68% Cr, at plant Materials Metals 1.92E+00 kg 2003 Ecoinvent data V2.2 (2010) Global
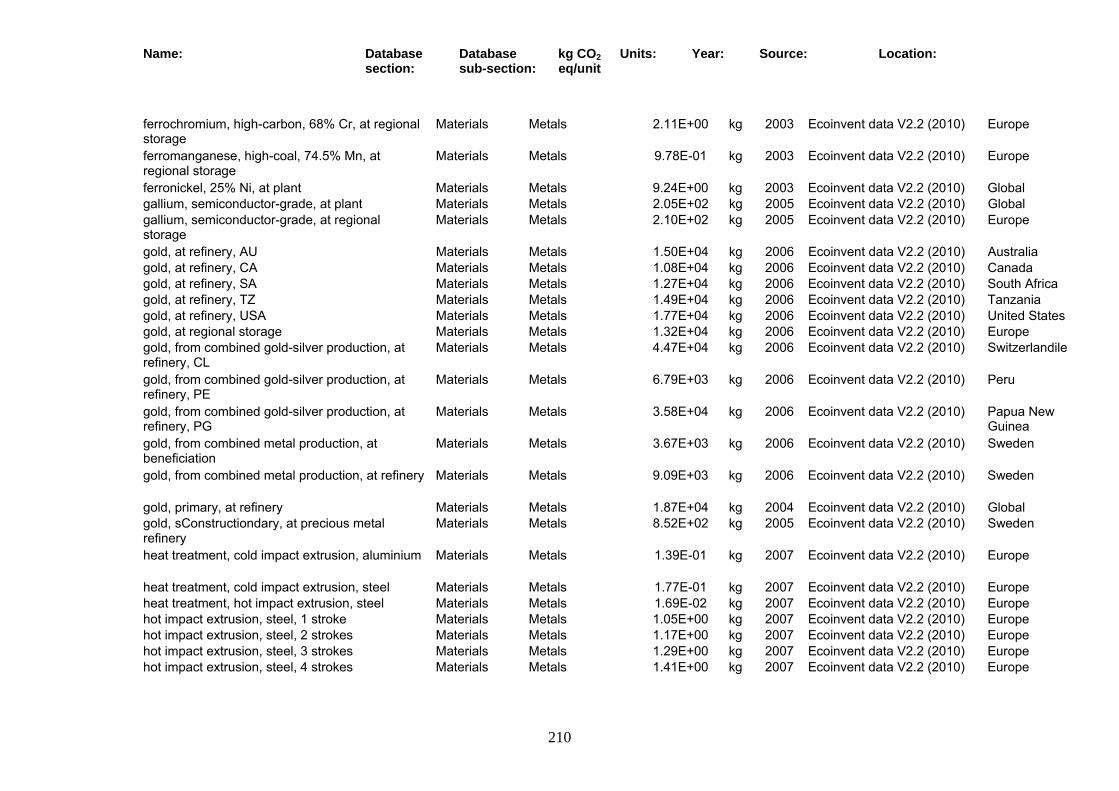
Name: Database section:
Database sub-section:
kg CO2 eq/unit
Units: Year: Source: Location:
210
ferrochromium, high-carbon, 68% Cr, at regional storage
Materials Metals 2.11E+00 kg 2003 Ecoinvent data V2.2 (2010) Europe
ferromanganese, high-coal, 74.5% Mn, at regional storage
Materials Metals 9.78E-01 kg 2003 Ecoinvent data V2.2 (2010) Europe
ferronickel, 25% Ni, at plant Materials Metals 9.24E+00 kg 2003 Ecoinvent data V2.2 (2010) Global gallium, semiconductor-grade, at plant Materials Metals 2.05E+02 kg 2005 Ecoinvent data V2.2 (2010) Global gallium, semiconductor-grade, at regional storage
Materials Metals 2.10E+02 kg 2005 Ecoinvent data V2.2 (2010) Europe
gold, at refinery, AU Materials Metals 1.50E+04 kg 2006 Ecoinvent data V2.2 (2010) Australia gold, at refinery, CA Materials Metals 1.08E+04 kg 2006 Ecoinvent data V2.2 (2010) Canada gold, at refinery, SA Materials Metals 1.27E+04 kg 2006 Ecoinvent data V2.2 (2010) South Africa gold, at refinery, TZ Materials Metals 1.49E+04 kg 2006 Ecoinvent data V2.2 (2010) Tanzania gold, at refinery, USA Materials Metals 1.77E+04 kg 2006 Ecoinvent data V2.2 (2010) United States gold, at regional storage Materials Metals 1.32E+04 kg 2006 Ecoinvent data V2.2 (2010) Europe gold, from combined gold-silver production, at refinery, CL
Materials Metals 4.47E+04 kg 2006 Ecoinvent data V2.2 (2010) Switzerlandile
gold, from combined gold-silver production, at refinery, PE
Materials Metals 6.79E+03 kg 2006 Ecoinvent data V2.2 (2010) Peru
gold, from combined gold-silver production, at refinery, PG
Materials Metals 3.58E+04 kg 2006 Ecoinvent data V2.2 (2010) Papua New Guinea
gold, from combined metal production, at beneficiation
Materials Metals 3.67E+03 kg 2006 Ecoinvent data V2.2 (2010) Sweden
gold, from combined metal production, at refinery Materials Metals 9.09E+03 kg 2006 Ecoinvent data V2.2 (2010) Sweden
gold, primary, at refinery Materials Metals 1.87E+04 kg 2004 Ecoinvent data V2.2 (2010) Global gold, sConstructiondary, at precious metal refinery
Materials Metals 8.52E+02 kg 2005 Ecoinvent data V2.2 (2010) Sweden
heat treatment, cold impact extrusion, aluminium Materials Metals 1.39E-01 kg 2007 Ecoinvent data V2.2 (2010) Europe
heat treatment, cold impact extrusion, steel Materials Metals 1.77E-01 kg 2007 Ecoinvent data V2.2 (2010) Europe heat treatment, hot impact extrusion, steel Materials Metals 1.69E-02 kg 2007 Ecoinvent data V2.2 (2010) Europe hot impact extrusion, steel, 1 stroke Materials Metals 1.05E+00 kg 2007 Ecoinvent data V2.2 (2010) Europe hot impact extrusion, steel, 2 strokes Materials Metals 1.17E+00 kg 2007 Ecoinvent data V2.2 (2010) Europe hot impact extrusion, steel, 3 strokes Materials Metals 1.29E+00 kg 2007 Ecoinvent data V2.2 (2010) Europe hot impact extrusion, steel, 4 strokes Materials Metals 1.41E+00 kg 2007 Ecoinvent data V2.2 (2010) Europe

Name: Database section:
Database sub-section:
kg CO2 eq/unit
Units: Year: Source: Location:
211
hot impact extrusion, steel, 5 strokes Materials Metals 1.53E+00 kg 2007 Ecoinvent data V2.2 (2010) Europe hot rolling, steel Materials Metals 2.80E-01 kg 2002 Ecoinvent data V2.2 (2010) Europe indium, at regional storage Materials Metals 1.54E+02 kg 2005 Ecoinvent data V2.2 (2010) Europe iron ore, 46% Fe, at mine Materials Metals 4.77E-03 kg 2000 Ecoinvent data V2.2 (2010) Global iron ore, 65% Fe, at beneficiation Materials Metals 1.78E-02 kg 2000 Ecoinvent data V2.2 (2010) Global iron scrap, at plant Materials Metals 4.21E-02 kg 2002 Ecoinvent data V2.2 (2010) Europe iron sulphate, at plant Materials Metals 1.67E-01 kg 1993 Ecoinvent data V2.2 (2010) Europe iron-nickel-chromium alloy, at plant Materials Metals 4.64E+00 kg 2005 Ecoinvent data V2.2 (2010) Europe leaching residues, indium rich, from zinc circuit, at smelter
Materials Metals 1.40E-02 kg 2003 Ecoinvent data V2.2 (2010) Global
lead concentrate, at beneficiation Materials Metals 2.96E-01 kg 2003 Ecoinvent data V2.2 (2010) Global lead, at regional storage Materials Metals 1.06E+00 kg 2005 Ecoinvent data V2.2 (2010) Europe lead, from combined metal production, at beneficiation
Materials Metals 2.71E-01 kg 2006 Ecoinvent data V2.2 (2010) Sweden
lead, from combined metal production, at refinery Materials Metals 5.14E-01 kg 2006 Ecoinvent data V2.2 (2010) Sweden
lead, primary, at plant Materials Metals 2.12E+00 kg 2005 Ecoinvent data V2.2 (2010) Global lead, sConstructiondary, at plant Materials Metals 6.59E-01 kg 2005 Ecoinvent data V2.2 (2010) Europe lead, sConstructiondary, from electronic and electric scrap recycling, at plant
Materials Metals 3.47E-02 kg 2005 Ecoinvent data V2.2 (2010) Sweden
lithium, at plant Materials Metals 2.11E+01 kg 2006 Ecoinvent data V2.2 (2010) Global magnesium, at plant Materials Metals 7.38E+01 kg 1998 Ecoinvent data V2.2 (2010) Europe magnesium-alloy, AZ91, at plant Materials Metals 6.76E+01 kg 1998 Ecoinvent data V2.2 (2010) Europe magnesium-alloy, AZ91, diecasting, at plant Materials Metals 1.37E+02 kg 1998 Ecoinvent data V2.2 (2010) Europe manganese concentrate, at beneficiation Materials Metals 1.48E-02 kg 2003 Ecoinvent data V2.2 (2010) Global manganese, at regional storage Materials Metals 2.60E+00 kg 2003 Ecoinvent data V2.2 (2010) Europe mercury, liquid, at plant Materials Metals 1.21E+01 kg 2000 Ecoinvent data V2.2 (2010) Global metal product manufacturing, average metal working
Materials Metals 1.87E+00 kg 2007 Ecoinvent data V2.2 (2010) Europe
metal values from electric waste, in blister-copper, at converter
Materials Metals 1.09E+00 kg 2005 Ecoinvent data V2.2 (2010) Sweden
metal working factory operation, average heat energy
Materials Metals 2.67E-01 kg 2007 Ecoinvent data V2.2 (2010) Europe
metal working factory operation, heat energy from hard coal
Materials Metals 3.09E-01 kg 2007 Ecoinvent data V2.2 (2010) Europe
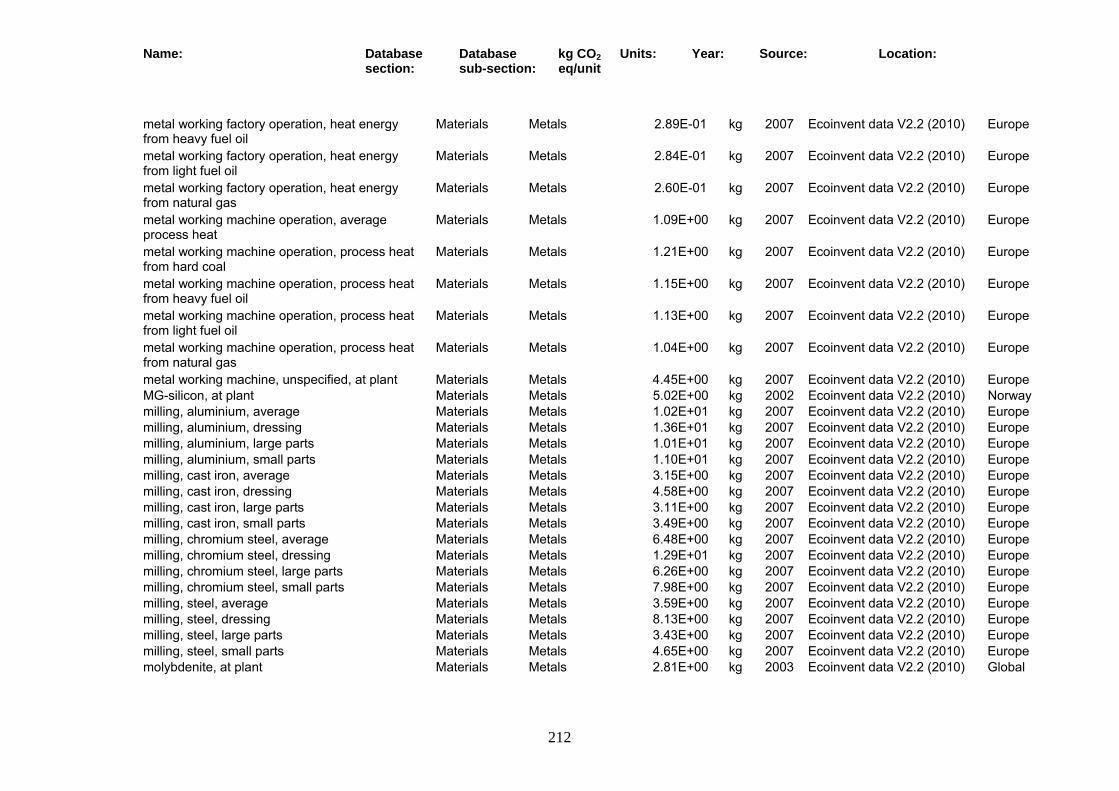
Name: Database section:
Database sub-section:
kg CO2 eq/unit
Units: Year: Source: Location:
212
metal working factory operation, heat energy from heavy fuel oil
Materials Metals 2.89E-01 kg 2007 Ecoinvent data V2.2 (2010) Europe
metal working factory operation, heat energy from light fuel oil
Materials Metals 2.84E-01 kg 2007 Ecoinvent data V2.2 (2010) Europe
metal working factory operation, heat energy from natural gas
Materials Metals 2.60E-01 kg 2007 Ecoinvent data V2.2 (2010) Europe
metal working machine operation, average process heat
Materials Metals 1.09E+00 kg 2007 Ecoinvent data V2.2 (2010) Europe
metal working machine operation, process heat from hard coal
Materials Metals 1.21E+00 kg 2007 Ecoinvent data V2.2 (2010) Europe
metal working machine operation, process heat from heavy fuel oil
Materials Metals 1.15E+00 kg 2007 Ecoinvent data V2.2 (2010) Europe
metal working machine operation, process heat from light fuel oil
Materials Metals 1.13E+00 kg 2007 Ecoinvent data V2.2 (2010) Europe
metal working machine operation, process heat from natural gas
Materials Metals 1.04E+00 kg 2007 Ecoinvent data V2.2 (2010) Europe
metal working machine, unspecified, at plant Materials Metals 4.45E+00 kg 2007 Ecoinvent data V2.2 (2010) Europe MG-silicon, at plant Materials Metals 5.02E+00 kg 2002 Ecoinvent data V2.2 (2010) Norway milling, aluminium, average Materials Metals 1.02E+01 kg 2007 Ecoinvent data V2.2 (2010) Europe milling, aluminium, dressing Materials Metals 1.36E+01 kg 2007 Ecoinvent data V2.2 (2010) Europe milling, aluminium, large parts Materials Metals 1.01E+01 kg 2007 Ecoinvent data V2.2 (2010) Europe milling, aluminium, small parts Materials Metals 1.10E+01 kg 2007 Ecoinvent data V2.2 (2010) Europe milling, cast iron, average Materials Metals 3.15E+00 kg 2007 Ecoinvent data V2.2 (2010) Europe milling, cast iron, dressing Materials Metals 4.58E+00 kg 2007 Ecoinvent data V2.2 (2010) Europe milling, cast iron, large parts Materials Metals 3.11E+00 kg 2007 Ecoinvent data V2.2 (2010) Europe milling, cast iron, small parts Materials Metals 3.49E+00 kg 2007 Ecoinvent data V2.2 (2010) Europe milling, chromium steel, average Materials Metals 6.48E+00 kg 2007 Ecoinvent data V2.2 (2010) Europe milling, chromium steel, dressing Materials Metals 1.29E+01 kg 2007 Ecoinvent data V2.2 (2010) Europe milling, chromium steel, large parts Materials Metals 6.26E+00 kg 2007 Ecoinvent data V2.2 (2010) Europe milling, chromium steel, small parts Materials Metals 7.98E+00 kg 2007 Ecoinvent data V2.2 (2010) Europe milling, steel, average Materials Metals 3.59E+00 kg 2007 Ecoinvent data V2.2 (2010) Europe milling, steel, dressing Materials Metals 8.13E+00 kg 2007 Ecoinvent data V2.2 (2010) Europe milling, steel, large parts Materials Metals 3.43E+00 kg 2007 Ecoinvent data V2.2 (2010) Europe milling, steel, small parts Materials Metals 4.65E+00 kg 2007 Ecoinvent data V2.2 (2010) Europe molybdenite, at plant Materials Metals 2.81E+00 kg 2003 Ecoinvent data V2.2 (2010) Global

Name: Database section:
Database sub-section:
kg CO2 eq/unit
Units: Year: Source: Location:
213
molybdenum concentrate, couple production Cu, Asia and the Pacific
Materials Metals 5.19E+00 kg 2003 Ecoinvent data V2.2 (2010) Asia and the Pacific
molybdenum concentrate, couple production Cu, Europe
Materials Metals 1.16E+00 kg 2003 Ecoinvent data V2.2 (2010) Europe
molybdenum concentrate, couple production Cu, Global
Materials Metals 2.95E+00 kg 2003 Ecoinvent data V2.2 (2010) Global
molybdenum concentrate, couple production Cu, ID
Materials Metals 2.42E+00 kg 2003 Ecoinvent data V2.2 (2010) Indonesia
molybdenum concentrate, couple production Cu, Latin American and the Caribbean
Materials Metals 2.72E+00 kg 2003 Ecoinvent data V2.2 (2010) Latin American and the Caribbean
molybdenum concentrate, couple production Cu, North America
Materials Metals 5.14E+00 kg 2003 Ecoinvent data V2.2 (2010) North America
Molybdenum concentrate, main product Materials Metals 2.61E+00 kg 2003 Ecoinvent data V2.2 (2010) Global molybdenum, at regional storage Materials Metals 7.67E+00 kg 2003 Ecoinvent data V2.2 (2010) Europe nickel, 99.5%, at plant Materials Metals 1.09E+01 kg Ecoinvent data V2.2 (2010) Global nickel, primary, from platinum group metal production, RU
Materials Metals 6.69E+00 kg Ecoinvent data V2.2 (2010) Russian Federation
nickel, primary, from platinum group metal production, SA
Materials Metals 7.36E+00 kg 2002 Ecoinvent data V2.2 (2010) South Africa
nickel, sConstructiondary, from electronic and electric scrap recycling, at refinery
Materials Metals 1.70E+00 kg 2005 Ecoinvent data V2.2 (2010) Sweden
palladium, at regional storage Materials Metals 9.73E+03 kg 2002 Ecoinvent data V2.2 (2010) Europe palladium, primary, at refinery, RU Materials Metals 9.73E+03 kg Ecoinvent data V2.2 (2010) Russian
Federation palladium, primary, at refinery, SA Materials Metals 1.06E+04 kg Ecoinvent data V2.2 (2010) South Africa palladium, sConstructiondary, at precious metal refinery
Materials Metals 4.46E+02 kg 2005 Ecoinvent data V2.2 (2010) Sweden
palladium, sConstructiondary, at refinery Materials Metals 7.59E+02 kg 2002 Ecoinvent data V2.2 (2010) Europe parkes process crust, from desilverising of lead Materials Metals 8.97E+00 kg 2005 Ecoinvent data V2.2 (2010) Global pellets, iron, at plant Materials Metals 8.61E-02 kg 2002 Ecoinvent data V2.2 (2010) Global pig iron, at plant Materials Metals 1.56E+00 kg Ecoinvent data V2.2 (2010) Global platinum, at regional storage Materials Metals 1.48E+04 kg Ecoinvent data V2.2 (2010) Europe platinum, primary, at refinery, RU Materials Metals 1.45E+04 kg Ecoinvent data V2.2 (2010) Russian

Name: Database section:
Database sub-section:
kg CO2 eq/unit
Units: Year: Source: Location:
214
Federation platinum, primary, at refinery, SA Materials Metals 1.58E+04 kg Ecoinvent data V2.2 (2010) South Africa platinum, sConstructiondary, at refinery Materials Metals 7.59E+02 kg Ecoinvent data V2.2 (2010) Europe precious metals from electric waste, in anode slime, at refinery
Materials Metals 5.91E+01 kg 2005 Ecoinvent data V2.2 (2010) Sweden
reinforcing steel, at plant Materials Metals 1.48E+00 kg 2002 Ecoinvent data V2.2 (2010) Europe rhodium, at regional storage Materials Metals 2.90E+04 kg 2002 Ecoinvent data V2.2 (2010) Europe rhodium, primary, at refinery, RU Materials Metals 3.17E+04 kg 2002 Ecoinvent data V2.2 (2010) Russian
Federation rhodium, primary, at refinery, SA Materials Metals 3.47E+04 kg 2002 Ecoinvent data V2.2 (2010) South Africa rhodium, sConstructiondary, at refinery Materials Metals 7.65E+02 kg 2002 Ecoinvent data V2.2 (2010) Europe section bar extrusion, aluminium Materials Metals 1.03E+00 kg 2002 Ecoinvent data V2.2 (2010) Europe section bar rolling, steel Materials Metals 1.99E-01 kg 2002 Ecoinvent data V2.2 (2010) Europe sheet rolling, aluminium Materials Metals 6.02E-01 kg 2002 Ecoinvent data V2.2 (2010) Europe sheet rolling, chromium steel Materials Metals 5.58E-01 kg 2002 Ecoinvent data V2.2 (2010) Europe sheet rolling, copper Materials Metals 3.54E-01 kg 2002 Ecoinvent data V2.2 (2010) Europe sheet rolling, steel Materials Metals 3.61E-01 kg 2002 Ecoinvent data V2.2 (2010) Europe silicon, electronic grade, at plant Materials Metals 8.62E+01 kg 2005 Ecoinvent data V2.2 (2010) Germany silicon, electronic grade, off-grade, at plant Materials Metals 2.71E+01 kg 2005 Ecoinvent data V2.2 (2010) Germany silicon, multi-Si, casted, at plant Materials Metals 6.32E+01 kg 2005 Ecoinvent data V2.2 (2010) Europe silicon, production mix, photovoltaics, at plant Materials Metals 4.60E+01 kg 2005 Ecoinvent data V2.2 (2010) Global silicon, solar grade, modified Siemens process, at plant
Materials Metals 3.99E+01 kg 2005 Ecoinvent data V2.2 (2010) Europe
silver, at regional storage Materials Metals 1.01E+02 kg 2005 Ecoinvent data V2.2 (2010) Europe silver, from combined gold-silver production, at refinery, CL
Materials Metals 7.65E+02 kg 2006 Ecoinvent data V2.2 (2010) Switzerlandile
silver, from combined gold-silver production, at refinery, Glboal
Materials Metals 4.42E+02 kg 2004 Ecoinvent data V2.2 (2010) Global
silver, from combined gold-silver production, at refinery, PE
Materials Metals 1.12E+02 kg 2006 Ecoinvent data V2.2 (2010) Peru
silver, from combined gold-silver production, at refinery, PG
Materials Metals 8.64E+02 kg 2006 Ecoinvent data V2.2 (2010) Papua New Guinea
silver, from combined metal production, at beneficiation
Materials Metals 6.26E+01 kg 2006 Ecoinvent data V2.2 (2010) Sweden
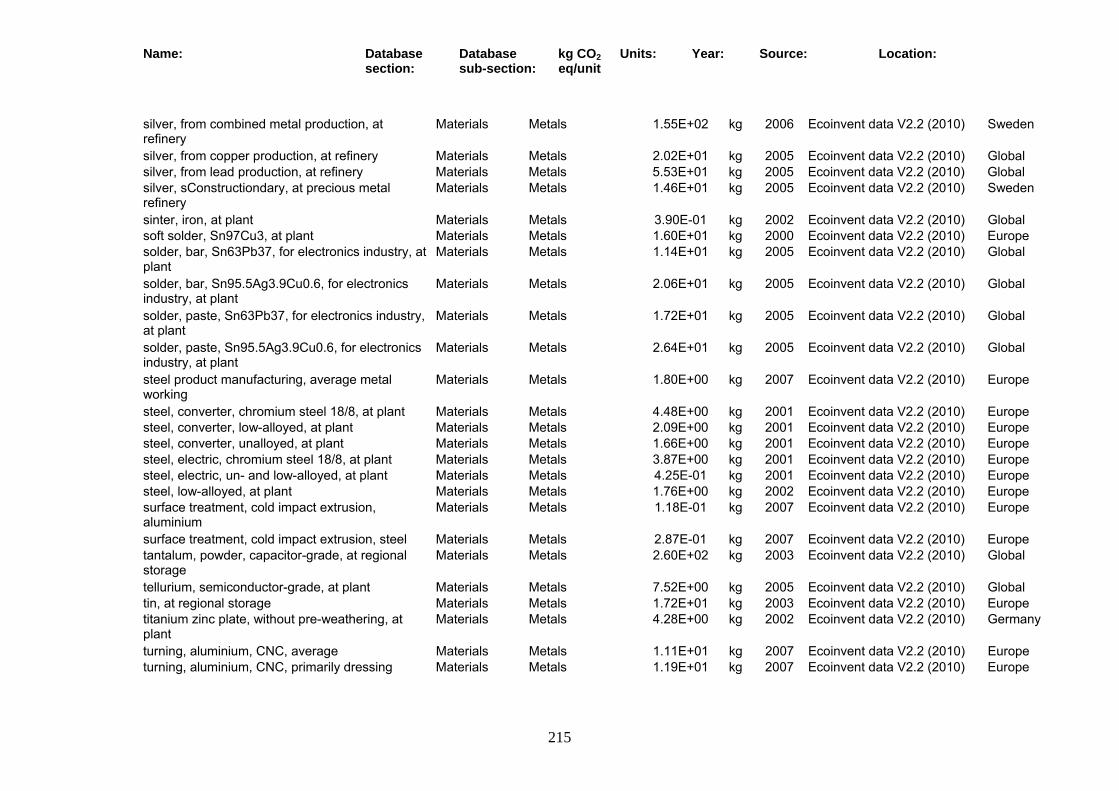
Name: Database section:
Database sub-section:
kg CO2 eq/unit
Units: Year: Source: Location:
215
silver, from combined metal production, at refinery
Materials Metals 1.55E+02 kg 2006 Ecoinvent data V2.2 (2010) Sweden
silver, from copper production, at refinery Materials Metals 2.02E+01 kg 2005 Ecoinvent data V2.2 (2010) Global silver, from lead production, at refinery Materials Metals 5.53E+01 kg 2005 Ecoinvent data V2.2 (2010) Global silver, sConstructiondary, at precious metal refinery
Materials Metals 1.46E+01 kg 2005 Ecoinvent data V2.2 (2010) Sweden
sinter, iron, at plant Materials Metals 3.90E-01 kg 2002 Ecoinvent data V2.2 (2010) Global soft solder, Sn97Cu3, at plant Materials Metals 1.60E+01 kg 2000 Ecoinvent data V2.2 (2010) Europe solder, bar, Sn63Pb37, for electronics industry, at plant
Materials Metals 1.14E+01 kg 2005 Ecoinvent data V2.2 (2010) Global
solder, bar, Sn95.5Ag3.9Cu0.6, for electronics industry, at plant
Materials Metals 2.06E+01 kg 2005 Ecoinvent data V2.2 (2010) Global
solder, paste, Sn63Pb37, for electronics industry, at plant
Materials Metals 1.72E+01 kg 2005 Ecoinvent data V2.2 (2010) Global
solder, paste, Sn95.5Ag3.9Cu0.6, for electronics industry, at plant
Materials Metals 2.64E+01 kg 2005 Ecoinvent data V2.2 (2010) Global
steel product manufacturing, average metal working
Materials Metals 1.80E+00 kg 2007 Ecoinvent data V2.2 (2010) Europe
steel, converter, chromium steel 18/8, at plant Materials Metals 4.48E+00 kg 2001 Ecoinvent data V2.2 (2010) Europe steel, converter, low-alloyed, at plant Materials Metals 2.09E+00 kg 2001 Ecoinvent data V2.2 (2010) Europe steel, converter, unalloyed, at plant Materials Metals 1.66E+00 kg 2001 Ecoinvent data V2.2 (2010) Europe steel, electric, chromium steel 18/8, at plant Materials Metals 3.87E+00 kg 2001 Ecoinvent data V2.2 (2010) Europe steel, electric, un- and low-alloyed, at plant Materials Metals 4.25E-01 kg 2001 Ecoinvent data V2.2 (2010) Europe steel, low-alloyed, at plant Materials Metals 1.76E+00 kg 2002 Ecoinvent data V2.2 (2010) Europe surface treatment, cold impact extrusion, aluminium
Materials Metals 1.18E-01 kg 2007 Ecoinvent data V2.2 (2010) Europe
surface treatment, cold impact extrusion, steel Materials Metals 2.87E-01 kg 2007 Ecoinvent data V2.2 (2010) Europe tantalum, powder, capacitor-grade, at regional storage
Materials Metals 2.60E+02 kg 2003 Ecoinvent data V2.2 (2010) Global
tellurium, semiconductor-grade, at plant Materials Metals 7.52E+00 kg 2005 Ecoinvent data V2.2 (2010) Global tin, at regional storage Materials Metals 1.72E+01 kg 2003 Ecoinvent data V2.2 (2010) Europe titanium zinc plate, without pre-weathering, at plant
Materials Metals 4.28E+00 kg 2002 Ecoinvent data V2.2 (2010) Germany
turning, aluminium, CNC, average Materials Metals 1.11E+01 kg 2007 Ecoinvent data V2.2 (2010) Europe turning, aluminium, CNC, primarily dressing Materials Metals 1.19E+01 kg 2007 Ecoinvent data V2.2 (2010) Europe
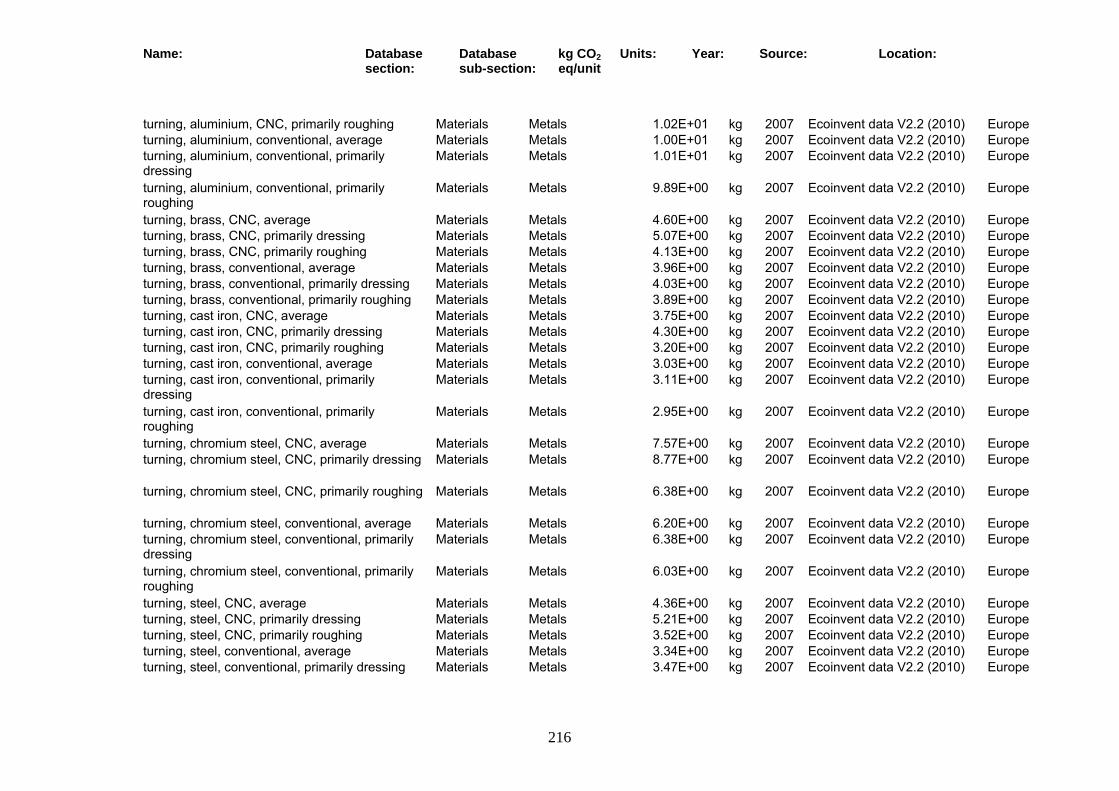
Name: Database section:
Database sub-section:
kg CO2 eq/unit
Units: Year: Source: Location:
216
turning, aluminium, CNC, primarily roughing Materials Metals 1.02E+01 kg 2007 Ecoinvent data V2.2 (2010) Europe turning, aluminium, conventional, average Materials Metals 1.00E+01 kg 2007 Ecoinvent data V2.2 (2010) Europe turning, aluminium, conventional, primarily dressing
Materials Metals 1.01E+01 kg 2007 Ecoinvent data V2.2 (2010) Europe
turning, aluminium, conventional, primarily roughing
Materials Metals 9.89E+00 kg 2007 Ecoinvent data V2.2 (2010) Europe
turning, brass, CNC, average Materials Metals 4.60E+00 kg 2007 Ecoinvent data V2.2 (2010) Europe turning, brass, CNC, primarily dressing Materials Metals 5.07E+00 kg 2007 Ecoinvent data V2.2 (2010) Europe turning, brass, CNC, primarily roughing Materials Metals 4.13E+00 kg 2007 Ecoinvent data V2.2 (2010) Europe turning, brass, conventional, average Materials Metals 3.96E+00 kg 2007 Ecoinvent data V2.2 (2010) Europe turning, brass, conventional, primarily dressing Materials Metals 4.03E+00 kg 2007 Ecoinvent data V2.2 (2010) Europe turning, brass, conventional, primarily roughing Materials Metals 3.89E+00 kg 2007 Ecoinvent data V2.2 (2010) Europe turning, cast iron, CNC, average Materials Metals 3.75E+00 kg 2007 Ecoinvent data V2.2 (2010) Europe turning, cast iron, CNC, primarily dressing Materials Metals 4.30E+00 kg 2007 Ecoinvent data V2.2 (2010) Europe turning, cast iron, CNC, primarily roughing Materials Metals 3.20E+00 kg 2007 Ecoinvent data V2.2 (2010) Europe turning, cast iron, conventional, average Materials Metals 3.03E+00 kg 2007 Ecoinvent data V2.2 (2010) Europe turning, cast iron, conventional, primarily dressing
Materials Metals 3.11E+00 kg 2007 Ecoinvent data V2.2 (2010) Europe
turning, cast iron, conventional, primarily roughing
Materials Metals 2.95E+00 kg 2007 Ecoinvent data V2.2 (2010) Europe
turning, chromium steel, CNC, average Materials Metals 7.57E+00 kg 2007 Ecoinvent data V2.2 (2010) Europe turning, chromium steel, CNC, primarily dressing Materials Metals 8.77E+00 kg 2007 Ecoinvent data V2.2 (2010) Europe
turning, chromium steel, CNC, primarily roughing Materials Metals 6.38E+00 kg 2007 Ecoinvent data V2.2 (2010) Europe
turning, chromium steel, conventional, average Materials Metals 6.20E+00 kg 2007 Ecoinvent data V2.2 (2010) Europe turning, chromium steel, conventional, primarily dressing
Materials Metals 6.38E+00 kg 2007 Ecoinvent data V2.2 (2010) Europe
turning, chromium steel, conventional, primarily roughing
Materials Metals 6.03E+00 kg 2007 Ecoinvent data V2.2 (2010) Europe
turning, steel, CNC, average Materials Metals 4.36E+00 kg 2007 Ecoinvent data V2.2 (2010) Europe turning, steel, CNC, primarily dressing Materials Metals 5.21E+00 kg 2007 Ecoinvent data V2.2 (2010) Europe turning, steel, CNC, primarily roughing Materials Metals 3.52E+00 kg 2007 Ecoinvent data V2.2 (2010) Europe turning, steel, conventional, average Materials Metals 3.34E+00 kg 2007 Ecoinvent data V2.2 (2010) Europe turning, steel, conventional, primarily dressing Materials Metals 3.47E+00 kg 2007 Ecoinvent data V2.2 (2010) Europe
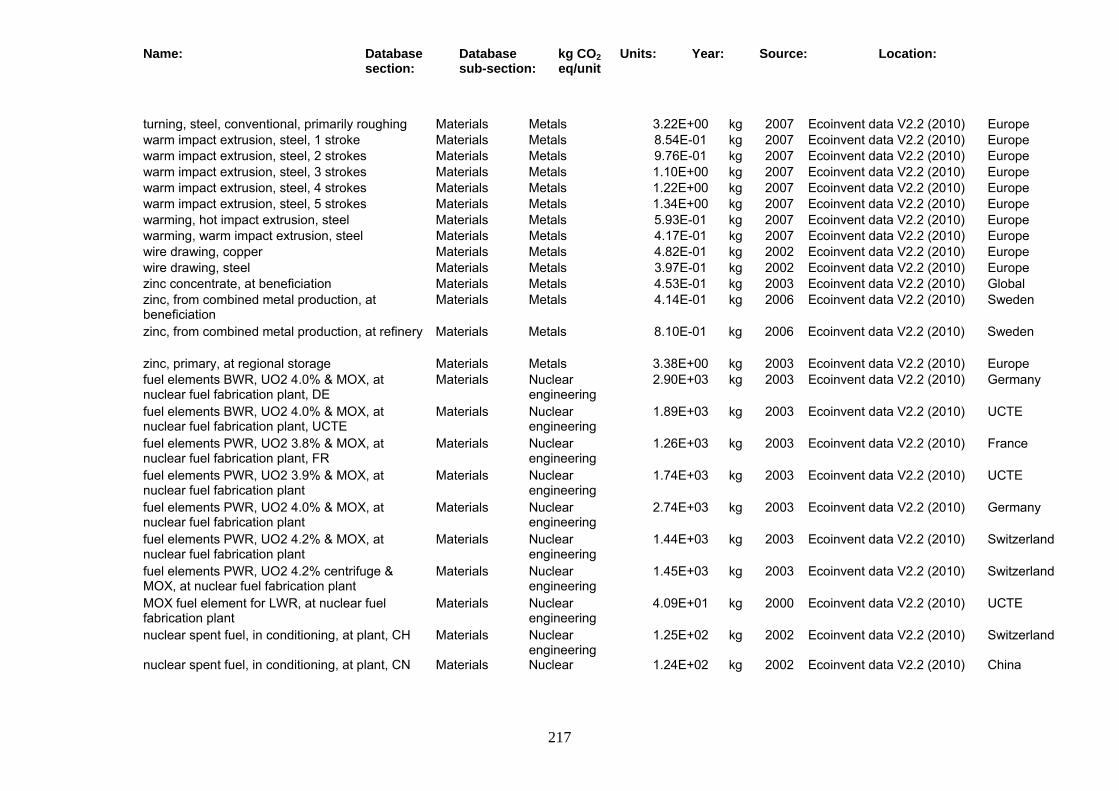
Name: Database section:
Database sub-section:
kg CO2 eq/unit
Units: Year: Source: Location:
217
turning, steel, conventional, primarily roughing Materials Metals 3.22E+00 kg 2007 Ecoinvent data V2.2 (2010) Europe warm impact extrusion, steel, 1 stroke Materials Metals 8.54E-01 kg 2007 Ecoinvent data V2.2 (2010) Europe warm impact extrusion, steel, 2 strokes Materials Metals 9.76E-01 kg 2007 Ecoinvent data V2.2 (2010) Europe warm impact extrusion, steel, 3 strokes Materials Metals 1.10E+00 kg 2007 Ecoinvent data V2.2 (2010) Europe warm impact extrusion, steel, 4 strokes Materials Metals 1.22E+00 kg 2007 Ecoinvent data V2.2 (2010) Europe warm impact extrusion, steel, 5 strokes Materials Metals 1.34E+00 kg 2007 Ecoinvent data V2.2 (2010) Europe warming, hot impact extrusion, steel Materials Metals 5.93E-01 kg 2007 Ecoinvent data V2.2 (2010) Europe warming, warm impact extrusion, steel Materials Metals 4.17E-01 kg 2007 Ecoinvent data V2.2 (2010) Europe wire drawing, copper Materials Metals 4.82E-01 kg 2002 Ecoinvent data V2.2 (2010) Europe wire drawing, steel Materials Metals 3.97E-01 kg 2002 Ecoinvent data V2.2 (2010) Europe zinc concentrate, at beneficiation Materials Metals 4.53E-01 kg 2003 Ecoinvent data V2.2 (2010) Global zinc, from combined metal production, at beneficiation
Materials Metals 4.14E-01 kg 2006 Ecoinvent data V2.2 (2010) Sweden
zinc, from combined metal production, at refinery Materials Metals 8.10E-01 kg 2006 Ecoinvent data V2.2 (2010) Sweden
zinc, primary, at regional storage Materials Metals 3.38E+00 kg 2003 Ecoinvent data V2.2 (2010) Europe fuel elements BWR, UO2 4.0% & MOX, at nuclear fuel fabrication plant, DE
Materials Nuclear engineering
2.90E+03 kg 2003 Ecoinvent data V2.2 (2010) Germany
fuel elements BWR, UO2 4.0% & MOX, at nuclear fuel fabrication plant, UCTE
Materials Nuclear engineering
1.89E+03 kg 2003 Ecoinvent data V2.2 (2010) UCTE
fuel elements PWR, UO2 3.8% & MOX, at nuclear fuel fabrication plant, FR
Materials Nuclear engineering
1.26E+03 kg 2003 Ecoinvent data V2.2 (2010) France
fuel elements PWR, UO2 3.9% & MOX, at nuclear fuel fabrication plant
Materials Nuclear engineering
1.74E+03 kg 2003 Ecoinvent data V2.2 (2010) UCTE
fuel elements PWR, UO2 4.0% & MOX, at nuclear fuel fabrication plant
Materials Nuclear engineering
2.74E+03 kg 2003 Ecoinvent data V2.2 (2010) Germany
fuel elements PWR, UO2 4.2% & MOX, at nuclear fuel fabrication plant
Materials Nuclear engineering
1.44E+03 kg 2003 Ecoinvent data V2.2 (2010) Switzerland
fuel elements PWR, UO2 4.2% centrifuge & MOX, at nuclear fuel fabrication plant
Materials Nuclear engineering
1.45E+03 kg 2003 Ecoinvent data V2.2 (2010) Switzerland
MOX fuel element for LWR, at nuclear fuel fabrication plant
Materials Nuclear engineering
4.09E+01 kg 2000 Ecoinvent data V2.2 (2010) UCTE
nuclear spent fuel, in conditioning, at plant, CH Materials Nuclear engineering
1.25E+02 kg 2002 Ecoinvent data V2.2 (2010) Switzerland
nuclear spent fuel, in conditioning, at plant, CN Materials Nuclear 1.24E+02 kg 2002 Ecoinvent data V2.2 (2010) China
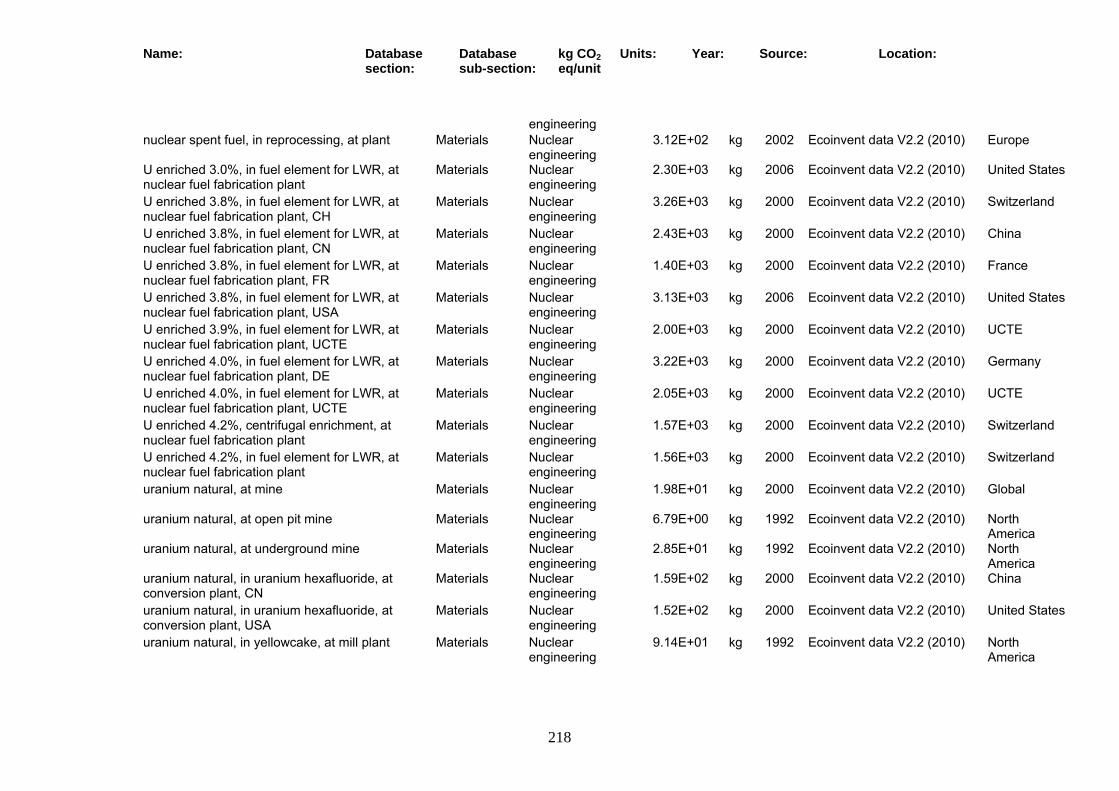
Name: Database section:
Database sub-section:
kg CO2 eq/unit
Units: Year: Source: Location:
218
engineering nuclear spent fuel, in reprocessing, at plant Materials Nuclear
engineering 3.12E+02 kg 2002 Ecoinvent data V2.2 (2010) Europe
U enriched 3.0%, in fuel element for LWR, at nuclear fuel fabrication plant
Materials Nuclear engineering
2.30E+03 kg 2006 Ecoinvent data V2.2 (2010) United States
U enriched 3.8%, in fuel element for LWR, at nuclear fuel fabrication plant, CH
Materials Nuclear engineering
3.26E+03 kg 2000 Ecoinvent data V2.2 (2010) Switzerland
U enriched 3.8%, in fuel element for LWR, at nuclear fuel fabrication plant, CN
Materials Nuclear engineering
2.43E+03 kg 2000 Ecoinvent data V2.2 (2010) China
U enriched 3.8%, in fuel element for LWR, at nuclear fuel fabrication plant, FR
Materials Nuclear engineering
1.40E+03 kg 2000 Ecoinvent data V2.2 (2010) France
U enriched 3.8%, in fuel element for LWR, at nuclear fuel fabrication plant, USA
Materials Nuclear engineering
3.13E+03 kg 2006 Ecoinvent data V2.2 (2010) United States
U enriched 3.9%, in fuel element for LWR, at nuclear fuel fabrication plant, UCTE
Materials Nuclear engineering
2.00E+03 kg 2000 Ecoinvent data V2.2 (2010) UCTE
U enriched 4.0%, in fuel element for LWR, at nuclear fuel fabrication plant, DE
Materials Nuclear engineering
3.22E+03 kg 2000 Ecoinvent data V2.2 (2010) Germany
U enriched 4.0%, in fuel element for LWR, at nuclear fuel fabrication plant, UCTE
Materials Nuclear engineering
2.05E+03 kg 2000 Ecoinvent data V2.2 (2010) UCTE
U enriched 4.2%, centrifugal enrichment, at nuclear fuel fabrication plant
Materials Nuclear engineering
1.57E+03 kg 2000 Ecoinvent data V2.2 (2010) Switzerland
U enriched 4.2%, in fuel element for LWR, at nuclear fuel fabrication plant
Materials Nuclear engineering
1.56E+03 kg 2000 Ecoinvent data V2.2 (2010) Switzerland
uranium natural, at mine Materials Nuclear engineering
1.98E+01 kg 2000 Ecoinvent data V2.2 (2010) Global
uranium natural, at open pit mine Materials Nuclear engineering
6.79E+00 kg 1992 Ecoinvent data V2.2 (2010) North America
uranium natural, at underground mine Materials Nuclear engineering
2.85E+01 kg 1992 Ecoinvent data V2.2 (2010) North America
uranium natural, in uranium hexafluoride, at conversion plant, CN
Materials Nuclear engineering
1.59E+02 kg 2000 Ecoinvent data V2.2 (2010) China
uranium natural, in uranium hexafluoride, at conversion plant, USA
Materials Nuclear engineering
1.52E+02 kg 2000 Ecoinvent data V2.2 (2010) United States
uranium natural, in yellowcake, at mill plant Materials Nuclear engineering
9.14E+01 kg 1992 Ecoinvent data V2.2 (2010) North America
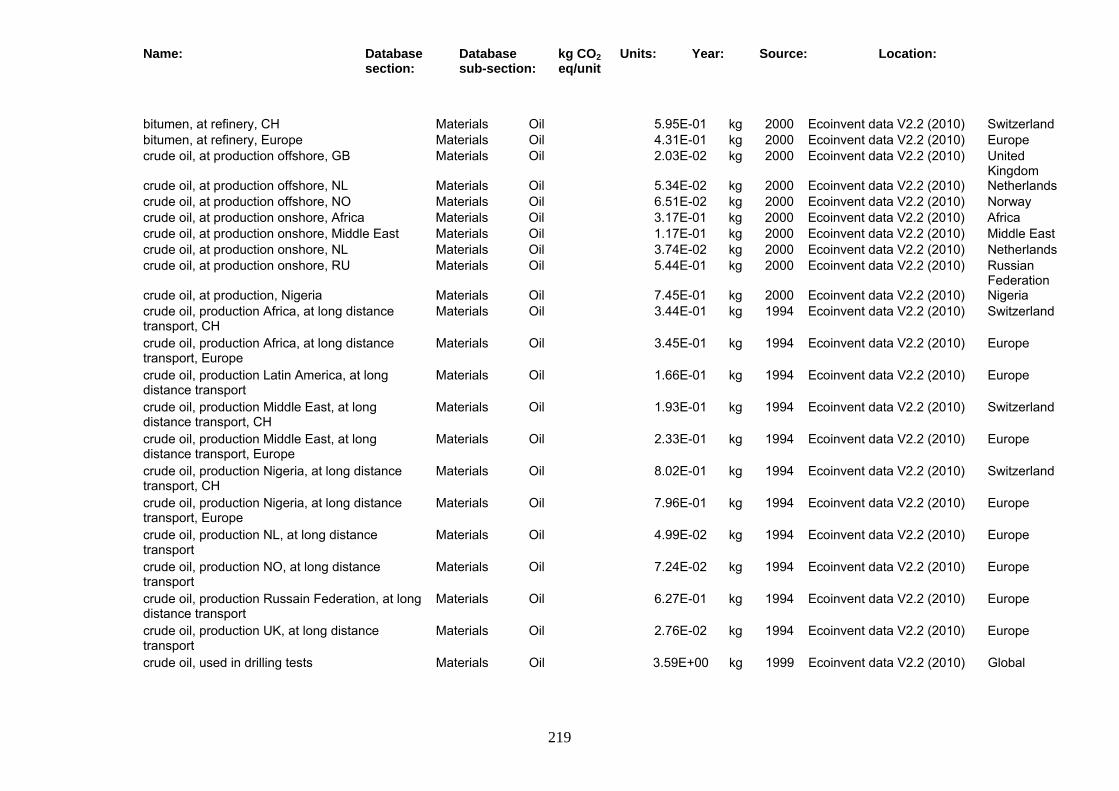
Name: Database section:
Database sub-section:
kg CO2 eq/unit
Units: Year: Source: Location:
219
bitumen, at refinery, CH Materials Oil 5.95E-01 kg 2000 Ecoinvent data V2.2 (2010) Switzerland bitumen, at refinery, Europe Materials Oil 4.31E-01 kg 2000 Ecoinvent data V2.2 (2010) Europe crude oil, at production offshore, GB Materials Oil 2.03E-02 kg 2000 Ecoinvent data V2.2 (2010) United
Kingdom crude oil, at production offshore, NL Materials Oil 5.34E-02 kg 2000 Ecoinvent data V2.2 (2010) Netherlands crude oil, at production offshore, NO Materials Oil 6.51E-02 kg 2000 Ecoinvent data V2.2 (2010) Norway crude oil, at production onshore, Africa Materials Oil 3.17E-01 kg 2000 Ecoinvent data V2.2 (2010) Africa crude oil, at production onshore, Middle East Materials Oil 1.17E-01 kg 2000 Ecoinvent data V2.2 (2010) Middle East crude oil, at production onshore, NL Materials Oil 3.74E-02 kg 2000 Ecoinvent data V2.2 (2010) Netherlands crude oil, at production onshore, RU Materials Oil 5.44E-01 kg 2000 Ecoinvent data V2.2 (2010) Russian
Federation crude oil, at production, Nigeria Materials Oil 7.45E-01 kg 2000 Ecoinvent data V2.2 (2010) Nigeria crude oil, production Africa, at long distance transport, CH
Materials Oil 3.44E-01 kg 1994 Ecoinvent data V2.2 (2010) Switzerland
crude oil, production Africa, at long distance transport, Europe
Materials Oil 3.45E-01 kg 1994 Ecoinvent data V2.2 (2010) Europe
crude oil, production Latin America, at long distance transport
Materials Oil 1.66E-01 kg 1994 Ecoinvent data V2.2 (2010) Europe
crude oil, production Middle East, at long distance transport, CH
Materials Oil 1.93E-01 kg 1994 Ecoinvent data V2.2 (2010) Switzerland
crude oil, production Middle East, at long distance transport, Europe
Materials Oil 2.33E-01 kg 1994 Ecoinvent data V2.2 (2010) Europe
crude oil, production Nigeria, at long distance transport, CH
Materials Oil 8.02E-01 kg 1994 Ecoinvent data V2.2 (2010) Switzerland
crude oil, production Nigeria, at long distance transport, Europe
Materials Oil 7.96E-01 kg 1994 Ecoinvent data V2.2 (2010) Europe
crude oil, production NL, at long distance transport
Materials Oil 4.99E-02 kg 1994 Ecoinvent data V2.2 (2010) Europe
crude oil, production NO, at long distance transport
Materials Oil 7.24E-02 kg 1994 Ecoinvent data V2.2 (2010) Europe
crude oil, production Russain Federation, at long distance transport
Materials Oil 6.27E-01 kg 1994 Ecoinvent data V2.2 (2010) Europe
crude oil, production UK, at long distance transport
Materials Oil 2.76E-02 kg 1994 Ecoinvent data V2.2 (2010) Europe
crude oil, used in drilling tests Materials Oil 3.59E+00 kg 1999 Ecoinvent data V2.2 (2010) Global

Name: Database section:
Database sub-section:
kg CO2 eq/unit
Units: Year: Source: Location:
220
diesel, at refinery, CH Materials Oil 6.28E-01 kg 2000 Ecoinvent data V2.2 (2010) Switzerland diesel, at refinery, Global Materials Oil 4.86E-01 kg 2000 Ecoinvent data V2.2 (2010) Europe diesel, at regional storage, CH Materials Oil 6.01E-01 kg 2000 Ecoinvent data V2.2 (2010) Switzerland diesel, at regional storage, Europe Materials Oil 5.12E-01 kg 2000 Ecoinvent data V2.2 (2010) Europe diesel, low-sulphur, at refinery, CH Materials Oil 6.37E-01 kg 2005 Ecoinvent data V2.2 (2010) Switzerland diesel, low-sulphur, at refinery, Europe Materials Oil 4.99E-01 kg 2005 Ecoinvent data V2.2 (2010) Europe diesel, low-sulphur, at regional storage, CH Materials Oil 6.12E-01 kg 2005 Ecoinvent data V2.2 (2010) Switzerland diesel, low-sulphur, at regional storage, Europe Materials Oil 5.25E-01 kg 2005 Ecoinvent data V2.2 (2010) Europe heavy fuel oil, at refinery, CH Materials Oil 5.91E-01 kg 2000 Ecoinvent data V2.2 (2010) Switzerland heavy fuel oil, at refinery, Europe Materials Oil 4.28E-01 kg 2000 Ecoinvent data V2.2 (2010) Europe heavy fuel oil, at regional storage, CH Materials Oil 6.26E-01 kg 2000 Ecoinvent data V2.2 (2010) Switzerland heavy fuel oil, at regional storage, Europe Materials Oil 4.52E-01 kg 2000 Ecoinvent data V2.2 (2010) Europe heavy fuel oil, burned in refinery furnace, CH Materials Oil 3.83E+00 kg 2000 Ecoinvent data V2.2 (2010) Switzerland heavy fuel oil, burned in refinery furnace, Europe Materials Oil 3.55E+00 kg 2000 Ecoinvent data V2.2 (2010) Europe
kerosene, at refinery, CH Materials Oil 6.28E-01 kg 2000 Ecoinvent data V2.2 (2010) Switzerland kerosene, at refinery, Europe Materials Oil 4.82E-01 kg 2000 Ecoinvent data V2.2 (2010) Europe kerosene, at regional storage, CH Materials Oil 5.87E-01 kg 2000 Ecoinvent data V2.2 (2010) Switzerland kerosene, at regional storage, Europe Materials Oil 5.06E-01 kg 2000 Ecoinvent data V2.2 (2010) Europe light fuel oil, at refinery, CH Materials Oil 6.28E-01 kg 2000 Ecoinvent data V2.2 (2010) Switzerland light fuel oil, at refinery, Europe Materials Oil 4.85E-01 kg 2000 Ecoinvent data V2.2 (2010) Europe light fuel oil, at regional storage, CH Materials Oil 5.91E-01 kg 2000 Ecoinvent data V2.2 (2010) Switzerland light fuel oil, at regional storage, Europe Materials Oil 5.09E-01 kg 2000 Ecoinvent data V2.2 (2010) Europe naphtha, APME mix, at refinery Materials Oil 3.47E-01 kg 2001 Ecoinvent data V2.2 (2010) Europe naphtha, at refinery, CH Materials Oil 5.84E-01 kg 2000 Ecoinvent data V2.2 (2010) Switzerland naphtha, at refinery, Europe Materials Oil 4.23E-01 kg 2000 Ecoinvent data V2.2 (2010) Europe naphtha, at regional storage, CH Materials Oil 6.19E-01 kg 2000 Ecoinvent data V2.2 (2010) Switzerland naphtha, at regional storage, Europe Materials Oil 4.47E-01 kg 2000 Ecoinvent data V2.2 (2010) Europe petrol, 15% vol. ETBE additive, EtOH f. biomass, prod., Europe, at service station
Materials Oil 8.64E-01 kg 2008 Ecoinvent data V2.2 (2010) Switzerland
petrol, 15% vol. ETBE additive, with ethanol from biomass, at refinery
Materials Oil 8.24E-01 kg 2008 Ecoinvent data V2.2 (2010) Europe
petrol, 4% vol. ETBE additive, EtOH f. biomass, prod. Europe, at service station
Materials Oil 7.76E-01 kg 2008 Ecoinvent data V2.2 (2010) Switzerland
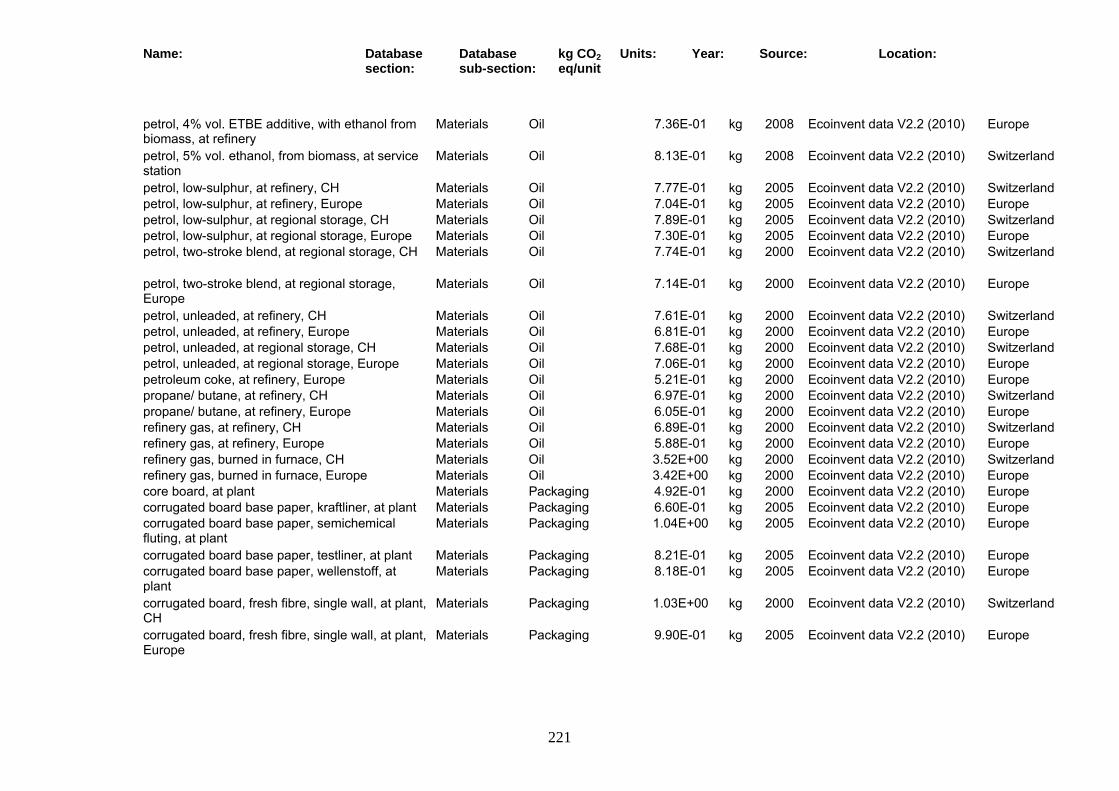
Name: Database section:
Database sub-section:
kg CO2 eq/unit
Units: Year: Source: Location:
221
petrol, 4% vol. ETBE additive, with ethanol from biomass, at refinery
Materials Oil 7.36E-01 kg 2008 Ecoinvent data V2.2 (2010) Europe
petrol, 5% vol. ethanol, from biomass, at service station
Materials Oil 8.13E-01 kg 2008 Ecoinvent data V2.2 (2010) Switzerland
petrol, low-sulphur, at refinery, CH Materials Oil 7.77E-01 kg 2005 Ecoinvent data V2.2 (2010) Switzerland petrol, low-sulphur, at refinery, Europe Materials Oil 7.04E-01 kg 2005 Ecoinvent data V2.2 (2010) Europe petrol, low-sulphur, at regional storage, CH Materials Oil 7.89E-01 kg 2005 Ecoinvent data V2.2 (2010) Switzerland petrol, low-sulphur, at regional storage, Europe Materials Oil 7.30E-01 kg 2005 Ecoinvent data V2.2 (2010) Europe petrol, two-stroke blend, at regional storage, CH Materials Oil 7.74E-01 kg 2000 Ecoinvent data V2.2 (2010) Switzerland
petrol, two-stroke blend, at regional storage, Europe
Materials Oil 7.14E-01 kg 2000 Ecoinvent data V2.2 (2010) Europe
petrol, unleaded, at refinery, CH Materials Oil 7.61E-01 kg 2000 Ecoinvent data V2.2 (2010) Switzerland petrol, unleaded, at refinery, Europe Materials Oil 6.81E-01 kg 2000 Ecoinvent data V2.2 (2010) Europe petrol, unleaded, at regional storage, CH Materials Oil 7.68E-01 kg 2000 Ecoinvent data V2.2 (2010) Switzerland petrol, unleaded, at regional storage, Europe Materials Oil 7.06E-01 kg 2000 Ecoinvent data V2.2 (2010) Europe petroleum coke, at refinery, Europe Materials Oil 5.21E-01 kg 2000 Ecoinvent data V2.2 (2010) Europe propane/ butane, at refinery, CH Materials Oil 6.97E-01 kg 2000 Ecoinvent data V2.2 (2010) Switzerland propane/ butane, at refinery, Europe Materials Oil 6.05E-01 kg 2000 Ecoinvent data V2.2 (2010) Europe refinery gas, at refinery, CH Materials Oil 6.89E-01 kg 2000 Ecoinvent data V2.2 (2010) Switzerland refinery gas, at refinery, Europe Materials Oil 5.88E-01 kg 2000 Ecoinvent data V2.2 (2010) Europe refinery gas, burned in furnace, CH Materials Oil 3.52E+00 kg 2000 Ecoinvent data V2.2 (2010) Switzerland refinery gas, burned in furnace, Europe Materials Oil 3.42E+00 kg 2000 Ecoinvent data V2.2 (2010) Europe core board, at plant Materials Packaging 4.92E-01 kg 2000 Ecoinvent data V2.2 (2010) Europe corrugated board base paper, kraftliner, at plant Materials Packaging 6.60E-01 kg 2005 Ecoinvent data V2.2 (2010) Europe corrugated board base paper, semichemical fluting, at plant
Materials Packaging 1.04E+00 kg 2005 Ecoinvent data V2.2 (2010) Europe
corrugated board base paper, testliner, at plant Materials Packaging 8.21E-01 kg 2005 Ecoinvent data V2.2 (2010) Europe corrugated board base paper, wellenstoff, at plant
Materials Packaging 8.18E-01 kg 2005 Ecoinvent data V2.2 (2010) Europe
corrugated board, fresh fibre, single wall, at plant, CH
Materials Packaging 1.03E+00 kg 2000 Ecoinvent data V2.2 (2010) Switzerland
corrugated board, fresh fibre, single wall, at plant, Europe
Materials Packaging 9.90E-01 kg 2005 Ecoinvent data V2.2 (2010) Europe
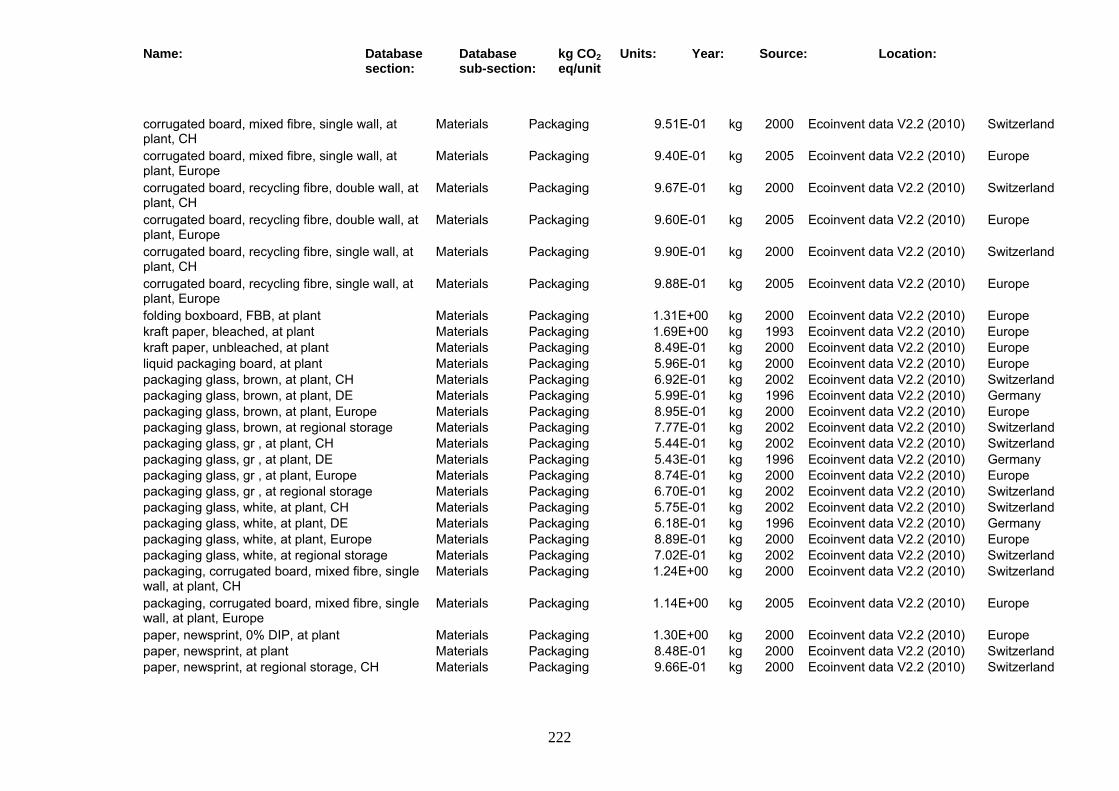
Name: Database section:
Database sub-section:
kg CO2 eq/unit
Units: Year: Source: Location:
222
corrugated board, mixed fibre, single wall, at plant, CH
Materials Packaging 9.51E-01 kg 2000 Ecoinvent data V2.2 (2010) Switzerland
corrugated board, mixed fibre, single wall, at plant, Europe
Materials Packaging 9.40E-01 kg 2005 Ecoinvent data V2.2 (2010) Europe
corrugated board, recycling fibre, double wall, at plant, CH
Materials Packaging 9.67E-01 kg 2000 Ecoinvent data V2.2 (2010) Switzerland
corrugated board, recycling fibre, double wall, at plant, Europe
Materials Packaging 9.60E-01 kg 2005 Ecoinvent data V2.2 (2010) Europe
corrugated board, recycling fibre, single wall, at plant, CH
Materials Packaging 9.90E-01 kg 2000 Ecoinvent data V2.2 (2010) Switzerland
corrugated board, recycling fibre, single wall, at plant, Europe
Materials Packaging 9.88E-01 kg 2005 Ecoinvent data V2.2 (2010) Europe
folding boxboard, FBB, at plant Materials Packaging 1.31E+00 kg 2000 Ecoinvent data V2.2 (2010) Europe kraft paper, bleached, at plant Materials Packaging 1.69E+00 kg 1993 Ecoinvent data V2.2 (2010) Europe kraft paper, unbleached, at plant Materials Packaging 8.49E-01 kg 2000 Ecoinvent data V2.2 (2010) Europe liquid packaging board, at plant Materials Packaging 5.96E-01 kg 2000 Ecoinvent data V2.2 (2010) Europe packaging glass, brown, at plant, CH Materials Packaging 6.92E-01 kg 2002 Ecoinvent data V2.2 (2010) Switzerland packaging glass, brown, at plant, DE Materials Packaging 5.99E-01 kg 1996 Ecoinvent data V2.2 (2010) Germany packaging glass, brown, at plant, Europe Materials Packaging 8.95E-01 kg 2000 Ecoinvent data V2.2 (2010) Europe packaging glass, brown, at regional storage Materials Packaging 7.77E-01 kg 2002 Ecoinvent data V2.2 (2010) Switzerland packaging glass, gr , at plant, CH Materials Packaging 5.44E-01 kg 2002 Ecoinvent data V2.2 (2010) Switzerland packaging glass, gr , at plant, DE Materials Packaging 5.43E-01 kg 1996 Ecoinvent data V2.2 (2010) Germany packaging glass, gr , at plant, Europe Materials Packaging 8.74E-01 kg 2000 Ecoinvent data V2.2 (2010) Europe packaging glass, gr , at regional storage Materials Packaging 6.70E-01 kg 2002 Ecoinvent data V2.2 (2010) Switzerland packaging glass, white, at plant, CH Materials Packaging 5.75E-01 kg 2002 Ecoinvent data V2.2 (2010) Switzerland packaging glass, white, at plant, DE Materials Packaging 6.18E-01 kg 1996 Ecoinvent data V2.2 (2010) Germany packaging glass, white, at plant, Europe Materials Packaging 8.89E-01 kg 2000 Ecoinvent data V2.2 (2010) Europe packaging glass, white, at regional storage Materials Packaging 7.02E-01 kg 2002 Ecoinvent data V2.2 (2010) Switzerland packaging, corrugated board, mixed fibre, single wall, at plant, CH
Materials Packaging 1.24E+00 kg 2000 Ecoinvent data V2.2 (2010) Switzerland
packaging, corrugated board, mixed fibre, single wall, at plant, Europe
Materials Packaging 1.14E+00 kg 2005 Ecoinvent data V2.2 (2010) Europe
paper, newsprint, 0% DIP, at plant Materials Packaging 1.30E+00 kg 2000 Ecoinvent data V2.2 (2010) Europe paper, newsprint, at plant Materials Packaging 8.48E-01 kg 2000 Ecoinvent data V2.2 (2010) Switzerland paper, newsprint, at regional storage, CH Materials Packaging 9.66E-01 kg 2000 Ecoinvent data V2.2 (2010) Switzerland
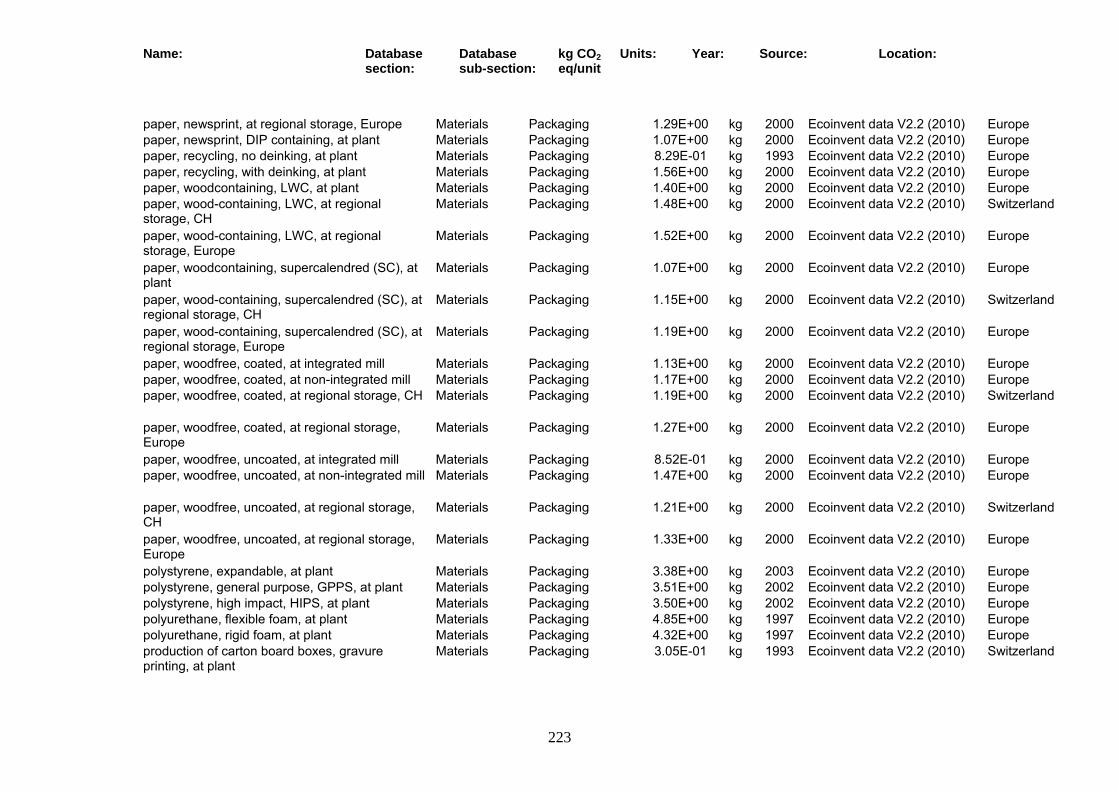
Name: Database section:
Database sub-section:
kg CO2 eq/unit
Units: Year: Source: Location:
223
paper, newsprint, at regional storage, Europe Materials Packaging 1.29E+00 kg 2000 Ecoinvent data V2.2 (2010) Europe paper, newsprint, DIP containing, at plant Materials Packaging 1.07E+00 kg 2000 Ecoinvent data V2.2 (2010) Europe paper, recycling, no deinking, at plant Materials Packaging 8.29E-01 kg 1993 Ecoinvent data V2.2 (2010) Europe paper, recycling, with deinking, at plant Materials Packaging 1.56E+00 kg 2000 Ecoinvent data V2.2 (2010) Europe paper, woodcontaining, LWC, at plant Materials Packaging 1.40E+00 kg 2000 Ecoinvent data V2.2 (2010) Europe paper, wood-containing, LWC, at regional storage, CH
Materials Packaging 1.48E+00 kg 2000 Ecoinvent data V2.2 (2010) Switzerland
paper, wood-containing, LWC, at regional storage, Europe
Materials Packaging 1.52E+00 kg 2000 Ecoinvent data V2.2 (2010) Europe
paper, woodcontaining, supercalendred (SC), at plant
Materials Packaging 1.07E+00 kg 2000 Ecoinvent data V2.2 (2010) Europe
paper, wood-containing, supercalendred (SC), at regional storage, CH
Materials Packaging 1.15E+00 kg 2000 Ecoinvent data V2.2 (2010) Switzerland
paper, wood-containing, supercalendred (SC), at regional storage, Europe
Materials Packaging 1.19E+00 kg 2000 Ecoinvent data V2.2 (2010) Europe
paper, woodfree, coated, at integrated mill Materials Packaging 1.13E+00 kg 2000 Ecoinvent data V2.2 (2010) Europe paper, woodfree, coated, at non-integrated mill Materials Packaging 1.17E+00 kg 2000 Ecoinvent data V2.2 (2010) Europe paper, woodfree, coated, at regional storage, CH Materials Packaging 1.19E+00 kg 2000 Ecoinvent data V2.2 (2010) Switzerland
paper, woodfree, coated, at regional storage, Europe
Materials Packaging 1.27E+00 kg 2000 Ecoinvent data V2.2 (2010) Europe
paper, woodfree, uncoated, at integrated mill Materials Packaging 8.52E-01 kg 2000 Ecoinvent data V2.2 (2010) Europe paper, woodfree, uncoated, at non-integrated mill Materials Packaging 1.47E+00 kg 2000 Ecoinvent data V2.2 (2010) Europe
paper, woodfree, uncoated, at regional storage, CH
Materials Packaging 1.21E+00 kg 2000 Ecoinvent data V2.2 (2010) Switzerland
paper, woodfree, uncoated, at regional storage, Europe
Materials Packaging 1.33E+00 kg 2000 Ecoinvent data V2.2 (2010) Europe
polystyrene, expandable, at plant Materials Packaging 3.38E+00 kg 2003 Ecoinvent data V2.2 (2010) Europe polystyrene, general purpose, GPPS, at plant Materials Packaging 3.51E+00 kg 2002 Ecoinvent data V2.2 (2010) Europe polystyrene, high impact, HIPS, at plant Materials Packaging 3.50E+00 kg 2002 Ecoinvent data V2.2 (2010) Europe polyurethane, flexible foam, at plant Materials Packaging 4.85E+00 kg 1997 Ecoinvent data V2.2 (2010) Europe polyurethane, rigid foam, at plant Materials Packaging 4.32E+00 kg 1997 Ecoinvent data V2.2 (2010) Europe production of carton board boxes, gravure printing, at plant
Materials Packaging 3.05E-01 kg 1993 Ecoinvent data V2.2 (2010) Switzerland

Name: Database section:
Database sub-section:
kg CO2 eq/unit
Units: Year: Source: Location:
224
production of carton board boxes, offset printing, at plant
Materials Packaging 3.63E-01 kg 1993 Ecoinvent data V2.2 (2010) Switzerland
production of liquid packaging board containers, at plant
Materials Packaging 1.46E+00 kg 2000 Ecoinvent data V2.2 (2010) Europe
raw cork, at forest road Materials Packaging 1.96E-02 kg 2003 Ecoinvent data V2.2 (2010) Europe solid bleached board, SBB, at plant Materials Packaging 1.08E+00 kg 2000 Ecoinvent data V2.2 (2010) Europe solid unbleached board, SUB, at plant Materials Packaging 9.08E-01 kg 2000 Ecoinvent data V2.2 (2010) Europe whitelined chipboard, WLC, at plant Materials Packaging 1.08E+00 kg 2000 Ecoinvent data V2.2 (2010) Europe acrylic binder, 34% in H2O, at plant Materials Paint 1.46E+00 kg 1995 Ecoinvent data V2.2 (2010) Europe acrylic dispersion, 65% in H2O, at plant Materials Paint 2.15E+00 kg 1996 Ecoinvent data V2.2 (2010) Europe acrylic varnish, 87.5% in H2O, at plant Materials Paint 1.88E+00 kg 1995 Ecoinvent data V2.2 (2010) Europe adhesive for metals, at plant Materials Paint 4.52E+00 kg 2003 Ecoinvent data V2.2 (2010) Germany alkyd paint, white, 60% in H2O, at plant Materials Paint 2.74E+00 kg 2001 Ecoinvent data V2.2 (2010) Europe alkyd paint, white, 60% in solvent, at plant Materials Paint 2.87E+00 kg 2001 Ecoinvent data V2.2 (2010) Europe alkyd resin, long oil, 70% in white spirit, at plant Materials Paint 3.57E+00 kg 2001 Ecoinvent data V2.2 (2010) Europe
melamine formaldehyde resin, at plant Materials Paint 4.61E+00 kg 1995 Ecoinvent data V2.2 (2010) Europe phenolic resin, at plant Materials Paint 4.16E+00 kg 2000 Ecoinvent data V2.2 (2010) Europe polyester resin, unsaturated, at plant Materials Paint 7.47E+00 kg 2002 Ecoinvent data V2.2 (2010) Europe printing colour, offset, 47.5% solvent, at plant Materials Paint 1.81E+00 kg 2000 Ecoinvent data V2.2 (2010) Europe printing colour, rotogravure, 55% toluene, at plant Materials Paint 2.70E+00 kg 2000 Ecoinvent data V2.2 (2010) Europe
resin size, at plant Materials Paint 1.56E+00 kg 2000 Ecoinvent data V2.2 (2010) Europe urea formaldehyde resin, at plant Materials Paint 2.85E+00 kg 2000 Ecoinvent data V2.2 (2010) Europe white spirit, at plant Materials Paint 9.32E-01 kg 2000 Ecoinvent data V2.2 (2010) Europe wood preservative, creosote, at plant Materials Paint 1.57E+00 kg 2002 Ecoinvent data V2.2 (2010) Europe wood preservative, inorganic salt, containing Cr, at plant
Materials Paint 2.55E+00 kg 2002 Ecoinvent data V2.2 (2010) Europe
wood preservative, organic salt, Cr-free, at plant Materials Paint 3.13E+00 kg 2002 Ecoinvent data V2.2 (2010) Europe chemi-thermomechanical pulp, at plant, Europe Materials Paper 8.93E-01 kg 2000 Ecoinvent data V2.2 (2010) Europe core board, at plant, Europe Materials Paper 4.92E-01 kg 2000 Ecoinvent data V2.2 (2010) Europe corrugated board base paper, kraftliner, at plant Materials Paper 6.60E-01 kg 2005 Ecoinvent data V2.2 (2010) Europe corrugated board base paper, semichemical fluting, at plant
Materials Paper 1.04E+00 kg 2005 Ecoinvent data V2.2 (2010) Europe
corrugated board base paper, testliner, at plant Materials Paper 8.21E-01 kg 2005 Ecoinvent data V2.2 (2010) Europe

Name: Database section:
Database sub-section:
kg CO2 eq/unit
Units: Year: Source: Location:
225
corrugated board base paper, wellenstoff, at plant
Materials Paper 8.18E-01 kg 2005 Ecoinvent data V2.2 (2010) Europe
corrugated board, fresh fibre, single wall, at plant, CH
Materials Paper 1.03E+00 kg 2000 Ecoinvent data V2.2 (2010) Switzerland
corrugated board, fresh fibre, single wall, at plant, Europe
Materials Paper 9.90E-01 kg 2005 Ecoinvent data V2.2 (2010) Europe
corrugated board, mixed fibre, single wall, at plant, CH
Materials Paper 9.51E-01 kg 2000 Ecoinvent data V2.2 (2010) Switzerland
corrugated board, mixed fibre, single wall, at plant, Europe
Materials Paper 9.40E-01 kg 2005 Ecoinvent data V2.2 (2010) Europe
corrugated board, recycling fibre, double wall, at plant, CH
Materials Paper 9.67E-01 kg 2000 Ecoinvent data V2.2 (2010) Switzerland
corrugated board, recycling fibre, double wall, at plant, Europe
Materials Paper 9.60E-01 kg 2005 Ecoinvent data V2.2 (2010) Europe
corrugated board, recycling fibre, single wall, at plant, CH
Materials Paper 9.90E-01 kg 2000 Ecoinvent data V2.2 (2010) Switzerland
corrugated board, recycling fibre, single wall, at plant, Europe
Materials Paper 9.88E-01 kg 2005 Ecoinvent data V2.2 (2010) Europe
folding boxboard, FBB, at plant, Europe Materials Paper 1.31E+00 kg 2000 Ecoinvent data V2.2 (2010) Europe kraft paper, bleached, at plant, Europe Materials Paper 1.69E+00 kg 1993 Ecoinvent data V2.2 (2010) Europe kraft paper, unbleached, at plant, Europe Materials Paper 8.49E-01 kg 2000 Ecoinvent data V2.2 (2010) Europe liquid packaging board, at plant, Europe Materials Paper 5.96E-01 kg 2000 Ecoinvent data V2.2 (2010) Europe packaging, corrugated board, mixed fibre, single wall, at plant, CH
Materials Paper 1.24E+00 kg 2000 Ecoinvent data V2.2 (2010) Switzerland
packaging, corrugated board, mixed fibre, single wall, at plant, Europe
Materials Paper 1.14E+00 kg 2005 Ecoinvent data V2.2 (2010) Europe
paper, newsprint, 0% DIP, at plant, Europe Materials Paper 1.30E+00 kg 2000 Ecoinvent data V2.2 (2010) Europe paper, newsprint, at plant, CH Materials Paper 8.48E-01 kg 2000 Ecoinvent data V2.2 (2010) Switzerland paper, newsprint, at regional storage, CH Materials Paper 9.66E-01 kg 2000 Ecoinvent data V2.2 (2010) Switzerland paper, newsprint, at regional storage, Europe Materials Paper 1.29E+00 kg 2000 Ecoinvent data V2.2 (2010) Europe paper, newsprint, DIP containing, at plant, Europe
Materials Paper 1.07E+00 kg 2000 Ecoinvent data V2.2 (2010) Europe
paper, recycling, no deinking, at plant, Europe Materials Paper 8.29E-01 kg 1993 Ecoinvent data V2.2 (2010) Europe paper, recycling, with deinking, at plant, Europe Materials Paper 1.56E+00 kg 2000 Ecoinvent data V2.2 (2010) Europe
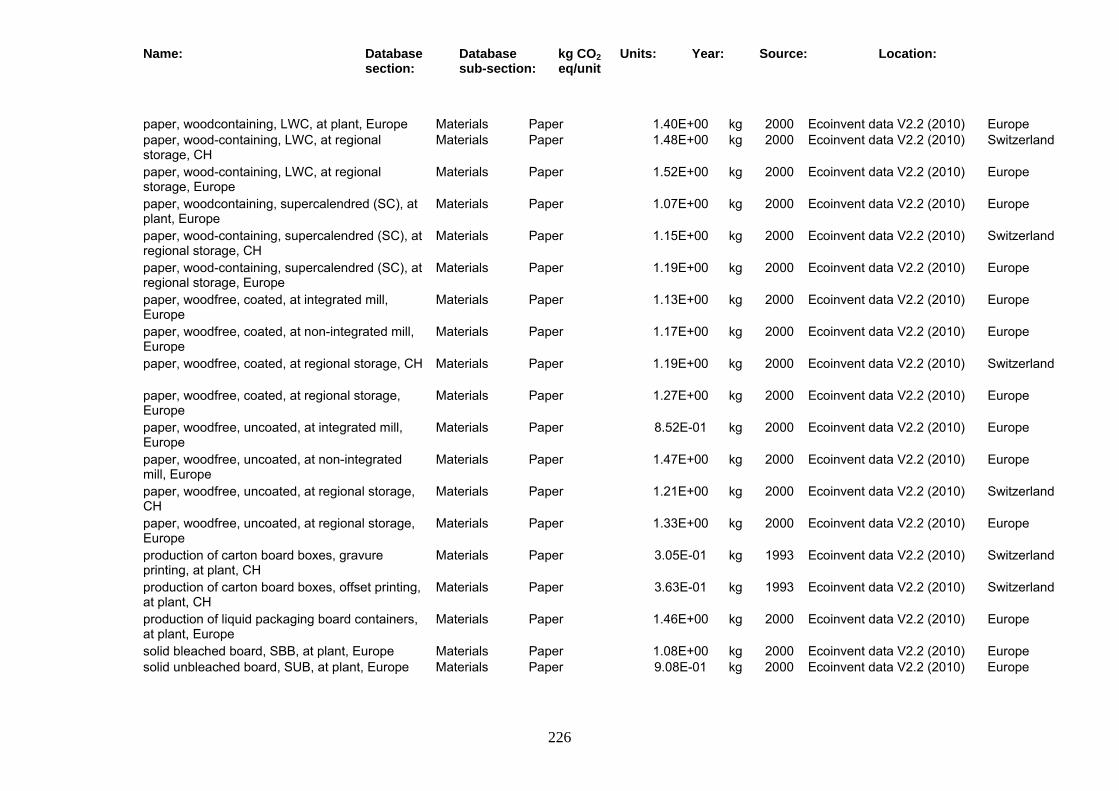
Name: Database section:
Database sub-section:
kg CO2 eq/unit
Units: Year: Source: Location:
226
paper, woodcontaining, LWC, at plant, Europe Materials Paper 1.40E+00 kg 2000 Ecoinvent data V2.2 (2010) Europe paper, wood-containing, LWC, at regional storage, CH
Materials Paper 1.48E+00 kg 2000 Ecoinvent data V2.2 (2010) Switzerland
paper, wood-containing, LWC, at regional storage, Europe
Materials Paper 1.52E+00 kg 2000 Ecoinvent data V2.2 (2010) Europe
paper, woodcontaining, supercalendred (SC), at plant, Europe
Materials Paper 1.07E+00 kg 2000 Ecoinvent data V2.2 (2010) Europe
paper, wood-containing, supercalendred (SC), at regional storage, CH
Materials Paper 1.15E+00 kg 2000 Ecoinvent data V2.2 (2010) Switzerland
paper, wood-containing, supercalendred (SC), at regional storage, Europe
Materials Paper 1.19E+00 kg 2000 Ecoinvent data V2.2 (2010) Europe
paper, woodfree, coated, at integrated mill, Europe
Materials Paper 1.13E+00 kg 2000 Ecoinvent data V2.2 (2010) Europe
paper, woodfree, coated, at non-integrated mill, Europe
Materials Paper 1.17E+00 kg 2000 Ecoinvent data V2.2 (2010) Europe
paper, woodfree, coated, at regional storage, CH Materials Paper 1.19E+00 kg 2000 Ecoinvent data V2.2 (2010) Switzerland
paper, woodfree, coated, at regional storage, Europe
Materials Paper 1.27E+00 kg 2000 Ecoinvent data V2.2 (2010) Europe
paper, woodfree, uncoated, at integrated mill, Europe
Materials Paper 8.52E-01 kg 2000 Ecoinvent data V2.2 (2010) Europe
paper, woodfree, uncoated, at non-integrated mill, Europe
Materials Paper 1.47E+00 kg 2000 Ecoinvent data V2.2 (2010) Europe
paper, woodfree, uncoated, at regional storage, CH
Materials Paper 1.21E+00 kg 2000 Ecoinvent data V2.2 (2010) Switzerland
paper, woodfree, uncoated, at regional storage, Europe
Materials Paper 1.33E+00 kg 2000 Ecoinvent data V2.2 (2010) Europe
production of carton board boxes, gravure printing, at plant, CH
Materials Paper 3.05E-01 kg 1993 Ecoinvent data V2.2 (2010) Switzerland
production of carton board boxes, offset printing, at plant, CH
Materials Paper 3.63E-01 kg 1993 Ecoinvent data V2.2 (2010) Switzerland
production of liquid packaging board containers, at plant, Europe
Materials Paper 1.46E+00 kg 2000 Ecoinvent data V2.2 (2010) Europe
solid bleached board, SBB, at plant, Europe Materials Paper 1.08E+00 kg 2000 Ecoinvent data V2.2 (2010) Europe solid unbleached board, SUB, at plant, Europe Materials Paper 9.08E-01 kg 2000 Ecoinvent data V2.2 (2010) Europe
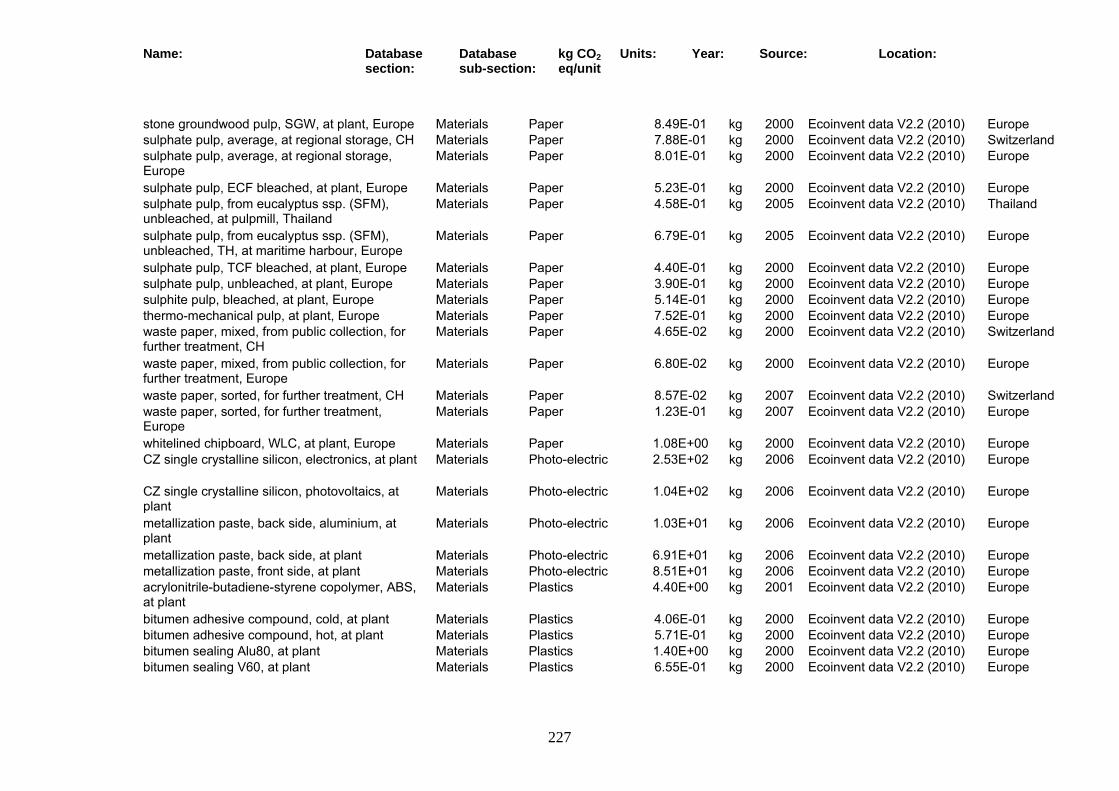
Name: Database section:
Database sub-section:
kg CO2 eq/unit
Units: Year: Source: Location:
227
stone groundwood pulp, SGW, at plant, Europe Materials Paper 8.49E-01 kg 2000 Ecoinvent data V2.2 (2010) Europe sulphate pulp, average, at regional storage, CH Materials Paper 7.88E-01 kg 2000 Ecoinvent data V2.2 (2010) Switzerland sulphate pulp, average, at regional storage, Europe
Materials Paper 8.01E-01 kg 2000 Ecoinvent data V2.2 (2010) Europe
sulphate pulp, ECF bleached, at plant, Europe Materials Paper 5.23E-01 kg 2000 Ecoinvent data V2.2 (2010) Europe sulphate pulp, from eucalyptus ssp. (SFM), unbleached, at pulpmill, Thailand
Materials Paper 4.58E-01 kg 2005 Ecoinvent data V2.2 (2010) Thailand
sulphate pulp, from eucalyptus ssp. (SFM), unbleached, TH, at maritime harbour, Europe
Materials Paper 6.79E-01 kg 2005 Ecoinvent data V2.2 (2010) Europe
sulphate pulp, TCF bleached, at plant, Europe Materials Paper 4.40E-01 kg 2000 Ecoinvent data V2.2 (2010) Europe sulphate pulp, unbleached, at plant, Europe Materials Paper 3.90E-01 kg 2000 Ecoinvent data V2.2 (2010) Europe sulphite pulp, bleached, at plant, Europe Materials Paper 5.14E-01 kg 2000 Ecoinvent data V2.2 (2010) Europe thermo-mechanical pulp, at plant, Europe Materials Paper 7.52E-01 kg 2000 Ecoinvent data V2.2 (2010) Europe waste paper, mixed, from public collection, for further treatment, CH
Materials Paper 4.65E-02 kg 2000 Ecoinvent data V2.2 (2010) Switzerland
waste paper, mixed, from public collection, for further treatment, Europe
Materials Paper 6.80E-02 kg 2000 Ecoinvent data V2.2 (2010) Europe
waste paper, sorted, for further treatment, CH Materials Paper 8.57E-02 kg 2007 Ecoinvent data V2.2 (2010) Switzerland waste paper, sorted, for further treatment, Europe
Materials Paper 1.23E-01 kg 2007 Ecoinvent data V2.2 (2010) Europe
whitelined chipboard, WLC, at plant, Europe Materials Paper 1.08E+00 kg 2000 Ecoinvent data V2.2 (2010) Europe CZ single crystalline silicon, electronics, at plant Materials Photo-electric 2.53E+02 kg 2006 Ecoinvent data V2.2 (2010) Europe
CZ single crystalline silicon, photovoltaics, at plant
Materials Photo-electric 1.04E+02 kg 2006 Ecoinvent data V2.2 (2010) Europe
metallization paste, back side, aluminium, at plant
Materials Photo-electric 1.03E+01 kg 2006 Ecoinvent data V2.2 (2010) Europe
metallization paste, back side, at plant Materials Photo-electric 6.91E+01 kg 2006 Ecoinvent data V2.2 (2010) Europe metallization paste, front side, at plant Materials Photo-electric 8.51E+01 kg 2006 Ecoinvent data V2.2 (2010) Europe acrylonitrile-butadiene-styrene copolymer, ABS, at plant
Materials Plastics 4.40E+00 kg 2001 Ecoinvent data V2.2 (2010) Europe
bitumen adhesive compound, cold, at plant Materials Plastics 4.06E-01 kg 2000 Ecoinvent data V2.2 (2010) Europe bitumen adhesive compound, hot, at plant Materials Plastics 5.71E-01 kg 2000 Ecoinvent data V2.2 (2010) Europe bitumen sealing Alu80, at plant Materials Plastics 1.40E+00 kg 2000 Ecoinvent data V2.2 (2010) Europe bitumen sealing V60, at plant Materials Plastics 6.55E-01 kg 2000 Ecoinvent data V2.2 (2010) Europe

Name: Database section:
Database sub-section:
kg CO2 eq/unit
Units: Year: Source: Location:
228
bitumen sealing VA4, at plant Materials Plastics 1.17E+00 kg 2000 Ecoinvent data V2.2 (2010) Europe bitumen sealing, at plant Materials Plastics 1.11E+00 kg 1993 Ecoinvent data V2.2 (2010) Europe bitumen sealing, polymer EP4 flame retardant, at plant
Materials Plastics 8.26E-01 kg 1993 Ecoinvent data V2.2 (2010) Europe
blow moulding Materials Plastics 1.09E+00 kg 1997 Ecoinvent data V2.2 (2010) Europe butadiene, at plant Materials Plastics 1.17E+00 kg 2001 Ecoinvent data V2.2 (2010) Europe butene, mixed, at plant Materials Plastics 1.53E+00 kg 2001 Ecoinvent data V2.2 (2010) Europe calendering, rigid sheets Materials Plastics 3.78E-01 kg 1997 Ecoinvent data V2.2 (2010) Europe epoxy resin insulator (Al2O3), at plant Materials Plastics 3.46E+00 kg 2000 Ecoinvent data V2.2 (2010) Europe epoxy resin insulator (SiO2), at plant Materials Plastics 2.73E+00 kg 2000 Ecoinvent data V2.2 (2010) Europe epoxy resin, liquid, at plant Materials Plastics 6.73E+00 kg 1995 Ecoinvent data V2.2 (2010) Europe epoxy resin, liquid, disaggregated data, at plant Materials Plastics 1.53E+01 kg 1995 Ecoinvent data V2.2 (2010) Europe
ethylene vinyl acetate copolymer, at plant Materials Plastics 2.11E+00 kg 2000 Ecoinvent data V2.2 (2010) Europe ethylene, average, at plant Materials Plastics 1.40E+00 kg 2001 Ecoinvent data V2.2 (2010) Europe ethylene, pipeline system, at plant Materials Plastics 1.47E+00 kg 2001 Ecoinvent data V2.2 (2010) Europe ethylvinylacetate, foil, at plant Materials Plastics 2.71E+00 kg 1997 Ecoinvent data V2.2 (2010) Europe extrusion, plastic film Materials Plastics 5.24E-01 kg 1997 Ecoinvent data V2.2 (2010) Europe extrusion, plastic pipes Materials Plastics 3.78E-01 kg 1997 Ecoinvent data V2.2 (2010) Europe fleece production, polyethylene terephthalate Materials Plastics 5.61E+00 kg 1997 Ecoinvent data V2.2 (2010) Europe fleece, polyethylene, at plant Materials Plastics 2.88E+00 kg 1995 Ecoinvent data V2.2 (2010) Europe foaming, expanding Materials Plastics 6.94E-01 kg 1995 Ecoinvent data V2.2 (2010) Europe glass fibre reinforced plastic, polyamide, injection moulding, at plant
Materials Plastics 8.81E+00 kg 1993 Ecoinvent data V2.2 (2010) Europe
glass fibre reinforced plastic, polyester resin, hand lay-up, at plant
Materials Plastics 4.88E+00 kg 1993 Ecoinvent data V2.2 (2010) Europe
injection moulding Materials Plastics 1.33E+00 kg 1997 Ecoinvent data V2.2 (2010) Europe methyl methacrylate, at plant Materials Plastics 6.70E+00 kg 2001 Ecoinvent data V2.2 (2010) Europe methylene diphenyl diisocyanate, at plant Materials Plastics 4.03E+00 kg 2001 Ecoinvent data V2.2 (2010) Europe modified starch, at plant Materials Plastics 2.02E+00 kg 2007 Ecoinvent data V2.2 (2010) Europe natural rubber based sealing, at plant Materials Plastics 1.95E+00 kg 2003 Ecoinvent data V2.2 (2010) Germany nylon 6, at plant Materials Plastics 9.28E+00 kg 2001 Ecoinvent data V2.2 (2010) Europe nylon 6, glass-filled, at plant Materials Plastics 7.33E+00 kg 2001 Ecoinvent data V2.2 (2010) Europe nylon 66, at plant Materials Plastics 8.02E+00 kg 2001 Ecoinvent data V2.2 (2010) Europe nylon 66, glass-filled, at plant Materials Plastics 7.05E+00 kg 2001 Ecoinvent data V2.2 (2010) Europe
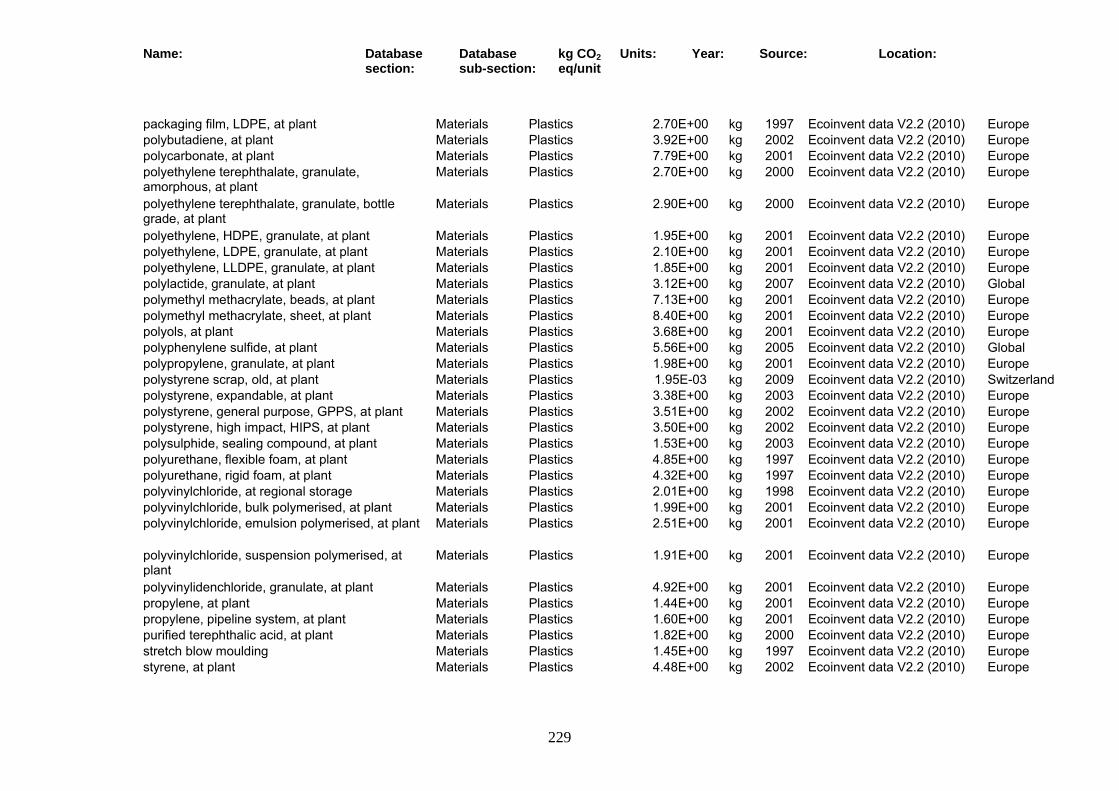
Name: Database section:
Database sub-section:
kg CO2 eq/unit
Units: Year: Source: Location:
229
packaging film, LDPE, at plant Materials Plastics 2.70E+00 kg 1997 Ecoinvent data V2.2 (2010) Europe polybutadiene, at plant Materials Plastics 3.92E+00 kg 2002 Ecoinvent data V2.2 (2010) Europe polycarbonate, at plant Materials Plastics 7.79E+00 kg 2001 Ecoinvent data V2.2 (2010) Europe polyethylene terephthalate, granulate, amorphous, at plant
Materials Plastics 2.70E+00 kg 2000 Ecoinvent data V2.2 (2010) Europe
polyethylene terephthalate, granulate, bottle grade, at plant
Materials Plastics 2.90E+00 kg 2000 Ecoinvent data V2.2 (2010) Europe
polyethylene, HDPE, granulate, at plant Materials Plastics 1.95E+00 kg 2001 Ecoinvent data V2.2 (2010) Europe polyethylene, LDPE, granulate, at plant Materials Plastics 2.10E+00 kg 2001 Ecoinvent data V2.2 (2010) Europe polyethylene, LLDPE, granulate, at plant Materials Plastics 1.85E+00 kg 2001 Ecoinvent data V2.2 (2010) Europe polylactide, granulate, at plant Materials Plastics 3.12E+00 kg 2007 Ecoinvent data V2.2 (2010) Global polymethyl methacrylate, beads, at plant Materials Plastics 7.13E+00 kg 2001 Ecoinvent data V2.2 (2010) Europe polymethyl methacrylate, sheet, at plant Materials Plastics 8.40E+00 kg 2001 Ecoinvent data V2.2 (2010) Europe polyols, at plant Materials Plastics 3.68E+00 kg 2001 Ecoinvent data V2.2 (2010) Europe polyphenylene sulfide, at plant Materials Plastics 5.56E+00 kg 2005 Ecoinvent data V2.2 (2010) Global polypropylene, granulate, at plant Materials Plastics 1.98E+00 kg 2001 Ecoinvent data V2.2 (2010) Europe polystyrene scrap, old, at plant Materials Plastics 1.95E-03 kg 2009 Ecoinvent data V2.2 (2010) Switzerland polystyrene, expandable, at plant Materials Plastics 3.38E+00 kg 2003 Ecoinvent data V2.2 (2010) Europe polystyrene, general purpose, GPPS, at plant Materials Plastics 3.51E+00 kg 2002 Ecoinvent data V2.2 (2010) Europe polystyrene, high impact, HIPS, at plant Materials Plastics 3.50E+00 kg 2002 Ecoinvent data V2.2 (2010) Europe polysulphide, sealing compound, at plant Materials Plastics 1.53E+00 kg 2003 Ecoinvent data V2.2 (2010) Europe polyurethane, flexible foam, at plant Materials Plastics 4.85E+00 kg 1997 Ecoinvent data V2.2 (2010) Europe polyurethane, rigid foam, at plant Materials Plastics 4.32E+00 kg 1997 Ecoinvent data V2.2 (2010) Europe polyvinylchloride, at regional storage Materials Plastics 2.01E+00 kg 1998 Ecoinvent data V2.2 (2010) Europe polyvinylchloride, bulk polymerised, at plant Materials Plastics 1.99E+00 kg 2001 Ecoinvent data V2.2 (2010) Europe polyvinylchloride, emulsion polymerised, at plant Materials Plastics 2.51E+00 kg 2001 Ecoinvent data V2.2 (2010) Europe
polyvinylchloride, suspension polymerised, at plant
Materials Plastics 1.91E+00 kg 2001 Ecoinvent data V2.2 (2010) Europe
polyvinylidenchloride, granulate, at plant Materials Plastics 4.92E+00 kg 2001 Ecoinvent data V2.2 (2010) Europe propylene, at plant Materials Plastics 1.44E+00 kg 2001 Ecoinvent data V2.2 (2010) Europe propylene, pipeline system, at plant Materials Plastics 1.60E+00 kg 2001 Ecoinvent data V2.2 (2010) Europe purified terephthalic acid, at plant Materials Plastics 1.82E+00 kg 2000 Ecoinvent data V2.2 (2010) Europe stretch blow moulding Materials Plastics 1.45E+00 kg 1997 Ecoinvent data V2.2 (2010) Europe styrene, at plant Materials Plastics 4.48E+00 kg 2002 Ecoinvent data V2.2 (2010) Europe
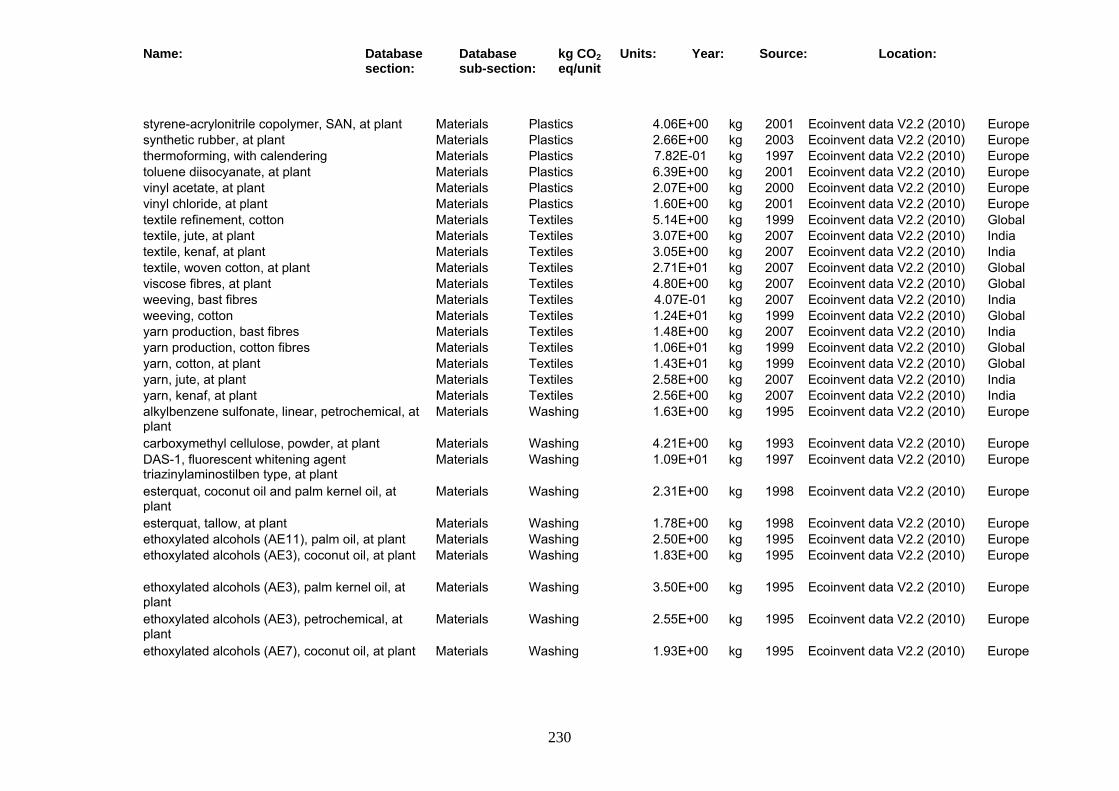
Name: Database section:
Database sub-section:
kg CO2 eq/unit
Units: Year: Source: Location:
230
styrene-acrylonitrile copolymer, SAN, at plant Materials Plastics 4.06E+00 kg 2001 Ecoinvent data V2.2 (2010) Europe synthetic rubber, at plant Materials Plastics 2.66E+00 kg 2003 Ecoinvent data V2.2 (2010) Europe thermoforming, with calendering Materials Plastics 7.82E-01 kg 1997 Ecoinvent data V2.2 (2010) Europe toluene diisocyanate, at plant Materials Plastics 6.39E+00 kg 2001 Ecoinvent data V2.2 (2010) Europe vinyl acetate, at plant Materials Plastics 2.07E+00 kg 2000 Ecoinvent data V2.2 (2010) Europe vinyl chloride, at plant Materials Plastics 1.60E+00 kg 2001 Ecoinvent data V2.2 (2010) Europe textile refinement, cotton Materials Textiles 5.14E+00 kg 1999 Ecoinvent data V2.2 (2010) Global textile, jute, at plant Materials Textiles 3.07E+00 kg 2007 Ecoinvent data V2.2 (2010) India textile, kenaf, at plant Materials Textiles 3.05E+00 kg 2007 Ecoinvent data V2.2 (2010) India textile, woven cotton, at plant Materials Textiles 2.71E+01 kg 2007 Ecoinvent data V2.2 (2010) Global viscose fibres, at plant Materials Textiles 4.80E+00 kg 2007 Ecoinvent data V2.2 (2010) Global weeving, bast fibres Materials Textiles 4.07E-01 kg 2007 Ecoinvent data V2.2 (2010) India weeving, cotton Materials Textiles 1.24E+01 kg 1999 Ecoinvent data V2.2 (2010) Global yarn production, bast fibres Materials Textiles 1.48E+00 kg 2007 Ecoinvent data V2.2 (2010) India yarn production, cotton fibres Materials Textiles 1.06E+01 kg 1999 Ecoinvent data V2.2 (2010) Global yarn, cotton, at plant Materials Textiles 1.43E+01 kg 1999 Ecoinvent data V2.2 (2010) Global yarn, jute, at plant Materials Textiles 2.58E+00 kg 2007 Ecoinvent data V2.2 (2010) India yarn, kenaf, at plant Materials Textiles 2.56E+00 kg 2007 Ecoinvent data V2.2 (2010) India alkylbenzene sulfonate, linear, petrochemical, at plant
Materials Washing 1.63E+00 kg 1995 Ecoinvent data V2.2 (2010) Europe
carboxymethyl cellulose, powder, at plant Materials Washing 4.21E+00 kg 1993 Ecoinvent data V2.2 (2010) Europe DAS-1, fluorescent whitening agent triazinylaminostilben type, at plant
Materials Washing 1.09E+01 kg 1997 Ecoinvent data V2.2 (2010) Europe
esterquat, coconut oil and palm kernel oil, at plant
Materials Washing 2.31E+00 kg 1998 Ecoinvent data V2.2 (2010) Europe
esterquat, tallow, at plant Materials Washing 1.78E+00 kg 1998 Ecoinvent data V2.2 (2010) Europe ethoxylated alcohols (AE11), palm oil, at plant Materials Washing 2.50E+00 kg 1995 Ecoinvent data V2.2 (2010) Europe ethoxylated alcohols (AE3), coconut oil, at plant Materials Washing 1.83E+00 kg 1995 Ecoinvent data V2.2 (2010) Europe
ethoxylated alcohols (AE3), palm kernel oil, at plant
Materials Washing 3.50E+00 kg 1995 Ecoinvent data V2.2 (2010) Europe
ethoxylated alcohols (AE3), petrochemical, at plant
Materials Washing 2.55E+00 kg 1995 Ecoinvent data V2.2 (2010) Europe
ethoxylated alcohols (AE7), coconut oil, at plant Materials Washing 1.93E+00 kg 1995 Ecoinvent data V2.2 (2010) Europe
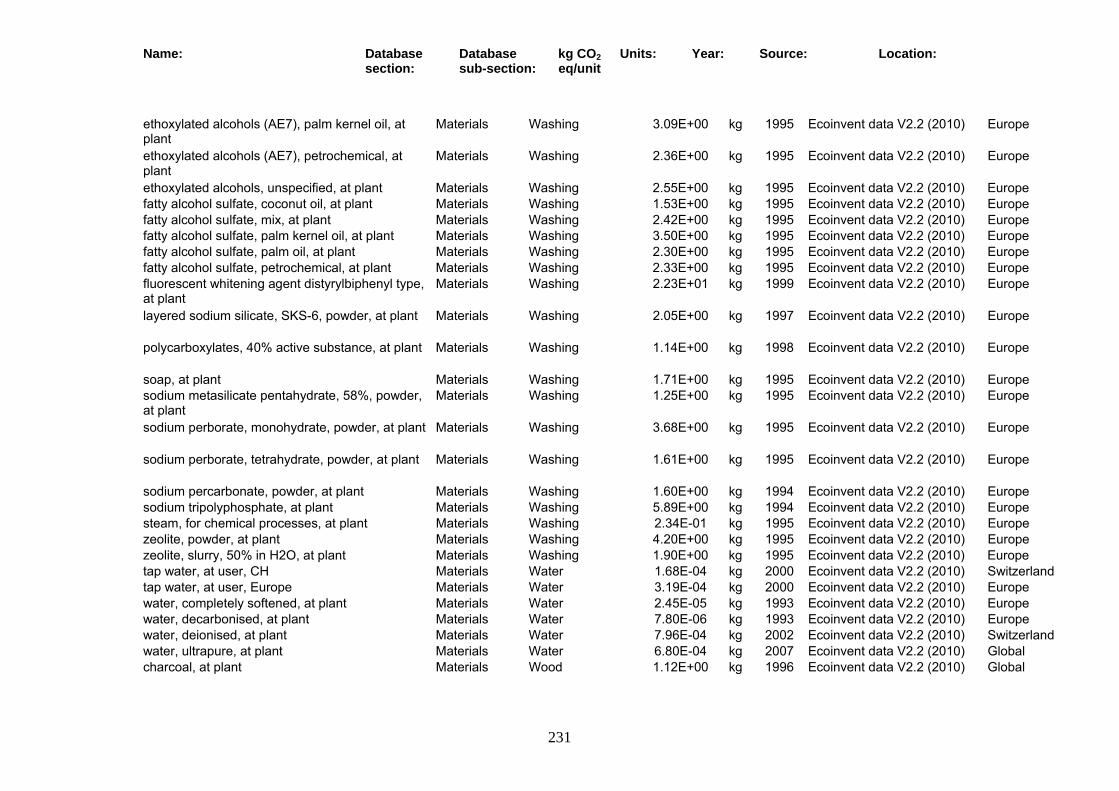
Name: Database section:
Database sub-section:
kg CO2 eq/unit
Units: Year: Source: Location:
231
ethoxylated alcohols (AE7), palm kernel oil, at plant
Materials Washing 3.09E+00 kg 1995 Ecoinvent data V2.2 (2010) Europe
ethoxylated alcohols (AE7), petrochemical, at plant
Materials Washing 2.36E+00 kg 1995 Ecoinvent data V2.2 (2010) Europe
ethoxylated alcohols, unspecified, at plant Materials Washing 2.55E+00 kg 1995 Ecoinvent data V2.2 (2010) Europe fatty alcohol sulfate, coconut oil, at plant Materials Washing 1.53E+00 kg 1995 Ecoinvent data V2.2 (2010) Europe fatty alcohol sulfate, mix, at plant Materials Washing 2.42E+00 kg 1995 Ecoinvent data V2.2 (2010) Europe fatty alcohol sulfate, palm kernel oil, at plant Materials Washing 3.50E+00 kg 1995 Ecoinvent data V2.2 (2010) Europe fatty alcohol sulfate, palm oil, at plant Materials Washing 2.30E+00 kg 1995 Ecoinvent data V2.2 (2010) Europe fatty alcohol sulfate, petrochemical, at plant Materials Washing 2.33E+00 kg 1995 Ecoinvent data V2.2 (2010) Europe fluorescent whitening agent distyrylbiphenyl type, at plant
Materials Washing 2.23E+01 kg 1999 Ecoinvent data V2.2 (2010) Europe
layered sodium silicate, SKS-6, powder, at plant Materials Washing 2.05E+00 kg 1997 Ecoinvent data V2.2 (2010) Europe
polycarboxylates, 40% active substance, at plant Materials Washing 1.14E+00 kg 1998 Ecoinvent data V2.2 (2010) Europe
soap, at plant Materials Washing 1.71E+00 kg 1995 Ecoinvent data V2.2 (2010) Europe sodium metasilicate pentahydrate, 58%, powder, at plant
Materials Washing 1.25E+00 kg 1995 Ecoinvent data V2.2 (2010) Europe
sodium perborate, monohydrate, powder, at plant Materials Washing 3.68E+00 kg 1995 Ecoinvent data V2.2 (2010) Europe
sodium perborate, tetrahydrate, powder, at plant Materials Washing 1.61E+00 kg 1995 Ecoinvent data V2.2 (2010) Europe
sodium percarbonate, powder, at plant Materials Washing 1.60E+00 kg 1994 Ecoinvent data V2.2 (2010) Europe sodium tripolyphosphate, at plant Materials Washing 5.89E+00 kg 1994 Ecoinvent data V2.2 (2010) Europe steam, for chemical processes, at plant Materials Washing 2.34E-01 kg 1995 Ecoinvent data V2.2 (2010) Europe zeolite, powder, at plant Materials Washing 4.20E+00 kg 1995 Ecoinvent data V2.2 (2010) Europe zeolite, slurry, 50% in H2O, at plant Materials Washing 1.90E+00 kg 1995 Ecoinvent data V2.2 (2010) Europe tap water, at user, CH Materials Water 1.68E-04 kg 2000 Ecoinvent data V2.2 (2010) Switzerland tap water, at user, Europe Materials Water 3.19E-04 kg 2000 Ecoinvent data V2.2 (2010) Europe water, completely softened, at plant Materials Water 2.45E-05 kg 1993 Ecoinvent data V2.2 (2010) Europe water, decarbonised, at plant Materials Water 7.80E-06 kg 1993 Ecoinvent data V2.2 (2010) Europe water, deionised, at plant Materials Water 7.96E-04 kg 2002 Ecoinvent data V2.2 (2010) Switzerland water, ultrapure, at plant Materials Water 6.80E-04 kg 2007 Ecoinvent data V2.2 (2010) Global charcoal, at plant Materials Wood 1.12E+00 kg 1996 Ecoinvent data V2.2 (2010) Global
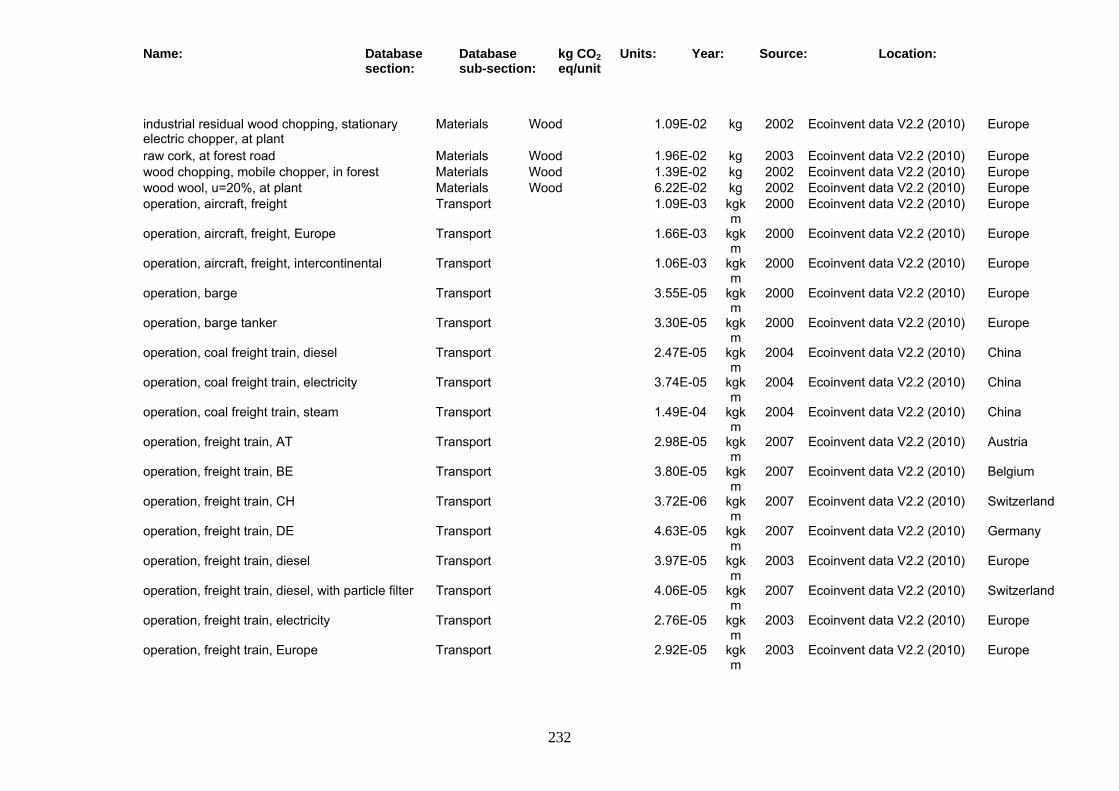
Name: Database section:
Database sub-section:
kg CO2 eq/unit
Units: Year: Source: Location:
232
industrial residual wood chopping, stationary electric chopper, at plant
Materials Wood 1.09E-02 kg 2002 Ecoinvent data V2.2 (2010) Europe
raw cork, at forest road Materials Wood 1.96E-02 kg 2003 Ecoinvent data V2.2 (2010) Europe wood chopping, mobile chopper, in forest Materials Wood 1.39E-02 kg 2002 Ecoinvent data V2.2 (2010) Europe wood wool, u=20%, at plant Materials Wood 6.22E-02 kg 2002 Ecoinvent data V2.2 (2010) Europe operation, aircraft, freight Transport 1.09E-03 kgk
m 2000 Ecoinvent data V2.2 (2010) Europe
operation, aircraft, freight, Europe Transport 1.66E-03 kgkm
2000 Ecoinvent data V2.2 (2010) Europe
operation, aircraft, freight, intercontinental Transport 1.06E-03 kgkm
2000 Ecoinvent data V2.2 (2010) Europe
operation, barge Transport 3.55E-05 kgkm
2000 Ecoinvent data V2.2 (2010) Europe
operation, barge tanker Transport 3.30E-05 kgkm
2000 Ecoinvent data V2.2 (2010) Europe
operation, coal freight train, diesel Transport 2.47E-05 kgkm
2004 Ecoinvent data V2.2 (2010) China
operation, coal freight train, electricity Transport 3.74E-05 kgkm
2004 Ecoinvent data V2.2 (2010) China
operation, coal freight train, steam Transport 1.49E-04 kgkm
2004 Ecoinvent data V2.2 (2010) China
operation, freight train, AT Transport 2.98E-05 kgkm
2007 Ecoinvent data V2.2 (2010) Austria
operation, freight train, BE Transport 3.80E-05 kgkm
2007 Ecoinvent data V2.2 (2010) Belgium
operation, freight train, CH Transport 3.72E-06 kgkm
2007 Ecoinvent data V2.2 (2010) Switzerland
operation, freight train, DE Transport 4.63E-05 kgkm
2007 Ecoinvent data V2.2 (2010) Germany
operation, freight train, diesel Transport 3.97E-05 kgkm
2003 Ecoinvent data V2.2 (2010) Europe
operation, freight train, diesel, with particle filter Transport 4.06E-05 kgkm
2007 Ecoinvent data V2.2 (2010) Switzerland
operation, freight train, electricity Transport 2.76E-05 kgkm
2003 Ecoinvent data V2.2 (2010) Europe
operation, freight train, Europe Transport 2.92E-05 kgkm
2003 Ecoinvent data V2.2 (2010) Europe
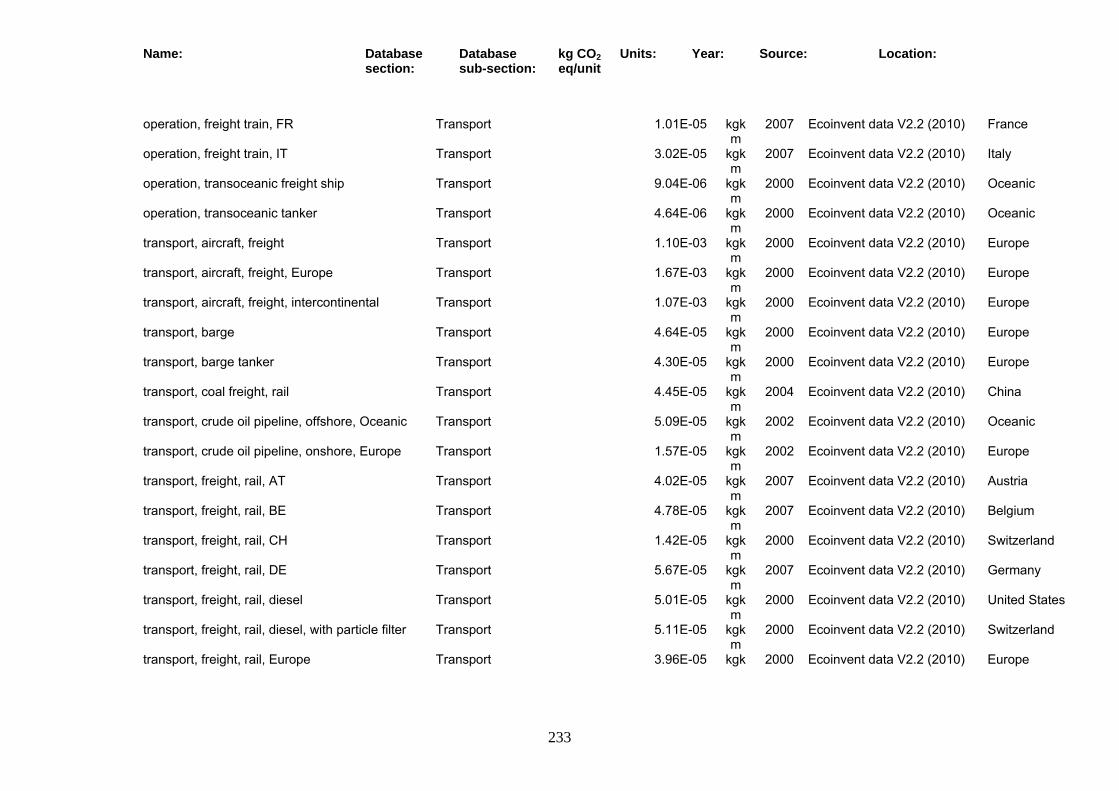
Name: Database section:
Database sub-section:
kg CO2 eq/unit
Units: Year: Source: Location:
233
operation, freight train, FR Transport 1.01E-05 kgkm
2007 Ecoinvent data V2.2 (2010) France
operation, freight train, IT Transport 3.02E-05 kgkm
2007 Ecoinvent data V2.2 (2010) Italy
operation, transoceanic freight ship Transport 9.04E-06 kgkm
2000 Ecoinvent data V2.2 (2010) Oceanic
operation, transoceanic tanker Transport 4.64E-06 kgkm
2000 Ecoinvent data V2.2 (2010) Oceanic
transport, aircraft, freight Transport 1.10E-03 kgkm
2000 Ecoinvent data V2.2 (2010) Europe
transport, aircraft, freight, Europe Transport 1.67E-03 kgkm
2000 Ecoinvent data V2.2 (2010) Europe
transport, aircraft, freight, intercontinental Transport 1.07E-03 kgkm
2000 Ecoinvent data V2.2 (2010) Europe
transport, barge Transport 4.64E-05 kgkm
2000 Ecoinvent data V2.2 (2010) Europe
transport, barge tanker Transport 4.30E-05 kgkm
2000 Ecoinvent data V2.2 (2010) Europe
transport, coal freight, rail Transport 4.45E-05 kgkm
2004 Ecoinvent data V2.2 (2010) China
transport, crude oil pipeline, offshore, Oceanic Transport 5.09E-05 kgkm
2002 Ecoinvent data V2.2 (2010) Oceanic
transport, crude oil pipeline, onshore, Europe Transport 1.57E-05 kgkm
2002 Ecoinvent data V2.2 (2010) Europe
transport, freight, rail, AT Transport 4.02E-05 kgkm
2007 Ecoinvent data V2.2 (2010) Austria
transport, freight, rail, BE Transport 4.78E-05 kgkm
2007 Ecoinvent data V2.2 (2010) Belgium
transport, freight, rail, CH Transport 1.42E-05 kgkm
2000 Ecoinvent data V2.2 (2010) Switzerland
transport, freight, rail, DE Transport 5.67E-05 kgkm
2007 Ecoinvent data V2.2 (2010) Germany
transport, freight, rail, diesel Transport 5.01E-05 kgkm
2000 Ecoinvent data V2.2 (2010) United States
transport, freight, rail, diesel, with particle filter Transport 5.11E-05 kgkm
2000 Ecoinvent data V2.2 (2010) Switzerland
transport, freight, rail, Europe Transport 3.96E-05 kgk 2000 Ecoinvent data V2.2 (2010) Europe
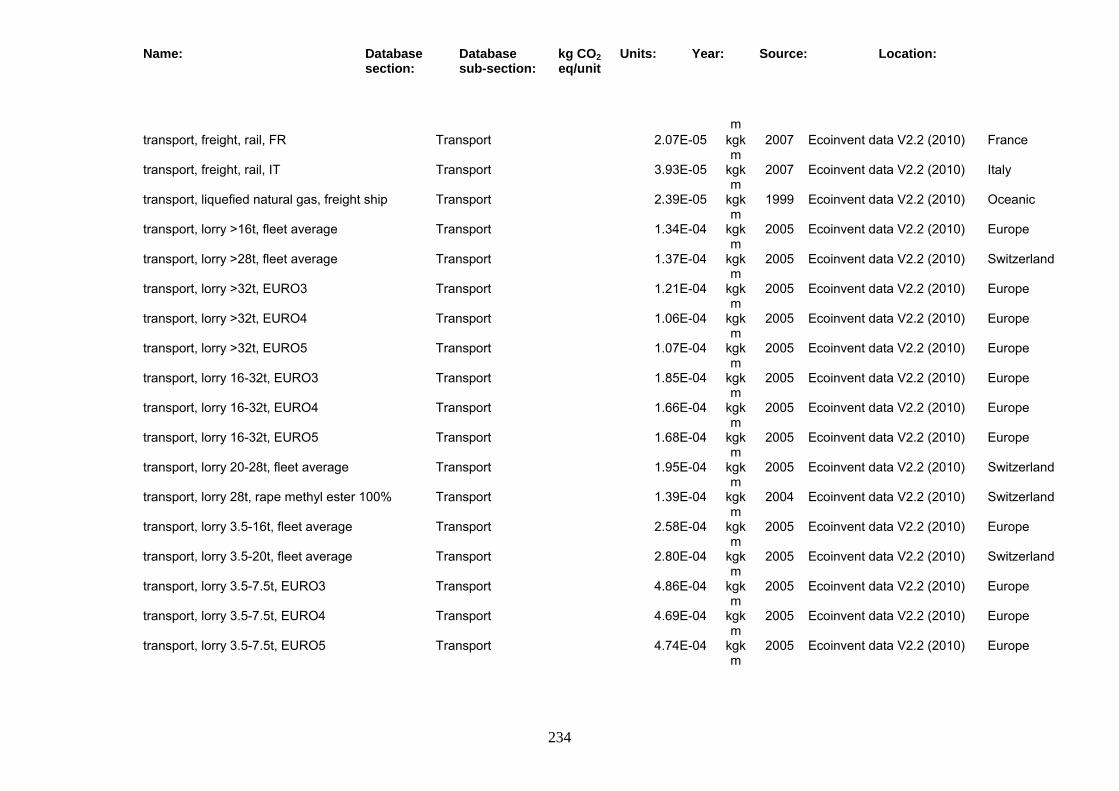
Name: Database section:
Database sub-section:
kg CO2 eq/unit
Units: Year: Source: Location:
234
m transport, freight, rail, FR Transport 2.07E-05 kgk
m 2007 Ecoinvent data V2.2 (2010) France
transport, freight, rail, IT Transport 3.93E-05 kgkm
2007 Ecoinvent data V2.2 (2010) Italy
transport, liquefied natural gas, freight ship Transport 2.39E-05 kgkm
1999 Ecoinvent data V2.2 (2010) Oceanic
transport, lorry >16t, fleet average Transport 1.34E-04 kgkm
2005 Ecoinvent data V2.2 (2010) Europe
transport, lorry >28t, fleet average Transport 1.37E-04 kgkm
2005 Ecoinvent data V2.2 (2010) Switzerland
transport, lorry >32t, EURO3 Transport 1.21E-04 kgkm
2005 Ecoinvent data V2.2 (2010) Europe
transport, lorry >32t, EURO4 Transport 1.06E-04 kgkm
2005 Ecoinvent data V2.2 (2010) Europe
transport, lorry >32t, EURO5 Transport 1.07E-04 kgkm
2005 Ecoinvent data V2.2 (2010) Europe
transport, lorry 16-32t, EURO3 Transport 1.85E-04 kgkm
2005 Ecoinvent data V2.2 (2010) Europe
transport, lorry 16-32t, EURO4 Transport 1.66E-04 kgkm
2005 Ecoinvent data V2.2 (2010) Europe
transport, lorry 16-32t, EURO5 Transport 1.68E-04 kgkm
2005 Ecoinvent data V2.2 (2010) Europe
transport, lorry 20-28t, fleet average Transport 1.95E-04 kgkm
2005 Ecoinvent data V2.2 (2010) Switzerland
transport, lorry 28t, rape methyl ester 100% Transport 1.39E-04 kgkm
2004 Ecoinvent data V2.2 (2010) Switzerland
transport, lorry 3.5-16t, fleet average Transport 2.58E-04 kgkm
2005 Ecoinvent data V2.2 (2010) Europe
transport, lorry 3.5-20t, fleet average Transport 2.80E-04 kgkm
2005 Ecoinvent data V2.2 (2010) Switzerland
transport, lorry 3.5-7.5t, EURO3 Transport 4.86E-04 kgkm
2005 Ecoinvent data V2.2 (2010) Europe
transport, lorry 3.5-7.5t, EURO4 Transport 4.69E-04 kgkm
2005 Ecoinvent data V2.2 (2010) Europe
transport, lorry 3.5-7.5t, EURO5 Transport 4.74E-04 kgkm
2005 Ecoinvent data V2.2 (2010) Europe
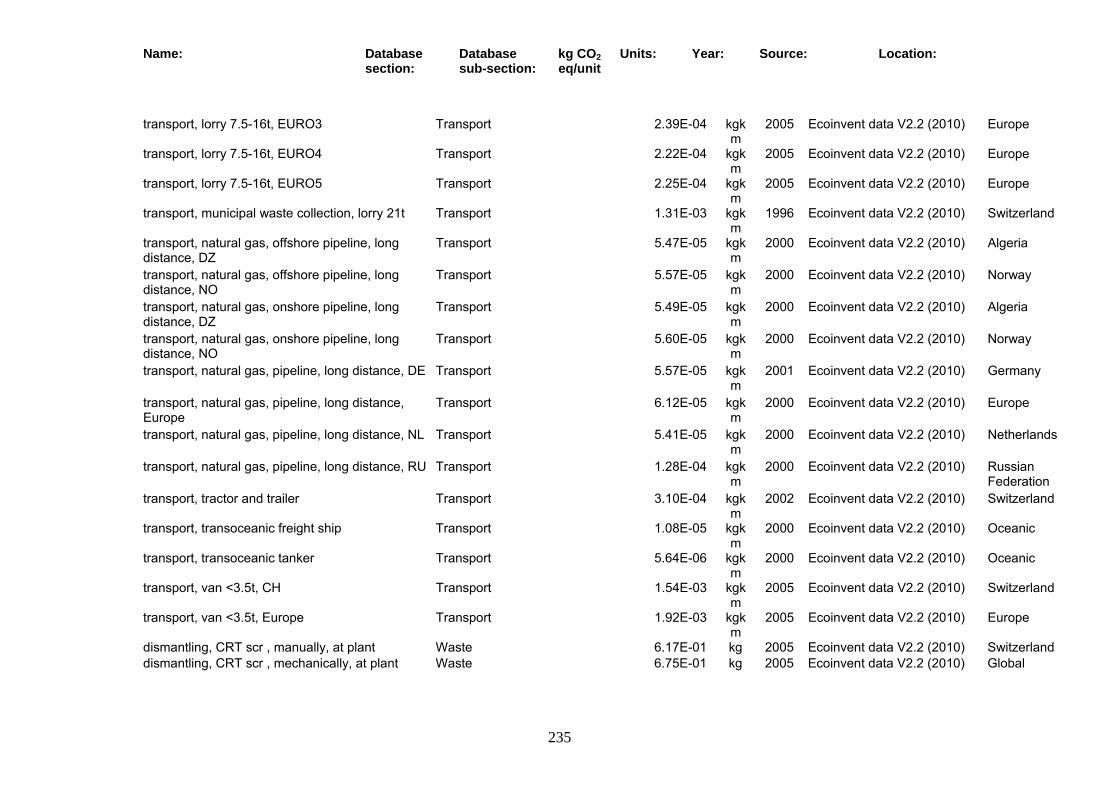
Name: Database section:
Database sub-section:
kg CO2 eq/unit
Units: Year: Source: Location:
235
transport, lorry 7.5-16t, EURO3 Transport 2.39E-04 kgkm
2005 Ecoinvent data V2.2 (2010) Europe
transport, lorry 7.5-16t, EURO4 Transport 2.22E-04 kgkm
2005 Ecoinvent data V2.2 (2010) Europe
transport, lorry 7.5-16t, EURO5 Transport 2.25E-04 kgkm
2005 Ecoinvent data V2.2 (2010) Europe
transport, municipal waste collection, lorry 21t Transport 1.31E-03 kgkm
1996 Ecoinvent data V2.2 (2010) Switzerland
transport, natural gas, offshore pipeline, long distance, DZ
Transport 5.47E-05 kgkm
2000 Ecoinvent data V2.2 (2010) Algeria
transport, natural gas, offshore pipeline, long distance, NO
Transport 5.57E-05 kgkm
2000 Ecoinvent data V2.2 (2010) Norway
transport, natural gas, onshore pipeline, long distance, DZ
Transport 5.49E-05 kgkm
2000 Ecoinvent data V2.2 (2010) Algeria
transport, natural gas, onshore pipeline, long distance, NO
Transport 5.60E-05 kgkm
2000 Ecoinvent data V2.2 (2010) Norway
transport, natural gas, pipeline, long distance, DE Transport 5.57E-05 kgkm
2001 Ecoinvent data V2.2 (2010) Germany
transport, natural gas, pipeline, long distance, Europe
Transport 6.12E-05 kgkm
2000 Ecoinvent data V2.2 (2010) Europe
transport, natural gas, pipeline, long distance, NL Transport 5.41E-05 kgkm
2000 Ecoinvent data V2.2 (2010) Netherlands
transport, natural gas, pipeline, long distance, RU Transport 1.28E-04 kgkm
2000 Ecoinvent data V2.2 (2010) Russian Federation
transport, tractor and trailer Transport 3.10E-04 kgkm
2002 Ecoinvent data V2.2 (2010) Switzerland
transport, transoceanic freight ship Transport 1.08E-05 kgkm
2000 Ecoinvent data V2.2 (2010) Oceanic
transport, transoceanic tanker Transport 5.64E-06 kgkm
2000 Ecoinvent data V2.2 (2010) Oceanic
transport, van <3.5t, CH Transport 1.54E-03 kgkm
2005 Ecoinvent data V2.2 (2010) Switzerland
transport, van <3.5t, Europe Transport 1.92E-03 kgkm
2005 Ecoinvent data V2.2 (2010) Europe
dismantling, CRT scr , manually, at plant Waste 6.17E-01 kg 2005 Ecoinvent data V2.2 (2010) Switzerland dismantling, CRT scr , mechanically, at plant Waste 6.75E-01 kg 2005 Ecoinvent data V2.2 (2010) Global
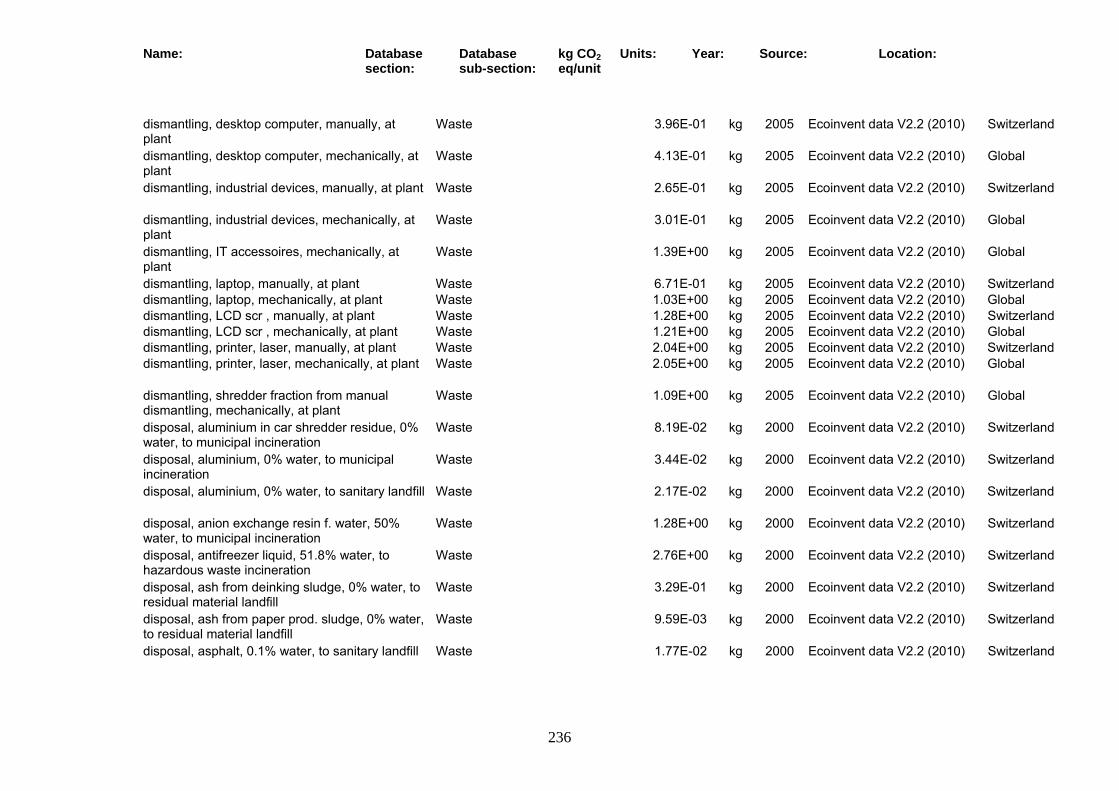
Name: Database section:
Database sub-section:
kg CO2 eq/unit
Units: Year: Source: Location:
236
dismantling, desktop computer, manually, at plant
Waste 3.96E-01 kg 2005 Ecoinvent data V2.2 (2010) Switzerland
dismantling, desktop computer, mechanically, at plant
Waste 4.13E-01 kg 2005 Ecoinvent data V2.2 (2010) Global
dismantling, industrial devices, manually, at plant Waste 2.65E-01 kg 2005 Ecoinvent data V2.2 (2010) Switzerland
dismantling, industrial devices, mechanically, at plant
Waste 3.01E-01 kg 2005 Ecoinvent data V2.2 (2010) Global
dismantling, IT accessoires, mechanically, at plant
Waste 1.39E+00 kg 2005 Ecoinvent data V2.2 (2010) Global
dismantling, laptop, manually, at plant Waste 6.71E-01 kg 2005 Ecoinvent data V2.2 (2010) Switzerland dismantling, laptop, mechanically, at plant Waste 1.03E+00 kg 2005 Ecoinvent data V2.2 (2010) Global dismantling, LCD scr , manually, at plant Waste 1.28E+00 kg 2005 Ecoinvent data V2.2 (2010) Switzerland dismantling, LCD scr , mechanically, at plant Waste 1.21E+00 kg 2005 Ecoinvent data V2.2 (2010) Global dismantling, printer, laser, manually, at plant Waste 2.04E+00 kg 2005 Ecoinvent data V2.2 (2010) Switzerland dismantling, printer, laser, mechanically, at plant Waste 2.05E+00 kg 2005 Ecoinvent data V2.2 (2010) Global
dismantling, shredder fraction from manual dismantling, mechanically, at plant
Waste 1.09E+00 kg 2005 Ecoinvent data V2.2 (2010) Global
disposal, aluminium in car shredder residue, 0% water, to municipal incineration
Waste 8.19E-02 kg 2000 Ecoinvent data V2.2 (2010) Switzerland
disposal, aluminium, 0% water, to municipal incineration
Waste 3.44E-02 kg 2000 Ecoinvent data V2.2 (2010) Switzerland
disposal, aluminium, 0% water, to sanitary landfill Waste 2.17E-02 kg 2000 Ecoinvent data V2.2 (2010) Switzerland
disposal, anion exchange resin f. water, 50% water, to municipal incineration
Waste 1.28E+00 kg 2000 Ecoinvent data V2.2 (2010) Switzerland
disposal, antifreezer liquid, 51.8% water, to hazardous waste incineration
Waste 2.76E+00 kg 2000 Ecoinvent data V2.2 (2010) Switzerland
disposal, ash from deinking sludge, 0% water, to residual material landfill
Waste 3.29E-01 kg 2000 Ecoinvent data V2.2 (2010) Switzerland
disposal, ash from paper prod. sludge, 0% water, to residual material landfill
Waste 9.59E-03 kg 2000 Ecoinvent data V2.2 (2010) Switzerland
disposal, asphalt, 0.1% water, to sanitary landfill Waste 1.77E-02 kg 2000 Ecoinvent data V2.2 (2010) Switzerland
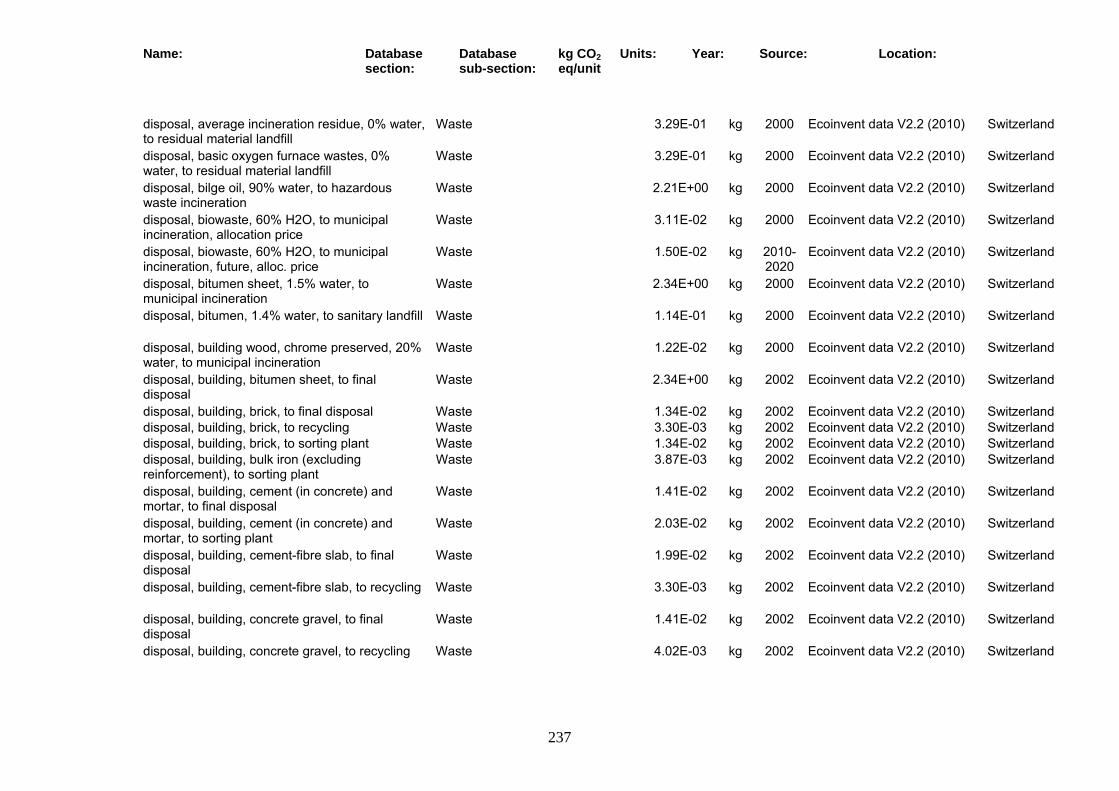
Name: Database section:
Database sub-section:
kg CO2 eq/unit
Units: Year: Source: Location:
237
disposal, average incineration residue, 0% water, to residual material landfill
Waste 3.29E-01 kg 2000 Ecoinvent data V2.2 (2010) Switzerland
disposal, basic oxygen furnace wastes, 0% water, to residual material landfill
Waste 3.29E-01 kg 2000 Ecoinvent data V2.2 (2010) Switzerland
disposal, bilge oil, 90% water, to hazardous waste incineration
Waste 2.21E+00 kg 2000 Ecoinvent data V2.2 (2010) Switzerland
disposal, biowaste, 60% H2O, to municipal incineration, allocation price
Waste 3.11E-02 kg 2000 Ecoinvent data V2.2 (2010) Switzerland
disposal, biowaste, 60% H2O, to municipal incineration, future, alloc. price
Waste 1.50E-02 kg 2010-2020
Ecoinvent data V2.2 (2010) Switzerland
disposal, bitumen sheet, 1.5% water, to municipal incineration
Waste 2.34E+00 kg 2000 Ecoinvent data V2.2 (2010) Switzerland
disposal, bitumen, 1.4% water, to sanitary landfill Waste 1.14E-01 kg 2000 Ecoinvent data V2.2 (2010) Switzerland
disposal, building wood, chrome preserved, 20% water, to municipal incineration
Waste 1.22E-02 kg 2000 Ecoinvent data V2.2 (2010) Switzerland
disposal, building, bitumen sheet, to final disposal
Waste 2.34E+00 kg 2002 Ecoinvent data V2.2 (2010) Switzerland
disposal, building, brick, to final disposal Waste 1.34E-02 kg 2002 Ecoinvent data V2.2 (2010) Switzerland disposal, building, brick, to recycling Waste 3.30E-03 kg 2002 Ecoinvent data V2.2 (2010) Switzerland disposal, building, brick, to sorting plant Waste 1.34E-02 kg 2002 Ecoinvent data V2.2 (2010) Switzerland disposal, building, bulk iron (excluding reinforcement), to sorting plant
Waste 3.87E-03 kg 2002 Ecoinvent data V2.2 (2010) Switzerland
disposal, building, cement (in concrete) and mortar, to final disposal
Waste 1.41E-02 kg 2002 Ecoinvent data V2.2 (2010) Switzerland
disposal, building, cement (in concrete) and mortar, to sorting plant
Waste 2.03E-02 kg 2002 Ecoinvent data V2.2 (2010) Switzerland
disposal, building, cement-fibre slab, to final disposal
Waste 1.99E-02 kg 2002 Ecoinvent data V2.2 (2010) Switzerland
disposal, building, cement-fibre slab, to recycling Waste 3.30E-03 kg 2002 Ecoinvent data V2.2 (2010) Switzerland
disposal, building, concrete gravel, to final disposal
Waste 1.41E-02 kg 2002 Ecoinvent data V2.2 (2010) Switzerland
disposal, building, concrete gravel, to recycling Waste 4.02E-03 kg 2002 Ecoinvent data V2.2 (2010) Switzerland

Name: Database section:
Database sub-section:
kg CO2 eq/unit
Units: Year: Source: Location:
238
disposal, building, concrete gravel, to sorting plant
Waste 1.40E-02 kg 2002 Ecoinvent data V2.2 (2010) Switzerland
disposal, building, concrete, not reinforced, to final disposal
Waste 1.41E-02 kg 2002 Ecoinvent data V2.2 (2010) Switzerland
disposal, building, concrete, not reinforced, to recycling
Waste 4.02E-03 kg 2002 Ecoinvent data V2.2 (2010) Switzerland
disposal, building, concrete, not reinforced, to sorting plant
Waste 1.40E-02 kg 2002 Ecoinvent data V2.2 (2010) Switzerland
disposal, building, electric wiring, to final disposal Waste 1.46E+00 kg 2002 Ecoinvent data V2.2 (2010) Switzerland
disposal, building, emulsion paint on walls, to final disposal
Waste 1.01E-02 kg 2002 Ecoinvent data V2.2 (2010) Switzerland
disposal, building, emulsion paint on walls, to sorting plant
Waste 4.44E-02 kg 2002 Ecoinvent data V2.2 (2010) Switzerland
disposal, building, emulsion paint on wood, to final disposal
Waste 1.13E+00 kg 2002 Ecoinvent data V2.2 (2010) Switzerland
disposal, building, emulsion paint remains, to final disposal
Waste 2.54E+00 kg 2002 Ecoinvent data V2.2 (2010) Switzerland
disposal, building, fibre board, to final disposal Waste 1.98E-01 kg 2002 Ecoinvent data V2.2 (2010) Switzerland disposal, building, glass pane (in burnable frame), to final disposal
Waste 2.66E-02 kg 2002 Ecoinvent data V2.2 (2010) Switzerland
disposal, building, glass pane (in burnable frame), to sorting plant
Waste 3.07E-02 kg 2002 Ecoinvent data V2.2 (2010) Switzerland
disposal, building, glass sheet, to final disposal Waste 1.01E-02 kg 2002 Ecoinvent data V2.2 (2010) Switzerland disposal, building, glass sheet, to sorting plant Waste 9.96E-03 kg 2002 Ecoinvent data V2.2 (2010) Switzerland disposal, building, mineral plaster, to final disposal
Waste 1.01E-02 kg 2002 Ecoinvent data V2.2 (2010) Switzerland
disposal, building, mineral plaster, to sorting plant Waste 1.64E-02 kg 2002 Ecoinvent data V2.2 (2010) Switzerland
disposal, building, mineral wool, to final disposal Waste 1.01E-02 kg 2002 Ecoinvent data V2.2 (2010) Switzerland
disposal, building, mineral wool, to sorting plant Waste 2.57E-02 kg 2002 Ecoinvent data V2.2 (2010) Switzerland
disposal, building, paint on metal, to final disposal
Waste 1.01E-02 kg 2002 Ecoinvent data V2.2 (2010) Switzerland
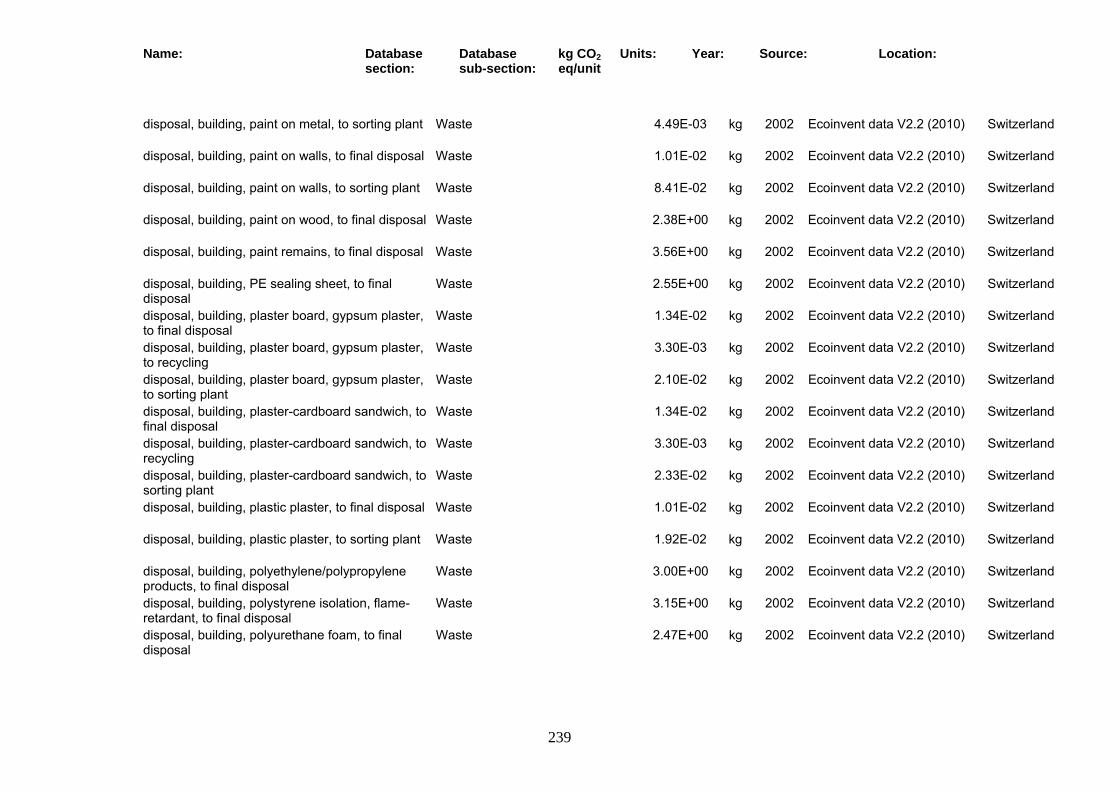
Name: Database section:
Database sub-section:
kg CO2 eq/unit
Units: Year: Source: Location:
239
disposal, building, paint on metal, to sorting plant Waste 4.49E-03 kg 2002 Ecoinvent data V2.2 (2010) Switzerland
disposal, building, paint on walls, to final disposal Waste 1.01E-02 kg 2002 Ecoinvent data V2.2 (2010) Switzerland
disposal, building, paint on walls, to sorting plant Waste 8.41E-02 kg 2002 Ecoinvent data V2.2 (2010) Switzerland
disposal, building, paint on wood, to final disposal Waste 2.38E+00 kg 2002 Ecoinvent data V2.2 (2010) Switzerland
disposal, building, paint remains, to final disposal Waste 3.56E+00 kg 2002 Ecoinvent data V2.2 (2010) Switzerland
disposal, building, PE sealing sheet, to final disposal
Waste 2.55E+00 kg 2002 Ecoinvent data V2.2 (2010) Switzerland
disposal, building, plaster board, gypsum plaster, to final disposal
Waste 1.34E-02 kg 2002 Ecoinvent data V2.2 (2010) Switzerland
disposal, building, plaster board, gypsum plaster, to recycling
Waste 3.30E-03 kg 2002 Ecoinvent data V2.2 (2010) Switzerland
disposal, building, plaster board, gypsum plaster, to sorting plant
Waste 2.10E-02 kg 2002 Ecoinvent data V2.2 (2010) Switzerland
disposal, building, plaster-cardboard sandwich, to final disposal
Waste 1.34E-02 kg 2002 Ecoinvent data V2.2 (2010) Switzerland
disposal, building, plaster-cardboard sandwich, to recycling
Waste 3.30E-03 kg 2002 Ecoinvent data V2.2 (2010) Switzerland
disposal, building, plaster-cardboard sandwich, to sorting plant
Waste 2.33E-02 kg 2002 Ecoinvent data V2.2 (2010) Switzerland
disposal, building, plastic plaster, to final disposal Waste 1.01E-02 kg 2002 Ecoinvent data V2.2 (2010) Switzerland
disposal, building, plastic plaster, to sorting plant Waste 1.92E-02 kg 2002 Ecoinvent data V2.2 (2010) Switzerland
disposal, building, polyethylene/polypropylene products, to final disposal
Waste 3.00E+00 kg 2002 Ecoinvent data V2.2 (2010) Switzerland
disposal, building, polystyrene isolation, flame-retardant, to final disposal
Waste 3.15E+00 kg 2002 Ecoinvent data V2.2 (2010) Switzerland
disposal, building, polyurethane foam, to final disposal
Waste 2.47E+00 kg 2002 Ecoinvent data V2.2 (2010) Switzerland

Name: Database section:
Database sub-section:
kg CO2 eq/unit
Units: Year: Source: Location:
240
disposal, building, polyurethane sealing, to final disposal
Waste 1.01E-02 kg 2002 Ecoinvent data V2.2 (2010) Switzerland
disposal, building, polyurethane sealing, to sorting plant
Waste 8.49E-02 kg 2002 Ecoinvent data V2.2 (2010) Switzerland
disposal, building, polyvinylchloride products, to final disposal
Waste 2.26E+00 kg 2002 Ecoinvent data V2.2 (2010) Switzerland
disposal, building, PVC sealing sheet, to final disposal
Waste 2.09E+00 kg 2002 Ecoinvent data V2.2 (2010) Switzerland
disposal, building, reinforced concrete, to final disposal
Waste 1.57E-02 kg 2002 Ecoinvent data V2.2 (2010) Switzerland
disposal, building, reinforced concrete, to recycling
Waste 5.63E-03 kg 2002 Ecoinvent data V2.2 (2010) Switzerland
disposal, building, reinforced concrete, to sorting plant
Waste 1.55E-02 kg 2002 Ecoinvent data V2.2 (2010) Switzerland
disposal, building, reinforced plaster board, to final disposal
Waste 1.34E-02 kg 2002 Ecoinvent data V2.2 (2010) Switzerland
disposal, building, reinforced plaster board, to recycling
Waste 3.30E-03 kg 2002 Ecoinvent data V2.2 (2010) Switzerland
disposal, building, reinforced plaster board, to sorting plant
Waste 2.24E-01 kg 2002 Ecoinvent data V2.2 (2010) Switzerland
disposal, building, reinforcement steel, to final disposal
Waste 6.77E-02 kg 2002 Ecoinvent data V2.2 (2010) Switzerland
disposal, building, reinforcement steel, to recycling
Waste 5.76E-02 kg 2002 Ecoinvent data V2.2 (2010) Switzerland
disposal, building, reinforcement steel, to sorting plant
Waste 6.17E-02 kg 2002 Ecoinvent data V2.2 (2010) Switzerland
disposal, building, vapour barrier, flame-retarded, to final disposal
Waste 2.82E+00 kg 2002 Ecoinvent data V2.2 (2010) Switzerland
disposal, building, waste wood, chrome preserved, to final disposal
Waste 1.41E-02 kg 2002 Ecoinvent data V2.2 (2010) Switzerland
disposal, building, waste wood, untreated, to final disposal
Waste 1.37E-02 kg 2002 Ecoinvent data V2.2 (2010) Switzerland
disposal, capacitors, 0% water, to hazardous waste incineration
Waste 2.50E+00 kg 2000 Ecoinvent data V2.2 (2010) Switzerland
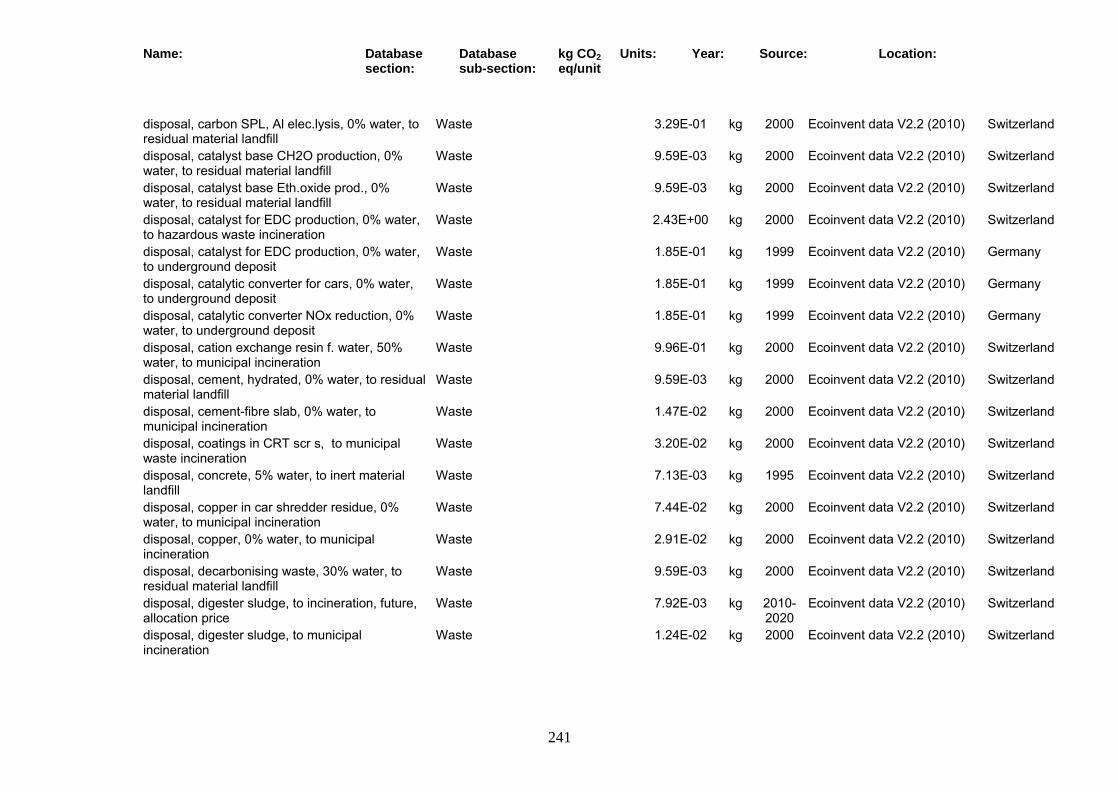
Name: Database section:
Database sub-section:
kg CO2 eq/unit
Units: Year: Source: Location:
241
disposal, carbon SPL, Al elec.lysis, 0% water, to residual material landfill
Waste 3.29E-01 kg 2000 Ecoinvent data V2.2 (2010) Switzerland
disposal, catalyst base CH2O production, 0% water, to residual material landfill
Waste 9.59E-03 kg 2000 Ecoinvent data V2.2 (2010) Switzerland
disposal, catalyst base Eth.oxide prod., 0% water, to residual material landfill
Waste 9.59E-03 kg 2000 Ecoinvent data V2.2 (2010) Switzerland
disposal, catalyst for EDC production, 0% water, to hazardous waste incineration
Waste 2.43E+00 kg 2000 Ecoinvent data V2.2 (2010) Switzerland
disposal, catalyst for EDC production, 0% water, to underground deposit
Waste 1.85E-01 kg 1999 Ecoinvent data V2.2 (2010) Germany
disposal, catalytic converter for cars, 0% water, to underground deposit
Waste 1.85E-01 kg 1999 Ecoinvent data V2.2 (2010) Germany
disposal, catalytic converter NOx reduction, 0% water, to underground deposit
Waste 1.85E-01 kg 1999 Ecoinvent data V2.2 (2010) Germany
disposal, cation exchange resin f. water, 50% water, to municipal incineration
Waste 9.96E-01 kg 2000 Ecoinvent data V2.2 (2010) Switzerland
disposal, cement, hydrated, 0% water, to residual material landfill
Waste 9.59E-03 kg 2000 Ecoinvent data V2.2 (2010) Switzerland
disposal, cement-fibre slab, 0% water, to municipal incineration
Waste 1.47E-02 kg 2000 Ecoinvent data V2.2 (2010) Switzerland
disposal, coatings in CRT scr s, to municipal waste incineration
Waste 3.20E-02 kg 2000 Ecoinvent data V2.2 (2010) Switzerland
disposal, concrete, 5% water, to inert material landfill
Waste 7.13E-03 kg 1995 Ecoinvent data V2.2 (2010) Switzerland
disposal, copper in car shredder residue, 0% water, to municipal incineration
Waste 7.44E-02 kg 2000 Ecoinvent data V2.2 (2010) Switzerland
disposal, copper, 0% water, to municipal incineration
Waste 2.91E-02 kg 2000 Ecoinvent data V2.2 (2010) Switzerland
disposal, decarbonising waste, 30% water, to residual material landfill
Waste 9.59E-03 kg 2000 Ecoinvent data V2.2 (2010) Switzerland
disposal, digester sludge, to incineration, future, allocation price
Waste 7.92E-03 kg 2010-2020
Ecoinvent data V2.2 (2010) Switzerland
disposal, digester sludge, to municipal incineration
Waste 1.24E-02 kg 2000 Ecoinvent data V2.2 (2010) Switzerland
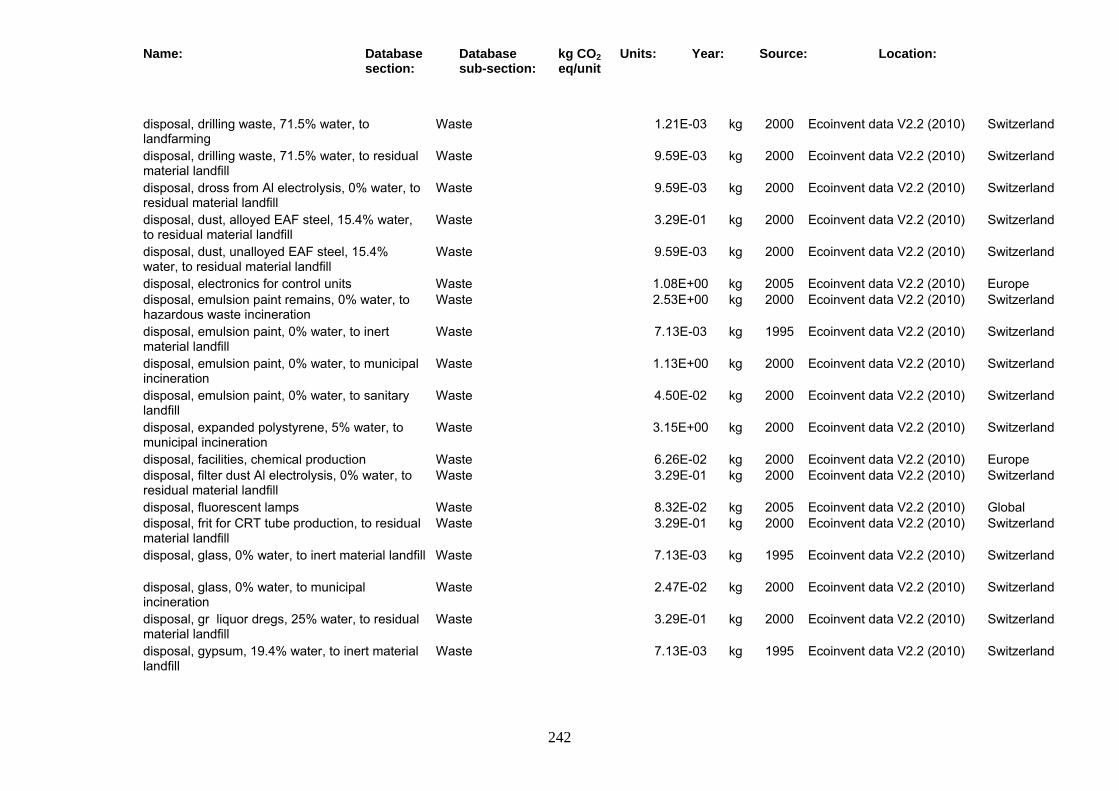
Name: Database section:
Database sub-section:
kg CO2 eq/unit
Units: Year: Source: Location:
242
disposal, drilling waste, 71.5% water, to landfarming
Waste 1.21E-03 kg 2000 Ecoinvent data V2.2 (2010) Switzerland
disposal, drilling waste, 71.5% water, to residual material landfill
Waste 9.59E-03 kg 2000 Ecoinvent data V2.2 (2010) Switzerland
disposal, dross from Al electrolysis, 0% water, to residual material landfill
Waste 9.59E-03 kg 2000 Ecoinvent data V2.2 (2010) Switzerland
disposal, dust, alloyed EAF steel, 15.4% water, to residual material landfill
Waste 3.29E-01 kg 2000 Ecoinvent data V2.2 (2010) Switzerland
disposal, dust, unalloyed EAF steel, 15.4% water, to residual material landfill
Waste 9.59E-03 kg 2000 Ecoinvent data V2.2 (2010) Switzerland
disposal, electronics for control units Waste 1.08E+00 kg 2005 Ecoinvent data V2.2 (2010) Europe disposal, emulsion paint remains, 0% water, to hazardous waste incineration
Waste 2.53E+00 kg 2000 Ecoinvent data V2.2 (2010) Switzerland
disposal, emulsion paint, 0% water, to inert material landfill
Waste 7.13E-03 kg 1995 Ecoinvent data V2.2 (2010) Switzerland
disposal, emulsion paint, 0% water, to municipal incineration
Waste 1.13E+00 kg 2000 Ecoinvent data V2.2 (2010) Switzerland
disposal, emulsion paint, 0% water, to sanitary landfill
Waste 4.50E-02 kg 2000 Ecoinvent data V2.2 (2010) Switzerland
disposal, expanded polystyrene, 5% water, to municipal incineration
Waste 3.15E+00 kg 2000 Ecoinvent data V2.2 (2010) Switzerland
disposal, facilities, chemical production Waste 6.26E-02 kg 2000 Ecoinvent data V2.2 (2010) Europe disposal, filter dust Al electrolysis, 0% water, to residual material landfill
Waste 3.29E-01 kg 2000 Ecoinvent data V2.2 (2010) Switzerland
disposal, fluorescent lamps Waste 8.32E-02 kg 2005 Ecoinvent data V2.2 (2010) Global disposal, frit for CRT tube production, to residual material landfill
Waste 3.29E-01 kg 2000 Ecoinvent data V2.2 (2010) Switzerland
disposal, glass, 0% water, to inert material landfill Waste 7.13E-03 kg 1995 Ecoinvent data V2.2 (2010) Switzerland
disposal, glass, 0% water, to municipal incineration
Waste 2.47E-02 kg 2000 Ecoinvent data V2.2 (2010) Switzerland
disposal, gr liquor dregs, 25% water, to residual material landfill
Waste 3.29E-01 kg 2000 Ecoinvent data V2.2 (2010) Switzerland
disposal, gypsum, 19.4% water, to inert material landfill
Waste 7.13E-03 kg 1995 Ecoinvent data V2.2 (2010) Switzerland
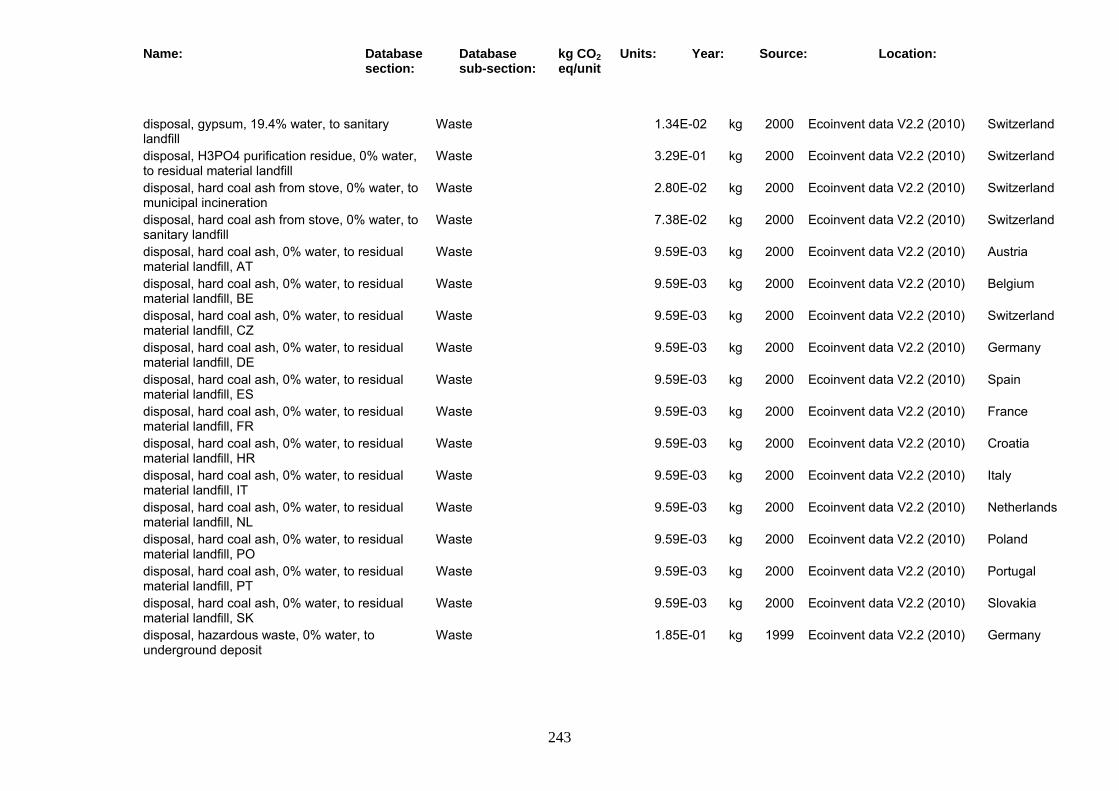
Name: Database section:
Database sub-section:
kg CO2 eq/unit
Units: Year: Source: Location:
243
disposal, gypsum, 19.4% water, to sanitary landfill
Waste 1.34E-02 kg 2000 Ecoinvent data V2.2 (2010) Switzerland
disposal, H3PO4 purification residue, 0% water, to residual material landfill
Waste 3.29E-01 kg 2000 Ecoinvent data V2.2 (2010) Switzerland
disposal, hard coal ash from stove, 0% water, to municipal incineration
Waste 2.80E-02 kg 2000 Ecoinvent data V2.2 (2010) Switzerland
disposal, hard coal ash from stove, 0% water, to sanitary landfill
Waste 7.38E-02 kg 2000 Ecoinvent data V2.2 (2010) Switzerland
disposal, hard coal ash, 0% water, to residual material landfill, AT
Waste 9.59E-03 kg 2000 Ecoinvent data V2.2 (2010) Austria
disposal, hard coal ash, 0% water, to residual material landfill, BE
Waste 9.59E-03 kg 2000 Ecoinvent data V2.2 (2010) Belgium
disposal, hard coal ash, 0% water, to residual material landfill, CZ
Waste 9.59E-03 kg 2000 Ecoinvent data V2.2 (2010) Switzerland
disposal, hard coal ash, 0% water, to residual material landfill, DE
Waste 9.59E-03 kg 2000 Ecoinvent data V2.2 (2010) Germany
disposal, hard coal ash, 0% water, to residual material landfill, ES
Waste 9.59E-03 kg 2000 Ecoinvent data V2.2 (2010) Spain
disposal, hard coal ash, 0% water, to residual material landfill, FR
Waste 9.59E-03 kg 2000 Ecoinvent data V2.2 (2010) France
disposal, hard coal ash, 0% water, to residual material landfill, HR
Waste 9.59E-03 kg 2000 Ecoinvent data V2.2 (2010) Croatia
disposal, hard coal ash, 0% water, to residual material landfill, IT
Waste 9.59E-03 kg 2000 Ecoinvent data V2.2 (2010) Italy
disposal, hard coal ash, 0% water, to residual material landfill, NL
Waste 9.59E-03 kg 2000 Ecoinvent data V2.2 (2010) Netherlands
disposal, hard coal ash, 0% water, to residual material landfill, PO
Waste 9.59E-03 kg 2000 Ecoinvent data V2.2 (2010) Poland
disposal, hard coal ash, 0% water, to residual material landfill, PT
Waste 9.59E-03 kg 2000 Ecoinvent data V2.2 (2010) Portugal
disposal, hard coal ash, 0% water, to residual material landfill, SK
Waste 9.59E-03 kg 2000 Ecoinvent data V2.2 (2010) Slovakia
disposal, hazardous waste, 0% water, to underground deposit
Waste 1.85E-01 kg 1999 Ecoinvent data V2.2 (2010) Germany
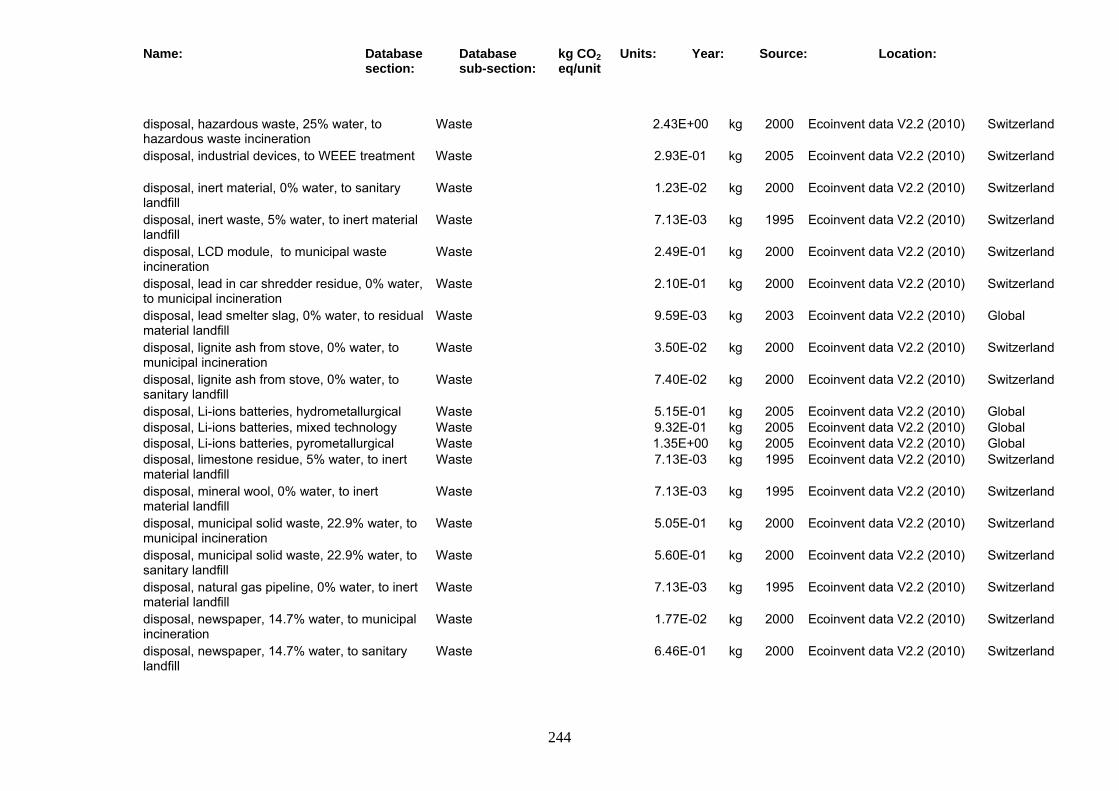
Name: Database section:
Database sub-section:
kg CO2 eq/unit
Units: Year: Source: Location:
244
disposal, hazardous waste, 25% water, to hazardous waste incineration
Waste 2.43E+00 kg 2000 Ecoinvent data V2.2 (2010) Switzerland
disposal, industrial devices, to WEEE treatment Waste 2.93E-01 kg 2005 Ecoinvent data V2.2 (2010) Switzerland
disposal, inert material, 0% water, to sanitary landfill
Waste 1.23E-02 kg 2000 Ecoinvent data V2.2 (2010) Switzerland
disposal, inert waste, 5% water, to inert material landfill
Waste 7.13E-03 kg 1995 Ecoinvent data V2.2 (2010) Switzerland
disposal, LCD module, to municipal waste incineration
Waste 2.49E-01 kg 2000 Ecoinvent data V2.2 (2010) Switzerland
disposal, lead in car shredder residue, 0% water, to municipal incineration
Waste 2.10E-01 kg 2000 Ecoinvent data V2.2 (2010) Switzerland
disposal, lead smelter slag, 0% water, to residual material landfill
Waste 9.59E-03 kg 2003 Ecoinvent data V2.2 (2010) Global
disposal, lignite ash from stove, 0% water, to municipal incineration
Waste 3.50E-02 kg 2000 Ecoinvent data V2.2 (2010) Switzerland
disposal, lignite ash from stove, 0% water, to sanitary landfill
Waste 7.40E-02 kg 2000 Ecoinvent data V2.2 (2010) Switzerland
disposal, Li-ions batteries, hydrometallurgical Waste 5.15E-01 kg 2005 Ecoinvent data V2.2 (2010) Global disposal, Li-ions batteries, mixed technology Waste 9.32E-01 kg 2005 Ecoinvent data V2.2 (2010) Global disposal, Li-ions batteries, pyrometallurgical Waste 1.35E+00 kg 2005 Ecoinvent data V2.2 (2010) Global disposal, limestone residue, 5% water, to inert material landfill
Waste 7.13E-03 kg 1995 Ecoinvent data V2.2 (2010) Switzerland
disposal, mineral wool, 0% water, to inert material landfill
Waste 7.13E-03 kg 1995 Ecoinvent data V2.2 (2010) Switzerland
disposal, municipal solid waste, 22.9% water, to municipal incineration
Waste 5.05E-01 kg 2000 Ecoinvent data V2.2 (2010) Switzerland
disposal, municipal solid waste, 22.9% water, to sanitary landfill
Waste 5.60E-01 kg 2000 Ecoinvent data V2.2 (2010) Switzerland
disposal, natural gas pipeline, 0% water, to inert material landfill
Waste 7.13E-03 kg 1995 Ecoinvent data V2.2 (2010) Switzerland
disposal, newspaper, 14.7% water, to municipal incineration
Waste 1.77E-02 kg 2000 Ecoinvent data V2.2 (2010) Switzerland
disposal, newspaper, 14.7% water, to sanitary landfill
Waste 6.46E-01 kg 2000 Ecoinvent data V2.2 (2010) Switzerland
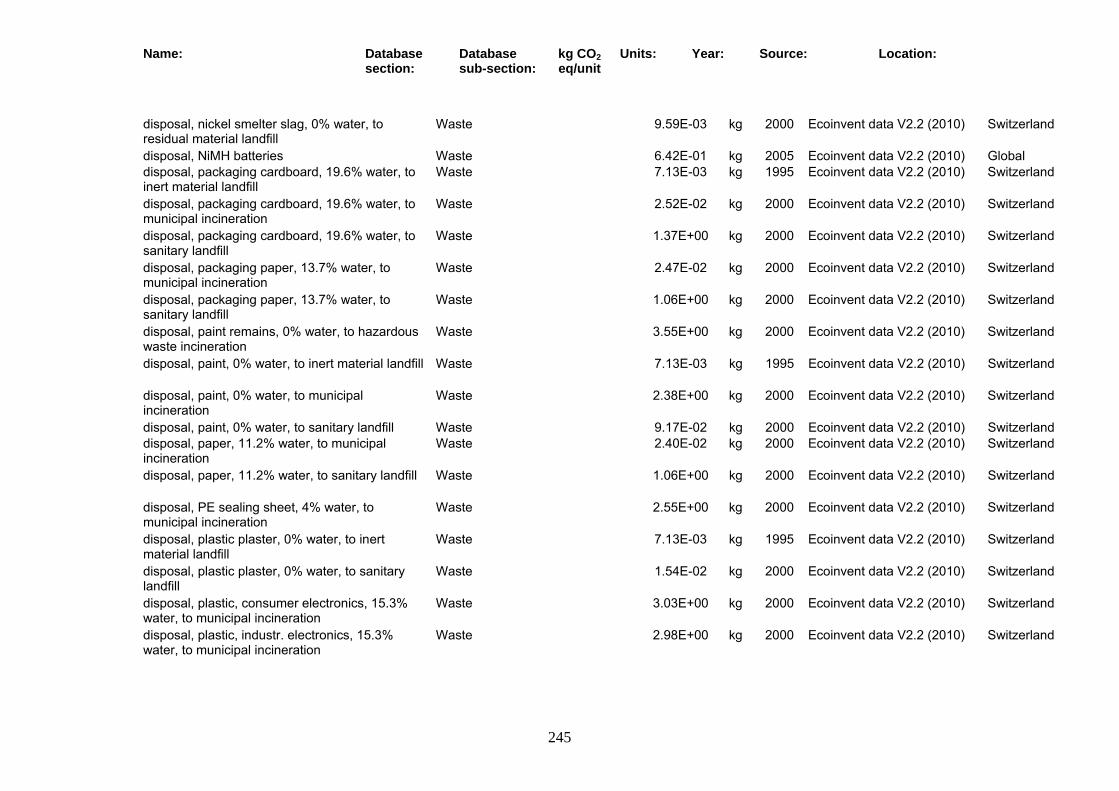
Name: Database section:
Database sub-section:
kg CO2 eq/unit
Units: Year: Source: Location:
245
disposal, nickel smelter slag, 0% water, to residual material landfill
Waste 9.59E-03 kg 2000 Ecoinvent data V2.2 (2010) Switzerland
disposal, NiMH batteries Waste 6.42E-01 kg 2005 Ecoinvent data V2.2 (2010) Global disposal, packaging cardboard, 19.6% water, to inert material landfill
Waste 7.13E-03 kg 1995 Ecoinvent data V2.2 (2010) Switzerland
disposal, packaging cardboard, 19.6% water, to municipal incineration
Waste 2.52E-02 kg 2000 Ecoinvent data V2.2 (2010) Switzerland
disposal, packaging cardboard, 19.6% water, to sanitary landfill
Waste 1.37E+00 kg 2000 Ecoinvent data V2.2 (2010) Switzerland
disposal, packaging paper, 13.7% water, to municipal incineration
Waste 2.47E-02 kg 2000 Ecoinvent data V2.2 (2010) Switzerland
disposal, packaging paper, 13.7% water, to sanitary landfill
Waste 1.06E+00 kg 2000 Ecoinvent data V2.2 (2010) Switzerland
disposal, paint remains, 0% water, to hazardous waste incineration
Waste 3.55E+00 kg 2000 Ecoinvent data V2.2 (2010) Switzerland
disposal, paint, 0% water, to inert material landfill Waste 7.13E-03 kg 1995 Ecoinvent data V2.2 (2010) Switzerland
disposal, paint, 0% water, to municipal incineration
Waste 2.38E+00 kg 2000 Ecoinvent data V2.2 (2010) Switzerland
disposal, paint, 0% water, to sanitary landfill Waste 9.17E-02 kg 2000 Ecoinvent data V2.2 (2010) Switzerland disposal, paper, 11.2% water, to municipal incineration
Waste 2.40E-02 kg 2000 Ecoinvent data V2.2 (2010) Switzerland
disposal, paper, 11.2% water, to sanitary landfill Waste 1.06E+00 kg 2000 Ecoinvent data V2.2 (2010) Switzerland
disposal, PE sealing sheet, 4% water, to municipal incineration
Waste 2.55E+00 kg 2000 Ecoinvent data V2.2 (2010) Switzerland
disposal, plastic plaster, 0% water, to inert material landfill
Waste 7.13E-03 kg 1995 Ecoinvent data V2.2 (2010) Switzerland
disposal, plastic plaster, 0% water, to sanitary landfill
Waste 1.54E-02 kg 2000 Ecoinvent data V2.2 (2010) Switzerland
disposal, plastic, consumer electronics, 15.3% water, to municipal incineration
Waste 3.03E+00 kg 2000 Ecoinvent data V2.2 (2010) Switzerland
disposal, plastic, industr. electronics, 15.3% water, to municipal incineration
Waste 2.98E+00 kg 2000 Ecoinvent data V2.2 (2010) Switzerland
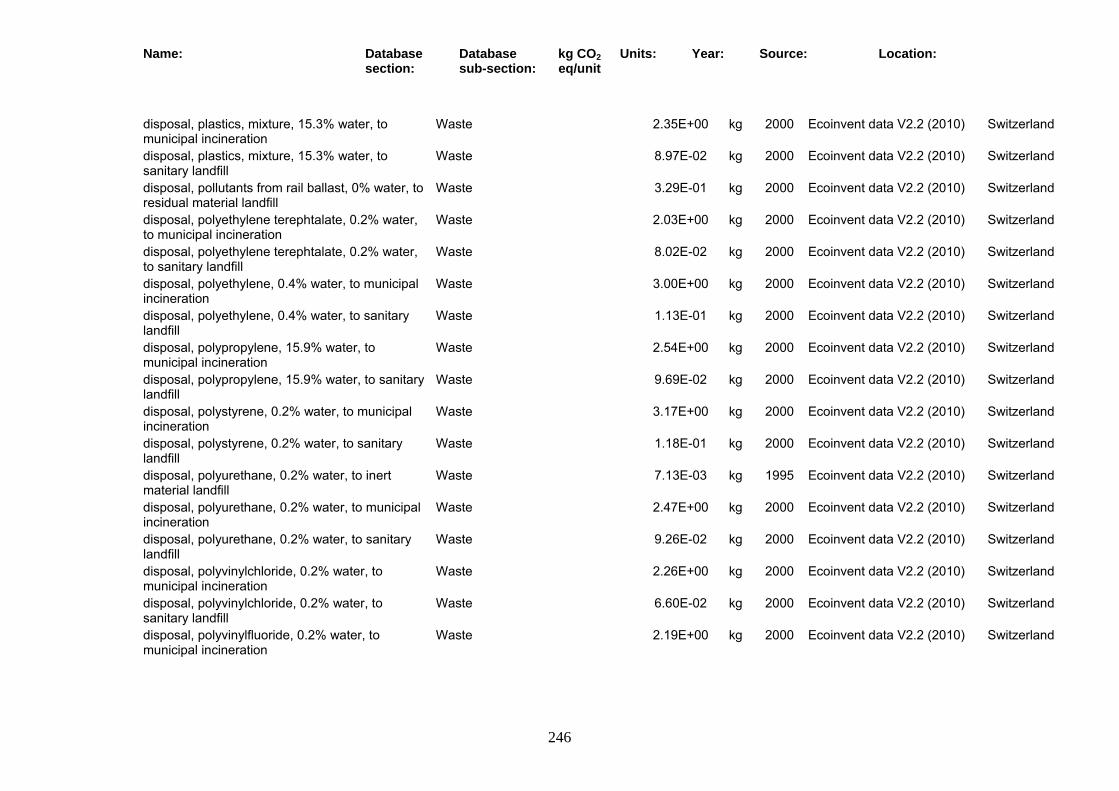
Name: Database section:
Database sub-section:
kg CO2 eq/unit
Units: Year: Source: Location:
246
disposal, plastics, mixture, 15.3% water, to municipal incineration
Waste 2.35E+00 kg 2000 Ecoinvent data V2.2 (2010) Switzerland
disposal, plastics, mixture, 15.3% water, to sanitary landfill
Waste 8.97E-02 kg 2000 Ecoinvent data V2.2 (2010) Switzerland
disposal, pollutants from rail ballast, 0% water, to residual material landfill
Waste 3.29E-01 kg 2000 Ecoinvent data V2.2 (2010) Switzerland
disposal, polyethylene terephtalate, 0.2% water, to municipal incineration
Waste 2.03E+00 kg 2000 Ecoinvent data V2.2 (2010) Switzerland
disposal, polyethylene terephtalate, 0.2% water, to sanitary landfill
Waste 8.02E-02 kg 2000 Ecoinvent data V2.2 (2010) Switzerland
disposal, polyethylene, 0.4% water, to municipal incineration
Waste 3.00E+00 kg 2000 Ecoinvent data V2.2 (2010) Switzerland
disposal, polyethylene, 0.4% water, to sanitary landfill
Waste 1.13E-01 kg 2000 Ecoinvent data V2.2 (2010) Switzerland
disposal, polypropylene, 15.9% water, to municipal incineration
Waste 2.54E+00 kg 2000 Ecoinvent data V2.2 (2010) Switzerland
disposal, polypropylene, 15.9% water, to sanitary landfill
Waste 9.69E-02 kg 2000 Ecoinvent data V2.2 (2010) Switzerland
disposal, polystyrene, 0.2% water, to municipal incineration
Waste 3.17E+00 kg 2000 Ecoinvent data V2.2 (2010) Switzerland
disposal, polystyrene, 0.2% water, to sanitary landfill
Waste 1.18E-01 kg 2000 Ecoinvent data V2.2 (2010) Switzerland
disposal, polyurethane, 0.2% water, to inert material landfill
Waste 7.13E-03 kg 1995 Ecoinvent data V2.2 (2010) Switzerland
disposal, polyurethane, 0.2% water, to municipal incineration
Waste 2.47E+00 kg 2000 Ecoinvent data V2.2 (2010) Switzerland
disposal, polyurethane, 0.2% water, to sanitary landfill
Waste 9.26E-02 kg 2000 Ecoinvent data V2.2 (2010) Switzerland
disposal, polyvinylchloride, 0.2% water, to municipal incineration
Waste 2.26E+00 kg 2000 Ecoinvent data V2.2 (2010) Switzerland
disposal, polyvinylchloride, 0.2% water, to sanitary landfill
Waste 6.60E-02 kg 2000 Ecoinvent data V2.2 (2010) Switzerland
disposal, polyvinylfluoride, 0.2% water, to municipal incineration
Waste 2.19E+00 kg 2000 Ecoinvent data V2.2 (2010) Switzerland

Name: Database section:
Database sub-section:
kg CO2 eq/unit
Units: Year: Source: Location:
247
disposal, PVC sealing sheet, 1.64% water, to municipal incineration
Waste 2.09E+00 kg 2000 Ecoinvent data V2.2 (2010) Switzerland
disposal, raw sewage sludge, to municipal incineration
Waste 1.31E-02 kg 2000 Ecoinvent data V2.2 (2010) Switzerland
disposal, redmud from bauxite digestion, 0% water, to residual material landfill
Waste 9.59E-03 kg 2000 Ecoinvent data V2.2 (2010) Switzerland
disposal, refinery sludge, 89.5% water, to hazardous waste incineration
Waste 2.17E+00 kg 2000 Ecoinvent data V2.2 (2010) Switzerland
disposal, refinery sludge, 89.5% water, to landfarming
Waste 1.21E-03 kg 2000 Ecoinvent data V2.2 (2010) Switzerland
disposal, refinery sludge, 89.5% water, to sanitary landfill
Waste 6.46E-01 kg 2000 Ecoinvent data V2.2 (2010) Switzerland
disposal, refractory SPL, Al elec.lysis, 0% water, to residual material landfill
Waste 3.29E-01 kg 2000 Ecoinvent data V2.2 (2010) Switzerland
disposal, residue from cooling tower, 30% water, to sanitary landfill
Waste 1.94E-02 kg 2000 Ecoinvent data V2.2 (2010) Switzerland
disposal, residue from TiO2 prod. Cl, 56% water, to residual material landfill
Waste 9.61E-03 kg 2000 Ecoinvent data V2.2 (2010) Switzerland
disposal, residue from TiO2 prod. SO4, 30% water, to residual material landfill
Waste 3.29E-01 kg 2000 Ecoinvent data V2.2 (2010) Switzerland
disposal, residues Na-dichromate prod., 0% water, to residual material landfill
Waste 3.29E-01 kg 2000 Ecoinvent data V2.2 (2010) Switzerland
disposal, residues, mechanical treatment, CRT scr , in MSWI
Waste 2.77E+00 kg 2000 Ecoinvent data V2.2 (2010) Switzerland
disposal, residues, mechanical treatment, desktop computer, in MSWI
Waste 2.23E+00 kg 2000 Ecoinvent data V2.2 (2010) Switzerland
disposal, residues, mechanical treatment, industrial device, in MSWI
Waste 2.31E+00 kg 2000 Ecoinvent data V2.2 (2010) Switzerland
disposal, residues, mechanical treatment, IT accessoires, in MSWI
Waste 2.86E+00 kg 2000 Ecoinvent data V2.2 (2010) Switzerland
disposal, residues, mechanical treatment, laptop computer, in MSWI
Waste 2.78E+00 kg 2000 Ecoinvent data V2.2 (2010) Switzerland
disposal, residues, mechanical treatment, laser printer, in MSWI
Waste 2.89E+00 kg 2000 Ecoinvent data V2.2 (2010) Switzerland

Name: Database section:
Database sub-section:
kg CO2 eq/unit
Units: Year: Source: Location:
248
disposal, residues, mechanical treatment, LCD scr , in MSWI
Waste 2.93E+00 kg 2000 Ecoinvent data V2.2 (2010) Switzerland
disposal, residues, shredder fraction from manual dismantling, in MSWI
Waste 2.86E+00 kg 2000 Ecoinvent data V2.2 (2010) Switzerland
disposal, rubber, unspecified, 0% water, to municipal incineration
Waste 3.14E+00 kg 2000 Ecoinvent data V2.2 (2010) Switzerland
disposal, salt tailings potash mining, 0% water, to residual material landfill
Waste 9.59E-03 kg 2000 Ecoinvent data V2.2 (2010) Switzerland
disposal, separator sludge, 90% water, to hazardous waste incineration
Waste 2.13E+00 kg 2000 Ecoinvent data V2.2 (2010) Switzerland
disposal, slag from MG silicon production, 0% water, to inert material landfill
Waste 7.13E-03 kg 1995 Ecoinvent data V2.2 (2010) Switzerland
disposal, slag, unalloyed electr. steel, 0% water, to residual material landfill
Waste 9.59E-03 kg 2000 Ecoinvent data V2.2 (2010) Switzerland
disposal, sludge from FeCl3 production, 30% water, to underground deposit
Waste 6.04E-01 kg 1999 Ecoinvent data V2.2 (2010) Germany
disposal, sludge from pulp and paper production, 25% water, to sanitary landfill
Waste 9.63E-01 kg 2000 Ecoinvent data V2.2 (2010) Switzerland
disposal, sludge from steel rolling, 20% water, to residual material landfill
Waste 3.29E-01 kg 2000 Ecoinvent data V2.2 (2010) Switzerland
disposal, sludge, NaCl electrolysis Hg, 0% water, to residual material landfill
Waste 3.29E-01 kg 2000 Ecoinvent data V2.2 (2010) Switzerland
disposal, sludge, NaCl electrolysis, 0% water, to residual material landfill
Waste 3.29E-01 kg 2000 Ecoinvent data V2.2 (2010) Switzerland
disposal, sludge, pig iron production, 8.6% water, to residual material landfill
Waste 3.29E-01 kg 2000 Ecoinvent data V2.2 (2010) Switzerland
disposal, solvents mixture, 16.5% water, to hazardous waste incineration
Waste 1.98E+00 kg 2000 Ecoinvent data V2.2 (2010) Switzerland
disposal, spent activated carbon with mercury, 0% water, to underground deposit
Waste 1.47E-02 kg 1999 Ecoinvent data V2.2 (2010) Germany
disposal, steel in car shredder residue, 0% water, to municipal incineration
Waste 4.51E-02 kg 2000 Ecoinvent data V2.2 (2010) Switzerland
disposal, steel, 0% water, to inert material landfill Waste 7.13E-03 kg 1995 Ecoinvent data V2.2 (2010) Switzerland
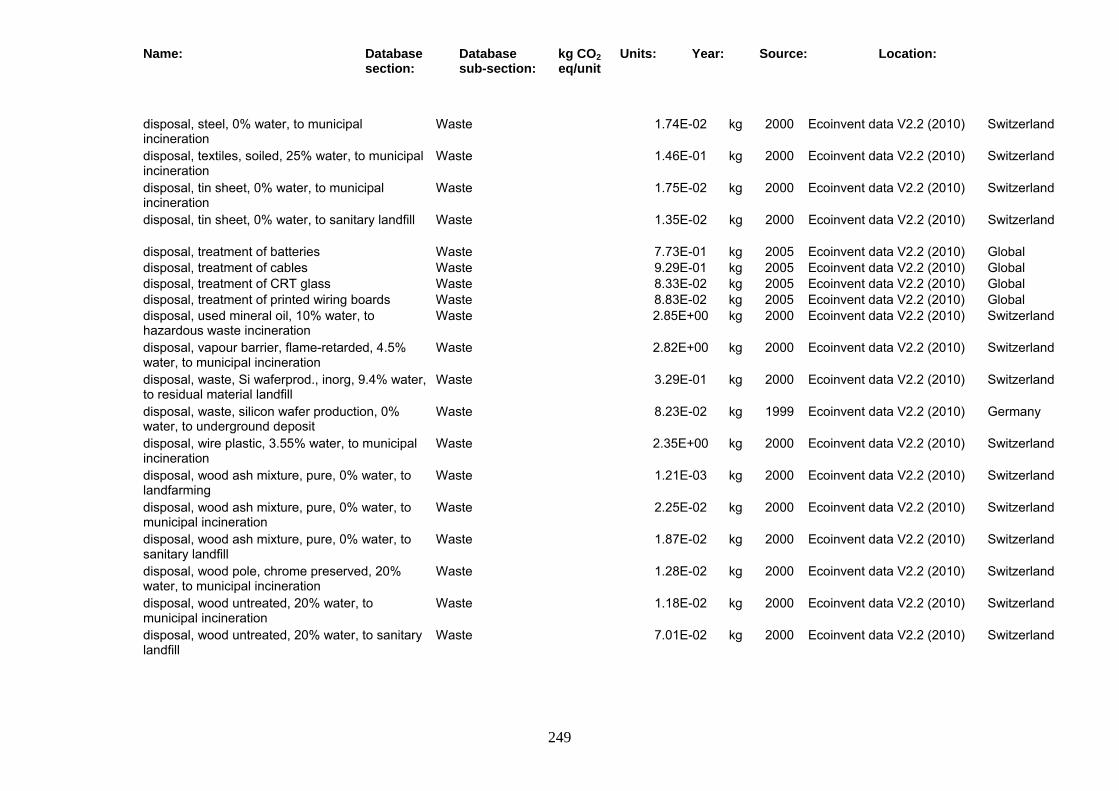
Name: Database section:
Database sub-section:
kg CO2 eq/unit
Units: Year: Source: Location:
249
disposal, steel, 0% water, to municipal incineration
Waste 1.74E-02 kg 2000 Ecoinvent data V2.2 (2010) Switzerland
disposal, textiles, soiled, 25% water, to municipal incineration
Waste 1.46E-01 kg 2000 Ecoinvent data V2.2 (2010) Switzerland
disposal, tin sheet, 0% water, to municipal incineration
Waste 1.75E-02 kg 2000 Ecoinvent data V2.2 (2010) Switzerland
disposal, tin sheet, 0% water, to sanitary landfill Waste 1.35E-02 kg 2000 Ecoinvent data V2.2 (2010) Switzerland
disposal, treatment of batteries Waste 7.73E-01 kg 2005 Ecoinvent data V2.2 (2010) Global disposal, treatment of cables Waste 9.29E-01 kg 2005 Ecoinvent data V2.2 (2010) Global disposal, treatment of CRT glass Waste 8.33E-02 kg 2005 Ecoinvent data V2.2 (2010) Global disposal, treatment of printed wiring boards Waste 8.83E-02 kg 2005 Ecoinvent data V2.2 (2010) Global disposal, used mineral oil, 10% water, to hazardous waste incineration
Waste 2.85E+00 kg 2000 Ecoinvent data V2.2 (2010) Switzerland
disposal, vapour barrier, flame-retarded, 4.5% water, to municipal incineration
Waste 2.82E+00 kg 2000 Ecoinvent data V2.2 (2010) Switzerland
disposal, waste, Si waferprod., inorg, 9.4% water, to residual material landfill
Waste 3.29E-01 kg 2000 Ecoinvent data V2.2 (2010) Switzerland
disposal, waste, silicon wafer production, 0% water, to underground deposit
Waste 8.23E-02 kg 1999 Ecoinvent data V2.2 (2010) Germany
disposal, wire plastic, 3.55% water, to municipal incineration
Waste 2.35E+00 kg 2000 Ecoinvent data V2.2 (2010) Switzerland
disposal, wood ash mixture, pure, 0% water, to landfarming
Waste 1.21E-03 kg 2000 Ecoinvent data V2.2 (2010) Switzerland
disposal, wood ash mixture, pure, 0% water, to municipal incineration
Waste 2.25E-02 kg 2000 Ecoinvent data V2.2 (2010) Switzerland
disposal, wood ash mixture, pure, 0% water, to sanitary landfill
Waste 1.87E-02 kg 2000 Ecoinvent data V2.2 (2010) Switzerland
disposal, wood pole, chrome preserved, 20% water, to municipal incineration
Waste 1.28E-02 kg 2000 Ecoinvent data V2.2 (2010) Switzerland
disposal, wood untreated, 20% water, to municipal incineration
Waste 1.18E-02 kg 2000 Ecoinvent data V2.2 (2010) Switzerland
disposal, wood untreated, 20% water, to sanitary landfill
Waste 7.01E-02 kg 2000 Ecoinvent data V2.2 (2010) Switzerland
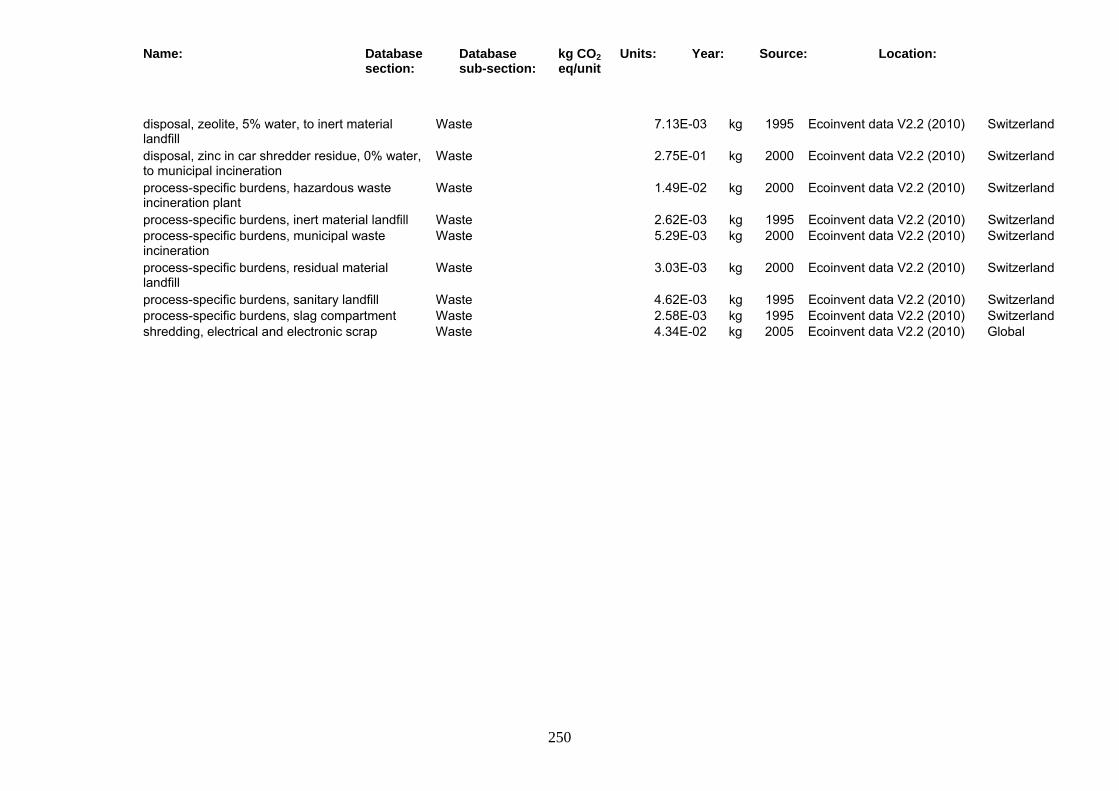
Name: Database section:
Database sub-section:
kg CO2 eq/unit
Units: Year: Source: Location:
250
disposal, zeolite, 5% water, to inert material landfill
Waste 7.13E-03 kg 1995 Ecoinvent data V2.2 (2010) Switzerland
disposal, zinc in car shredder residue, 0% water, to municipal incineration
Waste 2.75E-01 kg 2000 Ecoinvent data V2.2 (2010) Switzerland
process-specific burdens, hazardous waste incineration plant
Waste 1.49E-02 kg 2000 Ecoinvent data V2.2 (2010) Switzerland
process-specific burdens, inert material landfill Waste 2.62E-03 kg 1995 Ecoinvent data V2.2 (2010) Switzerland process-specific burdens, municipal waste incineration
Waste 5.29E-03 kg 2000 Ecoinvent data V2.2 (2010) Switzerland
process-specific burdens, residual material landfill
Waste 3.03E-03 kg 2000 Ecoinvent data V2.2 (2010) Switzerland
process-specific burdens, sanitary landfill Waste 4.62E-03 kg 1995 Ecoinvent data V2.2 (2010) Switzerland process-specific burdens, slag compartment Waste 2.58E-03 kg 1995 Ecoinvent data V2.2 (2010) Switzerland shredding, electrical and electronic scrap Waste 4.34E-02 kg 2005 Ecoinvent data V2.2 (2010) Global

251
Appendix 4 – Data quality criteria
A4.1 General about LCA data quality
According to PAS2050, the following data quality requirements should be considered when performing an LCA: time related coverage; geographical coverage; technology coverage; precision and accuracy; completeness; consistency; reproducibility; and sources of data (primary or secondary). Thus, data quality assessment is a complex task as multiple aspects need to be considered, including the context in which the data are used. Enough information on the data is therefore fundamental to avoid their misinterpretation or misuse.
A4.2 Data quality assessment in the CCaLC PVC tool
The quality of data within the CCaLC PVC tool can be defined by a user as: − High − Medium or − Low. To help the user determine whether their data are of High, Medium or Low quality, a methodology specific to the CCaLC PVC tool has been developed using the data quality criteria mentioned in the previous section. The criteria used in the methodology are summarised in Table A4.1. Table A4.2 shows how these can be aggregated to arrive at an overall Data Quality Indicator (DQI) - High, Medium or Low. For these purposes, each data quality criterion is assigned a weight of importance on a scale of 1-10. For example, as shown in Table A4.1, “Age of data” has the weight of 2, being twice as important as the geographical origin of data. Each data quality indicator is assigned (an arbitrary) maximum score for each criterion: e.g. the High indicator has a score of 3, Medium has 2 and Low has a score of 1 (see Table A4.2). Applying the weights of importance for each criterion and its maximum score for the respective quality indicators, the maximum score for each quality indicator is: − 30 for High; − 20 for Medium; and − 10 for Low. For the purposes of the analysis in the CCaLC PVC tool , the following score ranges have been adopted for the data quality assessment: − Low data quality: score in the range of 1-10; − Medium data quality: score in the range of 11-20; and − High data quality: score range of 21-30.

252
An example shown in Table A4.2 shows an overall score of 19, indicating Medium data quality (noting that the overall score for Medium quality is between 11-20). Table A4.1 Matrix of Data Quality Indicators (DQI) for the CCaLC PVC tool
Data quality indicators Data quality criteria High Medium Low
Age of data < 5 years 5 - 10 years > 10 Geographical origin of data
Specific Partly specific Generic/average
Source of data Measured and/or modelled based on specific data (e.g. the company data or from suppliers)
Modelled using generic data from LCA databases; some data derived using expert knowledge
Mainly sourced from literature and/or estimated and/or derived using expert knowledge
Completeness of data
All inputs and outputs considered
Majority of relevant inputs and outputs considered
Some relevant inputs and outputs considered or known
Reproducibility /reliability/ consistency of data
Completely reproducible/reliable/ consistent
Partly reproducible/reliable/ consistent
Not reproducible/ not known
Table A4.2 Aggregating individual Data Quality Indicators (DQI) to arrive at an overall DQI (High, Medium or Low)
Data quality criteria
Weighting for each criterion on a scale 1-10*
High quality
Max. score for each criterion: 3
Medium quality
Max. score for
each criterion: 2
Low quality
Max. score for each criterion: 1
Example data
quality assessment
Age 2 3 2 1 1 (Low) Geographical origin
1 3 2 1 3 (High)
Source 3 3 2 1 2 (Medium) Completeness 2 3 2 1 3 (High) Reproducibility /reliability/ consistency
2 3 2 1 1 (Low)
Maximum score
30 (max score)
Overall score for High in the
range: 21-30
20 (max score)
Overall score for Medium in the range: 11-20
10 (max score)
Overall score for Low in the
range: 1-10
19 (overall score) Data quality
indicator: Medium
*The sum of all weights is 10.

253
NB: The overall score of 19 has been calculated in the following way: Overall score = 2*1+1*3+3*2+2*3+2*1 = 19 Therefore the overall data quality indicator = Medium
It should be noted that the overall data quality will depend on both the quality of the particular datasets used by the user as well as on the confidence the user places on the quantity/amount of materials, energy etc. they are defining for each sub-system. For example, the quality of the background dataset for UK electricity mix and the related carbon footprint may be High; however, the user may not be confident in the data related to the amount of electricity used in a particular sub-system so that the quality of this datum may be Medium or Low. In this case, since the data quality for the set is already defined (as high), the user will only need to specify the quality for the quantity/amount and the tool will calculate the overall data quality for that particular sub-system. The process is repeated for each sub-system. The approach used for calculating DQI for a sub-system is shown in Table A1.3. Note that the quantity/amount is considered more important here than the quality of the dataset. Table A4.3 Aggregating the Data Quality Indicators (DQI) to arrive at an overall DQI for a each sub-system DQI for user-defined dataset*
DQI for the amount/quantity entered in the CCaLC tool by the user
Data quality of each sub-system (DQS)
High High High (3) Medium High High (3) Low High Medium (2) High Medium Medium (2) Medium Medium Medium (2) Low Medium Medium (2) High Low Medium (2) Medium Low Low (1) Low Low Low (1) *Note that the datasets already available in the tool have a predefined DQI so that the user only needs to define the quality of their own datasets. Once the data quality indicators have been calculated for each sub-system, a weighted approach is then applied for assessing the overall data quality of the whole system based on the percentage contribution of each life cycle stage to the total carbon footprint. The overall data quality for the whole system is therefore calculated as:
)(11
M
mm
N
nnCF DQSIDQ
where: DQCF - overall data quality of the system In – percentage contribution of each life cycle stage to the total carbon footprint (%)
254
DQSm – data quality (1, 2 or 3) for sub-system m For the purposes of the analysis in the CCaLC PVC tool , the following ranges have been adopted for the overall data quality of the whole system: − Low data quality: DQCF = 100 – 166; − Medium data quality: DQCF = 167 - 233; and High overall data quality: DQCF = 234 – 300.
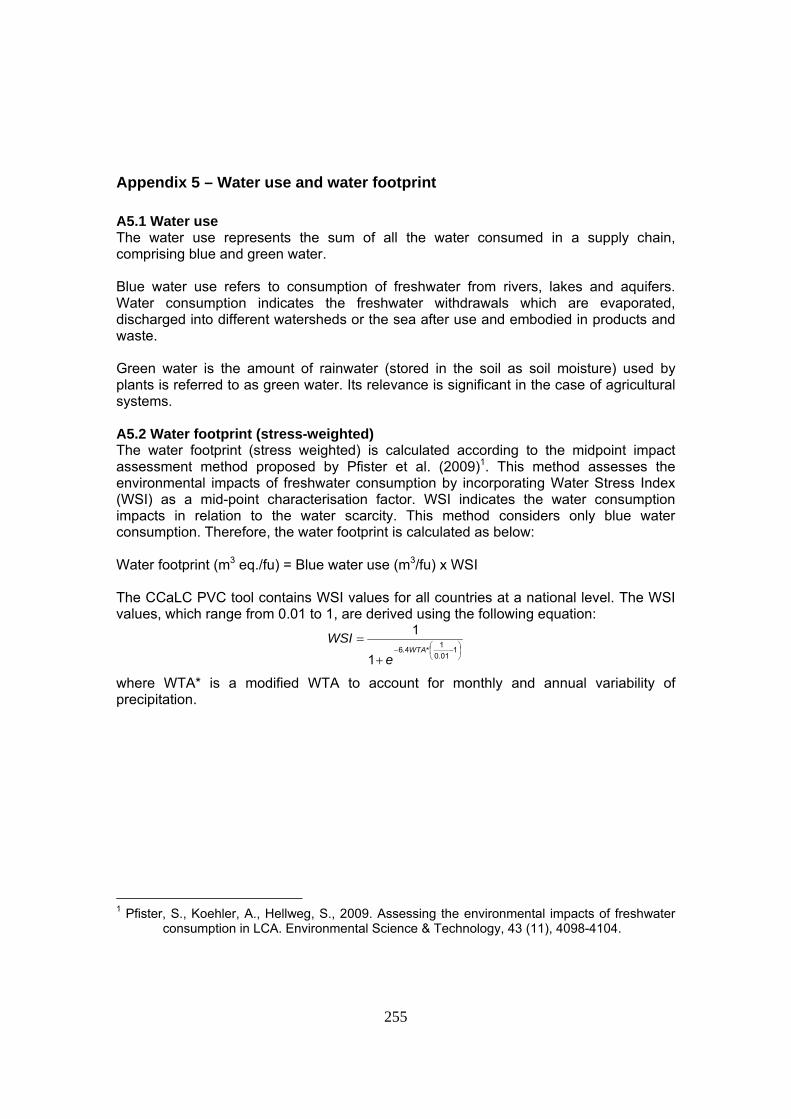
255
Appendix 5 – Water use and water footprint
A5.1 Water use The water use represents the sum of all the water consumed in a supply chain, comprising blue and green water. Blue water use refers to consumption of freshwater from rivers, lakes and aquifers. Water consumption indicates the freshwater withdrawals which are evaporated, discharged into different watersheds or the sea after use and embodied in products and waste. Green water is the amount of rainwater (stored in the soil as soil moisture) used by plants is referred to as green water. Its relevance is significant in the case of agricultural systems. A5.2 Water footprint (stress-weighted) The water footprint (stress weighted) is calculated according to the midpoint impact assessment method proposed by Pfister et al. (2009)1. This method assesses the environmental impacts of freshwater consumption by incorporating Water Stress Index (WSI) as a mid-point characterisation factor. WSI indicates the water consumption impacts in relation to the water scarcity. This method considers only blue water consumption. Therefore, the water footprint is calculated as below: Water footprint (m3 eq./fu) = Blue water use (m3/fu) x WSI The CCaLC PVC tool contains WSI values for all countries at a national level. The WSI values, which range from 0.01 to 1, are derived using the following equation:
1
010
146
1
1
.*WTA.
e
WSI
where WTA* is a modified WTA to account for monthly and annual variability of precipitation.
1 Pfister, S., Koehler, A., Hellweg, S., 2009. Assessing the environmental impacts of freshwater
consumption in LCA. Environmental Science & Technology, 43 (11), 4098-4104.