cca_transport sector_solomon islands
TRANSCRIPT

Climate change adaptation in the transport sectorGuidance manual for Solomon Islands
July 2014

Message from the Permanent Secretary
Transport infrastructure plays a vital role in the economy of the Solomon Islands, contributing approximately 13% to Gross Domestic Product. The Ministry of Infrastructure Development (MID) is mandated to provide and manage infrastructure and transport services throughout the Solomon Islands and has primary responsibility for roads, wharves and airstrips.
Recent weather events have highlighted vulnerabilities to some aspects of our transport network. Increasingly, risks to transport infrastructure and the services it provides will be impacted by projected changes to climate. For example our coastal roads are expected to be increasingly subject to coastal erosion from higher sea-levels, and projected increases in extreme rainfall will have substantial implications for the flood immunity of some of our bridges, and the effectiveness of drainage infrastructure.
Climate change will be one of a number of key drivers and constraints we have to manage and consider. It will rarely be the single most important key driver for service delivery, and infrastructure planning and operations. However it is important that the current and future risks to our transport network as a result of climate change are adequately considered and accounted for, both in the design of new infrastructure and the way we manage our current transport assets.
The future climate will remain uncertain. However, this does not mean that climate change cannot be ignored. This uncertainty will need to be actively managed.
This Guidance Manual represents the first systematic approach to integrate climate change into the design and development of transport infrastructure across the country. Over time, refinements in our approach to managing climate change will no doubt be required as we learn from our experiences, and ultimately improve the resilience of our transport network.
I encourage you to use and apply the information in this Guidance Manual as we work together to develop an integrated transport network that is safe, efficient, affordable, accessible, and economically and environmentally sustainable.
With these few words, I take pleasure in presenting the Guidance Manual for climate adaptation in the transport sector.
Moses Virivolomo Permanent Secretary Ministry of Infrastructure Development
1

Acknowledgements
The Ministry of Infrastructure Development’s (MID) work on climate change has been supported by the Australian Government through the Pacific-Australia Climate Change Science and Adaptation Planning (PACCSAP) Program. The PACCSAP program ($32 million, 2011- 2014) helps communities across the Pacific region to better understand and respond to climate change impacts, particularly in relation to infrastructure, coastal zone management and planning.
This guidance manual could not have been developed without the contributions of MID staff at all levels who provided their time and knowledge, testing the methodology across projects throughout the provinces. The input and assistance from the Climate Change Division within the Ministry of Environment, Climate Change and Disaster Management was also invaluable in developing the content. Many fruitful exchanges have been facilitated by the Asian Development Bank’s support through the Transport Sector Development Project and various advisors working for the Solomon Islands Government in the Central Project Implementation Unit at MID.
2 / Climate change adaptation in the transport sector. Guidance manual

ContentsMessage from the Permanent Secretary 1Acknowledgements 2Introduction 5
Why develop a Guidance Manual? 6How to use the Manual 8
Section 1 – Climate risks to the transport sector 9Strategic priorities 10Design and planning 10Construction 11Operations and maintenance 11Renewal and rehabilitation 12Ongoing monitoring 13Disposal 13
Section 2 – Adaptation Guide for Transport Infrastructure 15Step 1 - Screen for climate sensitivity 19
Background information – what is a hazard and risk 21Step 2 – Identify important climate risks 23
2.1 Identify potential risks (complete the risk screening matrix) 232.2 Identify key hazards for the project 262.3 Risks to road and bridge infrastructure 262.4 Risks to wharves 282.5 Risks to airports 282.6 Identify key project components at risk 292.7 Develop risk statements 30
Step 3 – Complete a risk assessment 333.1 Assigning the level of consequence 333.2 Determining the likelihood of risk 363.3 Determine the Risk Level 40
Step 4 – Prioritise the most important risks 41Step 5 – Consider management options 43
Overview of adaptation options 44Step 6 – Shortlist and appraise options 51
6.1 Shortlisting adaptation options 516.2 Appraising adaptation options 54
Monitoring and evaluation 61Section 3 – Tools and Resources 63
Appendix A1 - Climate Information 63Overview 63Temperature 65Annual average rainfall 66
3

Extreme rainfall events 68Sea level rise 69Tropical cyclones 70Storm surge 71Ocean acidification 73
Appendix A2 – Extreme rainfall projections 75Appendix B – Key Policies 79
Policy context for managing climate risk 79National Development Strategy 2011-2020 79National Adaptation Programme of Action 2008 79National Climate Change Policy 2012-2017 79Solomon Islands National Infrastructure Investment Plan 2012 79Operational context for managing climate risk 80National Transport Plan 80National Transport Fund 80MID Corporate Plan 81
Appendix C - Risk assessment tools 83Appendix C1 – Collecting local experiences 83Appendix C2 – Instructions for using risk spreadsheet 85Appendix C3 - Examples of risk statements 87Appendix C4 – Instructions for multi-criteria analysis template 89
Appendix D – Catalogue of adaptation option factsheets 91Appendix E – Economic Decision Support Tool Fact Sheets 119Appendix F - Glossary 127
4 / Climate change adaptation in the transport sector. Guidance manual

Introduction
The world’s climate is changing. The most recent Intergovernmental Panel on Climate Change (IPCC) assessment of the climate science concluded that:
Warming of the climate system is unequivocal, and since the 1950s, many of the observed changes are unprecedented over decades to millennia. The atmosphere and ocean have warmed, the amounts of snow and ice have diminished, sea level has risen, and the concentrations of greenhouse gases have increased.
[IPCC, 2013: Summary for Policymakers. In: Climate Change 2013: The Physical Science Basis. Contribution of Working Group I to the Fifth Assessment Report of the Intergovernmental Panel on Climate Change]
These changes are being experienced in the Solomon Islands, through increases in temperature and sea levels, changes in rainfall patterns and extreme events, and these impacts will continue to be felt across the coming decades. The impacts from a changing climate will affect communities, natural and built environments and the economy of the Solomon Islands unless we take steps to manage those impacts.
Transport infrastructure such as roads, bridges, airstrips and wharves, is likely to be sensitive to climate change because it is usually built to last for a long time. For this reason, the Solomon Islands Government has identified improving the resilience of key infrastructure to climate change and sea-level rise as a national goal in its National Transport Plan. Infrastructure plays a vital role in the economy of the Solomon Islands, contributing approximately 13% on average to Gross Domestic Product. If these assets are not designed to withstand future climate impacts, it is likely that losses from climate related hazards will increase in the future. An efficient national transport system, resilient to future climate events, will be better able to support the movement of goods and people, international and regional trade, and improve the reach and quality of essential government services.
This manual has been developed to provide step-by-step guidance to consider climate change in transport infrastructure design and management to reduce the economic and social costs to the Solomon Islands. Although some new transport projects have already incorporated climate risks into construction designs, the work to date has been part of specific projects, as opposed to a broader, systematic approach across the transport sector.
The approach presented in this guidance manual may also be a useful template for a range of other infrastructure types and for use in other sectors.
Figure 1: Flooding in Mberande
5

Project Need (e.g. from National Transport Plan)
Early Project Concept
Climate Change Screening
Climate Change Risk Assessment
Adaptation options development and appraisal
Engineering Development
Detailed Design, Procurement
Why develop a Guidance Manual?This manual supports the consideration of climate change in designing and maintaining transport infrastructure across the Solomon Islands. It aims to be a practical aid to Ministry of Infrastructure Development (MID) management staff, as well as to engineering, asset, and safeguards staff to reduce the longer term climate liabilities for MID.
Designing infrastructure for the future based only on past climate conditions may mean infrastructure fails more frequently or requires higher levels of maintenance and more frequently to maintain the service it provides.
Climate adaptation is best considered at the earliest stages of project development, when project concept designs are being developed. This allows the costs of climate adaptation to be kept to a minimum by integrating any necessary design responses into the early design. The alternative, or a ‘bolt on’ approach to climate adaptation, results in additional project measures being added to projects that have already been designed, with little integration and a higher chance of failure.
This guide has been developed to provide that early identification of climate risks.
Typically transport projects that need to consider climate change are those that have a long design life (generally more than 20 years), are already subject to weather-related hazards (for example, flooding or coastal erosion), or are important for the national economy.
6 / Climate change adaptation in the transport sector. Guidance manual

This guidance manual provides a step by step process and information to help:• identify climate risks • understand what the likelihood and consequence might be• identify options to manage the worst risks• evaluate and choose the most suitable options for dealing with future climate risks.
It is relevant to the design, construction and ongoing operation and maintenance of transport infrastructure and it considers impacts to physical infrastructure and the services the infrastructure provides to the community.
The methodology in this guidance manual is aligned with a formal risk-based approach that draws on the International Standard for Risk Management (ISO 31000:2009).
7

How to use the ManualThe manual has three sections.
Section 1: Climate risks to the transport sector discusses the climate risks to transport infrastructure and provides the policy context for the manual.
Section 2: Adaptation guide identifies a step-by-step approach to consider climate change in designing and maintaining transport infrastructure in the Solomon Islands.
Section 3: Tools and Resources contains practical information and tools that can help in the step by step process.
An excel spreadsheet has been developed to assist in the risk assessment methodology which is part of Section 2. The excel spreadsheet is available on a disk that accompanies this report and is designed to be used as a template for completing risk assessments. Instructions on using the spreadsheet, including screenshots, are contained in the appendices in Section 3 – Tools and resources.
This guide also includes case studies that help to illustrate examples of practical action.
Throughout this guide, key information is pulled out into prominent boxes to assist the user focus on different aspects throughout the process. The different types of signposts are described below.
Important information
Used to provide context and useful information throughout the document.
Reference materials
Identifies further resources and information that can assist throughout the climate risk assessment and adaptation process.
Case study
Illustrates key concepts through the use of case studies.
Stakeholder discussion point
Identifies times during the process where stakeholder workshops or discussions will be very useful for the project.
Tool box
Identifies further tools and resources available (including Appendices) to assist in the adaptation process.
8 / Climate change adaptation in the transport sector. Guidance manual

Section 1 – Climate risks to the transport sector
This section describes how climate risks can be considered in MID’s asset management process.
Traditionally, transport infrastructure design has been based on our understanding of the historical climate, but as our understanding of future change increases, the way we manage infrastructure must take this into account. A core element of effective asset management is to identify and respond to risks to service levels. This guidance manual provides guidance when developing new transport assets but can also be applied to existing assets. The following information provides an overview of how climate change should be considered throughout the asset management process.
Figure 2: Overview of a generalised Asset Management Process within MID
9

Strategic prioritiesThe priorities established at the national level through the National Transport Plan, the National Transport Fund, the National Infrastructure Investment Plan and the MID Corporate Plan set the focus for development and management of transport infrastructure in the Solomon Islands.
Key policies
Key policies guiding transport infrastructure development in the Solomon Islands and the consideration of climate impacts are summarised at Section 3, Appendix B.
Asset managers need to understand whether climate change impacts may affect the ability of MID to deliver on these priorities. It is therefore useful for MID to monitor the impacts of climate change on the whole of the transport network. Increasing impacts across the transport network may require MID to make decisions about its ability to maintain existing levels of service and asset performance, which may require an increase in expenditure on assets and operations or accept reductions in asset performance and in the level of service, which may minimise expenditure.
Documenting climate risks for new projects, upgrades and maintenance and the incremental costs of these improvements, will provide MID with information that can help in making strategic decisions about budget allocation and prioritisation of projects.
Design and planningInfrastructure design and planning ensures the asset can meet the identified priorities in the most cost effective manner.
This is the key focus of the Adaptation Guide in Section 2. The guide provides a consistent process that can be followed to consider climate change risks.
Use of the Adaptation Guide
The Adaptation Guide, outlined in Section 2 – should be used at the early design and planning stage for new assets, when project concepts are being considered. This will help to decide whether climate change should be accounted for in the construction process, and if so, what specific hazards and project elements need to be re-designed to cater for significant risks.
10 / Climate change adaptation in the transport sector. Guidance manual

In addition to direct impacts on transport infrastructure, climate change may affect the reliability of the transport infrastructure. For example, an increase in the frequency and intensity of extreme rainfall events could limit MID’s ability to guarantee service levels unless alternative transport options or upgraded infrastructure are established.
Climate change might also result in a change to the demand profile if communities move inland due to sea-level rise or flooding events render current settlements uninhabitable. Increases in demand may lead to network constraints, requiring the creation of new assets.
ConstructionAfter a project has been identified to be at risk from climate change impacts, adaptation options and possible designs identified through the Adaptation Guide should be investigated in detail at the construction phase, using information from previous projects to inform detailed drawings and specifications for construction. This will be subject to additional budget allocated for “climate proofing” planned improvements or new assets.
Operations and maintenanceOperations and maintenance relates to the ongoing running and upkeep of assets. This stage of the asset management cycle is an entry point for considering whether current operations and maintenance practices need to be modified in an attempt to reduce the possible impacts of climate change. This might include adjustments to the frequency of maintenance activities, or to the mix of reactive and preventative maintenance. In addition, the choice of materials and adopted maintenance standards may require modification. Operational practices might also need to be modified to reduce the impacts of climate change.
These changes will have financial implications for MID that will need to be considered in budgets. Climate impacts that may affect operations and maintenance practices include increased salinity in coastal areas (from higher sea levels and more frequent coastal inundation) that could increase the corrosion of structural assets. Maintenance costs for unsealed roads may also increase because of changes in rainfall intensity and frequency. The box below provides a useful case study on the impact of changing rainfall patterns on the maintenance costs of unsealed roads.
11

Case Study – Impact of rainfall patterns on maintenance costs for unsealed roads
Ramos-Scharron and MacDonald (2007) attribute about 80% of unpaved road degradation to rainfall, while the remaining 20% is attributed to factors such as the tonnage of traffic and traffic rates. On this basis, changes to maximum rainfall rates will have implications for maintenance costs and the design life of the unpaved road.
The increased rainfall leads to increased erosion, which in turn creates a need for increased maintenance to retain the original design life. To estimate the changes in road maintenance costs, the amount of erosion is used as a basis for determining the percentage of maintenance increase required. The calculation of the erosion rates for dirt and gravel roads is based on three factors: precipitation amount, traffic levels, and slope of the road. In terms of precipitation, studies indicate that a 1% increase results in an approximate 1% impact on the design life in a minimal slope condition with low traffic levels (Dubé et al. 2004). This is used as the base condition for maintenance calculations. However, this base case is augmented as traffic rates and slope percentages increase, resulting in significantly greater erosion rates.
Given this attribution to rainfall and the focus on retaining design lifespan, Ramos-Scharron and MacDonald’s research found that that base construction costs for unpaved roads increase by 80% of the total percentage increase in maximum monthly rainfall, rounded to one percentage point increments. For example, if the maximum monthly rainfall increases by 10% in a given location, then an 8% (0.8 x 0.1 = 0.08) increase in base construction costs is assumed.
Building on this approach, changes in unpaved road maintenance costs are associated with a 1% change in maximum monthly rainfall. As indicated above, 80% of road degradation can be attributed to rainfall, while the remaining 20% is due to traffic rates and other factors. This implies that unpaved road maintenance costs increase by 0.8% with every 1% increase in the maximum monthly rainfall values projected for any given year.
Renewal and rehabilitationAsset managers are required to assess whether it is necessary to renew or rehabilitate assets to maintain their condition and performance. These decisions should be made considering asset lifecycle costs.
When choosing whether to renew or rehabilitate, it is important to consider whether climate change will have an impact on the life expectancy of existing assets. While it may have been cost effective to rehabilitate certain assets in the past, increases in maintenance and rehabilitation costs may mean that it is more cost effective to replace or renew the asset.
The process in Section 2 can assist in this decision-making process, by framing the assessment around the likely risks to the asset within the remaining effective asset life.
12 / Climate change adaptation in the transport sector. Guidance manual

Ongoing monitoringMonitoring throughout the life of assets is required to keep track of the performance of assets and to identify under-performing assets. For example, asset condition deterioration profiles may change where assets are exposed to more extreme conditions. Where assets are sensitive to climate change, and measures to mitigate the impacts of climate change have been identified, the effectiveness of these measures should be monitored throughout the life of the asset.
As noted in the earlier section on strategic priorities, measuring the performance and condition of individual assets also provides information that can inform future decisions about appropriate levels of service and expected costs of infrastructure for strategic planning.
DisposalNo specific climate change entry points have been identified for the disposal phase of the asset lifecycle.
13

14 / Climate change adaptation in the transport sector. Guidance manual

Section 2 – Adaptation Guide for Transport Infrastructure
This guide provides a step-by-step risk management framework to identify risks to transport infrastructure projects and options to manage the risks. It provides a consistent and systematic approach to considering climate change risks that can be improved over time.
It will guide the user through a process to:
1. Screen for climate sensitivity
2. Identify important climate risks
3. Complete a risk assessment
4. Prioritise important risks
5. Consider management options
6. Shortlist and appraise options
The manual has been developed to guide planning for new transport assets but it can also be applied to existing assets.
Work through the steps, answering questions and completing the tasks in each step.
Make sure you have completed each step by referring to the checklists.
Be clear about the information, assumptions and judgments you base your decisions on, so you can monitor and evaluate over time.
Keep a full record of your responses so that others can understand your decision-making.
15

Figure 3: Overview of the step-by-step climate adaptation process
2
3
1
Consultation Tools Steps Approval
16 / Climate change adaptation in the transport sector. Guidance manual

Stakeholder consultation – essential for risk management
Talking with stakeholders is important. The development of this guideline has benefitted from consultation with key stakeholders including those from MID and MECDM to form the context for the risk assessment, and to describe key climate hazards relevant to transport infrastructure.
Giving and receiving information should occur throughout risk management activities. It can assist with identifying and analysing risks, and in considering which risk treatment solutions are most appropriate. It is good to consult widely; different stakeholders have diverse skills, experience, and perceptions of risk, and can contribute important perspectives to the risk management process.
The Central Project Implementation Unit has published a Communications & Consultation Plan (CCP), which identifies stakeholder consultation should be carried out with:
– internal MID engineers and Project Managers – other relevant Ministries, for example, Ministry of Lands or Ministry of
Environment – local landholders, through MID safeguards staff – industry stakeholders who may be affected by transport infrastructure, for
example, airline operators or local agriculture operations.
It is useful to identify early in the process, how, when and who you are going to consult with. This consultation plan should be developed in collaboration with implementing partners and it should discuss how the analysis results will be made accessible to support decision making and general awareness raising, for both technical and non-technical audiences.
17

Different target groups (for example, other Ministries, businesses, communities, women and children) and different communication vehicles (for example, workshops, reports, summary sheets and fact sheets) should be considered to ensure that the people affected by and accountable for implementing the risk management process each understand the basis on which decisions are made and have the opportunity to contribute to the decision-making process. Reporting of the process can also be useful as part of developing a Feasibility Report for a project.
Stakeholder consultations should be held at least three times in the risk assessment process – first of all as part of risk screening to identify whether a site is sensitive to climate impacts (step 1), secondly to complete the risk assessment if the site is considered sensitive (step 3), and thirdly to shortlist and appraise treatment options where high risks are identified (step 6). See Figure 3 above to see where consultations should be held as part of the risk management process.
18 / Climate change adaptation in the transport sector. Guidance manual

Step 1 - Screen for climate sensitivityThe first step is to decide whether a project is sensitive to climate change or not.
If a project is sensitive to climate hazards, Steps 2-6 of this guide help you to work through a process to better understand the risk and identify management options.
If the project is not sensitive to climate change it can proceed as usual.
The sensitivity of a project is largely determined by:• the design life of the asset – longer lived assets will be more exposed as changes to the climate will
become more pronounced over time• whether the project is located in an area that is sensitive to climate hazards – for example if a site is
already prone to erosion or flooding impacts it may be more sensitive to future climate change• the design standard – for example assets that need to perform during more extreme events are likely
to be more sensitive to small changes in the climate
Projects that have a shorter design life, for example less than 10 years, will be less sensitive to changes in the climate. An example would be an unsealed road rehabilitation with no major drainage structures, located inland on relatively flat land and with a design life less than 10 years. Assets with short design lives generally would not require further screening.
At the other end of the spectrum, a wharf project with a long design life of 50 years should consider climate change due to the project’s intended long lifespan, and also the fact that rising sea levels could affect both the wharf itself and the maritime traffic that use it. For this process, if an asset is expected to last more than 20 years, then the project can be assumed to be sensitive and should undergo a further screening and proceed to Step 2.
For projects that have a design life between 10-20 years, expert judgment will be required to decide if it may be sensitive to changes in the climate (and require further assessment using this guidance manual) or if it is not likely to be sensitive to changes in the climate and therefore doesn’t require any further action. In that case it may be helpful to consider broader issues such as the proposed location of the asset. The proposed location of a new project may increase the sensitivity of the design standard to small changes in climate. For example, if there is evidence of historical coastal flooding in a project area, then small increases in sea level will increase the likelihood of this occurring in the future.
19

The influence of design life on climate risks
An unsealed road rehabilitation might be expected to have a design life of 10 years, whereas an important bridge carrying a high volume of traffic might have a design life of 25 years or more. Climate change risks are expected to be higher the longer the design life of a project is.
Table 1 identifies issues to consider when assessing the sensitivity of a project to climate change. If more than one of the climate risk indicators is identified as ‘more sensitive’ to climate risk, then generally that project should undergo further assessment and Step 2 of this guidance manual should be completed. If there is any doubt, then it is best to assume that the project may be sensitive to climate change and proceed to the next step.
Table 1: Qualitative indicators of sensitivity to climate change
Not sensitive Unsure? Sensitive
Design life < 10 years 10-20 years >20 years
Coastal inundation Has been inundated before
Height above mean sea level (road project)
Less than 2 m
Proximity to the shoreline
Less than 100 m
Future traffic volumes Increasing
Adjacent land slopes More than 15 degrees
Flooding Has been flooded in the past
Bridges Project has bridges over large catchments
(larger than 4 km2)
Proceed as usual If NO to all If YES to any
Proceed to STEP 2
No need for further climate risk assessment
Identify important climate risks
20 / Climate change adaptation in the transport sector. Guidance manual

Case study – Is a new road sensitive to climate?
During the development of the guidance manual, a number of workshops were held to test and refine the approach presented here. One of the workshops had the following example as a test to determine whether a detailed risk assessment is required. The example read:
‘… a new road is planned to link a village up in the hills to an existing road on the coast, 5 km away. The concept design does not show the crossing of any watercourses, but the road will pass by some steep slopes. The road is planned to be unsealed with a design life of less than 10 years.
The example prompted spirited discussion about whether this project is sensitive to climate change. The project really only has one aspect in the ‘more sensitive’ category: steep slopes, and may not require a consideration of climate change. However, given it is a new road, alignment decisions will likely persist for many decades. This is despite the fact the pavement design life might be 10 years or less. While there is no right or wrong answer in pre-screening, this example highlights that some discretion is needed in determining the results of the pre-screening exercise.
Checklist for Step 1
Have you identified how long the asset is expected to provide services (e.g. set a design life)?
Have you consulted with stakeholders – other MID engineers, planners, social safeguards, local landholders, if appropriate?
Have you identified whether the proposed location is already sensitive to climate risks eg does it have a history of flooding etc?
Have you identified the key reasons why the project is sensitive to climate change? For example, as a result of the long design life, proximity to the coast, or as a result of a history of flooding in the project area? (This information can assist with Step 2)
Background information – what is a hazard and risk
Before identifying specific risks to transport infrastructure in Step 2, it is important to understand the relationship between climate hazards, the exposure of project components to the hazards, and the potential consequences/impacts. These consequences will be combined with an estimate of likelihood to evaluate risks in Step 3. Different project types may be subject to different climate hazards, and therefore different impacts and risks. The diagram below provides an indication of this relationship, with two examples looking at sea level and rainfall.
21

Hazard is a potentially damaging physical event that may cause loss of life or injury, property damage, social and economic disruption or environmental degradation. In the context of the impacts of climate change on transport infrastructure, the main hazards are natural hazards that can be made worse by changes in the climate system, for example coastal erosion that is made worse by rising sea levels or flood events which could be made worse by more intense rainfall.
The occurrence of a given hazard results in a risk situation when assets, human life or socio-economic values are potentially exposed. The consequences or impacts of a hazard event will depend on both the type of assets exposed and the nature and strengths of the hazard.
Risk is defined as the possibility that a damaging event could occur. Risk can also be expressed as a set relationship between the consequence of a hazard event on the assets / values exposed and the likelihood of an event occurring. For the purposes of this guide, the latter definition will be used as part of the step-by-step assessment guide in Step 3.
In the case of MID, a risk represents something that can impact on the ability to provide services from transport infrastructure and broadly fulfil Solomon Islands Government policy.
When considering risks to transport infrastructure it is important to consider risks not only to the infrastructure itself, but also risks to the service that the infrastructure provides, often described as the level of service. A simple example of this is severe erosion affecting the approach to a bridge; although this might be a relatively minor impact to the infrastructure itself, it can cut an important transport link, and as a result cut off the community from key health and education services, and also impact industry trying to move goods and services. The impacts would be significantly larger were they to occur in Honiara, compared to a rural road.
Consequence or Impact
Chance or Likelihood Risk Level
22 / Climate change adaptation in the transport sector. Guidance manual

Step 2 – Identify important climate risksIf initial screening undertaken in Step 1 has identified a project may be sensitive to climate change, the following steps in this guide will help you identify which climate risks are likely to have the biggest impact on the project and what management options are available.
Step 2 focuses on:• identifying potential risks
– identifying key climate hazards that could impact the planned infrastructure – identifying key project components of the planned infrastructure
• developing risk statements that describe the scenario and possible consequences of hazards impacting the project.
2.1 Identify potential risks (complete the risk screening matrix)
This step helps you document the climate risks that might affect the project.
It is important to recognise that not all of the risks identified will affect the entire project. For example, risks relating to inundation from sea level rise will only apply to those areas of the project considered low lying. In the same way, risks from flooding and debris loading may only apply to the larger bridges over major watercourse crossings.
Recent efforts to understand how climate change may affect existing climate hazards have indicated that during the 21st century, the Solomon Islands are expected to experience:• continued rising sea levels• an increase in annual and seasonal mean rainfall• an increase in frequency and intensity of extreme rainfall events• an increase in surface air and sea-surface temperatures, and an increase in the intensity and
frequency of days of extreme heat• continued ocean acidification• a general decrease in the number of cyclones, but an increase in the proportion of the most severe
cyclones.
23

The observed and projected climate changes in the Solomon Islands are summarised in Figure 4 below.
Figure 4: Summary of observed and projected weather and atmospheric changes in the Solomon Islands
Historic trend Projected (2030) Projected (2090)
Rainfall Mean rainfall No statistical trend (-1% to +7%)1 (-7% + 20%)1
Extreme rainfall
No statistical trend (+9 mm for 1:20 year event)2
(+43 mm for 1:20 year event)2
Temperature Mean Temperature
(annual mean temperatures up 0.16°C/ten years)
(up to 1°C)3 (up to 4°C)3
Sea Ocean acidity (Aragonite saturation)
(currently about 3.9)
(about 3.5)4 (about 2.5)4
Storm surge Historically, storm surges of up to 1.5 m have been experienced. Without future projections, these values could be expected in the future, in addition to the expected sea-level rise.
Sea-level rise (about 0.8 cm per year)
(up to 18 cm)5 (up to 89 cm)5
Atmosphere CO2 (almost 400 ppm as at end 2013)
Up to 449 ppm6 Up to 935 ppm6
Wind Tropical cyclones
Approx 10 per decade within 400 km of Honiara
(number of cyclones)
(cyclone intensity)
A risk screening matrix will help you identify which risks affect which parts of the project. There is a worked example below to illustrate how the screening matrix should be filled out.
A template for you to use to document the potential risks to project components is at Appendix C.
1. RCP8.5
2. Mean change under the RCP8.5 scenario for rainfall within a 24 hour period
3. RCP8.5
4. RCP8.5
5. RCP8.5
6. Riahi, K. Gruebler, A. and Nakicenovic, N. (2007). Scenarios of long-term socio-economic and environmental development under climate stabilization. Technological Forecasting and Social Change 74, 7, 887-935 in M. Meinshausen, S. Smith et al. “The RCP greenhouse gas concentrations and their extension from 1765 to 2500” (2011), Climate Change, Special RCP Issue.
24 / Climate change adaptation in the transport sector. Guidance manual

Identifying sources of risk When identifying risks it is important to document the possible sources of risk in addition to known events and circumstances that could affect operation of the transport infrastructure or service delivery – this can help inform more detailed risk assessment and adaptation measures down the track.
You will need to identify the climate hazards and the main project components at risk and then assess the strength of the potential impact for each component. There is guidance material in parts 2.2 and 2.3 of this step to help you identify the potential hazards and the project components.
In the risk screening template, you will need to choose the relevant project components (e.g. unsealed pavements, major watercourse crossing and longitudinal drains) and the relevant climate hazards for the project location. For each hazard, relationships between the project aspects need to be assessed as either ‘Strong’ (indicated by red boxes), ‘Potential’ (indicated by green boxes) or ‘No relationship’ (indicated by yellow boxes).
Any changes that might occur, in circumstances for the asset or associated services and areas of impact, should be considered. If there is uncertainty in the relationship between a climate variable and an aspect of the project, then a potential relationship should be assumed.
An example of how this template could be completed is provided below in Table 2.
Table 2: Example of a screening matrix looking at potential risks to a coastal road project
Strong relationship x
Potential relationship (or uncertain) x
No apparent relationship -
Sea Rainfall
Project Component Sea-level rise Storm surge
Annual average rainfall
Extreme rainfall
events and flooding Drought
Major watercourse crossings (bridges)
x x x x -
Sealed pavements x x x x -
Unsealed pavements x x x x -
Minor watercourse crossings (culverts)
x x x x -
Road corridor (obstructions) - x - x -
25

2.2 Identify key hazards for the project
To help identify the climate hazards that could impact the infrastructure being planned, the tables below identify general risk situations affecting roads and bridges, wharves and airports.
Look through the list of hazards for the type of asset you are considering and identify the hazards and impacts that you think are relevant for your project. You will need this information to fill out the risk matrix.
Tool box
For help identifying key hazards please refer to informative provided in Appendix A1 - Climate Information. This section provides an overview of the climate trends and observations as well as some of the key climate change projections affecting transport infrastructure.
2.3 Risks to road and bridge infrastructure
The main threats to roads and bridges are from an increase in extreme rainfall and storm events, as well as sea-level rise. Extreme rainfall can cause flooding or landslides that damage or destroy road sections and rising sea levels may worsen damage from coastal erosion, storm surge and coastal flooding and may lead to inundation.
Roads in upland areas with steep topography, and coastal roads vulnerable to coastal erosion and storm surge are likely to be particularly vulnerable. Projected increases in extreme rainfall will also have implications for the flood resilience of bridges and the effectiveness of drainage infrastructure. An issue which also affects bridges in Solomon Islands is the incidence of large-scale logging which destabilises soils and can contribute large loads of debris. The impacts are compounded by changes to the frequency and intensity of rainfall events. Table 3 summarises potential climate impacts to road infrastructure.
26 / Climate change adaptation in the transport sector. Guidance manual

Table 3: Summary of potential impacts to road infrastructure
Climate Hazards Potential impact to road infrastructure
Location
Increased frequency and intensity of extreme rainfall
• Can increase the rate of deterioration of unsealed roads, and therefore reduce the effective design life of assets, or increase periodic maintenance costs.
• Can cause more frequent flooding events than historically experienced, leading to impacts for bridges and drainage infrastructure.
• Can lead to greater occurrence of landslides blocking roads - Increased need for emergency management as communities become isolated after flooding events.
Upland areas with steep topography
Areas close to river crossings
Areas vulnerable to flooding
Continued sea-level rise • Will worsen coastal erosion and affect assets already close to the wave zone.
• Will worsen the effects of storm surge.
• Could permanently inundate some assets.
Coastal roads with low elevation
Increased intensity of tropical cyclones
• Increased debris on road corridor
• Storm surges associated with cyclones will affect coastal roads and infrastructure.
South eastern parts of the country in particular
27

2.4 Risks to wharves
Wharves typically have a design life of 50 years. During this time the effects of continued sea-level rise will affect the utility of the wharf and the impacts from storm surges may also be increased.
Table 4: Summary of potential impacts to wharves
Climate Hazards Potential impact to wharves
Continued sea-level rise • Reduced ability of some maritime traffic to use the wharf
• Decreased effectiveness of existing coastal protection measures, and therefore increased area of coastal erosion- Reduced effective design life of existing wharves
Tropical cyclones • Rough seas san reduce ability of maritime traffic to reach wharves
• Can result in large storm surges which may adversely impact on the stability of wharf structures.
2.5 Risks to airports
Within the Solomon Islands there are three airports with sealed runways. The remaining runways are unsealed. The majority of airports are located within close proximity to the coastline and may be subject to impacts from sea-level rise and coastal erosion. Some of the low lying airstrips may be subject to temporary or permanent inundation which would significantly impact on the utility of the asset.
As there are no plans to develop new airports, the majority of climate change risks to airports revolve around ongoing operation and maintenance. Impacts from cyclones could result in safety issues and even closure of airstrips as a result of debris obstructing the runways. Further investments in the monitoring and maintenance of these assets will address these risks to some extent.
Table 5: Summary of potential impacts to airports
Climate Hazards Potential impact to airports
Continued sea-level rise • Decreased effectiveness of existing coastal protection measures, and therefore increased area of coastal erosion
• Reduced effective design life of some existing airports
Increase in frequency and intensity of tropical cyclones
• Can reduce the ability of air traffic to reach airports on account of weather conditions, and likelihood of debris obstructing the runway
• Temporary closures as a result of temporary inundation from storm surges (combined with sea-level rise)
Increase in the frequency and intensity of extreme rainfall
• Damage to airstrips due to increase in soil moisture content and inadequate drainage to cope with extreme rainfall events
28 / Climate change adaptation in the transport sector. Guidance manual

Site visits and local knowledge assist in identifying risks. Refer to Appendix C1 - Collecting local experiences for more information about community consultation.
The best way to gain an understanding of these issues is to complete a site visit, and use the results of the safeguards consultation activities with the local community.
For coastal projects, it is useful to see the influence of current high tides on the location of proposed infrastructure. This can assist the project team make an informed evaluation of potential future impacts from rising sea levels, both in terms of impacts to proposed infrastructure and impacts to existing local communities. http://www.bom.gov.au/australia/tides/#locations-offshore provides a good resource for tide information for specific areas across the Solomon Islands.
Appendix C1 provides example questions that can be incorporated into community and stakeholder consultation activities early in the project development to assist in the climate risk assessment process and concept design.
2.6 Identify key project components at risk
Different components of the infrastructure asset are likely to be impacted by different hazards. Systematically considering all the different components against the potential hazards will ensure you have thought about the full scope of impacts.
The following table provides a list of the types of components in transport infrastructure projects.
Table 6: Key aspects of infrastructure to be considered during risk identification
Aspect Description
Road Projects
Minor watercourse crossing
Watercourse crossings of catchments smaller than 4 km2 and minor drainage infrastructure, e.g. pipes and minor culverts.
Major watercourse crossing
Structures built to cross waterways that drain catchments greater than 4 km2, e.g. major bridges. Includes approaches and embankments.
Low lying pavement (sealed or unsealed)
Low lying pavements can be defined as areas of a project likely to be subject to coastal inundation, either temporary or permanent. Typically this should apply to areas that sit at or below high tide levels, including expected sea-level rise over the life of the asset.
Road corridor Relates to the road alignment, and the ability of traffic to effectively use the road. Any obstructions in the road corridor could limit the ability of traffic to use the road, and thereby reduce the level of service of the project, for example storm debris, or landslide material.
29

Unsealed pavements Road pavement that is finished with a combination of gravel, dirt or coronous material.
Sealed pavements Road pavement that can be finished with a chip seal, concrete or asphalt.
Cuttings and embankments
Areas of the road that as a result of steep topography have either been cut into a hillside or where the road formation is resting on an embankment.
Longitudinal drains Areas that run alongside the road intended to manage surface water generated after rainfall events.
Wharf projects
The wharf deck Including the piles and supporting structure
Causeway and approach jetty
This component of the project is the key element facilitating land access to the wharf itself
Coastal protection Combination of natural features and engineered structures that contribute to the protection of the approach jetty and causeway from coastal erosion
Sea access The ability of maritime traffic to approach and use the wharf
Navaids Any type of infrastructure that helps a maritime vessel in navigation during sea travel, docking or departing a wharf facility, including buoys or lighthouses.
Airport Projects
Sealed runway The area where an aircraft lands or takes off consisting of asphalt or concrete.
Unsealed runway The area where an aircraft lands or takes off consisting of dirt, grass or coronous material, or a combination.
Air traffic control and/or navaids
Any type of infrastructure that helps the aircraft in navigation during takeoff, land or cruising, including buoys, beacons or traffic control towers.
Airside apron Aircraft aprons are the areas where the aircraft park.
Landside access The way passengers arrive at the airport and proceed through to boarding a plane (in some cases this involves landing at a wharf, while in most other cases it involves arriving via land)
Fuel storage The area where jet fuel is stored, and the method for receiving, using and disposing of fuel.
2.7 Develop risk statements
Once you have completed the risk matrix, you need to develop risk statements for any of the risks that have been identified as ‘strong’ or ‘potential’ relationships. The risk statement should be descriptive and define the risk’s current or possible condition, and undesired consequence. It should be written in condition - consequence format. That is, given a condition, there is a possibility that a consequence may occur.
For example, the relationship between ‘sea-level rise’ and ‘unsealed pavements’ could be developed into the following risk statement: ‘Continued sea-level rise causes coastal erosion which impacts unsealed pavement within the project area’. These risk statements should then be recorded in the Risk Spreadsheet, available on disk and illustrated in Appendix C2).
30 / Climate change adaptation in the transport sector. Guidance manual

The risk statements form the basis of the risk assessment process that takes place in Step 3. Use the results of the screening exercise as a cross check that each issue has an identified risk statement. There may be more than one risk statement for each issue. Likewise, there may be one risk statement that considers a range of issues.
Example risk statements
A number of risk statements have been prepared for different infrastructure projects – roads, airports and wharves. These sample statements can be found in Appendix C3.
Risk spreadsheet template
These risk statements should then be recorded in the Risk Spreadsheet template illustrated in Appendix C2.
Checklist Step 2
Do you understand the difference between climate hazards and risks?
Have you identified all climate hazards that could affect the project area? Have you conducted a site visit?
Have you identified all project aspects (including both physical components and service objectives) that may be at risk from specific climate-related hazards?
Have you identified all relationships between the project aspects and the climate hazards by completing the matrix?
Have you developed risk statements, using the examples in Appendix C3, to cover all ‘strong’ and ‘potential’ relationships?
31

32 / Climate change adaptation in the transport sector. Guidance manual

Step 3 – Complete a risk assessment This step assigns a level of risk to each of the potential risks identified in Step 2.
It is a good idea to complete the risk analysis, to assign levels of risk, in a workshop format or with input from other staff.
This step involves:• assigning the level of consequence• determining the likelihood • determining the risk level
Risk management is a common practice used around the world. In the context of this guidance manual, the term ‘risk’ is defined as the possibility that an event could occur, which could impact MID’s ability to provide services from transport infrastructure. It is expressed in terms of a combination of the consequences of an event and the associated likelihood or probability that it will happen.
In simple terms, this process exists to identify the risks most threatening to a project and, as a result, most important to MID. Generally, high or extreme risks need to be addressed, while medium or low risks can be accepted as part of day-to-day operations.
Different risk perceptions and the value of risk workshops
Different stakeholders often have different perceptions on the nature of risks. If, during consultation, stakeholders have expressed any concerns regarding the impacts of climate variability and climate change on the project, they should be included and considered in the climate risk assessment process.
Calculating risk levels
Appendix C2 provides guidance on using the excel spreadsheet template developed to support the risk analysis for any project. Use this template (provided as a separate file on an accompanying disk to this report) to select the consequence and likelihood values for each risk statement. The risk level is then automatically calculated.
3.1 Assigning the level of consequence
A set of standard definitions for consequence ratings has been developed to reflect the key priorities of MID. The standard consequence ratings cover:• infrastructure impacts, and implications for levels of service• financial loss as a result of potential impacts and associated replacement or maintenance costs.• reputational impacts to MID, or the Solomon Islands Government
Consequence or Impact
Chance or Likelihood Risk Level
33

• livelihood impacts on local communities that depend on transport infrastructure• health/safety impacts on local communities and workers alike• industry impacts as a result of disruption to critical transport infrastructure
For each risk statement, a level of consequence of minor, moderate, major or catastrophic risk needs to be assigned. Table 7 provides an indication of how users could rate the potential consequences of a variety of risks.
Where multiple consequences could result, choose a level that corresponds to the most significant consequence. For example, if a scenario potentially involves minor consequences to reputation, but major consequences from an infrastructure and livelihood perspective, the risk should be characterised as ‘major’.
The ratings should reflect the causes of risk, their positive and negative outcomes, and any factors that could affect the consequences. For example, factors affecting consequence might include if the risk event was to occur at different times of the year, or at low tide or high tide.
Once a final consequence rating has been assigned it needs to be documented in the Risk Spreadsheet. During this step it is useful to document the thought process in the space provided in the Risk Spreadsheet titled ‘Consequence Statement’.
Table 7: Consequence levels to be applied in the risk assessment process
Rating of potential consequence
Descriptions of potential loss or damage
Insignificant
Infrastructure: No infrastructure damage.
Financial Loss: Asset damage < $ 100K SBD.
Reputation: Some public awareness.
Livelihoods: Negligible or no impact on the livelihood system.
Health/Safety: Negligible or no changes to the public health profile or fatalities as an indirect result of extreme events.
Industry: Any impacts can be absorbed within existing systems.
Minor
Infrastructure: Localised infrastructure service disruption / No permanent damage / Some minor restoration work required.
Financial Loss: Asset damage between $100K SBD and $500K SBD.
Reputation: Some adverse news in the local media / Some adverse reactions in the community.
Livelihoods: Isolated and temporary disruption to an element of the livelihood system.
Health/Safety: Slight changes to the public health profile or isolated increases in fatalities as an indirect result of extreme events.
Industry: Isolated and temporary disruption to a key economic element.
34 / Climate change adaptation in the transport sector. Guidance manual

Rating of potential consequence
Descriptions of potential loss or damage
Moderate
Infrastructure: Widespread infrastructure damage and loss of service / Damage recoverable by maintenance and minor repair / Partial loss of local infrastructure.
Financial Loss: Asset damage between $500K SBD and $2 million SBD.
Reputation: Adverse news in media / Significant community reaction.
Livelihoods: Localised and temporary disruption to an element of the livelihood system, leading to the requirement of supplemental inputs.
Health/Safety: Noticeable changes to the public health profile or localised increases in fatalities as an indirect result of extreme events.
Industry: Short-term and localised disruption to a key economic element.
Major
Infrastructure: Extensive infrastructure damage requiring extensive repair / Permanent loss of local infrastructure services.
Financial Loss: Asset damage between $2 million SBD and $5 million SBD.
Reputation: Damage to reputation at national level; adverse national media coverage; Government agency questions or enquiry; significant decrease in community support.
Livelihoods: Widespread and reversible or localised and permanent impacts to core elements of the livelihood system.
Health/Safety: Marked changes in the public health profile or widespread increases in fatalities as an indirect result of extreme events.
Industry: Widespread and reversible or localised and permanent disruption to a key economic element.
Catastrophic
Infrastructure: Permanent damage and/or loss of infrastructure service / Retreat of infrastructure.
Financial Loss: Asset damage > $5 million SBD.
Reputation: Irreversible damages to reputation at the national and even international level / Public outrage.
Livelihoods: Core elements of the livelihood system are permanently impacted.
Health/Safety: Substantial changes to the public health profile or substantial increases in fatalities as an indirect result of extreme events.
Industry: Widespread and permanent disruption to a key economic element.
35

Calculating consequences
Sometimes the immediate impact on a piece of infrastructure from a given risk may be of less importance than the wider consequences that can result. For example the washout of a bridge approach, while being a localised impact in itself, could cause wider impacts to communities and business that become cut off from the rest of the road network. Therefore, where the risks from climate change are likely to affect a large area or region, the risk assessment should take into account how the region could respond and the capability of contingency plans and contingent resources to respond to wide scale impacts.
3.2 Determining the likelihood of risk
The next step is to consider the likelihood or probability of the consequence occurring.
The likelihood categories are split into classes depending on how often an event can be expected to occur and probability in percentage terms. Table 8 below provides guidance in how to assign a likelihood of risk rating.
Probability or likelihood is not necessarily determined through mathematical or statistical calculations, but more qualitatively through a combination of experience and evidence. This is especially the case if comprehensive historical information is not available.
In the same way as determining consequences, it is best to document thoughts and assumptions in the Risk Spreadsheet in the area ‘Likelihood Statement’.
36 / Climate change adaptation in the transport sector. Guidance manual

Table 8: Details for different likelihoods used in the risk assessment
Descriptor Recurrent risks / Single events
Very Unlikely
Recurrent Events: Unlikely during the next 25 years.
Single Events: Negligible / Probability very low
Probability: < 15%
Unlikely
Recurrent Events: May arise once in 10 years to 25 years.
Single Events: Unlikely but not negligible / Probability low but noticeably greater than zero.
Probability: 16% - 35 %
Possible
Recurrent Events: May arise once in 10 years.
Single Events: Less than likely, but still appreciable
Probability: 36% - 59%
Likely
Recurrent events: May arise about once per year.
Single events: More likely than not
Probability: 60% - 84%
Almost Certain
Recurrent events: Could occur several times per year.
Single events: Noticeably more likely than not
Probability: > 85%
Where data exists, a more quantitative likelihood value may need to be considered.
For example, for a risk statement that involved a bridge with a known flood immunity being overtopped and potentially destroyed, it is useful to understand the likelihood of that event occurring. Assuming the bridge in this example has a flood immunity for a 20-year event, and a design life of 20 years, then from Table 9 it is possible to see that the likelihood of that bridge being overtopped is 64%. Referring back to Table 8, this means the likelihood rating would be ‘likely’.
37

Table 9: Percentage chance of an event occurring within a given design life. ARI = Annual Return Interval and AEP = Annual Exceedance Probability
Event Design Life (years)
ARI AEP 2 5 10 20 50 100 200
1 100% 100% 100% 100% 100% 100% 100% 100%
2 50% 75% 97% 100% 100% 100% 100% 100%
5 20% 36% 67% 89% 99% 100% 100% 100%
10 10% 19% 41% 65% 88% 99% 100% 100%
20 5% 10% 23% 40% 64% 92% 99% 100%
50 2% 4% 10% 18% 33% 64% 87% 98%
100 1% 2% 5% 10% 18% 39% 63% 87%
200 1% 1% 2% 5% 10% 22% 39% 63%
500 0.2% 0% 1% 2% 4% 10% 18% 33%
What is an Annual Return Interval (ARI) and an Annual Exceedance Probability (AEP)?
ARI - the long-term average of the number of years between the occurrence of a climatic event as big as (or larger than) the specified event. For example, floods with a discharge as great as (or greater than) the 50-year ARI design flood will occur on average once every 50 years. ARI is another way of expressing the likelihood of the occurrence of a flood event.
AEP - the chance of a flood of a given size (or larger) occurring in any one year, usually expressed as a percentage.
Return periods are expected to change as a result of climate change and these should be considered in assessing the likelihood of events happening in the future. Some climate projections have shorter return periods in the future (for example a 1-in-20 year rainfall event could become a 1-in-4 year event by 2090). In this case, the likelihood of the bridge being overtopped will increase, to an ‘almost certain’ likelihood in future years. Further information on the changes in return periods expected as a result of climate change is presented in Appendix A2 – Extreme rainfall projections.
38 / Climate change adaptation in the transport sector. Guidance manual
Case Study – Changes in likelihood as a result of climate change
The Mberande River currently has a crossing that is considered to be immune to the 1-in-2 year flood level. The 1-in-20 year flood level would be expected to destroy the current bridge, requiring complete replacement. During a recent exercise to look at the options to replace the bridge, an assessment was made of the risks to the current bridge over the next 20 years. Using the projections presented in Appendix A, a determination was made that the return period for the 1-in-20 year event was going to change to be a 1-in-9 year event (approximately) by 2030. This would mean that the probability of the bridge being destroyed over the next 20 years would shift from a 64% chance or ‘likely’ to greater than 88% probability, in other words ‘almost certain’.
The importance of a good survey
The completion of the risk analysis will always benefit from reliable information about the project and the project location. In some cases specific project information will not be available, and therefore conservative assumptions should be made. When information like survey data is available, it is important to make sure that this information is correctly interpreted relative to sea level.
In areas located close to the coast it is important to understand the levels a project will sit at relative to sea level. For this to occur detailed survey is required. It is also very important that the survey is calibrated or referenced back to a known benchmark, for example Tide Gauge Zero (TGZ). This is normally gathered as part of the design process.
It is important to also gather information not just about the project location (for example, in the case of a road, about the area around the centre line), but also about the relationship between the project location and the nearby coast. For example, what is the distance to the coast? Does the land rise or fall between the project and the coast? What is the coastline comprised of? Is it unconsolidated sand or harder more resilient material? All of these factors will have a bearing on the nature of the risks to the infrastructure under consideration. Even if a project is likely to be clear of the high tide level, impacts from wave action and storm surge could still affect the project.
39

3.3 Determine the Risk Level
Once you have selected the consequence and likelihood level, risk levels will be automatically calculated. Table 10 provides an example of how the risk levels are automatically calculated.
Table 10: Risk matrix used as part of the MID climate risk assessment process
Consequences
Insignificant (1)
Minor (2) Moderate (3)
Major (4) Catastrophic (5)
Likelihood
Almost certain (5)
Medium (5) Medium (10) High (15) Extreme (20) Extreme (25)
Likely (4) Low (4) Medium (8) High (12) High (16) Extreme (20)
Possible (3) Low (3) Medium (6) Medium (9) High (12) High (15)
Unlikely (2) Low (2) Low (4) Medium (6) Medium (8) Medium (10)
Very Unlikely (1)
Low (1) Low (2) Low (3) Low (4) Medium (5)
Checklist
Have all risk statements been analysed in the excel risk spreadsheet?
Have assumptions and justifications around establishing the consequences and likelihood been documented in the excel risk spreadsheet?
Where there is uncertainty, has a conservative approach been taken? Have uncertainties been documented?
40 / Climate change adaptation in the transport sector. Guidance manual

Step 4 – Prioritise the most important risks This step identifies which of the risks are important enough to warrant taking action to reduce the risk level.
When the risk assessment process that was undertaken in Step 3 is completed (and documented in the Risk Spreadsheet) a summary of all risks is generated. An example is shown in Figure 5; the summary identifies the number of risks assessed for the project, and the risk level for each.
Risk levels of ‘high’ or ‘extreme’ are not acceptable, whereas ‘low’ and ‘medium’ risks can be acceptable as part of routine operations, usually with some form of ongoing monitoring.
Figure 5: Example output from the risk assessment
Calculated Risk Level Number of Risks
Extreme 0
High 5
Medium 10
Low 4
Table 11 below describes the different risk levels and identifies whether or under what conditions (what action should be taken), risks are acceptable or tolerable to MID.
Table 11: Response thresholds for different risk levels
Descriptor Description
Low • Low risks should be maintained under review but it is expected that existing controls should generally be sufficient and no further action should be required to treat them unless they become more severe.-
• These risks can be acceptable without treatment.
Medium • Medium risks could be expected to form part of routine operations but they should be assigned to relevant managers for action, maintained under review and reported upon at middle management level.
• These risks are possibly acceptable without treatment.
High • High risks are the most severe that can be accepted as a part of routine operations without MID sanction but they should be the responsibility of the senior operational management and reported upon to the Director.
• These risks are not acceptable without treatment.
Extreme • Extreme risks demand urgent attention at the most senior level and cannot be simply accepted as a part of routine operations without MID sanction.
• These risks are not acceptable without urgent treatment.
41

Recognising that sometimes treatment will not be possible for all risks identified, it is important to identify the priority risks, and the order in which these risks are proposed to be treated. Where one or more risks have been assessed as having the same risk rating, decisions on the risks to be further treated, and their significance, can be assisted by considering the potential consequences identified during the earlier steps in this process. This evaluation can also take into account the wider context of the risks arising from climate change, and the impact on other parties affected by the infrastructure, for example, the wider community.
Some high or extreme risks may not be able to be treated, on the grounds that treatment is unfeasible, or outside of the scope of the project. More discussion on this is presented in Step 5 and Step 6. In such a situation the management response might be to complete more investigations to better understand the risk, or to accept the risk and continue to monitor the situation throughout the life of the project.
Once the list of risks for treatment has been established, the options available to treat the risks will need to be considered (see Step 5).
Checklist
Have you identified the key risks (high or extreme) for treatment?
Have you completed a priority list of the risks to be treated, where multiple high or extreme risks have been identified? Has this been done in consideration of the consequences of each risk?
Have you reported any high level or extreme risks to relevant manager in order to progress to Step 5?
Have you noted other risks (medium or low) for further monitoring if necessary?
42 / Climate change adaptation in the transport sector. Guidance manual

Step 5 – Consider management optionsThis step requires you to identify management options that can treat the risks identified in Step 4.
At this point it is useful to identify the full range of options that might be appropriate – information is provided below to help you think through what actions could be taken. The next step, Step 6, will help you decide how to select the most appropriate option.
Risks that are not fully managed with plans for further treatment must be accepted by MID. This needs to be a conscious decision taken by senior management.
To get started, it is useful to think about the types of risk management options that are available to MID. You can choose options that will:• Avoid the risk – change to the design of a project for instance seal an unsealed road to reduce the
risk of erosion and ongoing maintenance costs• Remove the risk source – change the alignment of a coastal road to move away from areas that
could be subject to coastal erosion and flooding• Change the likelihood – lift a bridge higher to reduce the likelihood of a given flood event.• Change the consequences – reduce the investment in a piece of infrastructure to reduce potential
financial losses should the risk scenario eventuate• Transfer or share the risk with another party or parties – outsource the design, construction and
maintenance to a third party • Retain the risk – accept that there is a chance that a bridge could be washed away and may need
to be replaced, and use the money saved by accepting the risk for other infrastructure investment purposes.
A climate change adaptation strategy essentially involves developing a plan to treat or mitigate key risks. It can be defined as ‘actions in response to actual or projected climate change and impacts that lead to a reduction in risks or a realisation of benefits. A distinction can be made between a planned or anticipatory approach to adaptation (that is, risk prevention) and an approach that relies on unplanned or reactive adjustments’.
The preferred adaptation options should aim to:• protect persons and assets by acting on public health and risk management• integrate the social dimension and avoid inequalities when facing risks• limit costs and take advantage of opportunities• preserve the natural environment.
Priority is usually given to ‘win-win’ and ‘no-regrets’ treatments. These measures address the targeted climate change risks while also having other environmental, social or economic benefits.
43

Best practice principles of adaptation
Adaptation to increasing climate variability should be guided by a number of principles. These include:• Building resilience: building resilience to ongoing climate variability by addressing the current
vulnerability of societies will help to adapt to future climate change.• Addressing the financial and economic aspects: the cost of inaction, and the economic and social
benefits of adaptation actions, calls for increased and innovative investment and financing.• Improving governance: collaborative governance by strengthening institutions for land and water
management is crucial for effective adaptations.• Improving and sharing knowledge and information: access to information relevant to policy and
management is fundamental to building capacity to cope with increasing variability and change.• Broader development context: adaptation must be addressed and applied in a broader development
context, recognising climate variability and climate change as a challenge to development.
Overview of adaptation options
Different options have different benefits and costs. Careful consideration needs to be given to a range of factors in deciding which options might be appropriate. In some situations options may be inappropriate, for example raising low lying road pavements might address the issue of coastal inundation, but may also exacerbate impacts on local communities from riverine flooding.
Read through the examples discussed below and the tables that follow to help identify what adaptation options might be appropriate to treat the potential risks that have been identified. The list of options identified in this guide is by no means exhaustive, and other options may prove appropriate in individual circumstances.
Road adaptation options
Managing climate risks has long been part of best practice in road design. Damage from storms and flooding can be reduced through physical measures including structural drainage and protective measures and bio-engineering options such as use of vegetation for slope stabilisation or run-off management and through improved capacity (for road maintenance, land management, warning systems, and emergency response systems).
Design features of roads have different lifetimes and because of that they have different sensitivities to climate variability and climate change. Short-lifetime features should be designed with current climate variability in mind. For instance, pavement standards or embankment height can be readjusted to current flood and traffic conditions when a road segment is rehabilitated (up to 20 years). Within this timeframe, climate change is unlikely to affect pavement standards. Drains, culverts, and bridges have longer operating lifetimes and are more inflexible so require more consideration of climate change impacts during the design phase. Longest-lived of all is the decision on corridor alignments, which can affect development patterns (and exposure to climate risk) for generations.
44 / Climate change adaptation in the transport sector. Guidance manual

Wharf adaptation options
The height of wharf platforms will need close attention given the accessibility impacts from sea-level rise. The Asian Development Bank, for example, has stipulated a 500 mm addition be incorporated into sea level calculations for all new wharves.
One of the biggest issues for consideration in wharf projects is shoreline protection from erosion. Erosion is particularly an issue in areas where the coastline is comprised of coral sands. Anecdotally, the wash from motorised canoes and larger boats is one of the biggest contributors to shoreline erosion.
Site selection for wharves is heavily influenced by local community input, and also dependent on navigability. Although the use of mangroves is a useful means of natural shoreline protection support, local communities often do not favour mangrove habitats, as they are known to be a preferred habitat of saltwater crocodiles.
Given a shortage of readily available hard rock of suitable size for shoreline protection works, the Domestic Maritime Support Project has employed the use of precast concrete blocks for this work. Placed at the toe of the protection area, these blocks act as an effective means of energy dissipation and erosion protection. Over time with rising sea levels, however, this protection may need to be increased to manage erosion, and also to maintain land access to the wharves.
45

Airport adaptation options
There are strategic plans to upgrade existing airstrips, as noted in the SI NIIP. Given projected increases in extreme rainfall, an upgrade project might serve as an opportunity to review and where necessary improve existing drainage infrastructure. Another aspect of upgrades could involve looking at improving coastal protection to manage projected sea-level rise and increases in coastal erosion.
Adaptation options
Further information about the options listed below are provided in Appendix D with a detailed fact sheet for each option.
# General Options Relevance
G1 Increasing contingency budgets and developing disaster response plans
Contingency budgets could be reserved for responding to unforeseen and anticipated events alike (most typically natural disasters and emergencies), and allow rapid restoration of service.
G2 Vulnerability mapping Can assist in identifying areas for priority treatments, or act as a baseline for monitoring and maintenance activities.
G3 Early Warning System Early Warning System can assist individuals and communities threatened by hazards to act in time and in an appropriate manner to reduce the possibility of significant impacts.
G4 Erosion Protection – Solid structures Solid structures can be constructed by using various material and methods, such as concrete, blocks, concrete armour units, etc. The use of solid materials reduces the structure flexibility, increases construction skills, and can increase the cost. Solid structures are more vulnerable to failure due to minor damage.
G5 Mechanical Lagoon Opening In catchments that drain to coastal lagoon system, opening the lagoon to the ocean via the use of heavy machinery can reduce the impact of flooding.
46 / Climate change adaptation in the transport sector. Guidance manual
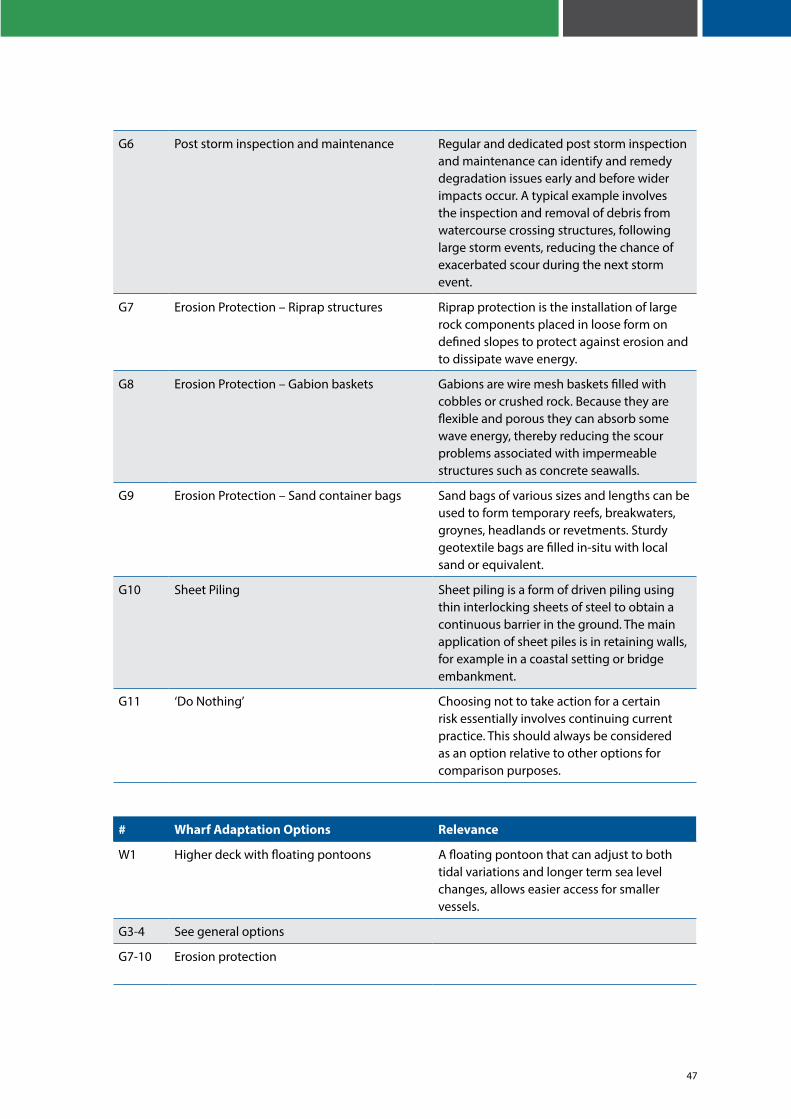
G6 Post storm inspection and maintenance Regular and dedicated post storm inspection and maintenance can identify and remedy degradation issues early and before wider impacts occur. A typical example involves the inspection and removal of debris from watercourse crossing structures, following large storm events, reducing the chance of exacerbated scour during the next storm event.
G7 Erosion Protection – Riprap structures Riprap protection is the installation of large rock components placed in loose form on defined slopes to protect against erosion and to dissipate wave energy.
G8 Erosion Protection – Gabion baskets Gabions are wire mesh baskets filled with cobbles or crushed rock. Because they are flexible and porous they can absorb some wave energy, thereby reducing the scour problems associated with impermeable structures such as concrete seawalls.
G9 Erosion Protection – Sand container bags Sand bags of various sizes and lengths can be used to form temporary reefs, breakwaters, groynes, headlands or revetments. Sturdy geotextile bags are filled in-situ with local sand or equivalent.
G10 Sheet Piling Sheet piling is a form of driven piling using thin interlocking sheets of steel to obtain a continuous barrier in the ground. The main application of sheet piles is in retaining walls, for example in a coastal setting or bridge embankment.
G11 ‘Do Nothing’ Choosing not to take action for a certain risk essentially involves continuing current practice. This should always be considered as an option relative to other options for comparison purposes.
# Wharf Adaptation Options Relevance
W1 Higher deck with floating pontoons A floating pontoon that can adjust to both tidal variations and longer term sea level changes, allows easier access for smaller vessels.
G3-4 See general options
G7-10 Erosion protection
47

# Road Adaptation Options Relevance
R1 Raising the pavement level Lifting the pavement in low lying areas (not subject to coastal erosion) can protect the pavement surface from inundation. Lifting the pavement typically requires additional drainage infrastructure to manage the barrier that the lifted road poses to overland flows.
R2 Green belts Enhancing the natural defences along a shoreline can help protect communities and infrastructure from future hazards that could result from increased wave action and run-up as a result of sea-level rise.
R3 River training, bendway weirs River training, including bendway weirs, can assist in guiding the flow of major watercourses and thereby reduce erosion on river banks and bridge abutments. Bendway weirs can be useful.
R4 Drainage redundancy Building increased capacity into the drainage network can assist in managing expected increases in runoff from more intense rainfall events. Such measures can also assist where catchment dynamics change as a result of other processes, for example, increased urbanisation or logging.
R5 Deviation from existing alignment Changing the alignment of the road can reduce or avoid the influence of certain hazards. For example, moving the road alignment away from the coastal zone can avoid the impacts from coastal erosion.
R6 Improved Catchment Management Improving the management of watersheds that flow to river crossings can assist in reducing the debris loads that impact on bridge structures and improve the ability of the bridge and approaches to withstand flood events. Other methods for slope stabilisation can reduce the risk of landslides.
R7 Flood risk studies For major river catchments in strategic areas, for example, rivers on the Guadalcanal plains, a flood study can be used to understand flooding behaviour, including under projected climate change scenarios. This information can be used to effectively design bridge structures from the perspective of bridging type, location and height.
48 / Climate change adaptation in the transport sector. Guidance manual

R8 Lifting bridges higher Lifting bridges above flood levels will allow traffic to continue to use the bridge even during flood events. In some wide floodplain locations, however, even if the bridge is raised higher, large flood events can still affect the road access to the bridge.
R9 Real time rainfall and runoff guages Rainfall gauges that collect and report rainfall in real time can help asset managers and the public know when flood events are likely. They can also collect useful information about upper catchment rainfall patterns that are currently unavailable. Knowledge about impending flood events can help reduce impacts and allow for earlier asset management planning by having resources on standby.
R10 Flood resilient wet crossing (fords) A ford is a form of water crossing that may become impassable after heavy rain or during flood conditions due to its low profile. The advantages of a ford are that they are generally not affected by river debris and cheaper than traditional bridges, but are unusable during high water conditions.
R11 Debris traps Debris traps can reduce the load of debris affecting a bridge structure, and thereby improve the ability of bridges to withstand flood events that typically carry high loads of debris. Debris traps however can cause other issues like afflux upstream and to remain effective require regular debris clearing and maintenance.
R12 River training – gabion baskets Gabions are wire mesh baskets filled with cobbles or crushed rock. Similar to rip rap, gabions can be used to protect structures, or direct flows away from specific areas
# Airport Adaptation Options Relevance
G1-4 See general options
G7-10 Erosion Protection
R1, R4 Pavement level, drainage redundancy
Checklist
Have you considered the options available to treat the key risks identified in Step 4, and developed a long list of possible options for further consideration?
49

50 / Climate change adaptation in the transport sector. Guidance manual

Step 6 – Shortlist and appraise optionsThe final step – Step 6 – has two parts. The first part will help you to shortlist options. The second part helps you to identify a final, preferred adaptation approach.
It is important to establish the proposed engineering concept prior to commencing detailed design of your project. It is at this stage that adaptation options can usually be more cost effectively integrated into the project, rather than retrofitting adaptation options to a design at a later date.
6.1 Shortlisting adaptation options
The first part of Step 6 is to shortlist the adaptation options for the project.
Using the custom designed multi-criteria analysis (MCA) template (see Appendix C4), enter all of the management options identified in Step 5 into the template.
You will also need to identify the assessment criteria that will be used in the shortlisting process (for example, Local Support, Feasibility, Practicality, Effectiveness, Indicative Cost, Durability etc) and then weight each criteria for relative importance.
Multi-criteria analysis tool
Further information about the Multi-criteria Analysis tool, as well as other economic analysis tools, is available in Appendix E - Economic Decision Support Tool Fact Sheets. These fact sheets provide information about a range of tools, their benefits, their strengths and weaknesses, and data requirements.
Ideally the project team would consider the merits of each option against the selected criteria and score accordingly. The multi-criteria analysis will produce a raw score and a weighted score for each option. It is important to view the multi criteria analysis process as a filter, and not a process necessarily to determine a preferred adaptation approach. An example of the multi-criteria analysis is worked through below. It considers all of management options to address the risks of sea level rise to a wharf.
51

Case study – Using the multi-criteria analysis, Lambulambu Wharf
The following information presents the results of the multi-criteria analysis used to evaluate a list of potential adaptation options for the Lambulambu Wharf. The information includes the key risk to be treated, the list of potential options considered, the criteria used to evaluate the options (and the relative weight given to each criteria), and finally the results of the analysis.
Risk to be treated:
As a result of sea-level rise, wharf deck design means that some maritime traffic cannot effectively use the wharf
Options: Name: Brief Description/Comments:
Option 1 Higher Wharf Deck Lifting the wharf deck to be consistent with the design objectives at the end of the 50-year design life, i.e. 1,500mm above the mean high water mark. This would mean adding up to an approximate 400mm to the design height to account for projected sea-level rise.
Option 2 Higher Wharf Deck with Floating Jetty Lifting the wharf deck to be consistent with the design objectives at the end of the 50-year design life, i.e. 1500mm above the mean high water mark, with an additional component of a floating jetty attached to the wharf deck to allow for smaller vessels to effectively use the wharf in the short term.
Option 3 Do Nothing Maintain the status quo, i.e. no new wharf construction.
Option 4 Wharf Deck for current conditions (basecase)
Build the wharf to be 1500mm above the current mean high water mark plus an additional 200mm to account for sea-level rise (as per ADB requirements, ADB Environmental Assessment and Review Framework, 2012)
Option 5 Build two wharves Stage the building of two wharves, each with a shorter design life, the first wharf built to current conditions, and the second wharf built in some 25 years to future conditions.
Option 6 Wharf that can be retrofitted Build a wharf to current conditions, but with the ability to have an additional deck added in the future to respond to sea-level rise. This would require stronger piles to be able to support the increased weight of an additional deck.
52 / Climate change adaptation in the transport sector. Guidance manual

Figure 6: Pie chart identifying the assessment criteria and the relative weighting for each of the criteria
The criteria used to evaluate the longlist (and their relative weighting) is shown in the above pie chart, while the results of the analysis is shown below for both the weighted and unweighted scores
Figure 7: Results of the Lambulambu wharf adaptation options analysis, displaying both weighted and unweighted scores.
Local Support 20%
Feasibility, Practicality 10%
Effectiveness 20%
Environment, Sustainability 5%
Indicative Cost 20%
Durability, Longevity 10%
Maintenance Requirements 10%
Timeframe until Effective 5%
Wharf that can be retrofitted
Build two wharves
Wharf Deck for current conditions (basecase)
Do Nothing
Higher Wharf Deck with Floating Jetty
Higher Wharf Deck
Higher Wharf Higher Wharf Deck with
Floating Jetty
Do Nothing Wharf Deck for current conditions (basecase)
Build two wharves
Wharf that can be
retrofitted
Unweighted 8.0 8.0 -7.0 5.0 1.0 1.0
Weighted Score 10.0 10.5 -9.5 7.5 1.5 1.5
-15.0 -10.0 -5.0 0.0 5.0 10.0 15.0
53

It is important to retain the language around risk used in the engineering design context. This helps illustrate how climate change adaptation is simply another infrastructure asset risk. However, it is important that the risk is described as an impact on the infrastructure rather than in terms of a potential solution.
6.2 Appraising adaptation options
Once the shortlist has been developed from the multi criteria analysis, a more detailed economic analysis of each option should be undertaken to rank the options and select a preferred one. It is likely that this step might be undertaken by project partners or staff outside of MID.
Economic analysis of adaptation measures can show the relative economic benefits (and costs) of the different options. The analysis should be developed in a way that is appropriate and robust for the level of climate information available, engineering assessments undertaken and stages at which an infrastructure solution is being considered.
As part of the Guidance Manual, a decision support matrix for economic appraisal has been developed to help decide what type of economic analysis can be used to address climate change adaptation issues. An overview of the key appraisal techniques is provided in Table 12.
Table 12: Overview of key appraisal techniques
Appraisal type What is Involved? When should it be used?
Strengths Weaknesses
Cost Effectiveness Analysis
Similar to a single output CBA except that benefits are not dollar quantified. The analysis measures outcomes in terms of costs per some unit of output or change. For example, $ per avoided flooded building.
Should be used when a single output or change is driving the project, and this is easily expressed in divisible units. Objective to identify least cost solutions.
Useful when costs are easily assessable and only type of benefit is of particular interest - particularly if the outcome as opposed to output is not easily quantified (e.g. $ per fatality avoided). Draws mainly on existing engineering data.
Does not provide easy comparison of projects when multiple benefits arise. Economic demand and externalities are not explicitly considered.
54 / Climate change adaptation in the transport sector. Guidance manual

Rapid Cost Benefit Analysis
Provides an initial net socio-economic impact of a transport infrastructure investment and assists in preliminary ranking of a set of short-listed project options. Preliminary discounting of major economic values. Takes into account benefits of ameliorating climate change impacts.
Should be used when the major costs and benefits are tangible and quantifiable, and timing of flows can be estimated. Objective to identify options likely to provide the largest net economic gain.
Can provide an early snapshot prior to more detailed analysis. Rapid approach to justifying a preferred option from a shortlist, considering the major economic costs and likely benefits. Draws on existing economic and engineering information and data. Establishes which options may produce a positive economic return.
Limited to projects that have outcomes that can be quantified in monetary terms. Usually not suitable for full project justification. Economic demand and externalities may be difficult to estimate.
Full Cost Benefit Analysis
All costs and benefits of the proposed investment are identified and quantified (monetised) relative to a ‘no project’ base case. Timing of costs and benefits are accounted for by discounting.
Should be used when all costs and benefits are tangible and quantifiable, and timing of flows can be estimated. Objective to select the preferred option for funding, development and delivery.
Rigorous approach to justifying a project and providing comparisons between diverse projects, on economic and/or financial grounds. Can be used to determine the incremental cost of climate adaptation. Analysis of net economic gain to the economy and how that gain is distributed.
Limited to projects that have outcomes that can be quantified in monetary terms. Requires significant data around each option.
55

Different projects are likely to use different appraisal methods depending on how much information is available, the total cost of the project, and the time available.
If cost benefit analysis is chosen as the appraisal approach, the scope of the analysis is also likely to vary depending on the scale and nature of the project. For large projects, the process may be separated into two phases; involving a rapid cost benefit assessment of a number of options followed by a full cost benefit assessment of the preferred option.
Approaches such as cost-benefit analyses should be considered as ‘a filter and not a scoop’7 and such approaches are ideally applied to rank adaptation options.
When climate change adaptation is integrated into the engineering design from the early concept phase, results should be considered relative to each other, rather than in absolute terms only. As a first step, the cost of a particular adaptation option can be compared to the costs of ‘doing nothing’, to establish a cost envelope within which adaptation measures will be beneficial.
Additional economic support tools
As part of the Guidance Manual, information about three additional economic support tools is included in Appendix E to assist in managing some of the inherent uncertainty associated with climate change impacts, and therefore benefits of adaptation.
These tools (Sensitivity Testing, Real Options Analysis and Stochastic Analysis) support the quantitative analysis where level of uncertainty around benefits or costs are significant enough to affect results. Further details on each of these tools are presented in Section 3 - Tools and resources, Appendix E – Economic Decision Support Tool Factsheets
7. World Bank, (2010), in Rao N.S., Carruthers T.J.B., Anderson P., Sivo L., Saxby T., Durbin, T., Jungblut V., Hills T., Chape S. 2013. An economic analysis of ecosystem-based adaptation and engineering options for climate change adaptation in Lami Town, Republic of the Fiji Islands. A technical report by the Secretariat of the Pacific Regional Environment Programme.
56 / Climate change adaptation in the transport sector. Guidance manual

Developing an adaptation ‘envelope’
Economic analysis can provide useful information to make sure you don’t underspend or overspend on adaptation options.
Understanding the potential ‘envelope’ within which adaptation options will realise benefits is an extremely useful element in informing the engineering design process.
At a very early stage it helps set the magnitude of the adaptation response relative to the overall design of the infrastructure in question. This can be achieved in three phases within an economic appraisal. An example below illustrates how this ‘envelope’ can be developed.
First, a baseline with non-climate change impacts and a traditional estimate of the full lifecycle cost of a proposed infrastructure investment needs to be determined.
A typical example - the construction, operation and maintenance of a bridge - is represented in the following diagram. It shows a large initial cost (mainly capital expenditures) and then ongoing costs relating to infrastructure and incremental wider social and economic costs of weather impacts. A significant weather event occurs in year 10.
Figure 8: Lifecycle asset costs based on historical experience (including wider economic impacts)
Figure 9: Comparison of lifecycles costs (historical and climate change, including wider economic impacts).
1400
1200
1000
800
600
400
200
0
Cost based on historical weather events
1 2 3 4 5 6 7 8 9 10 11 12 13 14 15 16 17 18 19 20
1400
1200
1000
800
600
400
200
0
Cost based on historical weather events
Cost considering projected future climate change
1 2 3 4 5 6 7 8 9 10 11 12 13 14 15 16 17 18 19 20
57

Analysis of climate change reveals that climate impacts generally add to the costs imposed by historic weather patterns. These costs tend to increase over time as the climate changes beyond what we have been used to.
The second step to developing an ‘envelope’, is to understand the full lifecycle costs under a climate change scenario. Using the example of the bridge (above) the diagram below shows the full life cycle costs for that bridge under a climate change scenario. The climate change scenario includes an additional severe weather event and has an increasing intensity in cost.
In the third step, the annual difference in costs between the historic baseline and the climate change scenario represents a potential climate change funding envelope. Any climate change project that addresses the climate change impacts for an amount less than the value of this envelope is expected to add to economic welfare.
It is possible to subtract the difference between the climate change lifecycle costs and the baseline lifecycle costs to consider the incremental costs imposed by climate change. This is shown in the following figure.
Figure 10: ‘Envelope’ for climate change adaptation budget (accounting for wider economic impacts)
Note there is a negative impact in one year (year 10) because that weather event is displaced between the baseline and the climate change scenarios. The sum of these differences expressed as a present value in effect becomes a budget amount for the lifecycle costs of incremental adaptation measures. It gives the design engineers a notional maximum budget to allocate between construction and operation/maintenance costs, provided this fully mitigates the identified climate change impacts.
1200
1000
800
600
400
200
0
-200
Adaptation Envelope
1 2 3 4 5 6 7 8 9 10 11 12 13 14 15 16 17 18 19 20
58 / Climate change adaptation in the transport sector. Guidance manual

The following snapshot of the Mberande River Crossing case study shows how this envelope can actually be estimated.
Case Study – Mberande River crossing – Economic impact of climate change
Economic analysis takes a wide set of impacts into a common value system for comparison. It allows engineering costs to be compared with the value of social services and industry values that a transport link might facilitate.
Climate change can degrade transport services through increasing frequency and intensity of weather events.
A baseline impact analysis helps clarify and quantify incremental costs that climate change might impose at the Mberande River crossing. It identifies many of the costs that could be avoided with successful adaptation strategies.
Mberande River transects a key part of the Guadalcanal transport network on the Guadalcanal floodplain. Unpredictable watercourses and flood events that have high levels and sustained duration pose significant challenges. The benefits of the Mberande crossing are critically dependent on adjacent road links and other nearby river crossings.
A 25-year timeframe was adopted to capture significant climate change impacts. A longer time period runs the risk of incorrectly forecasting future development opportunities critical to economic benefit realisation.
An absence of detailed hydrology for Mberande catchment led to the development of a scenario approach. Major flood events were assumed to be the dominant climate change impact– other impacts were not considered. Three flood events – one in two, one in ten and one in twenty – were adopted to represent these impacts. Data was grounded in previous asset performance ensuring scenario credibility. Localised ‘nuisance’ flooding was not considered.
Climate change projections were examined to form a view about how the frequency of flood events might change in the future.
The three flood event types modelled in the baseline (CCI-0) were adjusted by changing their frequency of occurrence with these projections in mind. Each of the climate scenarios (CCI-1 to CCI-4) modelled at least one asset loss event. No asset loss event was assumed in the baseline.
Note that the different scenarios (CCI-0 to CCI-4) are not based on climate projections. Rather, they are based on an expected increase in the frequency of extreme events due to a changing climate.
Num
ber o
f Eve
nts
Scenarios used for Analysis
CCI-0 CCI-1 CCI-2 CCI-3 CCI-4
12
10
8
6
4
2
0
One in Two
One in Ten
One in Twenty
59

A feature of the analysis is the estimation of unit values of economic costs associated with these impacts. Economic valuation was split across a number of different outcomes – construction and operation of the asset; social outcomes (education and health) and commercial/market outcomes (palm oil, general freight and cash crops).
Engineering costs were based on discussions within MID, and accounted for costs of clean ups in response to lower level impacts and loss of asset in significant flood events. Education and health unit values estimated in separate technical notes were based on national level data. Safeguards team data on population and education and health services was used. Palm oil production estimates were based on company data and discussions. General freight estimates were based on a Honiara port study and national levels of demand. Cash crops estimates drew on the proportion of the population engaged in farming, the value of that production and a pro rating to local conditions.
Climate change is expected to have a significant impact on the Mberande River crossing. In the baseline scenario (no climate change) the undiscounted value of flood impacts totals $3.3 million over a 25 year period. Depending on the climate change assumption, the incremental impact of climate change could be up to $34.5 million. Engineering design, construction and operation costs dominate, however the social and market impacts are critically dependent on existing population levels and projected growth and current patterns of settlement and economic activity.
This analysis highlights that any project case that mitigates some or all of the identified costs has a significant budget envelope within which to address climate change. This is in addition to meeting current design standards and addressing historical weather patterns.
60 / Climate change adaptation in the transport sector. Guidance manual

Monitoring and evaluationMost projects include monitoring and evaluation activities. This helps to: • ensure that the risk treatments are effective• contribute to improvement in risk understanding• detect changes in external and internal conditions• identify emerging risks.
The M&E framework should be based on robust and simple-to-measure quantitative and qualitative indicators.
Information can be collected and analysed through many avenues. For example local communities, such as those involved in Labour Based Equipment Support (LBES) activities, can take a very active role in monitoring tasks.
In the first few years of using this guidance manual, it is also useful to have a good record of all projects that have been assessed. This could include a summary of information on:• number and types of projects considered• results of the pre-screening process• nature (risk levels) and number of risks identified• results of any shortlisting and appraisal process for any ‘high’ or ‘extreme’ risks• number of projects that implement climate adaptation measures as part of construction design.
Over time this information will be valuable for future planning of transport infrastructure and to improve this guidance manual.
The information collected can assist in managing generic risks that apply to many of the transport infrastructure projects being undertaken by MID, for example, how are different projects responding to the climate change impacts associated with low lying coastal roads? What are the risks being identified, and how are they being managed?
61

62 / Climate change adaptation in the transport sector. Guidance manual

Section 3 – Tools and Resources
Appendix A1 - Climate InformationThis section presents an overview of the current climate in the Solomon Islands, over the available 40 year record, together with projections of future change.
OverviewThe Solomon Islands is a small island developing state of approximately 1000 volcanic islands lying within12 degrees latitude of the equator. The islands range from small low-lying atolls to large volcanic islands with high peaks. The Solomon Islands has a climate typical of many tropical areas, being characterised by high and rather uniform temperature and humidity, and abundant rainfall with a distinct wet season. The wet season occurs from November to April and the dry season occurs from May to October. Weather has been observed and recorded in the Solomon Islands at a number of weather stations across the islands, including seven good quality weather stations (depicted in Figure 11). These stations have an average of about 40 years of data that have been analysed to develop climatic trends for the Solomon Islands. The World Meteorological Organization recommends at least 30 years of continuous weather data be used to characterise a ‘climate’ and identify ‘climatic trends’.
Figure 11: Approximate location of available weather stations in the Solomon Islands
63

All seven of these stations are close to sea level. Some caution should be exercised in using the data from these stations for the purposes of catchment calculations as it represents essentially sea level data. Available data and anecdotal evidence indicates there can be very strong variability between regions owing to elevation and geographic position. For example, northern Guadalcanal exists in relative rain shadow, and southern Guadalcanal anecdotally experiences a dramatically higher rainfall regime. High watershed areas could be reasonably expected to experience two to four times the sea level rainfall.
Natural climate variability strongly affects the climate from one year to the next, while the Inter-decadal Pacific Oscillation can affect Pacific climate from one decade to the next. For example, within a warming trend it is still possible for some locations to experience mild years. However, these would become less frequent over time.
Recent efforts to understand the future projections as a result of climate change, particularly through the Australian Government’s Pacific Climate Change Science Program, have indicated that during the 21st century the Solomon Islands are expected to experience:• continued rising sea levels• an increase in annual and seasonal mean rainfall• an increase in frequency and intensity of extreme rainfall events• an increase in surface air and sea-surface temperatures, and an increase in the intensity and
frequency of days of extreme heat• continued ocean acidification• a general decrease in the number of cyclones, but an increase in the proportion of the most severe
cyclones.
The observed and projected climate changes in the Solomon Islands are summarised in Figure 12.
64 / Climate change adaptation in the transport sector. Guidance manual

Figure 12: Summary of observed and projected weather and atmospheric changes in the Solomon Islands
Historic trend Projected (2030) Projected (2090)
Rainfall Mean rainfall No statistical trend (-1% to +7%)1 (-7% + 20%)1
Extreme rainfall
No statistical trend (+9 mm for 1:20 year event)2
(+43 mm for 1:20 year event)2
Temperature Mean Temperature
(annual mean temperatures up 0.16°C/ten years)
(up to 1°C)3 (up to 4? C)3
Sea Ocean acidity (Aragonite saturation)
(currently about 3.9)
(about 3.5)4 (about 2.5)4
Storm surge Historically, storm surges of up to 1.5 m have been experienced. Without future projections, these values could be expected in the future, in addition to the expected sea-level rise.
Sea-level rise (about 0.8 cm per year)
(up to 18 cm)5 (up to 89 cm)5
Atmosphere CO2 (almost 400 ppm as at end 2013)
Up to 449 ppm6 Up to 935 ppm6
Wind Tropical cyclones
Approx 10 per decade within 400 km of Honiara
(number of cyclones)
(cyclone intensity)
Further information: Australian Bureau of Meteorology and CSIRO (2014). Climate Variability, Extremes and Change in the Western Tropical Pacific: New Science and Updated Country Reports.
TemperatureAir temperatures in the Solomon Islands are fairly constant throughout the year with very weak seasonal variations and are closely linked to sea-surface temperatures. The most significant variation is from July to August when cooler air blows in from the south. In Honiara a slight decrease in temperature is also evident in January, February and March due to increased cloud cover during the wet season.
1. RCP8.5
2. Mean change under the RCP8.5 scenario for rainfall within a 24 hour period
3. RCP8.5
4. RCP8.5
5. RCP8.5
6. Riahi, K. Gruebler, A. and Nakicenovic, N. (2007). Scenarios of long-term socio-economic and environmental development under climate stabilization. Technological Forecasting and Social Change 74, 7, 887-935 in M. Meinshausen, S. Smith et al. “The RCP greenhouse gas concentrations and their extension from 1765 to 2500” (2011), Climate Change, Special RCP Issue.
65

Annual mean temperatures and maximum and minimum temperatures have risen over the period of records in the Solomon Islands (1950 – 2009, approximately 59 years). Since records began in Honiara in 1950, the annual maximum temperature has increased by about 0.16°C per decade and the annual minimum temperature has increased by about 0.18°C per decade.
Water temperatures around the Solomon Islands have risen gradually since the 1950s. Since the 1970s the rate of warming has been approximately 0.12°C per decade.
Under all future IPCC emission scenarios (see information box below: How are climate projections made?), climate change is projected to increase global average temperatures by up to 1.0° C by 2030, relative to 1995. After 2030 there is a widening difference between projected temperature increases for each emission scenario. By 2090, a warming of 2.0° C to 4.0° C is projected for the very high emissions scenario (RCP8.5).
While relatively warm and cool years and decades will likely still occur due to natural variability, there is projected to be more warm years and decades on average in a warmer climate. There is high confidence that the intensity and frequency of days of extreme heat are expected to increase.
How are climate projections made?
Scientists investigating how the Earth’s climate will respond to future conditions must take into account a number of factors. These include the amount of future greenhouse gas emissions, developments in technology, changes in energy generation and land use, global and regional economic circumstances and population growth.
So that outputs from different modelling systems can be compared, a standard set of scenarios are used to provide a consistent set of starting conditions, historical data and possible future emissions for use across the various branches of climate science. Findings of the Intergovernmental Panel on Climate Change (IPCC) Fifth Assessment Report (AR5) are based on a new set of scenarios called Representative Concentration Pathways (RCPs).
The IPCC has adopted four scenarios, or possible pathways, to use for climate modelling and research. These scenarios, or RCPs, describe four climate futures, all of which are considered possible depending on how much greenhouse gases are emitted in the years to come.
Annual average rainfallAcross the Solomon Islands, rainfall varies very strongly from year to year. Annual rainfall in the wettest years can be twice that in the driest years. The El Nino Southern Oscillation (ENSO) has a strong influence on this variability, particularly during the wet season. During El Nino events, conditions are generally drier than average with higher temperature (due in part to reduced cloud cover), and during La Nina events rainfall is generally greater, with lower temperatures.
66 / Climate change adaptation in the transport sector. Guidance manual

Available rainfall records show no statistically significant annual or seasonal trends across the period of records (1950-2009). Figure 13 shows the high inter-annual variability of maximum rainfall events in both Honiara and Auki from the observed record.
Figure 13: Example of the different trends in maximum one day rainfall
Max
1-d
ay ra
infa
ll (m
m)
1940 1950 1960 1970 1980 1990 2000 2010 2020
Year
Least squares linear trend of 4.46mm/decade
Pacific-Australia Climate Change Science and Adaptation Planning Program
x: insufficient data
250
200
150
100
Annual Max 1-day rainfall - Honiara
Max
1-d
ay ra
infa
ll (m
m)
1940 1950 1960 1970 1980 1990 2000 2010 2020
Year
Least squares linear trend of 4.46mm/decade
Pacific-Australia Climate Change Science and Adaptation Planning Program
x: insufficient data
240
220
200
180
160
140
120
100
80
60
Annual Max 1-day rainfall - Auki
67

Topographical effects also cause significant variations between locations. In the west there is a marked wet season from November to April, while rainfall is more constant year round in the east. Rainfall in the Solomon Islands is affected by the West Pacific Monsoon, the South Pacific Convergence Zone and the Intertropical Convergence Zone.
While climate models for national averages across the Solomon Islands show a range of projected annual rainfall changes from an increase to a decrease, there is high confidence in the projected model average for a slight increase in rainfall. The range of increase is greater in the highest emissions scenarios. There is a similar range of results in both November-April and May-October rainfall, with a slight increase in the model average in both seasons. The year-to-year rainfall variability over the Solomon Islands is generally larger than the projected change, except for the models with the largest projected change in rainfall later in the century.
The effect of climate change on average rainfall may not be obvious in the short or medium term due to natural variability.
Rainfall projections
For more detailed information about rainfall projections, see Appendix A2 - Extreme rainfall projections.
Extreme rainfall eventsThe frequency and intensity of extreme rainfall events are projected to increase over the course of the 21st century (high confidence). The majority of models project the current 1-in-20-year daily rainfall event will become, on average, a 1-in-9-year event under a high emissions scenario by 2030, and a 1 in-4-year event by 2090.
An increase in the frequency and intensity of extreme rainfall is consistent with larger-scale projections, based on the physical argument that the atmosphere is able to hold more water vapour in a warmer climate (Allen and Ingram, 2002; IPCC, 2007). It is also consistent with physical arguments that rainfall will increase in the deep tropical Pacific in a warmer climate (IPCC, 2007; Volume 1, Section 6.4.3).
Figure 14: Stylised indication of changes in rainfall intensity under future climate change
Freq
uenc
y of
Occ
uren
ce
Lighter Rainfall Heavier Rainfall
Current Future
68 / Climate change adaptation in the transport sector. Guidance manual

Even in areas where mean precipitation is not changing, heavy precipitation events are becoming more common7 8 9). An Engineers Australia discussion paper from 201110 notes that much of the increase in extreme rainfall is likely to occur at much finer sub-daily timescales.
Sea level riseGlobal sea level is rising due to the expansion of the volume of ocean water as it warms, the addition of new water from melting glaciers and icecaps, and ice discharge from the polar ice sheets. From 1880 to 2000 global sea level has risen by about 0.2 m. The historic trend since reliable records began in the Solomon Islands in 1993, measured by satellite altimeters, has shown an average increase in sea level of 8 mm each year. This is greater than the global average of 3.2 ± 0.4 mm per year11.
A tide gauge installed at Honiara in 1994 as part of the South Pacific Sea Level and Climate Monitoring Project has measured the highest sea level as 0.204 m above the Tide Gauge Zero (TGZ). With a highest recorded sea level of 1.37 m, this translates to a highest sea level (relative to TGZ) of 1.57 m (or 0.88 m relative to Mean Sea Level).
Sea level around the world is projected to continue to rise. By 2030 sea levels are expected to rise by up to 15 cm. By 2090 under a high emissions scenario, sea levels are expected to rise by up to 60 cm11. More recent information released by the IPCC has projected a higher global average sea-level rise of up to nearly a metre by the end of the century under a high emissions (RCP8.5) scenario.
As the base level of the oceans rises, coastal areas are more vulnerable to permanent flooding, as well as more frequent and damaging storm-related flooding, endangering coastal communities and infrastructure. Coastal flooding is caused by wind-driven waves combined with a storm surge. Even small rises in sea level can result in very large increases in the frequency and severity of coastal flooding. The worst impacts are experienced during high tides. Sea-level rise also affects erosion of beaches and the land on which buildings and infrastructure are built.
7. Groisman, P. Y., R. W. Knight, et al. (2005). ‘Trends in intense precipitation in the climate record.’ Journal of Climate 18: 1326-1350.
8. Alexander, L., X. Zhang, et al. (2006). ‘Global observed changes in daily climatic extremes of temperature and precipitation.’ Journal of Geophysical Research 111(D05101).
9. Trenberth, K. E., P. D. Jones, et al. (2007). Observations: Surface and Atmospheric Climate Change. Climate Change 2007: The Physical Science Basis. Contribution of Working Group I to the Fourth Assessment Report of the Intergovernmental Panel on Climate Change. S. Solomon, D. Qin, M. Manning et al. Cambridge, Cambridge University Press.
10. Engineers Australia. (2001). Implications of climate change on flood estimation discussion paper for the Austrlaian rainfall and runoff climate change workshop No. 2, February 2011. Engineers Australia: Canberra.
11. Australian Bureau of Meteorology and CSIRO, 2011. Climate Change in the Pacific: Scientific Assessment and New Research. Volume 1: Regional Overview. Volume 2: Country Reports.
69

Tropical cyclonesBetween the months of November and April, the Solomon Islands experience frequent tropical cyclones which bring damaging winds, rains and storm surge. Tropical cyclones are intense low-pressure atmospheric systems that form over warm, tropical water and have gale force winds. The Islands have been affected by devastating cyclones multiple times in the last few decades. Between the 1969/70 and 2009/10 cyclone seasons, the centre of 41 tropical cyclones passed within approximately 400 km of Honiara. This represents an average of one cyclone a year.
Although the islands are less subject to the impacts of tropical cyclones than elsewhere in the Southwest Pacific because of their low latitude, cyclones still pose a serious threat each year12, resulting in flooding and wind damage, including severe damage to infrastructure.
Figure 15: Example of historical cyclone tracks within 400 km of Vella Lavella, Western Province
12. MECDM, 2013. Climate Information, www.met.gov.sb accessed January 2014.
70 / Climate change adaptation in the transport sector. Guidance manual

Although there are limited datasets on global cyclone intensity, and consistent data is only available since the 1980s with modern satellite equipment, projections indicate a general decrease in the number of cyclones, but an increase in the proportion of the most severe cyclones. Projections suggest a future increase in the relative frequency of tropical depressions, tropical storms, and category 5 storms and a general decrease in the number of storms in the other categories.13
These projections are in keeping with an understanding of the physical relationship between warmer surface oceans and the atmosphere. Cyclones form more readily in very warm conditions at the ocean surface, and increasing sea surface temperature increases the intensity of cyclones through increased wind speed and intensity of rainfall.
Higher-intensity cyclones, even if fewer in number, will cause greater damage to transport infrastructure.
Storm surge Storm surge is a temporary rise of sea level which occurs during severe weather events, for example, tropical cyclones. It is caused by a combination of the ‘suction effect’ of low atmospheric pressure and onshore wind. Waves are also an important contributor to extreme water levels during storm events.
Figure 16: Storm surge temporarily increases sea levels during severe weather events
There are number of documented cases of storm surge affecting areas in the Solomon Islands, primarily caused by tropical cyclones, although there is limited modeling and data on storm surge height. In general, across the Solomon Islands, extreme water levels of up to 1.5 m could reasonably be expected based on second hand observations (see Case Study box). While the steep offshore topography of the Solomon Islands would not generally assist large storm surge events, it does favour the generation of waves (Walsh et al, 2012).
13. AIR Worldwide. (2013). Current Future Tropical Cyclone Risk in the South Pacific Report – Solomon Islands. Pacific Catastrophe Risk Assessment and Financing Initiative: Australian Government, Canberra.
71

As global sea levels rise, the increased base level of the ocean makes the effects of a storm surge worse. The effect of increased sea level on storm surges is illustrated in Figure 17. The worst impacts would be experienced during a high tide.
Figure 17: Sea-level rise is likely to increase extreme water levels during storm events (source: Climate Commission).
72 / Climate change adaptation in the transport sector. Guidance manual

Case study – Historical storm surge in the Solomon Islands The following historical accounts of the impacts of storm surge are taken from Natural Disasters in the Solomon Islands (2nd Edition):
• Cyclone 1952: In Malaita, villages in coastal areas and on artificial islands facing the storm were obliterated by the surge and superposed breakers. In Honiara, the anemometer broke up at 135 km/h before the height of the cyclone. The storm surge at low tide was no greater than 1.1 metres, the wind paralleling the northern coastline.
• Cyclone Ida, 1972: At Fiu, 40 houses were destroyed by a storm surge which swept almost 100 metres inland.
• Cyclone Kerry, 1979: In Makira, at Mwaniqagosi village in the Star Harbour, more than 10 houses were destroyed by the storm surge which swept almost 100 metres inland. Many people lost all their belongings. The village Coopstore lost 150 bags of copra.
• Cyclone Hina, 1985: At the clinic in Tikopia, all the valuable items such as as medicine, plasters etc were washed away by flood from the storm surge which ranged from 100-200 metres from the sea to the inland.
• Cyclone Namu, 1986: Assessment of damage on low lying coastal villages was hampered by 10 meter high stacks of timber blown onto beaches by the tidal surge. In Honiara the storm was estimated to have caused a maximum wave height of 1.5 metres
Ocean acidificationOcean acidification occurs when oceans absorb additional carbon dioxide from the atmosphere. As the levels of carbon dioxide in the atmosphere as a result of human activities increase, so does the rate of absorption of carbon dioxide into the world’s oceans. Carbon dioxide reacts with sea water to produce carbonic acid. The resulting increase in acidity (measured by lower pH values) reduces the availability of minerals (carbonate ions), such as aragonite, that calcifying marine organisms such as corals use to maintain or build exoskeletons and shells, which is necessary for their survival.
Over the course of the observational record, aragonite levels in the Solomon Islands have reduced to levels below that considered optimal for coral growth and the development of healthy reef ecosystems (BOM and CSIRO, 2011). Aragonite saturation levels have declined from about 4.5 in the late 18th century to an observed value of about 3.9+/- 0.1 by 200014. A reduction in the health of reef ecosystems could have implications for coastal erosion as reefs have a reduced ability to mitigate wave impacts, especially when combined with observed rises in sea level.
Projections show that ocean acidification will continue to increase over the course of the 21st century as concentrations of atmospheric carbon dioxide increase. By about 2045 levels of aragonite are projected to be such that conditions for coral growth would be marginal. Projections show continued decline in levels of aragonite beyond this time.
14. Australian Bureau of Meteorology and CSIRO, 2011. Climate Change in the Pacific: Scientific Assessment and New Research. Volume 2: Country Reports.
73

Assistance from Ministry of Environment
If you are unsure how to interpret the climate information, or what it means for your project, the Ministry of Environment, Climate Change, Disaster Management and Meteorology (MECDM) can be contacted on 24074 for assistance. They have access to the weather records and the latest climate change projections. MECDM assistance should, however, only be sought for detailed clarifications needed as part of the detailed risk assessment process (Step 3).
Further weather and climate information
Information on observed weather and trends for the Solomon Islands, including temperature and rainfall for monthly, annual and various extreme event indices. http://www.bom.gov.au/climate/pccsp/
Information on observed ocean temperatures, salinity, wave height and direction, sea levels and currents. http://www.bom.gov.au/cosppac/comp/ocean-portal/
Information on historical tracks of cyclones http://www.bom.gov.au/cyclone/history/tracks/
Information on observed tide levels from the SEAFRAME tide gauge in Honiara http://www.bom.gov.au/oceanography/projects/spslcmp/data/index.shtml
Information on future climate projections. http://www.pacificfutures.net
74 / Climate change adaptation in the transport sector. Guidance manual

Appendix A2 – Extreme rainfall projections
This section builds on climate information presented in Appendix A1 – Climate information and presents information on the changes in rainfall return periods, and changes in the rainfall amounts for three key rainfall events. These events are the 20 year, 10 year and 5 year events, presented in mm per 24-hour period. These projections are based on two future scenarios, one considered a higher emission scenario (RCP8.5) and a low emission scenario (RCP4.5).This information was made available as part of the PACCSAP program with information from the CSIRO, and is publicly available at www.pacificclimatechangescience.org.
This information should be used when considering the potential changes in likelihood of rainfall and associated flooding scenarios impacting on transport infrastructure. For context, Table 13 and the Figure below highlight the implications of these changes for a 1-in-20 year event for a number of assets, under a high-emissions (RCP8.5) scenario. The table below presents the percentage chance of a 1-in-20-year event occurring for three different assets under current and future (2070) climate scenarios. Note that this information is primarily intended for advanced users (i.e. bridge/culvert and flood engineers) to assist in designing assets that are resilient to future climate conditions.
Table 13: Likelihood of a 1-in-20 year weather event occurring now and in the future for different assets
Currently By 2070
% Chance Risk Terminology % Chance Risk Terminology
5 Year Design Life 23 % Unlikely 67 % Likely
10 Year Design Life 40 % Possible 89 % Almost Certain
20 Year Design Life 64 % Likely 100 % Almost Certain
75

Figure 18: The change in likelihood of a 1-in-20 year weather event (green line) occurring now and in 2070 for a range of different assets. For an asset with a five-year design life, the chance of a 1-in-20 weather event occurring is 23% today, but is projected to increase to 67% by 2070
Projected changes in return periods for 24-hour duration events
The below figure represents how the annual return interval (i.e. how often a weather event might occur) for weather events could change into the future due to climate change. For example, a weather event expected to occur once every 20 years today could occur once every four years by 2090 under a ‘high emissions’ (RCP8.5) scenario.
2 Year Asset 5 Year Asset 10 Year Asset 20 Year Asset 30 Year Asset 40 Year Asset 50 Year Asset
1 in 1 Year
1 in 2 Year
1 in 5 Year
1 in 10 Year
1 in 20 Year
1 in 50 Year
1 in 100 Year
2%
5%
10%
19%
36%
75%
100%
5%
10%
23%
41%
67%
97%
100% 100%
89%
65%
40%
18%
10%
100%
88%
64%
33%
18%
100%
95%
78%
45%
26%
100%98%
87%
55%
33%
100%
99%
92%
64%
39%
Retu
rn P
erio
d (Y
ears
)
Current 2030 2050 2070 2090
2.23.12.8
4.13.4
5.4
3.8
6.4
5
10
20
8.6
6.8
5.54.1
1 in 1 Year 1 in 10 Year 1 in 20 Year
HIGH EMISSIONS SCENARIO (RCP 8.5)
76 / Climate change adaptation in the transport sector. Guidance manual

Projected changes in rainfall amounts for 24-hour duration events
The below three figures display how the intensity of various extreme rainfall events could change in the future due to climate change. The first figure shows the projected changes to extreme rainfall events that currently occur once every five years. The second figure shows projected changes for a 1-in-10 year rainfall event. And the third figure shows projected changes for a 1-in-20 year event. The figures demonstrate that, for example, a 1-in-5 year extreme rainfall event that currently generates 95mm of rainfall in a 24-hour period could be expected to generate 122mm by 2090, under a high emissions scenario (RCP8.5). The 5% and 95% values represent the lower and upper bounds of climate projections. This has implications for the design, construction and maintenance of transport infrastructure, and provides useful guidance for the planning of infrastructure with a longer design life, such as a bridge.
Rain
fall
in 2
4 ho
ur p
erio
d (m
m)
HISTORICAL 2030 2050 2070 2090
350
300
250
200
150
100
50
0
166
95
35
179
99
26
196
104
21
217
111
27
235
122
27
5% MEAN 95%
ARI5 Annual (RCP 8.5)
77

Rain
fall
in 2
4 ho
ur p
erio
d (m
m)
HISTORICAL 2030 2050 2070 2090
350
300
250
200
150
100
50
0
198
110
35
218
116
26
233
121
17
257
130
27
280
144
30
5% MEAN 95%
ARI10 Annual (RCP 8.5)
Rain
fall
in 2
4 ho
ur p
erio
d (m
m)
HISTORICAL 2030 2050 2070 2090
350
300
250
200
150
100
50
0
230
127
44
253
135
39
270
140
24
301
152
40
320
170
41
5% MEAN 95%
ARI20 Annual (RCP 8.5)
78 / Climate change adaptation in the transport sector. Guidance manual

Appendix B – Key Policies
Policy context for managing climate risk The external context for MID’s operations is influenced by relevant Solomon Islands Government policy objectives and initiatives, summarised below.
National Development Strategy 2011-2020This strategy aims to alleviate poverty and contribute to achieving the Millennium Development Goals. Of the eight development objectives, two are relevant to infrastructure: • Item 6: Develop physical infrastructure and utilities to ensure all Solomon Islanders have access to
essential services and markets• Item 7: Effectively respond to climate change and manage the environment and risks of natural
disasters.
National Adaptation Programme of Action 2008 The Solomon Islands’ National Adaptation Programme of Action (NAPA) aims to prioritise and rank key sectors of the economy requiring urgent and immediate adaptation actions. The program notes that the Solomon Islands already struggles to cope with a highly variable climate and that further climate change will increase pressure on sensitive environmental and human systems, including key infrastructure. The NAPA also notes that many roads, bridges, airports and wharves in the Solomon Islands are built in or near disaster-prone areas, highlighting that the protection and resilience of this infrastructure will be important for achieving long term sustainable development.
Because of this, infrastructure is identified as a key priority for adaptation and the NAPA has set a goal to ‘improve the resilience of key infrastructure to climate change and sea-level rise’.
National Climate Change Policy 2012-2017The National Climate Change Policy aims to link government, civil society and development partners in setting a strategic and coordinated approach to addressing climate change, and builds on the work completed as part of the NAPA. A key objective is to guide efforts in ensuring that the people, natural environment and economy of the country are resilient and able to adapt to the predicted impacts of climate change.
The policy states: ‘the Government of Solomon Islands considers it vital and urgent to develop the capacity of the country to assess risks and vulnerabilities associated with climate variability and change …’
Solomon Islands National Infrastructure Investment Plan 2012The Solomon Islands National Infrastructure Investment Plan (SI NIIP) outlines Solomon Islands priorities and plans for major infrastructure over the next five to ten years, focusing on strategic investments. In the transport sector, a number of projects across the maritime, aviation and roads sub-sector have been identified.
79

A key part of the SI NIIP was an assessment of the potential impacts of climate change and natural hazards on priority projects. The plan noted that effective management of these potential impacts would have cost and management implications, and therefore influence the effective planning of priority projects. Observations were also made in terms of managing climate change and natural hazards, including:• Low risk development is more cost effective than retrofitting. The increasing costs of upgrading and
maintaining infrastructure in highly exposed areas will increase the burden on the national budget.• Not all losses can be prevented, especially for low frequency and very high-intensity events. Effective
emergency response mechanisms are critical to minimising losses during inevitable hazard events.
The SI NIIP also noted that the general absence of spatial planning across the country will hinder the effectiveness of infrastructure planning into the future.
Operational context for managing climate risk MID is mandated to provide and manage infrastructure and transport services throughout the Solomon Islands, with the primary responsibility for roads, wharves and airstrips.
Plans and polices that direct MID’s organisational priorities and activities should inform management of climate risks at the project level. These plans and policies include the National Transport Plan, the National Transport Fund, and the MID Corporate Plan.
National Transport PlanThe National Transport Plan sets out the strategies, policies and immediate priorities for development of the Solomon Islands’ transport system. A key objective of this plan is to improve the resilience of the transport network to the impacts of climate change. The plan notes that ‘recent events have shown the vulnerability of elements of the transport network’ and identifies improved design standards and the selection of sub-projects which help to protect both the transport network and inhabited areas more generally as a key means of addressing these vulnerabilities.
National Transport FundThe National Transport Fund (NTF) is a key funding source for developing, maintaining and managing transport infrastructure in the Solomon Islands. The NTF can receive monies from donors and development partners, in addition to other Solomon Islands Government sources. The NTF is administered by a Board, charged with ensuring the NTF is managed in accordance with the requirements of the NTF Act and relevant regulations. Under the regulations, no funds can be released for projects unless they are specified in the NTP or are consistent with a clear statement of policy in the NTP.
80 / Climate change adaptation in the transport sector. Guidance manual

MID Corporate Plan The MID Corporate Plan is influenced by the institutional context previously outlined. The key objective of the plan is to stimulate economic development and improve connectivity in the Solomon Islands. The plan notes that the rehabilitation of existing infrastructure and construction of new infrastructure are both essential, not only to provide critical transport links but also to improve economic outcomes. The plan commits MID to the rehabilitation of social and economic infrastructure to create safe and sustainable transport linkages. The consideration of future climate hazards is fundamental to the provision of both safe and sustainable infrastructure that is resilient to current and future natural disasters and weather events.
81

82 / Climate change adaptation in the transport sector. Guidance manual

Appendix C - Risk assessment tools
Appendix C1 – Collecting local experiencesDuring the early phases of design for a new project, consultation with local communities can be used as a vehicle to understand more about historical and existing local conditions.
Solomon Islanders have coped with climate variability and extreme events since time immemorial. Traditional knowledge developed and refined over the years has been a feature of Solomon Islanders resilience and coping capacity (Solomon Islands National Climate Change Policy: 2012 – 2017).
Depending on the type of project under consideration, different questions will be more or less appropriate. Although the experience of the local community can be invaluable in interpreting the degree of climate variability and how this affects the local environment it is very important that consultation around climate variability and climate change is undertaken in an objective and neutral manner. This avoids bias in the respondents’ answers, and helps facilitate the collection of more reliable information. For example, instead of asking ‘have you noticed the sea levels rising in the recent past?’ it is better to ask ‘have you noticed any changes in the sea levels in the recent past?’
Below are some example questions that can be considered during local consultation. These example questions may need to be modified depending on the specific nature of the project, or the specifics of the project location (e.g. coastal as opposed to inland project).
Issues related to sea level: – Are there any places along the coast that are growing (accretion) or shrinking (recession)? – Have you noticed any changes in the sea level in the recent past? – If yes, what have these changes looked like? How have these changes affected the coastal
vegetation? – If there are near shore reefs, have you noticed any changes with how the waves break on the reefs
at high tide? – What is the highest level you have ever seen the sea? How far have you ever seen waves wash
inland?
Issues related to rainfall: – What happens when there is plenty of rain? Is there any flooding? If yes, how high do the
floodwaters get? Where do the floodwaters escape? How long does it take for the floodwaters to go away? Are there any places where the water stays after the flood (waterlogging)?
– During heavy rainfall, do the streams/rivers carry any big loads of debris? – In your lifetime, do you remember the streams/rivers moving around and changing their course?
How often does this happen? Do you know when this last happened? – If there are any coastal lagoons; how often is the lagoon open/closed to the ocean? When do
these changes occur?
83

Issues related to disaster/emergency management: – Have you ever had to evacuate because of a flooding, storm, or other natural disaster? – How did you evacuate, and where did you go to? – Are there any members of the community that you are more or less concerned about during an
emergency?
Issues related to existing infrastructure: – Are there any times when the road/wharf/airstrip cannot be used? Why does this happen?
84 / Climate change adaptation in the transport sector. Guidance manual

Appendix C2 – Instructions for using risk spreadsheetA risk spreadsheet was developed as part of this guidance manual and is available as an excel spreadsheet (available on the accompanying disk to this report). It can be used to assist in three steps of the adaptation process, that is, during:• risk screening (Step 2);• risk assessment (Step 3); and• deciding on the most important risks (Step 4).
The spreadsheet contains five tabs, or worksheets:1. summary sheet2. airports3. roads4. wharves5. risk assessment.
Summary Sheet – Use this sheet to enter key information about the project, including a brief description and the design life (or remaining effective asset life in the case of existing assets). Once the risk assessment is completed, this sheet will display the results including the number of different risks assessed, and the risk levels.
11
10
9
8
7
6
5
4
3
2
1
0
Risk
Dis
trib
utio
n
HighExtreme
Calculated Risk Summaries #
Extreme 0
High 5
Medium 10
Low 4
Medium Low
85

Tabs 2, 3 and 4 - Airports, Roads and Wharves – These three worksheets are designed to allow screening of each of these projects. Key project components are listed, along with key climate variables. Users are required to choose the nature of the relationship between the climate variables and the project components, choosing from the drop down list. Once the screening is complete, risk statements can be developed in line with the guidance presented in Step 2.
Risk assessment – Use this worksheet to enter the risk statements developed from the screening process, and then select the relevant consequence and likelihood options from the inbuilt drop down list. Use the spaces provided to include any aspects that have influenced the decision to select one consequence or likelihood over another. These spaces can also be used to note any uncertainties involved in forming these decisions. The risk levels are then calculated automatically in the spreadsheet.
86 / Climate change adaptation in the transport sector. Guidance manual

Appendix C3 - Examples of risk statements
Risk statements for roads – Increased severity of tropical cyclones results in greater road corridor obstructions as a result of
storm debris. – Increase in extreme rainfall leads to failure of bridge and culvert embankments impeding
vehicle access. – Increase in extreme rainfall, causes greater degree of pavement erosion impeding vehicle access. – Increase in extreme rainfall results in greater loads of flood debris, higher flow velocity and
catastrophic failure of minor watercourse crossing structures. – Increase in extreme rainfall events leads to a greater incidence of landslides and mudslides that
damage pavements and drainage structures, and impede vehicle access. – High tides inundate low lying pavements causing accelerated degradation. – Storm surge and wave action generally on top of a high tide and sea-level rise causes substantial
damage to road pavement in low lying areas. – Increase in extreme rainfall results in greater loads of flood debris, higher flow velocity and
complete failure of major watercourse crossing structures. – Road pavement in low lying areas is subject to temporary inundation following storm events,
impeding vehicle access. – Minor watercourse crossings within close proximity to the shoreline are subject to increased
scour from storm surge, leading to reduced effective design life. – Major watercourse crossings within close proximity to the shoreline are subject to increased
scour from storm surge, leading to reduced effective design life. – Increased levels of atmospheric CO2 lead to faster deterioration of concrete structures, and a
reduced effective design life. – Increase in extreme temperature events causes thermal expansion in bridges and a reduction in
effective design life. – Increased severity of tropical cyclones results in greater loading on bridge structures. – Increase in extreme rainfall results in more debris impeding road access. – Increased tropical cyclone severity and extreme rainfall results in greater blockages of minor
drainage infrastructure, and the need for increased maintenance. – Increased variation in wet/dry spells and decrease in available moisture may cause degradation of
road pavement. – Increase in ocean acidity causes accelerated degradation of bridge piers. – Increase in mean sea levels cause a reduction in the effectiveness of coastal vegetation buffer,
leading to damage of road pavement and structures from coastal erosion.
87

Risk statements for airports – Continued sea-level rise exacerbates coastal erosion causing a reduction in the length of the
runway. – Increase in the frequency and intensity of extreme rainfall causes temporary flooding of the
runway. – Increase in the severity of tropical cyclones results in the damage of navigational aids. – Storm surges, combined with continued sea-level rise causes temporary inundation of the
runway. – Increase in the severity of tropical cyclones, reduces the safety of the existing fuel storage
facilities. – Existing maintenance operations are unable to effectively respond to an increase in debris on the
runway/airside apron from extreme rainfall events, and flood debris. – Existing maintenance operations are unable to effectively respond to an increase in debris on the
runway/airside apron from tropical cyclone events, including potential more severe tropical cyclones.
Risk statements for wharves – Wharf deck design, as a result of sea-level rise restricts the ability of some maritime traffic to
effectively utilise the wharf. – Existing coastal process combined with higher sea levels reduce the effectiveness of coastal
protection, leading to instability of the approach jetty and causeway. – Extreme sea levels reduce the stability of the approach jetty and causeway. – Extreme sea levels adversely impact on the stability of the wharf. – Tropical cyclones affect the ability of maritime traffic to utilise the wharf. – Debris from tropical cyclones causes debris to block land access to the wharf. – Increased levels of atmospheric CO2 lead to a faster deterioration of concrete structures. – Extreme rainfall events cause degradation of causeway. – Construction of the wharf structure results in changes to local currents, which in turn affect
stability of approach jetty and causeway. – Sea-level rise affects the stability of the wharf structure.
88 / Climate change adaptation in the transport sector. Guidance manual

Appendix C4 – Instructions for multi-criteria analysis templateThe Multi-criteria Analysis Template developed as part of this guidance manual can be used to assist in the shortlisting of potential adaptation options, as described in Step 6 – Shortlist and appraise options. The template is a spreadsheet that contains five tabs described below:
1. Start – Use this tab to enter details about the project and the risk to be treated (usually a ‘high’ or ‘extreme’ risk identified from Step 4). Also enter the options being considered to manage this risk, using the information contained in Step 5 as a starting point.
2. Assessment Criteria – The template already has a set list of assessment criteria, which may be suitable for your analysis, otherwise replace these criteria with criteria that are relevant to the analysis being undertaken (maximum 15 criteria). Rate the relative importance of each criteria from the drop down list – this will weigh the analysis, in other words, place importance on certain criteria vs other (NB: the results will be presented for both ‘raw’ scores and ‘weighted’ scores).
3. Evaluation – Choose from the drop down list how each option performs relatively against the criteria. For each option being evaluated, allocate a score for the perceived performance of that option relative to the specified criteria. Use a scale of 2 to -2, where ‘2’ represents the best performance, and ‘-2’ represents the worst. For example a cheaper option would have a higher score than a more expensive option against a criterion of ‘indicative cost’.
4. Results – The results of the analysis are presented with ‘traffic light’ formatting - green colours indicate better scores, with red colours representing the worst performing options. A graph is also automatically generated of the results.
5. Weightings - The weightings on this page are derived from the Assessment Criteria page, and should not be changed here. To ensure that the chart accurately displays all criteria, click on the pie graph and drag out the box covering the source data.
89

90 / Climate change adaptation in the transport sector. Guidance manual

Appendix D – Catalogue of adaptation option factsheetsG1 – Increasing Contingency Budgets and Developing Disaster Response Plans
Overview
Contingency budgets could be reserved for responding to unforeseen events, most typically natural disasters and emergencies. Climate change is expected to exacerbate some of these natural disasters, and therefore increased funds and ‘ready to enact’ response plans for typical emergencies will assist in recovering from events that are likely to happen. In Guadalcanal, for example, it is not uncommon for bridge approaches to be cut after significant flood events. Being able to rapidly restore this link is critical for community and industry alike.
Advantages and Opportunities Challenges and Disadvantages
• Facilitates rapid restoration of service for the affected part of the transport network, thereby limiting impacts to the community or industry.
• Generic designs can be developed to respond to typical situations.
• Can prevent the worsening of a situation by addressing issues early.
• Promotes confidence in the Ministry that funds are available to respond quickly as needed.
• Different disasters and emergencies will require different responses; this approach may not be suitable for all situations.
• Some stakeholders could debate the value of quarantining budgets for specific contingencies, given that it may reduce funds available for other needs.
• Transparent selection criteria for candidate projects are required to ensure funds are disbursed for pressing emergencies only.
Indicative costs • Costs for contingency works are typically derived from existing budget streams, which can either take time for approval, take time to reconcile after the fact, and affect planning priorities for other projects.
Timing for implementation • Immediately post disaster or emergency.
Governance and Operation • In order to function effectively pre-qualified contractors need to be identified, with agreed rates for typical activities, or set daily rates.
• MID supervisors or representatives need to oversee works to ensure that the Ministry is receiving value for money, and designs are adequate for implementation.
91

Acceptability • Rapid response following natural disasters and emergencies would have a high level of community and stakeholder acceptance.
Feasibility and Technical Requirement • Basic stores and equipment need to be available and stored for rapid deployment, for example: sheet piling, gabion baskets, bailey bridges, geofabric etc.
G2 – Vulnerability Mapping
Overview
Vulnerability mapping can assist policy-makers as well as external donors in better targeting their support towards climate change efforts. Vulnerability in a climate change context is defined as the degree to which a system is susceptible to, or unable to cope with, the adverse effects of climate change, including climate variability and extremes. It can be mapped as a function of the character, magnitude, and rate of climate variation to which a system is exposed, its sensitivity, and its adaptive capacity. For a road network for instance, vulnerability mapping could prioritise areas for future works or identify areas more likely to suffer damage from extreme events.
Advantages and Opportunities Challenges and Disadvantages
• Can be linked in with the asset management unit within MID to obtain up to date vulnerability mapping following asset condition surveys.
• Excellent for communicating asset vulnerability or scales of issues to decision makers.
• Can be used to support funding applications or budget submissions.
• Can support ongoing strategic planning priorities.
• Can be linked with other ongoing mapping initiatives, e.g. the MECDM-run SICAP project.
• Requires relatively high quality data to enable reliable and meaningful results.
• Spatial information is limited at the present time within the Solomon Islands.
• Data acquisition can be costly, and can require sophisticated data storage and retrieval systems
• For ongoing value, requires ongoing maintenance.
Indicative costs • Costs can vary depending on the methods used to collect, interpret and store data.
Timing for implementation • Can be completed at any time; however, to remain valuable requires periodic updates (approximately five years).
92 / Climate change adaptation in the transport sector. Guidance manual

Governance and Operation • Vulnerability mapping can have benefits for a number of Ministries, and in this respect there is an opportunity to share costs in the development of the mapping.
Acceptability • Are an easy way to represent sometimes complex issues, and therefore a valuable communication tool that would likely have high community and stakeholder acceptance.
Feasibility and Technical Requirement • Requires a Geographic Information System (GIS) capability.
• The collection of existing asset and natural environment information should be gradually developed to ensure that it is future compatible with such a system, i.e. can be spatially referenced.
• Requires an overarching vulnerability framework such that vulnerability information can be correctly calculated and presented.
G3 – Early Warning Systems
Overview
Climate change projections for the Solomon Islands show an increasing frequency and intensity of extreme rainfall events for the 21st Century. Early Warning Systems (EWS) are increasingly recognised as a critical tool for the saving of lives and livelihoods, and there are increasingly more investments by national and local governments, international development agencies, and bilateral donors to support such systems. The primary objective of an Early Warning System (EWS) is to empower individuals and com munities threatened by hazards to act in time and in an appropriate manner to reduce the possibility of personal injury, loss of life, damage to property and the environment, and loss of livelihoods.
Advantages and Opportunities Challenges and Disadvantages
• Offers advantages over the current situation by communities and businesses being able to prepare for upcoming flood events
• Provides MID with the opportunity to be ready for any urgent maintenance or recovery works before events happen.
• Lack of forecast skill makes it is very difficult to issue flash flood warnings several hours in advance based upon quantitative precipitation forecasts.
• Lack of catchment modelling, or awareness of the relationship between rainfall and runoff provides a significant challenge.
93

Indicative costs • Cost for an EWS system is likely to be significant, and could potentially only be justified in strategic locations e.g. Guadalcanal Plains
Timing for implementation • Needs to be developed over a long period of time. A full system could take years to successfully design, implement and test.
Governance and Operation • Consistent with the Hyogo Framework for Action 2005-2015: Building the Resilience of Nations and Communities to Disasters
• Requires political commitment and dedicated investment
• Would require ownership by one key line Ministry
Acceptability • Would likely be positively received by the community and relevant industry stakeholders who would benefit from early warning advice.
Feasibility and Technical Requirement • Require development and strengthening of core capacities such as hydro-meteorological observing networks, 24/7 forecasting systems, and communication systems.
• Requires experience in sensor equipment design, installation and technical maintenance, along with ICT for sensor data transmission, filtering and analysis.
• Requires the development of a decision support system that will assist public authorities and citizens in choosing the right flood protection tactics and in managing emergency situations;
• Would benefit from internet-based or dedicated remote access to the early warning and decision support systems.
94 / Climate change adaptation in the transport sector. Guidance manual

G4 – Erosion Protection (Solid Structures)
Overview
Erosion protection from solid structures can either take the form of a sloping revetment or a near vertical wall. Revetments are built along the seafront, preferably above the run-up limit of waves under normal conditions. Where frequent wave attack is anticipated, the revetment may be topped by a vertical or curved wall to reduce overtopping.
Vertical seawalls are typically made of concrete, masonry or sheet piles, designed to withstand severe wave attack. Their use was popular in the past but they are now normally considered to be costly, and in some cases can have detrimental impacts to the ecology of the near shore environment. They can possibly be used to support a range of asset types in coastal areas.
Advantages and Opportunities Disadvantages
• Can be useful in the protection of high value assets
• Can prevent coastal flooding in some situations
• Often involves a reduction in available uses of near shore areas.
• Can be costly to build and maintain
• Because they do not reduce wave energy, but reflect it, sea walls can result in substantial erosion in other areas.
Indicative costs • Often the most expensive form of erosion protection in coastal areas.
• May be as high as SBD$15,000 – 20,000 per lineal metre
Timing for implementation • Normally completed during construction of adjacent assets, but can be retrofitted in some circumstances to protect high value assets.
Governance and Operation • If in a populated area, will usually involve consideration of how people can use the area, including escape ladders if there are vertical sea walls.
Acceptability • Can be supported when protecting high value, at risk assets, but can also increase erosion in other areas, or change the dynamic of the immediately surrounding coastal area with more erosion or deposition possible.
Feasibility and Technical Requirement • Can be complex to design, engineer and construct.
• Requires a good understanding of the local wave climate of an area.
Image courtesy of Hilary Perkins
95

G5 – Mechanical Lagoon Opening
Overview
Heavy equipment, such as excavators, is used to artificially open lagoons by digging a channel through the berm between the lagoon edges to the ocean. When water levels rise in a closed lagoon following rainfall this can lead to flooding. Mechanically opening the lagoon can mitigate and reduce the impacts of flooding. Mechanical opening of the barrier is undertaken to ‘drain’ the lagoon to the ocean and lower water levels to relieve existing flooding of foreshore development and infrastructure or avoid the likely threat of flooding which would occur before the lagoon entrance opens naturally.
Advantages and Opportunities Disadvantages
• Can reduce afflux during flooding events that affect local infrastructure or communities.
• A relatively inexpensive and rapid solution to manage potential impacts from coastal riverine flooding
• Can have adverse environmental impacts via a reduction in local water quality.
• Measure is usually only effective for a short period of time – after which the lagoon will typically reclose as a result of sedimentation.
• Depending on the time undertaken may result in temporary upstream influx of tidal waters, until water levels reach equilibrium.
Indicative costs • Cost involved essentially involve the hire of heavy machinery for the duration of the lagoon opening exercise, likely to be less than two days
Timing for implementation • Can be undertaken prior to imminent flooding event, or at the commencement of the west season, where specific flooding risks are identified.
Governance and Operation • May require consultation with local communities prior to works commencing, given the expected changes in the dynamics of the river/coastal interface.
Acceptability • May be unacceptable to some stakeholders given that it involves intrusive in stream works.
Feasibility and Technical Requirement • Mechanical opening can be undertaken within 1-2 days with the use of heavy earthmoving equipment.
96 / Climate change adaptation in the transport sector. Guidance manual

G6 – Post Storm Inspection and Maintenance
Overview
Storms can generate a lot of damage, as a result of heavy rain causing erosion, localised flooding and scour, and the blocking of drains, culverts and bridges with a range of debris. This is particularly so in areas that are currently undergoing logging activities. Early inspections and maintenance of key infrastructure immediately following storm events can quickly restore access or service, and also prevent further damage or destruction of assets as a result of subsequent storm events.
Advantages Disadvantages
• Can assist in managing minor issues with drainage infrastructure prior to subsequent flooding events causing greater damage.
• Investments in early maintenance typically are less expensive than delayed maintenance activities.
• Can reduce the incidence of failure of an asset, particularly bridge structures, as the opening for floodwaters to pass is maintained.
• In the short term, may require additional resources relative to those currently available.
• Can be difficult and time consuming to inspect assets across the transport network, particularly in more remote locations.
• Given the availability of weather observations, and communications, it can be difficult to appreciate when a storm actually passes through a given area.
• Cannot prevent significant asset damage from extreme events like cyclones.
Indicative costs • Costs can be controlled, and is a generally cheaper form of maintenance than reactive maintenance following significant damage or loss of service.
Timing for implementation • Should be completed following substantial storm events, whenever they occur. Will typically occur more frequently during the wet season.
Governance and Operation • Can be outsourced to local communities to undertake using labour-based methods. Such a scenario would typically require supervision or verification that results were satisfactory and value for money was being achieved.
• Consistent with best practice asset management as opposed to only utilising reactive maintenance, when assets fail.
• To be effective, without monitoring all assets, such a program requires the identification and prioritisation of key assets within a transport network.
97

Acceptability • Generally comes with a high level of community acceptance, as there is a visible and proactive asset management response.
Feasibility and Technical Requirement • Can be completed with a small crew. Equipment can include chainsaws, excavators, and tipper trucks.
• Requires the definition of a ‘substantial storm’ and the identification of ‘key assets’ within the program
G7 – Erosion Protection (Riprap Structures)
Overview
Riprap protection is the installation of large rock components placed in loose form on defined slopes (not generally exceeding 1 vertical in 2 horizontal) to protect against erosion and to dissipate wave energy. Structures built from riprap are flexible, do not fail under minor shifting, and generally can be easily constructed and repaired. The main limitation of riprap protection is that it is not suitable for steep slopes that cannot be re-graded to a lower angle. Can be used to protect a range of asset types, in both coastal areas, and in river environments.
Advantages Disadvantages
• Effective at reducing wave run up, reflection and overtopping.
• Can utilise waste concrete rubble and other materials available at hand.
• Requires the use of heavy machinery.
• Can be difficult to obtain suitable rock material.
• Can be ineffective during extreme storm events.
Indicative costs • If appropriate riprap material is available, then this approach is usually the cheapest form of coastal protection.
Timing for implementation • Can be undertaken at anytime.
• Can be undertaken during emergency situations, e.g. extreme seas, to help protect assets.
Governance and Operation • A relatively cheap, fast, and proven means to establish coastal protection.
• May require minor maintenance works, or the addition of extra boulders following settling or large storm events.
• Will eventually require replacement.
98 / Climate change adaptation in the transport sector. Guidance manual

Acceptability • In general riprap is well-accepted means of establishing coastal protection. In some locations, particularly tourist facilities, riprap may be perceived to have a negative visual appearance.
Feasibility and Technical Requirement • Requires the use of heavy machinery, to extract the material from the source, transport to the coastal location, and place the material in the correct position.
• Where hard rock, or other suitable material is locally not available, concrete can be cast in specially designed moulds to produce appropriate structure, often referred to as tetrapods, for use in coastal protection.
G8 – Erosion Protection (Gabion Baskets)
Overview
Gabions are wire mesh baskets filled with cobbles or crushed rock. They are filled insitu, often with locally available material and therefore have a relatively low capital cost. Because they are flexible and porous they can absorb some wave and wind energy, thereby reducing the scour problems associated with impermeable sea defences such as concrete seawalls. Gabions can be placed as sloping ‘mattresses’ or as near vertical cubic baskets. The latter are intended for bank or cliff stabilisation and are not normally suitable for use in shoreline situations
Advantages Disadvantages
• Useful solution where armour rock is considered inappropriate or too costly. Various forms available.
• Can be buried by sand and vegetation.
• Permeable face absorbs wave energy and encourages upper beach stability.
• Limited life, leading to unsightly and hazardous wire baskets along beach and the release of non-indigenous cobbles to the beach system.
• Wire affected by saltwater, vandalism and abrasion by trampling or gravel beach impacts.
Indicative costs • $1,500 (SBD) per cubic metre.
• Often used as a benchmark coastal protection technique for comparisons purposes with other techniques.
Timing for implementation • Can be constructed at anytime, but normally requires some basic site preparation, and is therefore easiest to construct at the same time as other works are being carried out.
99

Governance and Operation • Can be completed under labour-based contracts, with local communities being involved in the construction. Would require adequate supervision and training in such a scenario.
Acceptability • Generally well accepted by local communities.
• Can sometimes be cut by local communities following construction to obtain cooking stones, or for other site-specific reasons.
Feasibility and Technical Requirement • Well-established form of coastal protection.
• Requires the construction of or purchasing of specialised wire baskets that are then filled with available rocks to provide weight, and structure.
• Requires appropriate closure of the baskets to ensure gabions retain their shape.
• Adjoining gabions must be wired together by their vertical edges
G9 – Erosion Protection (Sand Container Bags)
Overview
Sand bags of various sizes and lengths can be used to form temporary reefs, breakwaters, groynes, headlands or revetments. Purpose designed geotextile bags are filled in-situ with local sand or equivalent and therefore have a relatively low cost. The larger the sand bag the greater the protection from extreme events. Some bags can hold more then 2 cubic meters of sand, weighing in at over 4,000 kg. Depending on the size of bags used, heavy machinery may be required to lift and place the bags.
Advantages Disadvantages
• Have proved extremely resilient in coastal environments, including during category five cyclones.
• Useful solution where armour rock is considered inappropriate or too costly.
• Various forms available depending on the nature of the wave or erosion environment.
• An alternative to rip rap, when large boulders are unavailable.
• Bags can be affected by vandalism and abrasion, especially immediately post installation.
• Heavier bags require specialised equipment for loading and placement.
• Can have a long lead-time from ordering to delivery in the Solomon Islands, sometimes up to four months.
• Unproven in riverine environments with heavy flooding and debris loads.
100 / Climate change adaptation in the transport sector. Guidance manual

• Can take advantage of locally available fill materials.
• Can be used on steeper slopes than rip rap
Indicative costs • $2,000 - $3,000 (SBD) per cubic metre.
Timing for implementation • Can be constructed at anytime, but normally requires some basic site preparation, and is therefore easiest to construct at the same time as other works are being carried out.
Governance and Operation • Bags will form a hard layer on the outside as sand material builds up within the structure of the fabric.
• Once established require very little maintenance.
• Different specifications can offer protection from vandalism in the form of slashing. Small tears, or holes can be remedied with a specialised repair kit.
Acceptability • Sand container bags are typically well accepted by the local community, although the application to date in the Solomon Islands to date is limited.
Feasibility and Technical Requirement • For the larger bags, specialist filling and placement equipment may be required.
• A swamp bucket on an excavator can be used to place the bags, where specialist bucket attachments are not available.
• Care needs to be taken in placing the bags that they do not tear.
• Design of the sand container bag structure needs to consider potential for scour at the ends of the installation and at the toe. Installation of a sheet of geofabric protecting the toe is often recommended.
101

G10 – Sheet Piling
Overview
Steel, concrete, wood, or plastic sheet piles that interlock to form a continuous wall along a stream channel. The wall may be partially supported by anchors imbedded in the soil behind the wall, called tiebacks. Create a temporary or permanent wall that retains soils, usually along highly eroded and steep to sheer stream channels. Can be used in channels of all types and size, particularly channels with widely fluctuating water levels, and with high velocities, like the Solomon Islands. Ideal for locations where permanent channel obstructions such as bridge abutments contribute to significant erosion.
Advantages Disadvantages
• Low maintenance.
• Can provide permanent stability if necessary.
• Prevents erosion and scouring in immediate area of sheet piling.
• May be used along channels where space prohibits the construction of other structures that require more space to work.
• Expensive, and requires the use of heavy equipment.
• Cannot generally be used in areas where boulders or bedrock restrict the sheets from reaching suitable depth.
• Should not be used to create very high walls.
• May exacerbate downstream erosion problems if not installed properly.
• Must be reviewed by a structural engineer for stability, prior to installation
• May transfer erosion downstream from sheeting if not properly transitioned.
Indicative costs • Costs vary, and can be quite expensive, particularly when materials need to be ordered and shipped from overseas.
Timing for implementation • Can generally be completed at any time, either during construction of new assets, or at other times with adequate preparation for existing assets.
Governance and Operation • Requires very little maintenance once installed.
• May require infrequent monitoring to ensure that system is functioning effectively, and transferring erosion issues elsewhere.
Acceptability • Can be perceived as having negative visual impacts, and therefore may not be suitable in all applications.
102 / Climate change adaptation in the transport sector. Guidance manual

Feasibility and Technical Requirement • Often sheet steel is not available in the Solomon Islands, and therefore needs to be ordered ahead.
• The most common methods for installing sheet piling are driving with traditional pile driving equipment. Other installation methods may be available, however the type of sheet piling used will normally govern the method of installation.
R1 – Raising the Pavement Level
Overview
In low lying areas, the road pavement is likely to become more inundated more often, as a result of flooding from increased frequency and intensity of rainfall events, and also as a result of rising sea levels. One approach to respond to this inundation is to lift the road pavement higher, above areas likely to be inundated. By importing fill material the road pavement can be raised; however, this may cause localised increases in flooding and would typically only be a medium term solution.
Advantages Disadvantages
• Offers a cheaper and faster alternative to realigning a road corridor away from the coast.
• Can be staged so that additional height can be added during major maintenance activities.
• Poor design could result in increased upslope flooding as the pavement acts as a barrier to overland flows.
• Can require a substantial amount of fill material.
• Is realistically only a temporary solution, as sea levels rise, the pavement will be inundated.
Indicative costs • Given the amount of fill required, this can be a costly exercise. For localised areas it can be a cost effective option, but generally not for long areas of coastal road potentially subject to inundation.
Timing for implementation • Typically should be completed during major rehabilitation or maintenance activities on existing assets.
Governance and Operation • Given the nature of the environment, other issues may need to be considered in any design response, for example coastal protection.
• Can be used as a trigger for a wider discussion about eventually realigning the asset away from the coastal zone.
103

Acceptability • Can result in localised flooding from the raised pavement acting as a barrier to water movement. This would be unacceptable to many community members.
Feasibility and Technical Requirement • Raising the pavement would normally need to be undertaken in conjunction with the installation of additional drainage, and may also require the installation of coastal protection.
R2 – Green Belts
Overview
A green belt is an area of vegetation that runs parallel to the shoreline, and between the coastal environment and the roadway. It can consist of a variety of vegetation, depending on the local site-specific characteristics. Given the usually wet nature of the soil some plant species will do better than others, for instance, Mangrove species or Sago Palm. The green belt acts as a first line of defence during extreme sea level events, and can substantially reduce the impacts on infrastructure and communities. Experiences show that areas with effective green belts can also be protected to a large degree from other natural hazards, like tsunamis.
Advantages Disadvantages
• Low cost solution.
• Can support labour-based engagement with the local community.
• A true ‘no regrets’ solution, addressing adaptation, assisting in carbon sequestration, and support local community livelihoods.
• Effective at reducing the impacts from other natural hazards, e.g. tsunamis.
• Can take some time to establish.
• Requires ongoing stewardship to ensure that it does not become degraded and then ineffective.
• Can involve a substantial land footprint in some situations, requires agreement with local landholders.
• May not be feasible in areas where communities or assets are already located too close to the coast, or areas where the coastline has already advanced too far inland.
Indicative costs • Can be cheaper than traditional hard engineering solutions if agreement can be reached with local landholders.
Timing for implementation • Can be developed at any stage, and even applied to existing infrastructure and assets, should sufficient land be available.
104 / Climate change adaptation in the transport sector. Guidance manual

Governance and Operation • Requires an agreement with local landholders to have an area retained in a natural state to provide protection from extreme sea level events.
• May also require an agreement or contract to manage the area in the long term.
• Requires local landholders foregoing any other rights to that area, e.g. to log the area, or remove or harvest vegetation.
• Management of the green belt could be included to be part of existing labour-based activities for a road.
Acceptability • Can be an acceptable solution for asset managers and local communities alike if the agreements are comprehensive. Can provide an additional revenue stream for local communities.
Feasibility and Technical Requirement • Requires retention of healthy vegetation along the coast to provide a buffer to the road. A minimum of at least 30 m of green belt would be recommended, although the larger the belt, the greater the protection.
R3 – Improved Bridge Stability – Bendway Weirs
Overview
Bendway weirs act to alter the flow pattern and divert flow away from a channel bank or structure to be protected. Bendway weirs are normally not visible, especially at stages above low water, and are intended to redirect flow by utilising weir hydraulics over the structure. Flow passing over the bendway weir is redirected such that it flows perpendicular to the axis of the weir and is directed towards the channel centreline. This can be a more cost-effective alternative to continuous bank stabilisation in areas where more space for channel adjustment may be allowed. They are constructed transverse to the flow path, and at levels approximately equal to 1.5 ARI flow. They can be constructed out of a range of materials but are typically from large boulders or cobbles.
105

Advantages Disadvantages
• Useful for bank or asset protection.
• Flow can be redirected and predicted (even downstream of the weir field).
• Weirs can be retrofitted after project completion to improve project effectiveness, and costs are competitive or lower than traditional methods.
• Flow patterns in the bends are generally parallel with the banks (not concentrated on the outer bank of the bend).
• Limited application.
• Can be difficult to design – requires a thorough understanding of stream dynamics and bendway weir theory, prior to design and installation.
• Requires a readily available source of hard rock material.
Indicative costs • Relatively cheap solution, however does require the use of heavy machinery and available rock material.
Timing for implementation • Can be installed at any time in the project cycle, either during construction of bridge assets, or following identification of scour issues.
• Best to be constructed during the dry season when flows are smaller.
Governance and Operation • No specific issues identified beyond those that already apply to the management and operation of existing river training works.
Acceptability • Would likely be acceptable to community except in situations where there is a perceived correlation between the installation of bendway weirs and localised flooding. In these situations local community members may seek to dismantle parts of the system.
Feasibility and Technical Requirement • Each stream channel and project site is unique. Geomorphic characteristics, such as meander pattern, width/depth ratio, radius of curvature, particle size distribution, channel gradient, and pool/riffle spacing, all impact the effectiveness of bendway weirs.
• Onsite evaluation of the appropriateness and utility of bendway weirs is necessary.
• They are most effective in gravel and cobble bedded streams with slopes less than 3%.
106 / Climate change adaptation in the transport sector. Guidance manual

R4 – Drainage Redundancy
Overview
Drainage redundancy is an umbrella term used to describe the practice of increasing the size of drainage assets to take into account projected increases in extreme rainfall events. For example, a particular culvert might be currently rated as sufficient for a 1-in-5 year event; or, in other words, on average the culvert might be overtopped once every five years. With climate change projections showing that these events would occur more frequently, the same culvert would in the future become overtopped more frequently than every five years. By increasing the size of these drainage assets the current level of service can be maintained into the future.
Advantages Disadvantages
• Provides greater protection from increased extreme rainfall events.
• Relatively simple way to address future impacts from climate change.
• More expensive than current design approach.
• May involve bridging some larger watercourses that are too big to cross with culverts or other drains.
Indicative costs • Costs are not expected to be significantly greater than current drainage costs.
Timing for implementation • Needs to be considered during rehabilitation projects, and new projects during the initial concept design phase.
• Expensive and difficult to retrofit already completed road projects.
Governance and Operation • No specific issues identified beyond those that already apply to the management and operation of existing drainage assets.
Acceptability • Would likely be seen as a positive initiative by local communities as the flood resilience is increased.
Feasibility and Technical Requirement • Requires an understanding of the local flood environment, and clear objectives around the desired level of flood immunity for the crossing or drainage structure.
• Currently there are no universal design specifications for these issues, and therefore designs are typically developed on an ad hoc basis.
• In developing the design for the larger drainage assets, consideration should also be given to the design and how this may be affected by debris (timber in rural catchments and plastic and other solid waste in urban catchments).
107

R5 – Deviation from existing alignment
Overview
For some road projects, particularly those located adjacent to the coastline, the only long term solution to addressing risks from a rising sea level is to realign the road away from the coastal area, and avoid the coastal zone. Realigning a road removes the hazard of coastal erosion out of the equation, but involves the acquisition of a new road easement, and the construction of a new road. In addition, given the prevailing topography of the Solomon Islands, moving a road inland may have to deal with steeper slopes, and potential hard rock, which present a range of challenges and risks in themselves.
Advantages Disadvantages
• Can be used to effectively avoid a range of natural hazards.
• Provides the best means of dealing with a rising sea level in the long term.
• Reduces the amount of money that needs to be spent on maintaining an existing asset in a hazard zone.
• May introduce new hazards in the form of steeper slopes (landslides).
• Can be very expensive, when land acquisition is involved, and the construction involves substantial engineering challenges, e.g. rock breaking, steep slopes etc.
• Can take a long time to develop a new alignment, including negotiations with affected local landholders.
Indicative costs • Can be very expensive depending on the specifics of the realignment, the length, and the type of environment that the new road needs to be constructed in.
• Compensation may also need to be factored into the cost equation.
Timing for implementation • Works to create a deviation away from an existing alignment involve substantial engineering considerations and can require lengthy landholder negotiations to secure access to a new corridor. It is reasonable to expect that these activities could be upwards of two years.
Governance and Operation • Requires a commitment from government and long-term planning around realignment.
• Requires transparent consultation with the local community if they are likely to be affected by the realignment.
108 / Climate change adaptation in the transport sector. Guidance manual

Acceptability • Moving an existing road can be adversely perceived when communities rely on existing passing trade for part of their livelihoods.
• Creating a new alignment can result in substantial impacts to local communities and will inevitably require compensation.
Feasibility and Technical Requirement • Feasibility varies on a case-by-case basis.
• Realignment essentially involves the construction of a new road on a new alignment, and tying into an existing road.
R6 – Improved catchment management
Overview
Improved catchment management involves the implementation of a range of land management activities that over time help to reduce the amount of debris being washed downstream. It can also assist in improving water quality, and reducing the severity of some downstream flooding impacts. Given the prevalence of logging – both legal and illegal – across the Solomon Islands, this option cannot be seen as a short-term fix. To be effective this option needs engagement with a range of local, government, and industry stakeholders to reach an agreement on how such a system could work, what the key responsibilities are, and how the system could be funded.
Advantages Disadvantages
• Can reduce the incidence of large woody debris affecting downstream drainage structures including bridges and culverts.
• Can improve water quality, and provide other local livelihoods in the long term with non-timber forest products.
• Provides a more equitable sharing of ecosystem services than clear fell logging, where benefits are often shared with a small number of individuals, and costs are shared widely across the community.
• Could become part of logging rehabilitation activities, paid for by the logging company, to establish and monitor new forest areas following logging.
• Can take a long time to conceive, establish and become effective.
• Often requires the agreement of a large number of stakeholders and interested parties.
• Is not guaranteed of being effective, especially when significant rainfall events undermine efforts to re-establish vegetation.
• Reduces the ability of communities to gain income from forest timber products.
109

Indicative costs • Costs can vary widely depending on the size of the catchment, and the complexity of the stakeholder landscape.
• Improved catchment management may involve some form of compensation to local landholders for the reduction in available uses for their land.
Timing for implementation • Can be undertaken at any time, although to be successful requires a long lead time, and does not become effective until soils are stabilised and trees become established.
Governance and Operation • Requires commitment from government agencies, and cooperation from all affected communities.
• Can take some time and effort to establish common objectives with affected stakeholders and agree on roles and responsibilities.
• Could be mandated as part of existing forestry approval that rehabilitation occurs.
• To be effective would also require increased enforcement of any illegal logging.
Acceptability • Removes the ability of land to be used for the extraction of timber resources, and can therefore have associated livelihood impacts.
Feasibility and Technical Requirement • Requires a commitment to prevent large scale logging activities.
• Requires the development of a long-term rehabilitation plan that involves species selection, weed management, monitoring, and enforcement.
• Day-to-day activities of improved catchment management could be contracted to local communities under labour based contractual arrangements.
110 / Climate change adaptation in the transport sector. Guidance manual

R7 – Flood risk studies
Overview
A flood study is a comprehensive technical investigation of flooding behaviour that defines the extent, depth and velocity of floodwaters for floods of various magnitudes. A flood study is the principal technical foundation from which a floodplain management plan is formulated. The two principal components to a flood study are the hydrologic analysis or estimation of flood discharges for floods of various magnitudes; and the hydraulic analysis or determination of the extent, depths and velocities of flooding for a given area. A flood study is often used as the basis for determining potential bridge options, and determining the desired or realistic flood immunity level that is possible in given locations.
Advantages Disadvantages
• Can provide very detailed understanding of the flood risk for a given location.
• Can assist in making strategic land use decisions, or identifying potential transport infrastructure alignment options.
• Provides an understanding of the scale of a ‘worst case’ scenario, therefore assisting in effective emergency and disaster management planning.
• Opportunities for cost sharing with other agencies and stakeholders, e.g. Industry, or MDPAC.
• Requires high quality information on the characteristics of the catchment, including topography, land use, soil type and geology.
• Requires detailed understanding of rainfall characteristics across the catchment, particularly up in the catchment, where currently no rainfall monitoring occurs in the Solomon Islands.
• Requires specialist skills to develop the models.
• Will always retain some levels of uncertainty.
Indicative costs • If the required information is available, then flood studies can be completed in a short timeframe, with relatively minimal cost.
• Where the required information is not available and needs to be acquired, and skills need to be brought in, the costs can rapidly escalate.
Timing for implementation • Ideally should be prepared before making detailed decisions about land use planning, or the design of particular bridge options.
Governance and Operation • Flood risk studies and associated maps can sometimes contain sensitive information that could impact on the value of property (if for example a certain land parcel is identified as being in a flood risk zone). Information therefore needs to be managed carefully.
111

Acceptability • Flood studies would be unlikely to experience any community opposition.
Feasibility and Technical Requirement • Realistically only feasible in strategic locations where the investment in developing the model and acquiring relevant information could be justified, for example, the Mataniko River, or the Lunga River on Guadalcanal.
R8 – Lifting bridges higher
Overview
Lifting bridges higher is a way to avoid larger flood events that could result from more frequent and intense extreme rainfall events. The attraction of this response lies in the ability of crossings to remain in service during times of flood. One of the key challenges in designing higher bridges is to ensure that they remain connected with the rest of the network. This is especially true in floodplain environments where during large flood events the road itself can be flooded, stranding the bridge. In these situations, even though the bridge is not flooded vehicular traffic is unable to use the bridge through lack of access.
Advantages Disadvantages
• Can avoid certain flood events.
• Means that access can be restored to affected communities quickly following large flood events.
• Allows emergency response teams access to communities affected by flooding, which historically may have only been possible by helicopter or boat.
• Difficult to implement on wide floodplains, unless the rest of the road network is flood immune.
• May contribute to upstream flooding (afflux) in some circumstances, given the barrier across a flood plain.
Indicative costs • Lifting bridges higher generally also involves longer spans, and more works at the approaches, and can therefore be expensive, depending on the specifics of the location.
Timing for implementation • Lifting bridges higher needs to be considered at the earliest stages of concept design.
• Can also be considered as a replacement option, where an existing bridge has been washed away or destroyed by a historical flood event.
Governance and Operation • No specific issues identified beyond those that already apply to the management and operation of existing bridge assets.
112 / Climate change adaptation in the transport sector. Guidance manual

Acceptability • Higher bridges are typically very well accepted by the local community, except when they cause upstream flooding, on account of debris blockage, poor design, or ancillary infrastructure e.g. river training.
Feasibility and Technical Requirement • Requires a detailed understanding of the catchment conditions and expected flood events, both historical and projected under climate change scenarios.
R9 – Real time rainfall and runoff system
Overview
Real-time flood forecasting is one of the most effective non-structural measures for flood management. Similar to flood risk studies, real-time flood forecasting uses a pre-established flood model, and based on live rainfall information is able to publish projected runoff and flood levels for specific catchments. The key benefit of this approach is the early warning for communities and asset managers about a potential flood event. This can allow for evacuations to occur or emergency works to be undertaken prior to a large flood event occurring. It is also useful in planning for emergencies and natural disasters by providing decision makers with an indication of the duration and magnitude of flooding events.
Advantages Disadvantages
• System can be developed to be modular so that additional catchments or flood risk areas are added over time as new information becomes available.
• Can utilise other location-based communication services, e.g. SMS to notify at-risk individuals.
• Provides a reliable and up-to-date warning of any potential flood hazards.
• Allows community, government and industry time to prepare for emergencies.
• Expensive, and requires a large amount of supporting infrastructure and resources.
• To be effective requires communication of warning message to affected communities.
• Would likely also require community awareness campaign so that individuals could understand what the system warning means.
Indicative costs • A fully developed system relies on a range of information sources, and requires constant monitoring and maintenance. Such a system would likely be very expensive, especially when supporting infrastructure (IT, mapping, rainfall gauges etc.) may need to be installed from scratch.
113

• Given the potential benefits to multiple stakeholders, costs could potentially be shared by multiple parties.
Timing for implementation • Can be developed and installed at any time. Once a basic platform is established additional areas could be added successively over time.
Governance and Operation • Requires strong commitment and ownership from a lead agency.
• Relies on a range of additional information sources from government agencies, and therefore may require multi-stakeholder commitments.
Acceptability • Would likely be seen as a positive development by the community.
• May need some community awareness training around the system, how it works and what it means.
Feasibility and Technical Requirement • Would require a detailed scoping investigation prior to developing the system. The scoping study would need to identify priority areas, investment requirements, and other governance and operational questions before a system could even be contemplated in detail.
R10 – Flood-resilient wet crossing (fords)
Overview
A ford or flood-resilient wet crossing is a waterway crossing that is not vulnerable to damage by flood events. The crossing can be constructed of a range of different materials, but is typically made from concrete cast in place. Low water flows are able to flow evenly over the top of the crossing, allowing vehicle and pedestrians to pass. After rainfall events, however, the crossing is usually impassable for a period of time, depending on the magnitude of the rainfall event.
Advantages and Opportunities Challenges and Disadvantages
• Usually not susceptible to plugging by debris or vegetation the way a culvert may be.
• Low tech crossing solution that requires very little maintenance.
• A cheap solution that can be constructed quickly and with limited expertise.
• Largely immune to damage from flood events.
• Not suitable for larger rivers with significant permanent flows.
• Because the crossing floods after heavy rainfall, passage can be blocked for long periods of time during rainy season.
• Can be a safety hazard when people try and cross during flood times if flood depths are underestimated.
114 / Climate change adaptation in the transport sector. Guidance manual

Indicative costs • Cost is confined to site establishment and costs for concrete or other material to install the crossing.
Timing for implementation • Best to be constructed during the dry season.
Governance and Operation • Fords may need to have flood indicators installed so that road users can visually estimate the depth of water during flood events.
Acceptability • May not be accepted by the community or other stakeholders, given that access can still be blocked during the wet season for substantial periods of time.
Feasibility and Technical Requirement • Requires a general understanding of the flow dynamics of the watercourse to understand if feasible.
• Cannot generally be constructed in areas with larger permanent flows.
R11 – Debris Traps
Overview
Debris accumulation on bridge piers is an on-going problem that can obstruct the waterway openings at bridges and result in significant erosion of stream banks and scour at abutments and piers. Driving circular posts into the channel bed (upstream of the bridge), spaced to match the minimum length of debris for which entrapment was desired, could be effective in capturing debris without impeding water and sediment flow.
Advantages and Opportunities Challenges and Disadvantages
• With effective site selection, debris traps would reduce the critical loads that are placed on key bridge assets.
• Would ‘buy time’ for key bridge assets during and after flood events – maintenance may not need to be completed immediately as in the case of debris accumulation at bridges.
• May allow for easier maintenance/ removal of debris than at bridge sites.
• Relatively untested with only a few examples of successful use of debris traps known from Canada.
• Still requires ongoing maintenance after major flood events.
• Not 100% reliable in capturing all debris loads.
• Failure of the debris trap during a major flood event could release large debris loads.
• Could increase afflux (flooding) issues to local communities.
• May adversely influence the course of the river over time.
115

Indicative costs • Would be relatively inexpensive to install the piles.
• Would require some form of ongoing maintenance to ensure that debris loads are not accumulating beyond design levels.
Timing for implementation • Can be installed at any time.
Governance and Operation • Requires ongoing periodic maintenance particularly after large flood events – could largely be undertaken via labour based means.
• Effective in river environments that receive large debris loads – debris is often linked to logging activities (legal or otherwise), so longer term management of catchments will reduce the need for such debris management measures.
Acceptability • May result in afflux (flooding) issues for communities located immediately upstream, and therefore would not be acceptable. Effective site selection can reduce the risk of these issues.
Feasibility and Technical Requirement • Requires pile driving machinery and equipment to install.
W1 – Higher wharf deck with auxiliary floating deck
Overview
A floating dock (pier) is a platform or ramp supported by pontoons. It is usually joined to the wharf with a gangway. The pier is usually held in place by vertical pilings, which are embedded in the seafloor. This type of pier maintains a fixed vertical relationship to watercraft secured to it, independent of tidal elevation and ongoing sea-level rise. It provides an alternative access to the wharf, and is particularly useful for smaller vessels at low tide.
Advantages and Opportunities Challenges and Disadvantages
• Can provide easy access to the wharf facility, especially from smaller vessels.
• Provides easier access for older community members and younger children.
• Flexible, can be designed in a number of ways and utilising a range of different materials, depending on what is available.
• Can be destroyed by extreme weather events, including cyclones.
• May not be as durable as the wharf over the fifty year period, and therefore may need replacing.
116 / Climate change adaptation in the transport sector. Guidance manual

Indicative costs • Costs for retrofitting a floating deck to a new or existing wharf are expected to be minor in comparison to the overall wharf cost.
Timing for implementation • Can be constructed virtually at any time. In most circumstances, can either be added to a new wharf, or an existing wharf.
Governance and Operation • No specific issues identified beyond those that already apply to the management and operation of existing wharves.
Acceptability • Feedback has been received that some community members struggle to access some new wharves and in some cases have preferred to land at adjacent beach areas. As such this option would be very well accepted by the community.
Feasibility and Technical Requirement • Can be designed a number of ways around the central premise of a floating platform, linked to the wharf with a gangplank.
• Needs to be designed so it does not affect other maritime traffic, particularly larger vessels.
• Can utilise readily available materials for construction, and is therefore quite inexpensive to construct.
117

118 / Climate change adaptation in the transport sector. Guidance manual

Appendix E – Economic Decision Support Tool Fact Sheets Economic Decision Support Tools – Fact Sheet 1
Logical Framework Approach (LFA)
Description Decision support tool used in strategic design, monitoring and evaluation of projects.
Benefits Enables consideration of CCA in strategic infrastructure planning.
Highlights key risk issues, including CCA.
Relevance to Manual: Review when undertaking pre-screen of climate change risks.
Best Stage to Use
• Very early stage, specific options not yet identified. At the start of the national transport strategy planning cycle.
• Predecessor(s):
• None.
Expected Outcome
• Nationally prioritised set of transport goals.
Strengths Weaknesses
• Links specific activities to national economic development and national climate change goals. Sets clear performance measures and success factors.
• Emphasises objectively verifiable indicators, means of verification and critical assumptions.
• Used by bilateral and multilateral donor agencies.
• May set key elements for MCA.
• Does not mandate a specific appraisal or evaluation methodology.
• Assumptions and scope critically determine whether goals are being achieved.
Data Requirements • Key policy strategy documents, plans and information / data on resourcing actions.
• Key stakeholders input (where appropriate) including government, industry and community, local communities and individuals
Training/Professional Development
• Strategic transport policy and planning.
• Infrastructure, facilitation.
• Appraisal methods.
119

Economic Decision Support Tools – Fact Sheet 2
Multi-criteria Analysis (MCA)
Description Use of multiple criteria to structure and solve decision and planning problems. Supports decision makers where a unique optimal solution is not apparent.
Benefits Trigger consideration of CCA in the design of potential infrastructure solutions.
Relevance to Manual: Complements identification of climate risks.
Best Stage to Use
• Very early stage. Initial design concepts for strategic transport planning needs. Preliminary screen.
Expected Outcome
• Set national infrastructure outcomes.
Strengths Weaknesses
• Multidisciplinary approach that is workshop oriented.
• Multi factor analysis of issues.
• Considers wider socio-economic impacts.
• Ranking of a program of different projects OR a set of options for a particular.
• Transparency about priorities amongst criteria.
• Basis of optioneering for engineering solutions.
• Lack of quantified economic costs and benefits.
• Potential lack of quantification of climate risk.
• Difficult to agree weighting criteria.
• Might not result in a works program or a specific project with largest net economic benefit or most effective CCA approach.
Data Requirements • Lack of quantified economic costs and benefits.
• Potential lack of quantification of climate risk.
• Difficult to agree weighting criteria.
• Might not result in a works program or a specific project with largest net economic benefit or most effective CCA approach.
Training/Professional Development
• Transport planning.
• Engineering design.
• Service level specification.
• Cost estimation.
• Microsoft Excel.
120 / Climate change adaptation in the transport sector. Guidance manual

Economic Decision Support Tools – Fact Sheet 3
Cost Effectiveness Analysis (CEA)
Description A form of economic analysis comparing relative costs and outcomes (effects) of two or more courses of action.
Benefits Comparison of cost trade-offs of different service attributes.
Enables comparison of relative costs of different service levels in response to proposed CCA measures.
Relevance to Manual: After risk identification, quantification of cost.
Best Stage to Use
• Project concept stage. Initial design option costs, service characteristics.
• Ranked cost of different service levels for a specific transport project.
• Predecessors(s): LFA, MCA.
Expected Outcome
• Developing initial project solutions.
Strengths Weaknesses
• Information driven by engineering data and preliminary option specifications.
• Good where CCA measures are well understood and risk issues are clear.
• Usually only comparing one dimension of benefits, typically service levels. Benefit streams are expressed in units but not monetised. As a result, relative value of different benefit streams are not comparable.
• Supply side analysis, with limited consideration of potential non-engineering benefits.
Data Requirements • Identification of potential project options.
• More detailed engineering cost estimates.
• Service level specification is confirmed.
Training/Professional Development
• Service level specification.
• Engineering design.
• Cost estimation.
• Microsoft Excel.
121

Economic Decision Support Tools – Fact Sheet 4
Rapid Cost Benefit Analysis (RCBA)
Description Provides an initial net socio-economic analysis of a transport infrastructure investment and assists in preliminary ranking of short-listed project options.
Benefits Introduces incremental benefit analysis of CCA measures and preliminary quantification of these CCA-related benefits.
Relevance to Manual: Apply after significant risks identified and potential adaptation responses have been costed.
Best Stage to Use
• More detailed analysis of costs, initial assessment of wider benefits. Short list of preferred options.
• Predecessors(s): LFA, MCA and CEA (optional)
Expected Outcome
• Reduce number of potential options under consideration and identification of a smaller set to progress to full business case.
Strengths Weaknesses
• Information driven by engineering data and preliminary option specifications.
• Good where CCA measures are well understood and risk issues are clear.
• Usually only comparing one dimension of benefits, typically service levels. Benefit streams are expressed in units but not monetised. As a result, relative value of different benefit streams are not comparable.
• Supply side analysis, with limited consideration of potential non-engineering benefits.
Data Requirements * Identification of potential project options.
* More detailed engineering cost estimates.
* Service level specification is confirmed.
Training/Professional Development
* Service level specification.
* Engineering design.
* Cost estimation.
* Microsoft Excel.
122 / Climate change adaptation in the transport sector. Guidance manual

Economic Decision Support Tools – Fact Sheet 5
Full Cost Benefit Analysis (FCBA)
Description Considers the net socio-economic impact of a transport infrastructure investment and provides the business case justification for funding a specific project option.
Benefits Develops estimates of quantified streams of costs and benefits associated with CCA measures for incorporation in a full CBA.
Consistent with established, recognised economic appraisal methods.
Relevance to Manual: Apply after completion of full risk assessment and costing of specific adaptation options.
Best Stage to Use
• Development of robust business cases for funding bodies (SIG, NTF, donors). (BC)
• Predecessors(s): LFA, MCA, CEA (optional), RCBA (optional)
Expected Outcome
• Economic appraisal to standard required by NTF and donors (where applicable), ranked shortlist of proposed options for a specific project, including recommendation and explanation of preferred option.
Strengths Weaknesses
• Business case for preferred project option. Established economic appraisal framework and consistent basis for appraisal. Available guidance material on CBA concepts.
• Economic benefits estimated in terms of avoided engineering, construction and operating costs of the infrastructure asset. Also, economic benefits associated with infrastructure asset service availability estimated.
• Additional, wider economic socio-economic benefits are estimated.
• Decision criteria are readily developable in Microsoft Excel. Clear decision rules (ENPV>0, BCR>1, IRR>target level).
• Attempts to address a triple bottom line (economic, social, environmental). Better than RCBA.
• Data and resource intensive. Time consuming with a likely requirement for field surveys to capture key geographic and project specific information.
• Emphasis on quantified benefits and costs.
• Risk key significant qualitative impacts are ignored/underemphasised.
• Risk economic analysis becomes a financial one in absence of sufficient information and data.
• Discount rate assumes a fixed time preference over period of analysis for values of identified costs and benefits.
• Assumes all factors are known and course of action over entire evaluation period is set in Year 1 of analysis.
Data Requirements • As for Rapid Cost Benefit Analysis, plus:
• MID manual for economic appraisal of transport projects.
• Field surveys to capture critical, project specific information (e.g. data on traffic, patronage, flood risk, wider socio-economic issues such as access to education and health services, access to markets).
123

Training/Professional Development
• Cost benefit analysis short course, emphasising: (i) conducting a CBA; (ii) Microsoft Excel in a CBA; (iii) using economic appraisal guidelines (eg ADB, HM Treasury, World Bank).
• Understanding ecosystem and socio-political systems to achieve transport objectives.
Economic Decision Support Tools – Fact Sheet 6
Sensitivity Testing (ST)
Description Examines how uncertainty in output can be apportioned to inputs in a CEA or CBA.
Benefits Changes in key climate change impacts can be assessed on both impact on service delivery and benefit realisation.
Relevance to Manual: Apply when quantitative data is available and key drivers are identified.
Best Stage to Use
• Not suitable as a standalone decision support tool but should be done as part of CEA, RCBA or FCBA.
• Determine whether to apply ROA or SA.
• Predecessor(s): LFA, MCA and CEA or RCBA or FCBA
Expected Outcome
• Thresholds (capex, omex, benefits) for a target economic return.
• Sensitivity of returns to cost/benefit factors and factors causing uncertainty in economic returns.
• Improve quality of analysis.
Strengths Weaknesses
• Increases understanding relationships between inputs and outputs of a model.
• Reduces uncertainty, identifying model inputs causing significant uncertainty in output and should therefore focus attention if the robustness is to be increased.
• Error search in model by encountering unexpected relationships between inputs and outputs.
• Model simplification – fixing model inputs that have no effect on the output, or identifying and removing redundant parts of model structure.
• Improve the understanding by stakeholders of results and recommendations.
• Find potential maximum, minimum and optimum values for input factors.
• Arbitrary sensitivity levels set on the basis of analyst judgement.
• Typically single variable changes to consider effects. Implicit assumption variables used in analysis capture all key dimensions of the impact.
Data Requirements • Information for CEA, rapid CBA or full CBA, plus:
• Information about possible variability of inputs.
Training/Professional Development
• Should be developed either as part of CBA training or Microsoft Excel training.
124 / Climate change adaptation in the transport sector. Guidance manual

Economic Decision Support Tools – Fact Sheet 7
Real Option Analysis (ROA)
Description Analysis of benefits of being able to defer, abandon, expand, stage or contract a transport infrastructure project.
Benefits Match development of long lived infrastructure to uncertainties around the actual path that develops for climate change impacts.
Relevance to Manual: Apply when there are path-dependent adaption scenarios.
Best Stage to Use
• Only really possible to do effectively after all the information for a full CBA has been developed.
• Predecessors(s): LFA, MCA and RCBA or FCBA then ST
Expected Outcome
• Determine whether stochastic analysis is required.
• Identify the magnitude of project development time path and optionality benefits.
Strengths Weaknesses
• Actively considers scaling development of transport projects on the basis of available information and assessment of current risks.
• Avoids potential short term overbuild of assets.
• Creates opportunities to do a wider range of projects now, picking up immediate economic benefits rather than fewer projects now where out year benefits might be more heavily discounted.
• Recognises there is a capital budget constraint,
• Level of analysis required is higher than for CEA, rapid CBA or full CBA. Future year development of infrastructure to meet increasing climate risks may not be secured. Possibility of higher risk assets constructed will not meet CCA needs, requiring more expensive response.
Data Requirements • In addition to requirements for a full CBA:
• A clear view about climate risks and how they translate into both impacts on construction and operation, as well transport accessibility.
Training/Professional Development
• Assumed knowledge of cost benefit analysis.
125

Economic Decision Support Tools – Fact Sheet 8
Stochastic Analysis (SA)
Description Application of random sampling and statistical techniques to obtain results.
Benefits Analysis of situations with high degrees of uncertainty and credible probability profiles.
Good approach for introducing uncertainty about level and timing of climate impacts, and uncertainty of a specific climate measure on asset performance.
Relevance to Manual: Apply when there is probabilistic data relating to adaptation outcomes.
Best Stage to Use
• Best on the basis of information developed from a full CBA and sensitivity analysis.
• Probabilistic statements about expected asset performance and economic results resulting from CCA impacts and measures.
• Predecessors(s): LFA, MCA, and CEA or RCBA or FCBA then ST and ROA (optional)
Expected Outcome
• Statistical profile of results for decision criteria based on statistical profile of inputs.
Strengths Weaknesses
• Avoids point estimates of climate impacts on infrastructure to develop estimates of the range for likely impacts.
• Provides more detail about likelihood a project will deliver its planned outcome.
• For example, statements such as 75% chance of a positive NPV across a range of reliable climate change forecasts.
• Technique can be used to support both full CBA and Real Options Analysis.
• Data intensive and heavily quantitative. Probabilistic results difficult to interpret and covert into clear guidance.
• Specialist software packages such as @Risk are required. SA does not produce decision criteria, but it is a technique to help explain robustness of results and identify implications of key quantitative risk.
• Probabilistic factors that cannot be quantified may not be considered.
• Requires information or analyst assumptions about statistical distributions and multi-collinearity of key data.
Data Requirements • In addition to requirements for a full CBA:
• Relevant statistical software packages.
• Statistical distributions of key input variables.
Training/Professional Development
• Training in statistics, statistical software packages and interpretation of climate data.
• Assumed knowledge of cost benefit analysis and economic appraisal.
126 / Climate change adaptation in the transport sector. Guidance manual

Appendix F - Glossary Adaptation Adjustment in natural or human systems in response to actual or expected
climatic stimuli or their effects, which moderates harm or exploits beneficial opportunities. (IPCC, 2007)
The process, or outcome of a process, that leads to reduction in harm or risk of harm, or realisation of benefits, associated with climate variability and change. (Willows and Connell, 2003).
Adaptation benefits The avoided damage cost of accrued benefits following the adoption and implementation of adaptation measures (IPCC, 2007)
Adaptation costs Cost of planning, preparing for, facilitating and implementing adaptation measures, including transaction costs (IPCC, 2007)
Adaptive capacity The ability of a system to adjust to climate change, to moderate potential damages, to take advantage of opportunities, or to cope with the consequences that cannot be avoided or reduced (IPCC, 2007).
The combination of the strengths, attributes, and resources available to an individual, community, society, or organisation that can be used to prepare for and undertake actions to reduce adverse impacts, moderate harm, or exploit beneficial opportunities (IPCC, 2012).
Baseline risk scenario The expected series of events that is predicted to occur in the future, either negative or positive. (Adapted from Willows and Connell, 2003).
Capacity building In the context of climate change, capacity building is developing the technical skills and institutional capabilities in developing countries and economies in transition to enable their participation in all aspects of adaptation to, mitigation of, and research on climate change, and in the implementation of the Kyoto Mechanisms, etc. (IPCC, 2007)
Climate change Climate change refers to a change in the state of the climate that can be identified (e.g., by using statistical tests) by changes in the mean and/or the variability of its properties, and that persists for an extended period, typically decades or longer. Climate change may be due to natural internal processes or external forcings, or to persistent anthropogenic changes in the composition of the atmosphere or in land use. (IPCC, 2007).
Climate change impacts The effects of climate change on natural and human systems. Depending on the consideration of adaptation, one can distinguish between potential impacts and residual impacts:
Potential impacts: all impacts that may occur given a projected change in climate, without considering adaptation.
Residual impacts: the impacts of climate change that would occur after adaptation. See also aggregate impacts, market impacts, and non-market impacts (IPCC, 2007).
127

Climate model Computer simulations of the climate system that use numerical methods to better understand changes in climate due to increased concentration of greenhouse gases, feedback mechanisms, and interactions between land, water, biological systems and the atmosphere. These are typically found either in at the scale of Global Climate Models (GCM) or Regional Climate Models (RCMS). (Adapted from IPCC, 2007).
Climate variability Variations in the mean state and other statistics (such as standard deviations, the occurrence of extremes, etc.) of the climate on all temporal and spatial scales beyond that of individual weather events (IPCC, 2007).
Departures from long-term averages or trends over seasons or a few years (CARICOM, 2003)
Cost-benefit analysis (CBA)
The rigorous and consistent appraisal of the merits associated with each option by quantifying in monetary terms as many costs and benefits as possible, including items for which the market does not provide a satisfactory measure of value. (Willows and Connell, 2003).
Disaster risk management (DRM)
The systematic process of using administrative decisions, organization, operational skills and capacities to implement policies, strategies and coping capacities of the society and communities to lessen the impacts of natural hazards and related environmental and technological disasters. This comprises all forms of activities, including structural and non-structural measures to avoid (prevention) or to limit (mitigation and preparedness) adverse effects of hazards. (UNEP, 2008)
Disaster risk reduction (DRR)
The conceptual framework of elements considered with the possibilities to minimize vulnerabilities and disaster risks throughout a society, to avoid (prevention) or to limit (mitigation and preparedness) the adverse impacts of hazards, within the broad context of sustainable development. (UNEP, 2008)
Exposure The nature and degree to which a system is exposed to significant climatic variations. Exposure is determined by the type, magnitude, timing and speed of climate events and variation to which a system is exposed (e.g. changing onset of the rainy season or minimum winter temperatures, floods, storms, heat waves). (World Bank, 2009).
‘Hard’ adaptation Actions or responses to climate vulnerability that typically involve high costs or fixed actions. Capital goods, such as dams, sea walls, and other infrastructure are examples. (World Bank, 2012).
Hazard A potentially damaging physical event, phenomenon or human activity/decision type that may cause the loss of life or injury, property damage, social and economic disruption or environmental degradation. (UN/ISDR, 2004).
Impact assessment The practice of identifying and evaluating, in monetary and/or non-monetary terms, the effects of climate change on natural and human systems. (Adapted from IPCC, 2007)
Level of Service A qualitative measure of the service provided from an asset.
128 / Climate change adaptation in the transport sector. Guidance manual

Likelihood A common concept referring to the chance of an event occurring which typically expressed as a probability of frequency. (Adapted from Willows and Connell, 2003).
Maladaptation Any changes in natural or human systems that inadvertently increase vulnerability to climatic stimuli; an adaptation that does not succeed in reducing vulnerability but increases it instead. Spending a disproportionate amount of effort and investment focussed upon adaptation beyond what is required (Adaptation Sub-Committee, 2010).
Mitigation In the context of risk management, any action to reduce the probability and magnitude of unwanted consequences. Adaptation to climate change is a strategy undertaken to mitigate the risk associated with future changes in climate. However, in climate change policy, mitigation refers specifically to the reduction in greenhouse gas emissions, which is an example of risk management (Adapted from Willows and Connell, 2003).
Multi-criteria analysis (MCA)
Describes any structured approach used to determine overall preferences among alternative options, where the options accomplish several objectives (Adapted from Willows and Connell, 2003).
Pathway Provides the connection between a particular hazard (e.g. storm-force winds) and the receptor (e.g. insurance company premiums) that may be ‘harmed’. The pathway may include the track of the storm, the location of domestic dwellings, nature of roofing materials, the level of consequent insurance claims (Willows and Connell, 2003).
Resilience The ability of a system and its component parts to anticipate, absorb, accommodate, or recover from the effects of a hazardous event in a timely and efficient manner, including through ensuring the preservation, restoration, or improvement of its essential basic structures and functions (IPCC, 2012).
Resilience measures Actions that enhance the ability of a system to withstand external shocks or/and support its effective recovery, as well as actions that reduce a system’s vulnerability to climate change and climate variability or mitigate external pressures eroding its resilience (Adapted from Carpenter et al. 2001, Adger 2000, Resilience Alliance).
Risk Risk is a combination of the chance or probability of an event occurring, and the impact or consequences associated with that event. (Willows and Connell, 2003).
Risk assessment A methodology to determine the nature and extent of risk by analysing potential hazards, evaluating existing conditions of vulnerability that could pose a potential threat or harm to people, property, livelihoods and the environment on which they depend, assessing the likelihoods and severities of impacts, and assessing the significance of the risk [...]. (UN/ISDR, 2004 and Willows and Connell, 2003).
Risk management The systematic application of policies, procedures and practices undertaken in order to analyse, evaluate, control and communicate about risks (CARICOM, 2003)
129
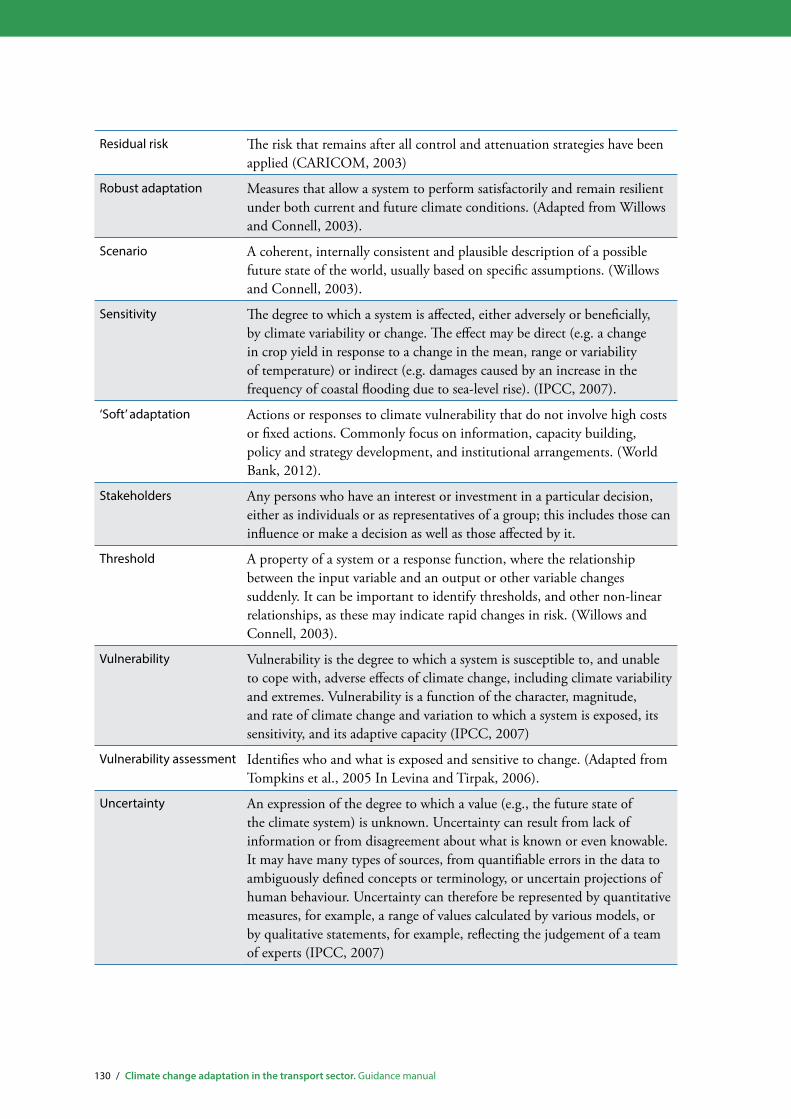
Residual risk The risk that remains after all control and attenuation strategies have been applied (CARICOM, 2003)
Robust adaptation Measures that allow a system to perform satisfactorily and remain resilient under both current and future climate conditions. (Adapted from Willows and Connell, 2003).
Scenario A coherent, internally consistent and plausible description of a possible future state of the world, usually based on specific assumptions. (Willows and Connell, 2003).
Sensitivity The degree to which a system is affected, either adversely or beneficially, by climate variability or change. The effect may be direct (e.g. a change in crop yield in response to a change in the mean, range or variability of temperature) or indirect (e.g. damages caused by an increase in the frequency of coastal flooding due to sea-level rise). (IPCC, 2007).
‘Soft’ adaptation Actions or responses to climate vulnerability that do not involve high costs or fixed actions. Commonly focus on information, capacity building, policy and strategy development, and institutional arrangements. (World Bank, 2012).
Stakeholders Any persons who have an interest or investment in a particular decision, either as individuals or as representatives of a group; this includes those can influence or make a decision as well as those affected by it.
Threshold A property of a system or a response function, where the relationship between the input variable and an output or other variable changes suddenly. It can be important to identify thresholds, and other non-linear relationships, as these may indicate rapid changes in risk. (Willows and Connell, 2003).
Vulnerability Vulnerability is the degree to which a system is susceptible to, and unable to cope with, adverse effects of climate change, including climate variability and extremes. Vulnerability is a function of the character, magnitude, and rate of climate change and variation to which a system is exposed, its sensitivity, and its adaptive capacity (IPCC, 2007)
Vulnerability assessment Identifies who and what is exposed and sensitive to change. (Adapted from Tompkins et al., 2005 In Levina and Tirpak, 2006).
Uncertainty An expression of the degree to which a value (e.g., the future state of the climate system) is unknown. Uncertainty can result from lack of information or from disagreement about what is known or even knowable. It may have many types of sources, from quantifiable errors in the data to ambiguously defined concepts or terminology, or uncertain projections of human behaviour. Uncertainty can therefore be represented by quantitative measures, for example, a range of values calculated by various models, or by qualitative statements, for example, reflecting the judgement of a team of experts (IPCC, 2007)
130 / Climate change adaptation in the transport sector. Guidance manual

Weather The day to day state of the atmosphere in the short term, over a particular place, usually in regard to temperature, air pressure, humidity, wind, precipitation, etc. Climate in a narrow sense is usually defined as the ‘average weather’. The US Environmental Protection Agency differentiates these by noting that, roughly, ‘climate’ is what you expect and ‘weather’ is what you get (Adapted from EPA, 2012).
131

132 / Climate change adaptation in the transport sector. Guidance manual