ccbs v2 community - amazon web services · ©2011 rainforest alliance ccb ... includes cultural...
TRANSCRIPT

©2011 Rainforest Alliance
CCB STANDARDS:
communityClimate, Community and
Biodiversity Standards
In-depth training
OVERVIEW
1. Introduction to the CCB Standards social
impact requirements
2. Techniques and tools for social impact
assessment
3. Assessment against the standard:
understanding the 4 key stages of community
impact assessment and monitoring in the CCB
Standards
2
Auditing
Tools
Social Reqs

INTRODUCTION
3
© J.Henman
STRUCTURE OF THE CCB COMMUNITY SECTION
4
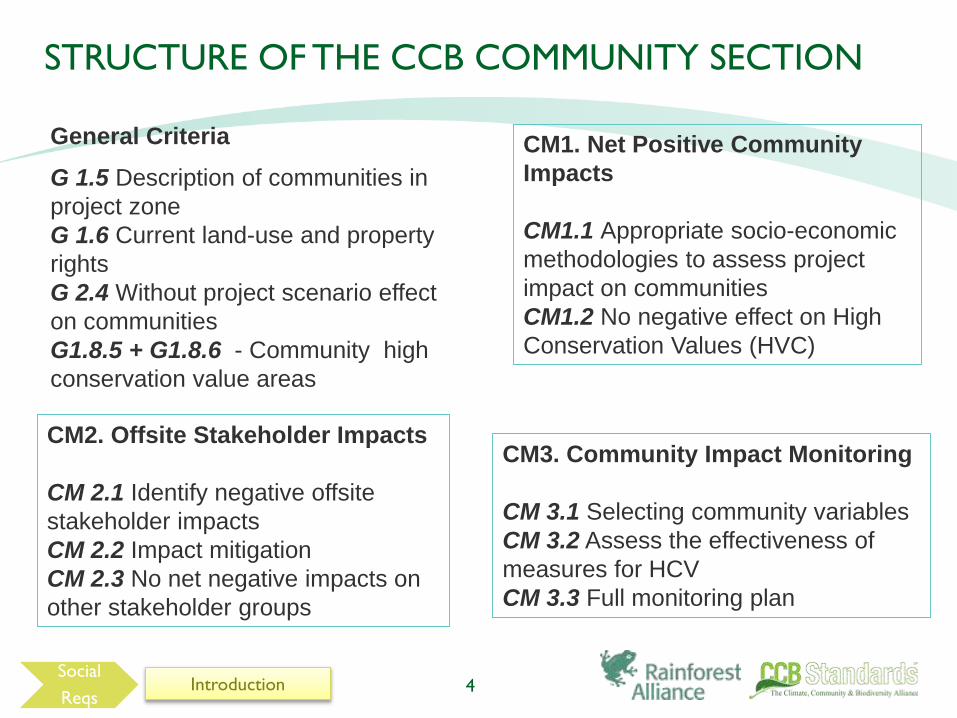
CM1. Net Positive Community
Impacts
CM1.1 Appropriate socio-economic
methodologies to assess project
impact on communities
CM1.2 No negative effect on High
Conservation Values (HVC)
CM2. Offsite Stakeholder Impacts
CM 2.1 Identify negative offsite
stakeholder impacts
CM 2.2 Impact mitigation
CM 2.3 No net negative impacts on
other stakeholder groups
CM3. Community Impact Monitoring
CM 3.1 Selecting community variables
CM 3.2 Assess the effectiveness of
measures for HCV
CM 3.3 Full monitoring plan
Social
ReqsIntroduction
General Criteria
G 1.5 Description of communities in
project zone
G 1.6 Current land-use and property
rights
G 2.4 Without project scenario effect
on communities
G1.8.5 + G1.8.6 - Community high
conservation value areas

FOUR KEY STAGES TO SOCIAL IMPACT ASSESSMENT IN
PROJECT DEVELOPMENT
5
Stage Brief description Relevant criteria
1 an accurate description of socio-economic conditions for all
affected stakeholders at the start of the project;
G1.5; G1.6;
G1.8.5-6
2 a projection of how those conditions would change in the
absence of the project (the “without-project” scenario);
G2.1; G2.2; G2.4
3 a description of the likely [positive and negative] outcomes
after implementation (the “with-project” scenario);
description of how negative impacts will be mitigated;
G3.1; 3.2; 3.3; 3.5;
3.7; 3.8; G5.4; 5.5;
5.6; CM1; CM2;
GL1-5
4 design and implementation of a credible system for
monitoring social impacts – known as the “community
monitoring plan”
CM3
RequirementsSocial
Reqs

WHAT ARE SOCIAL IMPACTS?
By social impacts we mean the consequences to human
populations of any public or private actions that alter the ways
in which people live, work, play, relate to one another, organize to meet
their needs and generally cope as members of society. The term also
includes cultural impacts involving changes to the norms, values, and
beliefs that guide and rationalize their cognition of themselves and their
society.
National Maritime Fisheries Service, 1994
6
”
“
Social
Reqs Introduction
© J.Henman

Negative social results • Migration of external families to existing villages
neighboring the project area causing pressure on
land/forest/ resources
• Social conflict between foreign workers and local
workers
• Displacement of grazing animals from project
area
Positive social results• Salaries paid to workers/ increased incomes
• Health care for workers and neighboring villages
• Worker accident insurance
• Local road improvement
• Financial and technical support for public works
in local communities
THE SOCIAL IMPACTS OF CARBON PROJECTS:
CAMPO VERDE PROJECT
7Introduction
Reforestation with Native SpeciesCampo Verde, Ucayali, Peru
Validated to the CCB Standards First
Edition
PDD available at CCB Web site
Social
Reqs

SOCIAL IMPACT ASSESSMENTS ARE TRICKY!
8
• The problem of attribution – it is difficult to prove cause and effect
• Social impacts tend to be long-term phenomena – it is hard and
unrealistic to identify them in the short-term
• Social impacts may be subtle and not easily measured
• Social impacts are often unexpected and/or can be negative, e.g.
difficult livelihood transition in REDD projects
• Social impacts are easy to confuse with outcomes
• Lack of research data on the social effects of land-based carbon projects
• Lack of user-friendly guidance on SIA for carbon project developers
Social
ReqsIntroduction

HOWEVER….
9
• They do not require sophisticated methods
• Based on the principle of ‘appropriate imprecision’, project proponents can
credibly document the likely social impacts of a carbon project, insofar as it
is possible to judge them at any point in time.
• Project staff can carry it out given the right guidance, some training and/or a
week or two of technical assistance
• Range of projects type and scales means there is no one size fits all approach
- REDD project: potential relocation, change in livelihoods
- A/R: potentially no communities in the project zone/area
Social
ReqsIntroduction
© J.Henman

10
TECHNIQUES AND TOOLS
© J.Henman

WHAT WILL I LEARN IN THE COMMUNITY TECHNIQUES AND
TOOLS SECTION?
You will gain an understanding of:
1. Identifying and differentiating between stakeholders
2. Data collection and analysis
3. Indicators and their selection
4. Projecting the future
11Tools Introduction
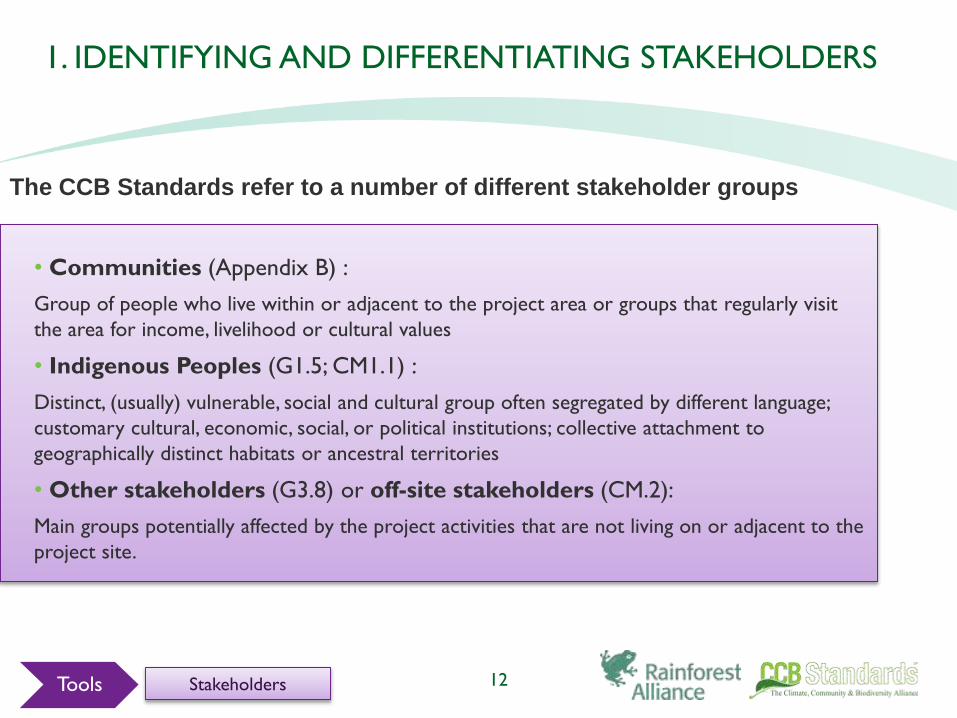
1. IDENTIFYING AND DIFFERENTIATING STAKEHOLDERS
• Communities (Appendix B) :
Group of people who live within or adjacent to the project area or groups that regularly visit
the area for income, livelihood or cultural values
• Indigenous Peoples (G1.5; CM1.1) :
Distinct, (usually) vulnerable, social and cultural group often segregated by different language;
customary cultural, economic, social, or political institutions; collective attachment to
geographically distinct habitats or ancestral territories
• Other stakeholders (G3.8) or off-site stakeholders (CM.2):
Main groups potentially affected by the project activities that are not living on or adjacent to the
project site.
12Tools Stakeholders
The CCB Standards refer to a number of different stakeholder groups

1. IDENTIFYING AND DIFFERENTIATING STAKEHOLDERS
• Communities (areas 1+2)
• Indigenous Peoples (all areas)
• Other stakeholders and off-site
stakeholders (area 3)
13
1. Project
area
2. Project zone
3. Off-site
Tools Stakeholders
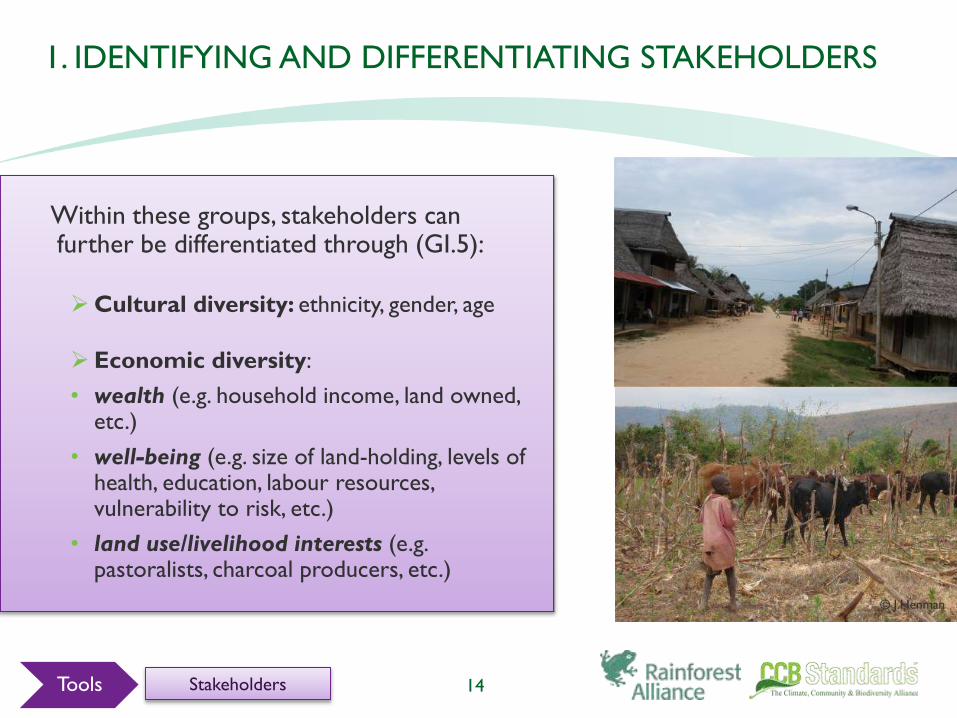
1. IDENTIFYING AND DIFFERENTIATING STAKEHOLDERS
Within these groups, stakeholders can further be differentiated through (GI.5):
Cultural diversity: ethnicity, gender, age
Economic diversity:
• wealth (e.g. household income, land owned, etc.)
• well-being (e.g. size of land-holding, levels of health, education, labour resources, vulnerability to risk, etc.)
• land use/livelihood interests (e.g. pastoralists, charcoal producers, etc.)
14Tools Stakeholders
© J.Henman

MINORITY STAKEHOLDER GROUPS
The CCB Standards require that specific minority stakeholder
groups have been properly identified and consulted (G1.5; G3.8). For
example, women, the elderly, ethnic minorities etc.
• This may include:
– Ensuring balanced representation of women and men in focus group discussions
– Separate focus group discussions with minority groups (men, women, the elderly,
etc.)
15Tools Stakeholders
!

Community
carbon group,
planting on their
own land and
boundary
planting on
reserve
EXERCISE 1: KIKONDA FORESTRY PROJECT, UGANDA
16
District
agricultural
authority
managing land
outside reserve
In-migrants moving
to area for
employment
National forest
authority owning
reserve land
Project developer,
leasing reserve land
and supporting
adjacent communities
Reserve
land
Charcoal
producers
on reserve
land
Seasonal
pastoralists
using reserve
land
Other community
members, some
employed on reserve
and some benefitting
from school teacherTools Stakeholders

For a good guide to conducting
stakeholder analysis see: CARE, 2002.
STAKEHOLDER ANALYSIS
Stakeholder analysis aims to:
17Tools Stakeholders
Identifying stakeholders is needed for the stakeholder analysis
3. Identify their likely reaction to project interventions or external
pressures
2. Identify their relative power in relation to key socio-economic
conditions (e.g. over community decision making processes) and project
impacts; and
1. Identify their interests and interactions with other stakeholder groups

STAKEHOLDER ANALYSIS: EXAMPLE
18Tools Stakeholders

STAKEHOLDER ANALYSIS: THINGS TO WATCH IN
PROJECT DESIGN
• Poorly defined process for identifying stakeholders or process is badly
implemented (e.g. limited number of stakeholders consulted)
• Main stakeholders (including off-site) are not clearly differentiated in
the PDD, based on the criteria listed in CM1.5 and G3.8
• No evidence that stakeholders have been consulted in the project
• Purposeful avoidance of key stakeholder groups, such as women or
ethnic minorities (possibly linked to negative project impacts or
discrimination)
• Stakeholders have been coerced into giving responses favourable to
project developer
• No differentiation based on wealth or well-being, or has not been
carried out in accordance with best practice (e.g. in terms of sample sizes)
19
!
Tools Stakeholders

2. SOCIO-ECONOMIC DATA COLLECTION AND ANALYSIS
• Qualitative and quantitative
– Qualitative processes may give more detail on specific issues and reasons
why different issues are arising
– Quantitative processes can be useful to give broad overview information on
local trends (e.g. number of people in different types of employment)
• Participatory and non-participatory processes
– Participatory processes require involvement of affected stakeholders in
defining the types of information collected and in providing information
– Non-participatory processes involve pre-defined information types and
measures (e.g. household questionnaires and expert interviews)
• CCB Standards emphasise the use of participatory approaches in all stages
20Tools Data Collection
Type of data collection and analysis

2. SOCIO-ECONOMIC DATA COLLECTION AND ANALYSIS:
THINGS TO WATCH OUT IN PROJECT
DESIGN
• Qualitative and participatory research methods have become more
popular in social impact assessments but there are some pitfalls:
– Participatory research methods can be subject to bias and subjectivity and
may be less effective for measuring indicators based on SMART objectives
– Qualitative research is time consuming, costly and can have a high
opportunity cost for local people
• Quantitative and qualitative data collection methods should be
combined in order to get a reliable scenario of what is happening on the
ground
• The sequence of data collection is very important – it is better to
start with participatory methods which can then inform and improve the
research methods used in the more targeted analysis, e.g., facilitating the
design of short and focused household surveys.
21Tools Data Collection
!

EXERCISE 2: DATA ANALYSIS AND COLLECTION
Can you list different
techniques for socio-
economic data
analysis and
collection?
22Tools Data Collection
© J.Henman

TECHNIQUES FOR SOCIO-ECONOMIC DATA
COLLECTION AND ANALYSIS
Data collection and
analysis techniques
Household surveys
Focus groups
Key informant interviews
Participa-tory rural appraisal
Expert analysis
Secondary data
sources
Tools Data Collection
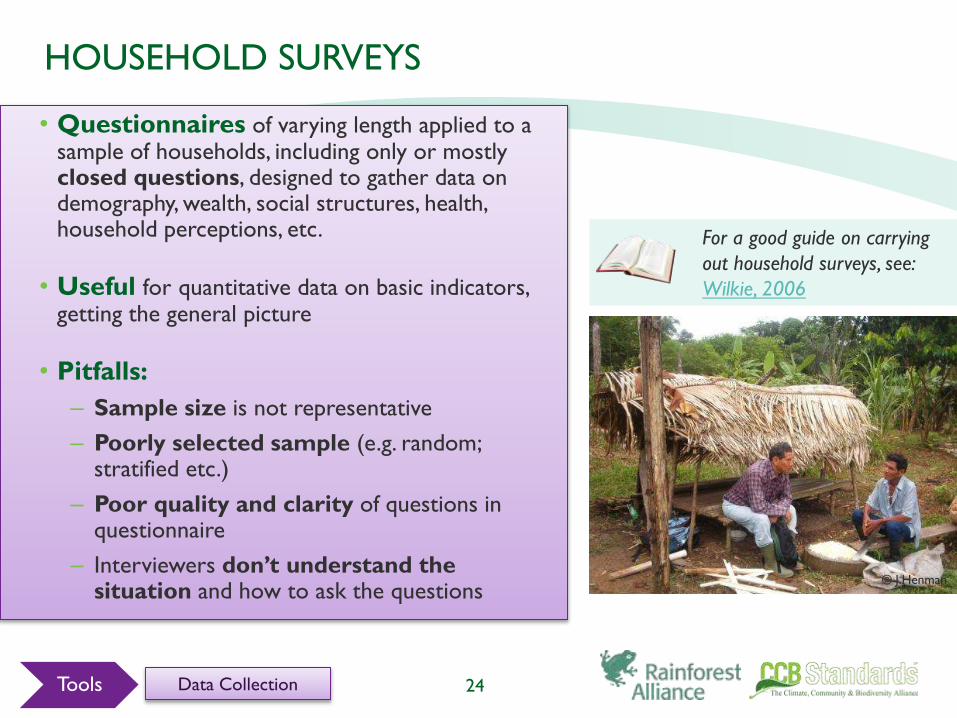
HOUSEHOLD SURVEYS
• Questionnaires of varying length applied to a sample of households, including only or mostly closed questions, designed to gather data on demography, wealth, social structures, health, household perceptions, etc.
• Useful for quantitative data on basic indicators, getting the general picture
• Pitfalls:
– Sample size is not representative
– Poorly selected sample (e.g. random; stratified etc.)
– Poor quality and clarity of questions in questionnaire
– Interviewers don’t understand the situation and how to ask the questions
24
For a good guide on carrying
out household surveys, see:
Wilkie, 2006
Tools Data Collection
© J.Henman

FOCUS GROUPS
• Discussions around specific topics with a small group of people, sometimes selected to be representative of certain social groups
• Useful for
Producing data and insights that would be less accessible without interactionfound in a group setting
-> early - to obtain a general understanding of important issues
-> later - to gain an in-depth understanding
25Tools Data Collection
• Pitfalls:
– Bias in groups selected (e.g. all male; dominant group members)
– Group size is not large enough to be representative
– Directing conversation in a group setting can be challenging
– Facilitator/translator not independent of group’s interests
– Few focus groups conducted

For a good guide on key informant
interviews, see: USAID, 1996
KEY INFORMANT INTERVIEWS
• Interviews with key players both
inside and outside the community.
– These are often semi-structured,
i.e. based on an interview checklist.
• Useful for:
– Gaining a general understanding of issues
– Cross-check findings from other sources
• Interpreting quantitative data
26Tools Data Collection
• Pitfalls:
– Key informants from different
interest groups have not been
consulted
– Difficult to prove validity of
findings
– Answers can be influenced by
interviewer

PARTICIPATORY RURAL APPRAISAL (PRA) and
RAPID RURAL APPRAISAL (RRA)
• RRA and PRA use the same participatory tools e.g.:– Participatory mapping and transect
walks with farmers
– Seasonal calendars (e.g. of activities, income, expenditure)
– Matrices (e.g. to rank or score the perceived significance of different impacts)
• Different focus:– RRA focuses on extracting information
– PRA focuses on stimulating research and analysis by local people
• Useful for detailed social impact assessment
• Pitfalls:– Can be costly and time consuming
27
For a good guide on carrying out PRA
look at: PROFOR, 2008.
Tools Data Collection

EXPERT ANALYSIS
• Consultation with local and/or international
experts about socio-economic conditions in the
project zone
• Useful for understanding trends in data and
cross-checking information from participatory
processes
• Pitfalls:
– Low independence of experts in relation to
project developer or stakeholder interests
28Tools Data Collection
© J.Henman

SECONDARY DATA SOURCES
• May include a range of data sources
such as national statistics,
student dissertations on socio-
economic issues in the project
zone etc.
• Useful for cross-checking and
comparing primary data results
• Pitfalls:
– Heavy reliance on these sources
– Assumptions/approaches used are
not comparable with primary
data sources
29Tools Data Collection
EXPERIENCE-SHARING
Does anyone have experience with socio-
economic data collection methods to
share?
• Most useful methods and why?
• Useful participatory exercises?
• Useful variation of methods?
• Identification of other pitfalls?
• On the ground examples?
30Tools Data Collection
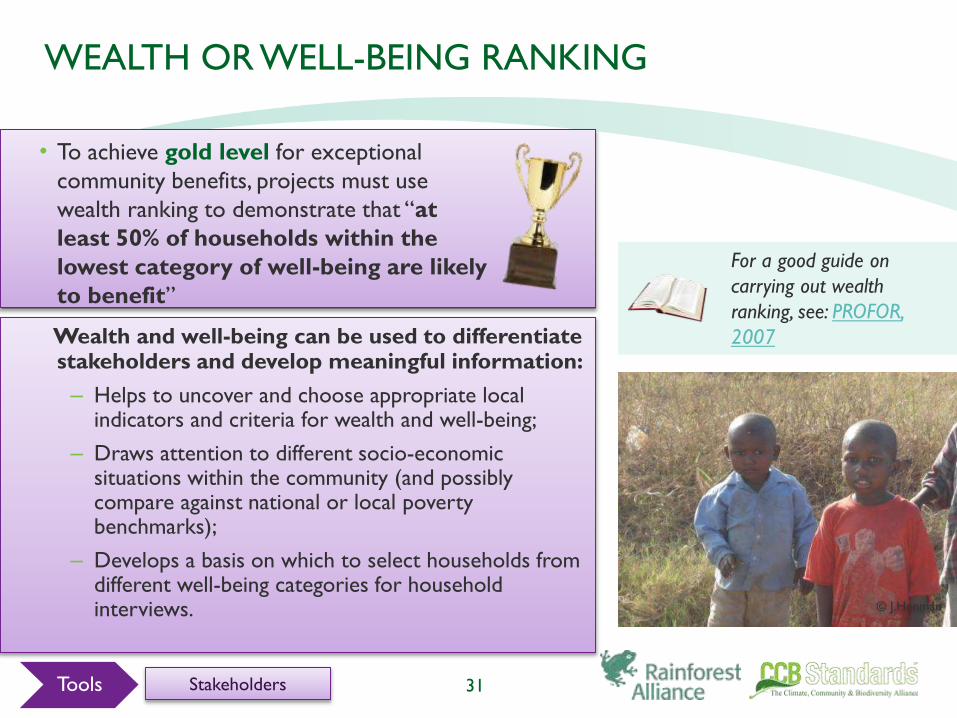
WEALTH OR WELL-BEING RANKING
Wealth and well-being can be used to differentiate stakeholders and develop meaningful information:
– Helps to uncover and choose appropriate local indicators and criteria for wealth and well-being;
– Draws attention to different socio-economic situations within the community (and possibly compare against national or local poverty benchmarks);
– Develops a basis on which to select households from different well-being categories for household interviews.
31
For a good guide on
carrying out wealth
ranking, see: PROFOR,
2007
Tools Stakeholders
• To achieve gold level for exceptional
community benefits, projects must use
wealth ranking to demonstrate that “at
least 50% of households within the
lowest category of well-being are likely
to benefit”
© J.Henman

CHECKING THE QUALITY OF SOCIO-ECONOMIC
DATA
Approach Description
Triangulation of data
sources
Triangulation between information from three or more sources or
types of information (including from secondary data) is an important
part of the research process, allowing for information from one tool to
be confirmed or refuted by, or probed further with, other tools.
Feedback and
validation by
communities
Feedback of research results to communities is not only an integral and
fundamental part of participatory research processes but can also
provide an important opportunity for checking interpretation of
information collected.
Care to avoid bias in
responses
Checking that person carrying out the survey has no interests in the
project or the community; checking stakeholder selection process to
avoid domination by elites; strategic responses of project beneficiaries
Use of significant
sample sizes and
appropriate sampling
methods
Particularly where quantitative information is collected and analysed,
(e.g. household surveys) it is important to ensure that a large enough
sample is taken and that an appropriate sampling method is used
32
!
Tools Data Collection

3. SOCIO-ECONOMIC INDICATORS
Socio-economic indicators are required throughout the CCB
Standards. They include:
• Original conditions (G1): indicators are needed to describe existing socio-
economic conditions (e.g. household income)
• Baseline (G2): indicators are needed to describe how socio-economic
conditions may change in the future (e.g. increasing household income due to
new infrastructure development and access to markets)
• Project impacts (G3; CM1): indicators are needed to describe how socio-
economic conditions may change in the future due to the project (e.g.
increasing household income due to employment provided by project)
• Community impact monitoring (CM3): indicators are needed to measure
actual changes in socio-economic conditions due to the project
33Tools Indicators

SOCIAL IMPACT INDICATOR SELECTION
• Indicator selection needs to be based on the causal model for the project,
and they need to be SMART
• But, social impact indicators specifically, should ideally have been discussed
with (and possibly defined by) communities
• Methodological frameworks can also be used to help define and choose
indicators. Examples include:
– Sustainable livelihoods framework
– Social carbon standard http://www.socialcarbon.org/documents/
34Tools Indicators

EXAMPLE: SUSTAINABLE LIVELIHOODS FRAMEWORK
35
Type of
capital
Examples of outcome indicators presented in PDD (+ = positive impact, - = negative impact)
Financial
capital
Increase in employment in forestry (+)
Loss of employment in certain activities (e.g. charcoal production on plantation land) (-)
Increase in income from ecotourism (+)
Loss of income from lost access to NTFPs (-)
Human
capital
Increase in knowledge and perception of forest resources (+)
Improvement in skills in business and administration (+)
Improvement in skills and knowledge of forest management, sustainable agriculture, wildlife management (+)
Natural
capital
Increase in productivity of forest systems (+)
Decrease in access to and use of forest resources either commercially or ‘in-kind’ (e.g. NTFPs, timber,
fuelwood, charcoal, medicines etc.) (-)
Decrease in access to local ecosystem services (use of water sources, soil, biodiversity) (-)
Improved quality of ecosystem services (e.g. soil quality) (+)
Physical
capital
Decreased quality of transport infrastructure (-)
Increased access to markets (+)
Increased access to health clinics (+)
Increased access to education (+)
Social
capital
More democratic decision making processes in communities (e.g. village councils and their governance; forest
user groups) (+)
Stronger role of specific groups/individuals in decision making processes (e.g. procedures for involvement of
women, children, elderly, etc.) (+)
More secure rights to land and forest resources for community landowners (+)
Loss of customary rights due to the formalisation of statutory land tenure (-)
Social problems (e.g. alcoholism, violence, health etc.) (-)

EXAMPLE: SOCIAL CARBON STANDARD
•Has a list of ‘approved’
social indicators
•Based on Financial,
Human, Social and
Natural resources
Financial
Resources
Ability or capacity to access credit
Participation in goods and services markets
Level of household income savings
‘Economic and social returns'
Human
Resources
State of family health
Adult literacy level
Professional skills in the household (especially agriculture,
livestock, extractivism)
Formal education levels
Disease incidence
Work attitudes
Leisure options
‘Technical competence'
Access to technical extension services
Social
Resources:
Level of participation in civil organizations
Number of people taking collective decisions
Adherence to and actions by institutions representing
community
Level of dependency on government interventions
Degree of community organization - formal associates or
community groups
Family networks
Internal conflicts and their causes (external or internal)
Natural
Resources
Rate of deforestation
Level of fish & wild game stocks
Quality of soil & water
Degree of fragmentation of local ecosystems
Level of protection
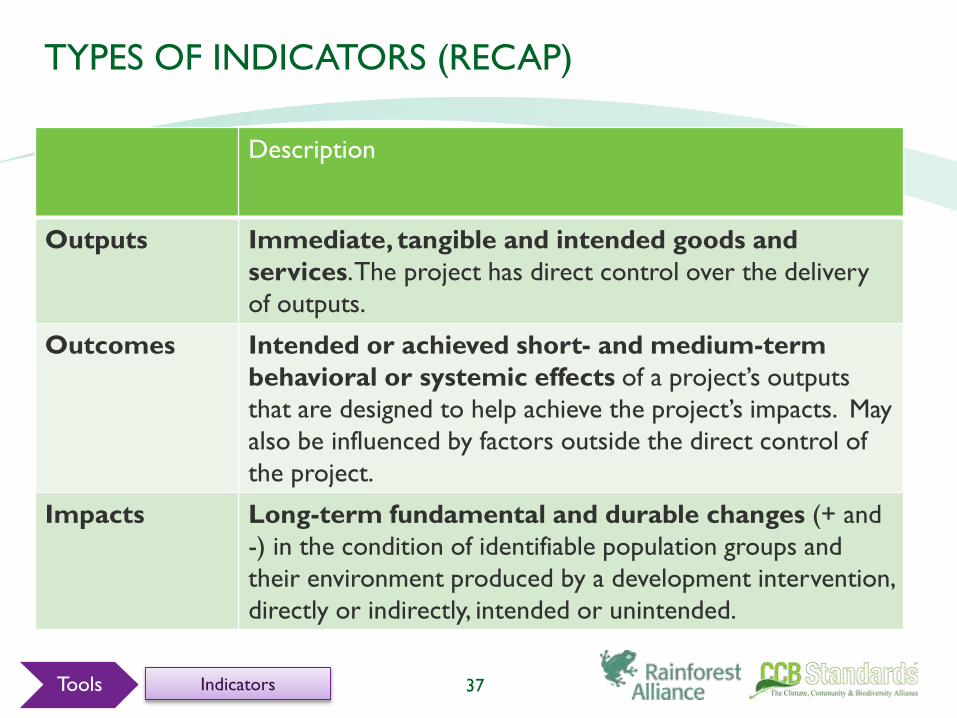
TYPES OF INDICATORS (RECAP)
Description
Outputs Immediate, tangible and intended goods and
services. The project has direct control over the delivery
of outputs.
Outcomes Intended or achieved short- and medium-term
behavioral or systemic effects of a project’s outputs
that are designed to help achieve the project’s impacts. May
also be influenced by factors outside the direct control of
the project.
Impacts Long-term fundamental and durable changes (+ and
-) in the condition of identifiable population groups and
their environment produced by a development intervention,
directly or indirectly, intended or unintended.
37Tools Indicators

EXERCISE 3: IDENTIFYING INDICATORS
Arrange the indicators on the next slide
into output, outcome and impact
categories
38Tools Indicators

EXERCISE 4: CLASSIFY INDICATORS BY TYPE
39Tools Indicators
Which of these are output indicators?
Which are outcome indicators?
Which are impact indicators?

EXERCISE 4: INDICATORS BY TYPE
40
Category
Output • numbers of jobs created
• number of people trained in X
• number of trees planted
Outcome • number of households adopting an alternative livelihood activity
• % or absolute increase in household income from carbon payments
• number of people who understand the basic accounts of community costs and
benefits (this is a measure of governance transparency)
Impact • % reduction in infant mortality or % of household living on < $1 per day
• % of local population changing from negative to positive attitude to forest
conservation measures;
• a reduction in domestic violence
Tools Indicators

THINGS TO WATCH IN PROJECTS
• Indicators are not relevant for tracking socio-economic impacts of projects
• There is no evidence that indicators are linked to discussions with
stakeholders about how they view potential project impacts
• Indicators are not SMART
• Proxy indicators are used but there is no justification as to how these may
link to actual project outcomes and impacts
• All indicators listed in the PDD/monitoring plan are ‘output’ indicators. There
are no outcome or impact indicators OR there is no justification of the links
between output and outcome/impact indicators
41Tools Indicators
!

THINGS TO WATCH IN PROJECTS
• Verification for the CCB Standard must begin within 5 years of the last
validation or verification, it is more practical to:
-Identify short/medium-term social benefits for project outputs and
outcomes
• If evidence is presented that the short/intermediate term objectives are
being achieved, and if it forms the convincing cause and effect story, then
the auditor can have reasonable confidence that the longer-term
objectives (impacts) will be achieved
42Tools Indicators
!
4. SOCIAL IMPACT PROJECTIONS
43
Projections about future socio-economic conditions or impacts
are required in the following parts of CCB PDDs:
• Baseline (G2): to project how socio-economic conditions may change in the
future (e.g. increasing household income due to new infrastructure
development and access to markets)
• Projected project impacts (G3): to project how socio-economic
conditions may change in the future due to the project (e.g. increasing
household income due to employment provided by project)
• Net community and off-site stakeholder impacts (CM1; CM2): to
project net community impacts by comparing the impacts with the project
with those in the baseline
Tools Projecting Impacts

EXERCISE 5 : TOOLS FOR CONSTRUCTING
PROJECTIONS
Can you list different
tools to create social
impacts projections?
44Tools Projecting Impacts
© J.Henman

TOOLS FOR CONSTRUCTING PROJECTIONS
45
Projections
Household surveys
Project case
studies
Scenario analysis
Problem trees
Focus groups
Secondary data on trends
Tools Projecting Impacts

(PARTICIPATORY) SCENARIO ANALYSIS
• 5 step process for building future scenarios
• Useful because it is highly participatory; offers a structured process for building scenarios
• Pitfalls:
– Stakeholders not given sufficient information on the project activities
– Assumptions used in PDD do not reflect those given by stakeholders
– Scenario analysis was not carried out with different stakeholder groups
46
Step 1• Identifying historic trends
Step 2
• Identifying focal questions (e.g. what are your concerns for future with/without project?)
Step 3
• Identifying drivers of change that may affect the future
Step 4• Identifying scenario starting points
Step 5• Creating narratives about the future
For a good guide on building scenarios,
see: Evans, 2006
Tools Projecting Impacts

PROBLEM TREES
• Participatory process where the project links the problems that it is addressing with the social, environmental and/or economic conditions it wishes to improve.
• Useful in helping to define objectives of project, establishing causality, understanding viewpoints of various stakeholder groups (if each group constructs its own problem tree.)
• Pitfalls:
– Often requires significant facilitation to achieve effective results
– Multiple stakeholder groups develop separate problem trees in isolation of one another
47
For a good guide on problem trees, see:
MDF (undated)
Tools Projecting Impacts

PROJECT CASE STUDIES
• Use of case studies of existing
projects that implement similar
activities to identify links between
activities and impacts
• Useful for gaining a general
understanding about the possible
outcomes and impacts of carbon
forestry projects and causes of
change
• Pitfalls:
– Not sufficient for understanding
specific project impacts as these vary
with context
48Tools Projecting Impacts
© J.Henman
EXPERIENCE-SHARING
Does anyone have experience with
projection tools to share?
• Most useful methods and why?
• Useful participatory exercises?
• Useful variation of methods?
• Identification of other pitfalls?
• On the ground examples?
49Tools Projecting Impacts
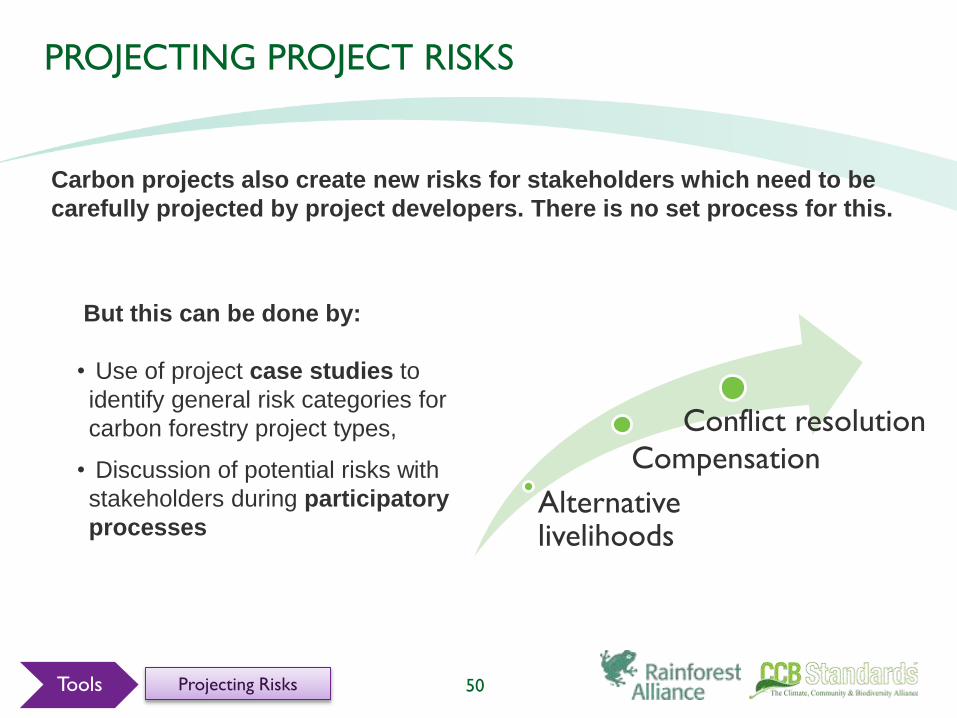
PROJECTING PROJECT RISKS
50
Alternative livelihoods
Compensation
Conflict resolution
Tools Projecting Risks
Carbon projects also create new risks for stakeholders which need to be
carefully projected by project developers. There is no set process for this.
But this can be done by:
• Use of project case studies to
identify general risk categories for
carbon forestry project types,
• Discussion of potential risks with
stakeholders during participatory
processes

PROJECTIONS: THINGS TO WATCH IN PROJECTS
• Stakeholders have not been involved in projections by defining the main processes and causative factors for change in social conditions
• No evidence that risks related to projects been discussed in the PDD or with stakeholders
• Key assumptions that have been used to develop projections about socio-economic conditions are not well justified
• No evidence that all stakeholder groups have been consulted about the suitability of mitigation strategies
• Alternative livelihood opportunities/compensation do not cover all affected stakeholders or are not viable in the long term
• Risks have not been properly identified because stakeholder consultation lacked independence
51Tools Projecting Impacts
!

SOCIAL AND BIODIVERSITY IMPACT ASSESSMENT (SBIA)
MANUAL FOR REDD+ PROJECTS
• Released September
2011
• Part 1: Core Guidance
• Part 2: Social Impact
Assessment Toolkit
• Authors: Michael
Richards and Steven
Panfil
52

SBIA MANUAL: DESCRIBES 7 STAGE PROCESS
53

SBIA MANUAL: SBIA ‘MAIN WORKSHOP’ APPROACH
• A ‘Main Workshop’ or series of workshops is a central approach recommended
in the SBIA Manual at the design phase for projects
• The workshop would comprise of approximately 20-25 selected group of stakeholder
participants who represent all whose rights may be affected by the project
• Non-stakeholders should not be included
• Stakeholder participants needs to be carefully selected, and briefed with adequate
notice about the meeting and logistical arrangements
• A strong ‘workshop coordinator’ should be identified ahead of time
• It may be necessary to pay participants a ‘per diem’ to compensate for lost livelihood
from the time spent at the workshop
• A workshop would ideally be convened ‘offsite’ for approx 4-5 days to go through the
steps of the SBIA process
54

SBIA MANUAL: SBIA WORKSHOP ACTIVITIES
• Stage 1: Starting Conditions Study and Stakeholder Identification
– Prior to the workshop, key stakeholder representatives will have been selected
– Define the project scope
– Develop a ‘vision statement’
– Identify Focal Issues & Focal Issue Statements
• Stage 2: “Without-Project” Social and Biodiversity Projections – What
Would Happen Without the Project?
– Divide workshop participants into focal issue ‘Working Groups’
– Developing Flow Diagrams to show how different causal factors affect focal issue
– Project change to focal issue, considering both negative and positive effects of the
‘without-project’ scenario over two future time frames
55

SBIA WORKSHOP ACTIVITIES -
EXAMPLE POVERTY FLOW DIAGRAM
56

SBIA WORKSHOP ACTIVITIES
• Stage 3: Project Design and Theory of Change – How Will the Social
and Biodiversity Benefits Be Achieved?
– Develop a results chain for each focal issue
– Results chains aim to cover negative factors identified in problem flow diagrams
– Develop a provisional ‘theory of change’ statement
57

SBIA WORKSHOP ACTIVITIES
EXAMPLE POVERTY RESULTS CHAIN
58

SBIA WORKSHOP ACTIVITIES
• Stage 4: Negative Impacts, Risks and Mitigation/Prevention
Measures – What Could Go Wrong?
– For each identified negative impact, the focal issue working group should identify
mitigation actions, or compensation mechanisms
– Integrate mitigation measures into the project results chain (see example in next
slide)
– Carry out a risk assessment on main results in the results chain
– Develop risk reduction or mitigation strategy, per identified risk
– Modification of ‘theory of change’ statement as needed
59

SBIA WORKSHOP ACTIVITIESEXAMPLE POVERTY RESULTS CHAIN, WITH NEGATIVE IMPACTS INCLUDED
60

SBIA WORKSHOP ACTIVITIES
• Stage 5 : Identification of Indicators – What Should We Measure?
• Stage 6: Developing the Monitoring Plan – How Should We Measure
the Indicators?
– The part of the workshop to cover stages 5+6 can be conducted with a sub-group
of the main workshop participants (as stages 2-4 can easily consume 4 days)
– In addition a couple of monitoring and evaluation experts could ideally participate
– The sub-group should convene immediately following the main workshop and
complete stages 5 + 6
61
SBIA WORKSHOP ACTIVITIES
• Stage 5 : Identification of Indicators – What Should We Measure?
– The sub-group should be divided into two monitoring plan teams
– Each team should work simultaneously to develop a ‘focal issue’ monitoring plan
– Review results chain and causal relationships (outputs, outcomes and impacts)
– Prioritize and identify pivotal results/objectives (select most important given not all
results can have indicators associated with them)
– Identify one indicator per objective, ensuring they are SMART
– Review other teams objectives and indicators
62

SBIA WORKSHOP ACTIVITIES
63
• Examples of Objectives and Indicators (from GuateCarbon REDD Project)
Focal Issue Objectives Indicators
Strengthened
Governance
By January 2012, the Coordinating Committee of
the Maya Biosphere Reserve has the mechanisms
to implement the environmental security strategy
in at least 70% of the area
- Mechanisms approved
By March 2012, an effective program of
community leadership is being developed in 10
concessions
- Community leadership program
designed and implemented
- Number of people trained
By June 2014, at least 50% of judiciary operators
in the Petén are applying their specialized
understanding of environmental legislation
- Number of judiciary operators
trained
By December 2014, at least 80% of environmental
actions result in crime sentences
Number of criminal sentences

SBIA WORKSHOP ACTIVITIES
• Stage 6: Developing the Monitoring Plan – How Should We Measure
the Indicators?
– This stage builds directly on the indicators developed in stage 5
– On a large sheet of paper, the columns below should be drawn up, and then
populated by the sub-group, based on the objectives and indicators chosen in stage
5.
64
Objective Indicator Indicator
Type
Data Collection
Method
Existing
Data
Who? When? Where? Cost to
Project

65
EVALUATION AGAINST THE
STANDARD

OVERVIEW OF THE EVALUATION SECTION
This section covers the following elements, which are especially
important during project evaluation against the standard
1.Establishing the original conditions of a project site (G1.5, G1.6)
2.How to make and evaluate baseline projections (without project scenario)
(G2.4)
3.Establishing net community impact (with project scenario)(CM.1)
4.Leakage (CM.2)
5.Monitoring community impacts (CM.3)
6.Gold-level impacts (GL.2)
66
G1. ORIGINAL CONDITIONS IN THE PROJECT AREA
67
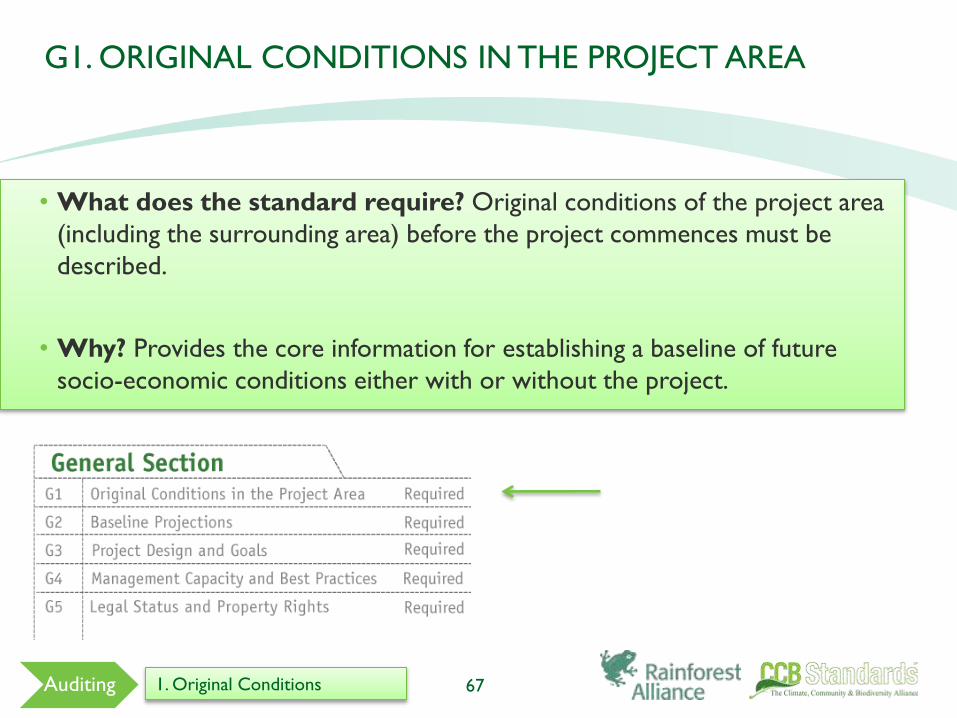
• What does the standard require? Original conditions of the project area
(including the surrounding area) before the project commences must be
described.
• Why? Provides the core information for establishing a baseline of future
socio-economic conditions either with or without the project.
Auditing 1. Original Conditions

G1. ORIGINAL CONDITIONS IN THE PROJECT AREA
68Auditing
Requirements:
Community Information
• Description of the communities in the project zone (G1.5)
• Description of the current land-use and property rights (G1.6)
1. Original Conditions

A description of communities located in the project zone, including basic socio-
economic and cultural information that describes the social, economic and cultural
diversity within communities (wealth, gender, age, ethnicity etc.), identifies specific
groups such as Indigenous Peoples and describes any community characteristics
G1.5 DESCRIPTION OF THE COMMUNITIES
LOCATED IN THE PROJECT ZONE
Auditing 1. Original Conditions
© J.Henman

G1.5 DESCRIPTION OF THE COMMUNITIES
LOCATED IN THE PROJECT ZONE
• Information should be aligned to compare with-project scenario.
• The communities should cover all groups of people in the project zone,
including indigenous and mobile people
• The description of the communities should cover financial, human,
natural, physical and social aspects
• The socio economic information should be gathered using participatory
processes and mixing qualitative and quantitative data or based on
official statistics
70
Common Pitfalls
• The socio-economic information is not disaggregated between the
different stakeholder groups
• Lack of consultation of all stakeholder groups identified
• The factors most likely to be impacted by the project are not identified
Conformance
Auditing 1. Original Conditions

A description of current land use and customary and legal property rights including
community property in the project zone, identifying any ongoing or unresolved
conflicts or disputes and identifying and describing any disputes over land tenure that
were resolved during the last ten years (see also G5)
G1.6 DESCRIPTION OF THE CURRENT LAND USE
AND PROPERTY RIGHTS
Auditing 1. Original Conditions
© J.Henman

G1.6 DESCRIPTION OF THE CURRENT LAND USE
AND PROPERTY RIGHTS
• The PDD should describe the types of agricultural systems, types of
forest management and property systems.
• Tenure rights should be documented to highlight conflicts or
disputes, e.g. forest management plans, independent title search.
• Tenure documents should include date of issuance and validity and their
relative importance.
72
Common Pitfalls
• The PDD does not describe the public, private and communal
property systems.
• Differences between government regulations and customary practices
inadequately presented.
• Ongoing conflicts or disputes over land tenure are not clearly
described.
Conformance
Auditing 1. Original Conditions

G.2 BASELINE PROJECTIONS
73
• What does the standard require? Baseline conditions of the project area
(including the surrounding area) in the absence of project activities.
• Why? Project impacts will be measured against this ‘without-project’
reference scenario.
Auditing 2. Baseline Projection

G.2 BASELINE PROJECTIONS
74Auditing
Requirements:
Community Information
• Description of ‘without project’ scenario effect on communities in the
project zone (G2.4)
2. Baseline Projection
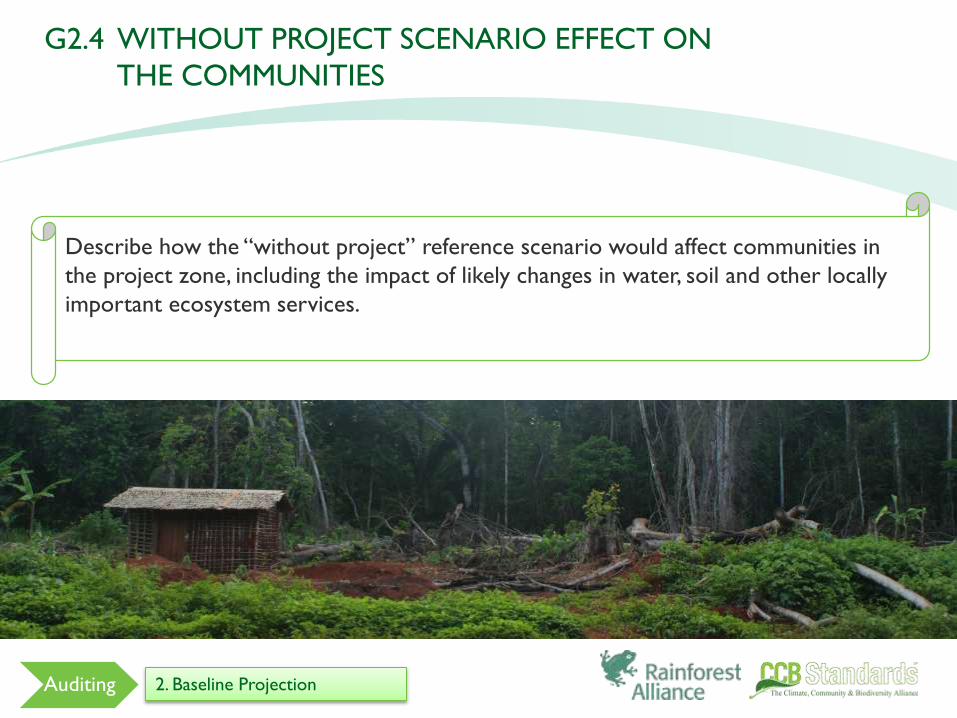
Describe how the “without project” reference scenario would affect communities in
the project zone, including the impact of likely changes in water, soil and other locally
important ecosystem services.
G2.4 WITHOUT PROJECT SCENARIO EFFECT ON
THE COMMUNITIES
Auditing 2. Baseline Projection
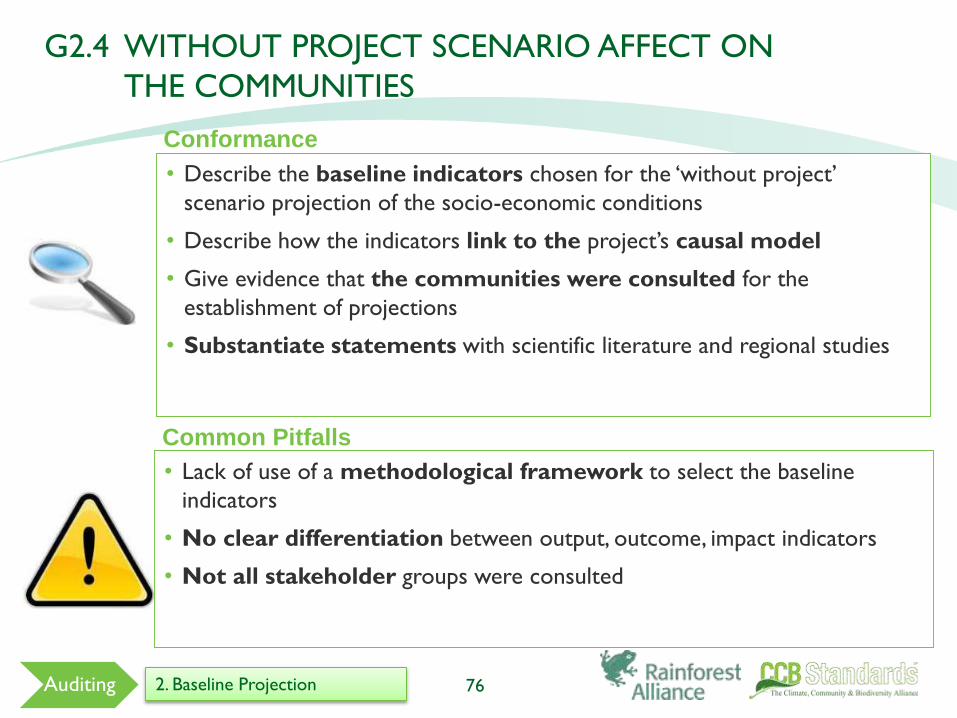
• Describe the baseline indicators chosen for the ‘without project’
scenario projection of the socio-economic conditions
• Describe how the indicators link to the project’s causal model
• Give evidence that the communities were consulted for the
establishment of projections
• Substantiate statements with scientific literature and regional studies
76
Common Pitfalls
• Lack of use of a methodological framework to select the baseline
indicators
• No clear differentiation between output, outcome, impact indicators
• Not all stakeholder groups were consulted
Conformance
Auditing 2. Baseline Projection
G2.4 WITHOUT PROJECT SCENARIO AFFECT ON
THE COMMUNITIES
CM1. NET POSITIVE COMMUNITY IMPACTS
77
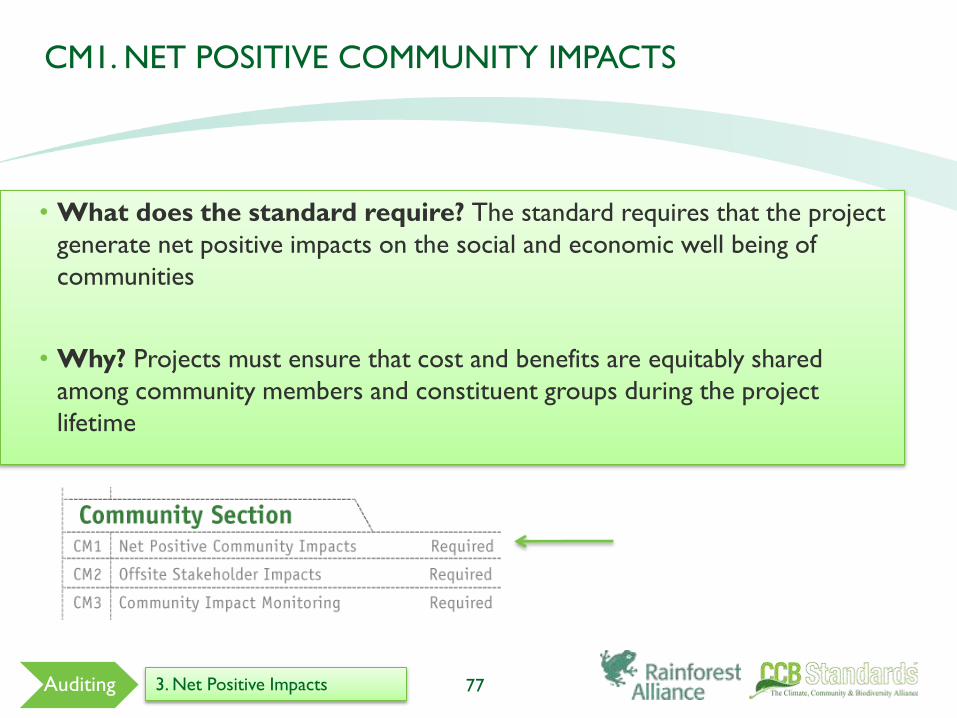
• What does the standard require? The standard requires that the project
generate net positive impacts on the social and economic well being of
communities
• Why? Projects must ensure that cost and benefits are equitably shared
among community members and constituent groups during the project
lifetime
Auditing 3. Net Positive Impacts
CM1. NET POSITIVE COMMUNITY IMPACTS
78Auditing 3. Net Positive Impacts
Requirements:
• Use of appropriate methodologies for the impact assessment (CM1.1)
• Demonstrate that no High Conservation Values are negatively impacted
(CM1.2)
CM1.2 will be covered with the rest of the HCVs in the Biodiversity
Section

KEY POINTS
• Use appropriate methodologies to estimate the impacts on
communities, (defined in G1), resulting from planned project activities.
• Produce a credible estimate of impacts on communities well-being due to
project activities and an evaluation of the impacts by affected groups.
• Compare the ‘with-project’ scenario to the ‘without project’ scenario of
social and economic well-being (completed in G2).
• The difference (i.e., the community benefit) must be positive for all
community groups.
CM1.1 USE OF APPROPRIATE METHODOLOGIES
FOR IMPACT ASSESSMENT
Auditing 3. Net Positive Impacts

• Use robust methodologies, such as the one in Annex A of the CCB
Standard
• Develop a robust causal model for future impacts justifying all
assumptions used
• Use comparable indicators between with and without scenario
• Give evidence of the self-evaluation of impacts by affected groups
80
Common Pitfalls
• No clear definition of the assumptions about how the project will
alter social and economic well-being
•The benefits are not clearly equitable across all stakeholder groups
•Significant groups not consulted
•Well being is not restricted to legal activities
Conformance
Auditing 3. Net Positive Impacts
CM1.1 USE OF APPROPRIATE METHODOLOGIES
FOR IMPACT ASSESSMENT

CM2. OFFSITE STAKEHOLDER IMPACTS
81
• What does the standard require? The standard requires that the project
must evaluate and mitigate any possible impacts that could result in the
decreased well-being of the main stakeholders living outside of the project
zone as a result of the project activities
• Why? Projects should at least ‘do no harm’ to the well-being of the offsite
stakeholders
Auditing 4. Offsite Stakeholder Impacts

CM2. OFFSITE STAKEHOLDER IMPACTS
82Auditing 4. Offsite Stakeholder Impacts
Requirements:
• Identify negative offsite stakeholder impacts (CM2.1)
• Describe the project plan to mitigate these impacts (CM2.2)
• Demonstrate the project will not result in net-negative impacts (CM2.3)

Identify any potential negative offset stakeholder impacts that the project activities are
likely to cause.
CM2.1 IDENTIFY NEGATIVE OFFSITE
STAKEHOLDER IMPACTS
Auditing 4. Offsite Stakeholder Impacts
© J.Henman

• Use of case studies to identify general risk categories of project
impacts on stakeholders
• The PDD must describe the stakeholder analysis process used to
identify affected stakeholders
84
Common Pitfalls
• No evidence that the offsite stakeholders have been consulted
• No evidence that an offsite stakeholder differentiation based on wealth or
well being has been carried out
Conformance
Auditing 4. Offsite Stakeholder Impacts
CM2.1 IDENTIFY NEGATIVE OFFSITE
STAKEHOLDER IMPACTS
Describe how the project plans to mitigate these negative offsite social and economic
impacts.
CM2.2 IMPACT MITIGATION PROJECT PLAN
Auditing 4. Offsite Stakeholder Impacts
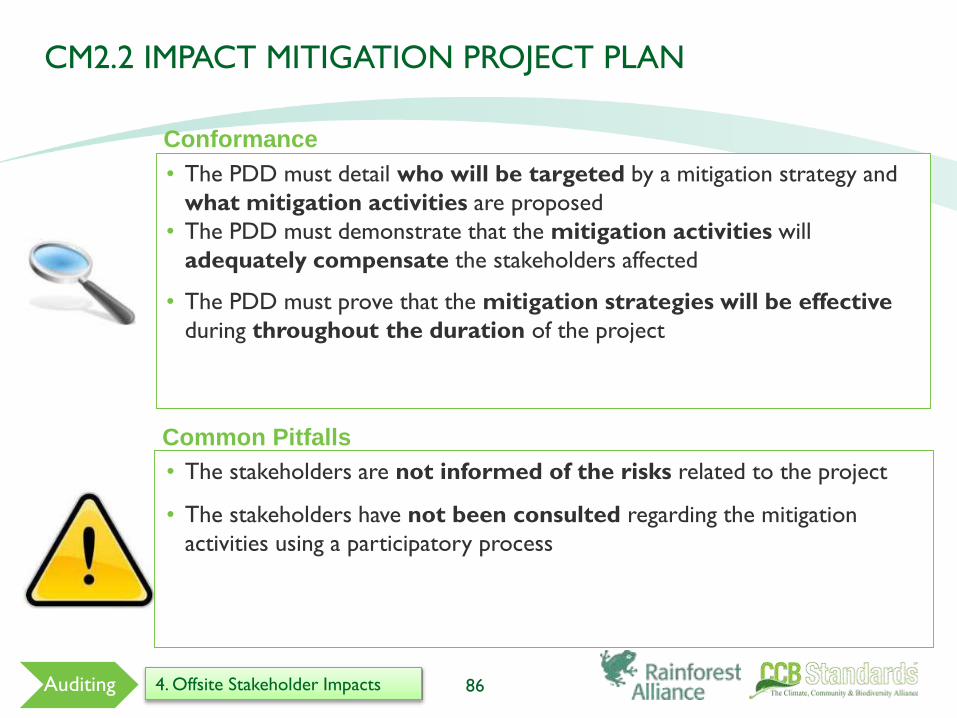
• The PDD must detail who will be targeted by a mitigation strategy and
what mitigation activities are proposed
• The PDD must demonstrate that the mitigation activities will
adequately compensate the stakeholders affected
• The PDD must prove that the mitigation strategies will be effective
during throughout the duration of the project
CM2.2 IMPACT MITIGATION PROJECT PLAN
86Auditing 4. Offsite Stakeholder Impacts
Common Pitfalls
Conformance
• The stakeholders are not informed of the risks related to the project
• The stakeholders have not been consulted regarding the mitigation
activities using a participatory process

Demonstrate that the project is not likely to result in net negative impacts on the well-
being of other stakeholder groups.
CM2.3 NO NET-NEGATIVE IMPACTS DEMONSTRATION
Auditing 4. Offsite Stakeholder Impacts
Source: Project PDD
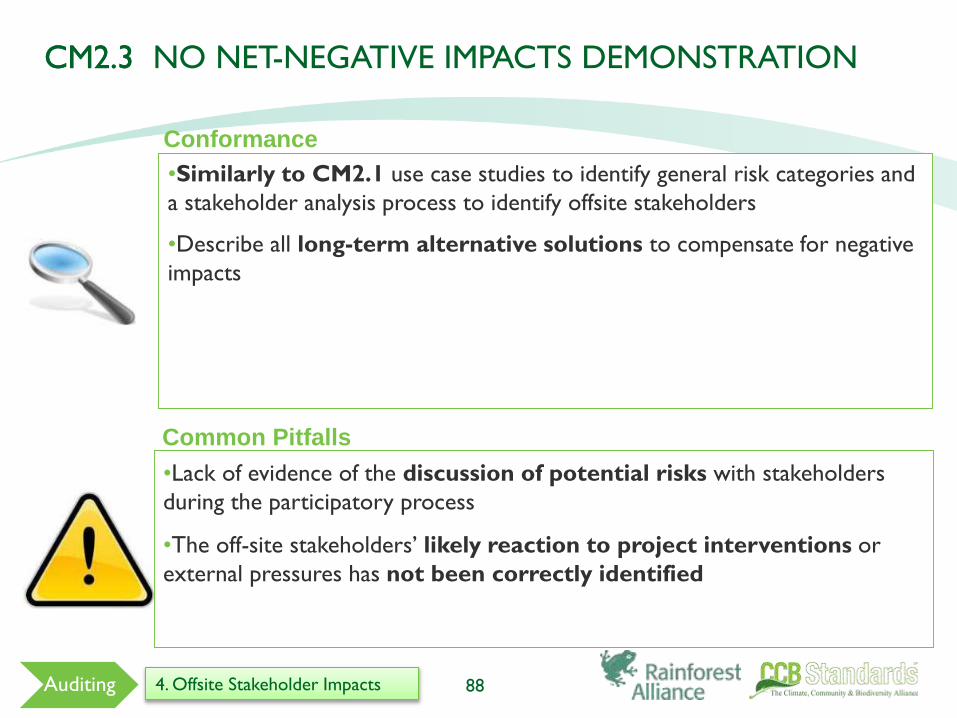
•Similarly to CM2.1 use case studies to identify general risk categories and
a stakeholder analysis process to identify offsite stakeholders
•Describe all long-term alternative solutions to compensate for negative
impacts
CM2.3
88Auditing 4. Offsite Stakeholder Impacts
CM2.3 NO NET-NEGATIVE IMPACTS DEMONSTRATION
Common Pitfalls
Conformance
•Lack of evidence of the discussion of potential risks with stakeholders
during the participatory process
•The off-site stakeholders’ likely reaction to project interventions or
external pressures has not been correctly identified

CM3. COMMUNITY IMPACT MONITORING
89
• What does the standard require? That the project must have a
monitoring plan indicating which communities and other stakeholders will be
monitored, and identifying the types of measurements, the sampling method,
and the frequency of measurement.
It is accepted that some of the plan details might not be
defined at the Validation stage as long as there is an explicit
commitment to do so later
• Why? Projects should quantify and document changes in social and
economic well-being resulting from the project activities for communities and
other stakeholders
Auditing 5. Impact Monitoring

CM3. COMMUNITY IMPACT MONITORING
90Auditing 5. Impact Monitoring
Requirements:
• Develop an initial plan for selecting community variables to be monitored
and the frequency of monitoring (CM3.1)
• Develop an initial plan to assess the effectiveness of measures used to
maintain or enhance HCVs (CM3.2)
• Commit to developing and disseminating a full monitoring plan (CM3.3)
CM3.2 will be covered with the rest of the HCVs in the Biodiversity
Section

Develop an initial plan for selecting community variables to be monitored and the
frequency of monitoring and reporting to ensure that monitoring variable are directly
linked to the projects’ community development objectives and to anticipated impacts
(positive and negative)
CM3.1 MONITORING VARIABLES AND FREQUENCY
Auditing 5. Impact Monitoring
© J.Henman

• List potential community variables which can include income,
employment, health, market access, schooling, food availability, security, etc.
• Describe the monitoring data collected e.g. payrolls, annual audit
reports
• Show comparison between project metrics and census or baseline
data to determine project effect on community development
92Auditing 5. Impact Monitoring
CM3.1 MONITORING VARIABLES AND FREQUENCY
Common Pitfalls
Conformance
• Variables chosen are not directly affected by the project
• Frequency of measurement is not representative of the variables
• Variables from other major stakeholder groups omitted

Commit to developing a full monitoring plan within six months of the project start
date or within twelve months of validation against the Standards and to disseminate
this plan and the results of monitoring, ensuring that they are made publicly available
on the internet and are communicated to the communities and other stakeholders.
CM3.3 COMMITING TO A FULL MONITORING PLAN
Auditing 5. Impact Monitoring

• The PDD should contain a statement of intention for the development
of the full monitoring plan and timelines for this
• Evidence that the plan and monitoring results will be disseminated to all
stakeholders, ideally the list of variables and frequency of monitoring
should have already been disseminated
• Present the strategy for the public dissemination of the monitoring
plan
94Auditing 5. Impact Monitoring
CM3.3 COMMITING TO A FULL MONITORING PLAN
Common Pitfalls
Conformance
• Some stakeholders are not aware of the monitoring process or don’t
understand what it entails
• No demonstration that the steps required to deliver a full monitoring plan
are achievable within the timeline
• Only community “authorities” are informed of process, and not majority of
community members.

GL2. EXCEPTIONAL COMMUNITY BENEFITS
GOLD STATUS (OPTIONAL)
95Auditing 6. Gold Status
• What does the standard require? The project must benefit globally
poorer communities and the poorer, more vulnerable households and
individuals within them.
– This optional criterion requires innovative approaches that enable poorer
households to participate effectively in land-based carbon activities.
• Why? Carbon projects may be developed that have benefits for some
members of communities, but not necessarily the poorest.

GL2. EXCEPTIONAL COMMUNITY BENEFITS
GOLD STATUS (OPTIONAL)
96Auditing
Requirements:
• Located in a poor area (GL2.1)
• Benefits to 50% of households in the lower quartile (GL2.2)
• Benefit flow to poorer households (GL2.3)
• Identification of negative effects on the poor (GL2.4)
• Monitoring impacts on the poor (GL2.5)
6. Gold Status

Demonstrate that the project zone is in a low-human development country OR in an
administrative area of a medium of high human development country in which at least
50% of the population of that area is below the national poverty line.
GL2.1 LOCATED IN A POOR AREA
Auditing 6. Gold Status
© J.Henman

• The PDD should reference the UNDP Human Development Report
or official national statistics and/or censuses covering poverty in the
project zone
• The information should come from governmental or peer reviewed
sources and be up-to-date
98Auditing 6. Gold Status
GL2.1 LOCATED IN A POOR AREA
Common Pitfalls
Conformance
• The latest studies are discarded if they come after the conceptualization
or start of the project

Demonstrate that at least 50% of households within the lowest category of well-being
(e.g. poorest quartile) of the community are likely to benefit substantially from the
project
GL2.2 BENEFITS TO 50% HOUSEHOLDS
IN LOWER QUARTILE
Auditing 6. Gold Status

• A description is not enough, the PDD should quantify the most in need
group, detailing the number of households in the community that are
affected by the project activities
• The PDD should show that a clear wealth ranking process has been
used to disaggregate stakeholders
100Auditing 6. Gold Status
GL2.2 BENEFITS TO 50% HOUSEHOLDS
IN LOWER QUARTILE
Common Pitfalls
Conformance
• The indicators chosen to reflect the poorer-quartile are not correctly
identified
• Further socioeconomic stratification within an already low-wealth
stakeholder group has not been conducted.

Demonstrate that any barriers or risks that might prevent benefits going to poorer
households have been identified and addressed in order to increase the probable flow
of benefits to poorer households.
GL2.3 BENEFIT FLOW TO POORER HOUSEHOLDS
Auditing 6. Gold Status

• Identify benefit barriers through stakeholder interviews and
literature
• Perform a risk-benefit analysis for poorer households
• Describe the measures implemented to increase benefits to poorer
households
102Auditing 6. Gold Status
GL2.3 BENEFIT FLOW TO POORER HOUSEHOLDS
Common Pitfalls
Conformance
• The stakeholders are not aware of the risks impending on their benefits

Demonstrate that measures have been taken to identify any poorer and more
vulnerable households and individuals whose well-being or poverty may be negatively
affected by the project, and that the project design includes measures to avoid any
such impacts. Where negative impacts are unavoidable, demonstrate that they will be
effectively managed.
GL2.4 IDENTIFICATION OF NEGATIVE EFFECTS
ON THE POOR
Auditing 6. Gold Status

• Demonstrate that the poor and vulnerable households have been
identified through participatory processes
• Clearly justify the reasons negative impacts are unavoidable
104Auditing 6. Gold Status
GL2.4 IDENTIFICATION OF NEGATIVE EFFECTS
ON THE POOR
Common Pitfalls
Conformance
• Impacts have been only been minimized and not avoided
• Not all stakeholder groups have been consulted

Demonstrate that community impact monitoring will be able to identify positive and
negative impacts on poorer and more vulnerable groups. The social impact monitoring
must take a differentiated approach that can identify positive and negative impacts on
poorer households and individuals and other disadvantaged groups, including women.
GL2.5 MONITORING IMPACTS ON THE POOR
Auditing 6. Gold Status

• Evidence and justification of how the variables chosen to be monitored
will reflect project impacts on poorer and more vulnerable groups
106Auditing 6. Gold Status
GL2.5 MONITORING IMPACTS ON THE POOR
Common Pitfalls
Conformance
• The variables chosen do not disaggregate between the different
classes of stakeholder groups

FURTHER RESOURCES
107
© J.Henman

GENERAL
• See the hyperlinks provided in the relevant sections of the tools and techniques
section of this presentation!
• Also see:
– Richards, M. and Panfil, S.N. 2011. Social and Biodiversity Impact Assessment (SBIA)
Manual for REDD+ Projects: Part 1 – Core Guidance for Project Proponents.
Climate, Community & Biodiversity Alliance, Forest Trends, Fauna & Flora
International, and Rainforest Alliance. Washington, DC. Available at: www.climate-
standards.org
– Richards, M. 2011. Social and Biodiversity Impact Assessment (SBIA) Manual for
REDD+ Projects: Part 2 – Social Impact Assessment Toolbox. Climate, Community
& Biodiversity Alliance and Forest Trends with Rainforest Alliance and Fauna &
Flora International. Washington, DC. Available at: www.climate-standards.org
– CCBA. 2008. Climate, Community & Biodiversity Project Design Standards Second
Edition. CCBA, Arlington, VA. December, 2008. At: www.climate-standards.org
108

FURTHER RESOURCES ON:
STAKEHOLDER DIFFERENTIATION
• CARE, 2002. Household Livelihood Security Assessments. A Toolkit for
Practitioners, Prepared for the PHLS Unit by: TANGO International Inc., Tucson,
Arizona 2002, US.
http://pqdl.care.org/Practice/HLS%20Assessment%20-
%20A%20Toolkit%20for%20Practitioners.pdf
This publication outlines a useful process for carrying out stakeholder
differentiation in project design
109
FURTHER RESOURCES ON:
DATA COLLECTION AND ANALYSIS
• Schreckenberg, K., Camargo, I., Withnall, K., Corrigan, C., Franks, P., Roe, D., Scherl, L. M. and Richardson, V. (2010) Social Assessment of Conservation Initiatives: A review of rapid methodologies, Natural Resource Issues No. 22. IIED, London. Available at: www.iied.org
This publication outlines all of the main concepts discussed in the tools and techniques section of this presentation and highlights pros and cons of different approaches
• CARE, 2002. Household Livelihood Security Assessments. A Toolkit for Practitioners, Prepared for the PHLS Unit by: TANGO International Inc., Tucson, Arizona 2002, US. http://pqdl.care.org/Practice/HLS%20Assessment%20-%20A%20Toolkit%20for%20Practitioners.pdf
• Catley, A., Burns, J., Adebe, D. & Suji, O. 2007. Participatory Impact Assessment. A Guide for Practitioners. Feinstein International Center, Tufts University. Medford, USA. http://www.entwicklung.at/uploads/media/Feinstein_Guide_Participatory_Impact_10_21_01.pdf
This publication gives a useful introduction to participatory approaches to social impact assessment
• PROFOR, 2008. Poverty Forests Linkages Toolkit. Program on Forests, World Bank, Washington, DC http://www.profor.info/profor/node/103
This series of publications gives a detailed introduction to concepts and tools for best practice social impact assessment linked to forestry projects110

FURTHER RESOURCES ON: INDICATORS
• Schreckenberg, K., Camargo, I., Withnall, K., Corrigan, C., Franks, P., Roe, D., Scherl, L. M.
and Richardson, V. (2010) Social Assessment of Conservation Initiatives: A review of rapid
methodologies, Natural Resource Issues No. 22. IIED, London. Available at: www.iied.org
This publication includes a discussion of different types of indicators and
how they can be applied in social impact assessment
• Richards, M. & Panfil, S.N. 2010. Manual for Social Impact Assessment of Land-Based
Carbon Projects. Version 1. Forest Trends, Climate, Community & Biodiversity Alliance,
Rainforest Alliance and Fauna & Flora International. Washington, DC. Available at:
www.climate-standards.org
This manual gives useful examples of many different indicator frameworks
and outlines some useful indicators specifically for carbon projects (pg 95)
111

FURTHER RESOURCES ON:
PROJECTIONS AND CAUSAL MODELS
• Evans, K., Velarde, S.J., Prieto, R.P., Rao, S.N., Sertzen, S., Davila, K., Cronkleton, P. and de Jong, W. 2006. Field guide to the future: four ways for communities to think ahead. CIFOR, ASB, ICRAF, Nairobi. http://www.asb.cgiar.org/PDFwebdocs/Evans-et-al-2006-Field-guide-to-the-future.pdf
This guide outlines useful tools for working with communities to project the impacts of development projects
• Wollenberg, E., Edmunds, D., Buck, L. 2000. Anticipating change: scenarios as a tool for adaptive forest management: a guide. CIFOR, Bogor, Indonesia. http://www.cifor.cgiar.org/acm/methods/fs.html
This guide outlines useful approaches for constructing scenarios of the social impacts of forestry projects
• Maack, J.N. 2001. Scenario analysis: a tool for task managers. From social analysis: Selected tools and techniques. Social Development Papers Number 36. The World Bank, Washington DC. http://siteresources.worldbank.org/EXTSOCIALDEV/Resources/31773941167940794463/ScenarioAnalysisMaack.pdf
This guide outlines useful approaches for constructing scenarios of the social impacts of forestry projects
112

PHOTO COPYRIGHT AND RE-USE
113
• All photos used in training materials are copyright to Jenny Henman and/or Leo Peskett
• Written permission is required for their re-use from Jenny Henman
• Any re-use must acknowledge on the photo Jenny Henman and/or Leo Peskett as per the
current copyright
