ccbst 2014 - a field study of airflow in high-rise multi...
TRANSCRIPT

14th Canadian Conference on Building Science and Technology - Toronto, Ontario 2014 Page 1
A Field Study of Airflow in Mid to High-Rise Multi-Unit Residential Buildings Lorne Ricketts, MASc, EIT John Straube, PhD, P.Eng.
ABSTRACT Airflow into, out of, and within buildings is a fundamental factor of building design and operation, as
building airflow patterns impact occupant health and comfort, building durability, and energy consumption. The height, typical inclusion of operable windows, and compartmentalized nature of high-rise multi-unit residential buildings makes them both unique and complex, and to efficiently and effectively ventilate these types of buildings, an understanding of airflow within and through them is required.
Airflow between building spaces (i.e. rooms, suites, storeys) is driven by pressure differences between the exterior and the interior, or between internal building spaces. These pressure differences are created by wind, stack effect, and mechanical ventilation systems. These driving forces move air within and through buildings, and this airflow is resisted by the airtightness of building elements including exterior and interior walls, doors, windows, floors etc.
A field study was carried out to determine and assess airflow patterns at a high-rise multi-unit residential building. This study included measurement of airflow rates between zones using perfluorocarbon tracer methods, long-term monitoring of pressure differences, and airtightness testing. Exterior conditions including wind speed and direction, temperature, and relative humidity were monitored using a weather station installed on the roof of the building to allow for evaluation of the interaction between the building and the exterior environment. This paper summarizes the results of this field study and then generalizes these findings for buildings of different height or located in different climate zones. INTRODUCTION
Airflow into, out of, and within buildings is a fundamental factor of building design and operation, as building airflow patterns impact occupant health and comfort, building durability, and energy consumption. The height, typical inclusion of operable windows, and compartmentalized nature of high-rise multi-unit residential buildings makes them both unique and complex, and to efficiently and effectively ventilate these types of buildings, an understanding of airflow within and through them is required. This understanding should include consideration of the driving forces of airflow and their interaction with the physical building including the building enclosure and interior compartmentalizing elements. While significant work has been conducted to understand airflows in houses and commercial buildings, multi-unit residential buildings pose unique challenges and are less well understood.
The majority of high-rise multi-unit residential buildings in Canada and the United States are ventilated using a corridor pressurization ventilation system. This system is intended to pressurize the corridors to provide ventilation air to suites, and to control and dilute air contaminants. Despite common anecdotal accounts of poor performance, and supporting research, the use of this ventilation system in high-rise multi-unit residential buildings is pervasive. Performance complaints include high humidity levels, sound transfer, and migration of cooking odours and vehicle exhaust fumes.
To understand the causes of the poor performance of corridor pressurization based ventilation systems, and subsequently to design alternative systems to provide better ventilation and airflow control, an understanding of pressure differences and airtightness is required. Pressure differences are created by
14th Canadian Conference on Building Science and Technology - Toronto, Ontario 2014 Page 2
the driving forces of airflow: wind, stack effect, and mechanical ventilation systems. These pressure differences drive airflow within and through buildings and can be developed across both the exterior enclosure and across interior compartmentalizing elements such as suite entrance doors, floors, and shaft walls. The airtightness of these elements resists airflow and alters the distribution of pressure differences within a building.
This paper provides a summary of an ongoing study of airflow and ventilation at a 13-storey multi-unit residential building in Vancouver, BC. The building was originally constructed in 1986, has a gross floor area of approximately 5,000 m² (54,000 ft²), and has 37 residential units with an average of 125 m² (1,340 ft²) each. The residents of the building are typically 55 years or older and many spend much of their time within their suites, unlike some condominiums which are occupied for fewer hours per day. The building is ventilated by a make-up air unit on the roof of the building using a corridor pressurization based ventilation system. Overall, the case study building is representative of much of the existing mid- to high-rise multi-unit residential housing stock constructed from the 1970’s through 1990’s across North America. In the latter half of 2013 the building underwent a significant building enclosure retrofit including over-cladding and window replacement. The potential impact of this retrofit on ventilation rates and airflow patterns is considered where appropriate.
To evaluate the performance of the ventilation system and its interaction with other drivers of airflow at this case study building, an experimental program was developed and implemented. This program includes:
• Measurements of airflow between zones using perfluorocarbon tracer (PFT) gas testing • Measurements of exterior enclosure and interior compartmentalizing element airtightness using
pressure neutralized testing techniques • Monitoring of pressure differences between building zones The methodology and results for each of these components of the experimental program are presented
in the Experimental Program section of this paper. Results of this case study are then extrapolated to multi-unit residential buildings in general. Conclusions are drawn at the end of the paper based on the compilation of the findings of each of the individual components of the experimental & analytical work. This paper provides a summary of this research work, and the complete study is detailed in Ricketts (2014). EXPERIMENTAL PROGRAM
The subsequent sections of this paper present the methodology and results for each of the components of the experimental program. First, measurements of the actual airflow (i.e. ventilation) rates are presented, and then measurements of other factors which may impact airflow rates are presented as means of explanation. Perfluorocarbon Tracer Gas Testing
Airflow rates between zones of the case study building were measured using the perfluorocarbon tracer gas (PFT) testing method developed by Brookhaven National Laboratory. (Heiser, & Sullivan, 2002) (D’Ottavio, Senum, & Dietz, 1988) This testing used 7 distinct PFT gasses to tag the air in various suites of the case study building. Because the source release rate is known, and assuming that these gasses are well mixed with the air within a given zone, measurement of the quantity of these gasses in the air of the tagged zones can provide a measurement of the air change rates of the tagged zones as well as of the airflow rates between zones. To measure the concentration of the PFTs in the selected zones, capillary absorption tube samplers (CATS) were placed in each of the selected zones. These CATS absorb all of the PFT gasses simultaneously and when subsequently analyzed, they provide a time-

14th Canadian Conference on Building Science and Technology - Toronto, Ontario 2014 Page 3
averaged measurement of the concentration of each of the PFT gasses in the zone in which they were installed. For this testing, the sources and CATS were installed after completion of the enclosure retrofit for a period of one week from April 10th to 17th, 2013 to capture typical occupancy patterns. For reference, the average exterior temperature during this period was 8°C and the average wind speed was 3.3 m/s. The total air flow rates into the suites as determined by the PFT testing are provided in FIGURE 1.
513
512
2333 27
73
91
57
0
10
20
30
40
50
60
70
80
90
100
Suite202
Suite301
Suite302
Suite303
Suite402
Suite1003
Suite1101
Suite1102
Suite1103
Suite1203
Airflow [L/s]
Lower Suites Upper Suites
ASHRAE 62.1‐2010 ≈ 40L/s
FIGURE 1: Chart showing the total airflow rate from all sources into each of the measure suites
FIGURE 1 indicates that there is an order of magnitude variation in the ventilation rates of the suites at the case study building. Typically, upper suites are more ventilated than lower suites, and most suites are either over- or under-ventilated compared to modern ventilation standards. (ASHRAE 62.1-2010) The cause of this variation is discussed in subsequent sections of this paper.
FIGURE 2 and FIGURE 3 illustrate the airflow rates to and from adjacent zones for six suites at the case study building as measured as part of the PFT testing.
0
10
20
30
40
50
60
70
80
90
100
Suite 301 Suite 302 Suite 303 Suite 1101 Suite 1102 Suite 1103
Airflow Rate [L/s]
Corridor
Suite to Right
Suite to Left
Suite Above
Suite Below
Exterior
Parking Garage
Flow to suites above and below only measured for Suite 302 and Suite 1103.
*Some results manually corrected.
FIGURE 2: Chart showing source of airflow into suites for six suites at the case study building

14th Canadian Conference on Building Science and Technology - Toronto, Ontario 2014 Page 4
0
10
20
30
40
50
60
70
80
90
100
Suite 301 Suite 302 Suite 303 Suite 1101 Suite 1102 Suite 1103
Airflow Rate [L/s]
Corridor
Suite to Right
Suite to Left
Suite Above
Suite Below
Exterior
Parking Garage
Flow to suites above and below only measured for Suite 302 and Suite 1103.
*Some results manually corrected.
FIGURE 3: Chart showing source of airflow out of suites for six suites at the case study building
Consistent with FIGURE 1, FIGURE 2 and FIGURE 3 also show significantly higher airflow rates into and out of the upper suites compared to the lower suites. Generally, this is due to higher airflow rates into the suite from the corridor (ventilation) and higher airflow rates out of the suites to the exterior. This finding is consistent with stack effect which would tend to cause exfiltration at the top of the building from the corridor through the suites to the exterior. This may also be caused by proximity to the make-up air unit and increased magnitude of wind on upper floors.
It is also apparent that the lower suites (Suite 301, Suite 302, and Suite 303) receive a significant proportion of the airflow into the suites from the parking garage. Parking garages often have relatively high concentrations of harmful contaminates including particulates, carbon monoxide, and various hydrocarbons from vehicle exhaust; consequently, airflow from the parking garage to occupied spaces of the building is a significant health concern.
To illustrate the distribution of air from the make-up air unit (MAU) and parking garage into the building, FIGURE 4 shows the quantity of tracer measured each zone for the tracer released in the MAU intake and for the tracer released in the parking garage. Note that the concentration of the tracer released in the parking garage was measured to be higher in Suite 302 than in the parking garage which is impossible and likely indicates that this CATS was unintentionally contaminated.
Overall, the PFT testing at the case study building found that typically the upper suites are over-ventilated and the lower suites are under-ventilated compared to modern ventilation standards, and that there is an order of magnitude variation in the ventilation rates. These findings indicate that the corridor pressurization ventilation system at this building is not effectively or efficiently ventilating the suites. The cause of these airflow patterns is discussed in more detail in subsequent sections.

14th Canadian Conference on Building Science and Technology - Toronto, Ontario 2014 Page 5
a) Distribution of tracer released in MAU b) Distribution of tracer released in parking garage FIGURE 4: Schematic cross-sections of the case study building showing the amount of tracer measured in each zone released in a) the MAU air intake with PMCP tracer, and b) the parking garage with PDCB tracer
Airtightness Testing Airtightness resists airflow and it is possible that the distribution of airtightness of the exterior
enclosure and of interior compartmentalizing elements is impacting the airflow patterns at the case study building. To evaluate the role of airtightness in creating the measured airflow patterns, pressure-neutralized multi-point fan depressurization/pressurization testing was performed. This technique uses multiple fans to sequentially develop and neutralize pressure differences across the exterior enclosure and interior compartmentalizing elements thereby determining the airflow resistance characteristics (i.e. the flow coefficient (C), and the flow exponent (n)) of each of the zone boundaries. This type of testing was performed on 3 corridors (Corridors 3, 9, and 11) and 6 suites (suites on Floors 3 and 11). The average result of the 3 corridor tests is presented in FIGURE 5.
296 L/s, 20%
612 L/s, 41%
446 L/s, 29%
158 L/s, 10%Suite Doors (3)
Elevator Doors (2)
Stairwell Doors (2)
Other
Airflow Rates at 75 Pa
"Other" includes flow to floors above and below, flow through the electical closets, and flow in to the garbage chute.
FIGURE 5: Chart showing the average distribution of airtightness for the three tested corridors

14th Canadian Conference on Building Science and Technology - Toronto, Ontario 2014 Page 6
FIGURE 5 illustrates that when the corridor is equally pressurized relative to adjacent zones, only approximately 20% of the airflow paths are directly to the adjacent suites through the suite entrance door. As the pressurized corridor ventilation system relies on pressurization of the corridor to deliver ventilation air to the suites, this finding indicates a significant potential for loss of ventilation air to other adjacent spaces such as the stairwells and elevator shafts, and consequently a significant inefficiency in the system. Additionally, large flow paths to zones other than the adjacent suites make controlling pressure differences more difficult as the zones are less compartmentalized relative to each other.
The suites were also airtightness tested both prior to and after the exterior enclosure retrofit. The average results of this testing are provided in FIGURE 6.
101 L/s, 16%
96 L/s, 15%
99 L/s, 15%
27 L/s, 4%
150 L/s, 24%
167 L/s, 26%
Suites Above and Below
Corridor
Suite Entrance Door
Suites to Left and Right
Exterior Enclosure ‐ Post‐Retrofit
Exterior Enclosure AirtightnessImprovement
Airflow Rates at 75 Pa
FIGURE 6: Chart showing the average distribution of airtightness for the tested suites
FIGURE 6 shows that prior to the enclosure retrofit approximately 50% of the leakage paths out of the average suite were through the exterior enclosure; however, post-retrofit this leakage has been reduced by 53% to 24%. Once the exterior enclosure is relatively airtight, the importance of airtightness of the interior compartmentalizing elements increases. Significant airflow paths were measured between corridors and suites through both the suite entrance door and the surrounding walls. The air leakage through the suite entrance door is intentional as it provides the path for ventilation air to reach the suites as part of the corridor pressurization system, but also provides a large flow path in the opposite direction when pressure differences reverse. There are also significant flow paths through the concrete floor slabs to the suites above and below. These airflow paths provide a route for unintentional airflows between suites.
The airflow through the exterior enclosure pre-retrofit was 317 L/s at 75 Pa and post-retrofit was 150 L/s at 75 Pa; however, the opening of operable windows can significantly reduce the resistance to airflow provided by the exterior enclosure. (Note that these values are not normalized by the wall area as is commonly done for airtightness test results because in this case the total amount of airflow through the enclosure is of interest.) An average operable window at the case study building is approximately 53 cm x 132 cm (1’9” x 4’4”) which, using an discharge coefficient of 0.611 (corresponding with orifice flow, i.e. equivalent leakage area), corresponds with approximately 4,800 L/s at 75 Pa. This flow rate through a completely open window is approximate, but indicates the order of magnitude increase in airflow which can occur through the exterior enclosure when the windows are open compared to when the windows are closed.
The ability for occupants to significantly alter the airtightness of the exterior enclosure by opening windows makes high-rise multi-unit residential buildings different than high-rise commercial or

14th Canadian Conference on Building Science and Technology - Toronto, Ontario 2014 Page 7
institutional building which often do not have operable windows. Changes to the exterior enclosure airtightness caused by the opening of windows increases the importance of the airtightness of interior compartmentalizing elements as pressure differences will act across these interior boundaries and have the potential to cause unintentional airflows. The distribution of pressures that can be caused by the operation of exterior windows is assessed in the subsequent section. Pressure Monitoring
A long-term monitoring program was implemented as part of the field study. This monitoring included hourly measurements of pressure differences between various zones of the building as well as across the exterior enclosure at locations on each elevation near the top of the building and near the bottom of the building. As pressure differences drive airflows, these measured pressures provide an indication of the drivers that are creating the measured airflow patterns, and can also be used in conjunction with the measured airtightness levels to estimate airflow rates between spaces.
FIGURE 7 shows the average pressure difference from the corridor to the adjacent suites for three upper floors and three lower floors.
‐5
0
5
10
15
20
25
‐10
‐5
0
5
10
15
20
Exterior Temperature [°C]
Pressure Difference [Pa]
Floor 02 Floor 03 Floor 04 Floor 10Floor 11 Floor 12 Temp ‐ WS' [°C]
FIGURE 7: Graph showing the average pressure difference from the corridors to the adjacent suites for six floors at the case study building (positive indicates corridor is higher pressure than adjacent suites)
FIGURE 7 shows that on upper floors the pressure of the corridor increases relative to the adjacent suites during colder periods of the year; while on lower floors there is little to no variation. This finding is consistent with stack effect. Importantly the variation in the pressure on upper floors is approximately 10 to 15 Pa, and other measurements determined that the MAU pressurizes the corridor by approximately 5 to 10 Pa. Because these pressure differences are of similar magnitude and acting in the same location, it is likely that stack effect significantly affects ventilation rates within the case study building and is a major cause of the measured airflow patterns.
Based on these measurements, stack effect has a relatively large impact on the building pressure regime despite the relatively moderate climate of Vancouver, BC. Literature commonly discusses stack effect across the exterior enclosure, and the airtightness testing indicates that more than half of the stack effect pressures should act across the exterior enclosure post-retrofit because the exterior enclosure is more airtight than the combination of the suite entrance doors and suite-to-corridor walls. However, the pressure measurements indicate that approximately 69% of stack effect acts across the boundary between the corridors and the adjacent suites. This is likely due to the use of operable exterior windows which, when open, provide large airflow paths relative to the airflow paths through the rest of the exterior
14th Canadian Conference on Building Science and Technology - Toronto, Ontario 2014 Page 8
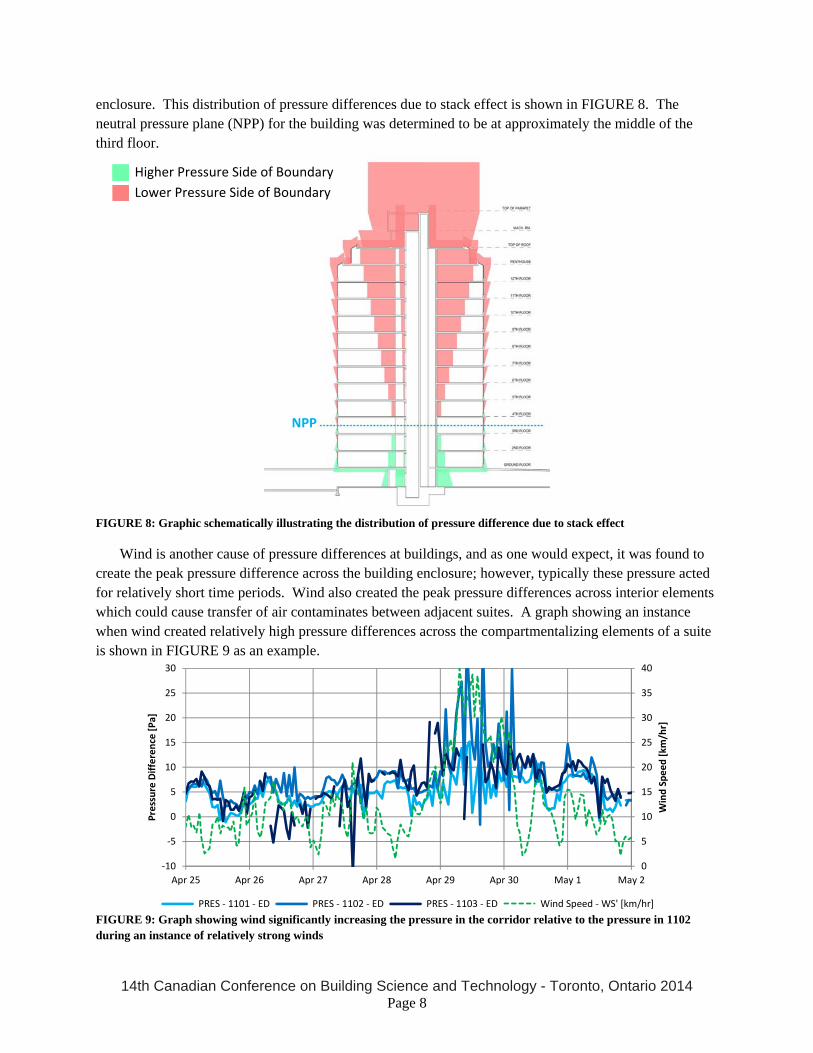
enclosure. This distribution of pressure differences due to stack effect is shown in FIGURE 8. The neutral pressure plane (NPP) for the building was determined to be at approximately the middle of the third floor.
FIGURE 8: Graphic schematically illustrating the distribution of pressure difference due to stack effect
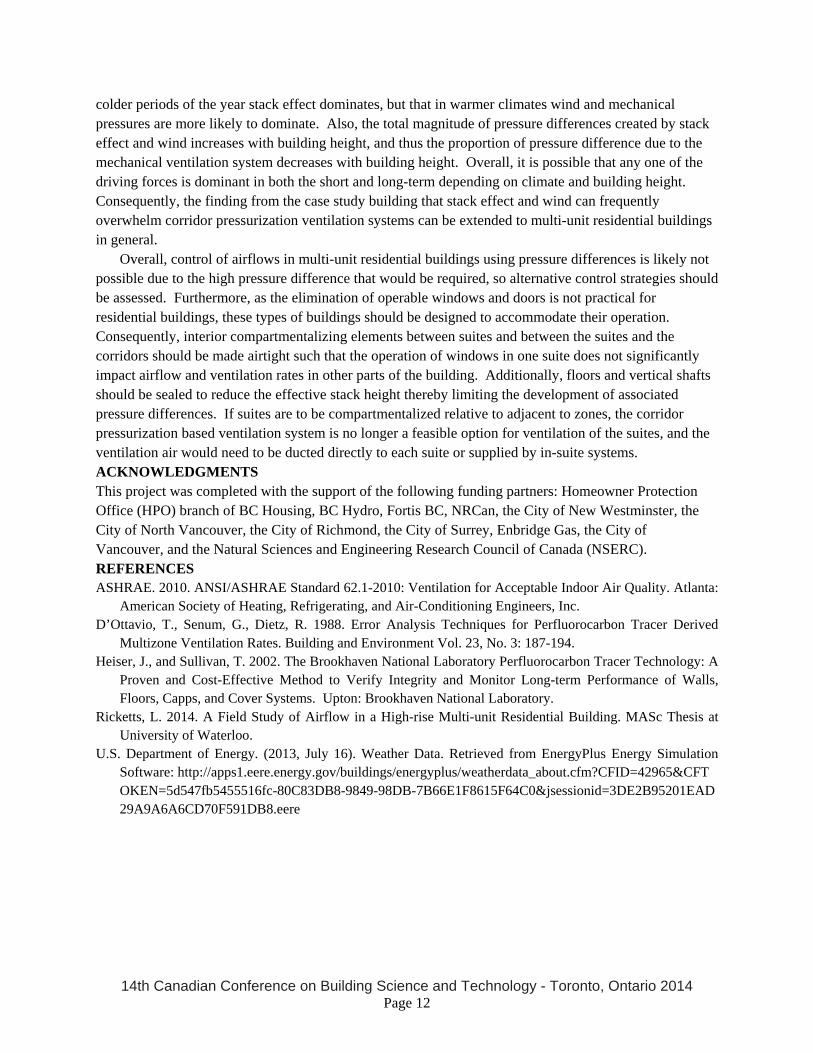
Wind is another cause of pressure differences at buildings, and as one would expect, it was found to create the peak pressure difference across the building enclosure; however, typically these pressure acted for relatively short time periods. Wind also created the peak pressure differences across interior elements which could cause transfer of air contaminates between adjacent suites. A graph showing an instance when wind created relatively high pressure differences across the compartmentalizing elements of a suite is shown in FIGURE 9 as an example.
0
5
10
15
20
25
30
35
40
‐10
‐5
0
5
10
15
20
25
30
Apr 25 Apr 26 Apr 27 Apr 28 Apr 29 Apr 30 May 1 May 2
Wind Speed [km
/hr]
Pressure Difference [Pa]
PRES ‐ 1101 ‐ ED PRES ‐ 1102 ‐ ED PRES ‐ 1103 ‐ ED Wind Speed ‐ WS' [km/hr]
FIGURE 9: Graph showing wind significantly increasing the pressure in the corridor relative to the pressure in 1102 during an instance of relatively strong winds
Higher Pressure Side of Boundary
Lower Pressure Side of Boundary
NPP

14th Canadian Conference on Building Science and Technology - Toronto, Ontario 2014 Page 9
GENERALIZATION OF FIELD STUDY RESULTS The field study clearly indicates the strong influence of stack effect and wind on building airflow and
ventilation patterns; however, this study provides results for only a 13-storey building located in Vancouver, BC which has a relatively moderate climate with respect to both wind and temperature. To examine the potential impact of stack effect and wind on buildings of different heights in climates which have more extreme conditions, the magnitudes of stack effect and wind were calculated for building heights of 20 m, 40 m, 60 m, 80 m, and 100 m using the maximum pressure created by stack effect (assuming NPP at mid-height of building) and the stagnation pressure of the wind (Cp = 1, and terrain category 2) at the roof of a building. These calculations use Canadian Weather for Energy Calculations (CWEC) weather data for locations in Canada and typical meteorological year (TMY) data for locations in the United States. (U.S. Department of Energy, 2013) The proportion of the total absolute magnitude of the driving forces attributable to stack effect, wind, and a mechanical pressure of 10 Pa was then determined on an hourly basis for each of these building heights in eight cities in North America. FIGURE 10 to FIGURE 12 show the proportion of total pressure difference created by each of the driving forces on an hourly basis for a 40m tall building in Miami, Vancouver, and Fairbanks respectively. FIGURE 13 shows the annual average proportion of the absolute magnitude of the total pressure differences created by the driving forces for various building heights in Vancouver, and FIGURE 14 shows the proportions for a 40 m tall building in each of eight cities with different climates.
Note that FIGURE 10 to FIGURE 14 do not indicate the direction of the pressure differences created (positive or negative) nor do they indicate the distribution of the pressure differences but instead are intended only to indicate relative magnitudes. As the mechanical ventilation pressure used for these graphs is always 10 Pa, this value can be used in interpreting the graphs to determine the approximate magnitudes of the driving forces.
FIGURE 10: Graph of proportion of total absolute pressure difference attributable to each of the driving forces at the top of a 40 m tall building in Miami

14th Canadian Conference on Building Science and Technology - Toronto, Ontario 2014 Page 10
FIGURE 11: Graph of proportion of total absolute pressure difference attributable to each of the driving forces at the top of a 40 m tall building in Vancouver
FIGURE 12: Graph of proportion of total absolute pressure difference attributable to each of the driving forces at the top of a 40 m tall building in Fairbanks
0%
10%
20%
30%
40%
50%
60%
70%
Stack Effect Wind Mechanical(10 Pa)
Percentage
of Driving Force Pressure
20 m
40 m
60 m
80 m
100 m
BuildingHeight
FIGURE 13: Graph of annual average proportion of total pressure difference attributable to each of the driving forces at the top of a building for various building heights in Vancouver

14th Canadian Conference on Building Science and Technology - Toronto, Ontario 2014 Page 11
0%
10%
20%
30%
40%
50%
60%
70%
Stack Effect Wind Mechanical(10 Pa)
Percentage
of Driving Force Pressure
Miami
Houston
Los Angeles
New York
Vancouver
Toronto
Calgary
Fairbanks
FIGURE 14: Graph of annual average proportion of total pressure difference attributable to each of the driving forces at the top of a 40 m tall building in various North American cities
The combination of the preceding graphs illustrates that, as one would expect, stack effect is a dominant driving force in colder climates and during colder periods of the year, but that in warmer climates wind and mechanical pressures are more likely to dominate. Also, the total magnitude of pressure differences created by stack effect and wind increases with building height, and thus the proportion of pressure difference due to the mechanical ventilation system decreases with building height. Overall, it is possible that any one of the driving forces is dominant in both the short and long-term depending on climate and building height. CONCLUSIONS AND RECOMMENDATIONS
A field study was conducted to evaluate airflows in a high-rise multi-unit residential building. This study included measurements of airflow rates, airtightness, and pressure differences. Overall, the pressurized corridor based ventilation system at the case study building was found to unevenly distribute ventilation air to both the corridors and suites of the building with upper zones receiving significantly higher ventilation rates than lower zones, and most suites being significantly over- or under-ventilated. This poor performance is due to the complex interaction of the driving forces of airflow and the airtightness (or lack of airtightness) of building elements.
Effective distribution of ventilation air in the building is significantly impacted by stack effect, and, on a shorter time-scale, by wind. These driving forces were measured to create pressure differences of similar (and frequently greater) magnitude as those created by the mechanical ventilation system. Furthermore, operable windows can significantly reduce the airtightness of the exterior enclosure such that pressures created by wind and stack effect frequently act across interior compartmentalizing elements such as suite entrance doors. In the case of stack effect, approximately 69% of the theoretical stack effect pressure difference was measured across the suite entrance doors. Given that these driving forces of airflow frequently act across interior compartmentalizing elements and are of similar magnitude to mechanically induced pressure differences, there is significant potential for overwhelming of the mechanically induced pressures and consequently for alteration of airflow rates and direction. Changes in the flow rates and direction due to stack effect and wind can lead to the under- and over-ventilation that was measured and can also cause contaminant transfer between zones. Thus, the control of airflows using pressure difference is not feasible at the building studied due to the high pressure differences that would be required to overcome stack effect and wind.
The results of this field study were then generalized for multi-unit residential buildings of different heights and in different climate zones. This analysis demonstrated that in colder climates and during
14th Canadian Conference on Building Science and Technology - Toronto, Ontario 2014 Page 12
colder periods of the year stack effect dominates, but that in warmer climates wind and mechanical pressures are more likely to dominate. Also, the total magnitude of pressure differences created by stack effect and wind increases with building height, and thus the proportion of pressure difference due to the mechanical ventilation system decreases with building height. Overall, it is possible that any one of the driving forces is dominant in both the short and long-term depending on climate and building height. Consequently, the finding from the case study building that stack effect and wind can frequently overwhelm corridor pressurization ventilation systems can be extended to multi-unit residential buildings in general.
Overall, control of airflows in multi-unit residential buildings using pressure differences is likely not possible due to the high pressure difference that would be required, so alternative control strategies should be assessed. Furthermore, as the elimination of operable windows and doors is not practical for residential buildings, these types of buildings should be designed to accommodate their operation. Consequently, interior compartmentalizing elements between suites and between the suites and the corridors should be made airtight such that the operation of windows in one suite does not significantly impact airflow and ventilation rates in other parts of the building. Additionally, floors and vertical shafts should be sealed to reduce the effective stack height thereby limiting the development of associated pressure differences. If suites are to be compartmentalized relative to adjacent to zones, the corridor pressurization based ventilation system is no longer a feasible option for ventilation of the suites, and the ventilation air would need to be ducted directly to each suite or supplied by in-suite systems. ACKNOWLEDGMENTS This project was completed with the support of the following funding partners: Homeowner Protection Office (HPO) branch of BC Housing, BC Hydro, Fortis BC, NRCan, the City of New Westminster, the City of North Vancouver, the City of Richmond, the City of Surrey, Enbridge Gas, the City of Vancouver, and the Natural Sciences and Engineering Research Council of Canada (NSERC). REFERENCES ASHRAE. 2010. ANSI/ASHRAE Standard 62.1-2010: Ventilation for Acceptable Indoor Air Quality. Atlanta:
American Society of Heating, Refrigerating, and Air-Conditioning Engineers, Inc. D’Ottavio, T., Senum, G., Dietz, R. 1988. Error Analysis Techniques for Perfluorocarbon Tracer Derived
Multizone Ventilation Rates. Building and Environment Vol. 23, No. 3: 187-194. Heiser, J., and Sullivan, T. 2002. The Brookhaven National Laboratory Perfluorocarbon Tracer Technology: A
Proven and Cost-Effective Method to Verify Integrity and Monitor Long-term Performance of Walls, Floors, Capps, and Cover Systems. Upton: Brookhaven National Laboratory.
Ricketts, L. 2014. A Field Study of Airflow in a High-rise Multi-unit Residential Building. MASc Thesis at University of Waterloo.
U.S. Department of Energy. (2013, July 16). Weather Data. Retrieved from EnergyPlus Energy Simulation Software: http://apps1.eere.energy.gov/buildings/energyplus/weatherdata_about.cfm?CFID=42965&CFT OKEN=5d547fb5455516fc-80C83DB8-9849-98DB-7B66E1F8615F64C0&jsessionid=3DE2B95201EAD29A9A6A6CD70F591DB8.eere