ccg improvement and assessment framework 2016… · technical annex for the ccg improvement and...
TRANSCRIPT

2
CCG improvement and assessment framework 2016/17: Technical Annex

3

4
Technical annex for the CCG improvement and assessment framework 2016/17
Version number: 2.0
First published: 23 May 2016
Revised: June 2017
Prepared by: NHS England analytical team
Classification: OFFICIAL
This document can be made available in alternative formats, such as easy read or large
print, and may be available in alternative languages, upon request. Please contact 0300
311 22 33 or email [email protected]

5
Contents
Introduction.................................................................................................................................... 4
BETTER HEALTH .................................................................................................................... 5
101a. Maternal smoking at delivery ................................................................................................ 6
102a. Percentage of children aged 10-11 classified as overweight or obese ......................................... 8
103a. Diabetes patients that have achieved all the NICE recommended treatment targets: Three (HbA1c,
cholesterol and blood pressure) for adults and one (HbA1c) for children ............................................ 10
103b. People with diabetes diagnosed less than a year who attend a structured education course ........ 12
104a. Injuries from falls in people aged 65 and over ....................................................................... 14
105a. Utilisation of the NHS e-referral service to enable choice at first routine elective referral .............. 17
105b. Personal health budgets .................................................................................................... 20
105c. Percentage of deaths which take place in hospital ................................................................. 22
105d. People with a long-term condition feeling supported to manage their condition(s) ....................... 24
106a. Inequality in unplanned hospitalisation for chronic ambulatory care sensitive conditions .............. 27
106b. Inequality in emergency admissions for urgent care sensitive conditions ................................... 30
107a. Antimicrobial resistance: appropriate prescribing of antibiotics in primary care ........................... 34
107b. Antimicrobial resistance: Appropriate prescribing of broad spectrum antibiotics in primary care .... 38
108a. Quality of life of carers....................................................................................................... 41
BETTER CARE ...................................................................................................................... 44
121a,b,c. Provision of high quality care......................................................................................... 45
122a. Cancers diagnosed at early stage ....................................................................................... 48
122b. People with urgent GP referral having first definitive treatment for cancer within 62 days of referral50
122c. One-year survival from all cancers ...................................................................................... 52
122d. Cancer patient experience ................................................................................................. 55
123a. Improving Access to Psychological Therapies recovery rate.................................................... 56
123b. People with first episode of psychosis starting treatment with a NICE-recommended package of
care treated within 2 weeks of referral .......................................................................................... 58
123c. Children and young people’s mental health services transformation ......................................... 60
123d. Crisis care and liaison mental health services transformation .................................................. 63
123e. Out of area placements for acute mental health inpatient care - transformation .......................... 67
124a. Reliance on specialist inpatient care for people with a learning disability and/or autism ............... 69
124b. Proportion of people with a learning disability on the GP register receiving an annual health check 71
125a. Neonatal mortality and stillbirths ......................................................................................... 72
125b. Women’s experience of maternity services ........................................................................... 75
125c. Choices in maternity services ............................................................................................. 81
126a. Estimated diagnosis rate for people with dementia................................................................. 87
126b. Dementia care planning and post-diagnostic support ............................................................. 89
127a. Achievement of milestones in the delivery of an integrated urgent care service .......................... 91
127b. Emergency admissions for urgent care sensitive conditions .................................................... 93
6
127c. Percentage of patients admitted, transferred or discharged from A&E within 4 hours................... 95
127d. Ambulance waits .............................................................................................................. 96
127e. Delayed transfers of care per 100,000 population .................................................................. 98
127f. Population use of hospital beds following emergency admission ..............................................101
128a. Management of long term conditions ..................................................................................104
128b. Patient experience of GP services......................................................................................106
128c. Primary care access.........................................................................................................109
128d. Primary care workforce.....................................................................................................111
129a. Patients waiting 18 weeks or less from referral to hospital treatment........................................114
130a. Achievement of clinical standards in the delivery of 7 day services ..........................................116
131a. People eligible for standard NHS Continuing Healthcare........................................................119
SUSTAINABILITY................................................................................................................. 121
141a. Financial plan .................................................................................................................122
141b. In-year financial performance ............................................................................................125
142a. Outcomes in areas with identified scope for improvement ......................................................128
142b. Expenditure in areas with identified scope for improvement....................................................136
143a - Adoption of new models of care ........................................................................................138
144a. Local digital roadmap in place ...........................................................................................140
144b. Digital interactions between primary and secondary care .......................................................141
145a. Local strategic estates plan (SEP) in place ..........................................................................143
WELL LED ........................................................................................................................... 146
161a. Sustainability and Transformation Plan ...............................................................................147
162a. Probity and corporate governance......................................................................................148
163a. Staff engagement index....................................................................................................151
163b. Progress against workforce race equality standard ...............................................................154
164a. Effectiveness of working relationships in the local system ......................................................157
165a. Quality of CCG leadership ................................................................................................159

4
Introduction
The CCG Improvement and Assessment Framework includes a set of 60 indicators
across 29 areas. This Technical Annex provides the detail of the construction and
purpose of each of the indicators in the Framework. The detail is provided in a
mostly standardised form, with slight differences for the small number of indicators
which require more judgement and moderation in their construction.
The content of the Technical Annex is current at the time of publication. It is likely
that there will need to be changes to the content, to reflect any changes to the
indicators in the Framework, definitions which are refined following experience using
the indicators, or corrections which are found necessary. Such updates, where
needed, will be provided on NHS England’s website approximately quarterly.

5
BETTER HEALTH
Indicator number
Indicator name
101a Maternal Smoking at Delivery
102a Percentage of children aged 10-11 classified as overweight or obese 103a Diabetes patients that have achieved all the NICE recommended
treatment targets: Three (HbA1c, cholesterol and blood pressure) for adults and one (HbA1c) for children
103b People with diabetes diagnosed less than a year who attend a structured education course
104a Injuries from falls in people aged 65 and over 105a Utilisation of the NHS e-referral service to enable choice at first routine
elective referral 105b Personal health budgets 105c Percentage of deaths which take place in hospital 105d People with a long-term condition feeling supported to manage their
condition(s)
106a Inequality in unplanned hospitalisation for chronic ambulatory care sensitive conditions
106b Inequality in emergency admissions for urgent care sensitive conditions 107a Anti-microbial resistance: appropriate prescribing of antibiotics in primary
care 107b Anti-microbial resistance: Appropriate prescribing of broad spectrum
antibiotics in primary care 108a Quality of life of carers

6
101a. Maternal smoking at delivery
Theme, Area Better Health, Smoking
Definition The percentage of women who were smokers at the time of delivery, out of the number of maternities
Publication status In publication
Purpose (Rationale) To encourage the continued prioritisation of action to
reduce smoking at delivery. Decreases in smoking during pregnancy will result in health benefits for the infant and mother, as well as cost savings to the NHS.
Evidence and policy base Smoking during pregnancy causes up to 2,200 premature births, 5,000 miscarriages and 300 perinatal deaths every year in the UK. It also increases the risk of developing a number of respiratory conditions; attention and
hyperactivity difficulties; learning difficulties; problems of the ear, nose and throat; obesity; and diabetes. On average, smokers have more complications during pregnancy and labour, including bleeding during
pregnancy, placental abruption and premature rupture of membranes. There is also an increased risk of miscarriage, premature birth, stillbirth, low birth-weight and sudden unexpected death in infancy.
Rates of smoking in pregnancy are currently measured by Smoking at Time of Delivery (SATOD). Whilst rates across England have declined there remains substantial variation across the country.
Encouraging pregnant women to stop smoking during pregnancy may also help them kick the habit for good, and thus provide health benefits for the mother and reduce
exposure to second hand smoke by the infant.
Data
Data source NHS Digital, Statistics on Women’s Smoking Status at Time of Delivery
http://content.digital.nhs.uk/searchcatalogue?q=%22Statistics+on+Women%27s+Smoking+Status+at+Time+of+Delivery%2c+England%22&sort=Most+recent&size=10&page=1
Data fields Org code; org name; number of maternities; number of women known to be smokers at time of delivery, year of
the collection period; quarter in the year of the collection period
Data filters N/A

7
Data processing N/A
Construction
Numerator Number of women known to smoke at time of delivery.
Denominator Number of maternities.
Computation CCGs submit the following data items each quarter:
· Number of maternities is defined as the number of
pregnant women who give birth to one or more live or stillborn babies of at least 24 weeks gestation, where the
baby is delivered by either a midwife or doctor at home or in an NHS hospital (including GP units). This count is the number of pregnant women, not the number of babies (deliveries). It does not include maternities that occur in
psychiatric hospitals or private beds / hospitals. · Number of women known to be smokers at the time of delivery is defined as the number of pregnant women
who reported that they were smokers at the time of giving birth. Calculation
Percentage of women known to be smokers at the time of delivery:
100 x (Number of women known to be smokers at the time of delivery / Number of maternities) NOTE: The percentage of maternities where the smoking
status was not recorded will result in the under reporting of the percentages of recorded smokers and non-smokers, this should be taken into account when interpreting these data.
Risk adjustment or standardisation type and methodology
None
Output
Frequency of publication Quarterly

8
102a. Percentage of children aged 10-11 classified as overweight or obese
Theme, Area Better Health, Child obesity
Definition Number of children in Year 6 (aged 10-11 years) classified as overweight or obese in the National Child Measurement
Programme (NCMP) attending participating state maintained schools in England as a proportion of all children measured.
Publication status In publication
Purpose (Rationale) To encourage action on overweight and obese children, as
they are more likely to become overweight or obese adults, with consequent health problems
Evidence and policy base The Health Survey for England (HSE) found that among
boys and girls aged 2 to 15, the proportion of children who were classified as obese increased from 11.7 per cent in 1995 to 16.0 per cent in 2010, peaking at 18.9 per cent in 2004.
There is concern about the rise of childhood obesity and the implications of such obesity persisting into adulthood. The risk of obesity in adulthood and risk of future obesity-
related ill health are greater as children get older. Studies tracking child obesity into adulthood have found that the probability of overweight and obese children becoming overweight or obese adults increases with age. The health
consequences of childhood obesity include: increased blood lipids, glucose intolerance, Type 2 diabetes, hypertension, increases in liver enzymes associated with fatty liver, exacerbation of conditions such as asthma and
psychological problems such as social isolation, low self-esteem, teasing and bullying. The National Institute of Health and Clinical Excellence
have produced guidelines to tackle obesity in adults and children - Obesity: the prevention, identification, assessment and management of overweight and obesity in adults and children. Available at
http://guidance.nice.org.uk/CG43
Data
Data source PHE, National Child Measurement Programme, Prevalence of overweight and obesity by area of child
residence (modelled) by Clinical Commissioning Group http://webarchive.nationalarchives.gov.uk/20170210161227/http:/www.noo.org.uk/visualisation
Data fields Numerator, Denominator and % (indicator value) columns in tab called Year6_ExcessWeight
Data filters N/A

9
Data processing N/A
Construction
Numerator Number of children in Year 6 classified as overweight or obese in the academic year. Children are classified as overweight (including obese) if their BMI is on or above the
85th centile of the British 1990 growth reference (UK90) according to age and sex.
Denominator Number of children in Year 6 (aged 10-11 years) measured
in the National Child Measurement Programme (NCMP) attending participating state maintained schools in England.
Computation % of children aged 10-11 years classified as overweight or obese. Children are classified as overweight (including obese) if their BMI is on or above the 85th centile of the British 1990 growth reference (UK90) according to age and
sex. To produce as robust an indicator as possible at small area level, these prevalence estimates use three years of data combined.
Risk adjustment or standardisation type and methodology
Direct Standardisation Variables and methodology (for more info please see: http://www.noo.org.uk/securefiles/160225_1348//PHE_NC
MP_AnalysisGuidance_October_2015.pdf (page 36-39): http://www.noo.org.uk/NCMP/analytical_guidance Child growth reference was used to convert the height,
weight and BMI measurements of individual children into standard deviation scores (z scores) or centiles (p scores). These z scores describe whether the child has a higher or lower value for that measure than would be expected of
children of the same age and sex. The NCMP published prevalence data use the British 1990 growth reference (UK90) for BMI and the 2nd, 85th and
95th centiles to define children as underweight, overweight or obese according to age and sex. This definition is the most commonly used in England for population monitoring – for example in Health Survey for England (HSE) figures.
Output
Frequency of publication Annually

10
103a. Diabetes patients that have achieved all the NICE recommended treatment
targets: Three (HbA1c, cholesterol and blood pressure) for adults and one
(HbA1c) for children
Theme, Area Better Health, Diabetes
Definition The percentage of diabetes patients that have achieved all 3 of the NICE-recommended treatment targets; as follows: Adults: HbA1c <=58mmol/mol (7.5%), Cholesterol <5mmol/L and
Blood pressure <=140/80 mmHg Children: HbA1c <=58mmol/mol (7.5%)
Publication status In publication
Purpose (Rationale) To incentivise CCGs to improve achievement rates for the
NICE-recommended treatment targets
Evidence and policy base The CCG IAF indicators encompass the triple aim of the
NHS Forward View (better health and wellbeing for populations, better quality care for patients, and better value for taxpayers). They are not intended to provide comprehensive coverage of NHS England and CCG
responsibilities. They are intended to be a small number of key metrics chosen to drive improvement in the highest priority areas. For adults, NICE recommends that the treatment and
management of diabetes aims for specific treatment targets for glucose levels, blood pressure and cholesterol For children, NICE recommends that the treatment and management of diabetes aims for a specific treatment
target for glucose levels. Achievement of the NICE recommended treatment targets plays an important role in the reduction of risk of the microvascular complications of diabetes (eye disease and
blindness; kidney disease and kidney failure; foot disease, foot ulceration and amputation) and in the reduction of excess risk of cardiovascular disease (heart attack, angina, heart failure, stroke, and amputation).
Whilst the National Diabetes Audit (NDA) reports against treatment targets in children, the National Paediatric Diabetes Audit (NPDA) does also. This indicator does not include the NPDA in its calculation due to an unknown
degree of overlap (of children) between the two audits (work is ongoing to quantify this overlap). As reported in the NDA, concurrent achievement of all 3 NICE-recommended treatment targets in individuals with
diabetes has not significantly improved in recent years. Additionally, the most recent NDA (2014-15) highlighted that only 19% of patients with type 1 diabetes and 41% of patients with type 2 diabetes are concurrently achieving all
3 treatment targets.

11
N.B. Linkage of individual patient-level data to give
information on the concurrent achievement of all 3 treatment targets in each individual is only achieved by the NDA, not by QOF.
Achievement of NICE-recommended treatment targets will be influenced by a range of factors including, but not limited to: - In adults, delivery rates for the 8 NICE-recommended
diabetes care processes (attributable to CCG) - In children, delivery rates for the 7 NICE-recommended diabetes care processes (attributable to CCG) - Self-management (attributable to CCG and patient)
As such, it is expected that, measuring treatment targets will incentivise CCGs to improve both delivery rates for the NICE-recommended care processes and the uptake of structured education, whilst allowing a degree of flexibility
to potentially stimulate innovation in other treatment areas. Data
Data source National Diabetes Audit (NDA) http://content.digital.nhs.uk/nda
Data fields http://content.digital.nhs.uk/media/23810/NDADPP-Pilot- Primary-Care-Extraction- Specification/pdf/NDA_DPP_Pilot_Primary_Care_Extractio
n_Specification.pdf NHS Number; Date of birth; Gender; Practice code; BP (Blood pressure); HbA1c; Serum total cholesterol
Data filters Diabetes diagnosis date (where before audit end date) Dissent from disclosure of personal confidential data by NHS Digital (where code exists without an appropriate withdrawn dissent code)
Data processing Mapping of GP practices to CCGs, and aggregation of data.
Construction
Numerator Number of NDA-registered diabetes patients achieving all
relevant treatment targets as recorded by the NDA: Adults: HbA1c ≤7.5%, cholesterol < 5mmol/l and blood pressure <=140/80 Children (<12 years): HbA1c ≤7.5%
Denominator Number of NDA-registered diabetes patients with relevant values recorded
Computation Numerator/Denominator expressed as a percentage
Risk adjustment or standardisation type and methodology
None
Output
Frequency of publication Annually

12
103b. People with diabetes diagnosed less than a year who attend a structured
education course
Theme, Area Better health, Diabetes
Definition The percentage of people with diabetes diagnosed for less than one year who have a record of attendance at a
structured education course. This is measured using the number of people who have attended a structured education course within 12 months of diagnosis, as recorded by the NDA.
Publication status In publication
Purpose (Rationale) To incentivise CCGs to increase the number of diabetes patients attending structured education
Evidence and policy base Poor management can be associated with higher risk of the microvascular complications of diabetes (eye disease and blindness; kidney disease and kidney failure; foot disease, foot ulceration and amputation) and higher risk of
cardiovascular disease (heart attack, angina, heart failure, stroke, and amputation). As such, NICE recommends that newly diagnosed diabetes patients are attend a structured education course within 12-months of diagnosis in order to
improve understanding, empowerment and self-management of diabetes. Whilst diabetes care process delivery and treatment target
achievement are recommended in order to both monitor for the onset of diabetes complications and to minimise the risk of onset of diabetes complications, structured education is recommended to support self-management in
order to achieve the same goals, as well as to achieve better understanding of the disease and better quality of life with diabetes.
According to the latest NDA (2015-16), only 6% of patients newly diagnosed with type 1 diabetes in 2014 and 7.5% of patients newly diagnosed with type 2 diabetes in 2014 attended a structured education course, suggesting that
there is scope for considerable improvement. Data
Data source National Diabetes Audit (NDA) http://content.digital.nhs.uk/nda
Data fields http://content.digital.nhs.uk/media/23810/NDADPP-Pilot-Primary-Care-Extraction-Specification/pdf/NDA_DPP_Pilot_Primary_Care_Extraction_Specification.pdf
Year; CCG code; CCG name; Number diagnosed; Structured education

13
Data filters Structured education attendance date (where before the
audit end date) Dissent from disclosure of personal confidential data by NHS Digital (where code exists without an appropriate withdrawn dissent code).
Structured education filter: Field: NDA field for Education referral Condition: Is equal to one of the codes detailed below Attended diab structured education programme
Diabetes structured education programme completed Attended diabetes education and self-management for ongoing and newly diagnosed structured programme (DESMOND)
Diabetes education and self-management for ongoing and newly diagnosed structured programme completed (DESMOND) Attended expert patient education versus routine treatment
diabetes structured education programme (XPERT) Expert patient education versus routine treatment diabetes structured education programme completed (XPERT) Attended dose adjustment for normal eating diabetes
structured education programme (DAFNE) Dose adjustment for normal eating diabetes structured education programme completed (DAFNE)
Data processing Mapping of GP practices to CCGs, and aggregation of data
Construction
Numerator Number of NDA-registered diabetes patients attending a structured education course within 12 months of diagnosis
Denominator Number of NDA-registered diabetes patients who were newly diagnosed in the calendar year
Computation Numerator/Denominator, expressed as a percentage Note that the method for calculating this indicator has been
improved for the 2015-16 NDA compared to the 2014-15 NDA, which means figures across the two years are not comparable. The 2015-16 NDA relates to those newly diagnosed in calendar years 2013 and 2014 respectively
and whether they were subsequently offered and attended structured education. Further details about the calculation method and how it compares to earlier years can be found at: http://content.digital.nhs.uk/catalogue/PUB23241/nati-
diab-audi-rep1-meth-2015-16_V2.pdf
Risk adjustment or
standardisation type and methodology
None
Output
Frequency of publication Annually

14
104a. Injuries from falls in people aged 65 and over
Theme, Area Better health, Falls
Definition Age-sex standardised rate of emergency hospital admissions for injuries due to falls in persons aged 65+ per 100,000 population
Publication status In publication
Purpose (Rationale) To indicate how well the NHS, public health and social care are working together to tackle issues locally
Evidence and policy base Falls are the largest cause of emergency hospital
admissions for older people, and significantly impact on long term outcomes, e.g. being a major precipitant of people moving from their own home to long-term nursing or residential care[1].
The highest risk of falls exists for those aged 65 and above and it is estimated that about 30% of people (2.5 million) aged 65 and above living at home and about 50% of
people aged 80 and above living at home or in residential care will experience a fall at least once a year [2]. Falls that results in injury can be very serious - approximately 1 in 20 older people living in the community experience a fracture
or need hospitalisation after a fall. Falls and fractures in those aged 65 and above account for over 4 million bed days per year in England alone, at an estimated cost of £2 billion [3].
The National Institute for Health and Clinical Excellence (NICE) has produced a quality standard that covers assessment after a fall and preventing further falls
(secondary prevention) in older people living in the community and during a hospital stay. The standard is designed to drive measurable improvements in the 3 dimensions of quality – patient safety, patient experience
and clinical effectiveness. [2] [1]. Department of Health (2012), Improving outcomes and supporting transparency. Part 2: Summary technical
specifications of public health indicators. Available at: http://www.dh.gov.uk/en/Publicationsandstatistics/Publicati
ons/PublicationsPolicyAndGuidance/DH_132358 [2]. National Institute for Health and Clinical Excellence (2015), Falls in older people: Assessment after a fall and
preventing further falls. Available at: http://www.nice.org.uk/guidance/qs86/chapter/introduction [3]. Royal College of Physicians (2011), NHS services for

15
falls and fractures in older people are inadequate, finds
national clinical audit. Available at: https://www.rcplondon.ac.uk/news/nhs-services-falls-and-fractures-older-people-are-inadequate-finds-national-clinical-audit
Data
Data source Secondary Uses Service (SUS) data Please note that for the 2016/17 year end assessment indicator values have been sourced from SUS (all historic
values have been recalculated based on SUS data) GP-registered populations
Data fields der_primary_diagnosis_code – diagnosis code, 3 or 4 characters age_on_admission - age at start of episode Admission_Method – method of admission
Sex – sex of patient Admission_Date – date of admission Der_Episode_Number – episode order Source_of_Admission – source of admission
CDS_Type – episode type Patient_Classification – patient classification Final_Derived_CCG – CCG of responsibility
Data filters Numerator: der_primary_diagnosis_code = S00 – T98 (selects episodes relating to injury, poisoning and certain other consequences of external causes)
Der_Diagnosis_All = W00 – W19 (selects external cause codes for falls) age_on_admission = 65 – 120 (restricts to over 65) Admission_Method = 21, 22, 23, 24, 25, 28, 2A, 2B, 2C,
2D (restricts to emergency admissions) Sex = 1 or 2 (allows direct age standardisation to enable comparable rates between CCGs and over time to be calculated)
Admission_Date = rolling quarter Der_Episode_Number = 1 (restricts to first episode of care) Source_of_Admission = is not equal to 51,52, 53
(excludes transfers) CDS_Type = 1 (restricts data to general episodes) Patient_Classification = 1 (restricts data to ordinary admissions – excludes day cases, regular/day-night attenders and mothers and babies using only delivery
facilities) Final_Derived_CCG = CCGs in England only (excludes patients who are registered with GPs outside England – reference file provided at:
http://content.digital.nhs.uk/ccgois

16
Denominator:
CCG level count of patients aged 65 and over registered with the constituent GP practices extracted from the NHAIS (Exeter) Systems. Counts of registered patients are extracted each quarter
and GP practices are mapped to CCGs using the mapping on this date. When calculating indicators, the count of registered patients and the GP to CCG mapping are taken from the relevant quarter.
Data processing N/A
Construction
Numerator Emergency admissions for falls injuries classified by
primary diagnosis codes (ICD10 code S00-T98) and external cause (ICD10 code W00-W19) and emergency admission codes (21, 22, 23, 24, 25, 2A, 2B, 2D, 28). Age at admission is 65 and over.
Counted by first finished consultant episode in the financial year in which the episode ended, CCG of responsibility from the SUS data.
Denominator CCG level count of patients registered with the constituent GP Practices using the quinary age bands 65-69, 70-74, 75-79, 80-84, 85-89 and 90+ (by sex).
Computation Numerator/Denominator * 100,000 - directly age-sex standardised as per methodology outlined below.
Risk adjustment or standardisation type and methodology
Directly age-sex standardised rate, European Standard Population 2013 per 100,000.
The directly age-sex standardised rate is the rate of events
that would occur in a standard population if that population were to experience the age-sex specific rates of the subject population. The standard population used for the direct method is the European Standard Population. The
age groups used are: 65-69, 70-74, 75-79, 80-84, 85-89, 90+.
The methodology is based on that provided in APHO Technical Briefing 3: Commonly Used Public Health Statistics and their Confidence Intervals. http://www.apho.org.uk/resource/item.aspx?RID=48457
Output
Frequency of publication Quarterly (rolling 12 months)

17
105a. Utilisation of the NHS e-referral service to enable choice at first routine
elective referral
Theme, Area Better health, Personalisation and choice
Definition The percentage of referrals for a first outpatient appointment
that are made using the NHS e-Referral Service (e-RS).
Publication status In publication
Purpose (Rationale) The purpose of this indicator is to measure the extent to which patients are being offered choice of provider at first referral and provide an evidence base for improvement.
Currently there is no direct or systematic measure of the extent to which patients are being offered choice of provider, so this metric has been developed as a short-medium term proxy measure. By making referrals through e-RS, referrers
should maximise their ability to offer meaningful choice to patients by having all relevant and up to date information available to inform the discussion. This metric therefore is incentivising the uptake of a key tool to support the
operation of choice. A monthly metric based on e-RS data would sharpen and repeat the signal on the legal requirement to offer elective
choice and on making all referrals through e-RS, and help to address low rates of people recalling being offered choice by their GPs as demonstrated in the annual choice survey.
This indicator is currently the best data set available for a proxy measure of choice on a monthly basis, but will be retired when a direct, quantitative measure is developed and tested through 2016/17.
Evidence and policy base
Inclusion of a metric relevant to choice in the CCG Improvement and Assessment Framework will help to bring a local CCG focus on the legal rights to choice of provider
and team for a first elective referral in physical and mental health services, which are at the heart of NHS choice policy. These choice rights are central to the 5 Year Forward View commitment to make good on the NHS' longstanding promise to give patients choice over where
and how they receive care. Furthermore, the 2016/17
NHS Mandate tasks NHSE with ensuring that people are empowered to shape and manage their own health care and make meaningful choices.
One aim of the NHS Planning Guidance 2016/17 – 2020/21
is to significantly improve patient choice by 2020. Although a proxy measure for choice, this indicator will be a further prompt for commissioners to establish baseline data,
measure improvement and take appropriate actions where

18
required.
This indicator will also support the wider drive for increased
utilisation of e-RS and improvement in timely access to high quality elective services, where e-RS as a key enabler of choice may help to improve waiting time performance by smoothing demand.
Data
Data source % utilisation reports published by NHS Digital: http://content.digital.nhs.uk/referrals/reports/weeklyutilisation (sub-section of the weekly % utilisation file) calculated using
monthly e-RS referral data as the numerator and monthly actual activity returns (MAR) as the denominator. NHS Digital produce these reports using data extracted from
e-RS for the numerator, and the published MAR data for the denominator. Referrals made by dental practices are excluded from the e-
RS numerator, so the NHS Digital abate the MAR denominator to adjust for referrals from dental practices, based on estimates of the percentage referrals that are from dental practices, in each CCG, calculated from hospital
episode statistics (HES).
Data fields % utilisation data is calculated using data from the fields:
- Numerator from e-RS daily booking reports: Ref_Org_NACS, Specialty, Appt_Type, Previously_Booked, New_Booking
- Denominator from monthly hospital activity report (MAR) (commissioner based): Org code, GP Referrals Made (All specialties). Adjusted (based on percentages derived from HES) to remove referrals from dental practices.
Data filters Numerator from e-RS daily booking reports: - Appt_Type and Specialty: Include all those with Appt_Type
‘First Outpatient’ or Specialty ‘2WW’ - Previously_Booked: Exclude if 1
- New_Booking: Include if 1
Data processing The referring organisation is assigned to a CCG based on a look up of the ‘Ref_Org_NACS’ against the latest ODS GP practice information. Dental practices (V*) and military
practices (A9*) are not assigned to a CCG on e-RS. CCG % utilisation scores therefore exclude referrals made by dental practices and military practices.
e-RS referral data are adjusted as described above and
19
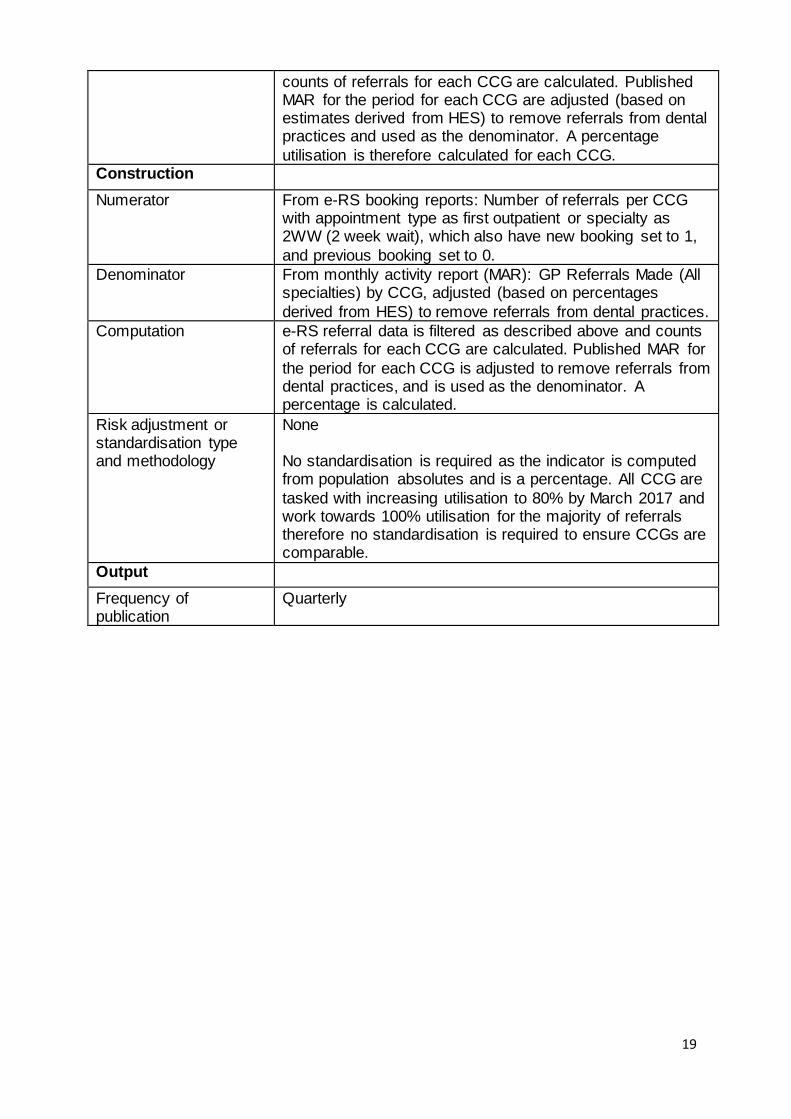
counts of referrals for each CCG are calculated. Published MAR for the period for each CCG are adjusted (based on estimates derived from HES) to remove referrals from dental practices and used as the denominator. A percentage
utilisation is therefore calculated for each CCG. Construction
Numerator From e-RS booking reports: Number of referrals per CCG with appointment type as first outpatient or specialty as 2WW (2 week wait), which also have new booking set to 1,
and previous booking set to 0.
Denominator From monthly activity report (MAR): GP Referrals Made (All specialties) by CCG, adjusted (based on percentages
derived from HES) to remove referrals from dental practices.
Computation e-RS referral data is filtered as described above and counts of referrals for each CCG are calculated. Published MAR for
the period for each CCG is adjusted to remove referrals from dental practices, and is used as the denominator. A percentage is calculated.
Risk adjustment or standardisation type and methodology
None No standardisation is required as the indicator is computed from population absolutes and is a percentage. All CCG are
tasked with increasing utilisation to 80% by March 2017 and work towards 100% utilisation for the majority of referrals therefore no standardisation is required to ensure CCGs are comparable.
Output
Frequency of publication
Quarterly

20
105b. Personal health budgets
Theme, Area Better health, Personalisation and choice
Definition Number of personal health budgets in place per 100,000 CCG population (based on the population the CCG is
responsible for)
Publication status In publication
Purpose (Rationale) To demonstrate the increasing number of patients with a personal health budget, as this is a key objective of the 5YFV and this directly measures this ambition. Further, the
published planning guidance for 2016-17 to 2020-21 through 2016-17 Mandate specifically makes commitments around increasing the number of personal health budgets: https://www.england.nhs.uk/wp-
content/uploads/2015/12/planning-guid-16-17-20-21.pdf
Evidence and policy base The 2016-17 Mandate and 2016-17 to 2020-21 Planning Guidance specifically commit to increasing the number of
personal health budgets. This indicator directly tracks the commitment.
During an informal data collection in September 2015 (via the PHB delivery teams markers of progress), CCGs
reported approx. 4,700 PHBs in place, This was an increase of approx. 60% on 2014/15 numbers however CCGs need to increase their implementation rate in order to meet the mandate commitment of between 50,000-100,000 PHBs in place by 2020.
NHS England has support programme in place to help
CCGs implement PHBs and need to quantify the increase in numbers available via a robust count involving all CCGs.
Data
Data source The data is not being collected yet. NHS Digital will collect the data directly from CCGs, starting in early 2017/18. The
mechanism for collection and reporting need to be agreed with NHS Digital. The policy lead received agreement from the Data
Coordination Group (DCG) in December 2015 (reference number DCG15033) that discussions can start with NHS Digital. An application to the Burden Advice and Assessment Service (BAAS) has been made.
In addition, some initial work has already taken place to identify the data to be collected (see descriptions below).
Data fields Data collection to be set up to reflect the indicator construction – see below for required fields.

21
At present, until the new data collection is up and running,
the construction of the indicator is slightly different as it reflects the format of the existing, voluntary data collection and refers not to in-quarter data but quarterly updated data for the financial year to date.
Data filters None.
Data processing To be determined with NHS Digital.
Construction
Numerator Total number of personal health budgets in place at some
point in the quarter. This is the number of PHBs in place at beginning of quarter plus the number of new PHBs beginning in the quarter.
Definition: A personal health budget is an amount of money to support a person's identified health and wellbeing needs, planned and agreed between the person and their local
NHS team or by a partner organisation on behalf of the NHS (e.g. local authority). This can be administered in 3 ways
· A notional budget · A third party payment · A direct payment
The numerator would include all personal budgets, regardless of whether they are accessed by a notional budget, third part payment or a direct payment.
It would include those who access only part of their package of care via a personal health budget. If a person has combined PHB types (e.g. part of their NHS
Continuing Healthcare package is covered by a notional budget and another element is covered by a direct payment) then these would be counted once.
Denominator Responsible CCG population per 100,000
Computation (Number of PHB in place at beginning of quarter +
Number of new PHB beginning in the quarter)/PHB CCG population * 100,000
Risk adjustment or standardisation type and methodology
None
Output
Frequency of publication Quarterly

22
105c. Percentage of deaths which take place in hospital
Theme, Area Better health, Personalisation and choice
Definition Of people who die, the proportion who die in hospital.
Publication status In publication
Purpose (Rationale) To encourage questioning of whether the reported level is in line with people’s needs and choices, and encourage more in-depth understanding of the related factors which
might explain local variations
Evidence and policy base Supporting patient choice and preferred location for care and for death was part of the government’s 2008 End of
Life Care Strategy. Survey data suggest that more people would, given the choice and conditions being right, prefer to die at home and fewer wish to die in hospital than is currently the case. Latest ONS data show that 47% of
people died in hospital, although the proportion of people dying at home or in care homes continues to increase. NHS Shared Planning Guidance 2016/17 – 2020/21
(https://www.england.nhs.uk/wp-content/uploads/2015/12/planning-guid-16-17-20-21.pdf) includes a focus on end of life care when considering Sustainability and Transformation Plans. The importance of
end of life care is further highlighted by its incorporation under 2.2 (Patient Experience) in the Mandate to NHS England (https://www.gov.uk/government/publications/nhs-mandate-2016-to-2017).
Data
Data source ONS is the source of the data. The National end of life care intelligence network publish and compare the data: http://www.endoflifecare-intelligence.org.uk/data_sources/place_of_death.
Data for 2010-2014 are based on final mortality data. Data for 2015-16 and 2016-17 are provisional.
Data fields Area Type code and name: England, Strategic Clinical
Network, Public Health England Centre, Local Area Teams, Clinical Commissioning Group, Local Authority Place of death: All places, Home, Hospital, Care Home,
Hospice, Other Communal Establishment (OCE) and elsewhere Rolling annual averages (provided quarterly) for the number and percentage of deaths
Figures are for deaths registered in financial year quarters: Q1 - April to June, Q2 - July to September, Q3 - October to

23
December, Q4 - January to March
Data filters Persons resident in England.
Figures exclude deaths of non-residents.
Data processing N/A
Construction
Numerator All deaths occurring in hospital
Denominator All deaths in all places
Computation All deaths registered with place of death as hospital/All deaths all places *100 Data for 2010-2014 are based on final mortality data. Data
for 2015-16 and 2016-17 are provisional. Figures are based on deaths registered, rather than deaths occurring in each quarter. Further information on registration delays for a range of causes can be found on the ONS website:
www.ons.gov.uk/ons/guide-method/user-guidance/health-and-life-events/impact-of-registration-delays-on-mortality-statistics/index.html
Risk adjustment or standardisation type and methodology
None
Output
Frequency of publication Quarterly

24
Evidence and policy base
Supporting patients to effectively manage their own health, while reducing demand on NHS services (including by heavy users such as those with Long Term Conditions) is an ambition of the 5YFV. This will help measure the level of support patients with
LTCs believe they get to manage their condition. NHS Shared Planning Guidance 2016/17 – 2020/21 (https://www.england.nhs.uk/wp-
content/uploads/2015/12/planning-guid-16-17-20-21.pdf) includes a focus on self-care when considering Sustainability and Transformation Plans.
Data
Data source This is indicator 2.2 from the CCG Outcomes Indicator Set published by NHS Digital - Indicator Reference: I00325/I00782. The specification of this indicator can be accessed at
https://indicators.hscic.gov.uk/webview/ GP Patient Survey from Ipsos MORI (http://www.gp-patient.co.uk/).
Data fields Practice_Code Wt_new Answers to Q32
Answers to Q30 Answers to Q31 Answers to Q51 (gender) Answers to Q52 (Age)
CCG_Code (GP Patient Survey Y7 surveys onwards) Data filters Only responses with a valid age and sex are included in the
calculation: Q51 is not NULL and Q52 is not NULL Data are filtered based on questions 30 and 31 of the GP Patient Survey, to isolate those respondents who report having one or
more long-term condition. Respondents are identified as having a long-term condition if they answer ‘Yes’ to question 30 of the GP Patient Survey.
105d. People with a long-term condition feeling supported to manage their
condition(s)
Theme, Area Better health, Personalisation and choice
Definition The proportion of people reporting they have a Long Term
Condition (LTC) in the GP Patient Survey who report they receive enough support from local services or organisations to help manage their LTC.
Publication status In publication
Purpose (Rationale) To encourage supporting patients to manage their own condition
and reduce demand on the NHS
25
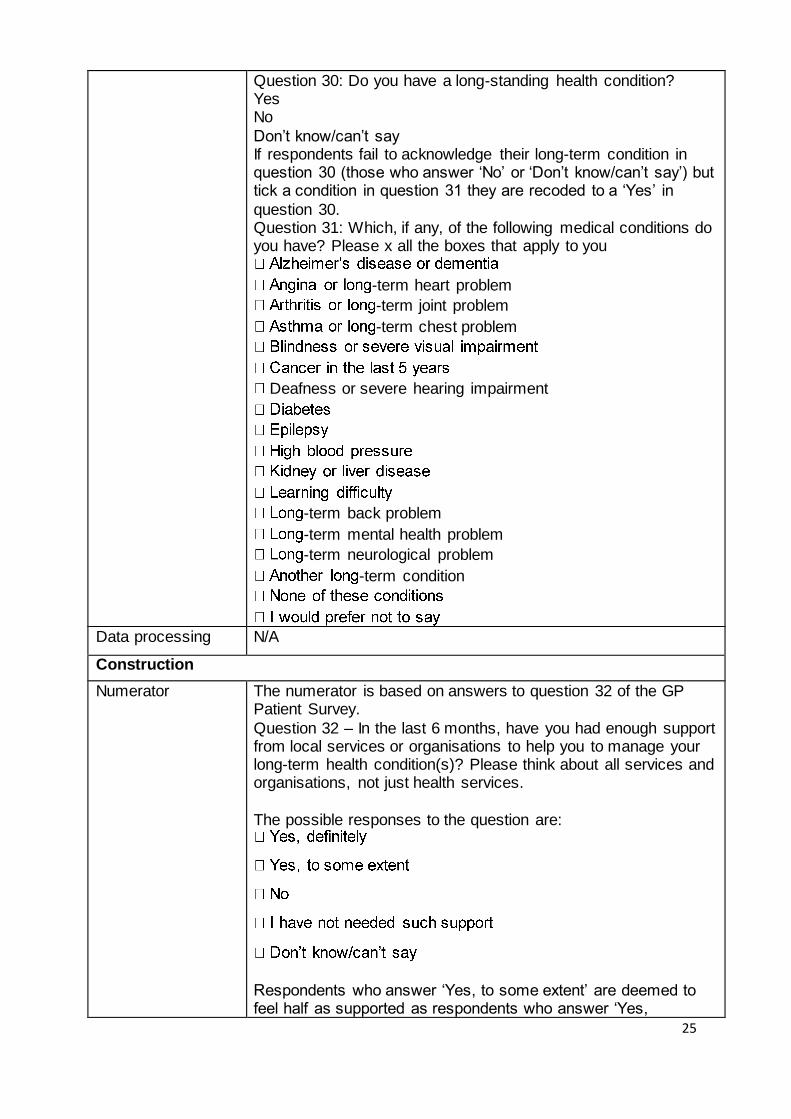
Question 30: Do you have a long-standing health condition? Yes No
Don’t know/can’t say If respondents fail to acknowledge their long-term condition in question 30 (those who answer ‘No’ or ‘Don’t know/can’t say’) but tick a condition in question 31 they are recoded to a ‘Yes’ in
question 30. Question 31: Which, if any, of the following medical conditions do you have? Please x all the boxes that apply to you
-term heart problem
-term joint problem
-term chest problem
Deafness or severe hearing impairment
-term back problem
-term mental health problem
-term neurological problem
-term condition
Data processing N/A
Construction
Numerator The numerator is based on answers to question 32 of the GP Patient Survey.
Question 32 – In the last 6 months, have you had enough support from local services or organisations to help you to manage your long-term health condition(s)? Please think about all services and organisations, not just health services.
The possible responses to the question are:
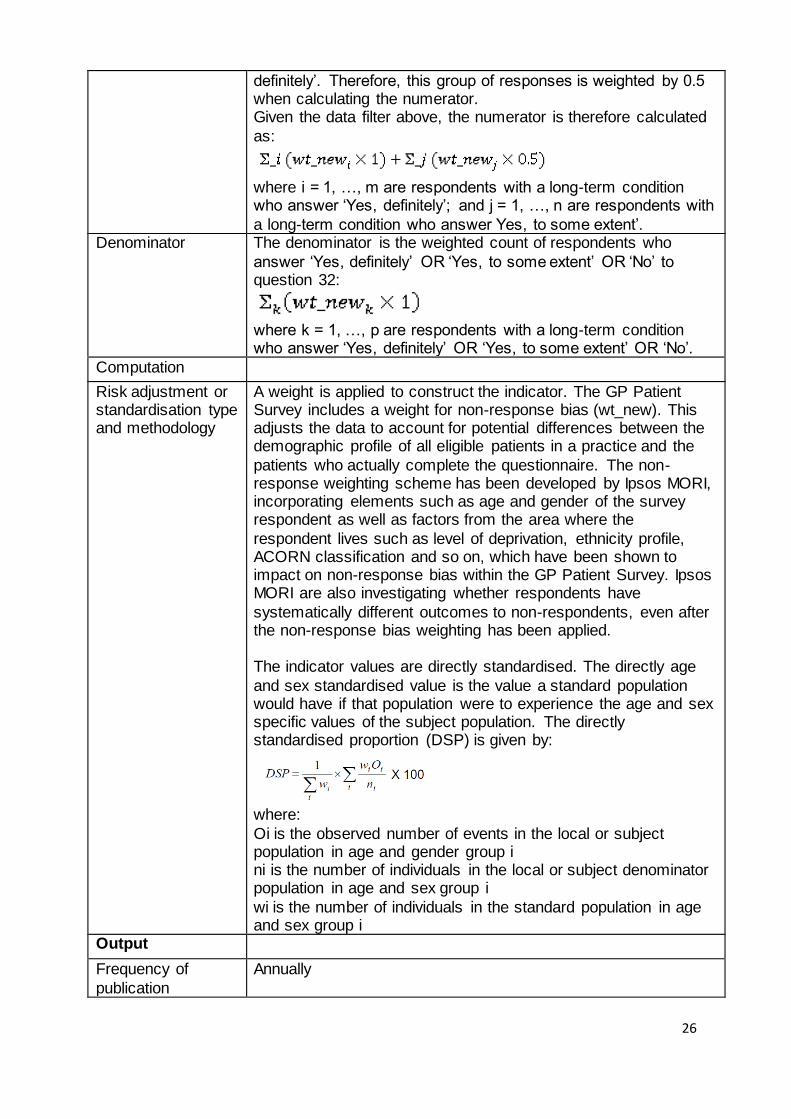
Respondents who answer ‘Yes, to some extent’ are deemed to feel half as supported as respondents who answer ‘Yes,
26
definitely’. Therefore, this group of responses is weighted by 0.5 when calculating the numerator. Given the data filter above, the numerator is therefore calculated
as:
where i = 1, …, m are respondents with a long-term condition who answer ‘Yes, definitely’; and j = 1, …, n are respondents with
a long-term condition who answer Yes, to some extent’. Denominator The denominator is the weighted count of respondents who
answer ‘Yes, definitely’ OR ‘Yes, to some extent’ OR ‘No’ to question 32:
where k = 1, …, p are respondents with a long-term condition who answer ‘Yes, definitely’ OR ‘Yes, to some extent’ OR ‘No’.
Computation
Risk adjustment or standardisation type and methodology
A weight is applied to construct the indicator. The GP Patient Survey includes a weight for non-response bias (wt_new). This adjusts the data to account for potential differences between the demographic profile of all eligible patients in a practice and the
patients who actually complete the questionnaire. The non-response weighting scheme has been developed by Ipsos MORI, incorporating elements such as age and gender of the survey respondent as well as factors from the area where the
respondent lives such as level of deprivation, ethnicity profile, ACORN classification and so on, which have been shown to impact on non-response bias within the GP Patient Survey. Ipsos MORI are also investigating whether respondents have
systematically different outcomes to non-respondents, even after the non-response bias weighting has been applied. The indicator values are directly standardised. The directly age
and sex standardised value is the value a standard population would have if that population were to experience the age and sex specific values of the subject population. The directly standardised proportion (DSP) is given by:
where:
Oi is the observed number of events in the local or subject population in age and gender group i ni is the number of individuals in the local or subject denominator population in age and sex group i
wi is the number of individuals in the standard population in age and sex group i
Output
Frequency of
publication
Annually

27
106a. Inequality in unplanned hospitalisation for chronic ambulatory care
sensitive conditions
Theme, Area Better health, Health inequalities
Definition Absolute gradient of the relationship at Lower Super Output Area (LSOA) level between unplanned hospitalisation for chronic
ambulatory care sensitive conditions per 100,000 population and deprivation, measured by the Index of Multiple Deprivation (2015). The indicator measures the reduction over time of within-CCG variation in unplanned hospitalisation. Variation is measured
by the gap between more and less deprived Lower Super Output Area (LSOA) rates of unplanned hospitalisation for chronic ambulatory care sensitive conditions per 100,000 population. The measure uses the range of deprivation in England as a whole, which allows direct comparisons to be made between all CCGs.
Measurement unit: Absolute Gradient of Inequality (AGI) =
difference in age and sex standardised rate of unplanned hospitalisation for chronic ambulatory care sensitive conditions
per 100,000 population, between the most and least deprived LSOAs in England.
The scope of the indicator is unplanned hospitalisation for chronic ambulatory care sensitive conditions at LSOA level in England.
The ICD-10 diagnoses that are included in unplanned
hospitalisation for chronic ambulatory care sensitive conditions are given in the specification for indicator 2.6 of the CCG Outcomes Indicator Set: https://indicators.hscic.gov.uk/webview/
The figures are produced using Secondary Uses Service (SUS)
data. The admissions rate for each LSOA-CCG is constructed using the CCG of registration and LSOA of residence.
The rate is indirectly age and sex standardised using the England rate in each year.
The indicator is published on a quarterly basis for the 12 months
to the end of the quarter, based on discharges within those 12 months. The population at the mid-point of the 12 months is used as the denominator.
Publication status In publication
Purpose (Rationale)
Inequalities persist and these should be reduced for the benefit of patients and for CCGs to meet legal duties. The indicator will encourage such action.
There are large inequalities in the rate of unplanned hospitalisation for chronic ambulatory care sensitive conditions when comparing the most and least deprived areas nationally. The most deprived decile has about three times as many

28
Data
Data source 1. Secondary Uses Service (SUS) data;
2. GP registered population data derived from the Exeter system by LSOA, age and sex;
3. Indices of Deprivation (ID) 2015 (https://www.gov.uk/government/statistics/english-indices-of-deprivation-2015)
Data fields As per indicator number 128a of this framework, and CCG OIS indicator 2.6 at https://indicators.hscic.gov.uk/webview/
Data filters As per indicator number 128a of this framework
Data processing N/A
Construction
Numerator Difference in the fitted rate of unplanned hospitalisation for chronic
ambulatory care sensitive conditions between the LSOAs with the least and most deprived populations as measured by the Index of Multiple Deprivation (IMD) 2015.
Denominator N/A
Computation The definition of unplanned hospitalisation for chronic ambulatory
care sensitive conditions is the same as that used for the corresponding, assured indicators in the NHS Outcomes Framework (NHS OF, indicator number 2.3.i) and CCG Outcomes Indicator Set (CCG OIS, indicator number 2.6). This is detailed in
the specification for indicator 2.6 at: https://indicators.hscic.gov.uk/webview/. The admissions rate for each LSOA-CCG is constructed using the
CCG of registration and LSOA of residence. The indirectly age-standardised rate of unplanned hospitalisation per 100,000 registered population is calculated for every LSOA of
emergency admissions compared to the least deprived decile at a
national level. (Source: NHS Digital - NHS Outcomes Framework, February 2015: Quarterly publication.)
Evidence and
policy base
There are large inequalities in the rate of unplanned
hospitalisation for chronic ambulatory care sensitive conditions when comparing the most and least deprived areas nationally. Providing information on the level of inequalities within CCGs will shine a spotlight on variations in practice and will provide data to
enable CCGs to explore levels of inequalities in order to address and reduce these. This indicator reflects variations in the quality of management of
long-term conditions in primary, community and outpatient care and resulting avoidable demand on acute hospital services. It will help identify areas of ‘good practice’ and those where improvements should be made for the benefit of patients and the
local health economy. It is seen as being sensitive to in-year change as a direct result of local action.

29
residence. The Absolute Gradient of Inequality (AGI) is calculated for each
CCG by weighted least squares using the indirectly age-standardised rate of unplanned hospitalisation per 100,000 registered population as the dependent variable; the rank of IMD 2015 (on a scale of 0 to 1) as the independent variable, and the
CCG’s population in each LSOA as the weight. The coefficient on the rank of IMD is the slope and is called the AGI. As the IMD is on a scale of 0 to 1, the slope gives the expected
difference in the rate of unplanned hospitalisation in the most deprived compared to the least deprived LSOA in England if they were in that CCG.
Risk adjustment or standardisation
type and methodology
Indirect standardisation.
The measure is standardised for age and sex because these are legitimate drivers in the variation in avoidable emergency admissions. Indirect standardisation must be used as there are many LSOAs that do not have populations in all age-sex groups.
Output
Frequency of publication
Quarterly

30
106b. Inequality in emergency admissions for urgent care sensitive conditions
Theme, Area Better health, Health inequalities
Definition Absolute gradient of the relationship at Lower Super Output Area (LSOA) level between emergency admissions for urgent care sensitive conditions per 100,000 population
and deprivation, measured by the Index of Multiple Deprivation (IMD) 2015. The indicator measures the reduction over time of within-CCG variation in emergency admissions for urgent care sensitive conditions. Variation
is measured by the gap between more and less deprived Lower Super Output Area (LSOA) rates of emergency admissions for urgent care sensitive conditions per 100,000 population. The measure uses the range of
deprivation in England as a whole, which allows direct comparisons to be made between all CCGs.
Measurement unit: Absolute Gradient of Inequality (AGI) = difference in age and sex standardised rate of emergency
admissions for urgent care sensitive conditions per 100,000 population, between the most and least deprived LSOAs in England.
The scope of the indicator is emergency admissions for urgent care sensitive conditions at LSOA level in England.
The rate is indirectly age and sex standardised using the England rate in each year.
The indicator is published on a quarterly basis for the 12 months to the end of the quarter.
Publication status In publication
Purpose (Rationale) Inequalities persist and these should be reduced for the
benefit of patients and for CCGs to meet legal duties. The indicator will encourage such action.
There are large inequalities in the rate of emergency admissions for urgent care sensitive conditions when comparing the most and least deprived areas nationally.
A well performing urgent and emergency care system
should minimise the rate of emergency admission for urgent care sensitive conditions in more as well as less deprived areas.

31
To the least deprived decile at a national level.
A well performing urgent and emergency care system
should minimise the rate of emergency admission for
urgent care sensitive conditions in more as well as less
deprived areas.
Evidence and policy base A well performing urgent and emergency care system
should treat people with the right care in the right place, first time. This should minimise the rate of emergency admission to hospital for urgent care sensitive conditions in more as well as less deprived areas.
There are large inequalities in the rate of emergency admissions for urgent care sensitive conditions when
comparing the most and least deprived areas nationally. Providing information on the level of inequalities within CCGs will shine a spotlight on variations in practice and will provide data to enable CCGs to explore levels of
inequalities in order to address and reduce these. Urgent and Emergency Care networks may monitor how effectively the services within their range of responsibility are managing demands for care for urgent conditions among patients in more deprived areas.
Data
Data source 1. Secondary Uses Service (SUS) data;
2. GP registered population data derived from the Exeter system by LSOA, age and sex;
3. Indices of Deprivation (ID) 2015 (https://www.gov.uk/government/statistics/english-indices-of-deprivation-2015)
Data fields The following data fields within SUS are used to construct the indicator:
1. primary diagnosis
2. cause code
3. finished admission episode status
4. method of admission
5. episode end date
6. age at start of episode
7. sex
8. 2011 Lower Super Output Area
Data filters Finished Admission Episodes
Emergency admissions = admission method starting with

32
'2'
Filter on the conditions listed under Computation below which are used for the numerator
Data processing
Construction
Numerator Difference in the fitted rate of emergency admission
between the LSOAs with the most and least deprived
populations as measured by the IMD 2015.
Denominator N/A
Computation The definition of emergency admissions for urgent care sensitive conditions is that used for the emergency admissions for urgent care sensitive conditions indicator in
the CCG IAF. This consists of cases involving the following primary diagnoses, cause codes and age groups:
COPD J40; J41; J42; J43; J44
Acute mental health crisis F
Non-specific chest pain R072; R073; R074
Falls Patients aged 74 years or over
W0; W1-W19
Non-specific abdominal
pain
R10
Deep vein thrombosis I80; I81; I82
Cellulitis L03
Pyrexial child Patients aged 6 years or
under
R50
Blocked tubes, catheters and feeding tubes
T830
Hypoglycaemia E10; E11; E12; E13; E14; E15; E161; E162
Urinary tract infection N390
Angina I20
Epileptic fit G40; G41 Minor head injuries S00
The Absolute Gradient of Inequality (AGI) is calculated for
each CCG by weighted least squares using the indirectly age-standardised rate of emergency admissions for urgent care sensitive conditions per 100,000 population as the dependent variable; the rank of IMD 2015 (on a scale of 0
to 1) as the independent variable, and the CCG’s population in each LSOA as the weight. The coefficient on

33
the rank of IMD is the slope and is called the AGI.
As the IMD is on a scale of 0 to 1, the slope gives the expected difference in the rate of emergency admissions for urgent care sensitive conditions in the most compared to the least deprived LSOA in England if they were in that CCG.
Risk adjustment or
standardisation type and
methodology
Indirect Standardisation The measure is standardised for age and sex because
these are legitimate drivers in the variation in avoidable emergency admissions. Indirect standardisation must be used as there are many LSOAs that do not have populations in all age-sex groups.
Output
Frequency of publication Quarterly

34
107a. Antimicrobial Resistance: appropriate prescribing of antibiotics in primary
care
Theme, Area Better Health, Antimicrobial Resistance
Definition The number of antibiotics prescribed in primary care divided by the Item based Specific Therapeutic group Age-
Sex related Prescribing Unit STAR-PU
Publication status In publication
Purpose (Rationale) The purpose of this indicator is to encourage an improvement in appropriate antibiotic prescribing in primary care.
Antimicrobial resistant infections impact on patient safety and the quality of patient care. Evidence suggests that antimicrobial resistance (AMR) is driven by over-using antibiotics and prescribing them inappropriately. Reducing
the inappropriate use of antibiotics will delay the development of antimicrobial resistance that leads to patient harm from infections that are harder and more costly to treat. Reducing inappropriate antibiotic use will
also protect patients from healthcare acquired infections such as Clostridium difficile infections.
Evidence and policy base NICE QS61: Infection prevention and control.
NICE advice KTT9: Antibiotic prescribing – especially broad spectrum antibiotics
NICE NG15: Antimicrobial stewardship: systems and processes for effective antimicrobial medicine use NHS England Patient Safety Alert: Addressing antimicrobial
resistance through implementation of an antimicrobial stewardship programme 18 August 2015 NHS/PSA/Re/2015/007 ‘Optimising prescribing practice’ is a key action as part of
the DH UK 5 Year Antimicrobial Resistance Strategy 2013 to 2018. Code of Practice on the prevention and control of infections, under The Health and Social Care Act 2008
In the NHS mandate 2016/17 under section 2.1 ‘Avoidable deaths and seven-day services’, goals and deliverables include: improvement in antimicrobial prescribing and resistance rates.
Data
Data source This information is sourced from the Antibiotic quality premium monitoring dashboard which is published on the NHS England website (https://www.england.nhs.uk/resources/resources-for-
ccgs/ccg-out-tool/ccg-ois/anti-dash/). The 2016/17 quality premium antimicrobial resistance (AMR) Improving antibiotic prescribing in primary care. The dashboard is
35
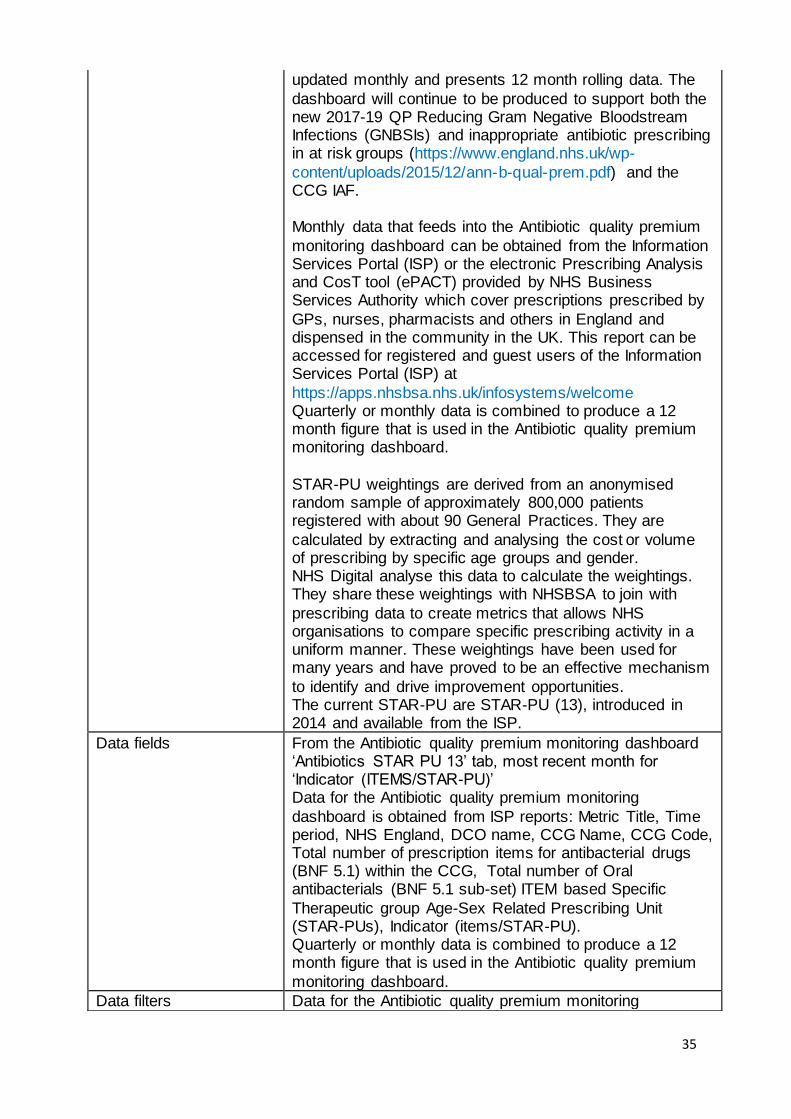
updated monthly and presents 12 month rolling data. The
dashboard will continue to be produced to support both the new 2017-19 QP Reducing Gram Negative Bloodstream Infections (GNBSIs) and inappropriate antibiotic prescribing in at risk groups (https://www.england.nhs.uk/wp-
content/uploads/2015/12/ann-b-qual-prem.pdf) and the CCG IAF. Monthly data that feeds into the Antibiotic quality premium
monitoring dashboard can be obtained from the Information Services Portal (ISP) or the electronic Prescribing Analysis and CosT tool (ePACT) provided by NHS Business Services Authority which cover prescriptions prescribed by
GPs, nurses, pharmacists and others in England and dispensed in the community in the UK. This report can be accessed for registered and guest users of the Information Services Portal (ISP) at
https://apps.nhsbsa.nhs.uk/infosystems/welcome Quarterly or monthly data is combined to produce a 12 month figure that is used in the Antibiotic quality premium monitoring dashboard.
STAR-PU weightings are derived from an anonymised random sample of approximately 800,000 patients registered with about 90 General Practices. They are
calculated by extracting and analysing the cost or volume of prescribing by specific age groups and gender. NHS Digital analyse this data to calculate the weightings. They share these weightings with NHSBSA to join with
prescribing data to create metrics that allows NHS organisations to compare specific prescribing activity in a uniform manner. These weightings have been used for many years and have proved to be an effective mechanism
to identify and drive improvement opportunities. The current STAR-PU are STAR-PU (13), introduced in 2014 and available from the ISP.
Data fields From the Antibiotic quality premium monitoring dashboard ‘Antibiotics STAR PU 13’ tab, most recent month for ‘Indicator (ITEMS/STAR-PU)’ Data for the Antibiotic quality premium monitoring
dashboard is obtained from ISP reports: Metric Title, Time period, NHS England, DCO name, CCG Name, CCG Code, Total number of prescription items for antibacterial drugs (BNF 5.1) within the CCG, Total number of Oral antibacterials (BNF 5.1 sub-set) ITEM based Specific
Therapeutic group Age-Sex Related Prescribing Unit (STAR-PUs), Indicator (items/STAR-PU). Quarterly or monthly data is combined to produce a 12 month figure that is used in the Antibiotic quality premium
monitoring dashboard.
Data filters Data for the Antibiotic quality premium monitoring

36
dashboard is obtained from ISP reports: Data View set to
CCG prescribing and time period. For data at CCG level, prescriptions written by a prescriber located in a particular CCG but dispensed outside that CCG will be included in the CCG in which the prescriber is
based. Prescriptions written in England but dispensed outside England are included. Prescriptions dispensed in hospitals, dental prescribing and private prescriptions are not included in the data. The data is to include prescribing
by Out of Hours and Urgent Care services where relevant prescribing data is captured within ISP. Quarterly or monthly data is combined to produce a 12 month figure that is used in the Antibiotic quality premium
monitoring dashboard
Data processing
Construction
Numerator Total number of prescription items for antibacterial drugs
(BNF 5.1) within the CCG in the previous 12 months.
Denominator Total number of Oral antibacterials (BNF 5.1 sub-set) ITEM based Specific Therapeutic group Age-Sex Related
Prescribing Units (STAR-PUs) for the previous 12 months.
Computation Numerator divided by denominator.
The computed figure is extracted from the Antibiotic quality premium monitoring dashboard For data at CCG level, prescriptions written by a prescriber located in a particular CCG but dispensed outside that CCG will be included in
the CCG in which the prescriber is based. Prescriptions written in England but dispensed outside England are included. Prescriptions dispensed in hospitals, dental prescribing and private prescriptions are not included in the
data. The data is to include prescribing by Out of Hours and Urgent Care services where relevant prescribing data is captured within ISP.
Risk adjustment or standardisation type and methodology
Weighting Methodology There are differences in the age and sex of patients for whom drugs in specific therapeutic groups are usually prescribed. STAR-PUs (Specific Therapeutic Group Age-
sex weightings Related Prescribing Units) allow more accurate and meaningful comparisons within a specific therapeutic group by taking into account the types of people who will be receiving that treatment. This weighting
is designed to weight individual practice or organisation populations for age and sex to allow for better comparison of prescribing patterns. The total number of Oral antibacterials (BNF 5.1 sub-set) ITEM based STAR-PUs
are used as the denominator of this indicator. STAR-PU weightings have been updated to reflect current prescribing practice, based on prescribing patterns in primary care in England in 2013. These were made
available and introduced into national prescribing data sets

37
in February 2014. The numerator represents actual population figures and do not need to be standardised. When used in conjunction
with STAR-PUs data is comparable across CCGs.
Output
Frequency of publication Quarterly

38
107b. Antimicrobial Resistance: appropriate prescribing of broad spectrum
antibiotics in primary care
Theme, Area Better health, Antimicrobial Resistance
Definition The number of co-amoxiclav, cephalosporins and
quinolones as a percentage of the total number of selected antibiotics prescribed in primary care.
Publication status In publication
Purpose (Rationale) The purpose of this indicator is to encourage an improvement in appropriate antibiotic prescribing in
primary care, in particular broad spectrum antibiotics. Antimicrobial resistant infections impact on patient safety and the quality of patient care. Evidence suggests that
antimicrobial resistance (AMR) is driven by over-using antibiotics and prescribing them inappropriately. Reducing the inappropriate use of antibiotics will delay the development of antimicrobial resistance that leads to
patient harm from infections that are harder and more costly to treat. Reducing inappropriate antibiotic use will also protect patients from healthcare acquired infections such as Clostridium difficile infections.
Broad spectrum antibiotics, such as co-amoxiclav, cephalosporins and quinolones, should be prescribed in line with prescribing guidelines and local microbiology
advice. Reducing inappropriate antibiotic use will protect patients from healthcare acquired infections such as Clostridium difficile infections.
Evidence and policy base NICE QS61: Infection prevention and control. NICE advice KTT9: Antibiotic prescribing – especially broad spectrum antibiotics
NICE NG15: Antimicrobial stewardship: systems and processes for effective antimicrobial medicine use
NHS England Patient Safety Alert: Addressing antimicrobial resistance through implementation of an antimicrobial stewardship programme 18 August 2015 NHS/PSA/Re/2015/007
‘Optimising prescribing practice’ is a key action as part of the DH UK 5 Year Antimicrobial Resistance Strategy 2013 to 2018.
Code of Practice on the prevention and control of infections, under The Health and Social Care Act 2008
39
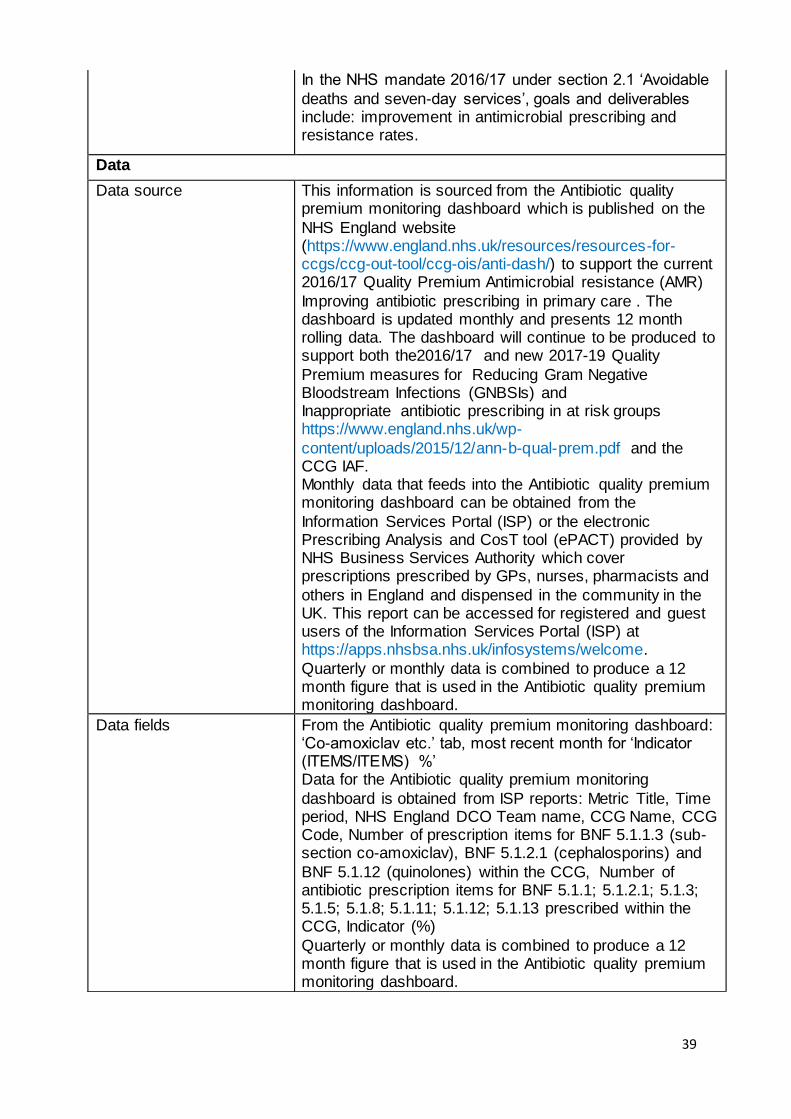
In the NHS mandate 2016/17 under section 2.1 ‘Avoidable
deaths and seven-day services’, goals and deliverables include: improvement in antimicrobial prescribing and resistance rates.
Data
Data source This information is sourced from the Antibiotic quality premium monitoring dashboard which is published on the
NHS England website (https://www.england.nhs.uk/resources/resources-for-ccgs/ccg-out-tool/ccg-ois/anti-dash/) to support the current 2016/17 Quality Premium Antimicrobial resistance (AMR)
Improving antibiotic prescribing in primary care . The dashboard is updated monthly and presents 12 month rolling data. The dashboard will continue to be produced to support both the2016/17 and new 2017-19 Quality
Premium measures for Reducing Gram Negative Bloodstream Infections (GNBSIs) and Inappropriate antibiotic prescribing in at risk groups https://www.england.nhs.uk/wp-
content/uploads/2015/12/ann-b-qual-prem.pdf and the CCG IAF. Monthly data that feeds into the Antibiotic quality premium monitoring dashboard can be obtained from the
Information Services Portal (ISP) or the electronic Prescribing Analysis and CosT tool (ePACT) provided by NHS Business Services Authority which cover prescriptions prescribed by GPs, nurses, pharmacists and
others in England and dispensed in the community in the UK. This report can be accessed for registered and guest users of the Information Services Portal (ISP) at https://apps.nhsbsa.nhs.uk/infosystems/welcome.
Quarterly or monthly data is combined to produce a 12 month figure that is used in the Antibiotic quality premium monitoring dashboard.
Data fields From the Antibiotic quality premium monitoring dashboard: ‘Co-amoxiclav etc.’ tab, most recent month for ‘Indicator (ITEMS/ITEMS) %’ Data for the Antibiotic quality premium monitoring
dashboard is obtained from ISP reports: Metric Title, Time period, NHS England DCO Team name, CCG Name, CCG Code, Number of prescription items for BNF 5.1.1.3 (sub-section co-amoxiclav), BNF 5.1.2.1 (cephalosporins) and
BNF 5.1.12 (quinolones) within the CCG, Number of antibiotic prescription items for BNF 5.1.1; 5.1.2.1; 5.1.3; 5.1.5; 5.1.8; 5.1.11; 5.1.12; 5.1.13 prescribed within the CCG, Indicator (%)
Quarterly or monthly data is combined to produce a 12 month figure that is used in the Antibiotic quality premium monitoring dashboard.
40
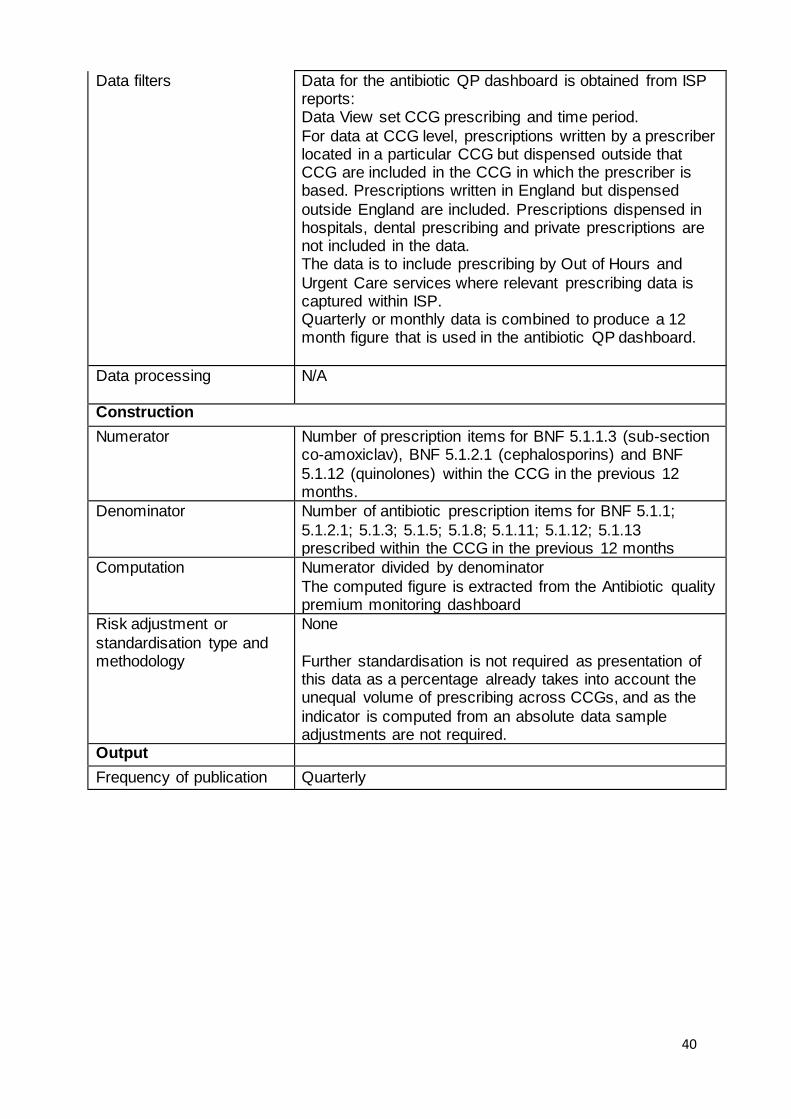
Data filters Data for the antibiotic QP dashboard is obtained from ISP reports: Data View set CCG prescribing and time period.
For data at CCG level, prescriptions written by a prescriber located in a particular CCG but dispensed outside that CCG are included in the CCG in which the prescriber is based. Prescriptions written in England but dispensed
outside England are included. Prescriptions dispensed in hospitals, dental prescribing and private prescriptions are not included in the data. The data is to include prescribing by Out of Hours and
Urgent Care services where relevant prescribing data is captured within ISP. Quarterly or monthly data is combined to produce a 12 month figure that is used in the antibiotic QP dashboard.
Data processing N/A
Construction
Numerator Number of prescription items for BNF 5.1.1.3 (sub-section co-amoxiclav), BNF 5.1.2.1 (cephalosporins) and BNF
5.1.12 (quinolones) within the CCG in the previous 12 months.
Denominator Number of antibiotic prescription items for BNF 5.1.1;
5.1.2.1; 5.1.3; 5.1.5; 5.1.8; 5.1.11; 5.1.12; 5.1.13 prescribed within the CCG in the previous 12 months
Computation Numerator divided by denominator
The computed figure is extracted from the Antibiotic quality premium monitoring dashboard
Risk adjustment or
standardisation type and methodology
None
Further standardisation is not required as presentation of this data as a percentage already takes into account the unequal volume of prescribing across CCGs, and as the
indicator is computed from an absolute data sample adjustments are not required.
Output
Frequency of publication Quarterly
41
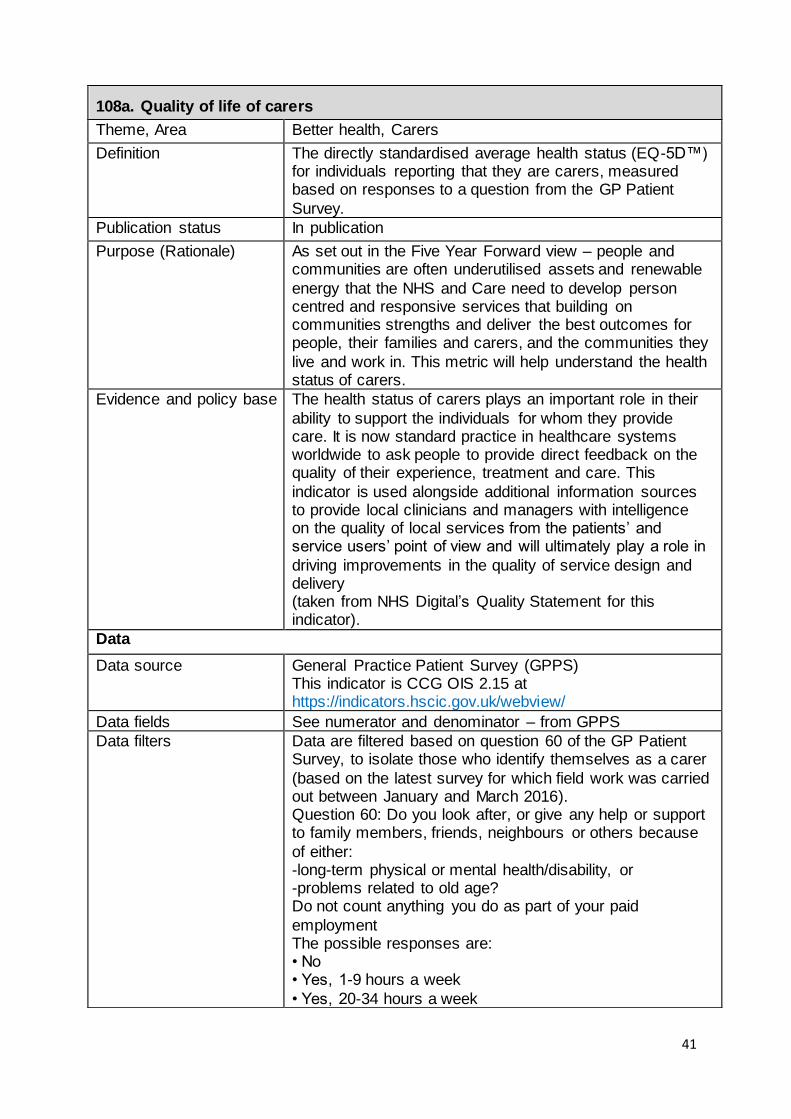
108a. Quality of life of carers
Theme, Area Better health, Carers
Definition The directly standardised average health status (EQ-5D™) for individuals reporting that they are carers, measured based on responses to a question from the GP Patient
Survey.
Publication status In publication
Purpose (Rationale) As set out in the Five Year Forward view – people and communities are often underutilised assets and renewable
energy that the NHS and Care need to develop person centred and responsive services that building on communities strengths and deliver the best outcomes for people, their families and carers, and the communities they
live and work in. This metric will help understand the health status of carers.
Evidence and policy base The health status of carers plays an important role in their
ability to support the individuals for whom they provide care. It is now standard practice in healthcare systems worldwide to ask people to provide direct feedback on the quality of their experience, treatment and care. This
indicator is used alongside additional information sources to provide local clinicians and managers with intelligence on the quality of local services from the patients’ and service users’ point of view and will ultimately play a role in
driving improvements in the quality of service design and delivery (taken from NHS Digital’s Quality Statement for this indicator).
Data
Data source General Practice Patient Survey (GPPS) This indicator is CCG OIS 2.15 at https://indicators.hscic.gov.uk/webview/
Data fields See numerator and denominator – from GPPS
Data filters Data are filtered based on question 60 of the GP Patient Survey, to isolate those who identify themselves as a carer
(based on the latest survey for which field work was carried out between January and March 2016). Question 60: Do you look after, or give any help or support to family members, friends, neighbours or others because
of either: -long-term physical or mental health/disability, or -problems related to old age? Do not count anything you do as part of your paid
employment The possible responses are: • No • Yes, 1-9 hours a week
• Yes, 20-34 hours a week

42
• Yes, 35-49 hours a week
• Yes, 50+ hours a week People who answer ‘Yes …’ are assumed a carer, regardless of how many hours of care they provide. Those
who answer otherwise are not considered in the calculation. All invalid responses (where there is no value for gender or age or any other of the breakdown variables) are excluded
from the calculation. Gender and age of a respondent are derived from questions 51 and 52 of the survey. Further only people resident in an English region are included in the indicator.
Data processing N/A Construction
Numerator The sum of the weighted EQ-5D™ values for all responses from people identified as being carers with a valid age and
sex. Health-related quality of life for people who identify themselves as carers is measured using the EQ-5D™ instrument, included as question 34 of the GP Patient
Survey. Question 34: By placing an (×) in one box in each group below, please indicate which statements best describe your own health state today.
Denominator The weighted sum of responses from people who identify themselves as carers. Σ𝑘(𝑤𝑡_𝑛𝑒𝑤𝑘) where k = 1, …, p are respondents who identify themselves as carers in question 60 of the GP Patient Survey.
Computation Weighted average health status score for individuals who
are reporting that they are carers
Risk adjustment or standardisation type and
methodology
Weighting A weight is applied to construct the indicator. The GP
Patient Survey includes a weight for non-response bias (wt_new). This adjusts the data to account for potential differences between the demographic profile of all eligible patients in a practice and the patients who actually
complete the questionnaire. The non-response weighting scheme has been developed by Ipsos MORI, incorporating elements such as age and gender of the survey respondent as well as factors from the area where the respondent lives
such as level of deprivation, ethnicity profile, ACORN classification and so on, which have been shown to impact on non-response bias within the GP Patient Survey. Ipsos MORI are also investigating whether respondents have
systematically different outcomes to non-respondents, even after the non-response bias weighting has been applied. Standardisation
The indicator values are directly standardised. The directly age- and gender-standardised mean EQ-5D™ score is the

43
score a standard population would have if that population
were to experience the age- and gender specific scores of the subject population. The directly standardised score (DSS) is given by:
where:
Oi is the observed number of events in the local or subject population in age and gender group i (sum of weighted EQ-5D™ scores in the respective age and gender group for all respondents who identify themselves as carers).
ni is the number of individuals in the local or subject denominator population in age and gender group i (sum of all weighted responses (wt_new) in the respective age and
gender group for all respondents who identify themselves as carers). wi is the number of individuals in the reference or standard
population in age and gender group i (sum of all weighted responses (wt_new) in the respective age and gender group for all respondents to the GP Patient Survey).
The standard population used for the direct method are all persons who responded to the GP Patient Survey in the respective financial year. The age groups used in the calculation are derived from question 52 of the survey: 18
to 24, 25 to 34, 35 to 44, 45 to 54, 55 to 64, 65 to 74, 75 to 84, 85+.
Output
Frequency of publication Annually

44
BETTER CARE
Indicator
number
Indicator name
121a,b,c Use of high quality providers 122a Cancers diagnosed at early stage 122b People with urgent GP referral having first definitive treatment for cancer
within 62 days of referral 122c One-year survival from all cancers 122d Cancer patient experience 123a Improving Access to Psychological Therapies recovery rate
123b People with first episode of psychosis starting treatment with a NICE-recommended package of care treated within 2 weeks of referral
123c Children and young people’s mental health services transformation 123d Crisis care and liaison mental health services transformation
123e Out of area placements for acute mental health inpatient care - transformation
124a Reliance on specialist inpatient care for people with a learning disability and/or autism
124b Proportion of people with a learning disability on the GP register receiving an annual health check
125a Neonatal mortality and stillbirths 125b Women’s experience of maternity services
125c Choices in maternity services 126a Estimated diagnosis rate for people with dementia 126b Dementia care planning and post-diagnostic support 127a Achievement of milestones in the delivery of an integrated urgent care
service 127b Emergency admissions for urgent care sensitive conditions 127c Percentage of patients admitted, transferred or discharged from A&E
within 4 hours
127d Ambulance waits 127e Delayed transfers of care per 100,000 population 127f Population use of hospital beds following emergency admission 128a Management of long term conditions
128b Patient experience of GP services 128c Primary care access 128d Primary care workforce 129a Patients waiting 18 weeks or less from referral to hospital treatment
130a Achievement of clinical standards in the delivery of 7 day services 131a People eligible for standard NHS Continuing Healthcare

45
121a, b, c. Provision of high quality care
Theme, Area Better Care, Care ratings
Definition There are three indicators: 121a Provision of high quality care – Hospitals
121b Provision of high quality care – Primary Medical Services (PMS) 121c Provision of high quality care – Adult Social Care (ASC)
A score from 0 – 100 for three sector-based indicators covering (a) Hospital, (b) Primary Medical Services, (c) Adult Social Care each comprised of aggregated scores which
have been allocated to CQC inspection ratings on five key questions for each service asking “Is it safe?”, “Is it effective?”, “Is it well-led?”, “Is it caring?”, “Is it responsive?”. The ratings for each sector are aligned to services located
within the CCG area. Services are rated as “Inadequate”, “Requiring Improvement”, “Good” or “Outstanding”. Scores are applied to these ratings at the lowest rating level e.g. key question for a core service. The total score received is then divided by the total available
score for each CCG area to form an overall proportional score which would range between 0 and a maximum available score of 100 i.e. if all services/locations/providers, for each sector, within a CCG area received a rating of
outstanding across all five key questions.
Publication status In publication
Purpose (Rationale) This metric provides an overall score indicative of the quality
of care in a CCG area as determined by CQC inspection ratings. The summary score by sector for each area allows CCGs to assess the quality of care in their area against an England average and provides a baseline to monitor
improvements.
Evidence and policy base Providing high quality care for all is a fundamental principle for health and social care services. CQC rate the quality of
care by asking five key questions. In hospitals these questions are asked for each core service. The five key questions – Is it safe? Is it effective? Is it caring? Is it responsive? Is it well-led? These key questions are intended
to provide a rounded assessment of quality. Using the lowest level of ratings provides the broadest possible assessment of progress. Over time this CQC indicator will enable people to look at improvements in the quality of care.
Data
Data source CQC Ratings can be downloaded from this link under the
download our directory section
http://www.cqc.org.uk/content/how-get-and-re-use-cqc-
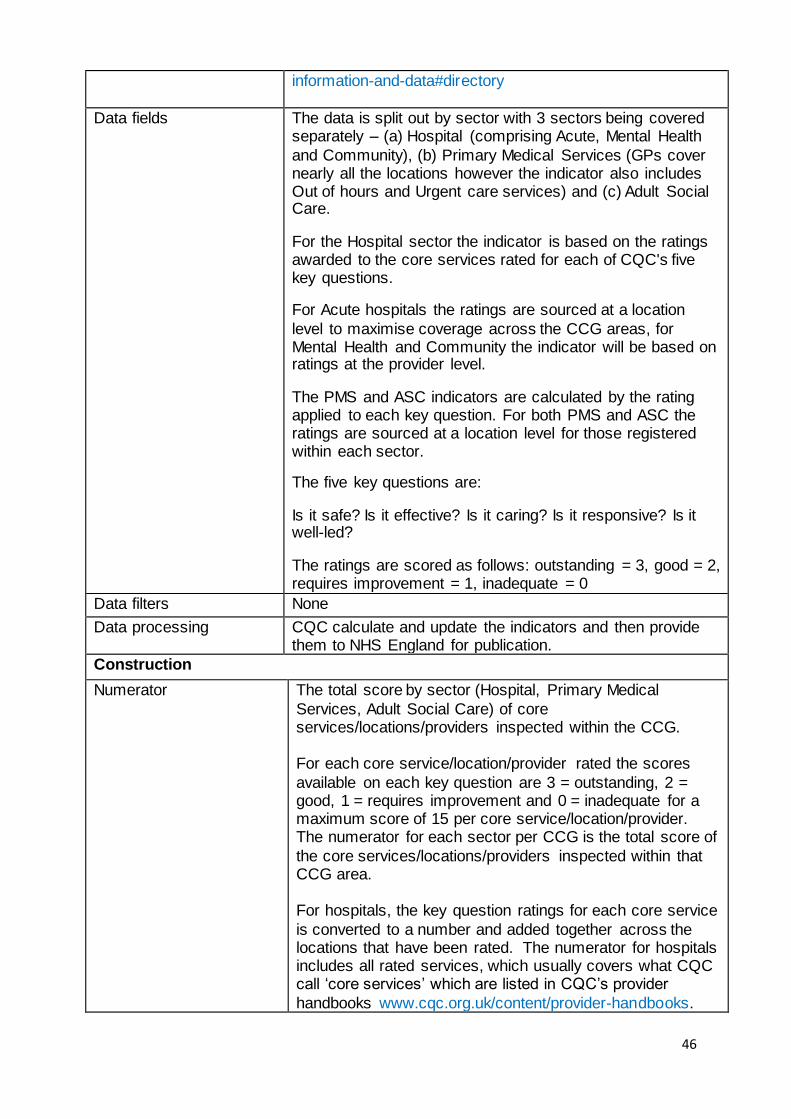
46
information-and-data#directory
Data fields The data is split out by sector with 3 sectors being covered separately – (a) Hospital (comprising Acute, Mental Health
and Community), (b) Primary Medical Services (GPs cover nearly all the locations however the indicator also includes Out of hours and Urgent care services) and (c) Adult Social Care.
For the Hospital sector the indicator is based on the ratings awarded to the core services rated for each of CQC's five key questions.
For Acute hospitals the ratings are sourced at a location
level to maximise coverage across the CCG areas, for Mental Health and Community the indicator will be based on ratings at the provider level.
The PMS and ASC indicators are calculated by the rating applied to each key question. For both PMS and ASC the ratings are sourced at a location level for those registered within each sector.
The five key questions are:
Is it safe? Is it effective? Is it caring? Is it responsive? Is it well-led?
The ratings are scored as follows: outstanding = 3, good = 2, requires improvement = 1, inadequate = 0
Data filters None
Data processing CQC calculate and update the indicators and then provide them to NHS England for publication.
Construction
Numerator The total score by sector (Hospital, Primary Medical
Services, Adult Social Care) of core services/locations/providers inspected within the CCG. For each core service/location/provider rated the scores
available on each key question are 3 = outstanding, 2 = good, 1 = requires improvement and 0 = inadequate for a maximum score of 15 per core service/location/provider. The numerator for each sector per CCG is the total score of
the core services/locations/providers inspected within that CCG area. For hospitals, the key question ratings for each core service
is converted to a number and added together across the locations that have been rated. The numerator for hospitals includes all rated services, which usually covers what CQC call ‘core services’ which are listed in CQC’s provider
handbooks www.cqc.org.uk/content/provider-handbooks.

47
As well as the core services any additional services which
have been rated to reflect particular specialisms are also included. The hospitals metric uses HES data to weight the
numerator for Acute services to reflect where residents from that CCG are visiting to receive their actual care. For example if Trust X provided 80% of attendances for a single CCG, 80% of this CCGs’ score would be comprised of the
ratings from Trust X. The equivalent data is not available for community hospitals and ratings are attributed based on the location of the community provider.
For Adult Social Care and Primary Medical Services the numerator is solely formed from using the key question ratings, i.e. each key question receives a score for GPs and ASC. For the Hospital sector, their core services are rated
by a key question.
Denominator The denominator is the total maximum score available for
that sector. For example, each ASC location and PMS provider is rated by CQC’s 5 key questions and the highest rating of
outstanding is given a score of 3 so each ASC location could have a maximum score of 15. So the CCG’s maximum score would be 15*the number of
registered ASC locations or PMS providers respectively. For Hospitals it would be the weighted maximum score to reflect where the CCG residents have attended.
Computation Divide the numerator by the denominator and multiply by 100. This is done individually for each sector indicator to
form a proportional score for each CCG. The three sector indicators are not combined.
Risk adjustment or
standardisation type and methodology
None
Output
Frequency of publication Quarterly

48
122a. Cancers diagnosed at early stage
Theme, Area Better Care, Cancer
Definition New cases of cancer diagnosed at stage 1 and 2 as a proportion of all new cases of cancer diagnosed (specific cancer sites, morphologies and behaviour: invasive
malignancies of breast, prostate, colorectal, lung, bladder, kidney, ovary, uterus, non-Hodgkin lymphomas, and invasive melanomas of skin).
Publication status In publication
Purpose (Rationale) The metric is designed to monitor the proportion of early
staged cancers, which are associated with higher survival than late staged cancers. Diagnosis at an early stage of the cancer’s development
leads to dramatically improved survival chances. Specific interventions, such as screening programmes, information/education campaigns and greater GP access to diagnostic services all aim to improve rates of early
diagnosis.
Evidence and policy base Diagnosis at an early stage of the cancer’s development leads to significantly improved survival outcomes, as shown
in a BJC paper “Stage at diagnosis and early mortality from cancer in England”. Supporting clinicians to spot cancers earlier and greater GP
access to diagnostic and specialist advice is key as outlined in the Five Year Forward View. Improving cancer survival is one of the three key ambitions in the report, “Achieving world-class cancer outcomes: a strategy for England 2015-
2020”, published by the Independent Cancer Taskforce in July 2015.
Data
Data source Cancer Analysis System, National Cancer Registry, Public
Health England http://www.ncin.org.uk/publications/survival_by_stage
Data fields Year of diagnosis
Site of the cancer (in ICD10 O2)
Stage of the cancer
Geographical area (derived from Postcode by NSPL)
Data filters
Data processing Data are extracted as numerator and denominator fields.
CCG Code/CCG Name
Tumour group
Summary stage (stage of diagnosis)
Diagnosis year Count

49
Construction
Numerator All cases of cancer diagnosed at stage 1 or 2, for the
specific cancer sites, morphologies and behaviour: invasive malignancies of breast, prostate, colorectal, lung, bladder, kidney, ovary, uterus, non-Hodgkin lymphomas and invasive melanomas of skin
Denominator All new cases of cancer diagnosed at any stage or unknown stage, for the specific cancer sites, morphologies and behaviour: invasive malignancies of breast, prostate,
colorectal, lung, bladder, kidney, ovary, uterus, non-Hodgkin lymphomas and invasive melanomas of skin
Computation The number of new cancer cases (for the specified site,
morphology and behaviour) diagnosed at stage 1 and 2 is divided by the total number of new cancer cases (for the specified site, morphology and behaviour) in the same area and multiplied by 100. Cancers where the stage is not
recorded are included in the denominator, so a low proportion of cases with staging data will lead to the indicator showing a low proportion of cases diagnosed at stage 1 or 2.
Result is displayed as a percentage to zero decimal places, rounded up.
All ages are included. All sexes are included (Persons).
Data are provided at CCG level.
Risk adjustment or standardisation type and
methodology
None
Output
Frequency of publication Annual
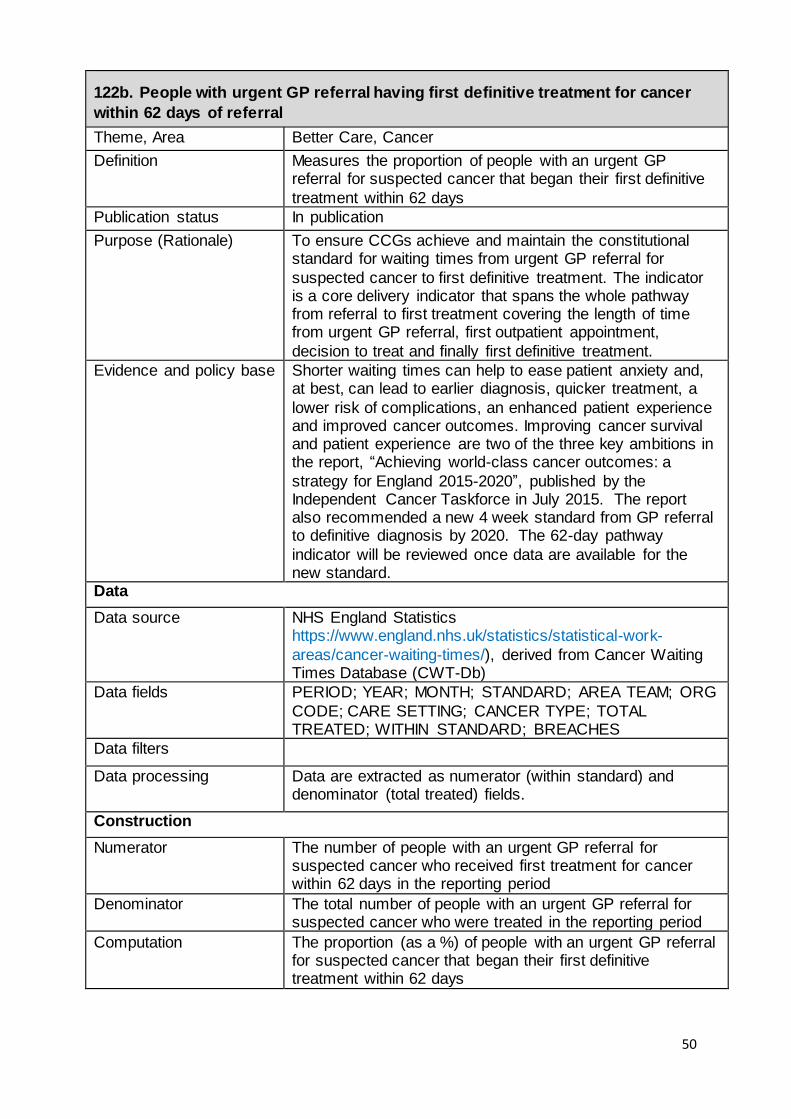
50
122b. People with urgent GP referral having first definitive treatment for cancer
within 62 days of referral
Theme, Area Better Care, Cancer
Definition Measures the proportion of people with an urgent GP referral for suspected cancer that began their first definitive
treatment within 62 days
Publication status In publication
Purpose (Rationale) To ensure CCGs achieve and maintain the constitutional standard for waiting times from urgent GP referral for
suspected cancer to first definitive treatment. The indicator is a core delivery indicator that spans the whole pathway from referral to first treatment covering the length of time from urgent GP referral, first outpatient appointment,
decision to treat and finally first definitive treatment.
Evidence and policy base Shorter waiting times can help to ease patient anxiety and, at best, can lead to earlier diagnosis, quicker treatment, a
lower risk of complications, an enhanced patient experience and improved cancer outcomes. Improving cancer survival and patient experience are two of the three key ambitions in the report, “Achieving world-class cancer outcomes: a
strategy for England 2015-2020”, published by the Independent Cancer Taskforce in July 2015. The report also recommended a new 4 week standard from GP referral to definitive diagnosis by 2020. The 62-day pathway
indicator will be reviewed once data are available for the new standard.
Data
Data source NHS England Statistics https://www.england.nhs.uk/statistics/statistical-work-
areas/cancer-waiting-times/), derived from Cancer Waiting Times Database (CWT-Db)
Data fields PERIOD; YEAR; MONTH; STANDARD; AREA TEAM; ORG
CODE; CARE SETTING; CANCER TYPE; TOTAL TREATED; WITHIN STANDARD; BREACHES
Data filters
Data processing Data are extracted as numerator (within standard) and denominator (total treated) fields.
Construction
Numerator The number of people with an urgent GP referral for suspected cancer who received first treatment for cancer within 62 days in the reporting period
Denominator The total number of people with an urgent GP referral for suspected cancer who were treated in the reporting period
Computation The proportion (as a %) of people with an urgent GP referral for suspected cancer that began their first definitive treatment within 62 days

51
Risk adjustment or
standardisation type and methodology
None
Output
Frequency of publication Quarterly

52
122c. One-year survival from all cancers
Theme, Area Better Care, Cancer
Definition A measure of the number of adults diagnosed with any type
of cancer in a year who are still alive one year after diagnosis. All adults (15–99 years) who were diagnosed with a first,
primary, invasive malignancy were eligible for inclusion. Patients diagnosed with malignancy of the skin other than melanoma were excluded. Non-melanoma skin cancer is a non-basal cell carcinoma which is regularly excluded from
cancer indicators as its impact on health is much less than other cancers and there are comparatively large numbers of cases which could significantly impact any statistic that includes it. Cancer of the prostate was also excluded from
the index, because the widespread introduction of prostate-specific antigen (PSA) testing since the early 1990s has led to difficulty in the interpretation of survival trends.
Publication status In publication
Purpose (Rationale) To encourage work to improve cancer survival rates - a key component of the strategy to achieve world-class cancer outcomes.
Evidence and policy base The most up-to-date published international comparisons
show that relative survival during 1995-2007 improved for breast, colorectal, lung and ovarian cancer patients in all jurisdictions. However, the gap in survival between the highest performing countries (Australia, Canada and
Sweden) and the lowest (England, Northern Ireland, Wales and Denmark) remains largely unchanged, except for breast cancer, where the UK is narrowing the gap. More recently, the survival gap has also started to close in stomach and
rectal cancers, according to as yet unpublished data. But it remains significant in lung and colon cancers. Improving cancer survival is one of the three key ambitions
in the report, Achieving world-class cancer outcomes: a strategy for England 2015-2020, published by the Independent Cancer Taskforce in July 2015. In additional to making overall improvements, the Taskforce would also like
to see a reduction in CCG variation.
Data
Data source Statistical Bulletin: A Cancer Survival Index for Clinical Commissioning Groups. Published annually (calendar years)
by the Office for National Statistics (ONS).
Data fields Geography; Years since diagnosis; Survival (%); Precision
for each calendar year of diagnosis

53
Data filters The number of patients aged 15 to 99 years diagnosed with
any type of cancer in a year who are still alive one year after diagnosis. Cancer is defined as a first, primary, invasive malignancy with two exclusions; Non-melanoma skin cancer (ICD-10 C44) and cancer of the prostate (C61).
Data processing Construction
Numerator Net survival is the probability of survival derived solely from the risk of death from cancer, compensating for the risk of
death from other causes (background mortality). Background mortality is accounted for through life tables of all-cause mortality rates for the general population in England.
To obtain an unbiased estimation of net survival, age needs to be carefully modelled to account for the informative censoring associated with age [1]. LSHTM used flexible
parametric models [2,3] with age and year of diagnosis as main effects and an interaction between age and year of diagnosis. They also examined interactions between year and follow-up time and between age and follow-up time to
deal with potential non-proportionality of the excess hazards over time since diagnosis. The Akaike Information Criterion (AIC) [4] was used to select the best-fitting statistical model, by testing the relative goodness of fit. A publicly available
program (stpm2) was used to estimate net survival [1]. 1. Danieli C, Remontet L, Bossard N, Roche L, Belot A. Estimating net survival: the importance of allowing for
informative censoring. Stat Med 2012; 31: 775-86. 2. Lambert PC, Royston P. Further development of flexible parametric models for survival analysis. Stata J 2009; 9:
265-90. 3. Royston P, Parmar MK. Flexible parametric proportional-hazards and proportional-odds models for censored survival
data, with application to prognostic modelling and estimation of treatment effects. Stat Med 2002; 21(15): 2175-97. 4. Akaike H. A new look at the statistical model identification.
IEEE Transactions on Automatic Control 1974; 19: 716-23.
Denominator See numerator

54
Computation One-year survival is a measure of the number of patients
diagnosed with cancer in a year who are still alive one year after diagnosis. The methodology used to calculate one-year survival is the ‘classical’ or ‘cohort’ approach. All patients diagnosed in the diagnosis period are followed-up
to one year later. Net survival is an estimate of the probability of survival from the cancer alone. It is defined as the ratio of the observed survival and the survival that would have been expected if the cancer patients had experienced
the same background mortality by age and sex as the general population. It can be interpreted as the survival of cancer patients after taking into account the background mortality that the patients would have experienced if they
had not had cancer. Net survival varies with age, sex and type of cancer and all of these factors can vary with time and between geographical areas, so the estimates are age, sex and cancer standardised to facilitate comparison.
The survival index is constructed by using a weighted average of all the cancer survival estimates for each age, sex and cancer, using the proportions of cancer patients diagnosed in England and Wales during 1996 to 1999 in
each age group, sex and type of cancer as the standard weights.
Risk adjustment or
standardisation type and methodology
The indicator is standardised for age, sex and cancer type.
To make figures from the past comparable with those from today and in the future, it is necessary to adjust an all-cancers survival index for changes over time in the profile of cancer patients by age, sex and type of cancer within each
CCG. This is because survival varies widely with all three factors. Overall cancer survival in a given CCG can change simply because the profile of its cancer patients changes, even if survival at each age, for each cancer and in each sex
has not changed. For each CCG, this adjustment was made by using a weighted average of all the cancer survival estimates for each age, sex and cancer, using the proportions of cancer patients diagnosed in England and
Wales during 1996–99 in each age group, sex and type of cancer as the standard weights. All values of the cancer survival index in that CCG, past and future, are adjusted using the same standard weights. This means that the
cancer survival index is not affected by changes over time in the proportion of cancers of different lethality in either sex – for example, a reduction in lung cancer or an increase in breast cancer. Similarly, the index will be unaffected by a change in the age profile of newly diagnosed cancer
patients, or a shift in the proportion of a given type of cancer between men and women.
Output
Frequency of publication Annually

55
122d. Cancer patient experience
Theme, Area Better Care, Cancer
Definition Average score given to the question “Overall, how would you rate your care?” on a scale from 0 (very poor) to 10 (very good)
Publication status In publication
Purpose (Rationale) To encourage progress towards the ambition set by the Independent Cancer Taskforce in July 2015 of continuous improvement in patient experience.
Evidence and policy base Improving cancer patient experience (and quality of life) is one of the three key ambitions in the report “Achieving world-class cancer outcomes: a strategy for England 2015-2020”, published by the Independent Cancer Taskforce in
July 2015. The Taskforce has set an ambition for continuous improvement in patient experience and to give it equal priority with clinical outcomes.
Data
Data source National Cancer Patient Experience Survey produced by Quality Health on behalf of NHS England http://www.ncpes.co.uk/
Data fields SCN, provider code, provider name, cancer type, number of
responses, score
Data filters
Data processing Data is presented as the average score given to the overall patient experience question for each CCG, adjusted for case-mix.
Construction
Numerator Sum of all individual responses to the question "Overall, how would you rate your care?", on a scale from 0 (very poor) to 10 (very good)
Denominator Count of all valid responses
Computation Numerator / Denominator, as an average score.
Risk adjustment or
standardisation type and methodology
Case-mix adjustment has been undertaken with this
methodology: Abel, G. et al (2014). Cancer patient experience, hospital performance and case mix: evidence from England. Future Oncology, pp.1589-1598.
Output
Frequency of publication Annually

56
123a. Improving Access to Psychological Therapies recovery rate
Theme, Area Better Care, Mental Health
Definition The percentage of people who finished treatment within the reporting period who were initially assessed as “at caseness”, have attended at least two treatment contacts and are coded as discharged, who are assessed as moving
to recovery
Publication status In publication
Purpose (Rationale) This indicator focuses on improved access to psychological therapies, in order to address enduring unmet need. This
indicator assesses the effectiveness of local IAPT services.
Evidence and policy base Around one in six adults in England suffer from a common mental health problem, such as depression or an anxiety
disorder. The effectiveness of local IAPT services is measured using this indicator and the IAPT access rate which focuses on the access to services as a proportion of local prevalence.
Research evidence indicates that 50% of people treated with CBT for depression or anxiety conditions recover during treatment. The use of CBT and evidence based
psychological therapies for the treatment of depression and anxiety is outlined in the relevant NICE quality standards).
Data
Data source NHS Digital, Improving Access to Psychological Therapies
Minimum Dataset (IAPT) http://content.digital.nhs.uk/iapt
Monthly and quarterly data files are needed for calculating the indicator and can be accessed via this link: http://content.digital.nhs.uk/iaptreports
Data fields Data fields from the monthly/quarterly NHS Digital csv data file: 1. Recovery
2. Notcaseness 3. FinishedCourseTreatment
Data filters N/A
Data processing N/A
Construction
Numerator The number of people who have completed treatment
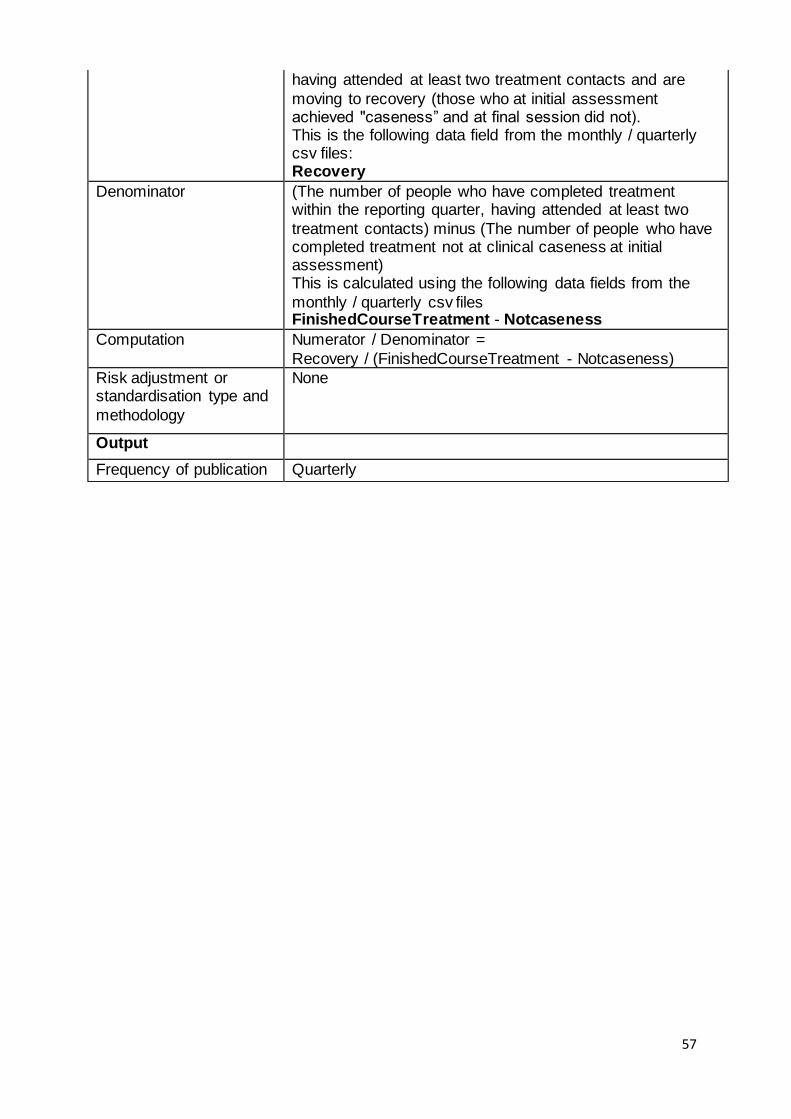
57
having attended at least two treatment contacts and are
moving to recovery (those who at initial assessment achieved "caseness” and at final session did not). This is the following data field from the monthly / quarterly csv files: Recovery
Denominator (The number of people who have completed treatment within the reporting quarter, having attended at least two
treatment contacts) minus (The number of people who have completed treatment not at clinical caseness at initial assessment) This is calculated using the following data fields from the
monthly / quarterly csv files FinishedCourseTreatment - Notcaseness
Computation Numerator / Denominator =
Recovery / (FinishedCourseTreatment - Notcaseness)
Risk adjustment or standardisation type and
methodology
None
Output
Frequency of publication Quarterly

58
123b. People with first episode of psychosis starting treatment with a NICE-
recommended package of care treated within 2 weeks of referral
Theme, Area Better Care, Mental Health
Definition The percentage of people referred to service experiencing first episode psychosis or at “risk mental state” that start a NICE-recommended care package in the reporting period.
Publication status In publication
Purpose (Rationale) To encourage compliance with the new access and waiting time standard. This standard came into effect on 1 April 2016 and requires that more than 50% of people experiencing first episode psychosis will be treated with a
NICE-concordant package of care within 2 weeks of referral.
Evidence and policy base This indicator focuses on improving access to evidence based care in Early Intervention in Psychosis (EIP) services.
People who receive the right treatment at the right time from an EIP service can go on to lead full, hopeful and productive lives. Since 2004, EIP services have demonstrated that they can significantly reduce the rate of relapse, risk of suicide
and number of hospital admissions. They are cost effective and improve employment, education and wellbeing outcomes (Craig et al., 2004; Garety et al., 2006; McCrone et al., 2010; Petersen et al., 2005). The EIP access and
waiting time standard is part of NHS England’s Mandate commitment for 2016/17.
Data
Data source Initially EIP Waiting Times Unify collection. In due course the intention is to monitor compliance with the EIP standard
using data collected by NHS Digital via the Mental Health Services Dataset (MHSDS). This will be dependent on developing data quality and coverage of the MHSDS – the position on data collection via Unify will be reviewed in the
context of this.
Data fields Final data publication format to be confirmed: - The number of patients who started treatment in the
period. - The number of patients who started treatment within two weeks.
Data filters N/A
Data processing N/A
Construction
Numerator The number of people referred to the service experiencing first episode psychosis or at ‘risk mental state’ that start
treatment within 2 weeks of referral in the last twelve months.

59
Denominator The number of people referred to the service experiencing
first episode psychosis or at ‘risk mental state’ that start treatment in the last twelve months
Computation Numerator / denominator
Risk adjustment or standardisation type and methodology
None
Output
Frequency of publication Quarterly
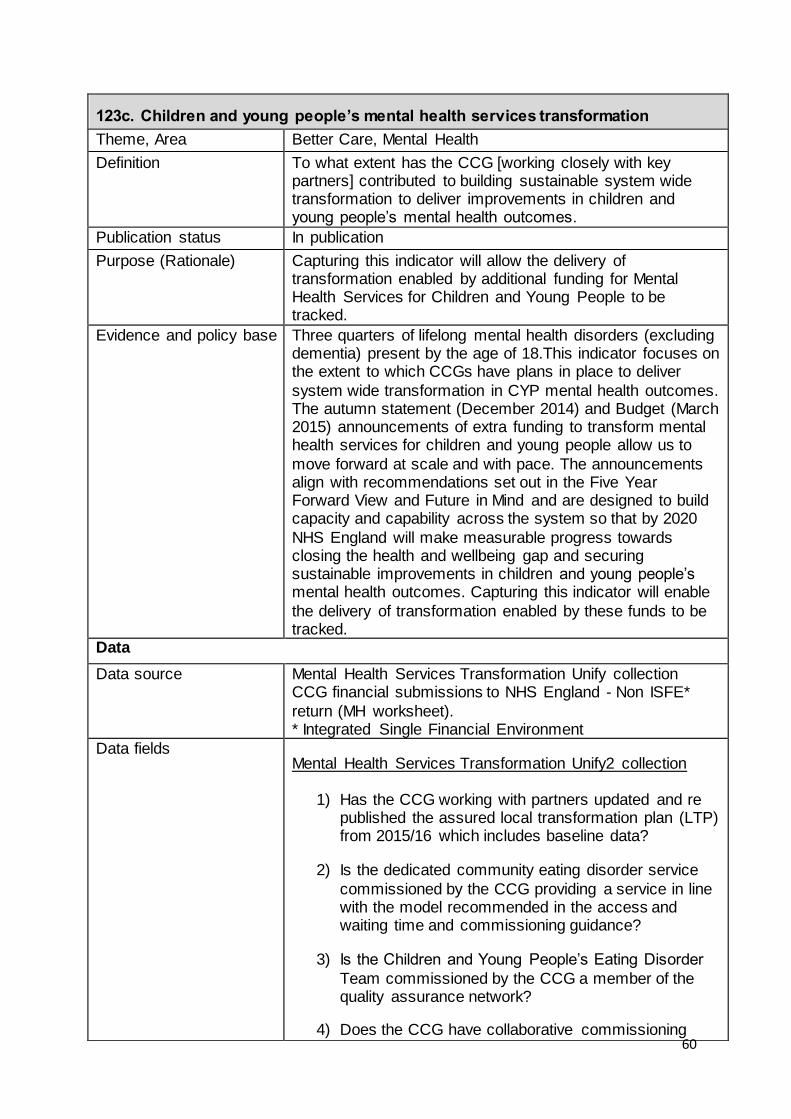
60
123c. Children and young people’s mental health services transformation
Theme, Area Better Care, Mental Health
Definition To what extent has the CCG [working closely with key partners] contributed to building sustainable system wide transformation to deliver improvements in children and young people’s mental health outcomes.
Publication status In publication
Purpose (Rationale) Capturing this indicator will allow the delivery of transformation enabled by additional funding for Mental Health Services for Children and Young People to be tracked.
Evidence and policy base Three quarters of lifelong mental health disorders (excluding dementia) present by the age of 18.This indicator focuses on the extent to which CCGs have plans in place to deliver
system wide transformation in CYP mental health outcomes. The autumn statement (December 2014) and Budget (March 2015) announcements of extra funding to transform mental health services for children and young people allow us to
move forward at scale and with pace. The announcements align with recommendations set out in the Five Year Forward View and Future in Mind and are designed to build capacity and capability across the system so that by 2020
NHS England will make measurable progress towards closing the health and wellbeing gap and securing sustainable improvements in children and young people’s mental health outcomes. Capturing this indicator will enable
the delivery of transformation enabled by these funds to be tracked.
Data
Data source Mental Health Services Transformation Unify collection CCG financial submissions to NHS England - Non ISFE*
return (MH worksheet). * Integrated Single Financial Environment
Data fields Mental Health Services Transformation Unify2 collection
1) Has the CCG working with partners updated and re published the assured local transformation plan (LTP) from 2015/16 which includes baseline data?
2) Is the dedicated community eating disorder service
commissioned by the CCG providing a service in line with the model recommended in the access and waiting time and commissioning guidance?
3) Is the Children and Young People’s Eating Disorder
Team commissioned by the CCG a member of the quality assurance network?
4) Does the CCG have collaborative commissioning

61
plans in place with NHS England for tier 3 and tier 4
CAMHS? (It was expected that all CCGs had this in place by the end of December 2016)
5) Has the CCG published joint agency workforce plans
detailing how they will build capacity and capability
including implementation of Children and Young People’s Improving Access to Psychological Therapies programmes (CYP IAPT) transformation objectives?
Non ISFE return (CCG financial submission to NHS England
6) Is the CCG forecast to have increased its spend on
Mental Health Services for Children and Young People by at least their allocation of baseline funding for 2016/17 compared to 2015/16, including appropriate use of the resources allocated from the
Autumn Statement 2014 and Spring Budget 2015?
Fully compliant if: CCGs planned spend on CYP
mental health services (2016/17) >= CCGs forecast
outrun spend on CYP mental health services
(2015/16 – from CCGs financial plan submission) +
CCGs share of additional funding for CYP MH
services included in 2016/17 baseline allocations.
Question / data fields 1, 2, 4 and 5 have the following
possible range of values:
i. Fully compliant
ii. Not compliant
iii. Partially compliant
Questions / data fields 3 and 6 have the following possible
range of values:
i. Fully compliant
ii. Not compliant
Data filters None
Data processing None Construction
Numerator The total score achieved by the CCG based on the milestones detailed above. The score for each milestone is as follows:
Questions 1-5
Not compliant: 0

62
Partially compliant: 0.3
Fully compliant: 0.6 Question 6
Not compliant: 0
Fully compliant: 3
Denominator Total possible score (6)
Computation A percentage calculated as the sum of the scores for each of milestone questions (see above). Divided by the total possible score (6). Five of the questions are self-assessed by CCGs as Fully,
Partially or not compliant. The answer to the sixth question is calculated by NHS England’s Finance team using data from non ISFE returns and CCG plans.
Risk adjustment or standardisation type and methodology
None
Output
Frequency of publication Quarterly
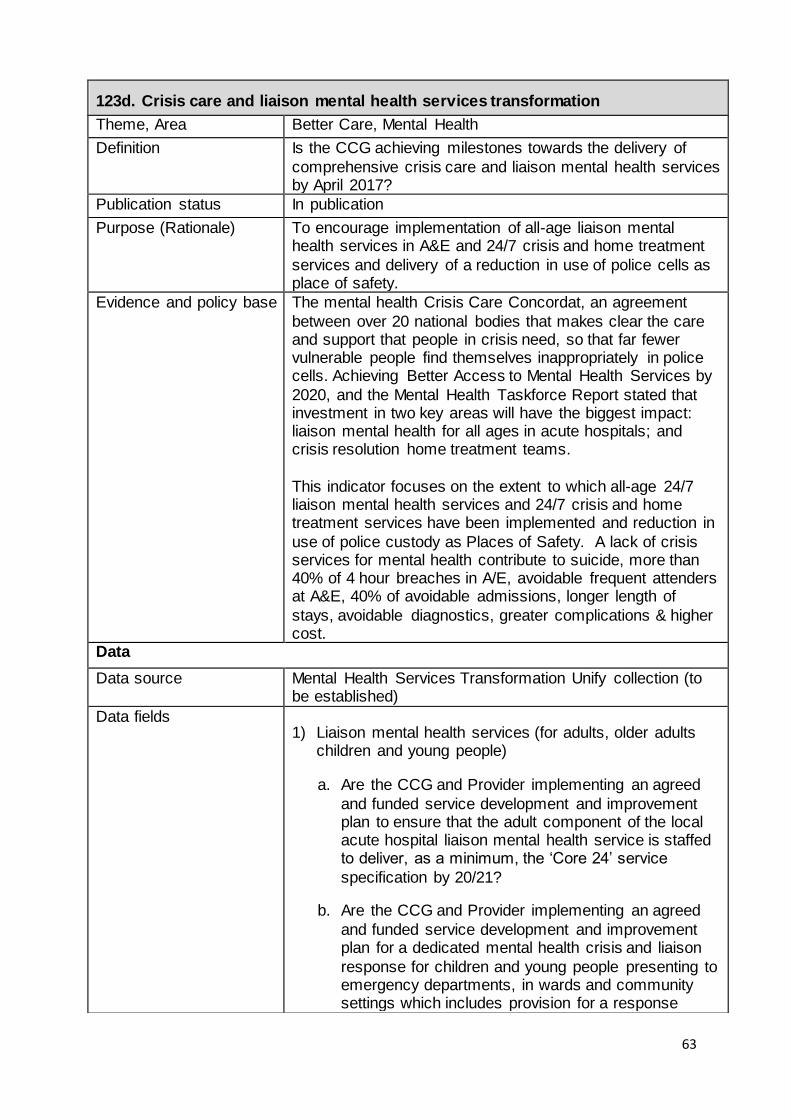
63
123d. Crisis care and liaison mental health services transformation
Theme, Area Better Care, Mental Health
Definition Is the CCG achieving milestones towards the delivery of
comprehensive crisis care and liaison mental health services by April 2017?
Publication status In publication
Purpose (Rationale) To encourage implementation of all-age liaison mental health services in A&E and 24/7 crisis and home treatment
services and delivery of a reduction in use of police cells as place of safety.
Evidence and policy base The mental health Crisis Care Concordat, an agreement
between over 20 national bodies that makes clear the care and support that people in crisis need, so that far fewer vulnerable people find themselves inappropriately in police cells. Achieving Better Access to Mental Health Services by
2020, and the Mental Health Taskforce Report stated that investment in two key areas will have the biggest impact: liaison mental health for all ages in acute hospitals; and crisis resolution home treatment teams.
This indicator focuses on the extent to which all-age 24/7 liaison mental health services and 24/7 crisis and home treatment services have been implemented and reduction in
use of police custody as Places of Safety. A lack of crisis services for mental health contribute to suicide, more than 40% of 4 hour breaches in A/E, avoidable frequent attenders at A&E, 40% of avoidable admissions, longer length of
stays, avoidable diagnostics, greater complications & higher cost.
Data
Data source Mental Health Services Transformation Unify collection (to be established)
Data fields 1) Liaison mental health services (for adults, older adults
children and young people)
a. Are the CCG and Provider implementing an agreed
and funded service development and improvement plan to ensure that the adult component of the local acute hospital liaison mental health service is staffed to deliver, as a minimum, the ‘Core 24’ service
specification by 20/21?
b. Are the CCG and Provider implementing an agreed
and funded service development and improvement plan for a dedicated mental health crisis and liaison
response for children and young people presenting to emergency departments, in wards and community settings which includes provision for a response

64
across extended hours? (This may be provided as a
specific CYP crisis team, life course/all ages provision or/and a multi-agency response). (CYP)
c. Is the liaison service commissioned to provide an on-
site 24/7 service? (adults)
d. Is the liaison service commissioned to provide a 1
hour response time following an Emergency Department referral and 24 hour response time following a ward referral? (adults)
e. Is the commissioned liaison service routinely
collecting outcome measures in line with the RCPsych standards (FROM-LP)?
2) Crisis resolution home treatment teams (adults):
a. Are the CCG and Provider implementing an agreed
and funded service development and improvement plan to ensure the CRHTT is operating effectively and in line with recognised best practice?
b. Is the CRHTT commissioned to respond quickly to
new referrals, providing a 24/7 “gatekeeping” function for acute inpatient beds, assessing all people face to face within four hours of referral?
c. Is the CRHTT staffed adequately, with caseloads in
line with recommended practice?
d. Is the commissioned CRHTT offering intensive home
treatment in line with recommended practice? (For
example, by routinely visiting people at least twice a day the first three days of home treatment, providing twice daily visits when required thereafter, and routinely offering visits that allow enough time to
prioritise therapeutic relationships and help with social and practical problems?)?
e. Does the commissioned CRHTT routinely collect and
monitor clinician and patient reported outcomes, as
well as feedback from people who use the service?
3) Places of safety (for people of all ages):
a. Does the CCG (individually or collaboratively with
other CCGs) commission 24/7 accessible health-
based places of safety which operate in such a way that people of any age do not have to undergo a Mental Health Act section 136 (s136) assessment in police custody?

65
b. Does the CCG actively use provider, police and local
authority data to monitor and understand the demand
for health-based places of safety, as well as outcomes for s136 detainees?
c. Is the CCG party/signatory to a joint s136 protocol
with other local partners as per the Mental Health Act
Code of Practice, which is regularly reviewed with a clear action plan to address any concerns?
d. Do senior CCG representatives actively instigate a
joint incident review whenever someone detained
under s136 within your geographical footprint is refused access to a health-based place of safety and/or taken to police custody?
e. Does the CCG (individually or jointly e.g. with a
Police & Crime Commissioner) commission services from a provider which give police officers urgent access to mental health specialist clinical advice?
Question / data fields 1a, 1b, 1d, 2a, 2b, 2e, 3a and 3b have
the following possible range of values:
i. Fully compliant
ii. Not compliant
iii. Partially compliant
The remaining questions have the following possible range
of values:
i. Fully compliant
ii. Not compliant
Data filters None
Data processing Calculate the total score achieved by the CCG based on the
milestones detailed above. The score for each milestones is as follows: Questions 1-5 and 11-15
Not compliant : 0
Partially compliant: 0.375
Fully compliant: 0.75
Questions 6-10
Not compliant: 0
Partially compliant: 0.75
Fully compliant: 1.5

66
Construction
Numerator The total score achieved by the CCG based on the
milestones detailed above.
Denominator Total possible score (15)
Computation A percentage calculated as the sum of the scores for each of the milestone questions (see above). Divided by the total
possible score (15).
Risk adjustment or standardisation type and
methodology
None
Output
Frequency of publication Quarterly
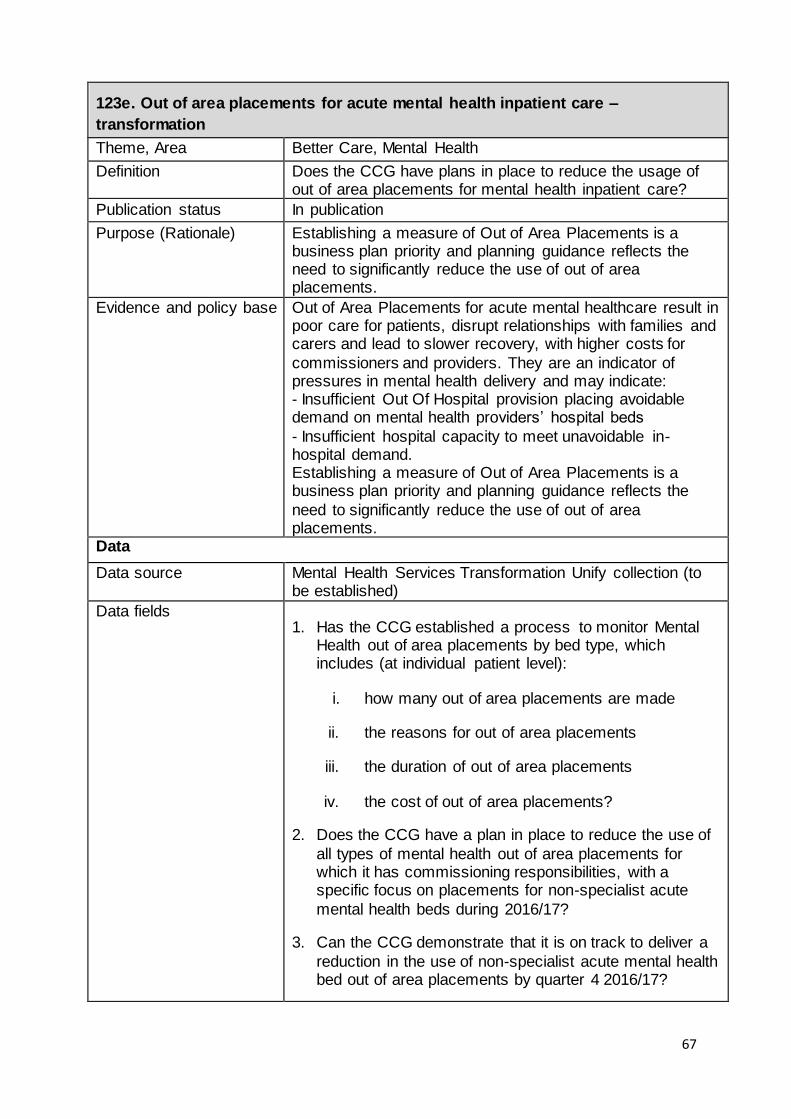
67
123e. Out of area placements for acute mental health inpatient care –
transformation
Theme, Area Better Care, Mental Health
Definition Does the CCG have plans in place to reduce the usage of out of area placements for mental health inpatient care?
Publication status In publication
Purpose (Rationale) Establishing a measure of Out of Area Placements is a business plan priority and planning guidance reflects the need to significantly reduce the use of out of area placements.
Evidence and policy base Out of Area Placements for acute mental healthcare result in poor care for patients, disrupt relationships with families and carers and lead to slower recovery, with higher costs for
commissioners and providers. They are an indicator of pressures in mental health delivery and may indicate: - Insufficient Out Of Hospital provision placing avoidable demand on mental health providers’ hospital beds
- Insufficient hospital capacity to meet unavoidable in-hospital demand. Establishing a measure of Out of Area Placements is a business plan priority and planning guidance reflects the
need to significantly reduce the use of out of area placements.
Data
Data source Mental Health Services Transformation Unify collection (to be established)
Data fields 1. Has the CCG established a process to monitor Mental
Health out of area placements by bed type, which includes (at individual patient level):
i. how many out of area placements are made
ii. the reasons for out of area placements
iii. the duration of out of area placements
iv. the cost of out of area placements?
2. Does the CCG have a plan in place to reduce the use of
all types of mental health out of area placements for which it has commissioning responsibilities, with a specific focus on placements for non-specialist acute
mental health beds during 2016/17?
3. Can the CCG demonstrate that it is on track to deliver a
reduction in the use of non-specialist acute mental health bed out of area placements by quarter 4 2016/17?
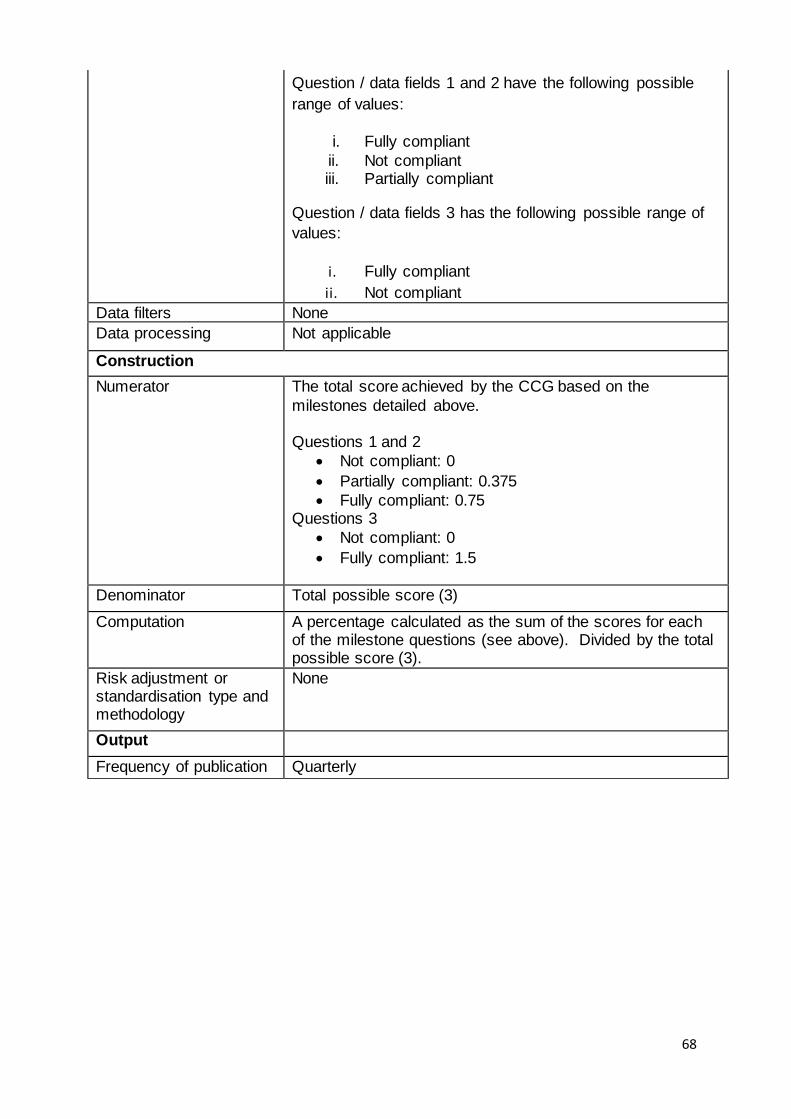
68
Question / data fields 1 and 2 have the following possible
range of values:
i. Fully compliant
ii. Not compliant iii. Partially compliant
Question / data fields 3 has the following possible range of
values:
i. Fully compliant
ii. Not compliant
Data filters None
Data processing Not applicable
Construction
Numerator The total score achieved by the CCG based on the
milestones detailed above. Questions 1 and 2
Not compliant: 0
Partially compliant: 0.375
Fully compliant: 0.75 Questions 3
Not compliant: 0
Fully compliant: 1.5
Denominator Total possible score (3)
Computation A percentage calculated as the sum of the scores for each of the milestone questions (see above). Divided by the total possible score (3).
Risk adjustment or standardisation type and methodology
None
Output
Frequency of publication Quarterly

69
124a. Reliance on specialist inpatient care for people with a learning disability
and/or autism
Theme, Area Better care, Learning Disability
Definition The number of inpatients for each CCG in the Transforming Care Partnership, based on CCG of origin, per million GP registered adult population in the Partnership
Publication status In publication
Purpose (Rationale) To give a direct measure of the reliance on inpatient care, and hence indicate whether a Transforming Care Partnership is meeting its commitment to reduce the number of inpatients and transform services.
Evidence and policy base Transforming care partnerships (TCPs) are developing plans setting out year-on-year trajectories so that by March 2019 no area should need more inpatient capacity than is
necessary at any one time to cater to: - 10-15 inpatients in CCG-commissioned beds (such as those in assessment and treatment units) per million
population - 20-25 inpatients in NHS England-commissioned beds (such as those in low-, medium- or high-secure units) per
million population The reduction in inpatient numbers is a proxy measure for a reduction in the number of inpatient beds, and the
transformational change to deliver more services in the community rather than through inpatient services. This change is a key objective of the Transforming Care Programme
(https://www.england.nhs.uk/learningdisabilities/care/) and the national transformation plan Building the Right Support (https://www.england.nhs.uk/learningdisabilities/natplan/).
Plans are being developed by TCPs, which comprise NHS commissioners and local authority partners. The commissioning footprint is typically larger than that of a single CCG reflecting that services are commissioned and delivered by a range of organisations, and that individual
CCGs often have a very small number of inpatients. For this indicator the success of a CCG will be assessed by monitoring the performance of the collaborative TCP of which it is a member.

70
Data
Data source NHS Digital, Assuring Transformation collection, plus GP
registered population
http://content.digital.nhs.uk/article/6328/Reports-from-
Assuring-Transformation-Collection
Data fields From Assuring Transformation: Count of OriginatingCCG From QOF: Estimated GP registered population aged 18+
In addition, the CCG-TCP mapping is agreed by CCGs with NHS England
Data filters None – no exclusions apply
Data processing CCG inpatient numbers and CCG populations are both aggregated up to TCP level.
The indicator is the “Proportion of people with a learning disability on the GP register receiving an annual health check”, then any practices submitting AHC data but not QOF data are excluded.
By the same logic, all practices submitting QOF data but not AHC data are included, to ensure a CCG denominator that matches the indicator definition.
Construction
Numerator Number of inpatients at the end of the reporting period, on a ‘CCG of Origin’ basis
Denominator Estimated GP population aged 18+
Computation Numerator/Denominator
Risk adjustment or standardisation type and methodology
None
Output
Frequency of publication Quarterly
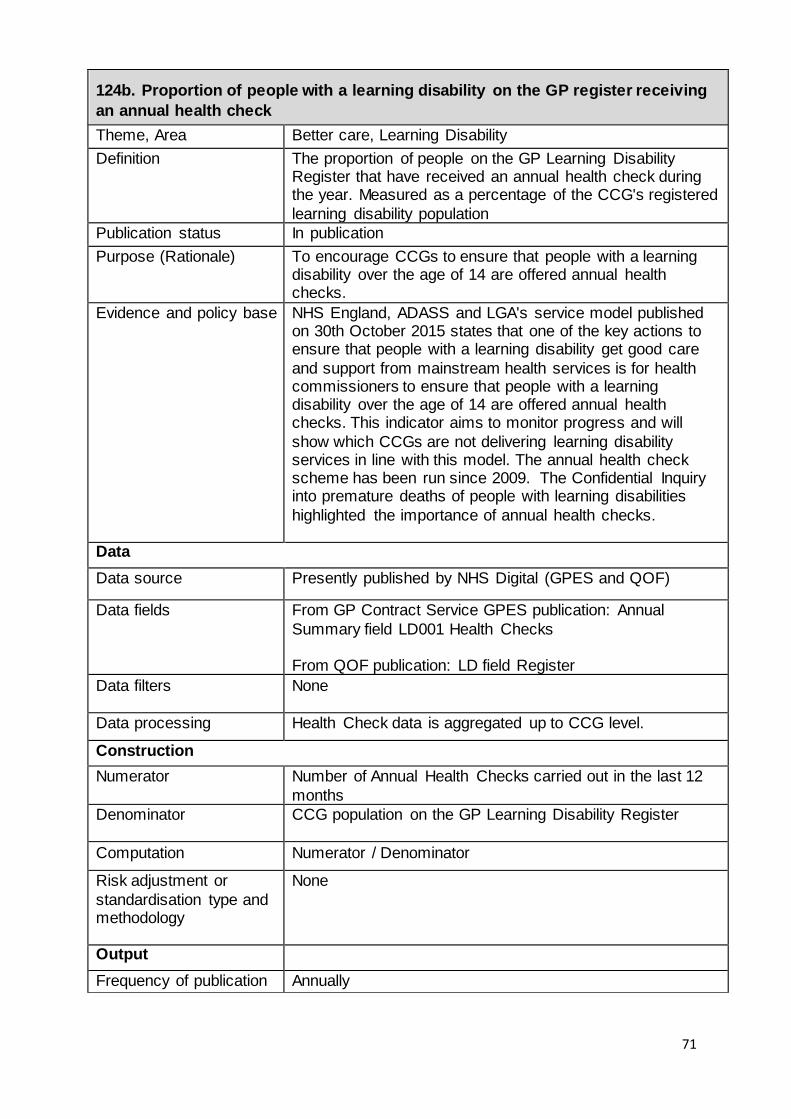
71
124b. Proportion of people with a learning disability on the GP register receiving
an annual health check
Theme, Area Better care, Learning Disability
Definition The proportion of people on the GP Learning Disability Register that have received an annual health check during the year. Measured as a percentage of the CCG's registered
learning disability population
Publication status In publication
Purpose (Rationale) To encourage CCGs to ensure that people with a learning disability over the age of 14 are offered annual health checks.
Evidence and policy base NHS England, ADASS and LGA's service model published on 30th October 2015 states that one of the key actions to ensure that people with a learning disability get good care
and support from mainstream health services is for health commissioners to ensure that people with a learning disability over the age of 14 are offered annual health checks. This indicator aims to monitor progress and will
show which CCGs are not delivering learning disability services in line with this model. The annual health check scheme has been run since 2009. The Confidential Inquiry into premature deaths of people with learning disabilities
highlighted the importance of annual health checks.
Data
Data source Presently published by NHS Digital (GPES and QOF)
Data fields From GP Contract Service GPES publication: Annual
Summary field LD001 Health Checks From QOF publication: LD field Register
Data filters None
Data processing Health Check data is aggregated up to CCG level.
Construction
Numerator Number of Annual Health Checks carried out in the last 12
months
Denominator CCG population on the GP Learning Disability Register
Computation Numerator / Denominator
Risk adjustment or
standardisation type and methodology
None
Output
Frequency of publication Annually
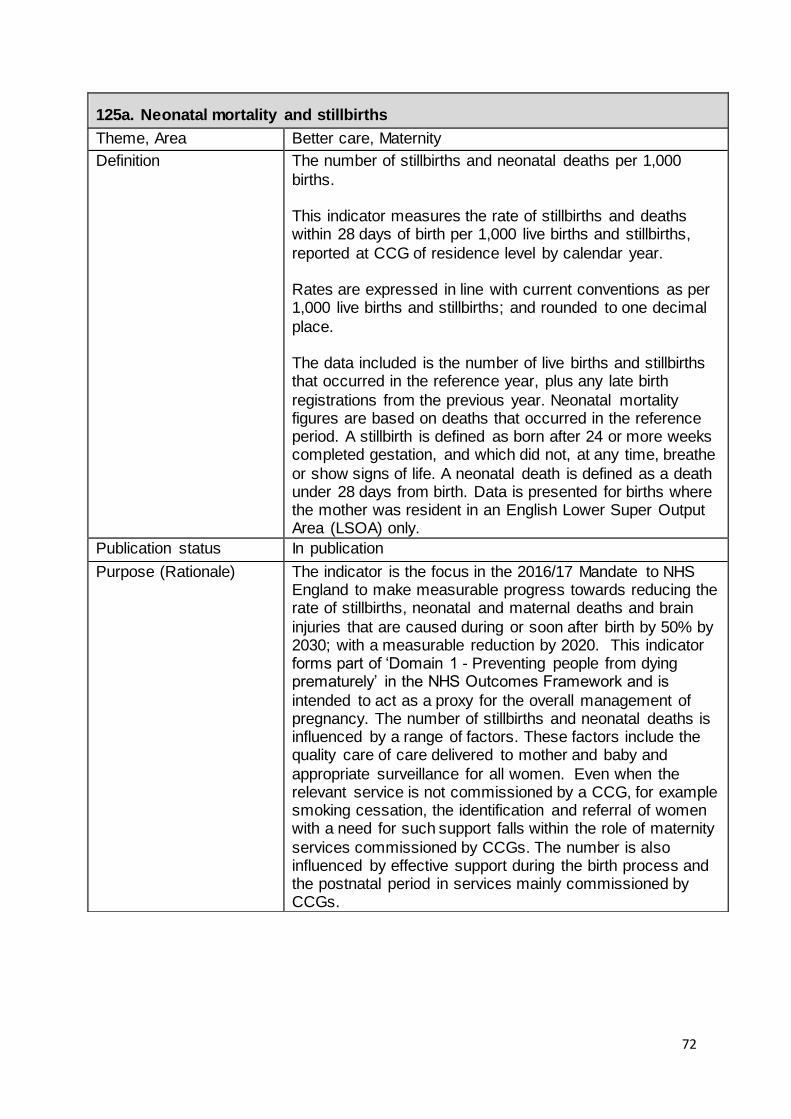
72
125a. Neonatal mortality and stillbirths
Theme, Area Better care, Maternity
Definition The number of stillbirths and neonatal deaths per 1,000
births. This indicator measures the rate of stillbirths and deaths within 28 days of birth per 1,000 live births and stillbirths,
reported at CCG of residence level by calendar year. Rates are expressed in line with current conventions as per 1,000 live births and stillbirths; and rounded to one decimal
place. The data included is the number of live births and stillbirths that occurred in the reference year, plus any late birth
registrations from the previous year. Neonatal mortality figures are based on deaths that occurred in the reference period. A stillbirth is defined as born after 24 or more weeks completed gestation, and which did not, at any time, breathe
or show signs of life. A neonatal death is defined as a death under 28 days from birth. Data is presented for births where the mother was resident in an English Lower Super Output Area (LSOA) only.
Publication status In publication
Purpose (Rationale)
The indicator is the focus in the 2016/17 Mandate to NHS England to make measurable progress towards reducing the rate of stillbirths, neonatal and maternal deaths and brain
injuries that are caused during or soon after birth by 50% by 2030; with a measurable reduction by 2020. This indicator forms part of ‘Domain 1 - Preventing people from dying prematurely’ in the NHS Outcomes Framework and is
intended to act as a proxy for the overall management of pregnancy. The number of stillbirths and neonatal deaths is influenced by a range of factors. These factors include the quality care of care delivered to mother and baby and
appropriate surveillance for all women. Even when the relevant service is not commissioned by a CCG, for example smoking cessation, the identification and referral of women with a need for such support falls within the role of maternity
services commissioned by CCGs. The number is also influenced by effective support during the birth process and the postnatal period in services mainly commissioned by CCGs.

73
Evidence and policy base The National maternity review ‘Better Births’ report outlined
a vision for maternity services across England to become safer, more personalised, kinder, professional and more family friendly. This indicator is closely linked to the safety element of this vision and resonates with issues highlighted
by the 2015 Morecambe Bay report. Problems during pregnancy such as miscarriage, foetal growth restriction and preterm birth remain common and stillbirth rates have not changed significantly in recent years. This indicator will
monitor stillbirths and neonatal mortality rates and the success of CCG activities aimed at reducing them. While caution is required when making international comparisons of stillbirths and neonatal death rates due to differences in
reporting methods and thresholds, evidence suggests that rates in England are higher than many other European countries and therefore show significant scope for improvement.
Data
Data source This indicator is a repurpose of CCG OIS indicator 1.25, which is published on the NHS Digital indicator portal.
https://indicators.hscic.gov.uk/webview/ Data is therefore finalised.
Original source data: Office for National Statistics – Child Mortality Statistics: Childhood, Infant and Perinatal.
See http://www.ons.gov.uk/peoplepopulationandcommunity/birthsdeathsandmarriages/deaths/bulletins/childhoodinfantandpe
rinatalmortalityinenglandandwales/2014#child-mortality-rates and http://www.ons.gov.uk/peoplepopulationandcommunity/birthsdeathsandmarriages/deaths/bulletins/childhoodinfantandperinatalmort
alityinenglandandwales/2014 for more information. The indicator data source is an extract from the ONS Child Mortality statistics dataset. It is a re-use of this data source,
which is not collected primarily for this indicator.

74
Data fields ONS provide volumes of live births, stillbirths and neonatal deaths and a pre-calculated rate at CCG of residence level from the birth and deaths notifications data. The following
fields are present: · CCG code · CCG name
· Stillbirths · Neonatal deaths · Total live and stillbirths · Rate of stillbirths and neonatal deaths
Data filters Data included is the number of live births and stillbirths that occurred in the reference year, plus any late birth registrations from the previous year. Infant mortality figures
are based on deaths that occurred within the reference period.
Data processing N/A
Construction
Numerator The number of stillbirths and deaths within 28 days of birth,
during a calendar year, by CCG of residence.
Denominator The number of live births and stillbirths occurring during a calendar year by CCG of residence.
Computation The indicator is calculated as a rate per 1,000 live births and
stillbirths. Rates are rounded to one decimal place.
Calculation is as follows:
stillbirths and deaths within 28 days of birth
total births
The construction of the indicator is fit for purposes and
supports the stated rationale by adopting the approved methodology of the existing CCG OIS indicator 1.25.
Risk adjustment or
standardisation type and methodology
None
Output
Frequency of publication Annually
X 1,000

75
125b. Women’s experience of maternity services
Theme, Area Better care, Maternity
Definition Women’s experiences of maternity services based on the 2015 CQC National Maternity Services Survey.
This indicator uses the CQC Maternity National Maternity survey results to specifically look at the user experience of maternity services, across the care pathway; and with regards to choice, information, confidence in staff and
clinical care. The indicator is a composite value, calculated as the average of six survey questions from the survey.
The composite indicator construction mirrors that of the national level indicator (4.5) in the NHS Outcomes Framework. A composite indicator is preferred as it
measures quality of experience, treatment and care throughout the care pathway (antenatal, intrapartum and postnatal) and to take into account the several policy priorities linked to choice, information provision, confidence in staff and clinical care.
Women were eligible for the survey if they had a live birth within the sampling period, were aged 16 or older and gave birth in a hospital, birth centre or maternity unit, or had a
home birth. A complete list of eligibility and participation criteria for the survey is available at the following link: http://www.cqc.org.uk/content/maternity-services-survey-2015
The indicator is based on all valid survey responses for which the patient’s CCG of registration is available. Responses to the survey reflect women who gave birth during January or February of the reference year.
Publication status In publication
Purpose (Rationale) Patient experience is one of the three domains of quality
care, along with safety and clinical effectiveness. The purpose of this indicator is to encourage the improvement of patient experience in maternity services and support people to shape and manage their own health and care. To help
service users make meaningful choices to achieve better health outcomes, progressing towards a person-centred NHS. This indicator strives to measure patient experience across the entirety of the maternity pathway, that is,
antenatal, intrapartum and postnatal stages.

76
Evidence and policy base The National maternity review ‘Better Births’ report outlined a vision for maternity services across England is for them to become safer, more personalised, kinder, professional and more family friendly; where every woman has access to
information to enable her to make decisions about her care; and where she and her baby can access support that is centred around their individual needs and circumstances. This indicator is intended to provide a summary measure of
women’s experience linked to the different aspects of this vision. This indicator is also closely link to the objective in the 2016/17 Mandate to NHS England to improve patient
experience, supporting people to shape and manage their own health and care and make meaningful choices to achieve better health outcomes. Patient Experience, along with Safety and Clinical Effectiveness, is one of the three
domains of Quality. A connection exists with the National Maternity Review’s policy intentions of improving the experience of mothers and their families across the breadth of maternity services. This indicator mirrors the national level
indicator (4.5) within the NHS Outcomes Framework.
Data
Data source CQC National Maternity Services Survey
2015 data from: http://www.cqc.org.uk/content/maternity-
services-survey-2015
The CQC maternity survey data is primarily collected for the calculation of provider level scores and the sampling methodology is designed for this purpose. CCG level scores are derived using the methodology outlined in the
Construction section below. The data that inform the indicator is finalised.
Data fields The following fields are present to facilitate calculation of the indicator composite scores: - Code of the CCG billed for the care of respondent
- Anonymised respondent record number (for a count of number of records. This is a unique identifier for each record in the data set. It does not enable identification of the
patient.) - Age and parity grouping of respondent
- Status of response (Responded/did not respond) Answer option, per the following questions:
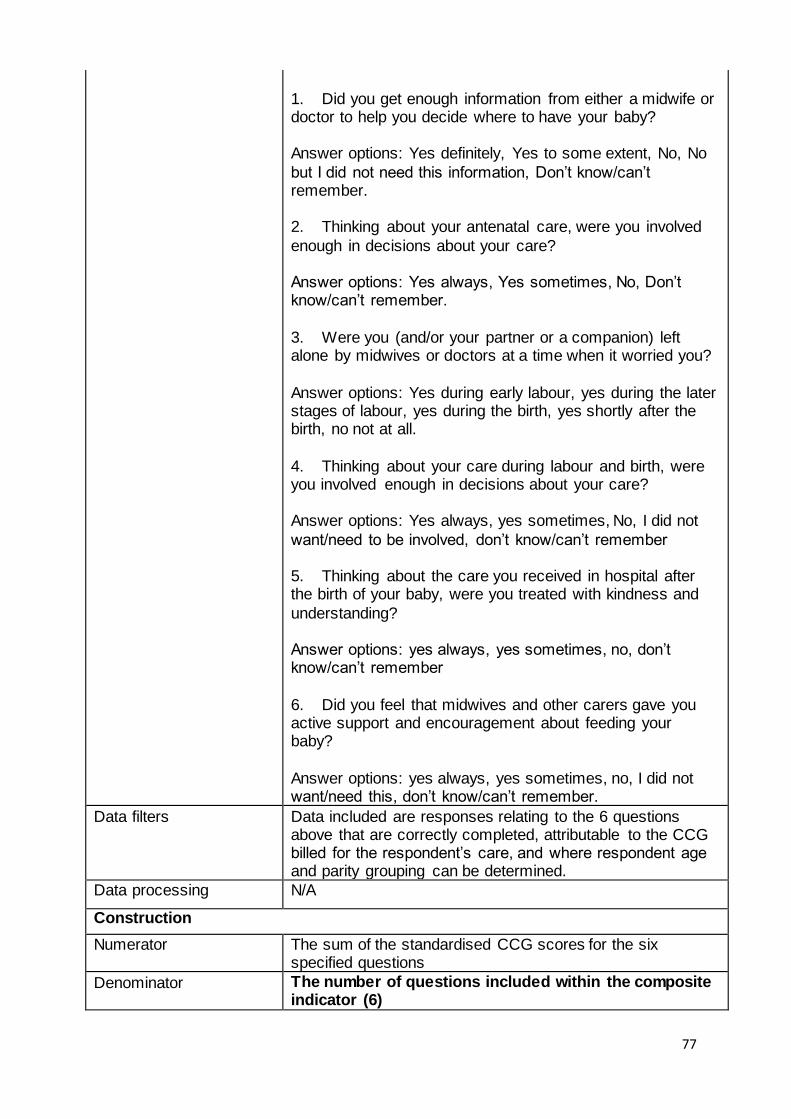
77
1. Did you get enough information from either a midwife or doctor to help you decide where to have your baby? Answer options: Yes definitely, Yes to some extent, No, No
but I did not need this information, Don’t know/can’t remember. 2. Thinking about your antenatal care, were you involved
enough in decisions about your care? Answer options: Yes always, Yes sometimes, No, Don’t know/can’t remember.
3. Were you (and/or your partner or a companion) left alone by midwives or doctors at a time when it worried you?
Answer options: Yes during early labour, yes during the later stages of labour, yes during the birth, yes shortly after the birth, no not at all.
4. Thinking about your care during labour and birth, were you involved enough in decisions about your care? Answer options: Yes always, yes sometimes, No, I did not
want/need to be involved, don’t know/can’t remember 5. Thinking about the care you received in hospital after the birth of your baby, were you treated with kindness and
understanding? Answer options: yes always, yes sometimes, no, don’t know/can’t remember
6. Did you feel that midwives and other carers gave you active support and encouragement about feeding your baby?
Answer options: yes always, yes sometimes, no, I did not want/need this, don’t know/can’t remember.
Data filters Data included are responses relating to the 6 questions above that are correctly completed, attributable to the CCG billed for the respondent’s care, and where respondent age and parity grouping can be determined.
Data processing N/A
Construction
Numerator The sum of the standardised CCG scores for the six specified questions
Denominator The number of questions included within the composite indicator (6)

78
Computation This is a composite indicator, calculated using the mean
CCG score for 6 survey questions from the CQC National Maternity Survey. Individual questions are scored according to a pre-defined
scoring regime (see further details below) that awards scores between 0 and 10. The mean CCG score for these questions therefore take a value between 0 and 10, where 0 is the worst score and 10 is the best score. This value is
multiplied by 10 to generate a score out of 100. The possible scoring range of 0 to 100 matches that of the equivalent NHS Outcomes Framework indicator on women’s experience of maternity services.
The questions cover experience across the whole maternity pathway: antenatal, intrapartum and postnatal:
1. Did you get enough information from a midwife or doctor to help you decide where to have your baby? 2. Thinking about your antenatal care, were you involved
enough in decisions about your care? 3. Were you (and/or your partner or a companion) left alone by midwives or doctors at a time when it worried you?
4. Thinking about your care during labour and birth, were you involved enough in decisions about your care?
5. Thinking about the care you received in hospital after the birth of your baby, were you treated with kindness and understanding?
6. Did you feel that midwives and other carers gave you active support and encouragement about feeding your baby?
Results are standardised by maternal age and parity (number of previous births) so that CCG scores reflect the score the CCG would have if it had the same respondent breakdown as in the national cut of the data.
Calculating the composite score per CCG has several steps: - Selecting data for reporting:
Data is selected in line with the following exclusions, which reflect those used in the CQC Maternity Survey methodology:
The CQC Maternity Survey excludes women:

79
- aged under 16 at the date of the delivery of their baby,
- whose baby had died during or since delivery, - who had a stillbirth (including where it occurred during a multiple delivery), - who were in hospital, or whose baby was in hospital, at the
time the sample was drawn from the trusts’ records, - who had a concealed pregnancy (where it was possible to, identify from trusts’ records), - whose baby was taken into care (where known by the
trust), - who gave birth in a private maternity unit or wing, - who did not have a UK postal address. - any patient known to have requested their details are not
used for any purpose other than their clinical care In addition to this, data are excluded where: - respondent age group cannot be determined
- respondent parity group cannot be determined - a respondent was not eligible to answer a given question - a respondent incorrectly answers a question (e.g. selecting all answer options when only one option is
possible) See the CQC Quality and Methodology Report and CQC Technical Documentation for more information.
- CCG attribution: Care is attributed to the respondent’s CCG of registration. This is derived from the CCG code provided in the dataset.
- Question scoring: Scores are assigned to answer options to questions that are
of an evaluative nature, of a range between 0 and 10. A score of 0 is assigned to answer options that reflect considerable scope for improvement, whereas an answer option is assigned score of 10 where it reflects the most
positive possible patient experience. Where a number of answer options lay between negative and positive responses, they are placed at equal intervals along the scale. Where answer options were provided that did not
have any bearing on performance (e.g. don’t know/can’t remember) a score is not assigned and the answer option is classed as not applicable. - Calculating composite scores:
Respondent numerators are calculated via multiplying respondent’s individual scores by their individual weighting.
Score denominators are then calculated via assigning a

80
value of 1 if question was answered by respondent, 0 if not.
These are multiplied by the weighting allocated to respondents. The standardised mean score for each CCG per question is
then calculated. This is achieved by dividing the sum of the weighted scores by the sum of the weighted number of eligible respondents for each question for each CCG.
The composite indicator score per CCG is then calculated as the mean of the scores across the six questions multiplied by a factor of ten.
Standardisation (weighting): Data is standardised for age and parity (see below).
See CQC Technical Documentation and CQC 2015 Scored Maternity Survey Questionnaire for more information.
Risk adjustment or
standardisation type and methodology
Indirect Standardisation
Variables and methodology: Data are weighted for age and parity. The data set includes
a field indicating the age-parity category of the respondent. The respondent’s age is derived from trust level sample files, which are not available to NHS England. Dates of birth are not included in the dataset used by NHS England for the
indicator calculation. - Parity is derived from answers to question G3 (“how many babies have you given birth to before this pregnancy?”).
- Respondents are then grouped according to six age and parity categories (defined above).
- Calculating the CCG proportions for age and parity, using the above approach. - Calculating respondent level proportions – divide national
proportion of respondents in their age or parity group by corresponding CCG proportion. A maximum weighting cap is assigned to limit excessive weight being given to respondents in an extremely under-
represented group. No minimum weighting cap is calculated as assigning very small weights to over-represented groups does not have the same potential to give excessive impact to the responses of small numbers of individual respondents.
Output
Frequency of publication Triennial (every three years)
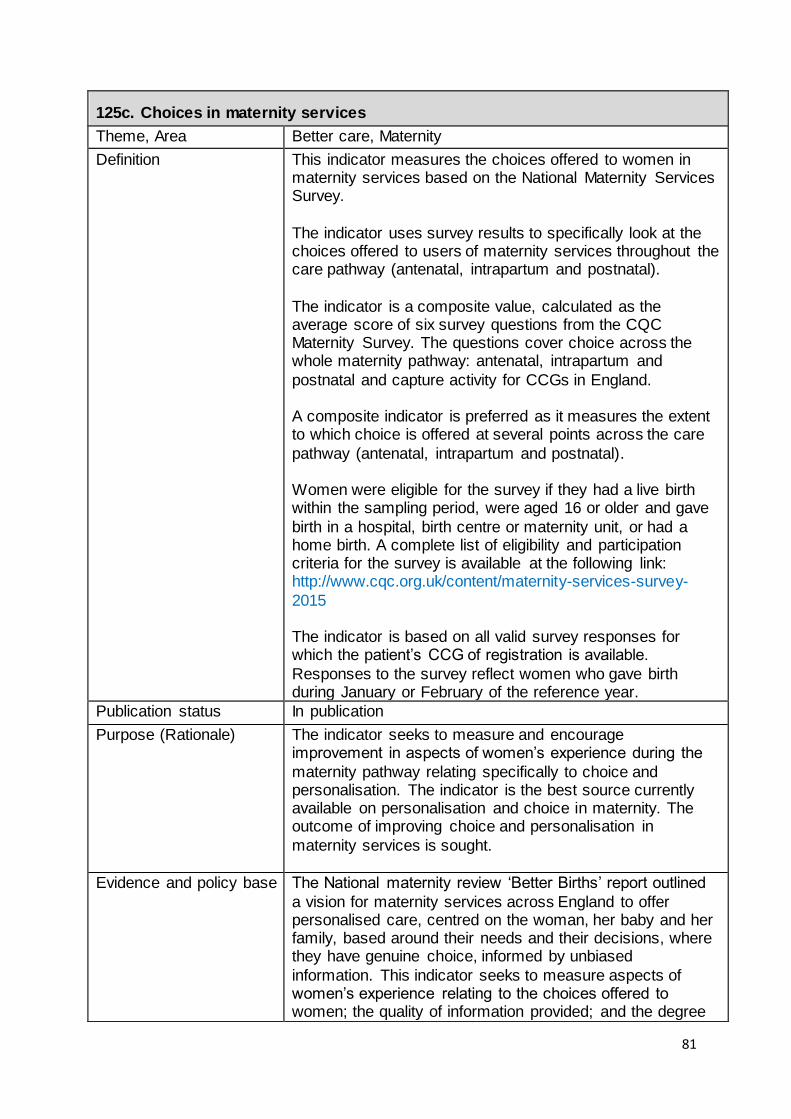
81
125c. Choices in maternity services
Theme, Area Better care, Maternity
Definition This indicator measures the choices offered to women in maternity services based on the National Maternity Services Survey.
The indicator uses survey results to specifically look at the choices offered to users of maternity services throughout the care pathway (antenatal, intrapartum and postnatal).
The indicator is a composite value, calculated as the average score of six survey questions from the CQC Maternity Survey. The questions cover choice across the whole maternity pathway: antenatal, intrapartum and
postnatal and capture activity for CCGs in England. A composite indicator is preferred as it measures the extent to which choice is offered at several points across the care
pathway (antenatal, intrapartum and postnatal). Women were eligible for the survey if they had a live birth within the sampling period, were aged 16 or older and gave
birth in a hospital, birth centre or maternity unit, or had a home birth. A complete list of eligibility and participation criteria for the survey is available at the following link: http://www.cqc.org.uk/content/maternity-services-survey-
2015 The indicator is based on all valid survey responses for which the patient’s CCG of registration is available.
Responses to the survey reflect women who gave birth during January or February of the reference year.
Publication status In publication
Purpose (Rationale) The indicator seeks to measure and encourage improvement in aspects of women’s experience during the
maternity pathway relating specifically to choice and personalisation. The indicator is the best source currently available on personalisation and choice in maternity. The outcome of improving choice and personalisation in
maternity services is sought.
Evidence and policy base The National maternity review ‘Better Births’ report outlined
a vision for maternity services across England to offer personalised care, centred on the woman, her baby and her family, based around their needs and their decisions, where they have genuine choice, informed by unbiased
information. This indicator seeks to measure aspects of women’s experience relating to the choices offered to women; the quality of information provided; and the degree

82
of involvement afforded to women along the maternity
pathway. The Five Year Forward view promises to “make good on the NHS’ longstanding promise to give patients choice over where and how they receive care”. There is also a close link to the objective in the 2016/17 Mandate to NHS
England to: improve patient experience and create a person-centred NHS in which people are supported to shape and manage their own health and care; and make meaningful choices in order to achieve better health outcomes.
Data
Data source CQC National Maternity Services Survey
2015 data from: http://www.cqc.org.uk/content/maternity-
services-survey-2015
The CQC maternity survey data is primarily collected for the
calculation of provider level scores and the sampling methodology is designed for this purpose. CCG level scores are derived using the methodology outlined below.
The data that inform the indicator is finalised
Data fields The following fields are present to facilitate calculation of the indicator composite scores:
- Code of the CCG billed for the care of respondent - Anonymised respondent record number (for a count of
number of records. This is a unique identifier for each record in the data set. It does not enable identification of the patient)
- Age and parity grouping of respondent - Status of response (Responded/did not respond)
Answer option, per questions: Antenatal:
1. Were you offered any of the following choices about where to have your baby? Answer options: a choice of hospitals; a choice of giving birth in a midwife led unit or birth centre; a choice of giving birth in a consultant led unit; a
choice of giving birth at home; not offered any choices; no choices due to medical reasons; don’t know/can't remember. 2. Did you get enough information from either a midwife or
doctor to help you decide where to have your baby? Answer options: yes, definitely; yes, to some extent; no; no, but I did

83
not need this information; don’t know/can’t remember.
3. Were you offered a choice of where your antenatal assessments would take place? Answer options: yes, no, don't know/can't remember.
4. Thinking about your care during labour and birth, were you involved enough in decisions about your care? Answer options: yes, always; yes, sometimes; no; I didn’t want to be
involved; don’t know/can’t remember. 5. Were decisions about how you wanted to feed your baby, respected by midwives? Answer options: yes, always; yes,
sometimes; no; don’t know/can’t remember. 6. Did you feel that midwives and other health professionals gave you active support and encouragement about feeding
your baby? Answer options: yes, always; yes, sometimes; no; I didn’t want or need this; don’t know/can’t remember.
Data filters Data included are responses relating to the 6 questions
above that are: correctly completed, attributable to the CCG billed for the respondent’s care, and where respondent age and parity grouping can be determined.
Data processing N/A
Construction
Numerator The sum of standardised CCG scores for the six specified questions
Denominator The number of questions included within the composite indicator (6)
Computation This is a composite indicator, calculated using the mean CCG score for 6 survey questions from the CQC National Maternity Survey.
Individual questions are scored according to a pre-defined scoring regime (see further details below) that awards scores between 0 and 10. The mean CCG score for these
questions therefore take a value between 0 and 10, where 0 is the worst score and 10 is the best score. This value is multiplied by 10 to generate a score out of 100. The possible scoring range of 0 to 100 matches that of the equivalent
NHS Outcomes Framework indicator on women’s experience of maternity services. The questions cover elements of choice across the whole
maternity pathway: antenatal, intrapartum and postnatal: 1. Were you offered any of the following choices about where to have your baby? (a choice of hospitals; a choice of
giving birth in a midwife led unit or birth centre; a choice of giving birth in a consultant led unit; a choice of giving birth at

84
home; not offered any choices)
2. Did you get enough information from either a midwife or doctor to help you decide where to have your baby?
3. Were you offered a choice of where your antenatal assessments would take place? 4. Thinking about your care during labour and birth, were
you involved enough in decisions about your care? 5. Were decisions about how you wanted to feed your baby, respected by midwives?
6. Did you feel that midwives and other health professionals gave you active support and encouragement about feeding your baby?
Results are standardised by maternal age and parity (number of previous births) so that CCG scores reflect the score the CCG would have if it had the same respondent
breakdown as in the national cut of the data. Calculating the composite score per CCG has several steps:
- Selecting data for reporting: Data is selected in line with the following exclusions, which reflect those used in the CQC Maternity Survey
methodology: The CQC Maternity Survey excludes women: - aged under 16 at the date of the delivery of their baby,
- whose baby had died during or since delivery, - who had a stillbirth (including where it occurred during a multiple delivery), - who were in hospital, or whose baby was in hospital, at the
time the sample was drawn from the trusts’ records, - who had a concealed pregnancy (where it was possible to, identify from trusts’ records), - whose baby was taken into care (where known by the
trust), - who gave birth in a private maternity unit or wing, - who did not have a UK postal address. - any patient known to have requested their details are not used for any purpose other than their clinical care
In addition to this, data are excluded where: - respondent age group cannot be determined - respondent parity group cannot be determined
- a respondent was not eligible to answer a given question

85
- a respondent incorrectly answers a question (e.g.
selecting all answer options when only one option is possible) See the CQC Quality and Methodology Report and CQC Technical Documentation for more information.
- CCG attribution: Care is attributed to the respondent’s CCG of registration.
This is derived from the CCG code provided in the dataset. - Question scoring:
Scores are assigned to answer options to questions that are of an evaluative nature, of a range between 0 and 10. A score of 0 is assigned to answer options that reflect considerable scope for improvement, whereas an answer
option is assigned score of 10 where it reflects the most positive possible patient experience. Where a number of answer options lay between negative and positive responses, they are placed at equal intervals along the
scale. Where answer options were provided that did not have any bearing on performance (e.g. don’t know/can’t remember) a score is not assigned and the answer option is classed as not applicable.
- Calculating composite scores: Respondent numerators are calculated via multiplying
respondent’s individual scores by their individual weighting. Score denominators are then calculated via assigning a value of 1 if question was answered by respondent, 0 if not.
These are multiplied by the weighting allocated to respondents. The standardised mean score for each CCG per question is
then calculated. This is achieved by dividing the sum of the weighted scores by the sum of the weighted number of eligible respondents for each question for each CCG.
The composite indicator score per CCG is then calculated as the mean of the scores across the six questions multiplied by a factor of ten. - Standardisation (weighting):
Data is standardised for age and parity (see below). Please note that this methodology is applied to indicator 12b
and 12c. This is as both indicators are a composite of 6

86
questions from the CQC National Maternity Survey. Applying
the methodology used by CQC for each indicator therefore seems appropriate and aides comparability between results. See CQC Technical Documentation and CQC 2015 Scored
Maternity Survey Questionnaire for more information.
Risk adjustment or standardisation type and
methodology
Indirect Standardisation
Variables and methodology: Data are weighted for age and parity. The data set includes a field indicating the age-parity category of the respondent.
The respondent’s age is derived from trust level sample files, which are not available to NHS England. Dates of birth are not included in the dataset used by NHS England for the indicator calculation.
- Parity is derived from answers to question G3 (“how many babies have you given birth to before this pregnancy?”).
- Respondents are then grouped according to six age and parity categories (defined above). - Calculating the CCG proportions for age and parity, using
the above approach. - Calculating respondent level proportions – divide national proportion of respondents in their age or parity group by
corresponding CCG proportion. A maximum weighting cap is assigned to limit excessive weight being given to respondents in an extremely under-
represented group. No minimum weighting cap is calculated as assigning very small weights to over-represented groups does not have the same potential to give excessive impact to the responses of small numbers of individual
respondents. Output
Frequency of publication Triennial (every three years)
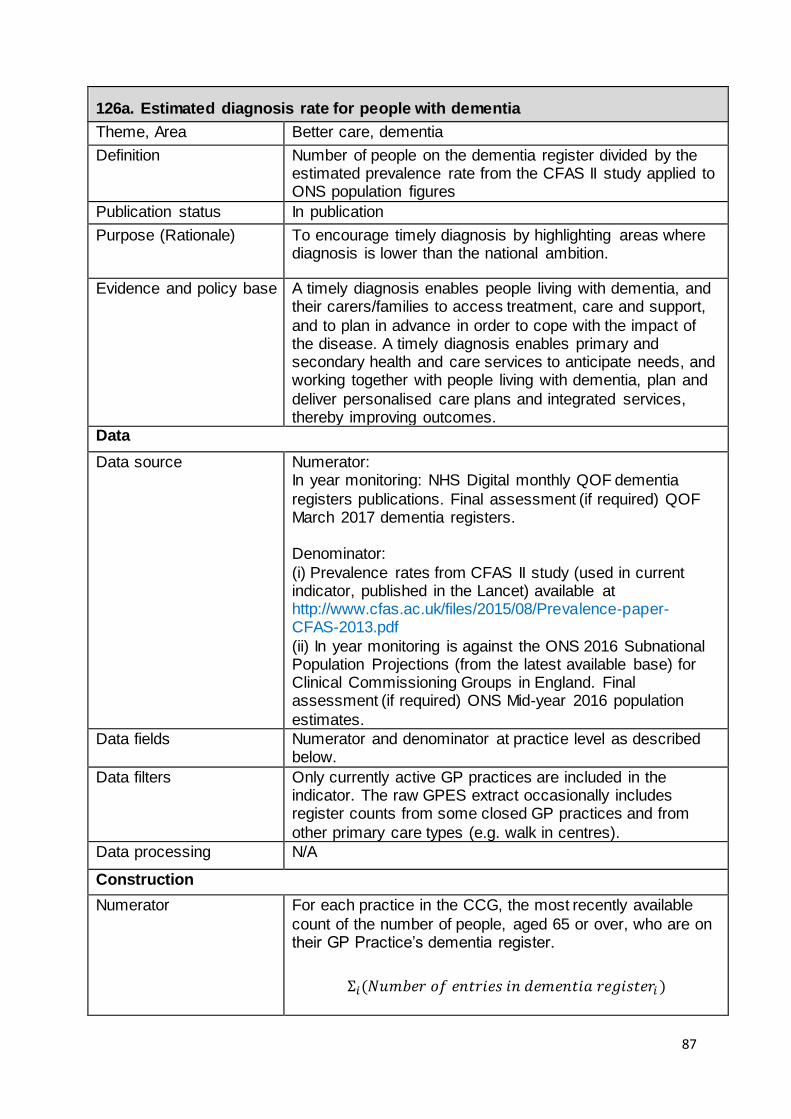
87
126a. Estimated diagnosis rate for people with dementia
Theme, Area Better care, dementia
Definition Number of people on the dementia register divided by the estimated prevalence rate from the CFAS II study applied to ONS population figures
Publication status In publication
Purpose (Rationale) To encourage timely diagnosis by highlighting areas where diagnosis is lower than the national ambition.
Evidence and policy base A timely diagnosis enables people living with dementia, and their carers/families to access treatment, care and support,
and to plan in advance in order to cope with the impact of the disease. A timely diagnosis enables primary and secondary health and care services to anticipate needs, and working together with people living with dementia, plan and
deliver personalised care plans and integrated services, thereby improving outcomes.
Data
Data source Numerator: In year monitoring: NHS Digital monthly QOF dementia
registers publications. Final assessment (if required) QOF March 2017 dementia registers. Denominator:
(i) Prevalence rates from CFAS II study (used in current indicator, published in the Lancet) available at http://www.cfas.ac.uk/files/2015/08/Prevalence-paper-CFAS-2013.pdf
(ii) In year monitoring is against the ONS 2016 Subnational Population Projections (from the latest available base) for Clinical Commissioning Groups in England. Final assessment (if required) ONS Mid-year 2016 population
estimates.
Data fields Numerator and denominator at practice level as described below.
Data filters Only currently active GP practices are included in the indicator. The raw GPES extract occasionally includes register counts from some closed GP practices and from
other primary care types (e.g. walk in centres).
Data processing N/A
Construction
Numerator
Σ𝑖(𝑁𝑢𝑚𝑏𝑒𝑟 𝑜𝑓 𝑒𝑛𝑡𝑟𝑖𝑒𝑠 𝑖𝑛 𝑑𝑒𝑚𝑒𝑛𝑡𝑖𝑎 𝑟𝑒𝑔𝑖𝑠𝑡𝑒𝑟𝑖 )
For each practice in the CCG, the most recently available
count of the number of people, aged 65 or over, who are on their GP Practice’s dementia register.

88
where i = 1, …, x where x is the count of currently active GP
practices in the CCG If a practice’s register has not been obtained through the
GPES in a given month, then the practice’s most recently available register is included in the numerator. The GPES extract omits between 2% and 4% of practices in a given month, but with an unstable omission rate it is important to
smooth the spikes in the indicator caused by variance in the practice set from which data are obtained. This methodology has been in place since August 2014 and in 2014-15 was a successful predictor of final outturn for the complete set of practices.
Denominator
Σj(% Prevalence ratej ∗ Population estimatej)
The denominator is the estimated number of people living with dementia in the CCG area.
This is calculated from estimated prevalence rates for dementia, and ONS population estimates (or projections in the absence of estimates). The prevalence rates for males
and females from the age of 65 to 90+ are applied to male and female population figures by 5-year age-band to derive an estimate of the total number of people with dementia in an area.
where j = 65-69, 70-74, 75-79, 80-84, 85-89, 90+ is the age group for males and females
Computation
Σ𝑗(% 𝑃𝑟𝑒𝑣𝑎𝑙𝑒𝑛𝑐𝑒 𝑟𝑎𝑡𝑒𝑗 ∗ 𝑃𝑜𝑝𝑢𝑙𝑎𝑡𝑖𝑜𝑛 𝑒𝑠𝑡𝑖𝑚𝑎𝑡𝑒𝑗)
Σ𝑖(𝑁𝑢𝑚𝑏𝑒𝑟 𝑜𝑓 𝑎𝑝𝑝𝑙𝑖𝑐𝑎𝑏𝑙𝑒 𝑒𝑛𝑡𝑟𝑖𝑒𝑠 𝑖𝑛 𝑑𝑒𝑚𝑒𝑛𝑡𝑖𝑎 𝑟𝑒𝑔𝑖𝑠𝑡𝑒𝑟𝑖 )*
Risk adjustment or
standardisation type and methodology
None
Output
Frequency of publication Quarterly

89
126b. Dementia care planning and post-diagnostic support
Theme, Area Better care, Dementia
Definition The percentage of patients diagnosed with dementia whose care plan has been reviewed in a face-to-face review in the preceding 12 months
Publication status In publication
Purpose (Rationale) Substantial effort has been made recently to increase the
proportion of people living with dementia who have a formal diagnosis in primary care. Clinical evidence shows that formal care planning and other post-diagnostic support is positive for the patient and is expected to lengthen the time
which they can live in the community. This indicator tests whether primary care is conducting a timely review of the patient’s needs, including that:
· patients are receiving an appropriate physical, mental health and social review; · a record is made of the patients’ wishes for the future;
· communication and co-ordination arrangements with secondary care (if applicable);
· identification of the patient’s carer(s)
Evidence and policy base Patients diagnosed with dementia are expected to be offered annual face-to-face appointments specifically to
review their diagnosis and/or their care plan or advanced care plan. This is in line with the NICE clinical guideline
CG42.”Dementia. Supporting people with dementia and their carers in health and social care” Which is in support of two NICE Quality Standards:
1. NICE Quality Standard 1: Dementia; 2. NICE Quality Standard 30: Supporting people to live
well with dementia.
Data
Data source Quality and Outcomes Framework (QOF) Indicator DEM004: The percentage of patients diagnosed with dementia whose
care plan has been reviewed in a face-to-face review in the preceding 12 months
Data fields Numerator and denominator per GP practice as described below
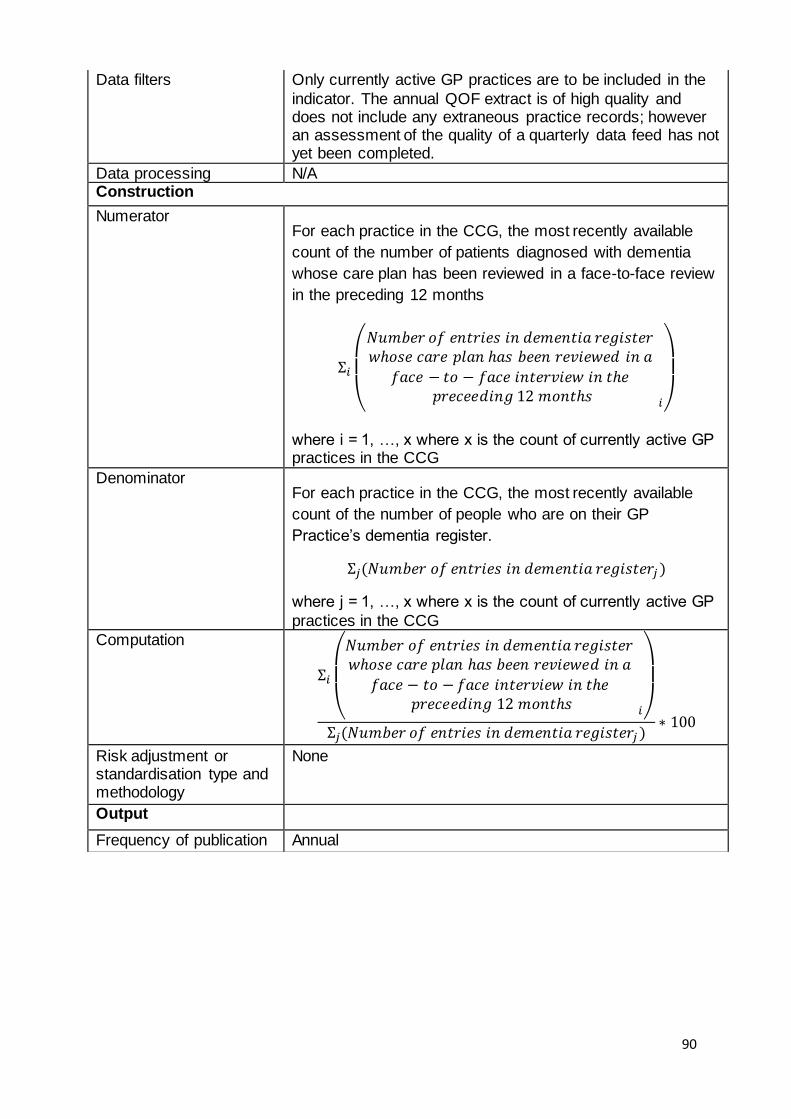
90
Data filters Only currently active GP practices are to be included in the
indicator. The annual QOF extract is of high quality and does not include any extraneous practice records; however an assessment of the quality of a quarterly data feed has not yet been completed.
Data processing N/A Construction
Numerator
Σ𝑖
(
𝑁𝑢𝑚𝑏𝑒𝑟 𝑜𝑓 𝑒𝑛𝑡𝑟𝑖𝑒𝑠 𝑖𝑛 𝑑𝑒𝑚𝑒𝑛𝑡𝑖𝑎 𝑟𝑒𝑔𝑖𝑠𝑡𝑒𝑟 𝑤ℎ𝑜𝑠𝑒 𝑐𝑎𝑟𝑒 𝑝𝑙𝑎𝑛 ℎ𝑎𝑠 𝑏𝑒𝑒𝑛 𝑟𝑒𝑣𝑖𝑒𝑤𝑒𝑑 𝑖𝑛 𝑎
𝑓𝑎𝑐𝑒 − 𝑡𝑜 − 𝑓𝑎𝑐𝑒 𝑖𝑛𝑡𝑒𝑟𝑣𝑖𝑒𝑤 𝑖𝑛 𝑡ℎ𝑒 𝑝𝑟𝑒𝑐𝑒𝑒𝑑𝑖𝑛𝑔 12 𝑚𝑜𝑛𝑡ℎ𝑠 𝑖)
For each practice in the CCG, the most recently available
count of the number of patients diagnosed with dementia
whose care plan has been reviewed in a face-to-face review
in the preceding 12 months
where i = 1, …, x where x is the count of currently active GP practices in the CCG
Denominator
Σ𝑗(𝑁𝑢𝑚𝑏𝑒𝑟 𝑜𝑓 𝑒𝑛𝑡𝑟𝑖𝑒𝑠 𝑖𝑛 𝑑𝑒𝑚𝑒𝑛𝑡𝑖𝑎 𝑟𝑒𝑔𝑖𝑠𝑡𝑒𝑟𝑗)
For each practice in the CCG, the most recently available
count of the number of people who are on their GP
Practice’s dementia register.
where j = 1, …, x where x is the count of currently active GP
practices in the CCG
Computation
Σ𝑖
(
𝑁𝑢𝑚𝑏𝑒𝑟 𝑜𝑓 𝑒𝑛𝑡𝑟𝑖𝑒𝑠 𝑖𝑛 𝑑𝑒𝑚𝑒𝑛𝑡𝑖𝑎 𝑟𝑒𝑔𝑖𝑠𝑡𝑒𝑟 𝑤ℎ𝑜𝑠𝑒 𝑐𝑎𝑟𝑒 𝑝𝑙𝑎𝑛 ℎ𝑎𝑠 𝑏𝑒𝑒𝑛 𝑟𝑒𝑣𝑖𝑒𝑤𝑒𝑑 𝑖𝑛 𝑎
𝑓𝑎𝑐𝑒 − 𝑡𝑜 − 𝑓𝑎𝑐𝑒 𝑖𝑛𝑡𝑒𝑟𝑣𝑖𝑒𝑤 𝑖𝑛 𝑡ℎ𝑒 𝑝𝑟𝑒𝑐𝑒𝑒𝑑𝑖𝑛𝑔 12 𝑚𝑜𝑛𝑡ℎ𝑠 𝑖)
Σ𝑗(𝑁𝑢𝑚𝑏𝑒𝑟 𝑜𝑓 𝑒𝑛𝑡𝑟𝑖𝑒𝑠 𝑖𝑛 𝑑𝑒𝑚𝑒𝑛𝑡𝑖𝑎 𝑟𝑒𝑔𝑖𝑠𝑡𝑒𝑟𝑗 )∗ 100
Risk adjustment or standardisation type and methodology
None
Output
Frequency of publication Annual
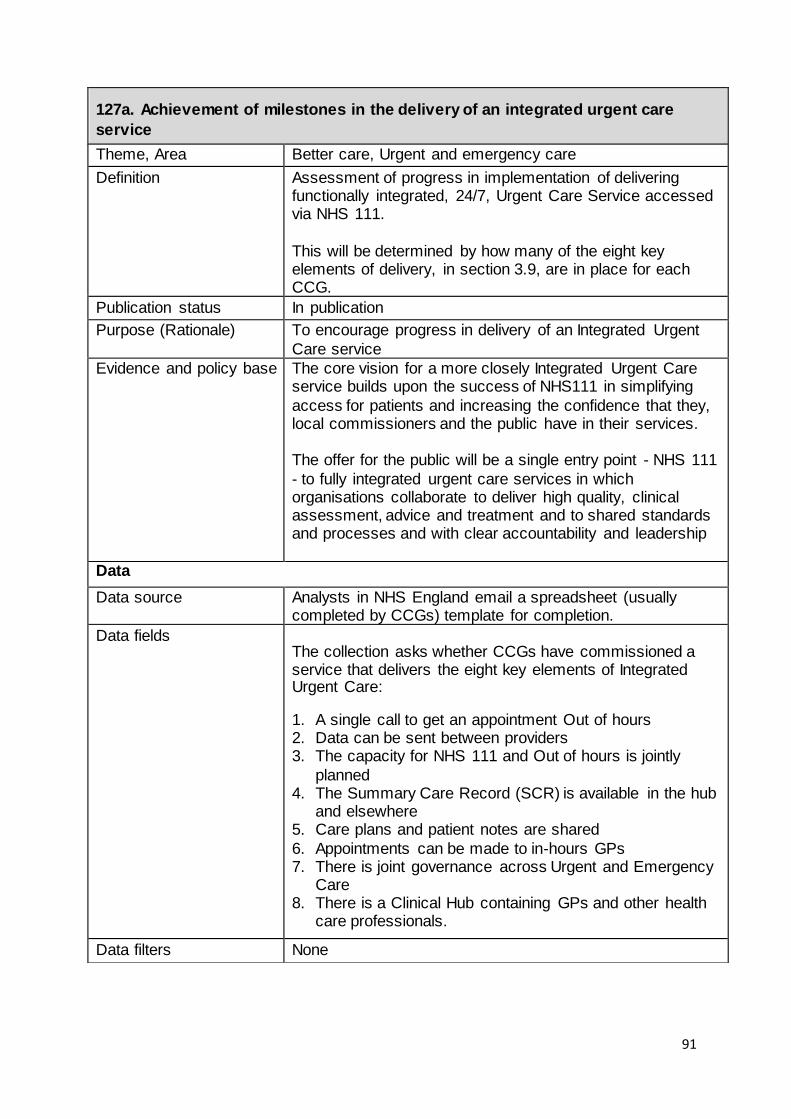
91
127a. Achievement of milestones in the delivery of an integrated urgent care
service
Theme, Area Better care, Urgent and emergency care
Definition Assessment of progress in implementation of delivering functionally integrated, 24/7, Urgent Care Service accessed via NHS 111.
This will be determined by how many of the eight key elements of delivery, in section 3.9, are in place for each CCG.
Publication status In publication
Purpose (Rationale) To encourage progress in delivery of an Integrated Urgent
Care service
Evidence and policy base The core vision for a more closely Integrated Urgent Care service builds upon the success of NHS111 in simplifying
access for patients and increasing the confidence that they, local commissioners and the public have in their services. The offer for the public will be a single entry point - NHS 111
- to fully integrated urgent care services in which organisations collaborate to deliver high quality, clinical assessment, advice and treatment and to shared standards and processes and with clear accountability and leadership
Data
Data source Analysts in NHS England email a spreadsheet (usually completed by CCGs) template for completion.
Data fields The collection asks whether CCGs have commissioned a service that delivers the eight key elements of Integrated Urgent Care:
1. A single call to get an appointment Out of hours 2. Data can be sent between providers 3. The capacity for NHS 111 and Out of hours is jointly
planned 4. The Summary Care Record (SCR) is available in the hub
and elsewhere 5. Care plans and patient notes are shared
6. Appointments can be made to in-hours GPs 7. There is joint governance across Urgent and Emergency
Care 8. There is a Clinical Hub containing GPs and other health
care professionals.
Data filters None

92
Data processing NHS England defines an area as delivering an Integrated
Urgent Care service if the responses show all eight elements are being delivered. If an area is only delivering seven, that is not enough to be delivering Integrated Urgent Care. However, this indicator shows how many of the eight
elements are being delivered. Construction
Numerator The number of the eight key elements of integrated urgent care that have answers of “Yes” for each CCG
Denominator The total number of questions.
Computation Yes/No as described under “data processing” above
Risk adjustment or standardisation type and methodology
None
Output
Frequency of publication Quarterly

93
127b. Emergency admissions for urgent care sensitive conditions
Theme, Area Better Care, Urgent and Emergency Care
Definition Rate of unplanned hospital admissions for urgent care sensitive conditions, per 100,000 registered patients.
Publication status In publication
Purpose (Rationale) To reduce admissions to hospital for urgent care sensitive conditions which should be managed within a well
performing UEC system without the need for an admission.
Evidence and policy base A well performing UEC system should treat people with the
right care, right place, first time. This should prevent unnecessary emergency admissions to hospital for conditions that should be dealt with effectively by the UEC system without the need for admission to hospital. These
are called “urgent care sensitive conditions”. All parts of the UEC system have a part to play from NHS 111 to Ambulance to EDs. As systems undergo transformation improvement in this metric needs to be encouraged.
This indicator extends the concept of ‘ambulatory care sensitive conditions’ by focussing on avoidable admissions for acute episodes of “urgent care sensitive conditions”. In this way UEC networks may monitor how effectively the
services within their range of responsibility are managing demand for care for urgent conditions over time without admitting the patient to a hospital bed.
This indicator covers a different group of conditions than those included in the “management of LTCs” measure, although there is some overlap. The “management of LTCs” measure identifies emergency admissions for “Ambulatory
Care Sensitive Conditions” which are those that should be dealt with out of hospital, including in primary care, to avoid an exacerbation occurring. For conditions which are included in both measures, once an exacerbation has
occurred a well performing UEC system should prevent the need for an admission.
Data
Data source Secondary Uses Services (SUS) data Please note that for the 2016/17 year end assessment
indicator values have been sourced from SUS (all historic values have been recalculated based on SUS data) GP-registered populations
Data fields Admission method, Primary diagnosis, Age, CCG of residence, Year, Quarter Admission_Method
Admission_Date Final_Derived_CCG age_on_admission

94
der_primary_diagnosis_code
Data filters Emergency = admission method starting with '2' See also list of conditions used in the Construction section
below
Data processing
Construction
Numerator Number of emergency admissions for UEC sensitive conditions (defined in below) of residents within CCG or network area for urgent conditions by year.
Finished Admission Episodes Emergency = admission method starting with '2' ‘Urgent conditions’ defined as the acute episodes which could be managed by a well-performing EUC system without
admission to an inpatient bed, where the primary diagnosis code:
COPD J40; J41; J42; J43; J44
Acute mental health crisis F Non-specific chest pain R072; R073; R074 Falls .74 years W0; W1
Non-specific abdominal pain
R10
Deep vein thrombosis I80; I81; I82
Cellulitis L03 Pyrexial child ,6 years and under
R50
Blocked tubes, catheters and feeding tubes
T830
Hypoglycaemia E10; E11; E12; E13; E14;
E15; E161; E162 Urinary tract infection N390
Angina I20
Epileptic fit G40; G41
Minor head injuries S00
Pyrexial child (0-6) and cause code fall for those 75+. Urgent care sensitive = based on main diagnosis and age
(plus cause code for falls)
Denominator GP-registered populations
Computation The rate of emergency admissions for UEC sensitive conditions per 100,000 population
Risk adjustment or
standardisation type and methodology
Direct Standardisation
The indicator values are directly age standardised. The directly age standardised rate is the rate a standard population (European standard) would have if that population were to experience the age specific rates of the
subject population. Output
Frequency of publication Quarterly

95
127c. Percentage of patients admitted, transferred or discharged from A&E within
4 hours
Theme, Area Better Care, Urgent and Emergency Care
Definition The number of patients admitted, transferred or discharged from A&E within 4 hours as a percentage of the total number
of attendances at A&E (for all types of A&E)
Publication status In publication
Purpose (Rationale) A&E waiting times form part of the NHS Constitution. NHS England must take into account the expected rights and pledges for patients that are made in the constitution when
assessing organisational delivery. This measure aims to encourage providers to improve health outcomes and patient experience of A&E.
Evidence and policy base The national operating standard is that 95% of patients should be admitted, transferred or discharged within 4 hours of their arrival at an A&E department.
This is the current indicator and measures the flow through the UEC system. Indicator development work is taking place as part of the UEC agenda and therefore new measures are likely to emerge to better reflect the transformed UEC
system for inclusion in the framework. Data
Data source NHS England: A&E attendances and emergency admissions monthly return (MSitAE via UNIFY2) is used to measure A&E performance against the 4 hour measure using figures
on number of attendances and number of attendances within 4 hours from arrival to admission, transfer or discharge. This data source is collected on a provider basis and not available by CCG.
https://www.england.nhs.uk/statistics/statistical-work-areas/ae-waiting-times-and-activity/ NHS Digital: A&E Hospital Episode Statistics. A&E Hospital Episode Statistics on the number of A&E attendances at
each provider and CCG is used to map provider data to CCGs and provide estimates of performance at CCG level.
Data fields A&E attendances and emergency admissions return:
Number of A&E attendances (all types of A&E)
Number of A&E attendances within 4 hours from arrival to admission, transfer or discharge (all types of A&E)
A&E Hospital Episode Statistics (for mapping to CCG):
Number of A&E attendances (all types of A&E)
Data filters None
Data processing Processing of A&E attendances and emergency admissions
return:

96
For the monthly A&E return, NHS Trusts, NHS Foundation
Trusts, Social Enterprises and GP Practices submit data to NHS England through a template via Unify2. Unify2 is NHS England’s standard online tool for the collection and sharing of NHS performance data. Once data is submitted and
signed-off locally, NHS England performs central validation checks to ensure good data quality. Mapping data from provider to CCG:
• HES A&E attendance data provides a breakdown of A&E attendances by provider and CCG. • HES A&E data is used to estimate what proportion of activity (A&E attendances from all types of A&E) from a
provider can be attributed to each CCG. • These proportions are applied to both numerator and denominator (provider based monthly collection figures on breaches and attendances) to assign numbers to each CCG
• These numbers are then used to calculate the estimated performance of the A&E 4 hour standard by CCG. • A limit of 1% is used - so any percentages of less than 1% for a mapping to a CCG were ignored in the calculations.
Thus the numbers of attendances/breaches does not correspond to the actual figures and should only be used as a basis for estimating performance.
Construction
Numerator Total number of patients who have a total time in A&E within
4 hours from arrival to admission, transfer or discharge (all types of A&E)
Denominator Total number of A&E attendances (all types of A&E)
Computation Percentage of patients admitted, transferred or discharged from A&E within 4 hours =
1-(Total number of patients who have a total time in A&E over 4 hours from arrival to admission, transfer or discharge / total number of attendances) The total number of A&E attendances, is defined as "An
unplanned attendance when the A&E attendance category = 1 or 3", For both total attendances, and those where total time is within 4 hours, all types of A&E are included in the measure.
Note the data on attendances and those within 4 hours should be apportioned to CCG as described above.
Risk adjustment or
standardisation type and methodology
None
Output
Frequency of publication Quarterly
127d. Ambulance waits
Theme, Area Better Care, Urgent and Emergency Care
Definition The proportion of ambulances arriving at Category A Red 1 incident within 8 minutes.
Publication status Not currently in publication
Purpose (Rationale) Category A Red 1 calls are the most time critical of the calls
received by Ambulance Trusts, and cover cardiac arrest patients who are not breathing and do not have a pulse, and other severe conditions such as airway obstruction. Rapid response to this category of calls improves patient
outcomes. The purpose of this measure is to encourage a rapid response to these time critical calls to benefit patient outcomes.
Evidence and policy base The handbook to the NHS constitution states 75% of
Category A Red 1 calls should receive a response within 8 minutes.
Data
Data source Ambulance System Indicator data submitted monthly by the 11 England Ambulance Trusts. Submission and subsequent
publication of data through Unify2 portal. Published data available from: https://www.england.nhs.uk/statistics/statistical-work-areas/ambulance-quality-indicators/
Data fields AQI Guidance V1.4 published at https://www.england.nhs.uk/statistics/statistical-work-areas/ambulance-quality-indicators/
HQU03_1_1_3 -The number of Red 1 calls resulting in an emergency response arriving at the scene of the incident within 8 minutes
HQU03_1_1_4 - The number of Red 1 calls resulting in an emergency response arriving at the scene of the incident
Data filters
Data processing Data specification is published on Statistical Work Area
website. Data collected via Unify 2 template and collection. Once complete data is downloaded for validation. Validation failures are reported back to data suppliers. Finalised data is published on the Statistical Work Area of the NHS England
website and made public on Unify2 system. Construction
Numerator The number of Category A Red 1 calls receiving ambulance response within 8 minutes
Denominator The number of Category A Red 1 calls received by the Ambulance Trusts

97
Computation The number of ambulances arriving at Category A Red 1
calls within 8 minutes divided by the total Category A Red 1 calls received by the Ambulance Trusts, presented as a percentage. The performance of individual ambulance trusts will be
mapped to individual CCGs in a ‘One to Many’ relationship. A lookup of the ambulance trusts to CCGs is available in the tab labelled ‘CCG to Ambulance Trust’ of the Ambulance time series spreadsheet available
https://www.england.nhs.uk/statistics/wp-content/uploads/sites/2/2015/06/Ambulance-Systems-Indicators-December-2015-web-file-v23.xlsx
Risk adjustment or standardisation type and methodology
None
Output
Frequency of publication Quarterly

98
127e. Delayed transfers of care per 100,000 population
Theme, Area Better Care, Urgent and Emergency Care
Definition Average Delayed transfers of care (delayed days) per day for all reasons per 100,000 population
Publication status In publication
Purpose (Rationale) To encourage minimising delayed transfers of care, enable
timely discharge or transfer to the most appropriate care setting and promote smooth flow through the system for medically optimised patients. This is one of the desired outcomes of social care.
Evidence and policy base Measuring delayed transfers of care is an important marker of the effective joint working of local partners, and is a measure of the effectiveness of the interface between health
and social care services. Minimising delayed transfers of care, enabling timely discharge or transfer to the most appropriate care setting and promoting smooth flow through the system for medically optimised patients, is one of the
desired outcomes of social care. Current data and indicators measure the flow through the UEC system. Indicator development work is taking place as
part of the UEC agenda and therefore new measures are likely to emerge to better reflect the transformed UEC system for inclusion in the framework.
Data
Data source Monthly Delayed Transfers of Care Return (MSitDT via
UNIFY2) is used to measure Delayed Transfers of Care. This data source is collected on a local authority and provider basis and is not available by CCG. https://www.england.nhs.uk/statistics/statistical-work-
areas/delayed-transfers-of-care/ Exeter database of GP registrations is used to map LA data
to CCG level.
ONS population estimates for 2014 by district are used to calculate the no of delayed days per 100,000. These are obtained from the NHS Digital Population Statistics Database.
Data fields Number of delayed days during the reporting period Population estimate for local authority (aged 18 +)
Population estimates for 18+ are used because the Delayed Transfers of Care collection only relates to those aged 18 and over
Data filters
Data processing 1. Processing of Delayed Transfers of Care return and computation of average daily number:

99
For the monthly DTOC return, organisations submit data to
NHS England through a template via Unify2. Unify2 is NHS
England’s standard online tool for the collection and sharing
of NHS performance data. Once data is submitted and
signed-off locally, NHS England performs central validation
checks to ensure good data quality.
Average number per day: Divide the number of delayed
days across the reporting period by the number of days
across the reporting period.
2. Mapping data from LA to CCG:
Exeter database provides population estimates based
on GP registrations by LA and CCG.
Estimate what proportion of activity (delayed days) from an LA can be attributed to each CCG. Proportions based on population estimated proportions.
These proportions are applied to the average number of delayed days per day for each LA to assign numbers to each CCG. Giving an estimated average daily number of delayed days per CCG.
3. Adjust for population Calculate the rate per 100,000 population using ONS
population estimates (aged 18+) for CCG level
Construction
Numerator Average number of delayed days per day (for all reasons)
Denominator Population estimates for CCG (aged 18 +)
Computation Figures are calculated for each LA as outlined below: Map LA figures to CCG
Apply the proportions of each LA which should be assigned
to each CCG to the LA figures to provide CCG level estimates, then calculate the estimated rate per 100,000. Delayed transfers of care (delayed days) per day per
100,000 population = (X/Y) x 100,000 Where
X = average delayed days (per day) for CCG (number of delayed days during the reporting period for CCG/number of days over the reporting period)
and

100
Y = Population estimates for local authority (aged 18 +) for CCG
Risk adjustment or standardisation type and methodology
None
Output
Frequency of publication Quarterly

101
127f. Population use of hospital beds following emergency admission
Theme, Area Better Care, Urgent and Emergency Care
Definition Total length of all Finished Consultant Episodes where the patient’s episode finished in the quarter and their admission was from a source coded as an emergency, excluding day cases, per 1,000 population, adjusted for age, sex and need
Publication status In publication
Purpose (Rationale) May indicate poor operation of primary and community services
Evidence and policy base The indicator focuses on the extent of utilisation of
healthcare resources from emergency sources and will be used to address critical business question regarding the extent of local health and care integration. Areas with a lower rate of emergency bed days are likely to have services
in place which support people to remain independent and support timely discharge if they do have to be admitted to hospital
Data
Data source Secondary Uses Service (SUS) data to calculate bed days
Please note that for the 2016/17 year end assessment indicator values have been sourced from SUS (all historic values have been recalculated based on SUS data)
GP registration system linked to ONS postcode directory to derive LSOAs and attached index of multiple deprivation quintile.
National Health Applications and Infrastructure Services (NHAIS) to provide population counts by age, sex and area. Population data is available by restricted access, an aggregated data file is assembled in NHS England to LSOA
from postcode of residency using the ONS postcode directory and can be obtained:
NHAIS
http://www.content.digital.nhs.uk/catalogue/PUB23139
Postcode directory
https://data.gov.uk/dataset/nhs-postcode-directory-latest-centroids
Need will be assessed through the Index of Multiple Deprivation (IMD) 2015
https://www.gov.uk/government/statistics/english-indices-of-deprivation-2015

102
Data fields NHAIS
Year, Quarter, CCG, LSOA, Male 0-4, Male 5-9, Male 10-14, Male 15-19, Male 20-24, Male 25-29, Male 30-34, Male 35-39., Male 40-44, Male 45-
49, Male 50-54, Male 55-59, Male 60-64, Male 65-69, Male 70-74,Male 75-79, Male 80-84, Male 85+ Female 0-4, Female 5-9, Female 10-14, Female 15-19, Female 20-24, Female 25-29, Female 30-34, Female 35-
39., Female 40-44, Female 45-49, Female 50-54, Female 55-59, Female 60-64, Female 65-69, Female 70-74,Female 75-79, Female 80-84, Female 85+
SUS FCE, Method of admission (admimeth), Episode end date (epiend), CCG of Responsibility Episode
(ccg_responsibility), duration (epidur), Age on admission (admiage), Sex of patient (sex), the 2011 Census lower layer super output area (LSOA11)
Data filters FCE =1 to ensure only finished episodes are considered in the calculation.
Episode end date between 'XXX' and 'YYY' to ensure the correct bed days are calculated for the period
Admimeth in (‘21’,‘22’,’23’,’24’,’2A’,’2B’,’2C’,’2D’,‘28’)
Treatment function code not in
('501','560','700','710','711','712','713','715','720','721','722', '723','724','725','726','727')
These are the codes associated with midwifery and mental health. "Day cases" are always elective, so they are
excluded through the choice of data fields (admimeth = emergency).
Data processing Once extracted the data will be processed into the required geography.
Construction
Numerator For each age/sex banding the total duration of all Finished
Consultant Episodes (FCEs) where the patient’s episode finished in the quarter and their admission was from a source coded as an emergency
Denominator Registered population by age/sex/deprivation quintile bands associated with the area / 1000
Computation Numerator / Denominator
Risk adjustment or standardisation type and methodology
Indirect Standardisation
Standardised by age and gender to the national population

103
rates at Q1 2015/16.
Output
Frequency of publication Quarterly
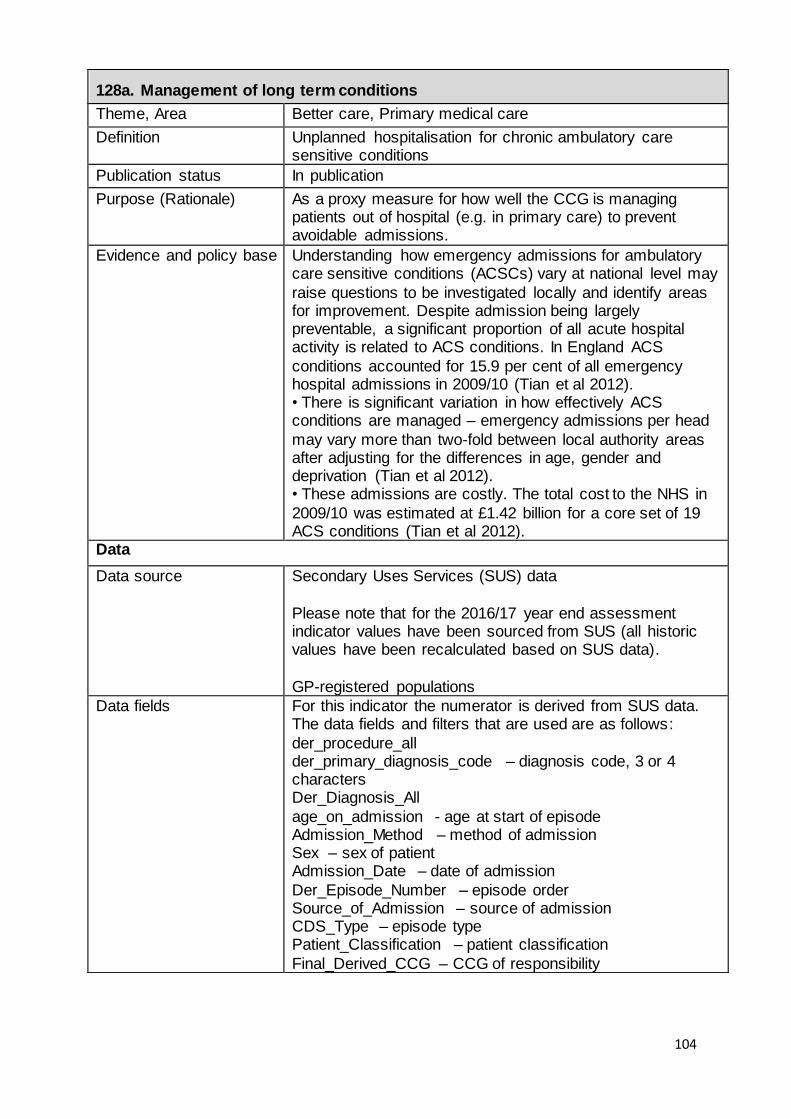
104
128a. Management of long term conditions
Theme, Area Better care, Primary medical care
Definition Unplanned hospitalisation for chronic ambulatory care sensitive conditions
Publication status In publication
Purpose (Rationale) As a proxy measure for how well the CCG is managing patients out of hospital (e.g. in primary care) to prevent avoidable admissions.
Evidence and policy base Understanding how emergency admissions for ambulatory care sensitive conditions (ACSCs) vary at national level may
raise questions to be investigated locally and identify areas for improvement. Despite admission being largely preventable, a significant proportion of all acute hospital activity is related to ACS conditions. In England ACS
conditions accounted for 15.9 per cent of all emergency hospital admissions in 2009/10 (Tian et al 2012). • There is significant variation in how effectively ACS conditions are managed – emergency admissions per head
may vary more than two-fold between local authority areas after adjusting for the differences in age, gender and deprivation (Tian et al 2012). • These admissions are costly. The total cost to the NHS in
2009/10 was estimated at £1.42 billion for a core set of 19 ACS conditions (Tian et al 2012).
Data
Data source Secondary Uses Services (SUS) data
Please note that for the 2016/17 year end assessment indicator values have been sourced from SUS (all historic values have been recalculated based on SUS data).
GP-registered populations
Data fields For this indicator the numerator is derived from SUS data. The data fields and filters that are used are as follows:
der_procedure_all der_primary_diagnosis_code – diagnosis code, 3 or 4 characters Der_Diagnosis_All
age_on_admission - age at start of episode Admission_Method – method of admission Sex – sex of patient Admission_Date – date of admission
Der_Episode_Number – episode order Source_of_Admission – source of admission CDS_Type – episode type Patient_Classification – patient classification
Final_Derived_CCG – CCG of responsibility

105
Data filters There is an extensive list.
Please the link to specification of the equivalent CCG OIS indicator below (pp 6-9) although the CCG IAF equivalent indicator is sourced from SUS instead of HES. https://indicators.hscic.gov.uk/download/Clinical
Commissioning Group Indicators/Specification/CCG_2.6_I00757_S.pdf
Data processing
Construction
Numerator Secondary Uses Service (SUS) Admitted Patient Care (APC) data, provided by the Health and Social Care
Information Centre (NHS Digital).
Denominator Registered patient counts by single year of age and sex from the National Health Application & Infrastructure
Services (NHAIS), commonly known as ’Exeter’ System.
Computation This indicator is a rate directly standardised by age and sex per 100,000 registered patients.
Risk adjustment or standardisation type and methodology
The directly age and sex standardised rate (DSR) is the rate of events that would occur in a standard population if that population were to experience the age and sex specific rates
of the subject population. The age and sex specific rates of the subject population are applied to the age and sex structure of the standard population.
where: Oi is the observed number of events in the local or subject population in age and sex group i;
ni is the number of individuals in the local or subject denominator population in age and sex group i; wi is the number of individuals in the standard population in age and sex group i.
The standard population used for the direct method is the England population in the appropriate ONS mid-year population estimates. The age groups used are: 0-4, 5-9,
10-14, 15-18, 19-24, 25-29…80-84, 85+. Output
Frequency of publication Quarterly

106
128b. Patient experience of GP services
Theme, Area Better Care, Primary Medical Care
Definition This indicator is the weighted percentage of people who report through the GP Patient Survey that their overall experience of GP services was ‘fairly good’ or ‘very good’
Publication status In publication
Purpose (Rationale) To assess the overall patient experience of GP services within CCGs
Evidence and policy base This indicator is part of the new CCG assessment
framework which is expected as part of the government’s mandate to the NHS. This indicator specifically relates to objective 6: To improve out-of-hospital care.
This requires more services provided out of hospitals, a
larger primary care workforce and greater integration with social care, so that care is more joined up to meet people’s physical health, mental health and social care needs. NHS England is expected to ensure everyone has easier and
more convenient access to GP services, including appointments at evenings and weekends where this is more convenient for them, and effective access to urgent care 24 hours a day, seven days a week.
An overall patient experience measure will inform if patients are finding GP services satisfactory. Good experience of GP
services will indicate that practices within a CCG’s remit are delivering good services for their population and in context this would be while delivering additional services. The indicator will help to pinpoint areas who need to do more to
achieve Data
Data source GP Patient Survey (GPPS) found at: https://gp-patient.co.uk/surveys-and-reports
Data fields All data fields used for this indicator are taken from the GP Patient Survey. Data is taken from the weighted CCG report (.csv) found
on the GP Patient Survey webpage:
https://gp-patient.co.uk/surveys-and-reports The data field names below are those used in the most recent publication; descriptions of the fields (referred to as
variables) can be found on the GP Patient Survey webpage: https://gp-patient.co.uk/surveys-and-reports Data fields used are: 1. Within Question 28: “Overall, how would you describe
your experience of your GP surgery?” 1.1 Q28base 1.2 Q28_1 1.3 Q28_2
2. Overall, within the survey:
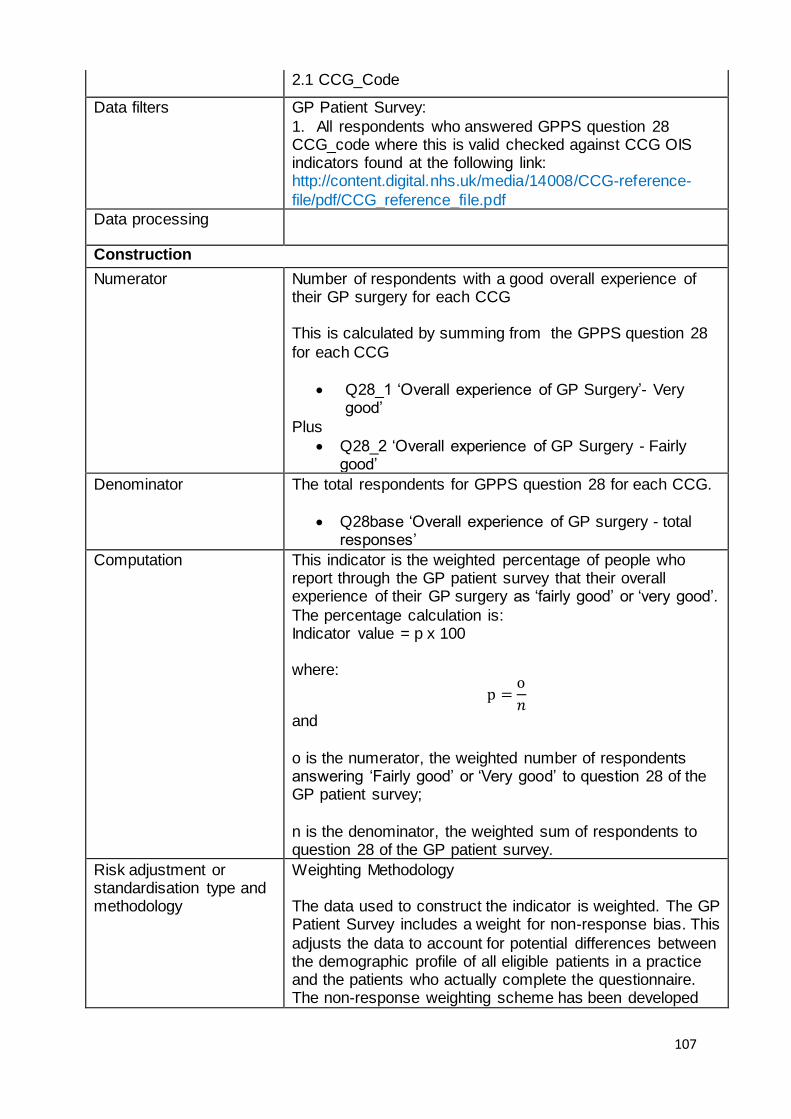
107
2.1 CCG_Code
Data filters GP Patient Survey:
1. All respondents who answered GPPS question 28 CCG_code where this is valid checked against CCG OIS indicators found at the following link: http://content.digital.nhs.uk/media/14008/CCG-reference-
file/pdf/CCG_reference_file.pdf
Data processing
Construction
Numerator Number of respondents with a good overall experience of their GP surgery for each CCG This is calculated by summing from the GPPS question 28
for each CCG
Q28_1 ‘Overall experience of GP Surgery’- Very good’
Plus
Q28_2 ‘Overall experience of GP Surgery - Fairly good’
Denominator The total respondents for GPPS question 28 for each CCG.
Q28base ‘Overall experience of GP surgery - total responses’
Computation This indicator is the weighted percentage of people who report through the GP patient survey that their overall experience of their GP surgery as ‘fairly good’ or ‘very good’.
The percentage calculation is: Indicator value = p x 100 where:
p =o
𝑛
and
o is the numerator, the weighted number of respondents answering ‘Fairly good’ or ‘Very good’ to question 28 of the GP patient survey;
n is the denominator, the weighted sum of respondents to question 28 of the GP patient survey.
Risk adjustment or standardisation type and methodology
Weighting Methodology The data used to construct the indicator is weighted. The GP Patient Survey includes a weight for non-response bias. This
adjusts the data to account for potential differences between the demographic profile of all eligible patients in a practice and the patients who actually complete the questionnaire. The non-response weighting scheme has been developed

108
by Ipsos MORI, incorporating elements such as age and
gender of the survey respondent as well as factors from the area where the respondent lives such as level of deprivation, ethnicity profile, ACORN classification and so on, which have been shown to impact on non-response bias within the
GP Patient Survey. Ipsos MORI are also investigating whether respondents have systematically different outcomes to non-respondents, even after the non-response bias weighting has been applied.
Further information on the weighting can be found in the latest technical annex at the following webpage. https://gp-patient.co.uk/surveys-and-reports
Output
Frequency of publication Annual
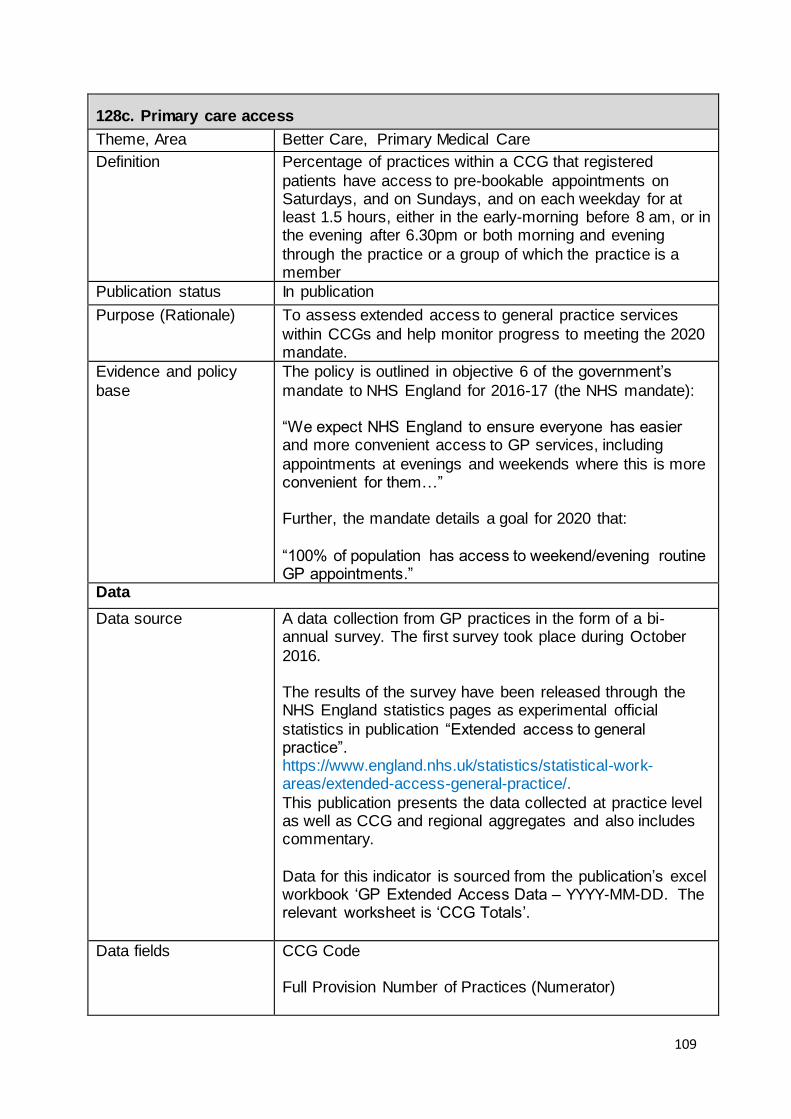
109
128c. Primary care access
Theme, Area Better Care, Primary Medical Care
Definition Percentage of practices within a CCG that registered
patients have access to pre-bookable appointments on Saturdays, and on Sundays, and on each weekday for at least 1.5 hours, either in the early-morning before 8 am, or in the evening after 6.30pm or both morning and evening
through the practice or a group of which the practice is a member
Publication status In publication
Purpose (Rationale) To assess extended access to general practice services
within CCGs and help monitor progress to meeting the 2020 mandate.
Evidence and policy
base
The policy is outlined in objective 6 of the government’s
mandate to NHS England for 2016-17 (the NHS mandate): “We expect NHS England to ensure everyone has easier and more convenient access to GP services, including
appointments at evenings and weekends where this is more convenient for them…” Further, the mandate details a goal for 2020 that:
“100% of population has access to weekend/evening routine GP appointments.”
Data
Data source A data collection from GP practices in the form of a bi-annual survey. The first survey took place during October
2016. The results of the survey have been released through the NHS England statistics pages as experimental official
statistics in publication “Extended access to general practice”. https://www.england.nhs.uk/statistics/statistical-work-areas/extended-access-general-practice/.
This publication presents the data collected at practice level as well as CCG and regional aggregates and also includes commentary.
Data for this indicator is sourced from the publication’s excel workbook ‘GP Extended Access Data – YYYY-MM-DD. The relevant worksheet is ‘CCG Totals’.
Data fields CCG Code Full Provision Number of Practices (Numerator)
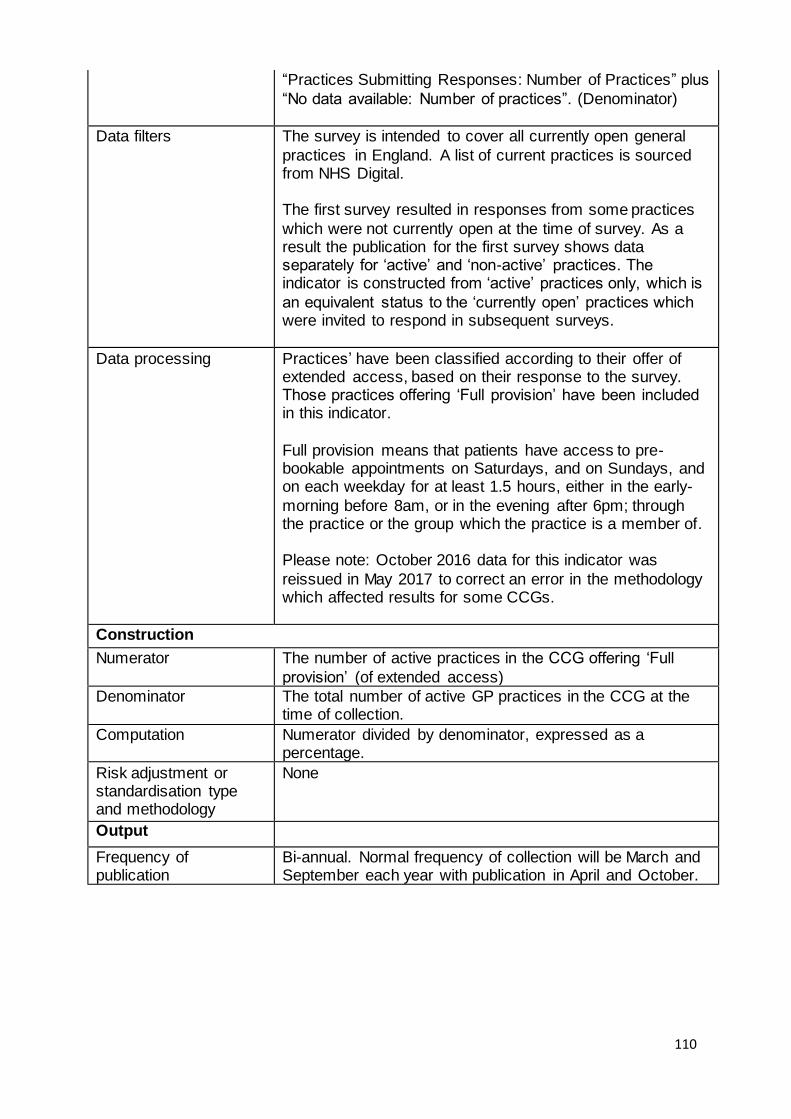
110
“Practices Submitting Responses: Number of Practices” plus
“No data available: Number of practices”. (Denominator)
Data filters The survey is intended to cover all currently open general
practices in England. A list of current practices is sourced from NHS Digital. The first survey resulted in responses from some practices
which were not currently open at the time of survey. As a result the publication for the first survey shows data separately for ‘active’ and ‘non-active’ practices. The indicator is constructed from ‘active’ practices only, which is
an equivalent status to the ‘currently open’ practices which were invited to respond in subsequent surveys.
Data processing Practices’ have been classified according to their offer of extended access, based on their response to the survey. Those practices offering ‘Full provision’ have been included in this indicator.
Full provision means that patients have access to pre-bookable appointments on Saturdays, and on Sundays, and on each weekday for at least 1.5 hours, either in the early-
morning before 8am, or in the evening after 6pm; through the practice or the group which the practice is a member of. Please note: October 2016 data for this indicator was
reissued in May 2017 to correct an error in the methodology which affected results for some CCGs.
Construction
Numerator The number of active practices in the CCG offering ‘Full
provision’ (of extended access)
Denominator The total number of active GP practices in the CCG at the time of collection.
Computation Numerator divided by denominator, expressed as a percentage.
Risk adjustment or standardisation type and methodology
None
Output
Frequency of publication
Bi-annual. Normal frequency of collection will be March and September each year with publication in April and October.

111
128d. Primary care workforce
Theme, Area Better Care, Primary Medical Care
Definition Number of GPs and practice nurses (full-time equivalent) per 1,000 weighted patients by CCG
Publication status In publication
Purpose (Rationale) To provide a starting point for a conversation about whether GP services in the CCG have the appropriate workforce.
Evidence and policy base This indicator specifically relates to objective 6 of the government’s mandate to the NHS for 2016/17: To improve out-of-hospital care.
This requires more services provided out of hospitals, a larger primary care workforce and greater integration with social care, so that care is more joined up to meet people’s
physical health, mental health and social care needs. NHS England is expected to ensure everyone has easier and more convenient access to GP services, including appointments at evenings and weekends where this is more
convenient for them, and effective access to urgent care 24 hours a day, seven days a week. This workforce indicator will support measurement of the
larger primary care workforce element of the mandate. A similar indicator is included in MyNHS (but using actual instead of weighted population figures)
Data
Data source The counts of GPs, nurses and other clinical staff are from the workforce Minimum Data Set, wMDS. Data from the
wMDS are published quarterly by NHS Digital as “General and Personal Medical Services” data. Every other publication contains the detailed information required for this indicator. At time of writing, the most recent such
publication, for September 2016, can be found here: http://content.digital.nhs.uk/catalogue/PUB23693 Weighted patient data is sourced from the allocation formula
published by NHS England. This can be found at https://www.england.nhs.uk/2016/04/allocations-tech-guide-16-17/
Data fields The annual uplift of CCG populations is calculated from the 2014 ONS subnational population projections. Data are found at:
https://www.ons.gov.uk/peoplepopulationandcommunity/populationandmigration/populationprojections/datasets/subnationalpopulationprojectionsexplorabledatasets
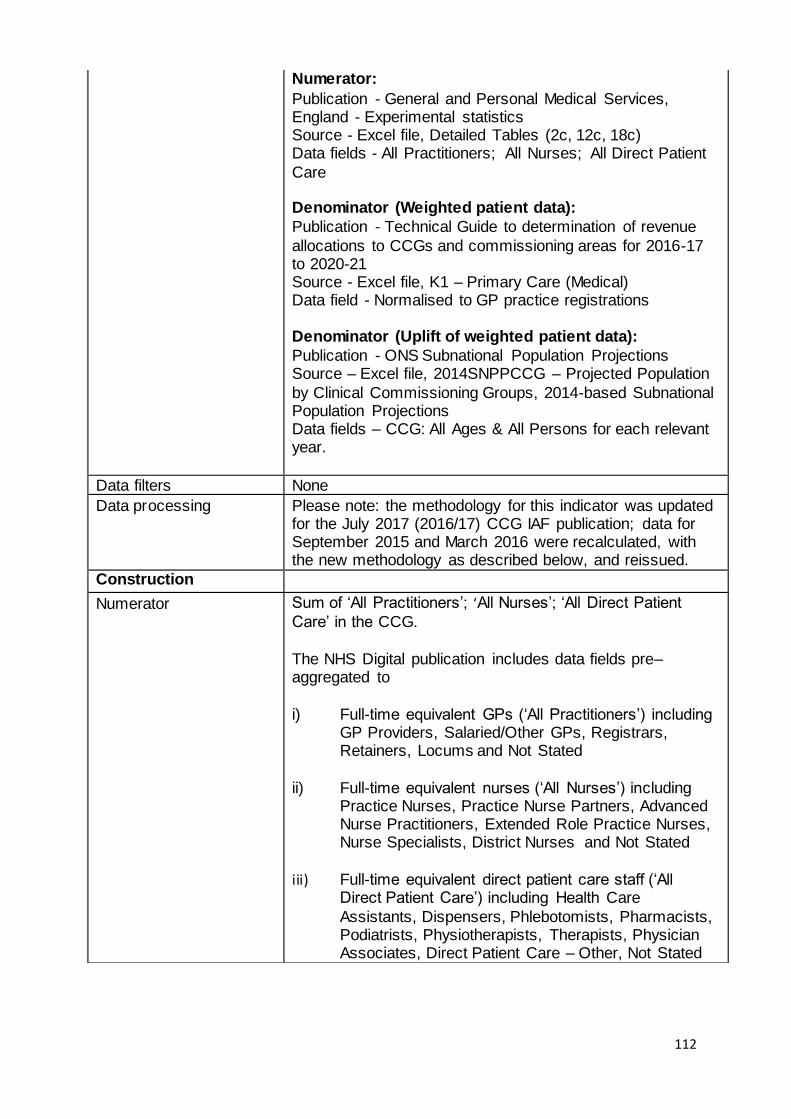
112
Numerator:
Publication - General and Personal Medical Services, England - Experimental statistics Source - Excel file, Detailed Tables (2c, 12c, 18c) Data fields - All Practitioners; All Nurses; All Direct Patient
Care Denominator (Weighted patient data):
Publication - Technical Guide to determination of revenue
allocations to CCGs and commissioning areas for 2016-17 to 2020-21 Source - Excel file, K1 – Primary Care (Medical) Data field - Normalised to GP practice registrations
Denominator (Uplift of weighted patient data):
Publication - ONS Subnational Population Projections Source – Excel file, 2014SNPPCCG – Projected Population
by Clinical Commissioning Groups, 2014-based Subnational Population Projections Data fields – CCG: All Ages & All Persons for each relevant year.
Data filters None
Data processing Please note: the methodology for this indicator was updated for the July 2017 (2016/17) CCG IAF publication; data for September 2015 and March 2016 were recalculated, with the new methodology as described below, and reissued.
Construction
Numerator Sum of ‘All Practitioners’; ‘All Nurses’; ‘All Direct Patient
Care’ in the CCG.
The NHS Digital publication includes data fields pre–aggregated to
i) Full-time equivalent GPs (‘All Practitioners’) including GP Providers, Salaried/Other GPs, Registrars, Retainers, Locums and Not Stated
ii) Full-time equivalent nurses (‘All Nurses’) including Practice Nurses, Practice Nurse Partners, Advanced Nurse Practitioners, Extended Role Practice Nurses, Nurse Specialists, District Nurses and Not Stated
iii) Full-time equivalent direct patient care staff (‘All
Direct Patient Care’) including Health Care
Assistants, Dispensers, Phlebotomists, Pharmacists, Podiatrists, Physiotherapists, Therapists, Physician Associates, Direct Patient Care – Other, Not Stated
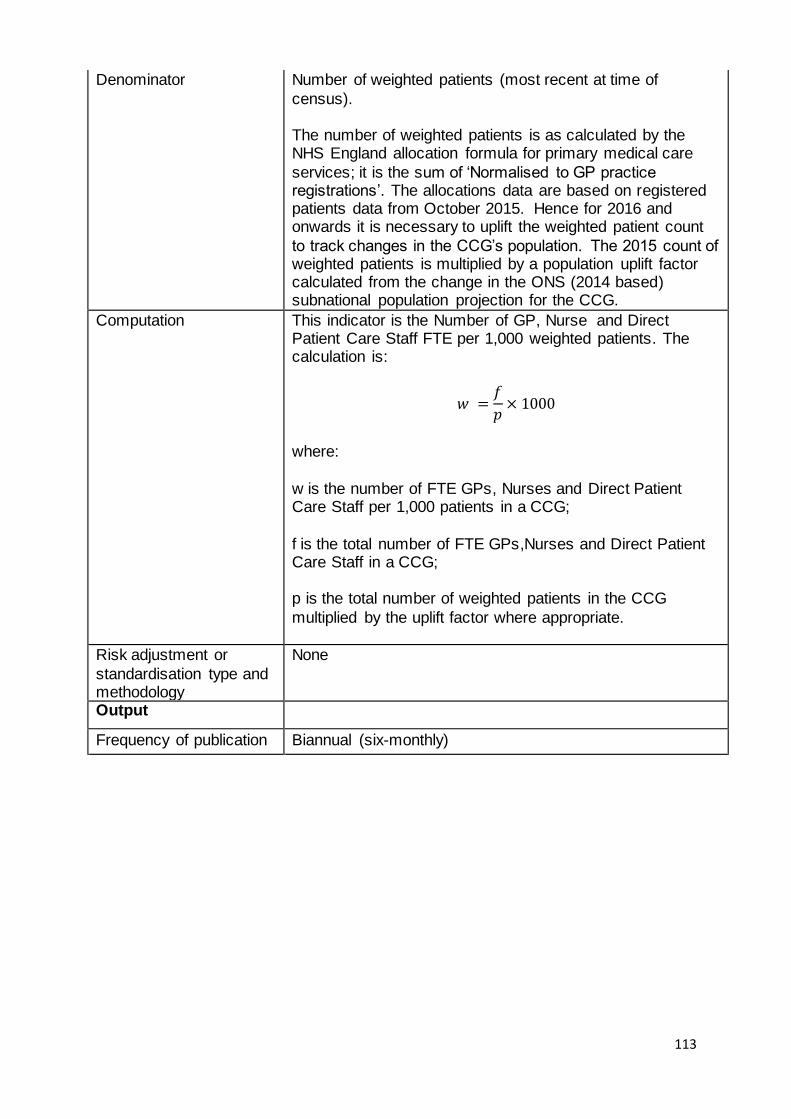
113
Denominator Number of weighted patients (most recent at time of
census). The number of weighted patients is as calculated by the NHS England allocation formula for primary medical care
services; it is the sum of ‘Normalised to GP practice registrations’. The allocations data are based on registered patients data from October 2015. Hence for 2016 and onwards it is necessary to uplift the weighted patient count
to track changes in the CCG’s population. The 2015 count of weighted patients is multiplied by a population uplift factor calculated from the change in the ONS (2014 based) subnational population projection for the CCG.
Computation
𝑤 =𝑓
𝑝× 1000
This indicator is the Number of GP, Nurse and Direct Patient Care Staff FTE per 1,000 weighted patients. The calculation is:
where:
w is the number of FTE GPs, Nurses and Direct Patient Care Staff per 1,000 patients in a CCG;
f is the total number of FTE GPs,Nurses and Direct Patient Care Staff in a CCG; p is the total number of weighted patients in the CCG
multiplied by the uplift factor where appropriate.
Risk adjustment or
standardisation type and methodology
None
Output
Frequency of publication Biannual (six-monthly)

114
129a. Patients waiting 18 weeks or less from referral to hospital treatment
Theme, Area Better care, Elective access
Definition The percentage of patients waiting to start non-emergency consultant-led treatment who were waiting less than 18 weeks at the end of the reporting period
Publication status In publication
Purpose (Rationale) To measure and encourage compliance with this constitutional measure (operational standard)
Evidence and policy base Waiting times matter to patients. Most patients want to be referred, diagnosed and treated as soon as possible. Patients can and do use waiting times information to inform their choice of where to be referred and also to understand
how long they might expect to wait before starting their treatment. The NHS Improvement Plan (June 2004) set out the aim
that no-one would have to wait longer than a maximum of 18 weeks from the time they are referred for a hospital operation by their GP until the time they have that operation. At the time there was little evidence in the UK on acceptable
waiting times, but work showed that once waiting times were down to three months patients would not pay for marginal improvements in the private sector. Also some evidence from the EU showed that the maximum referral to treatment waiting time at which the public ceased to be concerned was
about four months. Implementation of the aim was supported by a Clinical Advisory Group representing all specialties. Further professional endorsement came in June 2015, when Simon Stevens and the Secretary of State for
Health accepted a recommendation from Sir Bruce Keogh that the incomplete pathway operational standard should became the sole measure of patients’ constitutional right to start treatment within 18 weeks (the incomplete standard
has been in place since 2012/13, and before that the completed pathway standards were in place from 2008/09). The mandate to NHS England sets the objective of
maintaining and improving performance against core standards, which include the RTT incomplete pathway standard. The standard is also a quality requirement in the NHS Standard Contract. The NHS Constitution sets out that
patients can expect to start consultant-led treatment within a maximum of 18 weeks from referral for non-urgent conditions if they want this and it is clinically appropriate. The legislative basis for this right is the National Health
Service Commissioning Board and Clinical Commissioning Groups (Responsibilities and Standing Rules) Regulations 2012, as amended by the National Health Service Commissioning Board and Clinical Commissioning Groups

115
(Responsibilities and Standing Rules) (Amendment) (No. 2)
Regulations 2015. This legislation places a duty on commissioners to meet the NHS operational standard for Referral to Treatment (RTT) waiting times that a minimum of 92% of patients yet to start their non-urgent consultant-led
treatment should have been waiting less than 18 weeks from referral. NHS providers and commissioners need the RTT data to ensure they are meeting their patients’ legal right, and to identify where action is needed to reduce
inappropriately long waiting times.
Data
Data source NHS England UNIFY2 system
https://www.england.nhs.uk/statistics/statistical-work-areas/rtt-waiting-times/
Data fields Total number of incomplete pathways (Total for RTT Part Name, Part_2) Total within 18 weeks (sum of ‘Gt 00 To 01 Weeks SUM 1’ to ‘Gt 17 To 18 Weeks SUM 1’ for RTT Part Name, Part_2)
Data filters RTT pathways commissioned by non-English commissioners are excluded from the calculation.
Data processing
Construction
Numerator Number of incomplete pathways within 18 weeks at the end of the reporting period
Denominator Total number of incomplete pathways at the end of the reporting period.
Computation Numerator as percentage of denominator
Risk adjustment or standardisation type and
methodology
None
Output
Frequency of publication Quarterly
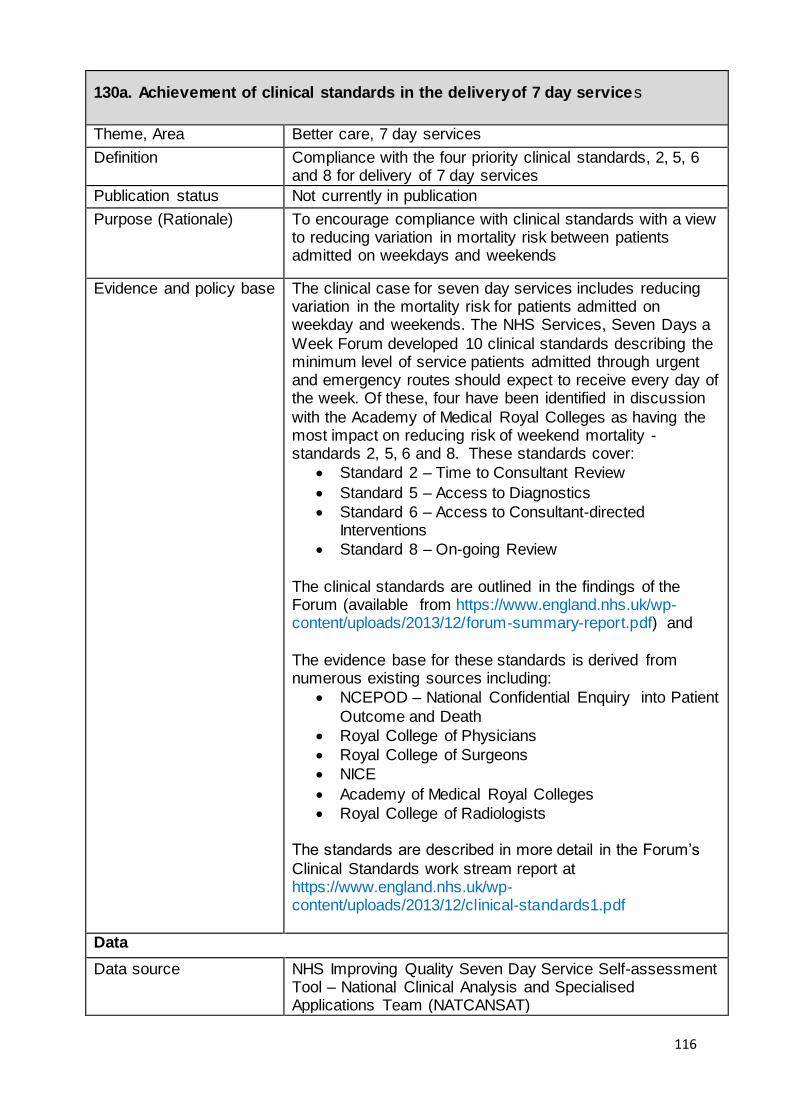
116
130a. Achievement of clinical standards in the delivery of 7 day services
Theme, Area Better care, 7 day services
Definition Compliance with the four priority clinical standards, 2, 5, 6 and 8 for delivery of 7 day services
Publication status Not currently in publication
Purpose (Rationale) To encourage compliance with clinical standards with a view to reducing variation in mortality risk between patients admitted on weekdays and weekends
Evidence and policy base The clinical case for seven day services includes reducing variation in the mortality risk for patients admitted on weekday and weekends. The NHS Services, Seven Days a
Week Forum developed 10 clinical standards describing the minimum level of service patients admitted through urgent and emergency routes should expect to receive every day of the week. Of these, four have been identified in discussion
with the Academy of Medical Royal Colleges as having the most impact on reducing risk of weekend mortality - standards 2, 5, 6 and 8. These standards cover:
Standard 2 – Time to Consultant Review
Standard 5 – Access to Diagnostics
Standard 6 – Access to Consultant-directed Interventions
Standard 8 – On-going Review
The clinical standards are outlined in the findings of the Forum (available from https://www.england.nhs.uk/wp-content/uploads/2013/12/forum-summary-report.pdf) and
The evidence base for these standards is derived from numerous existing sources including:
NCEPOD – National Confidential Enquiry into Patient
Outcome and Death
Royal College of Physicians
Royal College of Surgeons
NICE
Academy of Medical Royal Colleges
Royal College of Radiologists
The standards are described in more detail in the Forum’s
Clinical Standards work stream report at https://www.england.nhs.uk/wp-content/uploads/2013/12/clinical-standards1.pdf
Data
Data source NHS Improving Quality Seven Day Service Self-assessment Tool – National Clinical Analysis and Specialised Applications Team (NATCANSAT)

117
Data fields The indicator will be drawn from the responses to the key
survey questions covering the 4 priority clinical standards. These are set out below. Clinical Standard 2: Percentage of patients reviewed
by an appropriate consultant within 14 hours of admission Clinical Standard 5: Proportion of consultants who said
that diagnostic tests were always or usually available when needed for critical and urgent patients Clinical Standard 6: Proportion of the nine possible
consultant- directed in tervent ions provided by the trust 7 days a week on-site or by formal arrangement Clinical Standard 8: Proportion of patients in the trust who
need it, receive a daily or twice daily review by a consultant
Data filters
Data processing N/A
Construction
Numerator The indicator will be calculated as an average of the score for each clinical standard (see “Computation” for details ).
The numerator for calculating the score for each clinical standard is as follows:
Clinical standard 2: Number of patients reviewed by an appropriate consultant within 14 hours of admissions
Clinical standard 5: Number of consultants who said that diagnostic tests were always or usually available when needed for critical and urgent patients.
Clinical standard 6: Number of consultant -directed interventions provided on-site or by formal arrangement
Clinical standard 8: Number of patients who needed and received once or twice daily consultant reviews (calculated separately for once and twice daily reviews)
Denominator The denominators for each clinical standard are as follows:
Clinical standard 2: number of reviews required

118
Clinical standard 5: number of consultants (who take emergency admissions in the trust) who responded to the survey
Clinical standard 6: total number of available consultant directed interventions (9 in total)
Clinical standard 8: number of patients requiring once or twice daily reviews
Computation For each clinical standard, the score will be the (numerator/denominator) * 100 expressed as a percentage.
Note that the scores for each clinical standard will be calculated for weekday and weekend admissions separately and the lowest score will be taken to be the score for each standard.
The indicator value will be the sum of the scores for the four c linical standards dived by 4. Each clinical standard therefore contributes 25% to the overall score.
To calculate CCG level indicator values, data will be attributed to CCGs using a weighted average of the number of emergency admissions from each CCG to a particular trust.
Risk adjustment or standardisation type and methodology
None
Output
Frequency of publication 6 monthly
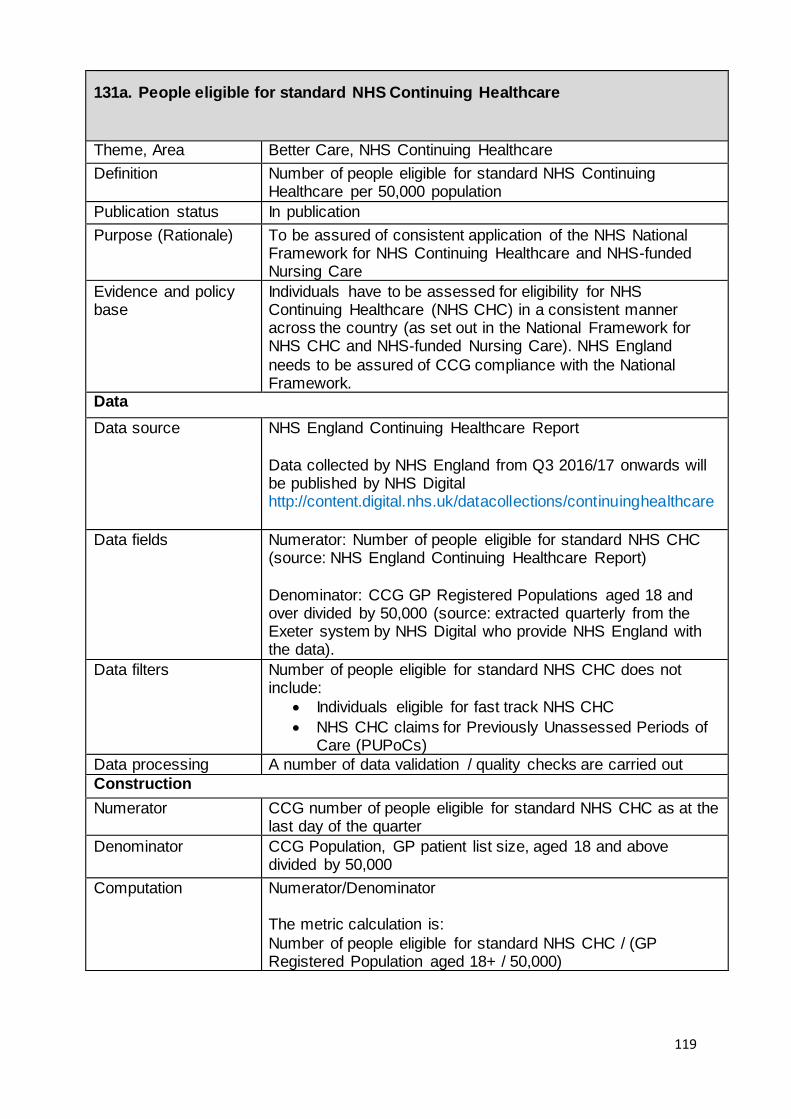
119
131a. People eligible for standard NHS Continuing Healthcare
Theme, Area Better Care, NHS Continuing Healthcare
Definition Number of people eligible for standard NHS Continuing Healthcare per 50,000 population
Publication status In publication
Purpose (Rationale) To be assured of consistent application of the NHS National Framework for NHS Continuing Healthcare and NHS-funded Nursing Care
Evidence and policy base
Individuals have to be assessed for eligibility for NHS Continuing Healthcare (NHS CHC) in a consistent manner across the country (as set out in the National Framework for NHS CHC and NHS-funded Nursing Care). NHS England
needs to be assured of CCG compliance with the National Framework.
Data
Data source NHS England Continuing Healthcare Report
Data collected by NHS England from Q3 2016/17 onwards will be published by NHS Digital http://content.digital.nhs.uk/datacollections/continuinghealthcare
Data fields Numerator: Number of people eligible for standard NHS CHC (source: NHS England Continuing Healthcare Report)
Denominator: CCG GP Registered Populations aged 18 and over divided by 50,000 (source: extracted quarterly from the Exeter system by NHS Digital who provide NHS England with the data).
Data filters Number of people eligible for standard NHS CHC does not include:
Individuals eligible for fast track NHS CHC
NHS CHC claims for Previously Unassessed Periods of Care (PUPoCs)
Data processing A number of data validation / quality checks are carried out
Construction
Numerator CCG number of people eligible for standard NHS CHC as at the last day of the quarter
Denominator CCG Population, GP patient list size, aged 18 and above divided by 50,000
Computation Numerator/Denominator The metric calculation is:
Number of people eligible for standard NHS CHC / (GP Registered Population aged 18+ / 50,000)

120
Risk adjustment or
standardisation type and methodology
None
Output
Frequency of publication
Quarterly

121
SUSTAINABILITY
Indicator
number
Indicator name 141a Financial plan 141b In-year financial performance 142a Outcomes in areas with identified scope for improvement 142b Expenditure in areas with identified scope for improvement 143a Adoption of new models of care 144a Local digital roadmap in place 144b Digital interactions between primary and secondary care 145a Local strategic estates plan (SEP) in place

122
141a. Financial plan
Theme, Area Sustainability, Financial sustainability
Summary The indicator assesses compliance of financial plans with business rules
Detailed description of indicator
All CCGs will have a detailed financial plan for the year which will typically be published in summary form on the CCG website. This financial plan indicator will be based on final published approved financial plans. It will not change in year.
The RAG rating will be given to the plan as follows:
GREEN AMBER RED
All business rules met including:
Minimum 1%
cumulative planned underspend
1% uncommitted
non-recurrent spend
Minimum 0.5% contingency
Approved plan for the use of any drawdown1
The plan is of high quality, is stretching
but still credible, and represents good value for money investment
in line with the Five Year Forward View. The plan includes robust efficiency
plans supported by comprehensive
Key business rules met:
Minimum 1%
cumulative planned underspend
1% uncommitted
non-recurrent spend
Minimum 0.5% contingency
Approved plan for the use of any drawdown
The plan is non-compliant in other
areas of the business rules (see below), and/or the plan is
of a lower quality than that required to achieve a green rating, and/or
efficiency plans have areas of
One or more of the key business rules have not
been met:
Minimum 1% cumulative planned
underspend
1% uncommitted non-recurrent spend
Minimum 0.5% contingency
Approved plan for the use of
any drawdown
The plan may also be non-compliant
in other areas of the business rules (see below) and or have other
significant areas of weakness, and generally be of a lower quality than
would be expected to receive an
1 In normal circumstances, NHS England will approve the carry forward of under- and overspends to the following year. It results in an additional non-recurrent allocation adjustment to the CCG. The use of carried forward underspends is termed drawdown. Plans for the use of drawdown must be signed off by NHS England to ensure that (1) it is used for appropriate non-recurrent purposes, e.g. to support longer term transformation, and (2) CCGs cannot run in year deficits without approval. This means that a CCG with, for example, a cumulative 2% underspend in one year must carry that forward as an underspend in the following year unless it has an approved plan for the use of drawdown.

123
programme architecture.
weakness, and / or the plans highlight significant
unmitigated risk.
amber rating.
In exceptional circumstances where a CCG’s plan fails to meet its financial duties due to factors that are truly beyond its control, this may be taken into account in assigning the assurance rating.
A plan would be treated as “non-compliant in other areas” if the following rules were not met:
Management costs exceed the CCG admin allocation;
or
NHS Constitution or other financial policy commitments not met, specifically including Mental Health Minimum Investment and Better Care Fund contributions; or
National contract & PbR rules not applied in full in the plan, including sanctions, MRET and readmissions; or
Evidence of failure to provide information on source & use of sanctions, MRET etc. to relevant stakeholders.
Rationale for use and what it intends to achieve
This is intended to give an indication of whether individual CCGs are likely to deliver NHS England’s business rules. Improvement against the Financial Plan Indicator will be
possible annually by improving compliance with the business rules.
Process of assessment
The indicator will be based on:
Published final financial plans; and
An element of judgement by local teams and regions
with national moderation. Financial plans are prepared annually.
The assessment will be made by local teams with moderation within regions by regional teams. The Director of Financial Planning and Delivery will oversee the moderation process and ensure consistency across regions.
What is the published rating? Is contextual information
required?
Red, amber or green ratings. Contextual information is not required.
Frequency of
assessment
The Financial Plan Indicator is reported at the end of June.
How is consistency of information /
The indicators will largely be based on published financial information, but there will be limited subjective judgements.

124
assessments ensured?
Where judgements are made by local teams:
Regional teams will ensure consistency within their
regions; and
The Director of Financial Planning and Delivery will ensure consistency across regions.

125
141b. In-year financial performance
Theme, Area
Sustainability, Financial sustainability
Summary The indicator assesses whether actual financial performance is
likely to meet plans.
Detailed description of indicator
The in-year financial performance indicator is based on the delivery of the CCG’s plan for the year. In-year financial performance is assessed on a quarterly basis using the forecast
outturn financial position for the CCG. The RAG rating will be assigned as follows:
GREEN AMBER RED
The CCG is forecasting delivery
in line with the plan for the year. The year to date position is in line
with the plan, the CCG is delivering against its efficiency plan and
there are no other indicators that the plan is at risk of delivery.
And the CCG is compliant with the requirements for
the 1% non-recurrent spend set down at the planning stage.
The CCG is forecasting delivery
in line with the plan for the year, though there are some signs of
financial distress. These may include:
the year to date
position is off plan; and/or
the CCG is not delivering against
its efficiency plan for the year to date; and/or
there are material
unmitigated risks; and/or
there are other indicators that the
plan is at risk of delivery.
And the CCG is
compliant with the requirements for the 1% non-recurrent spend set down at
the planning stage.
The CCG is not
forecasting delivery
in line with the plan for the year, and/or the CCG is not
compliant with the
requirements for the 1% non-recurrent spend set down at the planning stage.
There may be other indicators of significant financial
distress such as the year to date position is not in line with the plan,
the CCG is not delivering against its efficiency plan, or there are
material long-standing disputes with providers.
The CCG may be considering initiating a turnaround process.
In exceptional circumstances where a CCG has failed to meet its financial duties due to factors that are truly beyond its control,

126
this may be taken into account in assigning the assurance rating. It would be based on published quarterly full year forecast
outturn consistent with MI reporting, and quarterly information collected to identify:
Commitments of 1% non-recurrent spend;
Whether commitments of 1% non-recurrent spend have
been approved;
CCGs in financial turnaround;
CCGs being considered for financial turnaround; and
CCGs where there are signs of extreme financial distress
that cause significant doubt over the achievability of financial plans.
Rationale for use and what it
intends to achieve
This is intended to give an indication of whether individual CCGs are meeting plans and whether or not those plans comply with
business rules. Improvement against the In-year financial performance indicator will be possible quarterly if confidence in achievement of in-year
plans increases.
Process of assessment
The indicator will be based on:
Published quarterly in-year financial performance; and
An element of judgement by local teams and regions with national moderation.
In-year financial performance is collected as part of monthly financial reporting processes.
The assessment will be made by local teams with moderation within regions by regional teams. The Director of Financial Planning and Delivery will oversee the moderation process and ensure consistency across regions.
What is the published rating? Is contextual information
required?
Red, amber or green rating. Contextual information is not required.
Frequency of
assessment
The In-year financial performance indicator will be assessed
quarterly after publication of the CCG quarterly financial position and will therefore be available approximately two months after the end of each quarter.
How is
consistency of information / assessments ensured?
The indicator is largely based on published financial information,
but there are limited subjective judgements. Where judgements are made by local teams:
Regional teams will ensure consistency within their
regions; and

127
The Director of Financial Planning and Delivery will ensure consistency across regions.
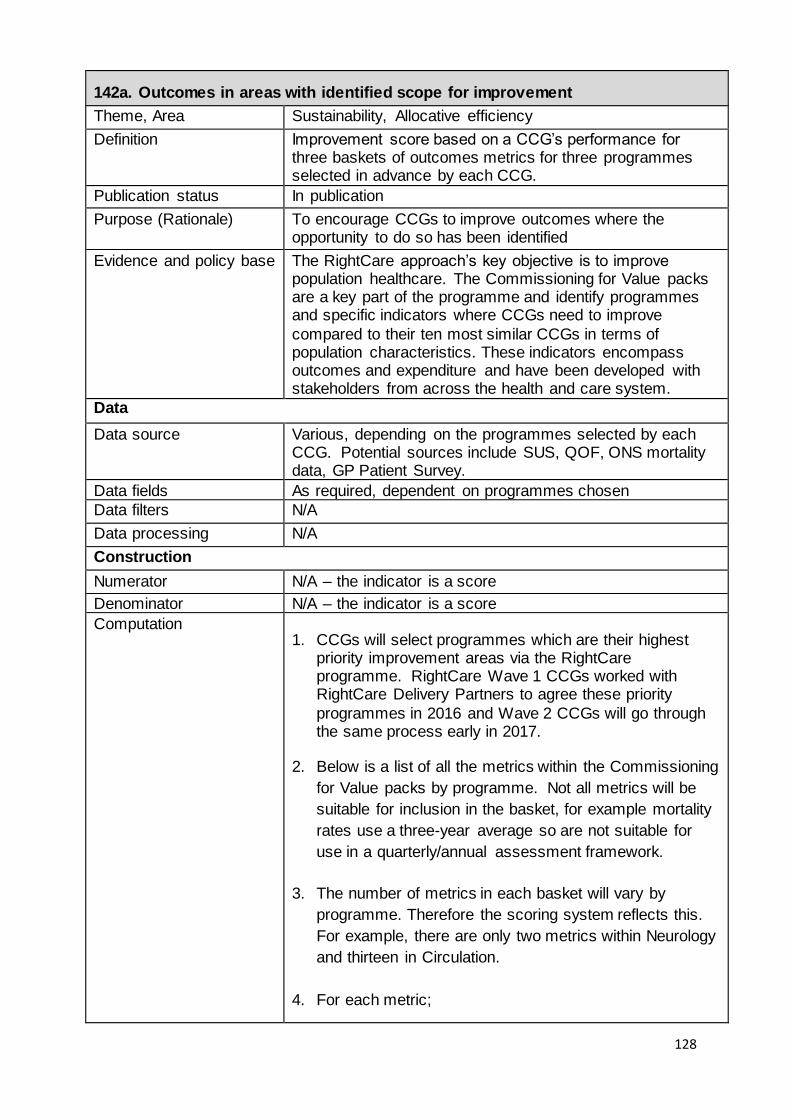
128
142a. Outcomes in areas with identified scope for improvement
Theme, Area Sustainability, Allocative efficiency
Definition Improvement score based on a CCG’s performance for three baskets of outcomes metrics for three programmes selected in advance by each CCG.
Publication status In publication
Purpose (Rationale) To encourage CCGs to improve outcomes where the opportunity to do so has been identified
Evidence and policy base The RightCare approach’s key objective is to improve population healthcare. The Commissioning for Value packs are a key part of the programme and identify programmes and specific indicators where CCGs need to improve
compared to their ten most similar CCGs in terms of population characteristics. These indicators encompass outcomes and expenditure and have been developed with stakeholders from across the health and care system.
Data
Data source Various, depending on the programmes selected by each CCG. Potential sources include SUS, QOF, ONS mortality data, GP Patient Survey.
Data fields As required, dependent on programmes chosen
Data filters N/A
Data processing N/A
Construction
Numerator N/A – the indicator is a score
Denominator N/A – the indicator is a score
Computation 1. CCGs will select programmes which are their highest
priority improvement areas via the RightCare programme. RightCare Wave 1 CCGs worked with RightCare Delivery Partners to agree these priority
programmes in 2016 and Wave 2 CCGs will go through the same process early in 2017.
2. Below is a list of all the metrics within the Commissioning
for Value packs by programme. Not all metrics will be
suitable for inclusion in the basket, for example mortality
rates use a three-year average so are not suitable for
use in a quarterly/annual assessment framework.
3. The number of metrics in each basket will vary by
programme. Therefore the scoring system reflects this.
For example, there are only two metrics within Neurology
and thirteen in Circulation.
4. For each metric;

129
• A score of 2 is given to any metrics where the CCG achieves a statistically significant improvement
• A score of 1 is given to any metrics with no statistically significant change
• A score of 0 is given to any metrics where performance has got statistically significantly worse.
5. The sum of the scores for each of the individual metrics are calculated and divided by the highest possible score (i.e. a score of two per metric).
6. Each basket therefore has a score between 0 and 1
(where 1 is the best possible score)
7. The overall score for the indicator is the sum of the three selected baskets (i.e. from 0 to 3 where 3 is the best possible score).
List of all metrics included in the Commissioning for Value (CfV) packs
Programme Indicator
Cancer & Tumours
% of breast cancers detected at an early stage (1 or 2)
Cancer & Tumours
One-year survival from breast, lung and colorectal cancer for ages 15-99 CCG OIS 1.11 and NHSOF 1.4.iii
Cancer & Tumours
% of women aged 50 - 70 screened for breast cancer in last three years
Cancer & Tumours
Mortality from all cancers: Under 75 directly age-standardised rates (DSR) per 100,000 population
Cancer & Tumours
Mortality from all cancers: All ages directly age-standardised rates (DSR) per 100,000 population
Cancer & Tumours
Mortality from colorectal cancer: Under 75 directly age-standardised rates (DSR) per 100,000 population
Cancer & Tumours
Mortality from lung cancer: Under 75 directly age-standardised rates (DSR) per 100,000 population
Cancer & Tumours
Mortality from breast cancer: Under 75 directly age-standardised rates (DSR) per 100,000 population
Cancer & Tumours
% (all cancers) receiving first definitive treatment within two months of urgent referral from GP
Cancer & Tumours
Smoking quit rates (successful quitters), per 100,000 population aged 16yrs+
Cancer & Tumours
% of people aged 60-69 who were screened for bowel cancer in the previous 30 months
Cancer & Tumours
% of colorectal cancers detected at an early stage (1 or 2)
Cancer & Tumours
% of lung cancers detected at an early stage (1 or 2)
Cancer & Tumours
Cancer - Spend on elective and day-case admissions per 1,000 population
Cancer & Tumours
Cancer - Non-elective (EM + ONEL) admissions per 1000 population across secondary care – Cost
Cancer & Tumours
Cancer - Cost prescribed per 1,000 ASTRO-PU population

130
Circulation Problems (CVD)
Reported to estimated prevalence of CHD (%)
Circulation Problems (CVD)
Reported to estimated prevalence of hypertension (%)
Circulation Problems (CVD)
Percentage of transient ischaemic attack (TIA) cases with a higher risk who are treated within 24 hours
Circulation Problems (CVD)
% of patients admitted to hospital following a stroke who spend 90% of their time in a stroke unit
Circulation Problems (CVD)
Mortality from circulatory diseases under 75 directly age-standardised rate (DSR) per 100,000 population
Circulation Problems (CVD)
Mortality from coronary heart diseases under 75 directly age-standardised rate (DSR) per 100,000 population
Circulation Problems (CVD)
Mortality from acute MI under 75 directly age-standardised rate (DSR) per 100,000 population
Circulation Problems (CVD)
Mortality from stroke under 75 directly age-standardised rates (DSR) per 100,000 population
Circulation Problems (CVD)
The percentage of patients with coronary heart disease in whom the last blood pressure reading (measured in the preceding 12 months) is 150/90 or less
Circulation Problems (CVD)
Percentage of patients with CHD whose last measured cholesterol (as measured within the last 12 months) is 5mmol/l or less
Circulation Problems (CVD)
% of patients with hypertension whose last blood pressure reading (as measured within the last 12 months) is 150/90 or less
Circulation Problems (CVD)
% of patients with stroke or TIA whose last blood pressure reading (as measured within the last 12 months) is 150/90 or less
Circulation Problems (CVD)
The percentage of patients with stroke shown to be non-haemorrhagic, or a history of TIA, whose last measured total cholesterol (measured in the preceding 12 months) is 5 mmol/l or less
Circulation Problems (CVD)
% of patients with a non-haemorrhagic stroke or TIA with a record that an anti-platelet agent or an anti-coagulant is being taken
Circulation Problems (CVD)
In those patients with atrial fibrillation in whom there is a record of a CHADS2 score of 1, the percentage of patients who are currently treated with anti-coagulation drug therapy or anti-platelet therapy
Circulation Problems (CVD)
Emergency readmissions to hospital within 28 days for patients with stroke
Circulation Problems (CVD)
% of patients returning to usual place of residence following hospital treatment for stroke
Circulation Problems (CVD)
Circulation - Total elective (IP + DC) admissions per 1000 population across secondary care – Cost
Circulation Problems (CVD)
Circulation - Non-elective (EM + ONEL) admissions per 1,000 population across secondary care – Cost
Circulation Problems (CVD)
Circulation - Cost prescribed per 1000 ASTRO-PU population – Cost
Endocrine, Nutritional and Metabolic Problems
The percentage of diabetic patients whose last cholesterol was 5mmol or less
Endocrine, Nutritional and Metabolic Problems
The percentage of patients with diabetes in whom the last IFCC-HbA1c is 64 mmol/mol (equivalent to HbA1c of 8% in DCCT values) or less (or equivalent test/reference range depending on local laboratory) in the preceding 12 months
Endocrine, Nutritional and Metabolic
The percentage of diabetic patients whose last blood pressure was 150/90 or less

131
Problems
Endocrine, Nutritional and Metabolic Problems
The % of all diabetes patients receiving eight care processes
Endocrine, Nutritional and Metabolic Problems
% of all diabetes patients having retinal screening in the previous 12 months
Endocrine, Nutritional and Metabolic Problems
Additional risk of complication for myocardial infarction among people with diabetes
Endocrine, Nutritional and Metabolic Problems
Additional risk of complication for heart failure among people with diabetes
Endocrine, Nutritional and Metabolic Problems
Additional risk of complication for stroke among people with diabetes
Endocrine, Nutritional and Metabolic Problems
Endocrine - Total elective (IP + DC) admissions per 1000 population across secondary care – Cost
Endocrine, Nutritional and Metabolic Problems
Endocrine - Non-elective (EM + ONEL) admissions per 1000 population across secondary care – Cost
Endocrine, Nutritional and Metabolic Problems
Endocrine - Cost prescribed per 1000 ASTRO-PU population
Gastrointestinal Emergency admissions for alcohol related liver disease
Gastrointestinal Mortality from gastrointestinal disease: Under 75 directly age-standardised rates (DSR) per 100,000 population
Gastrointestinal Mortality from liver disease: Under 75 directly standardised rates (DSR) per 100,000 population
Gastrointestinal Total Elective (IP + DC) gastro-intestinal admissions cost
Gastrointestinal Total non-elective (EM + ONEL) gastro-intestinal admissions cost
Gastrointestinal Cost of gastro-intestinal items prescribed
Genitourinary % of patients on CKD register, for whom the last blood pressure reading, measured in the preceding 12 months, is 140/85 or less
Genitourinary % of patients on the CKD register with hypertension and proteinuria who are treated with ACE-I or ARB
Genitourinary Reported to expected prevalence of CKD (%)
Genitourinary % of patients on the CKD register with a record of urine albumin creatinine ratio test in the preceding 12 months
Genitourinary % of people receiving dialysis or undertaking dialysis at home
Genitourinary % of patients on Renal Replacement Therapy who have a kidney transplant
Genitourinary Total elective (IP + DC) genito-urinary admissions cost
Genitourinary Total non-elective (EM + ONEL) genito-urinary admissions cost
Genitourinary Cost of genito-urinary items prescribed

132
Maternity & Reproductive Health
Percentage (%) of live and stillbirths <2500 grams
Maternity & Reproductive Health
Teenage conceptions (aged under 18): rates
Maternity & Reproductive Health
% of pregnant women vaccinated for flu
Maternity & Reproductive Health
Number of women known to be smokers at time of delivery per 100 maternities
Maternity & Reproductive Health
% of mothers who give their babies breast milk in the first 48 hours after delivery
Maternity & Reproductive Health
% of infants that are totally or partially breastfed at age 6-8 weeks
Maternity & Reproductive Health
Rate of infant deaths aged <1 year per 1,000 live births
Maternity & Reproductive Health
Rate of emergency admissions for gastroenteritis in infants aged <1 year per 10,000 population
Maternity & Reproductive Health
Rate of emergency admissions for respiratory tract infections in infants aged <1 year per 10,000 population
Maternity & Reproductive Health
Children who received 3 doses of DTaP/IPV/Hib vaccine at any time by their second birthday as a % of children reaching age 2 years within the period
Maternity & Reproductive Health
Rate of hospital admissions caused by unintentional and deliberate injuries in children aged 0-4 years per 10,000 population
Maternity & Reproductive Health
% of children aged 4-5 years classified as overweight or obese
Maternity & Reproductive Health
Children who received 2 doses of MMR vaccine at any time between their first and fifth birthdays as a % of children reaching age 5 years within the period
Maternity & Reproductive Health
The mean number of teeth per child aged 5 years sampled which were either actively decayed or had been filled or extracted (due to decay)
Maternity & Reproductive Health
Cost of trauma and injuries items prescribed
Mental Health Problems
Emergency admissions for self-harm per 100,000 population
Mental Health Problems
Mortality from suicide and injury all ages directly age-standardised rate (DSR) per 100,000 population
Mental Health Problems
Mental Health - % of people with mental illness and or disability in settled accommodation
Mental Health Problems
Excess under 75 mortality in adults with serious mental illness: standardised mortality ratio (%)
Mental Health Problems
Reported numbers of dementia cases on GP registers as a percentage of estimated prevalence
Mental Health Problems
The % of new cases of depression in the previous year who had an assessment of severity using an assessment tool validated for use in primary care (DEP06)
Mental Health Problems
Access to IAPT services: People entering IAPT services as a % of those estimated to have anxiety/depression

133
Mental Health Problems
Waiting < 28 days for IAPT: % of referrals (in quarter) waiting <28 days for first treatment
Mental Health Problems
Completion of IAPT treatment: Rate completing treatment per 100,000 population aged 18+
Mental Health Problems
% of IAPT patients receiving a course of treatment
Mental Health Problems
% of IAPT patients given a provisional diagnosis
Mental Health Problems
% of IAPT referrals with treatment outcome measured
Mental Health Problems
Rate of recovery: % of people who are "moving to recovery" of those who have completed IAPT treatment
Mental Health Problems
IAPT reliable recovery: % of people who have completed IAPT treatment who achieved "reliable improvement"
Mental Health Problems
Physical health checks for patients with SMI: Summary score (average of the 6 physical health check indicators)
Mental Health Problems
The number of people on Care Programme Approach per 100,000 population aged 18+
Mental Health Problems
Mental health admissions to hospital: Rate per 100,000 population aged 18+
Mental Health Problems
The number of people subject to the Mental Health Act per 100,000 population aged 18+
Mental Health Problems
% of people aged 18-69 on CPA in employment
Mental Health Problems
Mental Health - Cost prescribed per 1000 ASTRO-PU population
Musculoskeletal System Problems (Excludes Trauma)
Hip replacement, EQ-5D, Health Gain
Musculoskeletal System Problems (Excludes Trauma)
Knee replacement, EQ-5D, Health Gain
Musculoskeletal System Problems (Excludes Trauma)
The % of patients aged 50-75 years , with a fragility fracture on or after 1 April 2012, in whom osteoporosis is confirmed on DXA scan, who are currently treated with an appropriate bone-sparing agent (OST002)
Musculoskeletal System Problems (Excludes Trauma)
% of patients aged 75+ years with a fragility fracture treated with an appropriate bone-sparing agent (OST03)
Musculoskeletal System Problems (Excludes Trauma)
Emergency readmissions to hospital within 28 days for patients with hip replacements
Musculoskeletal System Problems (Excludes Trauma)
Total elective (IP + DC) musculoskeletal admissions cost
Musculoskeletal System Problems (Excludes
Total non-elective (EM + ONEL) musculoskeletal admissions cost

134
Trauma)
Musculoskeletal System Problems (Excludes Trauma)
Cost of musculoskeletal items prescribed
Neurological System Problems
Emergency admission rate for children with epilepsy per population aged 0–17 years
Neurological System Problems
Mortality from epilepsy under 75 directly age-standardised rate (DSR) per 100,000 population
Neurological System Problems
The percentage of aged 18 years and over on drug treatment for epilepsy patients who have been seizure free for the last 12 months recorded in the preceding 12 months
Neurological System Problems
Neurological - Total elective (IP + DC) admissions per 1,000 population across secondary care – Cost
Neurological System Problems
Neurological - Non-elective (EM + ONEL) admissions per 1,000 population across secondary care – Cost
Neurological System Problems
Neurological - Cost prescribed per 1,000 ASTRO-PU population – Cost
Respiratory System Problems
Mortality from bronchitis emphysema, and COPD: Under 75 directly age-standardised rates (DSR) per 100,000
Respiratory System Problems
Reported to estimated prevalence of COPD (%)
Respiratory System Problems
% of asthma patients who have had a review in the preceding 12 months
Respiratory System Problems
Emergency admission rate for children with asthma per 100,000 population aged 0–18 years
Respiratory System Problems
Mortality from asthma: Directly age-standardised rates (DSR) per 100,000 population
Respiratory System Problems
% of COPD patients with a record of FeV1 in the preceding 12 months
Respiratory System Problems
The % of patients with COPD who have had a review, undertaken by a healthcare professional, including an assessment of breathlessness using the Medical Research Council dyspnoea scale in the preceding 12 months (COPD003)
Respiratory System Problems
Respiratory - Total Elective (IP + DC) admissions cost
Respiratory System Problems
Respiratory - Total non-elective (EM + ONEL) admissions cost
Respiratory System Problems
Cost of respiratory items prescribed
Trauma & Injuries
Mortality from accidents - all ages
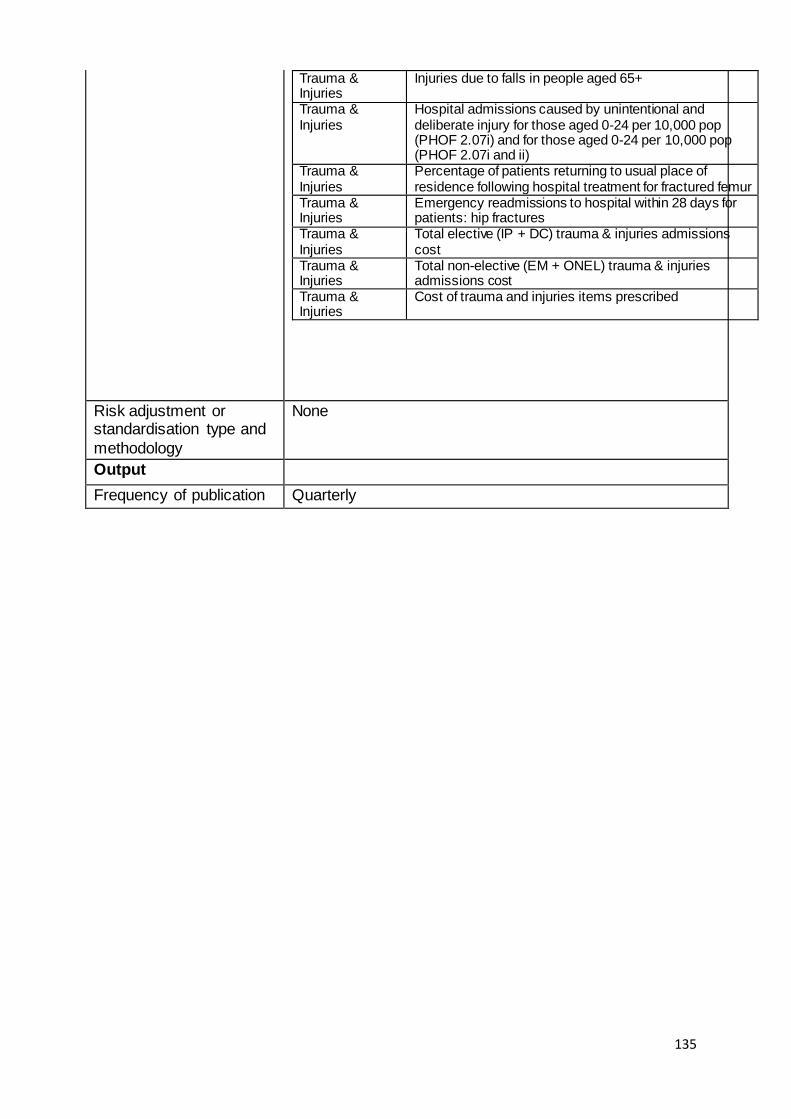
135
Trauma & Injuries
Injuries due to falls in people aged 65+
Trauma & Injuries
Hospital admissions caused by unintentional and deliberate injury for those aged 0-24 per 10,000 pop (PHOF 2.07i) and for those aged 0-24 per 10,000 pop (PHOF 2.07i and ii)
Trauma & Injuries
Percentage of patients returning to usual place of residence following hospital treatment for fractured femur
Trauma & Injuries
Emergency readmissions to hospital within 28 days for patients: hip fractures
Trauma & Injuries
Total elective (IP + DC) trauma & injuries admissions cost
Trauma & Injuries
Total non-elective (EM + ONEL) trauma & injuries admissions cost
Trauma & Injuries
Cost of trauma and injuries items prescribed
Risk adjustment or standardisation type and
methodology
None
Output
Frequency of publication Quarterly

136
142b. Expenditure in areas with identified scope for improvement
Theme, Area Sustainability, Allocative efficiency
Definition Improvement score for expenditure on primary care
prescribing, elective admissions and non-elective admissions for three programmes selected in advance by each CCG. The selected programmes should be selected using the RightCare process and informed by the
Commissioning for Value packs and should offer the opportunity to improve outcomes as well as reduce expenditure.
Publication status In publication
Purpose (Rationale) To encourage CCGs to reduce expenditure in programmes where there exist opportunities to improve outcomes and reduce expenditure
Evidence and policy base The RightCare programme key objective is to ensure improvements in value for money and allocative efficiency. The Commissioning for Value packs are a key part of the programme and identify programmes and specific indicators
where CCGs need to improve compared to their ten most similar CCGs in terms of population characteristics. These indicators encompass expenditure and outcomes and have been developed with stakeholders from across the health and care system.
Data
Data source SUS
Data fields As required, dependent on programmes chosen.
Data filters N/A
Data processing N/A
Construction
Numerator N/A – the indicator is a score
Denominator N/A – the indicator is a score
Computation 1. CCGs will select programmes which are their highest
priority improvement areas via the RightCare programme.
RightCare Wave 1 CCGs worked with RightCare Delivery
Partners to agree these priority programmes in 2016 and
Wave 2 CCGs will go through the same process early in
2017.
2. For each CCG, for each of the selected programmes, the
sum of primary care prescribing, elective admissions and
non-elective admissions expenditure for a rolling 12 month
period compared will be calculated.
3. If expenditure for a selected programme has decreased
over the rolling 12 month period compared to the previous

137
year then a score of 2 will be awarded.
4. If expenditure for a selected programme has increased in
absolute terms over the rolling 12 month period compared to
the previous year but this growth is lower than the average
growth from 2013/14 to 2015/16 then a score of 1 will be
awarded.
5. If expenditure for a selected programme has increased in
absolute terms over the rolling 12 month period compared to
the previous year and this growth is higher than the average
growth from 2013/14 to 2015/16 then a score of 0 will be
awarded.
6. The scores for the selected programmes will be added
together and expressed as a percentage of the total possible score for the programmes selected.
Score for selected programmes expressed as a percentage
of total possible score for the selected programmes where 100% = best possible score. 0% = worst possible score. The underlying scores for the selected programmes should be looked at separately to interpret this indicator fully
Risk adjustment or standardisation type and
methodology
None.
Indicators in the Commissioning for Value packs are indirectly age-sex standardised to allow comparison between CCGs. However, the purpose of this indicator is to monitor changes in expenditure over time so this is not
essential Output
Frequency of publication Quarterly
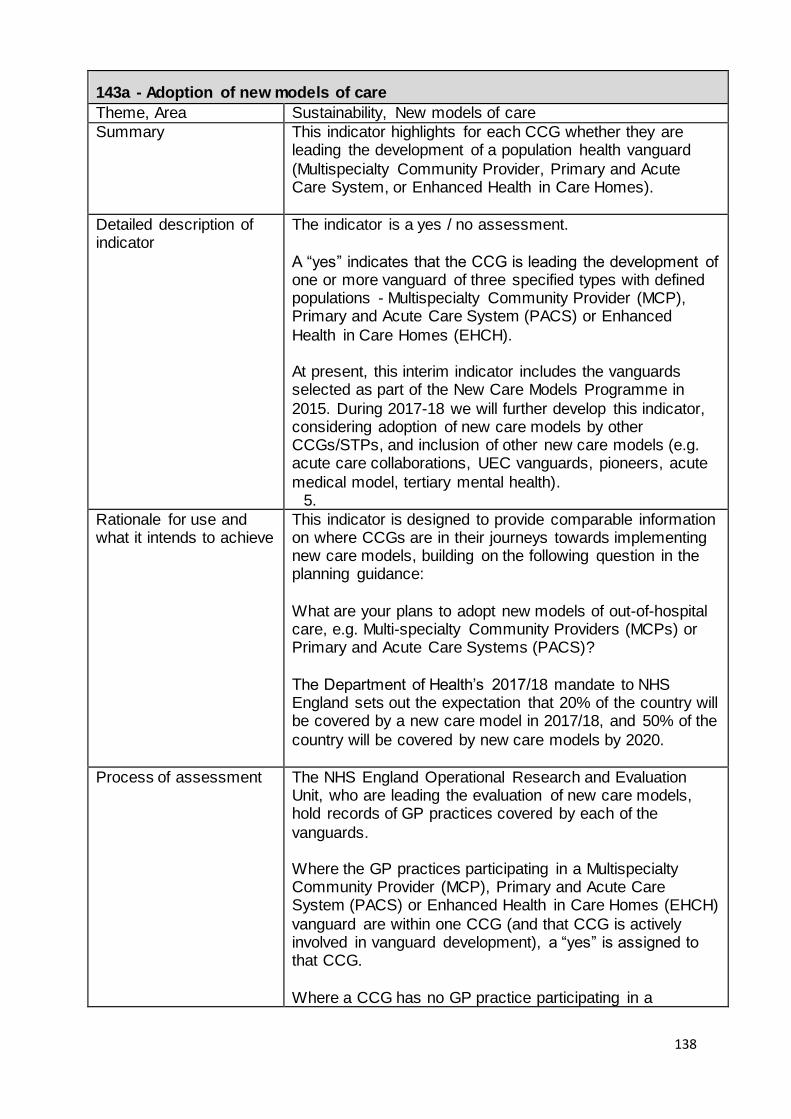
138
143a - Adoption of new models of care Theme, Area Sustainability, New models of care
Summary This indicator highlights for each CCG whether they are leading the development of a population health vanguard
(Multispecialty Community Provider, Primary and Acute Care System, or Enhanced Health in Care Homes).
Detailed description of indicator
The indicator is a yes / no assessment.
A “yes” indicates that the CCG is leading the development of one or more vanguard of three specified types with defined populations - Multispecialty Community Provider (MCP), Primary and Acute Care System (PACS) or Enhanced
Health in Care Homes (EHCH). At present, this interim indicator includes the vanguards selected as part of the New Care Models Programme in
2015. During 2017-18 we will further develop this indicator, considering adoption of new care models by other CCGs/STPs, and inclusion of other new care models (e.g. acute care collaborations, UEC vanguards, pioneers, acute
medical model, tertiary mental health). 5.
Rationale for use and what it intends to achieve
This indicator is designed to provide comparable information on where CCGs are in their journeys towards implementing new care models, building on the following question in the planning guidance:
What are your plans to adopt new models of out-of-hospital care, e.g. Multi-specialty Community Providers (MCPs) or Primary and Acute Care Systems (PACS)?
The Department of Health’s 2017/18 mandate to NHS England sets out the expectation that 20% of the country will be covered by a new care model in 2017/18, and 50% of the
country will be covered by new care models by 2020.
Process of assessment The NHS England Operational Research and Evaluation Unit, who are leading the evaluation of new care models, hold records of GP practices covered by each of the
vanguards. Where the GP practices participating in a Multispecialty Community Provider (MCP), Primary and Acute Care System (PACS) or Enhanced Health in Care Homes (EHCH)
vanguard are within one CCG (and that CCG is actively involved in vanguard development), a “yes” is assigned to that CCG.
Where a CCG has no GP practice participating in a
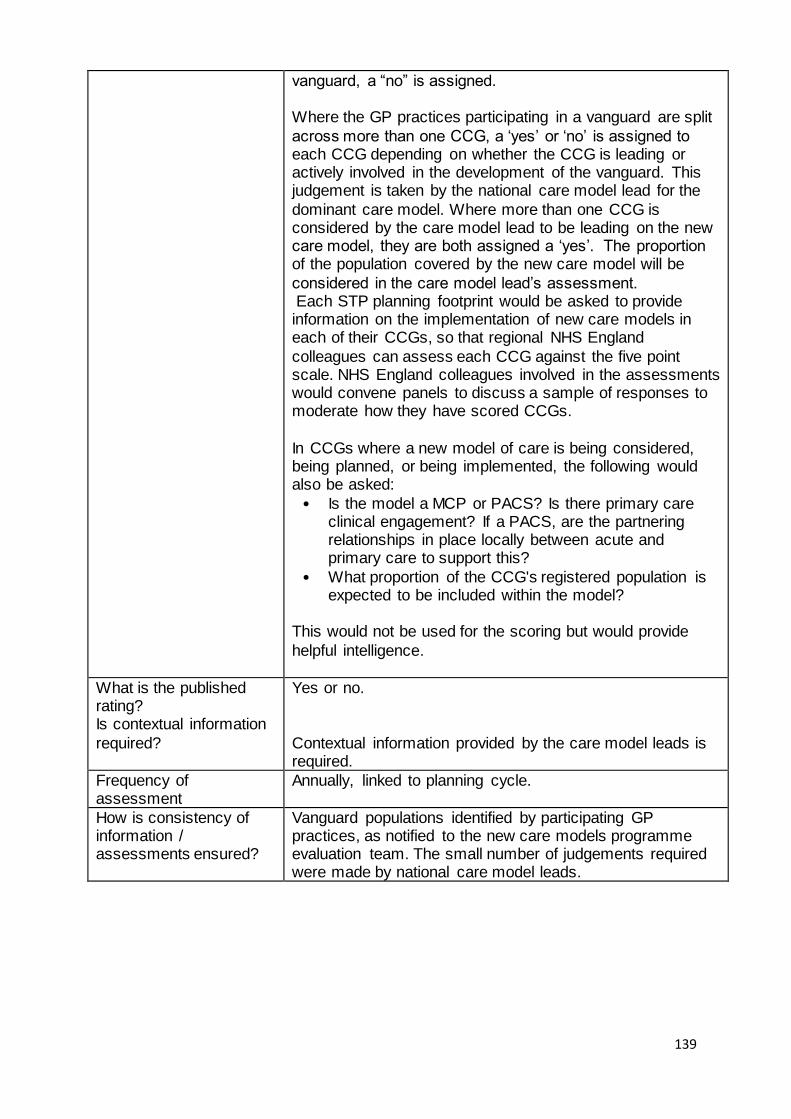
139
vanguard, a “no” is assigned. Where the GP practices participating in a vanguard are split
across more than one CCG, a ‘yes’ or ‘no’ is assigned to each CCG depending on whether the CCG is leading or actively involved in the development of the vanguard. This judgement is taken by the national care model lead for the
dominant care model. Where more than one CCG is considered by the care model lead to be leading on the new care model, they are both assigned a ‘yes’. The proportion of the population covered by the new care model will be
considered in the care model lead’s assessment. Each STP planning footprint would be asked to provide information on the implementation of new care models in each of their CCGs, so that regional NHS England
colleagues can assess each CCG against the five point scale. NHS England colleagues involved in the assessments would convene panels to discuss a sample of responses to moderate how they have scored CCGs.
In CCGs where a new model of care is being considered, being planned, or being implemented, the following would also be asked: Is the model a MCP or PACS? Is there primary care
clinical engagement? If a PACS, are the partnering relationships in place locally between acute and primary care to support this?
What proportion of the CCG's registered population is expected to be included within the model?
This would not be used for the scoring but would provide
helpful intelligence.
What is the published rating? Is contextual information
required?
Yes or no.
Contextual information provided by the care model leads is required.
Frequency of assessment
Annually, linked to planning cycle.
How is consistency of information / assessments ensured?
Vanguard populations identified by participating GP practices, as notified to the new care models programme evaluation team. The small number of judgements required were made by national care model leads.
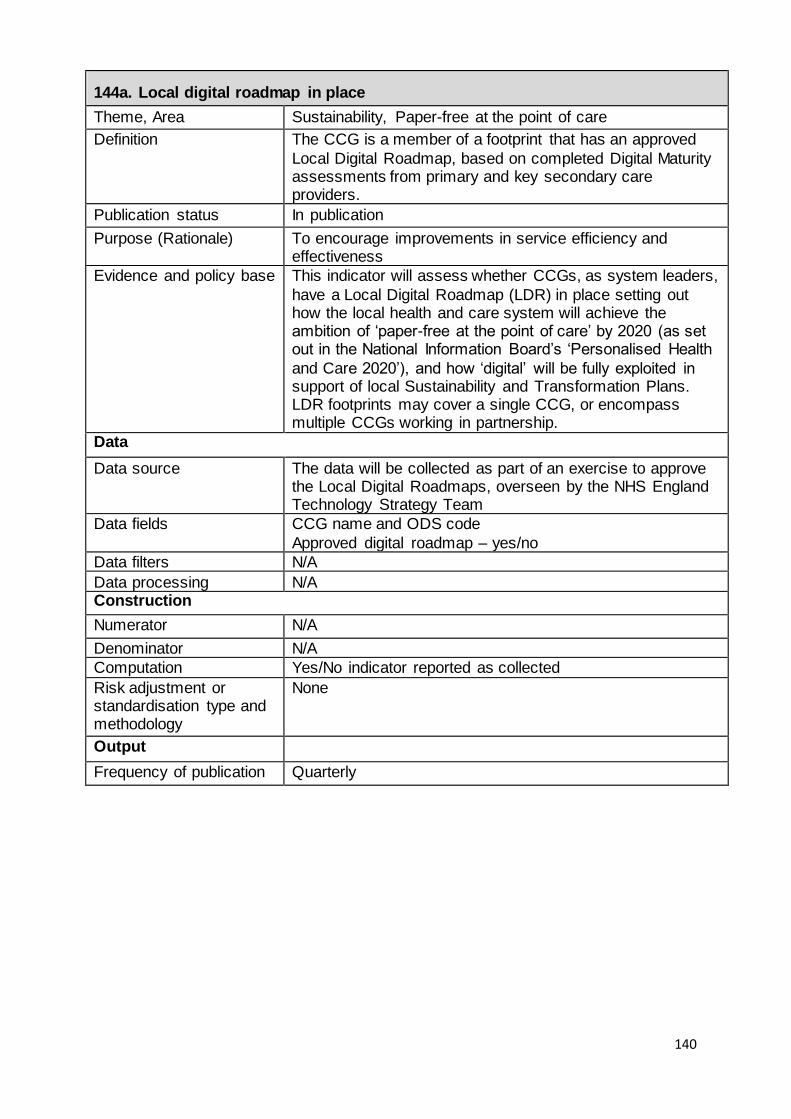
140
144a. Local digital roadmap in place
Theme, Area Sustainability, Paper-free at the point of care
Definition The CCG is a member of a footprint that has an approved
Local Digital Roadmap, based on completed Digital Maturity assessments from primary and key secondary care providers.
Publication status In publication
Purpose (Rationale) To encourage improvements in service efficiency and effectiveness
Evidence and policy base This indicator will assess whether CCGs, as system leaders,
have a Local Digital Roadmap (LDR) in place setting out how the local health and care system will achieve the ambition of ‘paper-free at the point of care’ by 2020 (as set out in the National Information Board’s ‘Personalised Health
and Care 2020’), and how ‘digital’ will be fully exploited in support of local Sustainability and Transformation Plans. LDR footprints may cover a single CCG, or encompass multiple CCGs working in partnership.
Data
Data source The data will be collected as part of an exercise to approve the Local Digital Roadmaps, overseen by the NHS England Technology Strategy Team
Data fields CCG name and ODS code
Approved digital roadmap – yes/no
Data filters N/A
Data processing N/A Construction
Numerator N/A
Denominator N/A
Computation Yes/No indicator reported as collected
Risk adjustment or standardisation type and methodology
None
Output
Frequency of publication Quarterly
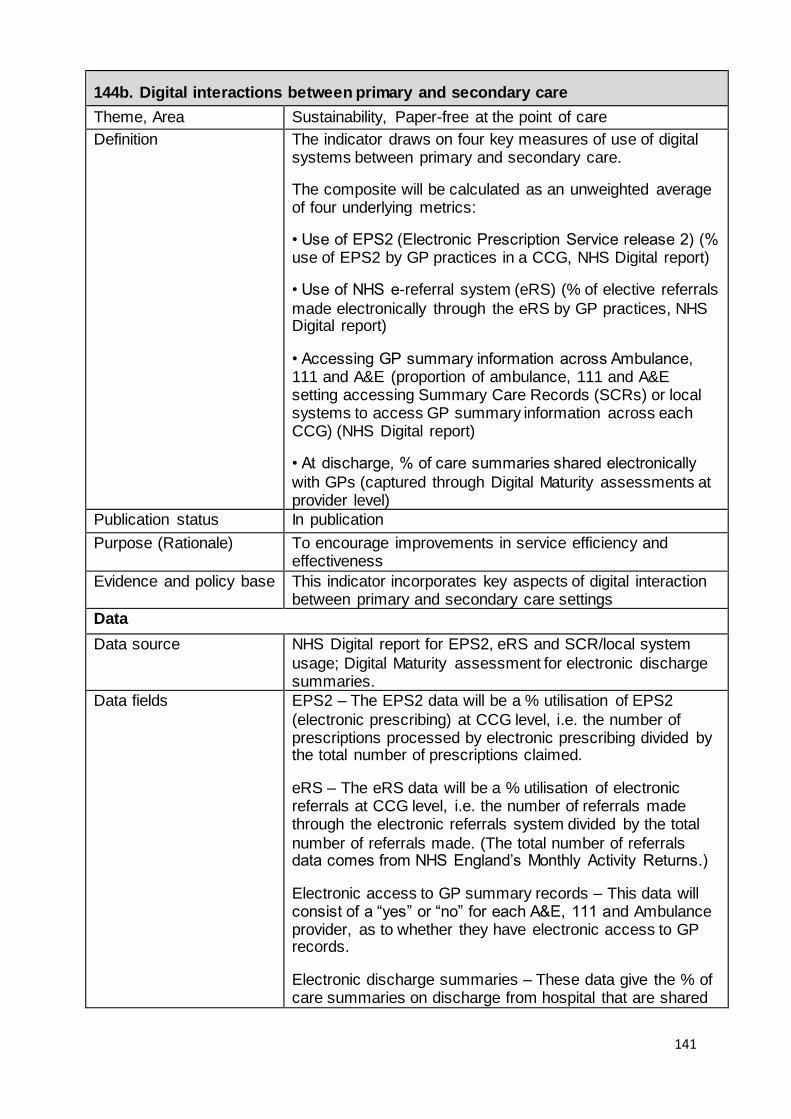
141
144b. Digital interactions between primary and secondary care
Theme, Area Sustainability, Paper-free at the point of care
Definition The indicator draws on four key measures of use of digital systems between primary and secondary care.
The composite will be calculated as an unweighted average of four underlying metrics:
• Use of EPS2 (Electronic Prescription Service release 2) (% use of EPS2 by GP practices in a CCG, NHS Digital report)
• Use of NHS e-referral system (eRS) (% of elective referrals
made electronically through the eRS by GP practices, NHS Digital report)
• Accessing GP summary information across Ambulance, 111 and A&E (proportion of ambulance, 111 and A&E setting accessing Summary Care Records (SCRs) or local systems to access GP summary information across each CCG) (NHS Digital report)
• At discharge, % of care summaries shared electronically
with GPs (captured through Digital Maturity assessments at provider level)
Publication status In publication
Purpose (Rationale) To encourage improvements in service efficiency and effectiveness
Evidence and policy base This indicator incorporates key aspects of digital interaction between primary and secondary care settings
Data
Data source NHS Digital report for EPS2, eRS and SCR/local system
usage; Digital Maturity assessment for electronic discharge summaries.
Data fields EPS2 – The EPS2 data will be a % utilisation of EPS2
(electronic prescribing) at CCG level, i.e. the number of prescriptions processed by electronic prescribing divided by the total number of prescriptions claimed.
eRS – The eRS data will be a % utilisation of electronic referrals at CCG level, i.e. the number of referrals made through the electronic referrals system divided by the total
number of referrals made. (The total number of referrals data comes from NHS England’s Monthly Activity Returns.)
Electronic access to GP summary records – This data will consist of a “yes” or “no” for each A&E, 111 and Ambulance provider, as to whether they have electronic access to GP records.
Electronic discharge summaries – These data give the % of care summaries on discharge from hospital that are shared
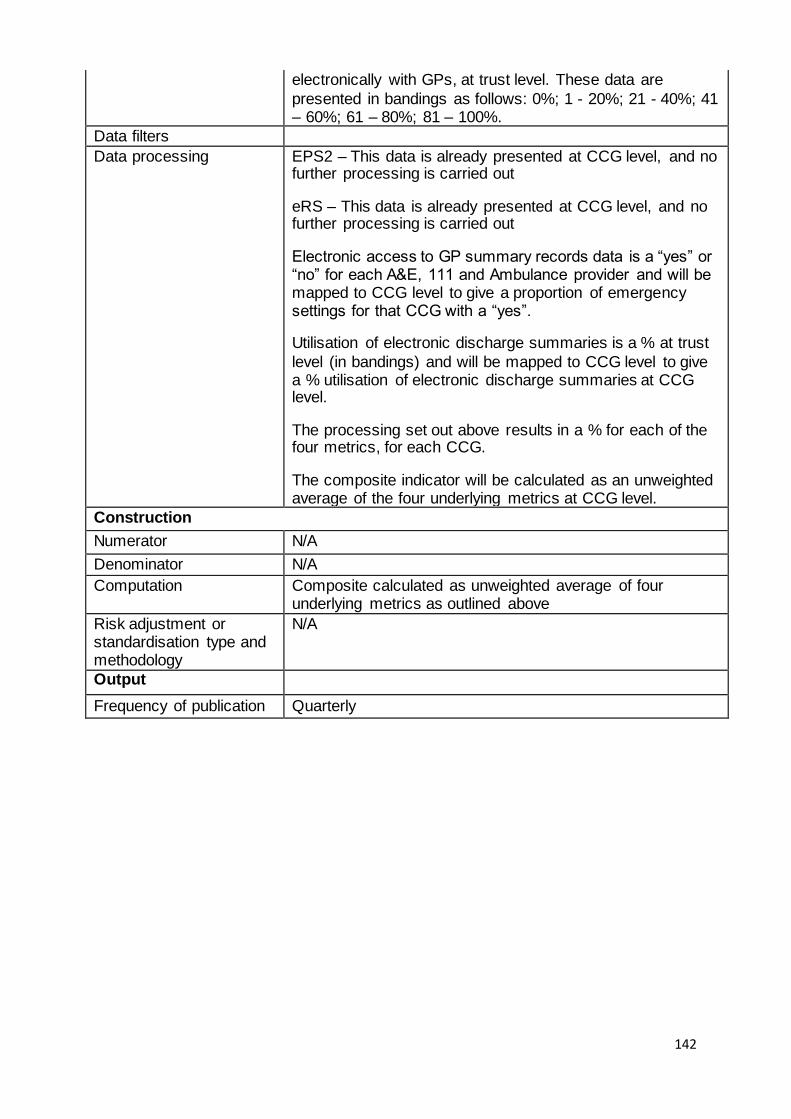
142
electronically with GPs, at trust level. These data are
presented in bandings as follows: 0%; 1 - 20%; 21 - 40%; 41 – 60%; 61 – 80%; 81 – 100%.
Data filters
Data processing EPS2 – This data is already presented at CCG level, and no further processing is carried out
eRS – This data is already presented at CCG level, and no further processing is carried out
Electronic access to GP summary records data is a “yes” or “no” for each A&E, 111 and Ambulance provider and will be mapped to CCG level to give a proportion of emergency settings for that CCG with a “yes”.
Utilisation of electronic discharge summaries is a % at trust
level (in bandings) and will be mapped to CCG level to give a % utilisation of electronic discharge summaries at CCG level.
The processing set out above results in a % for each of the four metrics, for each CCG.
The composite indicator will be calculated as an unweighted average of the four underlying metrics at CCG level.
Construction
Numerator N/A
Denominator N/A
Computation Composite calculated as unweighted average of four underlying metrics as outlined above
Risk adjustment or standardisation type and methodology
N/A
Output
Frequency of publication Quarterly

143
145a. Local strategic estates plan (SEP) in place Theme, Area Sustainability, Estates Strategy
Summary First phase of a developing indicator, to support a Department of Health (DH) led national programme to drive
greater efficiency in the NHS estate. As local system leaders, CCGs can facilitate the national agenda through the creation of a strategic estates plan (SEP) covering their area of responsibility. The indicator reports whether a plan is in
place.
Detailed description of indicator
For 2016/17 the main aim of this indicator will be to ensure that all CCGs are engaging constructively on the need to produce a SEP, so the assessment in 2016/17, will be
binary – pass if the SEP exists; fail if it does not. The expectation is that in future years the indicator can and should become more qualitative including alignment to relevant STPs in the context of the different geographical
footprints covered by STPs and more confident underpinning with implementation and delivery plans. For the beginning of 2016/17 the first key line of enquiry will
be assessed by the Department of Health and NHS England will be advised of the outcome. During 2016/17 DH will provide feedback to CCGs to help them further develop their plans and the key lines of enquiry 2-5 are those anticipated
to be assessed in 2017/18. 1. Is there a SEP covering the CCG’s area of responsibility? Evidence: CCG to provide copy SEP to DH. DH to advise
NHS England which CCGs have submitted a SEP. 2. Has the CCG’s board approved the SEP and confirmed its alignment with the CCG’s current commissioning plans?
Evidence: CCG to provide written confirmation and copy of CCG Board minute 3. Is the SEP informed by a CCG-led Local Estates Forum
(LEF) under the local leadership of one or more CCGs? Evidence: CCG written confirmation supported by copy of the CCG’s LEF Terms of Reference
4. Does the SEP reflect CCG engagement with each of the providers it commissions services from in respect of their own estate strategies? Evidence: CCG written confirmation and review of SEP
5. Does the SEP include plans for better usage and the freeing up of redundant NHS estate for disposal or alternative use? Evidence: CCG written confirmation and review of SEP

144
Rationale for use and what it intends to achieve
In macro policy terms DH is moving to establish a national estates strategy with clear drivers to release value from the existing NHS estate (very largely in the hands of provider
trusts) both in cash terms (for reinvestment) and via the notional “currency” of housing units. DH with NHSIA will be exploring levers and incentives to influence action at provider (estate owning) level.
The substance of this indicator is to support that wider national agenda but in a way that recognises that CCGs can, as local system leaders, facilitate the exposure of
opportunities for efficiency gains and establish a sound platform for better informed investment and divestment opportunities by clinical estate owners (i.e. inform better practice), but at the same time recognising that as
commissioners they cannot impose or enforce action at provider level. A more strategic, local health economy led approach is
needed for more joined up management of the local NHS estate. Increasingly robust SEPs will enable commissioners to demonstrate, with increasing confidence, clarity and objectivity the relative priorities of local infrastructure
investment proposals and the capacity for better utilisation and rationalisation to ease capital and revenue affordability pressures implicit in those plans. This, in turn, will be of increasing value to them as competition for finite investment
resource inevitably intensifies.
Process of assessment DH has already gathered 172 SEPs covering all CCGs (there are fewer SEPs than CCGs because some SEPs cover more than one CCG area) and DH is undertaking an initial qualitative review of core content and key themes. DH
issued no guidance as to minimum content; its objective was to ensure that every CCG took the first step towards “owning “and driving an estates strategy locally.
DH is also setting up a new Policy Group to support the delivery of SEPs and provide updates to the National Estates Programme Board.
CCGs “own” their SEPs; SEPs may contain commercially sensitive/confidential information re future commissioning intentions, service provision, service reconfiguration so others in the system having permitted access to SEPs
would currently require data owners’ consent to distribution. SEPs are “living” documents so CCGs should refresh them periodically to assure continuing alignment to commissioning
plans, and DH intend to issue feedback derived from their

145
review of first cut plans in spring/early summer 2016 to help CCGs focus on those aspects of their current SEPs that would benefit most from further enhancement.
As the STP process gathers pace and maturity it is likely that SEPs will need to be refreshed to ensure alignment at CCG and STP footprint level. This may well be something to
emphasise through a revision of this indicator for 2017/18.
What is the published rating? Is contextual information
required?
Yes / No No, not for 2016/17
Frequency of
assessment/publication
Annual
How is consistency of information / assessments ensured?
N/A for 2016/17

146
WELL LED
Indicator
number
Indicator name 161a Sustainability and Transformation Plan 162a Probity and corporate governance 163a Staff engagement index 163b Progress against workforce race equality standard 164a Effectiveness of working relationships in the local system 165a Quality of CCG leadership

147
161a. Sustainability and Transformation Plan
Theme, Area Sustainability and Transformation Plan
Detailed description of indicator
This is not an assessment of the overall STP. The indicator is designed to make a one-off assessment of each CCG’s
participation in / contribution to ensuring a successful STP, during the first year of STP development.
Rationale for use and
what it intends to achieve
STPs are place-based, multi-year plans built around the
needs of local populations. They are not an end in themselves, but a means to build and strengthen local relationships enabling a shared understanding of where we are now, our ambition for 2020 and the concrete steps
needed to get us there. This is an assessment, at CCG level, of engagement with the STP as progress has been made on establishing STPs
throughout 2016/17. By the end of 2017/18 the programme will be embedded. An STP dashboard is in development and future assessments will be made at STP level. Therefore a stand-alone indicator is not required in the CCG
IAF in 2017/18, although key lines of enquiry on STPs will be included in the quality of leadership indicator.
Process of assessment The assessment of the indicator will be carried out by NHS England’s local teams who have on the ground knowledge of way their CCGs have been working with all partners
across an STP footprint to develop STP plans. The submissions of the draft STP plans have been assessed within regions. The evidence from this process, and any relevant regular assessment meetings, will form the basis of
the indicator assessment. The assessment will be rated green/amber/red on the CCG’s engagement with its STP where
Green = good engagement Amber = acceptable engagement Red = poor engagement
. What is the published
rating? Is contextual information required?
A green / amber / red rating.
Frequency of assessment
There will be a single assessment for 2016/17 carried out in line with year end.
How is consistency of information /
assessments ensured?
As an evidence-based judgement, the assessment of this indicator will be taken through the established regional and
national operational moderation process to ensure consistency. .

148
162a. Probity and corporate governance
Theme, Area Well led, Probity and corporate governance
Summary This indicator assesses CCGs’ compliance with a number of requirements of the revised statutory guidance on managing
conflicts of interest for CCGs. This indicator is to be considered along with each CCG’s annual internal audit of conflicts of interest management, which will provide further assurance on the level of compliance with the statutory
guidance.
Detailed description of indicator
This indicator consists of two parts: Part one: An annual self-certification that requests
confirmation that:
The CCG has a clear policy for the management of conflicts of interest (in line with the statutory guidance on managing conflicts of interest for CCGs)
and that the policy includes a robust process for the management of breaches.
The CCG has a minimum of three lay members. This includes confirmation of the number of CCG lay
members and how many days they are employed per month.
The CCG’s audit chair has taken on the role of the conflicts of interest guardian, supported by a senior
CCG manager(s).
A minimum of 90% of CCG staff have completed the mandatory conflicts of interest online training as of 31 January each year.
Part two: A quarterly self-certification that requests
confirmation that:
The CCG has processes in place to ensure individuals declare any conflict or potential conflict of interest as soon as they become aware of it, and within 28 days, ensuring accurate, up-to-date
registers are complete for: conflicts of interest; procurement decisions; and gifts and hospitality.
These registers are available on the CCG’s website and, upon request, at the CCG’s Head Quarters.
If there have been any breaches of the CCG’s policy on managing conflicts of interests. This includes confirmation that any breaches have been:
published on the CCG’s website,

149
communicated to NHS England.
Rationale for use and what it intends to achieve
CCGs need to appropriately and robustly manage conflicts of interest and demonstrate accountability to the public.
The indicator aims to evidence the implementation of the revised statutory guidance on managing conflicts of interest for CCGs and that conflicts of interest are being robustly and
proactively managed by CCGs. Process of assessment The self-certification (designed by the national co-
commissioning team) would be signed off as accurate by the CCG's Accountable Officer and the CCG’s Audit Chair. The form should then be submitted to NHS England's local team.
The local team will collate the information onto a spreadsheet and submit to the national co-commissioning team once responses have been obtained from all CCGs in their region.
NHS England may follow up on any responses to enable a decision to be reached on the effectiveness of the CCG's systems and processes in managing conflicts of interest.
NHS England’s local team and the national co-commissioning team will respond, as appropriate, to any identified need for support in the management of conflicts of
interest.
What is the published rating? Is contextual information
required?
The CCG will be rated as: • Compliant (if 100% of the criteria are met) • Partially compliant (if less than 100%, but more than 0%,
of the criteria are met) • Not compliant (if 0% of the criteria are met) The contextual information in brackets would be required.
Frequency of
assessment
Part One: Annual Assessment
The first annual data collection will be in quarter 4 of 2016/17, to allow CCG staff time to complete the mandatory online training on managing conflicts of interest which will be made available in the autumn of 2016. The part one
assessments are expected to be published in June 2017. Part Two: Quarterly Assessment
The first quarterly data collection will be in September 2016
(quarter 3) to allow time for CCGs to implement the new statutory guidance on managing conflicts of interest for CCGs, which will be published in June 2016. The first assessment of part two of this indicator will be published on
MyNHS in December 2016.

150
How is consistency of information / assessments ensured?
A template (designed by the national co-commissioning team) will be used to collect the data from each CCG. Local operational teams will discuss with the CCG where there is
missing data or insufficient detail.

151
163a. Staff engagement index
Theme, Area Well led, Workforce engagement
Definition The level of engagement reported by staff in the NHS staff survey for
providers in the NHS footprint of the CCG weighted according to the financial flows
Publication status In publication
Purpose
(Rationale)
To signal the expectation that CCGs demonstrate leadership across the
organisations in their part of the NHS. One part of this leadership role will be in encouraging the growth of organisational cultures in which the workforce is highly engaged. The composite indicator of workforce engagement will show the extent of progress in good engagement
across the patch which will inform discussions between the CCGs and their provider organisations on how further progress can be made.
Evidence and
policy base
The link between good leadership and quality patient outcomes is
increasingly understood. The NHS Leadership Academy, for instance, say “there’s so much evidence connecting better leadership to better patient care, Francis , Berwick , Keogh point to it and so does leading academic, Michael West . They all make the link between good
leadership and making a positive difference to patient care, care outcomes and the experience of care”. A variety of research reports have demonstrated clear links between levels of engagement (a mixture of how motivated staff are, how much they are able to suggest and implement improvements, and how
prepared they are to speak positively about their organisation) and a range of outcomes for trusts, including patient satisfaction, patient mortality, trust performance ratings, staff absenteeism and turnover. The more engaged a workforce is, the better the outcomes for patients; the
difference between an average and good trust on engagement would be equivalent to around a 5% decrease in absenteeism or turnover, or about a 4% decrease in mortality. Engagement has been steadily increasing as shown by the results of the NHS staff survey.
The role of CCGs in System Leadership is developing. NHS England’s website refers to “Support and development opportunities for CCGs (and HWBs) in 2014/15. “… NHS England has been working with the LGA, PHE and other national partners on the Health and Wellbeing System
Improvement Programme and support for System Leadership development. A wide-range of development opportunities are available to CCGs and their local partners, and NHS England have worked to maximise the alignment to CCG development needs, in their role as
statutory partners on health and wellbeing boards and local system leaders”. A recognition of this role is, for instance, demonstrated by The Advancing Quality Alliance (AQuA) whose CCG Systems leadership event in November 20156 had an agenda including “the role of CCGs as
system leaders … how to create collective vision, shared purpose and engagement …” Detailed information of current levels of engagement is contained in the results of the NHS staff survey.
(http://www.nhsstaffsurveys.com/Page/1006/Latest-Results/2015-Results/)
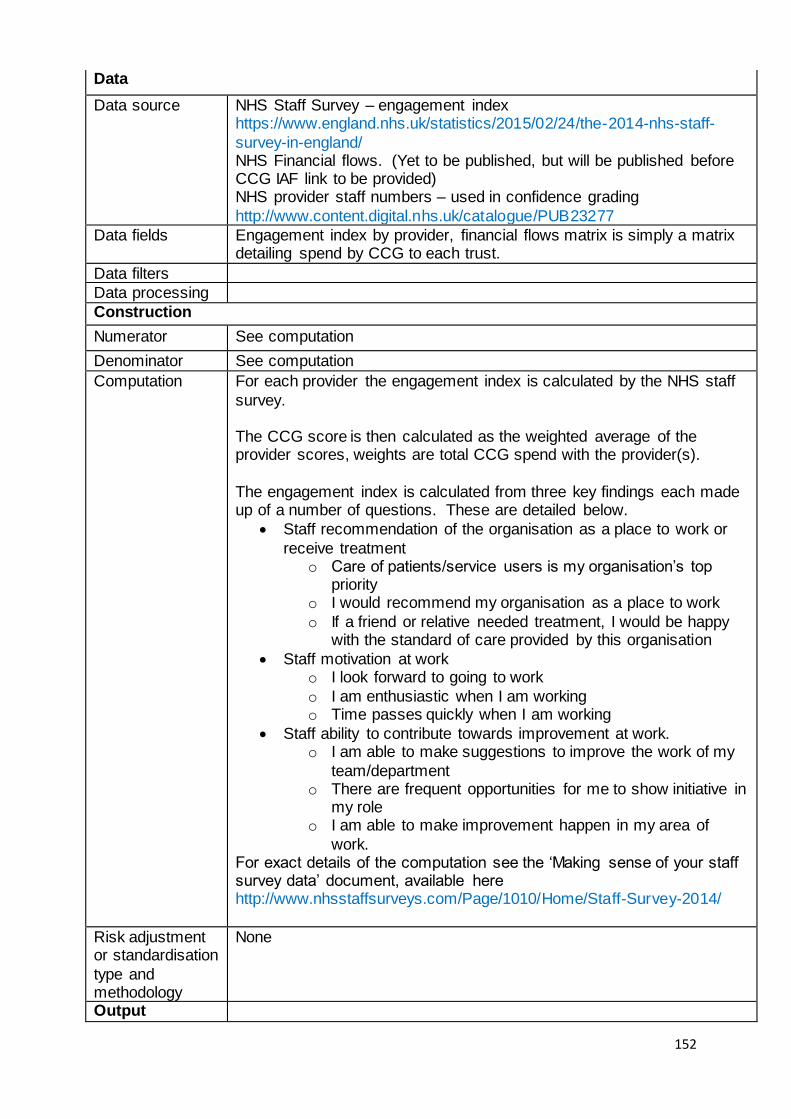
152
Data
Data source NHS Staff Survey – engagement index https://www.england.nhs.uk/statistics/2015/02/24/the-2014-nhs-staff-
survey-in-england/ NHS Financial flows. (Yet to be published, but will be published before CCG IAF link to be provided) NHS provider staff numbers – used in confidence grading
http://www.content.digital.nhs.uk/catalogue/PUB23277
Data fields Engagement index by provider, financial flows matrix is simply a matrix detailing spend by CCG to each trust.
Data filters
Data processing
Construction
Numerator See computation
Denominator See computation
Computation For each provider the engagement index is calculated by the NHS staff
survey. The CCG score is then calculated as the weighted average of the provider scores, weights are total CCG spend with the provider(s).
The engagement index is calculated from three key findings each made up of a number of questions. These are detailed below.
Staff recommendation of the organisation as a place to work or
receive treatment o Care of patients/service users is my organisation’s top
priority o I would recommend my organisation as a place to work
o If a friend or relative needed treatment, I would be happy with the standard of care provided by this organisation
Staff motivation at work o I look forward to going to work
o I am enthusiastic when I am working o Time passes quickly when I am working
Staff ability to contribute towards improvement at work. o I am able to make suggestions to improve the work of my
team/department o There are frequent opportunities for me to show initiative in
my role o I am able to make improvement happen in my area of
work. For exact details of the computation see the ‘Making sense of your staff survey data’ document, available here http://www.nhsstaffsurveys.com/Page/1010/Home/Staff-Survey-2014/
Risk adjustment or standardisation
type and methodology
None
Output

153
Frequency of
publication
Annually

154
163b. Progress against workforce race equality standard
Theme, Area Well led, Workforce engagement
Definition At a provider level the Workforce Race Equality Standard
relates to one indicator. For the CCG IAF indicator we use the staff survey indicator that shows the strongest, most consistent evidence of discriminatory treatment of BME staff when compared to white staff, this is
KF 27. Percentage believing that trust provides equal opportunities for career progression or promotion.
The CCG indicator aims to represent where the ‘patch’ of each CCG is up to in terms of WRES. Currently the CCG indicator is made up of a weighted average of trust level scores. Weights are given by the spend of the CCG to each
of its providers and trust level scores given by the sum of the staff survey indicators.
Publication status In publication
Purpose (Rationale) To signal the expectation that CCGs demonstrate leadership across the organisations in their part of the NHS. One part of this leadership role will be to demonstrate a commitment to equality including race equality. CCGs will need to
demonstrate their use of the Workforce Race Equality Standard within their own organisations and to expect NHS providers in their footprint to do the same. The composite indicator of workforce race equality will show the extent of
progress towards race equality across the patch, and will inform discussions between CCGs and their providers around how further progress can be made in race equality and more widely across all indicators of the Workforce Race
Equality Standard and other dimensions of equality
Evidence and policy base The link between good leadership and quality patient outcomes is increasingly understood. The NHS Leadership
Academy, for instance, say “there’s so much evidence connecting better leadership to better patient care, Francis , Berwick , Keogh point to it and so does leading academic, Michael West . They all make the link between good
leadership and making a positive difference to patient care, care outcomes and the experience of care”. This, in part, is the rationale behind the Workforce Race Equality Standard. The NHS Staff Survey results and the Patient Survey results
suggest that “the experience of Black and Minority Ethnic (BME) NHS staff is a good barometer of the climate of respect and care for all within the NHS. Put simply, if BME staff feel engaged, motivated, valued and part of a team with
a sense of belonging, patients were more likely to be satisfied with the service they received. Conversely, the greater the proportion of staff from a BME background who

155
reported experiencing discrimination at work in the previous
12 months, the lower the levels of patient satisfaction.” Discrimination is reported at exceptionally high levels by several minority groups, particularly Black staff, Muslim staff, disabled staff and non-heterosexual staff, even when
controlling for all other demographic and work-related factors. In addition the more a workforce is representative of the local community in terms of ethnicity, the more patients report being treated with civility, and the better the outcomes
for the trust. This suggests that focussing on civil treatment may be an important driver of performance, particularly where staff ethnicity is not similar to that of patients. By measuring discrimination and incivility experienced by the
BME staff employed by their providers, CCGs can assess the likely care their BME patients receive. The role of CCGs in System Leadership is developing. NHS England’s website refers to “Support and development
opportunities for CCGs (and HWBs) in 2014/15. “… NHS England has been working with the LGA, PHE and other national partners on the Health and Wellbeing System Improvement Programme and support for System
Leadership development. A wide-range of development opportunities are available to CCGs and their local partners, and work has been done to maximise the alignment to CCG development needs, in their role as statutory partners on
health and wellbeing boards and local system leaders”. A recognition of this role is, for instance, demonstrated by The Advancing Quality Alliance (AQuA) whose CCG Systems leadership event in November 20156 had an agenda
including “the role of CCGs as system leaders … how to create collective vision, shared purpose and engagement …”
Detailed information of current levels of inequality is contained in the results of the NHS staff survey. (http://www.nhsstaffsurveys.com/Page/1006/Latest-Results/2015-Results/)
Patients First and Foremost - The Initial Government Response to the Report of The Mid Staffordshire NHS Foundation Trust Public Inquiry, Presented to Parliament by
the Secretary of State for Health by Command of Her Majesty, March 2013 A promise to learn – a commitment to act. Improving the Safety of Patients in England. National Advisory Group on
the Safety of Patients in England, August 2013 The Keogh Mortality Review, Review Reports. NHS Choices, July 2013 http://www.nhs.uk/NHSEngland/bruce-keogh-review/Pages/terms-of-reference.aspx

156
Employee engagement and NHS performance, Michael A West, Lancaster University, Jeremy F Dawson, University of Sheffield. Work commissioned by Kings Fund, 2012 West, M et al 2012 NHS Staff Management and Health
Quality Results from the NHS staff survey and related data. Data
Data source NHS Staff Survey - KF 27. Percentage believing that trust provides equal opportunities for career progression or promotion.
- The above restricted to BME and White respondent groups – aligned to the Workforce Race Equality indicators related
to staff experience. https://www.england.nhs.uk/statistics/2015/02/24/the-2014-nhs-staff-survey-in-england/
NHS Financial flows. (unpublished, but the spend used for each CCG can be shared with the relevant CCG) NHS provider staff numbers – used in confidence grading.
http://www.content.digital.nhs.uk/catalogue/PUB23277
Data fields Items as above, restricted by ethnicity of responders into BME and White, financial flows matrix is simply a matrix
detailing spend by CCG to each trust.
Data filters
Data processing Construction
Numerator See computation
Denominator See computation
Computation For each provider the WRES score is calculated by the sum
of the difference between the BME and White WRES key findings. The CCG score is then calculated as the weighted average of the provider scores, weights are total CCG spend with the
provider(s). Where a provider has a missing score for BME due to small numbers all the scores for that provider are treated as missing. The degree of missing data is reported in the confidence grade. For 14/15 33 providers had
missing data.
Risk adjustment or
standardisation type and methodology
None
Output
Frequency of publication Annually

157
164a. Effectiveness of working relationships in the local system
Theme, Area Well led, CCGs’ local relationships
Definition This metric would be taken from the annual CCG stakeholder 360 survey and would draw on the responses to
2 questions. Each of the key stakeholder groups: upper tier / unitary local authority; health and wellbeing board; Healthwatch and patient groups; GP member practices; NHS providers; other CCGs and key wider stakeholders
would be asked to provide an overall rating of their working relationship with the CCG. The available categories would be very good, fairly good, neither good nor poor, fairly poor, very poor. Additionally stakeholders would be asked to rate
the CCG as an effective local system leader in the categories very effective, fairly effective, neither effective nor ineffective, not very effective, ineffective.
Publication status In publication
Purpose (Rationale) To identify relationships that need to be strengthened and
areas within the system where support may be necessary
Evidence and policy base This measure shows the current status of the CCG's local system working relationships. This identifies relationships that need to be strengthened and areas within the system where support may be necessary. It also gives an
assessment from the other key stakeholders of the CCG's effectiveness as a leader in its health and care system. The wider stakeholder survey provides assurance of continuing organisational development, provides triangulation of
evidence of stakeholder and partnership working across the health economy and provides value to NHS England and CCGs as an insight tool.
Data
Data source NHS England – CCG stakeholder 360 survey
Data fields Two questions asked of all stakeholders: • Overall, how would you rate your working relationship with your CCG/with CCG? Response options: Very good, Fairly
good, Neither good nor poor, Fairly poor, Very poor, I/we do not have a working relationship with CCG, Don’t know • How effective, if at all, do you feel CCG is as a local system leader? Response options: Very effective, Fairly
effective, Not very effective, Not at all effective, Don’t know
Data filters N/A
Data processing N/A Construction
Numerator N/A
Denominator N/A
Computation A score is created for each respondent which can vary between 0 and 100, with 100 the best possible score. This
is based on coding each response to the 2 questions on a linear scale and taking an unweighted average of the two

158
questions. An average score is then calculated for each
CCG. Missing data – “Don’t Know” or “I/we do not have a relationship with CCG” - would be taken as an indication of a
poor working relationship and coded at the low end of the scales, equivalent to “fairly poor” and “very poor” respectively.
The level of responses will be considered as contextual information.
Risk adjustment or standardisation type and methodology
None
Output
Frequency of publication Annually

159
165a. Quality of CCG leadership
Theme, Area Well led, Quality of leadership
Summary Four key lines of enquiry will be assessed to determine how robustly the senior levels of a CCG are performing their leadership role.
Detailed description of
indicator
On the basis of evidence provided by the CCG, four key
lines of enquiry (KLOE) will be reviewed. Some will be reviewed at least quarterly (Q) and some annually, unless there is leadership change or an interdependency with another indicator (A).
Robust culture and leadership sustainability (A)
The clinical and non-clinical leadership, and all levels of the organisation, demonstrate a shared understanding of the CCG’s values and operate with openness and
transparency.
The leadership actively promotes and develops strong relationships within its local system to ensure that its population is getting the best health and care outcomes.
In particular, the CCG contributes fully to its STP.
The CCG has an OD plan that focuses on talent management and which will develop clinical and non-clinical leaders to meet current and future operating
challenges. Succession planning takes in to account the risk of turnover in senior roles, and includes a focus on financial leadership.
Quality (Q)
There is a focus on quality at governing body level with frequent and regular reports to the governing body and discussions focusing on driving improvements in quality, safety, outcomes and delivery of Constitutional
standards.
The CCG has effective systems and processes for monitoring and acting on a range of information about quality, from a variety of sources, including patient
feedback, so that the CCG is able to identify early warnings of a failing service.
Governance (Q)
The governance framework ensures that responsibilities are clear, regular review is built in, and that quality, performance, and finance risks are understood and managed.
The CCG has effective arrangements in place to obtain appropriate advice for enabling it effectively to discharge its functions, in line with its statutory duty under section 14W of the NHS Act 2006 (as amended).

160
The CCG matches the characteristics of an organisation with strong financial leadership, described in annex A.
Engagement and involvement (A)
The CCG has governance processes which embed participation throughout the organisation and across the commissioning cycle. It can evidence how decisions taken by the Governing Body (and any relevant sub-
committees) are informed by engagement with – and the views of – patients and the public.
The CCG has built, and continues to build, robust relationships with their local communities. It supports
strong partnerships with voluntary and community organisations, local Healthwatch, and patient groups.
The CCG can demonstrate how it has identified and engaged with ‘seldom heard’ groups, and the full
diversity of the local population.
Prior to commencing engagement activity, the CCG considers and uses existing sources of insight about patient and public views and experiences.
The CCG holds its providers to account for how they involve patients in their own governance, decision-making and quality improvement activities.
The CCG “closes the loop” whenever it seeks the views of patients and the public by feeding back the results of consultation and engagement activities and explaining how views have been considered and had an impact on
decisions. Rationale for use and
what it intends to achieve
The 15/16 CCG assurance framework assessed CCGs on
whether they were well led organisations. A well-established process is in place for reviewing sources of insight and reaching a consistent, evidence-based judgement In this area.
A medium term aim would be for all CCGs to reach and maintain a green rating.
Process of assessment Review of insight will be undertaken by NHS England’s local teams, including a senior level conversation or meeting with relevant, director level members of the DCO and CCG
teams. An evidence based judgement will be made against the indicator criteria. A risk based schedule of reviews will be put in place at the
start of each year, although insight received may prompt a review outside of the schedule. For example, deteriorating performance or finances may highlight concerns relevant to the key lines of enquiry in the quality of CCG leadership
indicator. Evidence would be drawn from, but not limited to, CCG IAF

161
data and the CCG's own documents such as board papers, annual report and governance statement, reporting, monitoring and assurance systems, records of improvement actions undertaken, risk logs, clinical, internal and external
audit reports, OD plan, staff turnover rates, PDR completion rate, patient and public engagement /participation /involvement strategy and policy, up-to-date website information about opportunities for involvement.
As the CCG’s risk level and local context will be taken in to account, not all sources of evidence described above would necessarily be considered for all CCGs at each review.
A green / amber / red rating would be used: A green rating would be given when the CCG has no issues or minor / low risk issues. Within this banding, a CCG that is considered very good, with practice that could be replicated
as an exemplar, would be awarded a green star rating. An amber rating would be given when more serious weaknesses have been identified A red rating would be given when there is significant failure
to meet requirements.
What is the published rating? Is contextual information
required?
A RAG rating is published with a small amount of text describing the criteria for each rating, as stated in the previous section.
Frequency of
assessment
Some key lines of enquiry are reviewed at least quarterly
and some annually. A risk based schedule of reviews has been put in place by the local NHS England team, although insight received may prompt a review outside of the schedule. The most current position is reported on a
quarterly basis.
How is consistency of information / assessments ensured?
Continuation of the current regional consistency checking, overseen by the regional director, and national moderation which takes place at the CCG improvement and assessment
delivery group, chaired by the director of NHS operations and delivery.
Additional information Annex A – Characteristics of an organisation with good financial leadership
A substantive director of finance is in place and the chair of the audit committee is a qualified accountant;
Good evidence of challenge of financial information by audit committee and governing body;
The CCG operates a robust system of financial controls including segregation of duties;
Budgets are actively used as part of the financial control environment;

162
SFIs are kept up to date, are appropriate to the organisation, are understood by and followed by all staff;
There is consistency of reporting between summary financial information reported internally and externally, across ledgers and related financial reporting such as agreement of balances;
Clean external and internal audit opinions in the previous year’s accounts;
Good quality reports on the financial position and the financial control environment to the governing body;
Good risk management processes operate in the CCG, including the identification, quantification and mitigation of risk, and robust processes for reporting risk to the governing body;
Evidence of a good understanding of the CCG’s underlying financial position;
Clear links between financial and activity information;
Reliable and well understood plans and forecasts; Realistic and robust QIPP plans which are supported by a sound delivery architecture