ccmod: a gate module for compton camera imaging simulation
TRANSCRIPT

HAL Id: hal-02497878https://hal.archives-ouvertes.fr/hal-02497878
Submitted on 22 Dec 2020
HAL is a multi-disciplinary open accessarchive for the deposit and dissemination of sci-entific research documents, whether they are pub-lished or not. The documents may come fromteaching and research institutions in France orabroad, or from public or private research centers.
L’archive ouverte pluridisciplinaire HAL, estdestinée au dépôt et à la diffusion de documentsscientifiques de niveau recherche, publiés ou non,émanant des établissements d’enseignement et derecherche français ou étrangers, des laboratoirespublics ou privés.
CCMod: a GATE module for Compton camera imagingsimulation
A. Etxebeste, D. Dauvergne, M. Fontana, J.M. Létang, G. Llosá, E. Munoz,J.F. Oliver, É Testa, D. Sarrut
To cite this version:A. Etxebeste, D. Dauvergne, M. Fontana, J.M. Létang, G. Llosá, et al.. CCMod: a GATE modulefor Compton camera imaging simulation. Phys.Med.Biol., 2020, 65 (5), pp.055004. �10.1088/1361-6560/ab6529�. �hal-02497878�

CCMod: a GATE module for Compton Cameraimaging simulation
A. Etxebeste1, D. Dauvergne2, M. Fontana3, J. M. Letang1,G. Llosa4, E. Munoz4, J. F. Oliver4, E. Testa3 andD. Sarrut1
1Universite de Lyon, CREATIS, CNRS UMR5220, Inserm U1044, INSA-Lyon,Universite Lyon 1, France.2LPSC, Universite Grenoble-Alpes, CNRS/IN2P3 UMR 5821, Grenoble, France.3Universite de Lyon, CNRS/IN2P3, UMR 5822, IPNL, F-69622 Villeurbanne,France.4Instituto de Fısica Corpuscular, CSIC/Universitat de Valencia, Valencia, Spain.
E-mail: [email protected]
Abstract.Compton cameras are gamma-ray imaging systems which have been
proposed for a wide variety of applications such as medical imaging, nucleardecommissioning or homeland security. In the design and optimization of such asystem Monte Carlo simulations play an essential role. In this work, we proposea generic module to perform Monte Carlo simulations and analyses of ComptonCamera imaging which is included in the open-source GATE/Geant4 platform.Several digitization stages have been implemented within the module to mimicthe performance of the most commonly employed detectors (e.g. monolithicblocks, pixelated scintillator crystals, strip detectors...). Time coincidence sorterand sequence coincidence reconstruction are also available in order to aim atproviding modules to facilitate the comparison and reproduction of the datataken with different prototypes. All processing steps may be performed duringthe simulation (on–the–fly mode) or as a post–process of the output files (offlinemode). The predictions of the module have been compared with experimentaldata in terms of energy spectra, angular resolution, efficiency and back-projectionimage reconstruction. Consistent results within a 3-sigma interval were obtainedfor the energy spectra except for low energies where small differences arise. Theangular resolution measure for incident photons of 1275 keV was also in goodagreement between both data sets with a value close to 13◦. Moreover, with theaim of demonstrating the versatility of such a tool the performance of two differentCompton camera designs was evaluated and compared.
Keywords: Monte Carlo, simulation, gamma imaging, Compton camera
1. Introduction
Compton Cameras (CCs) are actively collimated gamma-ray imaging devices whichhave been originally designed for astronomy applications. Their first applicationin medical imaging was proposed in (Todd et al. 1974). Thenceforth, there hasbeen an interest in their application in the field of nuclear medical imaging (Hanet al. 2008, Seo et al. 2008, Harkness et al. 2009, Karimian et al. 2009, Alnaaimiet al. 2011, Odaka et al. 2012, Calderon et al. 2014, Fontana et al. 2017). Inaddition, there is also a growing interest in their use to image the prompt gamma

CCMod: a GATE module for Compton Camera imaging simulation 2
emission produced during proton therapy for in-vivo range assessment (Richardet al. 2011, Peterson et al. 2010, Kormoll et al. 2011, Polf et al. 2015, Hilaireet al. 2016, Solevi et al. 2016, Rohling et al. 2017).
In nuclear medicine, Single Photon Emission Computed Tomography (SPECT)Anger gamma-camera is nowadays one of the most widespread imaging techniquesfor diagnosis. The main drawback of this technique is that the sensitivity is inverselyproportional to the spatial resolution due to the use of mechanical collimation. In orderto overcome this limitation, the use of active collimation systems such as CCs has beenproposed. They usually consist of several position and energy sensitive gamma raydetectors arranged in scatterer and absorber planes working in time coincidence. Usingthe kinematics of Compton scattering, the origin of the gamma-ray can be constrainedto a cone surface. As a result of the intersection of different cones, information of theactivity distribution can be obtained.
However, to our knowledge, commercial devices have only been proposed forastronomy or for envirommental measurements in homeland security but not formedical applications, even if several prototypes have been built (Llosa et al. 2006, Seoet al. 2010, Alnaaimi et al. 2011, Takeda et al. 2012, Kurosawa et al. 2012, Kishimotoet al. 2015, McCleskey et al. 2015, Thirolf et al. 2016, Golnik et al. 2016, Munozet al. 2017, Lee et al. 2017). The high performance required in terms of energy,spatial and time resolution when CCs are employed in medical applications togetherwith the complexity of the image reconstruction algorithms have prevented them frombecoming a commercial medical imaging system. These gamma-ray imaging devicesneed to be further investigated and optimized to reach the clinical standards for whichaccurate Monte Carlo (MC) simulations are required.
MC simulations play an essential role in the design and optimization ofthese systems (Richard et al. 2011), the validation of reconstruction algorithms(Andreyev et al. 2016) and the extrapolation of the behaviour of these devices tounavailable situations in order to predict their potential (Munoz et al. 2017). Severalparticle-tracking MC simulation software packages have been used to simulate CCs,such as CIS (Lee et al. 2009), MEGAlib (Zoglauer et al. 2006), GAMOS (Arceet al. 2008, Harkness et al. 2012), Geant4 (Richard et al. 2011, Peterson et al.2010, Rohling et al. 2017, Fontana et al. 2017), SWORD (Novikova et al. 2006) orBEAMnrc/EGSnrc (Sinclair et al. 2009). GATE/Geant4 (Jan et al. 2011, Sarrutet al. 2014) is an open-source and collaborative simulation platform dedicated tomedical physics applications which is based on the well established general purposeGeant4 software (Allison et al. 2016). Nowadays, GATE is commonly used for emissiontomography simulations (Gillam and Rafecas 2016), notably due to the broad range ofexperimental settings that can be simulated by using macro language. GATE alreadycontains dedicated modules for SPECT and PET imaging.
In this work, we present an extension of GATE toolkit with the aim of supportingCC simulations. This new Compton Camera Module (CCMod) facilitates theinvestigation of CC systems and realistic comparisons between different prototypesin an environment that allows to simulate several imaging devices, radiotherapytreatments and perform dosimetry calculation in the same framework. As an example,simulations of protontherapy beam lines (Grevillot et al. 2011, Grevillot et al. 2012)are already available and may be used to generate realistic distributions of prompt-gammas (Gueth et al. 2013, Huisman et al. 2016) that may be investigated with CCs.Moreover, GATE already contains specific modules for medical physics simulations,which allow to easily insert a voxelized CT image from a DICOM file or to read and

CCMod: a GATE module for Compton Camera imaging simulation 3
analyze list mode format among others. In this work, the predictions of CCModhave been compared with experimental data taken with MACACO prototype builtat IFIC-Valencia (Munoz et al. 2017). The developed tools have been employed toillustrate their capability to characterize and enhance experimental data by developingdedicated filtering criteria to reduce the fraction of background events. Furthermore,the performance of two different CCs has been characterized in terms of efficiency andangular resolution showing the versatility of this open-source module.
2. Materials and Methods
All the simulation studies included in this work were performed with Geant4version 10.5 and GATE version 8.2.
2.1. Compton Camera module
2.1.1. Compton Camera principles. CCs employ electronic collimation based onCompton kinematics. A conventional CC is comprised of a scatterer and an absorberdetector layer working in time coincidence. Ideally, the gamma-ray undergoes aCompton interaction in the closest detector layer, referred to as scatterer, wherethe recoil electron deposits its energy, and the scattered photon is absorbed in theabsorber. Using the kinematics of Compton scattering the incident trajectory of thegamma-ray can be constrained to a cone surface. However, in experimental data thereis a non-negligible percentage of invalid events that contribute to the backgroundsuch as partial energy absorption events (recoil electron or scattered photon escape),incorrectly ordered interactions and randoms.
CCs typically consist of low-Z material for the scatterer and high-Z materialfor the absorber in order to maximize the probability of Compton scattering in thescatterer and photoelectric absorption of the scattered photon in the absorber. Theenergy resolution of the scatterer is particularly important to accurately determine thescattering angle. To this end, a low Z material is also of special interest to reduce theeffect of Doppler energy broadening, Compton profile, due to the initial momentumof the bound electron (Ordonez et al. 1997).
In most proposed designs, the device is comprised of a scintillator detectorfor the absorber and one or several detector layers for the scatterer based ondifferent technologies such as scintillator crystals coupled to compact SiPM/MPPCarrays (Munoz et al. 2017, Kishimoto et al. 2015), semiconductor detectors (Seoet al. 2010, Thirolf et al. 2016, Golnik et al. 2016, Lee et al. 2017, Fontana et al. 2017)or gaseous detectors (Kurosawa et al. 2012). In addition, CCs composed only ofsemiconductor detector layers (Alnaaimi et al. 2011, Takeda et al. 2012, McCleskeyet al. 2015) have been successfully built and tested.
The aim of CCMod is to provide a framework where different systemconfigurations can be easily simulated in a medical environment. It was designedto model the most common CC configuration with a scatterer and an absorber.However, it can be adapted to accommodate other designs such as one single positionsensitive detector system that acts as scatterer and absorber at the same time (Lehneret al. 2004, Mihailescu et al. 2007, Maier et al. 2017, Montemont et al. 2017) that canbe of interest in homeland security applications.

CCMod: a GATE module for Compton Camera imaging simulation 4
2.1.2. GATE module. CCMod has been implemented as a dedicated GATE actorthat follows the same structure to store and process the interaction of particles as theSPECT and PET scanner systems (Jan et al. 2011). Portions of the geometry aredesignated as Geant4’s sensitive detectors where interactions are recorded. Here, theabsorber and scatterer layers store information about all particle interactions fromnow on referred to as hits. A hit contains the interaction process type (Compton,photoelectric, ionization...), the layer name, the position interaction, the depositedenergy, the time and information on parent particle among others.
Individual detector layer responses obtained from the aggregation of the hitsare referred to as singles. The singles are then sorted in time and associated incoincidences. Finally, the singles within each coincidence are ordered generating asequence coincidence. This sequence determines the cone surface. This processingfrom interactions to cone information is divided into three different steps namelydigitizer, sorter and coincidence sequence reconstruction which are explained in detailin sections 2.1.3 to 2.1.5. At each step the corresponding output data (hit collection,singles, coincidence, sequence coincidence) are available to the user. All processingsteps may be performed during the simulation (on-the-fly mode) or on the simulationoutput files (offline mode).
A similar data format for hit collection and singles as for SPECT and PETmodules has been used to be able to share the digitizer modules and sorter betweenthe different imaging devices. Hence, some of the already available modules for SPECTand PET systems (Jan et al. 2004), e.g. energy resolution, time resolution, energywindow, spatial resolution, and dead-time, can be directly applied in CCMod. Severalnew modules, briefly described in section 2.1.3, have been developed to meet the needsof some of the most commonly employed CC configurations. The features included inthese additional modules, that can be equally applied to SPECT/PET systems, canbe of interest to simulate more accurately and further understand the acquired dataalso in those imaging modalities.
2.1.3. Digitizer. The digitizer consists of applying sequentially a chain of modulesto the hit collection to mimic the individual detector response creating the singles. Inorder to reproduce accurately the response of a detector, the modules that composethe digitizer chain must be carefully selected.
With the aim of modeling the response of the most commonly employed detectorsin CCs such as semiconductor, pixelated and monolithic scintillator detectors (see2.1.1), several modules have been implemented. These modules can be classifiedinto three different categories. The first one corresponds to those that spatiallyregroup hits to take into account the characteristics of the signal generation in thedetector such as grid discretization module which simulates the response of pixelatedor strip detectors. The second one corresponds to modules that modify the observablevalues of the singles such as Depth of Interaction (DoI) modeling or 3-dimensionalspatial resolution module. The last category comprises those modules that filter thesingles such as energy threshold modules. Figure 1 shows the general structure ofthe digitization chain divided into the aforementioned three categories applied to a5-hit-collection composed of three photon interactions, two Compton scattering and aphotoelectric absorption, and two secondary electronic interactions. As an example,the response of a monolithic block readout by position sensitive photo-detectors isapproached by applying a hit regrouping module to collect the total energy depositedby the hits and provide the energy weighted centroid position.

CCMod: a GATE module for Compton Camera imaging simulation 5
Since in CCs different detector layers have usually different roles andcharacteristics, these modules have been designed so that they can be applied locallyto a specified sensitive volume. In addition, with the aim of recovering Comptonkinematics, a module that provides the information of the incident photon before andafter each interaction has been developed. Additional modules can be easily added bythe users to take into account unforeseen situations in specific configurations.
The digitization of optical photons has not been considered in CCMod. Theperformed simulations do not include the generation and transport of optical photonswhich highly increase the computational cost (Bonifacio et al. 2010). However,several digitization modules, such as DoI module which models the influence of thelight distribution on the 3-dimensional spatial resolution of the detector, have beenimplemented aiming at reproducing the response of scintillator crystals.
2.1.4. Sorter. In Geant4, events are created sequentially. However, singles are notnecessarily arriving to the sorter in chronological order. Therefore, they are orderedby their simulation time value before being sorted in time, generating coincidenceswhen they are detected within the same Time Coincidence Window (TCW). To thisend, the sorter developed in GATE for PET systems (Strydhorst and Buvat 2016) hasbeen adapted for CCMod. By default, Single Window method is selected where aslong as a coincidence window is opened, no other single can open its own coincidencewindow. Multiple Window method is also available as for PET systems. An additionaloption has been included to allow only singles in the absorber layer to open its ownwindow (absorber coincidence trigger). The criterion set for CC coincidence processingacceptance is that at least two of the singles within the TCW are recorded in differentdetector layers.
2.1.5. Coincidence Sequence Reconstruction (CSR). The CSR is a coincidenceprocessor which modifies the order of the singles within a coincidence to generatea sequence coincidence. In CCs, CSR plays an essential role since the correct sequenceof singles is necessary to determine the correct cone surface where the source is located.By default, the singles within a coincidence are ordered according to their detectiontime, i.e by increasing time-stamp value. This policy is referred to as ideal. However,since the time resolution of the detector layers is generally not good enough to identifythe correct interaction sequence, different policies are adopted. CCMod includesseveral policies namely random, distance to the source and the above described idealpolicy. The distance to the source policy orders the singles by increasing distance tothe source in the perpendicular direction to the camera, i.e. first singles in the firstlayer. Furthermore, a policy based on the so-called revan analyzer from MEGAlib(Zoglauer et al. 2008), known as Classic Coincidence Sequence Reconstruction (CCSR)has been included.
Coincidence processing modules already available for PET systems, such as dead-time or memory buffer can also be employed in the CCMod.
2.2. Comparison with experimental data
2.2.1. MACACO prototype The predictions of CCMod were compared withexperimental data taken at IFIC–Valencia with the first version of MACACO (MedicalApplications CompAct COmpton camera) prototype (Munoz et al. 2017). Theprototype is based on LaBr3 monolithic crystals coupled to SiPMs. The system

CCMod: a GATE module for Compton Camera imaging simulation 6
1. CS
5. PE
3. CS
2. EI
4. EI
5-hit collection
Monolithic block Strip/pixelated detector
Hit regrouping modules
Energy threshold at the local (e.g. pixel) and/or global (e.g. block) level
Multiplicity selection
MPM (Model of Pixel response for a SiPM array coupledto a Monoblock)
DoI set to the center ofthe block
+
5
Optional adder for clusters (sum of energies and CoGfor position)
Filtering modules (trigger)
Model of detector response observable values
Energy resolution3D spatial resolution /DoI modelsTime resolution
31
2
4
Solid angle
weighted energy1
21
2
Do
I
located in thedead space
CS (Compton), PE (Photoelectric effect),EI (electron ionization).
Effective energy of cluster i at pixel level
Grid-discretization moduleClustering module
dead
spa
ce
Figure 1: Scheme of the digitization chain applied to a 5-hit-collection where xhiti
and Ehiti are i-th hit position and energy deposition respectively. For simplicity, the
set of possible hits associated to the recoil electron are represented by a single hit.The position and the energy deposition of clusters after applying a hit regrouping
module are represented by xci and Ec
i respectively.
setup, the so-called configuration 1 in (Munoz et al. 2017), was composed of twolayers separated by 50 mm. Both layers were made of monolithic scintillator crystalscoupled to SiPM arrays with active area elements of 3×3 mm2. The crystal sizes were27.2×26.8×5 mm3 and 32.0×36×10 mm3 for the first and second layer respectively.The first layer was based on four Hamamatsu MPPC S11830-3340MF monolithicarrays whereas the second one was based on an older version S11064-050P(X1) withlarger gaps between the pixels. More details can be found in (Munoz et al. 2017).A second version of the prototype is currently under development based on higher

CCMod: a GATE module for Compton Camera imaging simulation 7
performance SiPM arrays with the aim of improving the energy resolution of theprototype. The SiPM, model S13361-3050AE-08, is based on TSV (Through SiliconVia) technology. Further information is available in (Barrio et al. 2018).
The reported measurements, unless otherwise stated, were taken with the firstversion of the prototype and a 22Na source of 847 kBq activity located in the centerof the first plane at a perpendicular distance of 53 mm (see figure 2). The acquisitiondiscriminator threshold applied at pixel level was set about 70 keV for each plane(sum of the values in all 64 pixels) (Munoz et al. 2017).
2.2.2. Simulation characteristics
Geometry Two sets of simulations were performed to reproduce the experimentaldata: a simplified geometry in which only the volumes corresponding to the sensitivedetector layers (scintillator crystals) were included and another one in which additionalinsensitive components of the prototype i.e. crystal encapsulation, crystal holder,PCBs (printed circuit boards) and the SiPMs, were included in order to take intoaccount their contribution to photon scattering. The compositions, densities andthicknesses of these materials are not exactly known and they were not optimized.The camera was simulated in air. Both geometries are shown in figure 2.
50 mm
53 mm
Holder (5.6 mm)Encapsulation (0.1 mm)Crystal (5.0 mm)SiPM (0.4 mm)PCB (2.0 mm)
5 mm
10 mm
Layer-1
Layer-2
5 mm
10 mm
27.2 mm x 26.8 mm
32 mm x 36 mm
5.6
mm
Figure 2: Simulated geometry. Left, geometry with the main parts of the passivematerials of the experimental set up included. Right, simplified geometry.
Processing The first step of the processing was the digitization of the hits toreproduce the response of the detector-layers, see section 2.1.3. The digitization chainwas designed with the aim of modeling the experimental response of a monolithiccrystal coupled to a SiPM matrix with an acquisition discriminator threshold appliedat pixel level.
Following the general structure shown in figure 1, a hit regrouping module wasfirstly applied. The clustering module was selected to group the hits within anacceptance distance of 3 mm, which corresponds to the SiPM pixel size. Then, themaximum deposited energy in a SiPM pixel of the array (Ec
effect,i) was approximatedanalytically without the generation and transport of optical photons using the MPM,namely the Model of Pixel response for a SiPM array coupled to a Monoblock, seefigure 1. This effective energy at pixel level was obtained for each cluster by weighting

CCMod: a GATE module for Compton Camera imaging simulation 8
its energy by the fraction of the solid angle subtended by a virtual pixel centered atthe cluster X-Y position at the readout surface of the crystal. Then, the conventionaladder was applied to generate a single signal per layer and per event where the energycorresponds to the total deposited energy of all the clusters in the layer and theposition to the energy weighted centroid position. Pile up effect was not includedsince it was negligible in the experimental data.
After the hit regrouping modules, energy and spatial resolution modules wereapplied. The energy resolution was set to 8.5% at 511 keV in the first layer, withan energy dependence following the inverse square root law policy. In the secondlayer however a slightly worse resolution of 12.5% at 511 keV was set to matchthe experimental data. The influence of the temperature variations on the energyresolution was not modeled. Regarding the transverse spatial resolution, a 2 mmGaussian blurring was applied. In this work, the DoI uncertainty was modelled as anexponential function with a coefficient of −0.3507 mm−1 (Cabello et al. 2015) and avalue of 8 mm FWHM at the entrance of the crystal. However, different models weretested for DoI, such as dual layer model or Gaussian blurring for the DoI uncertainty,yielding equivalent results.
Finally, a local threshold was applied at pixel level where if at least the effectiveenergy of one of the clusters (Ec
effect,i) was above the threshold the whole eventwas accepted for processing. Due to the uncertainties in the applied experimentaldiscriminator threshold which was set to get a global energy threshold in each layer ofabove ∼70 keV (Munoz et al. 2017), and the simplified model employed to reproduceit, discrepancies between the simulated and experimental accepted singles distributionare expected. In order to minimize them, a slightly higher global energy threshold of85 keV was also applied to the total energy deposition in each layer to both data sets.
After the digitization process, the generated singles were sorted using a TCW of50 ns. The singles within the sequence coincidence were ordered by increasing axialdistance to the source, i.e. first singles in the first layer. It was considered that themajority of coincidences corresponds to forward scattering in the scatterer followedby an interaction in the second layer.
Source 22Na source was simulated with an activity of 847 kBq and a diameter of0.5 mm that correspond to the experimental values. The source was embedded in aplastic phantom that represents the source encapsulation and facilitates the positronannihilation.
The intrinsic activity of 138La of the LaBr3 crystal and naturally occurringradioactive materials were not included since the detected count rates due to thenatural radioactivity were negligible (<1%) compared to those generated by theemployed external source. Natural radioactivity can be included in the simulationwith an additional source.
Physics list and cuts The option 4 of the standard electromagnetic physics list, whichincludes Doppler broadening effect, was selected. The employed model for Comptonscattering for energies below 20 MeV was LowEPComptonModel (Brown et al. 2014)with G4EMLOW7.7 database. Atomic de-exitation processes such as fluorescence,Auger and PIXE (Particle-Induced X-ray Emission) effects were activated for allvolumes (sensitive and insensitive materials). Cuts values were set to 0.1 mm whichcorresponds to one order of magnitude less than the smallest dimension of the sensitive

CCMod: a GATE module for Compton Camera imaging simulation 9
detectors.
Time A simulation time of 200 s was set leading to around 20000 acceptedcoincidences. The simulation lasted around 14 hours on a single Intel(R) Xeon(R)CPU E5-2620 @ 2.00GHz.
2.2.3. Figures of Merit The verification was made through the comparison ofdifferent figures of merit namely energy spectra of singles, energy spectra ofcoincidences, scattering angle, angular resolution and efficiency. In addition,reconstructed images obtained from the back-projection onto the plane of the sourcewere compared.
Scattering angle The estimated scattering angles obtained from the Comptonkinematics θC were compared to the ones obtained from geometrical method θGfollowing eq. (1a) and eq. (1b) respectively:
cos(θC) = 1− mec2E1
E0(E0 − E1)(1a)
cos(θG) =~g10 · ~g21
|~g10||~g21|(1b)
where E1 is the energy deposited in the Compton scattering, E0 is the incident energy,me is the rest mass energy of the electron, ~g10 is the vector that goes from the sourceposition to the first interaction position and ~g21 from the first interaction to the secondinteraction position. Due to the error associated with the manual positioning of thesource in the experimental set-up, the position of the source was corrected taking intoaccount the reconstructed image.
For the comparison with experimental data, the initial energy E0 was estimatedfrom the sum of the energy deposition in the layers. When the total deposited energywas below 600 keV, E0 was assigned to the 511 keV photon and otherwise to the1275 keV photon.
Angular Resolution The error distribution of the scatter angles was computed as thedifference between θG and θC (Zoglauer and Kanbach 2003, Seo et al. 2011, Odakaet al. 2012, Mizumoto et al. 2015). The Angular Resolution Measure (ARM) value isgiven by the FWHM of the distribution. Its magnitude is related to the resolution ofthe final image. Therefore, it enables to study the resolution excluding the dependenceof the reconstruction methods.
In order to fit the non-Gaussian distribution of the ARM, different functionshave been employed in the literature: a Voigt function (a convolution of the Gaussianand Lorentzian distributions) (Seo et al. 2011, Odaka et al. 2012), a Lorentzianfunction (Mizumoto et al. 2015) or a superposition of different Lorentzian functions(Zoglauer and Kanbach 2003). In this work, the ARM value was obtained by fittingthe distribution with a Lorentzian function.
Relative detection efficiency The relative detection efficiency was calculated as thefraction of events emitting a photon within the solid angle subtended by the first

CCMod: a GATE module for Compton Camera imaging simulation 10
detector layer that produces a detected coincidence. In order to compare the obtainedvalue with the experimental value reported in (Munoz et al. 2017) for the 1275 keVphotons of the 22Na source, the coincidences with a total deposited energy comprisedbetween 600 and 1350 keV were selected.
2.3. CCMod as a facilitator towards more accurate results
CCMod can be employed to better understand the experimental data and to get moreaccurate results. The ground-truth provided by the developed tool on a validatedsimulation can be employed to define ad-hoc filters based on observable values toimprove experimental data by reducing the fraction of invalid events.
In this section, the developed simulation was employed to illustrate the capabilityof the CCMod to characterize the signature of the deposited energy of randomcoincidences. This type of invalid events was chosen for illustration purposes. Thestudied experimental data were taken with a 22Na source which leads to severalphotons per decay (511 keV and 1275 keV). Therefore, the information of the primaryphoton that produces each interaction, included in the CCMod, was employed todistinguish between random coincidences generated by the detection of differentphotons coming from the same decay process (same event identification) and photonscoming from two different decays (different event identification).
In addition, the angular error distribution was studied to evaluate the impact ofthe energy threshold applied experimentally and to characterize the energy signatureof the events with large angular error value with the aim of reducing the fraction ofbackground events.
2.4. Comparison of the performance of different prototypes
The comparison of the performances between MACACO and CLaRyS prototypeswas performed. The CLaRyS collaboration includes four institutions: Institut dePhysique Nucleaire de Lyon (IPNL), Centre de Recherche en Acquisition et Traitementde l’Image pour la Sante de Lyon (CREATIS), Centre de Physique de Particulesde Marseille (CPPM) and Laboratoire de Physique Subatomique et Cosmologie deGrenoble (LPSC). The prototype under development by the CLaRyS collaboration isdescribed below.
2.4.1. The CLaRyS Compton Camera prototype The CLaRyS prototype wasoriginally designed and optimized for hadrontherapy purposes. However, the simulatedgeometry of the absorber corresponds to the one presented in (Fontana et al. 2017),which was adapted to be as close as possible to a commercial SPECT-Anger cameradevice (GE Healthcare Infinia system). The scatterer detector is composed of sevenparallel double sided silicon strip detectors (DSSDs) separated by 10 mm distancefrom each other. The absorber, 210×280×30 mm3 in size, is composed of 6×8 BGOstreaked blocks. Each block was simulated as an 8 × 8 pixel matrix. The distancebetween the last silicon plane (center) and the center of the absorber is 150 mm. TheDSSDs are 90× 90× 2 mm3 in size with 2 × 64 strips in a 1.4 mm pitch. The camerawas simulated in air.
Processing. Different digitization chains were applied to model the responses ofscatterer and absorber layers following the specifications described in (Fontana

CCMod: a GATE module for Compton Camera imaging simulation 11
et al. 2017). Regarding the scatterer, a grid discretization module was applied tomodel the charge collection of the DSSDs where 64 strips of 1.3 mm active size in a1.4 mm pitch were simulated in each transverse direction. An activation threshold of50 keV was set at strip intersection level. An energy resolution of 2.5% at 200 keV withan energy dependence following the inverse square root law policy was additionallyapplied. Regarding the absorber layer, the scintillator crystal was simulated with 6 × 8blocks made of 8 × 8 pixels each with an active area of 4.375 mm2 in size. The readoutwas performed at block level. The signal of each block corresponded to the total energydeposition taking into account the 64 pixels, and the position was given by the energyweighted centroid position. An activation threshold of 100 keV was set at the blocklevel. An energy resolution of 21% at 662 keV with an energy dependence following theinverse square root law policy was set to match the experimental performance. In bothcases, the transverse spatial resolution was determined by the applied discretizationmodule and the DoI was set to the center of the detector layer. After the digitizationprocess, the singles were sorted in time using the same TCW value as in MACACOprototype (50 ns). For the CSR, forward scattering policy was also selected.
Multiple coincidences may contain useful information about the source in CLaRySprototype since it is composed of several scatterer layers and a pixelated absorber.However, for comparison purposes with the MACACO configuration composed of twomonolithic crystals, only coincidences composed of one single in each detector typewere considered.
The physics list and cuts described in 2.2 were applied.
2.4.2. Evaluation The performance of both prototypes was studied in terms ofdetection efficiency normalized to the geometrical acceptance of the scatterer (relativedetection efficiency) and ARM. The relative detection efficiency for CLaRyS prototypewas studied for coincidences composed of two singles. To this end, monochromaticpoint-like gamma sources related to radioemitters already suggested for nuclearmedicine applications (Fontana et al. 2017) emitting in a range comprised between245-2614 keV were employed. The source was located 53 mm far from the surface ofthe first layer as for MACACO experimental data. In order to make a fair comparisonthe passive structure of MACACO prototype was not included in this study. Anacquisition time of 200 s and an activity of 847 kBq were simulated. The computationaltime for CLaRyS prototype was between 3 and 6 hours depending on the incidentenergy whereas for MACACO prototype was around 2 hours on a single Intel(R)Xeon(R) CPU E5-2620 @ 2.00GHz.
3. Results
3.1. Comparison with MACACO experimental data
3.1.1. Energy spectra of singles In order to evaluate if the structure of the prototypeplays a significant role in the measurements, the energy spectrum of the singles wasstudied. The comparison of the spectra between experimental data and the two sets ofsimulations, the simplified one and the one that includes part of the passive structureof the prototype, without applying any energy threshold is shown in figure 3(a) andfigure 3(b) for the first and the second layer respectively.
In the singles spectra we can observe the photo-peaks, at 511 keV and 1275 keV,together with the Compton edges in each detector layer. In addition, the absorption

CCMod: a GATE module for Compton Camera imaging simulation 12
(keV)1E0 200 400 600 800 1000 1200 1400
Norm
aliz
ed c
ounts
0
0.5
1
1.5
2
2.5
3
Experimental
Simulation with structure
Simulation without structure
(a)
(keV)2E0 200 400 600 800 1000 1200 1400
Norm
aliz
ed c
ounts
0
0.5
1
1.5
2
2.5
Experimental
Simulation with structure
Simulation without structure
(b)
(keV)1E
0 200 400 600 800 1000 1200 1400
Norm
aliz
ed c
ounts
0
0.5
1
1.5
2
2.5
3
Experimental
THR=3.5 keV
THR=3.0 keV
THR=2.5 keV
THR=2.0 keV
THR=1.0 keV
No THR
(c)
(keV)2E
0 200 400 600 800 1000 1200 1400
Norm
aliz
ed c
ounts
0
0.5
1
1.5
2
2.5
Experimental
THR=1.2 keV
THR=1.0 keV
THR=0.8 keV
THR=0.6 keV
THR=0.4 keV
No THR
(d)
Figure 3: Simulated and experimental singles energy spectra with and withoutincluding the passive structure in (a) layer 1 and (b) layer 2. Comparison betweenexperimental and simulated energy spectra when the passive material is included
and different values for the local threshold are applied in (c) layer 1 and (d) layer 2.
of the photons undergoing back-scattering outside the studied detector layer, withenergies around ∼170 keV and ∼213 keV respectively, can be clearly seen. The energyspectrum of both simulation types above the first photo-peak was equivalent. However,when the structure of the prototype was considered, there was an increment of detectedsingles at low energies resulting in a better agreement with experimental data. Inboth detector layers, the recovered intensity of the back-scattering fronts was higherand better matching the experimental data. Moreover, for the second detector layer,the Compton edge was also better recovered. Hence, all of the following simulationsinclude the passive material.
Another difference that can be found in figure 3(a) and figure 3(b) was the lackof events depositing an energy below ∼100 keV in experimental data with respect tothe simulations. This effect is due to the discriminator threshold applied at individualSiPM pixel level for the experimental acquisition, which does not result in a uniqueglobal threshold value at the total deposited energy. The value for the simulateddiscriminator, applied at the estimated deposited energy at pixel level using the MPM,was adjusted independently for each detector layer. Figure 3(c) and figure 3(d) showthe comparison of the spectrum of the singles between the experimental and simulateddata for different threshold values in each detector layer. The local threshold valuewas set in each detector layer as high as possible avoiding the rejection of the eventsthat were experimentally accepted which results in a value of 3 keV in the first and1 keV in the second layer to the estimated deposited energy at pixel level.
CCMod: a GATE module for Compton Camera imaging simulation 13
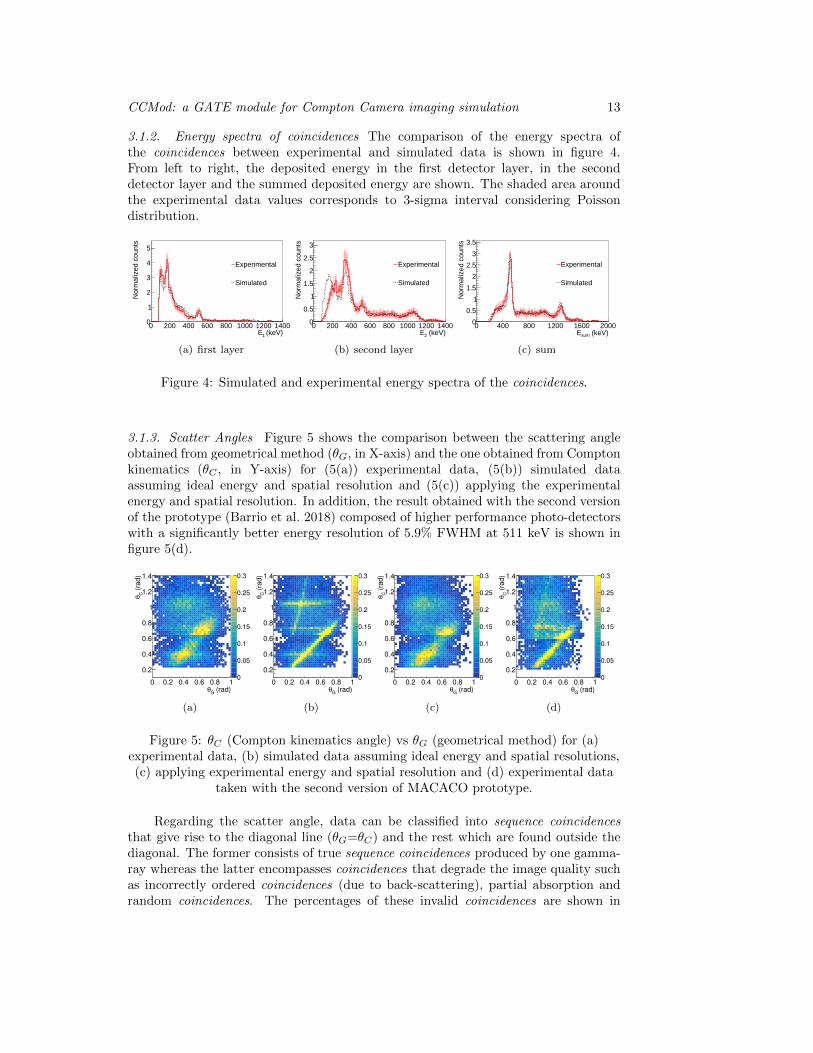
3.1.2. Energy spectra of coincidences The comparison of the energy spectra ofthe coincidences between experimental and simulated data is shown in figure 4.From left to right, the deposited energy in the first detector layer, in the seconddetector layer and the summed deposited energy are shown. The shaded area aroundthe experimental data values corresponds to 3-sigma interval considering Poissondistribution.
(keV)1E0 200 400 600 800 1000 1200 1400
Nor
mal
ized
cou
nts
0
1
2
3
4
5
Experimental
Simulated
(a) first layer
(keV)2E0 200 400 600 800 1000 1200 1400
Nor
mal
ized
cou
nts
0
0.5
1
1.5
2
2.5
3
Experimental
Simulated
(b) second layer
(keV)sumE0 400 800 1200 1600 2000
Nor
mal
ized
cou
nts
0
0.5
1
1.5
2
2.5
3
3.5
Experimental
Simulated
(c) sum
Figure 4: Simulated and experimental energy spectra of the coincidences.
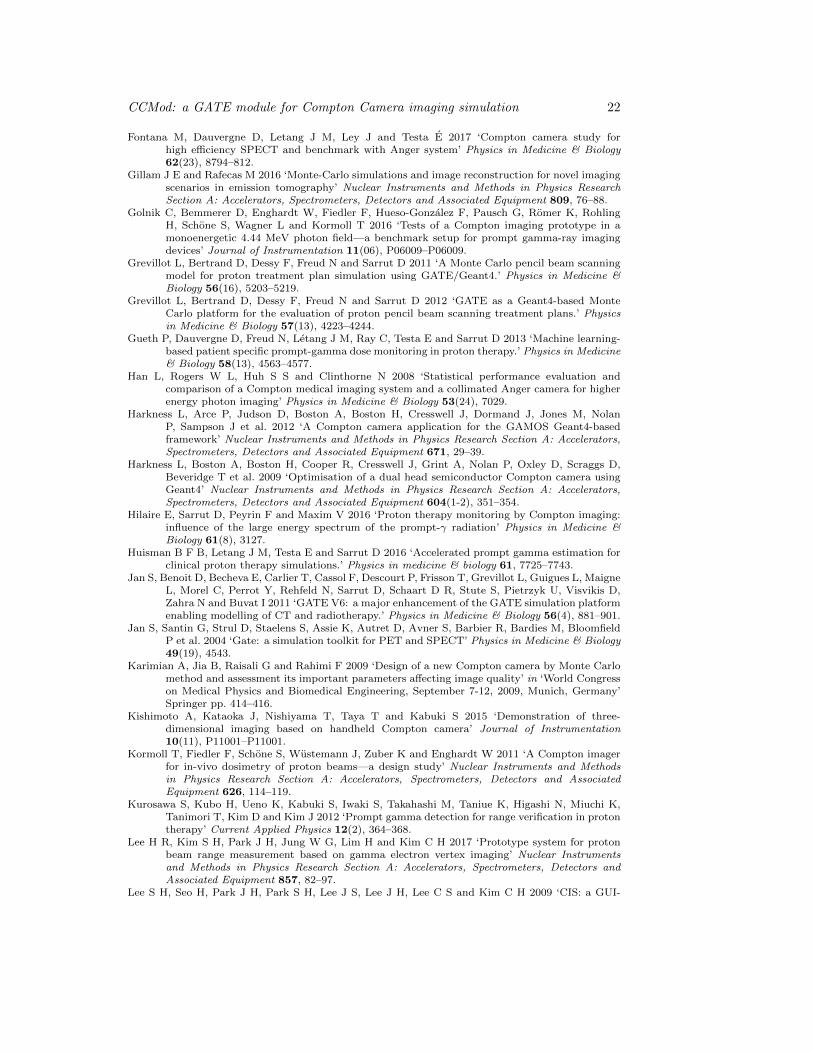
3.1.3. Scatter Angles Figure 5 shows the comparison between the scattering angleobtained from geometrical method (θG, in X-axis) and the one obtained from Comptonkinematics (θC , in Y-axis) for (5(a)) experimental data, (5(b)) simulated dataassuming ideal energy and spatial resolution and (5(c)) applying the experimentalenergy and spatial resolution. In addition, the result obtained with the second versionof the prototype (Barrio et al. 2018) composed of higher performance photo-detectorswith a significantly better energy resolution of 5.9% FWHM at 511 keV is shown infigure 5(d).
(rad)G
θ
0 0.2 0.4 0.6 0.8 1
(ra
d)
Cθ
0.2
0.4
0.6
0.8
1
1.2
1.4
0
0.05
0.1
0.15
0.2
0.25
0.3
(a)
(rad)G
θ
0 0.2 0.4 0.6 0.8 1
(ra
d)
Cθ
0.2
0.4
0.6
0.8
1
1.2
1.4
0
0.05
0.1
0.15
0.2
0.25
0.3
(b)
(rad)G
θ
0 0.2 0.4 0.6 0.8 1
(ra
d)
Cθ
0.2
0.4
0.6
0.8
1
1.2
1.4
0
0.05
0.1
0.15
0.2
0.25
0.3
(c)
(rad)G
θ
0 0.2 0.4 0.6 0.8 1
(ra
d)
Cθ
0.2
0.4
0.6
0.8
1
1.2
1.4
0
0.05
0.1
0.15
0.2
0.25
0.3
(d)
Figure 5: θC (Compton kinematics angle) vs θG (geometrical method) for (a)experimental data, (b) simulated data assuming ideal energy and spatial resolutions,(c) applying experimental energy and spatial resolution and (d) experimental data
taken with the second version of MACACO prototype.
Regarding the scatter angle, data can be classified into sequence coincidencesthat give rise to the diagonal line (θG=θC) and the rest which are found outside thediagonal. The former consists of true sequence coincidences produced by one gamma-ray whereas the latter encompasses coincidences that degrade the image quality suchas incorrectly ordered coincidences (due to back-scattering), partial absorption andrandom coincidences. The percentages of these invalid coincidences are shown in

CCMod: a GATE module for Compton Camera imaging simulation 14
table 1 where randoms were divided into coincidences generated by different photonscoming from the same decay, noted Single Decay Random (SDR) and coming fromtwo different radioactive decays, noted Two-Decay Random (TDR). Among invalidcoincidences four features can be identified according to figure 5, three clearly visiblehorizontal lines and a vertical curved line. The horizontal lines corresponding toθC ' 0.40 rad and θC ' 1.05 rad come from an incorrect order in the sequencecoincidence when forward scattering is assumed, for 1275 keV and 511 keV incidentphotons respectively. While θC ' 0.75 rad is caused by random coincidences with afull absorption of 511 keV photon in the first layer. Finally, the vertical curved linehas its origin in the underestimation of the initial energy of the gamma-ray when thetotal deposited energy is below 600 keV and the incident gamma ray corresponds tothe 1275 keV photon. This feature is clearly visible when ideal resolution is applied inthe simulation (see figure 5(b)). It is worth noting that in the experimental data takenwith the second version of MACACO prototype shown in figure 5(d), this feature isalso visible.
Table 1: Percentages of the different types of coincidences. The results for truecoincidences are also shown for each incident energy (E0).
E0=511 keV E0=1275 keV all
Coincidences 7842 (39.1%) 8517 (42.4%) 20079
Single Decay randoms (SDR) - - 15.4%Two Decay randoms (TDR) - - 3.1%Back-scattering 13.9% 4.6% 18.5%Forward-scattering (FSC) 25.2% 37.8% 63.0%
FSC with full absorption 14.8% 7.3% 22.1%FSC with partial absorption 10.0% 21.1% 31.1%FSC with incorrect E0 estimation 0.4% 9.4% 9.8%
3.1.4. ARM The error of the scattering angle was studied by means of ARM andcompared between experimental and simulated data. The angular error distribution isshown in figure 6 for (a) 511 keV and (b) 1275 keV estimated incident energy and for(c) all the coincidences showing a good agreement between experimental and simulateddata. For 511 keV incident energy, a second peak towards negative values is shownwhich mainly corresponds to the events with incorrect order or an underestimationof the initial energy. The ARM was studied for 1275 keV estimated incident energy.The obtained value for the experimental data was (13.5± 0.2)◦ whereas for simulateddata was (13.4± 0.2)◦.
3.1.5. Relative detection efficiency The obtained relative detection efficiency valuefor 1275 keV incident photons was about 2.6× 10⁻³ for simulated data, whereasthe measured value in a similar configuration reported in (Munoz et al. 2017) wasabout 1.9×10⁻³. An acceptable agreement was obtained between simulated dataand the experimental reference value acquired with a similar configuration, especiallyconsidering that the crude analytical model of the discriminator threshold was adjusted

CCMod: a GATE module for Compton Camera imaging simulation 15
(rad)Cθ-Gθ2− 1.5− 1− 0.5− 0 0.5 1 1.5 2
Nor
mal
ized
cou
nts
00.20.40.60.8
11.21.41.61.8
22.2
Experimental
Simulated
(a)
(rad)Cθ-Gθ2− 1.5− 1− 0.5− 0 0.5 1 1.5 2
Nor
mal
ized
cou
nts
00.5
11.5
22.5
33.5
4
Experimental
Simulated
(b)
(rad)Cθ-Gθ2− 1.5− 1− 0.5− 0 0.5 1 1.5 2
Nor
mal
ized
cou
nts
0
1
2
3
4
5
Experimental
Simulated
(c)
Figure 6: Angular error distribution for (a) 511 keV, (b) 1275 keV estimated energyincident photon coincidences and (c) all the coincidences.
to accept more events than in the experimental scenario (see figure 3) which led to anoverestimation of the detection efficiency of the system.
3.1.6. Back-projection onto the plane of the source Figure 7(a) and 7(b) showreconstructed images composed of 101×101 pixels of 1 mm×1 mm each from theback-projection onto the plane of the source of 1275 keV estimated incident energyphotons for experimental and simulated data respectively. A bias was presentedin the reconstructed axial position for the experimental data where the source wasreconstructed ∼12 mm closer to the first detector layer than for the simulated data.
The comparison of the normalized projections between both data sets along x andy orthogonal directions is shown respectively in figure 7(c) and 7(d) when the simulatedsource is centered at 53 mm from the first layer. A displacement of about 4 mm in they direction is presented in the reconstructed experimental data (figure 7(d)) which isprobably due to an error in the manual positioning of the source. The comparison ofthe normalized projections between both data sets when the source is located at thereconstructed experimental axial position, 41 mm from the first layer, along x and yorthogonal directions is shown respectively in figure 7(e) and 7(f) showing a betteragreement.
3.2. Towards more accurate results: simulation-based energy widow optimization
Figure 8 shows the energy spectra of the coincidences assuming forward scatteringgenerated by the different products of the decay of a 22Na source of 847 kBq activity:511 keV annihilation photons, 1275 keV gamma-rays, SDR and TDR. The coincidencesproduced after a decay different than β+ (such as electron capture), which can beneglected, are also shown and labeled “others”.
In order to minimize the SDR, the simulation allows to suggest an upper limitfor the deposited energy in each layer and in the summed energy spectrum. In thisstudy such limit corresponds to about 1200 keV in each layer and to 1350 keV in thesummed energy spectrum. These acceptance windows reduce the SDR in a 21.4% andthe TDR in a 16.0%. In addition, the rejection of the coincidences with a depositedenergy in the first layer comprised in (490, 550) keV range will further reduce themin a 10.2%, at the cost of rejecting 1.5% of good coincidences.
The angular error distribution of coincidences, excluding randoms (SDR, TDR),was studied for different low energy thresholds. Figure 9(a) and figure 9(b) showrespectively the angular error distribution for impinging photons with an estimated

CCMod: a GATE module for Compton Camera imaging simulation 16
x (mm)
y(m
m)
-25
0
25
50
-5050-50 -25 0 25
(a)
x (mm)
y(m
m)
-25
0
25
50
-5050-50 -25 0 25
(b)
-50 0 50x (mm)
0
0.5
1
1.5
2
arb.
uni
ts
experimentalsimulated
(c)
-50 0 50y (mm)
0
0.5
1
1.5
2
arb.
uni
tsexperimentalsimulated
(d)
-50 0 50x (mm)
0
0.5
1
1.5
2
arb.
uni
ts
experimentalsimulated
(e)
-50 0 50y (mm)
0
0.5
1
1.5
2
arb.
uni
ts
experimentalsimulated
(f)
Figure 7: Back-projection images of 1275 keV incident energy photons for (a)experimental and (b) simulated data. Comparison of the normalized projections
along ((c),(e)) x and ((d),(f)) y directions for the simulated source located at 53 mmfrom the first layer and located at the reconstructed axial position for experimental
data (41 mm from the first layer) respectively.
energy of 511 keV and 1275 keV for different pairs of energy threshold values appliedto the detector layers. It can be observed that when an energy threshold of 85 keVwas applied to both layers, which is in accordance with the reported value appliedexperimentally in (Munoz et al. 2017), the number of coincidences for the incidentenergy of 511 keV with small angular error (“small error” peak) was drastically reducedwith respect to the distribution obtained without any energy threshold. For anincident energy of 1275 keV, the applied threshold rejected only about 10% of thecoincidences. This result points out the need for low energy thresholds, especially inthe first layer for relatively low gamma energies.
Regarding the angular error distribution, coincidences were classified into two

CCMod: a GATE module for Compton Camera imaging simulation 17
(keV)1E0 200 400 600 800 1000 1200 1400
Nor
mal
ized
cou
nts
0
0.5
1
1.5
2
2.5
511 keV 1275 keV SDR TDR others
(a)
(keV)2E0 200 400 600 800 1000 1200 1400
Nor
mal
ized
cou
nts
0
0.2
0.4
0.6
0.8
1
1.2
1.4
511 keV 1275 keV SDR TDR others
(b)
(keV) 1E0 200 400 600 800 1000 1200 1400
(ke
V)
2E
0
200
400
600
800
1000
1200
1400 511 keV* 1275 keV• SDR♦ TDR+ others
(c)
(keV)sumE0 400 800 1200 1600 2000
Nor
mal
ized
cou
nts
0
0.5
1
1.5
2
2.5
511 keV 1275 keV SDR TDR others
(d)
Figure 8: Deposited energies (a) in the first layer (E1), (b) in the second layer (E2),(c) 2D diagram E2 vs E1 and (d) summed energy spectrum of the coincidences.
(rad)Cθ-Gθ2− 1.5− 1− 0.5− 0 0.5 1 1.5 2
Cou
nts
0
200
400
600
800
1000
1200
=(0,0) keVGTHR
=(85,0) keVGTHR
=(85,85) keVGTHR
=(85,250) keVGTHR
(a)
(rad)Cθ-Gθ2− 1.5− 1− 0.5− 0 0.5 1 1.5 2
Cou
nts
0
100
200
300
400
500
600
=(0,0) keVGTHR
=(85,0) keVGTHR
=(85,85) keVGTHR
=(85,250) keVGTHR
(b)
Figure 9: Angular error distribution for (a) 511 keV and (b) 1275 keV estimatedincident energy. THRG pair of values represents the energy threshold applied to the
deposited energy in the first and second layer respectively.
groups delimited by ∼3σ, where σ is the standard error of “small error” peaks.Coincidences with a large angular error value (≥3σ), considered as invalid coincidencesin this study, represented the ∼33% of the total coincidences. The energy signature ofthese two data sets was characterized through the comparison between the depositedenergy in the absorber (E2) and the deposited energy in the scatterer (E1), seefigure 10. Two empty regions can be identified in the “small error” peak diagram(figure 10(a)) associated with the two incident energies of the photons, 511 keV and1275 keV. It turns out that the lower limits of the E1 for these regions correspondapproximately to the energies of recoil electrons associated with scattered photons

CCMod: a GATE module for Compton Camera imaging simulation 18
(keV)1E0 200 400 600 800 1000 1200 1400
(ke
V)
2E
0
200
400
600
800
1000
1200
1400
0
5
10
15
20
25
30
35
40
45
(a)
(keV)1E0 200 400 600 800 1000 1200 1400
(ke
V)
2E
0
200
400
600
800
1000
1200
1400
0
10
20
30
40
50
60
(b)
Figure 10: 2D diagram E2 versus E1 for coincidences with (a) small angular errorand (b) large angular error delimited by three times the value of the standard error
of the distribution.
that can not be detected due to the limited angular coverage of the absorber. Foreach incident energy, above this E1 upper limit only back-scattering coincidences orcoincidences with multiple interactions in the scatterer layer can been found. Inour configuration, an upper energy threshold of 150 keV applied to the scatterer forthe estimated incident energy of 511 keV reduced the fraction of the studied invalidcoincides in a∼62%. Whereas an upper threshold of 700 keV for the estimated incidentenergy of 1275 keV reduced the fraction of the studied invalid coincidences in a ∼6%.
The capability of the CCMod to define ad-hoc filters based on observable valuesto reduce the fraction of invalid coincidences was illustrated for the studied prototype.
3.3. Comparison of the performance of different prototypes
The relative detection efficiency and the angular resolution were studied as a functionof the energy for both CC systems, MACACO and CLaRyS.
3.3.1. Efficiency Figure 11 shows the relative detection efficiency for both systemsfor different detection energy thresholds. The results for the reported energy thresholdof 85 keV for MACACO and the described operational thresholds for CLaRyS (50 keVto the scatterer and 100 keV to the absorber) are shown in filled markers. The resultsfor a lower energy threshold of 10 keV applied to each detector type are shown inempty markers.
Figure 11 shows that a higher energy threshold leads to a larger reduction of theefficiency at low energies. This effect is more significant for MACACO prototype due tothe smaller scattering acceptance angle which reduces the maximum allowed depositedenergy in the first layer (in accordance with figure 9). In this low energy region, thedetection efficiency increases as the energy increases. If the applied threshold is lowenough, a second energy region (700-1000 keV) can be seen with an opposite behaviordue to the decreasing photon interaction probability. This region is more visible forCLaRyS prototype since it is composed of thinner scatterer layers of lower atomicnumber material. Finally, for high incident energies, the contribution of pair creationto the detected efficiency may be non-negligible. This contribution can be clearly

CCMod: a GATE module for Compton Camera imaging simulation 19
500 1000 1500 2000 2500Energy (keV)
100
101
Eff
icie
ncy
×10
3
CLaRyS Low THRCLaRySMACACO Low THRMACACO
Figure 11: Relative detection efficiency as a function of the energy for CLaRyS (redcircular markers) and MACACO (blue square markers) prototypes. The results for
the low energy threshold are shown in empty markers.
observed for MACACO prototype when the low energy threshold was applied (blueempty square markers).
In general, the relative detection efficiency for CLaRyS prototype was alwayshigher than for MACACO prototype mainly due to a three times thicker absorber andabout two times higher scattering acceptance angle. It should also be noticed thatMACACO does not have an optimized geometry, but just reproduces the experimentalprototype layout and characterization results.
3.3.2. Angular resolution measure Figure 12 shows the ARM as a function of theincident energy for both prototypes. It monotonically decreases with increasing energy.The only exception was found for the highest energy considered due to the higherprobability of pair creation events which reduces the signal to noise ratio. The ARMvalue for CLaRyS was always better than for MACACO prototype, with a reductionof about a factor ∼4 for energies of 1 MeV.
500 1000 1500 2000 2500Energy (keV)
2
4
6
8
10
12
14
ARM
(deg
)
MACACOMACACO Low THRCLaRySCLaRyS Low THR
Figure 12: ARM as a function of the incident energy for CLaRyS (red circularmarkers) and MACACO (blue square markers) prototypes. The results for the low
energy threshold are shown in empty markers.

CCMod: a GATE module for Compton Camera imaging simulation 20
4. Discussion and conclusions
CCMod, a flexible alternative to simulate CCs, has been developed withinGATE/Geant4 as a complement to the already existing PET and SPECT systems.We think that this generic module within GATE not only provides the tools for dataanalyses but will benefit from the broad range of medical experimental settings thatcan be conveniently simulated using macro language. CCMod has been designedto employ the same data structures, i.e. hits, singles and coincidences, as PET andSPECT systems. Thereby, the digitization modules may be applied interchangeably toall imaging devices. Moreover, additional modules can be added by users to take intoaccount unforeseen situations. All the processing can be performed either on–the–flyor offline by the post–processing of simulation output files.
The predictions of CCMod were compared with experimental data interms of energy spectra, angular resolution, efficiency and back-projection imagereconstruction. The spectra of singles were used to assess the impact of the passivematerial and to adjust the discriminator threshold, at pixel level, in each detectorindependently. We observed that the passive material of the prototype (boards,holders...) played an important role in the scattering, resulting in a non-negligiblecontribution at low energies in both layers. The main parts were simulated improvingthe match with the experimental data. However, there was an underestimation ofthe passive material surrounding the sensitive detectors that was reflected in thesimulated spectra of the singles. On the other hand, the employed analytical model toreproduce the experimental discriminator threshold at pixel level accepted slightlymore events, mainly at low energies, than the one employed in the experimentaldata. This mismatch was more significant in the second layer due to its geometricalcharacteristics (thicker detector with smaller Aspect Ratio, ratio of length of theside of the detector to thickness). A good agreement between both simulatedand experimental data regarding the spectra of the coincidences and the ARMwas obtained despite small differences at low energies. The detection efficiencywas compared to the measured value reported in (Munoz et al. 2017) in a similarconfiguration. The obtained detection efficiency was higher by a factor ∼1.4 than theexperimental one which can be considered in good agreement due to the unknownexperimental discriminator threshold that was rather underestimated to avoid therejection of events registered experimentally. Regarding the back-projection imagereconstruction, a good agreement was obtained between both data sets regardlessof the small differences related to the error in the manual positioning of the sourcein the experimental data. In addition, the developed simulation was employed toidentify undesired coincidences and reduce them by inferring filtering criteria, basedon deposited energy, that can be applied to the experimental measurements with theprototype.
CCMod was employed to predict the response of the prototype under developmentby the CLaRyS collaboration and compare it with the performance of MACACOexperimental prototype regarding the relative detection efficiency and the ARM. Ingeneral a higher efficiency was obtained for CLaRyS prototype than for MACACOprototype mainly due to a three times thicker absorber and about two times higherscattering acceptance angle. Regarding the ARM, the performance was about fourtimes better for CLaRyS prototype with and angular resolution of about 2.3 degreeat 1 MeV, mainly due to a better energy resolution in the scatterer. The mainobjective of this study was to show the ability of the developed module to simulate

CCMod: a GATE module for Compton Camera imaging simulation 21
and reproduce the results of different existing prototypes, not to draw conclusionsabout their performances. It is worth noting that the two employed prototypes arein different development stages. MACACO is an experimental prototype driven byexisting detector size and available funding resources at the time of construction,which is being improved, whereas CLaRyS is a prototype under construction whichhas not been assembled yet for acquisitions in coincidence between the two types ofdetectors.
In summary, a dedicated GATE Compton camera module has been developedwhich has been satisfactorily compared with experimental data and employed to studythe performance of different prototypes. This extension of GATE will allow to easilycompare under the same analyses the performance of different CC systems in medicalexperimental setting such as hadron therapy monitoring or nuclear medicine using CT-based patient phantoms. This module, CCMod, will be available in the next GATErelease.
Acknowledgments
This work was performed within the framework of the SIRIC LYriCAN Grant INCa-INSERM-DGOS-12563, the program “Investissements d’Avenir” (ANR-11-IDEX-0007) operated by the ANR, the Ministerio de Ciencia, Innovacion y Universidades(FPA2017-85611-R) and IFIC Severo Ochoa Excellence centre (SEV-2014-0398). ThisProject has received funding from the Labex PRIMES (ANR-11-LABX-0063) ofUniversite de Lyon and PIC 2018 programme under the reference CSIC № 2018FR0032and CNRS PICS08272.
References
Allison J, Amako K, Apostolakis J, Arce P, Asai M, Aso T, Bagli E, Bagulya A, Banerjee S,Barrand G, Beck B, Bogdanov A, Brandt D, Brown J, Burkhardt H, Canal P, Ott D,Chauvie S, Cho K and Yoshida H 2016 ‘Recent developments in Geant4’ Nuclear Instrumentsand Methods in Physics Research Section A: Accelerators, Spectrometers, Detectors andAssociated Equipment 835, 186–225.
Alnaaimi M, Royle G, Ghoggali W, Banoqitah E, Cullum I and Speller R 2011 ‘Performanceevaluation of a pixellated Ge Compton camera’ Physics in Medicine & Biology 56(12), 3473.
Andreyev A, Celler A, Ozsahin I and Sitek A 2016 ‘Resolution recovery for Compton camera usingorigin ensemble algorithm’ Medical physics 43(8Part1), 4866–4876.
Arce P, Rato P, Canadas M and Lagares J I 2008 ‘GAMOS: A Geant4-based easy and flexibleframework for nuclear medicine applications’ in ‘Nuclear Science Symposium ConferenceRecord, 2008. NSS’08. IEEE’ IEEE pp. 3162–3168.
Barrio J, Etxebeste A, Granado L, Munoz E, Oliver J, Ros A, Roser J, Solaz C and Llosa G 2018‘Performance improvement tests of MACACO: A Compton telescope based on continuouscrystals and SiPMs’ Nuclear Instruments and Methods in Physics Research Section A:Accelerators, Spectrometers, Detectors and Associated Equipment 912, 48–52.
Bonifacio D A, Belcari N, Moehrs S, Moralles M, Rosso V, Vecchio S and Del Guerra A 2010 ‘Atime efficient optical model for GATE simulation of a LYSO scintillation matrix used in PETapplications’ IEEE Transactions on Nuclear Science 57(5), 2483–2489.
Brown J M C, Dimmock M R, Gillam J E and Paganin D 2014 ‘A low energy bound atomic electronCompton scattering model for Geant4’ Nuclear Instruments and Methods in Physics ResearchSection B: Beam Interactions with Materials and Atoms 338, 77–88.
Cabello J, Etxebeste A, Llosa G and Ziegler S I 2015 ‘Simulation study of PET detector limitationsusing continuous crystals’ Physics in Medicine & Biology 60(9), 3673.
Calderon Y, Chmeissani M, Kolstein M and De Lorenzo G 2014 ‘Evaluation of Comptongamma camera prototype based on pixelated CdTe detectors’ Journal of Instrumentation9(06), C06003.
CCMod: a GATE module for Compton Camera imaging simulation 22
Fontana M, Dauvergne D, Letang J M, Ley J and Testa E 2017 ‘Compton camera study forhigh efficiency SPECT and benchmark with Anger system’ Physics in Medicine & Biology62(23), 8794–812.
Gillam J E and Rafecas M 2016 ‘Monte-Carlo simulations and image reconstruction for novel imagingscenarios in emission tomography’ Nuclear Instruments and Methods in Physics ResearchSection A: Accelerators, Spectrometers, Detectors and Associated Equipment 809, 76–88.
Golnik C, Bemmerer D, Enghardt W, Fiedler F, Hueso-Gonzalez F, Pausch G, Romer K, RohlingH, Schone S, Wagner L and Kormoll T 2016 ‘Tests of a Compton imaging prototype in amonoenergetic 4.44 MeV photon field—a benchmark setup for prompt gamma-ray imagingdevices’ Journal of Instrumentation 11(06), P06009–P06009.
Grevillot L, Bertrand D, Dessy F, Freud N and Sarrut D 2011 ‘A Monte Carlo pencil beam scanningmodel for proton treatment plan simulation using GATE/Geant4.’ Physics in Medicine &Biology 56(16), 5203–5219.
Grevillot L, Bertrand D, Dessy F, Freud N and Sarrut D 2012 ‘GATE as a Geant4-based MonteCarlo platform for the evaluation of proton pencil beam scanning treatment plans.’ Physicsin Medicine & Biology 57(13), 4223–4244.
Gueth P, Dauvergne D, Freud N, Letang J M, Ray C, Testa E and Sarrut D 2013 ‘Machine learning-based patient specific prompt-gamma dose monitoring in proton therapy.’ Physics in Medicine& Biology 58(13), 4563–4577.
Han L, Rogers W L, Huh S S and Clinthorne N 2008 ‘Statistical performance evaluation andcomparison of a Compton medical imaging system and a collimated Anger camera for higherenergy photon imaging’ Physics in Medicine & Biology 53(24), 7029.
Harkness L, Arce P, Judson D, Boston A, Boston H, Cresswell J, Dormand J, Jones M, NolanP, Sampson J et al. 2012 ‘A Compton camera application for the GAMOS Geant4-basedframework’ Nuclear Instruments and Methods in Physics Research Section A: Accelerators,Spectrometers, Detectors and Associated Equipment 671, 29–39.
Harkness L, Boston A, Boston H, Cooper R, Cresswell J, Grint A, Nolan P, Oxley D, Scraggs D,Beveridge T et al. 2009 ‘Optimisation of a dual head semiconductor Compton camera usingGeant4’ Nuclear Instruments and Methods in Physics Research Section A: Accelerators,Spectrometers, Detectors and Associated Equipment 604(1-2), 351–354.
Hilaire E, Sarrut D, Peyrin F and Maxim V 2016 ‘Proton therapy monitoring by Compton imaging:influence of the large energy spectrum of the prompt-γ radiation’ Physics in Medicine &Biology 61(8), 3127.
Huisman B F B, Letang J M, Testa E and Sarrut D 2016 ‘Accelerated prompt gamma estimation forclinical proton therapy simulations.’ Physics in medicine & biology 61, 7725–7743.
Jan S, Benoit D, Becheva E, Carlier T, Cassol F, Descourt P, Frisson T, Grevillot L, Guigues L, MaigneL, Morel C, Perrot Y, Rehfeld N, Sarrut D, Schaart D R, Stute S, Pietrzyk U, Visvikis D,Zahra N and Buvat I 2011 ‘GATE V6: a major enhancement of the GATE simulation platformenabling modelling of CT and radiotherapy.’ Physics in Medicine & Biology 56(4), 881–901.
Jan S, Santin G, Strul D, Staelens S, Assie K, Autret D, Avner S, Barbier R, Bardies M, BloomfieldP et al. 2004 ‘Gate: a simulation toolkit for PET and SPECT’ Physics in Medicine & Biology49(19), 4543.
Karimian A, Jia B, Raisali G and Rahimi F 2009 ‘Design of a new Compton camera by Monte Carlomethod and assessment its important parameters affecting image quality’ in ‘World Congresson Medical Physics and Biomedical Engineering, September 7-12, 2009, Munich, Germany’Springer pp. 414–416.
Kishimoto A, Kataoka J, Nishiyama T, Taya T and Kabuki S 2015 ‘Demonstration of three-dimensional imaging based on handheld Compton camera’ Journal of Instrumentation10(11), P11001–P11001.
Kormoll T, Fiedler F, Schone S, Wustemann J, Zuber K and Enghardt W 2011 ‘A Compton imagerfor in-vivo dosimetry of proton beams—a design study’ Nuclear Instruments and Methodsin Physics Research Section A: Accelerators, Spectrometers, Detectors and AssociatedEquipment 626, 114–119.
Kurosawa S, Kubo H, Ueno K, Kabuki S, Iwaki S, Takahashi M, Taniue K, Higashi N, Miuchi K,Tanimori T, Kim D and Kim J 2012 ‘Prompt gamma detection for range verification in protontherapy’ Current Applied Physics 12(2), 364–368.
Lee H R, Kim S H, Park J H, Jung W G, Lim H and Kim C H 2017 ‘Prototype system for protonbeam range measurement based on gamma electron vertex imaging’ Nuclear Instrumentsand Methods in Physics Research Section A: Accelerators, Spectrometers, Detectors andAssociated Equipment 857, 82–97.
Lee S H, Seo H, Park J H, Park S H, Lee J S, Lee J H, Lee C S and Kim C H 2009 ‘CIS: a GUI-
CCMod: a GATE module for Compton Camera imaging simulation 23
based software system for Monte Carlo simulation of Compton camera’ Nuclear Technology168(1), 55–60.
Lehner C E, He Z and Zhang F 2004 ‘4π Compton imaging using a 3-D position-sensitive CdZnTedetector via weighted list-mode maximum likelihood’ IEEE Transactions on Nuclear Science51(4), 1618–1624.
Llosa G, Bernabeu J, Burdette D, Chesi E, Cindro V, Clinthorne N, Honscheid K, Kagan H,Lacasta C, Mikuz M, Modesto P, Rogers W, Steinberg J, Studen A, Weilhammer P, ZhangL and Zontar D 2006 ‘Results of a first demonstrator prototype of a Compton prostateprobe’ Nuclear Instruments and Methods in Physics Research Section A: Accelerators,Spectrometers, Detectors and Associated Equipment 569(2), 277–280.
Maier D, Blondel C, Delisle C, Limousin O, Martignac J, Meuris A, Visticot F, Daniel G, BaussonP A, Gevin O et al. 2017 ‘Second generation of portable gamma camera based on CalisteCdTe hybrid technology’ Nuclear Instruments and Methods in Physics Research Section A:Accelerators, Spectrometers, Detectors and Associated Equipment .
McCleskey M, Kaye W, Mackin D, Beddar S, He Z and Polf J 2015 ‘Evaluation of a multistage CdZnTeCompton camera for prompt gamma imaging for proton therapy’ Nuclear Instrumentsand Methods in Physics Research Section A: Accelerators, Spectrometers, Detectors andAssociated Equipment 785, 163–169.
Mihailescu L, Vetter K, Burks M, Hull E and Craig W 2007 ‘SPEIR: a Ge Compton camera’ NuclearInstruments and Methods in Physics Research Section A: Accelerators, Spectrometers,Detectors and Associated Equipment 570(1), 89–100.
Mizumoto T, Tomono D, Takada A, Tanimori T, Komura S, Kubo H, Matsuoka Y, MizumuraY, Nakamura K, Nakamura S et al. 2015 ‘A performance study of an electron-trackingCompton camera with a compact system for environmental gamma-ray observation’ Journalof Instrumentation 10(06), C06003.
Montemont G, Bohuslav P, Dubosq J, Feret B, Monnet O, Oehling O, Skala L, Stanchina S, VergerL and Werthmann G 2017 ‘NuVISION: a portable multimode gamma camera based onHiSPECT imaging module’ in ‘2017 IEEE Nuclear Science Symposium and Medical ImagingConference (NSS/MIC)’ IEEE pp. 1–3.
Munoz E, Barrio J, Etxebeste A, Ortega P G, Lacasta C, Oliver J F, Solaz C and Llosa G 2017‘Performance evaluation of MACACO: a multilayer Compton camera’ Physics in Medicine &Biology 62(18), 7321–41.
Novikova E, Stickman M, Gwon C and B.F.Phlips 2006 ‘Designing sword–software for optimizationof radiation detectors’ in ‘Nuclear Science Symposium Conference Record, 2006. IEEE’ IEEEpp. 607–61.
Odaka H, Ichinohe Y, Takeda S, Fukuyama T, Hagino K, Saito S, Sato T, Sato G, WatanabeS, Kokubun M et al. 2012 ‘High-resolution Compton cameras based on Si/CdTe double-sided strip detectors’ Nuclear Instruments and Methods in Physics Research Section A:Accelerators, Spectrometers, Detectors and Associated Equipment 695, 179–183.
Ordonez C E, Bolozdynya A and Chang W 1997 ‘Doppler broadening of energy spectra in Comptoncameras’ in ‘Nuclear Science Symposium, 1997. IEEE’ Vol. 2 IEEE pp. 1361–1365.
Peterson S, Robertson D and Polf J 2010 ‘Optimizing a three-stage Compton camera for measuringprompt gamma rays emitted during proton radiotherapy’ Physics in Medicine & Biology55(22), 6841.
Polf J C, Avery S, Mackin D S and Beddar S 2015 ‘Imaging of prompt gamma rays emittedduring delivery of clinical proton beams with a Compton camera: feasibility studies for rangeverification’ Physics in Medicine & Biology 60(18), 7085.
Richard M H, Chevallier M, Dauvergne D, Freud N, Henriquet P, Foulher F L, Letang J M, MontarouG, Ray C, Roellinghoff F, Testa E, Testa M and Walenta A H 2011 ‘Design guidelines for adouble scattering Compton camera for prompt-gamma imaging during ion beam therapy: AMonte Carlo simulation study’ IEEE Transactions on Nuclear Science 58(1), 87–94.
Rohling H, Priegnitz M, Schoene S, Schumann A, Enghardt W, Hueso-Gonzalez F, Pausch G andFiedler F 2017 ‘Requirements for a Compton camera for in vivo range verification of protontherapy’ Physics in Medicine & Biology 62(7), 2795.
Sarrut D, Bardies M, Boussion N, Freud N, Jan S, Letang J M, Loudos G, Maigne L, Marcatili S,Mauxion T et al. 2014 ‘A review of the use and potential of the gate Monte Carlo simulationcode for radiation therapy and dosimetry applications’ Medical physics 41(6Part1).
Seo H, Kim C H, Park J H, Kim J K, Lee J H, Lee C S and Lee J S 2010 ‘Development ofdouble-scattering-type Compton camera with double-sided silicon strip detectors and NaI(tl)scintillation detector’ Nuclear Instruments and Methods in Physics Research Section A:Accelerators, Spectrometers, Detectors and Associated Equipment 615(3), 333–339.
CCMod: a GATE module for Compton Camera imaging simulation 24
Seo H, Lee S H, Kim C H, An S H, Lee J H and Lee C S 2008 ‘Optimal geometrical configuration of adouble-scattering Compton camera for maximum imaging resolution and sensitivity’ NuclearInstruments and Methods in Physics Research Section A: Accelerators, Spectrometers,Detectors and Associated Equipment 591(1), 80–83.
Seo H, Park J H, Ushakov A, Kim C H, Kim J K, Lee J H, Lee C S and Lee J S 2011 ‘Experimentalperformance of double-scattering Compton camera with anthropomorphic phantom’ Journalof Instrumentation 6(01), C01024.
Sinclair L, Hanna D, MacLeod A and Saull P 2009 ‘Simulations of a scintillator Compton gammaimager for safety and security’ IEEE Transactions on Nuclear Science 56(3), 1262–1268.
Solevi P, Munoz E, Solaz C, Trovato M, Dendooven P, Gillam J E, Lacasta C, Oliver J F, RafecasM, Torres-Espallardo I et al. 2016 ‘Performance of MACACO Compton telescope for ion-beam therapy monitoring: first test with proton beams’ Physics in Medicine & Biology61(14), 5149.
Strydhorst J and Buvat I 2016 ‘Redesign of the GATE PET coincidence sorter’ Physics in Medicine& Biology 61(18), N522–N531.
Takeda S, Odaka H, nosuke Ishikawa S, Watanabe S, Aono H, Takahashi T, Kanayama Y, HiromuraM and Enomoto S 2012 ‘Demonstration of in-vivo multi-probe tracker based on a Si/CdTesemiconductor Compton camera’ IEEE Transactions on Nuclear Science 59(1), 70–76.
Thirolf P, Aldawood S, Bohmer M, Bortfeldt J, Castelhano I, Dedes G, Fiedler F, Gernhauser R,Golnik C, Helmbrecht S, Hueso-Gonzalez F, v.d. Kolff H, Kormoll T, Lang C, Liprandi S,Lutter R, Marinsek T, Maier L, Pausch G, Petzoldt J, Romer K, Schaart D and Parodi K 2016‘A Compton camera prototype for prompt gamma medical imaging’ EPJ Web of Conferences117, 05005.
Todd R, Nightingale J and Everett D 1974 ‘A proposed γ camera’ Nature 251(5471), 132.Zoglauer A, Andritschke R, Boggs S E, Schopper F, Weidenspointner G and Wunderer C B 2008
‘MEGAlib: simulation and data analysis for low-to-medium-energy gamma-ray telescopes’in ‘Space Telescopes and Instrumentation 2008: Ultraviolet to Gamma Ray’ Vol. 7011International Society for Optics and Photonics p. 70113F.
Zoglauer A, Andritschke R and Schopper F 2006 ‘MEGAlib–the medium energy gamma-rayastronomy library’ New Astronomy Reviews 50(7-8), 629–632.
Zoglauer A and Kanbach G 2003 ‘Doppler broadening as a lower limit to the angular resolution ofnext-generation Compton telescopes’ in ‘X-Ray and Gamma-Ray Telescopes and Instrumentsfor Astronomy’ Vol. 4851 International Society for Optics and Photonics pp. 1302–1310.