ccrs summative assessment results · 2019-08-05 · page | 7 2.1 how to read your child’s ccrs...
TRANSCRIPT

Understanding the
CCRS Summative
Assessment Results
2019 Edition

Page | 2
TABLE OF CONTENTS
Introduction ......................................................................................................................................3
Section 1.0 General Information for Principals and Educators..............................................................4
1.1 Purpose of this Guide ......................................................................................................................... 4
1.2 The Purpose and Use of DoDEA CCRS Summative Results ............................................................... 4
1.3 Types of Scores ................................................................................................................................... 4
1.4 Scale Score .......................................................................................................................................... 4
1.5 Performance Level .............................................................................................................................. 5
1.6 Subclaim Performance Indicators ...................................................................................................... 5
Section 2.0 CCRS Summative Assessment Reports for Parents .............................................................6
2.1 How to Read Your Child’s CCRS Individual Student Report (ISR) ..................................................... 7
2.2 How to Read Your Child’s CCRS Summative 2019 Student Report................................................. 10
Section 3.0 CCRS Summative Reports for Superintendents, Principals, and/or Teachers ..................... 12
3.1 Understanding the DoDEA CCRS Student Roster Report ................................................................ 13
3.2 Understanding the DoDEA CCRS Summative District Summary ..................................................... 16
3.3 Understanding the DoDEA CCRS Summative Performance Level Summary Report ..................... 19
3.4 Understanding the DoDEA CCRS Summative Evidence Statement Analysis Report...................... 21
3.5 Understanding the DoDEA CCRS Summative Content Standards Roster ....................................... 25
Appendix A - Scale Score Ranges .................................................................................................... 301
Appendix B - Glossary ...................................................................................................................... 35

Page | 3
Introduction
The DODEA Comprehensive Assessment System (DoDEA-CAS) is a critical component of College and
Career Ready Standards (CCRS) implementation. DoDEA has adopted new CCRS-aligned summative
assessments to measure student mastery of content standards taught for the grade level and/or course.
These assessments support student learning, provide information for decision makers concerning
instructional programs and services, and inform parents. The DoDEA-CAS informs continuous
improvement by providing schools with valuable data that identify school improvement needs and areas
of success.
Assessments provide valuable information for administrators, teachers, and parents for supporting
student learning and monitoring academic achievement. Through focused collaboration, teachers use
data to develop and implement strategies to build on strengths and mitigate weaknesses in student
learning and monitor the impact of the strategies on student achievement.
DoDEA is committed to student achievement and assessments that raise the bar for students to ensure
they are college and career ready.
For more information about the DoDEA Comprehensive Assessment System, please visit
https://www.dodea.edu/assessments/index.cfm.

Page | 4
College and Career Ready Standards Summative Assessment
Section 1.0 General Information for Principals
and Educators
1.1 Purpose of this Guide
This guide provides information on reports provided for the College and Career Ready Standards (CCRS) Summative Assessment results. It outlines and explains elements of the various reports that principals and teachers may use to support students. Section 2 includes reports that may be shared with parents. This section will help parents understand their child’s results. Section 3 outlines and explains elements of the school and district level reports that may be available to school and district leaders and teachers.
1.2 The Purpose and Use of DoDEA CCRS Summative Results
The primary purpose of the DoDEA CCRS Summative Assessment is to provide high-quality assessments to measure students’ progress towards college and career readiness. CCRS summative assessment results are to be used as one of many helpful tools in evaluating educational programs and student progress. These reports:
provide a snapshot of student progress towards meeting standards-based expectations;
provide one measure of student progress and achievement;
capture one of several indicators, in combination with student grades, teacher feedback, classroom work, and other assessments used to create a comprehensive picture of a student’s progress in school; and
provide valuable information for administrators, teachers, and parents for supporting student learning and monitoring academic achievement.
1.3 Types of Scores Student performance on DoDEA assessments is described using scale scores, performance levels, and subclaim performance indicators. DoDEA, district, and school average results are included in relevant sections of the report to help parents understand how their child’s performance compares to that of other students. In some instances, a note or dash (-) will appear in place of average results for a school and/or district. This indicates that there are too few students to maintain student privacy and therefore results are not reported.
1.4 Scale Score
A scale score is a numerical value that summarizes student performance. Not all students respond to the same set of test items, so each student’s raw score (actual points earned on test items) is adjusted for the slight differences in difficulty among the various forms and administrations of the test. The resulting scale score allows for an accurate comparison across test forms and administration years within a grade or course and content area. DoDEA reports provide overall scale scores for English language arts/literacy and mathematics, which determine a student’s performance level. Scale scores range from 650 to 850 for all tests. Additionally, English language arts/literacy (ELA/Literacy) reports provide separate scale

Page | 5
scores for both Reading and Writing. Reading scale scores range from 10 to 90, and Writing scale scores range from 10 to 60. For example, a student who earns an overall scale score of 800 on one form of the grade 8 mathematics assessment would be expected to earn an overall scale score of 800 on any other form of the grade 8 mathematics assessment. Furthermore, the student’s overall scale score and level of mastery of concepts and skills would be comparable to a student who took the same assessment the previous year or following year.
1.5 Performance Level
Each performance level is a broad, categorical level defined by a student’s overall scale score and is used to report overall student performance by describing how well students met the expectations for their grade level/course. Each performance level is defined by a range of overall scale scores for the assessment. There are five performance levels for DoDEA assessments:
Level 5: Exceeded expectations
Level 4: Met expectations
Level 3: Approached expectations
Level 2: Partially met expectations
Level 1: Did not yet meet expectations Students performing at levels 4 and 5 met or exceeded expectations, have demonstrated readiness for the next grade level/course and, ultimately, are likely on track for college and careers. Additional information pertaining to the test performance levels can be found in Appendix A. Performance Level Descriptors (PLDs) describe the knowledge, skills, and practices that students should know and be able to demonstrate at each performance level in each content area (ELA/Literacy and mathematics), and at each grade level/course. PLDs are available at https://www.dodea.edu/assessments/resources/CCRS.cfm.
1.6 Subclaim Performance Indicators
Student performance is reported at the subclaim level. A subclaim represents a group of standards that are identified for reporting. For example, the subclaims in Reading are Literary Text, Informational Text, and Vocabulary. Subclaim performance indicators for DoDEA assessments are reported using graphical representations that indicate how the student performed relative to the overall performance of students who met or nearly met expectations for the content area. Subclaim performance is reported using categories rather than scale scores or performance levels.
Met or Exceeded Expectations – represented by an up arrow
Approached Expectations – represented by a bidirectional arrow
Did Not Yet Meet or Partially Met Expectations – represented by a down arrow

Page | 6
College and Career Ready Standards Summative Assessment
Section 2.0 CCRS Summative Assessment Reports
for Parents
2.1 CCRS Individual Student Report (ISR)
The Individual Student Report (ISR) provides information on a student’s overall performance for the content areas tested at the end of the grade/course. Information is reported for each grade level/course and content area.
2.2 CCRS Summative 2019 Student Report
The CCRS Summative 2019 Student Report provides information on a student’s overall performance for the content areas tested at the end of the grade/course.
Page | 7
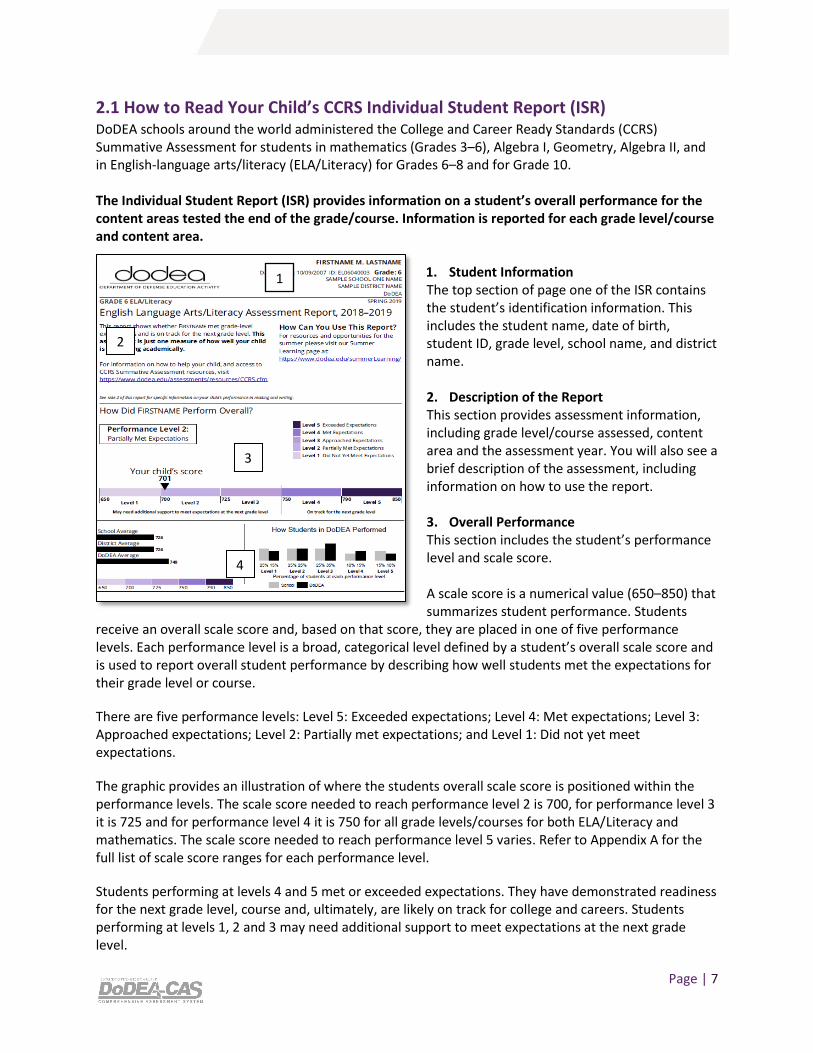
2.1 How to Read Your Child’s CCRS Individual Student Report (ISR) DoDEA schools around the world administered the College and Career Ready Standards (CCRS) Summative Assessment for students in mathematics (Grades 3–6), Algebra I, Geometry, Algebra II, and in English-language arts/literacy (ELA/Literacy) for Grades 6–8 and for Grade 10. The Individual Student Report (ISR) provides information on a student’s overall performance for the content areas tested the end of the grade/course. Information is reported for each grade level/course and content area.
1. Student Information The top section of page one of the ISR contains the student’s identification information. This includes the student name, date of birth, student ID, grade level, school name, and district name.
2. Description of the Report This section provides assessment information, including grade level/course assessed, content area and the assessment year. You will also see a brief description of the assessment, including information on how to use the report.
3. Overall Performance This section includes the student’s performance level and scale score.
A scale score is a numerical value (650–850) that summarizes student performance. Students
receive an overall scale score and, based on that score, they are placed in one of five performance levels. Each performance level is a broad, categorical level defined by a student’s overall scale score and is used to report overall student performance by describing how well students met the expectations for their grade level or course.
There are five performance levels: Level 5: Exceeded expectations; Level 4: Met expectations; Level 3: Approached expectations; Level 2: Partially met expectations; and Level 1: Did not yet meet expectations.
The graphic provides an illustration of where the students overall scale score is positioned within the performance levels. The scale score needed to reach performance level 2 is 700, for performance level 3 it is 725 and for performance level 4 it is 750 for all grade levels/courses for both ELA/Literacy and mathematics. The scale score needed to reach performance level 5 varies. Refer to Appendix A for the full list of scale score ranges for each performance level.
Students performing at levels 4 and 5 met or exceeded expectations. They have demonstrated readiness for the next grade level, course and, ultimately, are likely on track for college and careers. Students performing at levels 1, 2 and 3 may need additional support to meet expectations at the next grade level.
1
2
3
4

Page | 8
4. Average of School, District and DoDEA Comparative performance data allows for comparing a student’s overall scale score to the average overall scale score of students at the school, district, and within DoDEA for the same grade level/course. Comparative performance data differ based on grade level/course.
5. Reporting Category (ELA/Literacy) For ELA/Literacy student reports, there are two reporting categories, Reading and Writing, indicated by the bold headings. For each category, the student performance is provided as a scale score on a scale different from the overall scale score. For this reason, the sum of the scale score for each reporting categories will not equal the overall score. It is important to note that the range of scores for each claim category is not the same. The Reading Claim has a scale score range of 10 to 90, where a score of 50 is Met Expectations. The Writing Claim scale score has a range of 10 to 60, where 35 is Met Expectations. For each Claim, comparative performance data is also presented. 6. Subclaim Category For ELA/Literacy, within each Claim are subcategories or “subclaims.” The subclaims in Reading include Literary Text, Informational Text, and Vocabulary. While in Writing, the
subclaims include Written Expression and Knowledge & Use of Language Conventions. Subclaims are provided for mathematics, but are not listed under reporting categories as they are for ELA/Literacy. The Subclaims for mathematics are Major Content, Additional & Supporting Content, Expressing Mathematical Reasoning, and Modeling & Application. Subclaim performance is reported using categories rather than scale scores or performance levels. Performance in the Level 1 – 2 range of that scale is categorized as “Did Not Yet Meet or Partially Met Expectations”, performance in the Level 3 range is categorized as “Approached Expectations” and performance in the Level 4 – 5 range is categorized as “Met or Exceeded Expectations”.
5
5
4
6
5
5
4
7
5
5
4

Page | 9
7. Legend
The three categories are displayed in the LEGEND portion of the report.
An up arrow for the specified subclaim indicates that the student “Met or Exceeded Expectations”, meaning that the students subclaim performance reflects a level of proficiency consistent with Performance Level 4 or 5. Students in the subclaim category are likely academically well prepared to engage successfully in further studies in the subclaim content area and may need instructional enrichment.
A horizontal arrow for the specified subclaim indicates that the student “Approached Expectations”, meaning that the student’s subclaim performance reflects a level of proficiency consistent with Performance Level 3. Students in this subclaim category likely need academic support to engage successfully in further students in the subclaim content area.
A down arrow for the specified subclaim indicates that the student “Did Not Yet Meet or Partially Met Expectations”, meaning that the student’s subclaim performance reflects a level of proficiency consistent with performance Level 1 or 2. Students in this subclaim category are likely not academically well prepared to engage successfully in further studies in the subclaim content area. Such students likely need instructional interventions to increase achievement in the subclaim content area.
How can the Individual Student Report help students?
Results from the test give teachers, schools, and school districts information about academic performance, and provide insight on how a student is meeting DODEA's expectations. These results never stand alone, but should be used with other measures of learning and class work when determining overall student performance.
How can you use this report?
Parents may use this report to gain a better understanding of their child’s progress towards mastering the CCRS in ELA/Literacy or mathematics. Parents may help their child and reinforce learning at home. You can learn more about DoDEA’s College and Career Ready Standards at https://www.dodea.edu/collegeCareerReady/ccr-standards.cfm. For information on the CCRS Summative Assessment, please visit https://www.dodea.edu/assessments/resources/CCRS.cfm.

Page | 10
2.2 How to Read Your Child’s CCRS Summative 2019 Student Report DoDEA schools around the world administered the College and Career Ready Standards (CCRS) Summative Assessment for students in mathematics (Grades 3–6), Algebra I, Geometry, Algebra II, and in Literacy for Grades 6–8 and for Grade 10. This guide will improve understanding of the score report.
The Summative 2019 Student Report provides information on a student’s overall performance for the content areas tested the end of the grade/course.
1. Student Information This section of the Summative 2019 Student Report
contains the student name and student ID.
2. Test Detail
This section contains the test name, grade level,
date of birth, testing district, and testing school.
3. Overall Performance
This section contains assessment information,
including the student scale score, the content area,
and the performance level.
A scale score is a numerical value (650–850) that summarizes student performance. Students receive an overall scale score and, based on that score, they
are placed in one of five performance levels. Each performance level is a broad, categorical level defined by a student’s overall scale score and is used to report overall student performance by describing how well students met the expectations for their grade level or course.
There are five performance levels: Level 5: Exceeded expectations; Level 4: Met expectations; Level 3: Approached expectations; Level 2: Partially met expectations; Level 1: Did not yet meet expectations. Students performing at levels 4 and 5 met or exceeded expectations. They have demonstrated readiness for the next grade level, course and, ultimately, are likely on track for college and careers.
Reporting Categories The bottom section contains information on reporting categories at the Claims or subclaims level.
4. Claims For ELA/Literacy, each reporting category or “Claim,” Reading and Writing, is displayed with its respective performance data. It is important to note that the range of scores for each claim category is not the same. The Reading Claim has a scale score range of 10 to 90, where a score of 50 is Met Expectations. The Writing Claim scale score has a range of 10 to 60, where 35 is Met Expectations.
1
2
3
4

Page | 11
5. Subclaims Subclaims are reported in terms of percent correct out of the total number of points within the subclaim category. The subclaim indicator reflect the performance level for the score - Met or Exceeded Expectations, Approached Expectations, or Did Not Yet Meet or Partially Met Expectations.
The subclaims in Reading include Literary Text, Informational Text, and Vocabulary. While in Writing, the subclaims include Written Expression and Knowledge & Use of Language Conventions.
For mathematics, the subclaims are Major Content, Additional & Supporting Content, Expressing Mathematical Reasoning, and Modeling & Application.
How can the CCRS Summative 2019 report help students?
Results from the test give teachers, schools, and school districts information about academic performance, and provide insight on how a student is meeting DODEA's expectations. These results never stand alone, but should be used with other measures of learning and class work when determining overall student performance.
How can you use this report?
Parents may help their children and reinforce learning at home. For resources and opportunities for the summer, please visit our Summer Learning page at https://www.dodea.edu/summerLearning/. For information on the CCRS Summative Assessment, please visit https://www.dodea.edu/assessments/resources/CCRS.cfm.
5

Page | 12
Section 3.0 CCRS Summative Reports for
Superintendents, Principals, and/or Teachers
3.1 Student Roster Report
The Student Roster report provides information on how students in the school or district performed for
the content area tested at the end of the grade/course. Information is reported for each grade
level/course and content area.
3.2 District Summary Report
The District Summary report provides information on how students in the school or district performed
for the content area tested at the end of the grade/course. Information is reported for each grade
level/course and content area.
3.3 Performance Level Summary Report
The Performance Level Summary reports are provided at the DoDEA, district, and school level. This
report breaks out the performance aggregations into subcategory levels. Information is reported for
each grade level/course and content area
3.4 Evidence Statement Analysis Report
The Evidence Statement Analysis reports are two-page reports that analyze the performance of the Evidence Statements at the DoDEA, district, and school level. Information is reported for each grade level/course and content area.
3.5 Content Standards Roster Report
The Content Standards Roster analyzes the student performance on operational items on the CCRS
Summative Assessment based on the CCRS. Information is reported for each grade level/content area at
a school level.

Page | 13
3.1 Understanding the DoDEA CCRS Student Roster Report DoDEA schools around the world administered the College and Career Ready Standards (CCRS) Summative Assessment for students in mathematics (Grades 3–6), Algebra I, Geometry, Algebra II, and in English-language arts/literacy (ELA/Literacy) for Grades 6–8 and for Grade 10. The Student Roster report provides information on how students in the school or district performed for the content area tested at the end of the grade/course. Information is reported for each grade level/course and content area.
1. Identifying information The top section of the page identifies the grade of the course assessed, school name and district name. 2. Assessment Information The report heading provides the content area (English Language Arts/Literacy or Mathematics) and grade level/course assessed, as well as the assessment year. 3. DoDEA Averages and Student Roster The first three lines of the roster display the DoDEA, district, and school averages. After the first three lines the report lists all students in the school who took the specified grade/course.
2
3
4 6 7
P
e
r
f
o
r
m
a
n
c
e
l
e
v
e
l
s
a
r
e
i
n
d
i
c
a
t
e
d
b
y
t
h
e
c
o
8
9
5
P
e
r
f
o
r
m
a
n
c
e
l
e
v
e
l
s
a
1

Page | 14
4. Scale Score and Performance Level This column provides the student’s overall scale score and color-coded performance level. A scale score is a numerical value (650–850) that summarizes student performance. Students receive an overall scale score and, based on that score, they are placed in one of five performance levels. Each performance level is a broad, categorical level defined by a student’s overall scale score and is used to report overall student performance by describing how well students met the expectations for their grade level or course. Performance levels are indicated by the color highlighting behind the number.
5. Performance Level Legend
A legend at the bottom of the page can be used to match the coloring to the applicable performance level. There are five performance levels: Level 5: Exceeded expectations; Level 4: Met expectations; Level 3: Approached expectations; Level 2: Partially met expectations; Level 1: Did not yet meet expectations. 6. Reporting Categories For ELA/Literacy, there are two reporting category areas: Reading and Writing. Subclaims fall under the corresponding category. For mathematics, reporting categories are not applicable. 7. Performance by Reporting Category For ELA /Literacy, student performance for each reporting category is provided as a scale score on a scale different from the overall scale score. It is important to note that for this reason, the sum of the reporting category scale scores will not equal the overall scale score. The reporting scale score for each student can be compared to the DoDEA, district, and school levels. As mentioned above, Mathematics do not have reporting categories, so the “Score” columns will not be displayed. 8. Subclaim Category Within each reporting category for ELA/Literacy are specific skill sets (subclaims) students demonstrate on the DoDEA CCRS Summative Assessment. Subclaims are provided for mathematics as well, but do not correspond to a reporting category. The first three rows of each subclaim provide the DoDEA, district, and school averages. Below the first three rows, an icon is displayed representing the student’s performance. 9. Subclaim Performance Indicators The three categories are displayed in the LEGEND portion of the report.
An up arrow for the specified subclaim indicates that the student “Met or Exceeded Expectations”, meaning that the students subclaim performance reflects a level of proficiency consistent with Performance Level 4 or 5. Students in the subclaim category are likely academically well prepared to engage successfully in further studies in the subclaim content area and may need instructional enrichment.

Page | 15
A horizontal arrow for the specified subclaim indicates that the student “Approached Expectations”, meaning that the student’s subclaim performance reflects a level of proficiency consistent with Performance Level 3. Students in this subclaim category likely need academic support to engage successfully in further students in the subclaim content area.
A down arrow for the specified subclaim indicates that the student “Did Not Yet Meet or Partially Met Expectations”, meaning that the student’s subclaim performance reflects a level of proficiency consistent with performance Level 1 or 2. Students in this subclaim category are likely not academically well prepared to engage successfully in further studies in the subclaim content area. Such students likely need instructional interventions to increase achievement in the subclaim content area.
How can the Student Roster Report help students?
The Student Roster Report provides information on students’ overall performance for the content areas tested the end of the grade/course. This report contains information on the student performance and claim and subclaim performance for a group of students at the school.
How can you use this report?
• Discuss the overall school performance with the faculty. • Review the CCRS Summative Assessment Report Guide with the faculty. • Share hard copies of the Student Roster Report to grade level/course teachers for discussion
during Focused Collaboration meeting. Remind the teachers of the confidential nature of the report.

Page | 16
3.2 Understanding the DoDEA CCRS Summative District Summary DoDEA schools around the world administered the College and Career Ready Standards (CCRS) Summative Assessment for students in mathematics (Grades 3–6), Algebra I, Geometry, Algebra II, and in English-language arts/literacy (ELA/Literacy) for Grades 6–8 and for Grade 10. The District Summary report provides information on how students in the school or district performed for the content area tested at the end of the grade/course. Information is reported for each grade level/course and content area.
1. Identifying Information The top section of the page identifies the grade of the course assessed and district name. 2. Assessment Information The report heading provides the content area (English Language Arts/Literacy or Mathematics) and the grade level/course assessed, as well as the assessment year.
2
3
4
5 6 A scale score is a numerical value (650-850) t
7
7A scale score is a numerical value (650-850
2
87A scale score is a numerical value (650-850)
97A scale score is a numerical value (650-
107A scale score is a numerical value (650-
1
7A scale score is a numerical value (650-850) tha
2

Page | 17
3. Percentage of Students at Each Performance Level The first column in the report shows the distribution of the students that fall into each performance level at the DoDEA, district and school levels. Each section of the graph represents a performance level, beginning with level 1 on the left through level 5 on the right. The numerical values underneath the visual indicate the percentage of students who fall into each performance level. Please note that the numbers may not appear centered under each color. 4. Performance Level Legend A legend at the bottom of the page can be used to match the coloring to the applicable performance level. There are five performance levels: Level 5: Exceeded expectations; Level 4: Met expectations; Level 3: Approached expectations; Level 2: Partially met expectations; Level 1: Did not yet meet expectations. 5. Number of Students The second column indicates the number of students that aggregate to the DoDEA, district, and each school listed on the report. 6. Average Overall Scale Score This column provides the average overall scale score for all students assessed at the DoDEA, district, and school levels shown on the report. A scale score is a numerical value (650–850) that summarizes student performance. Students receive an overall scale score and, based on that score, they are placed in one of five performance levels. Each performance level is a broad, categorical level defined by a student’s overall scale score and is used to report overall student performance by describing how well students met the expectations for their grade level or course. Performance levels are indicated by the color highlighting behind the number.
7. Reporting Categories For English Language Arts, there are two reporting category areas: Reading and Writing. Subclaims fall under the corresponding category. For Mathematics, reporting categories are not applicable. 8. Performance by Reporting Category For English Language Arts, student performance for each reporting category is provided as a scale score on a scale different from the overall scale score. It is important to note that for this reason, the sum of the reporting category scale scores will not equal the overall scale score. The reporting scale score for each student can be compared to the DoDEA, district, and school levels. As mentioned above, Mathematics does not have reporting categories, so the “Score” columns will not be displayed. 9. Subclaim Category Within each reporting category for ELA/Literacy are specific skill sets (subclaims) students demonstrate on the DoDEA CCRS Summative Assessment. Subclaims are provided for mathematics as well, but do not correspond to a reporting category. The first three rows of each subclaim provide the DoDEA, district, and school averages. Below the first three rows, an icon is displayed representing the student’s performance.

Page | 18
10. Subclaim Performance Indicators The three categories are displayed in the LEGEND portion of the report.
An up arrow for the specified subclaim indicates that the student “Met or Exceeded Expectations”, meaning that the students subclaim performance reflects a level of proficiency consistent with Performance Level 4 or 5. Students in the subclaim category are likely academically well prepared to engage successfully in further studies in the subclaim content area and may need instructional enrichment.
A horizontal arrow for the specified subclaim indicates that the student “Approached Expectations”, meaning that the student’s subclaim performance reflects a level of proficiency consistent with Performance Level 3. Students in this subclaim category likely need academic support to engage successfully in further students in the subclaim content area.
A down arrow for the specified subclaim indicates that the student “Did Not Yet Meet or Partially Met Expectations”, meaning that the student’s subclaim performance reflects a level of proficiency consistent with performance Level 1 or 2. Students in this subclaim category are likely not academically well prepared to engage successfully in further studies in the subclaim content area. Such students likely need instructional interventions to increase achievement in the subclaim content area.

Page | 19
3.3 Understanding the DoDEA CCRS Summative Performance Level Summary
Report DoDEA schools around the world administered College and Career Ready Standards (CCRS) Summative Assessment for students in mathematics (Grades 3–6), Algebra I, Geometry, Algebra II, and in English-language arts/literacy (ELA/Literacy) for Grades 6–8 and for Grade 10. The Performance Level Summary reports are provided at the DoDEA, District and School level. This report breaks out the performance aggregations into subcategory levels. Information is reported for each grade level/course and content area.
1. Identifying Information The top section of the page identifies the grade of the course assessed, school name (if a school level report) and district name.
1
2
3
4 5
6 7

Page | 20
2. Assessment Information The report heading provides the content area (English Language Arts/Literacy or Mathematics) and the grade level/course assessed, as well as the assessment year. 3. Demographic and Student Groups Demographic and program categories with student groups are listed on the first column of the table. Please see the list of terminologies found in Appendix B. 4. Number of Valid Scores The second column indicates the number of students that aggregate to the DoDEA, district, and each school listed on the report. This column does not include students with no score. 5. Average Scale Score The average scale score is displayed for DoDEA, District, and school (if school level report). A scale score is a numerical value (650–850) that summarizes student performance. Students receive an overall scale score and, based on that score, they are placed in one of five performance levels. Each performance level is a broad, categorical level defined by a student’s overall scale score and is used to report overall student performance by describing how well students met the expectations for their grade level or course. Performance levels are indicated by the color highlighting behind the number. 6. Performance Level Results The bulk of the report will show the number and percentage of students who performed at the Did Not Yet Meet Expectations, Partially Met Expectations, Approached Expectations, Met Expectations, and Exceeded Expectations levels for each demographic or student group. 7. Count and Percentage of Students at or Above Performance Level 4 The last columns provide a count and percentage of the students who fell into performance level 4 or 5 (Met or Exceeded Expectations) for each demographic or student group.
Page | 21
3.4 Understanding the DoDEA CCRS Summative Evidence Statement Analysis
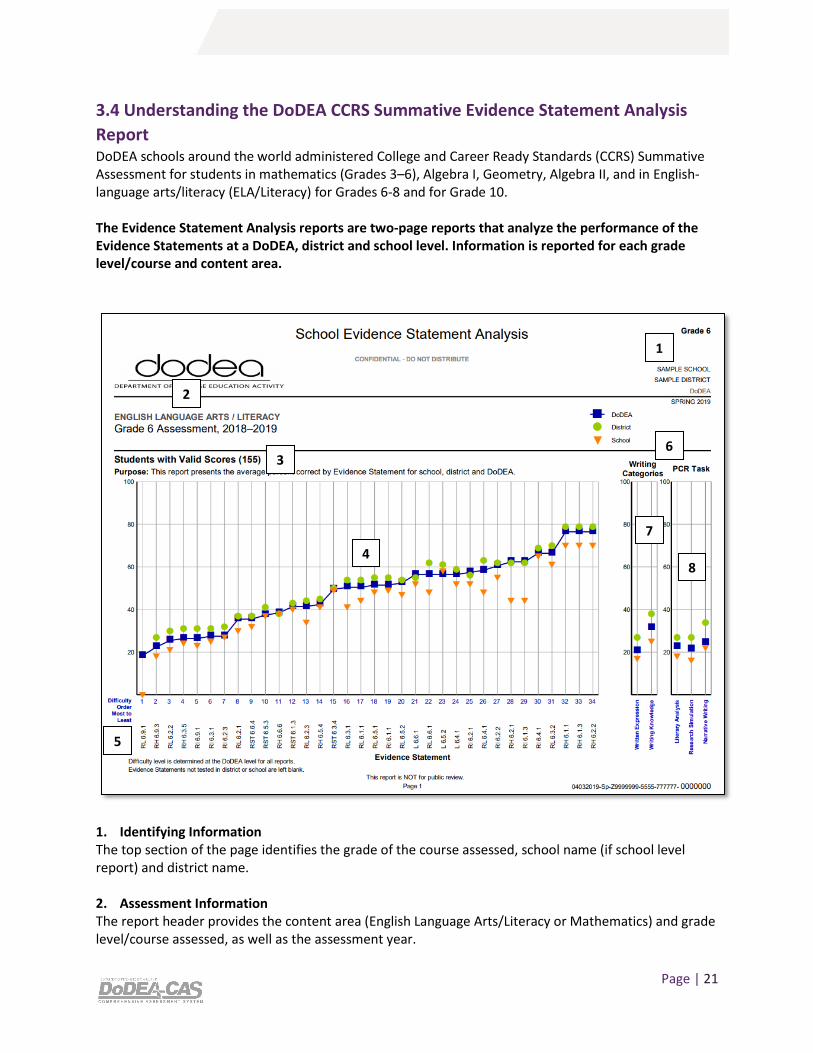
Report DoDEA schools around the world administered College and Career Ready Standards (CCRS) Summative Assessment for students in mathematics (Grades 3–6), Algebra I, Geometry, Algebra II, and in English-language arts/literacy (ELA/Literacy) for Grades 6-8 and for Grade 10. The Evidence Statement Analysis reports are two-page reports that analyze the performance of the Evidence Statements at a DoDEA, district and school level. Information is reported for each grade level/course and content area.
1. Identifying Information The top section of the page identifies the grade of the course assessed, school name (if school level report) and district name. 2. Assessment Information The report header provides the content area (English Language Arts/Literacy or Mathematics) and grade level/course assessed, as well as the assessment year.
1
2
1
3
1
4
1
5
1
6
1
7
1
8
1

Page | 22
3. Students with Valid Scores The total number of students with a valid score are shown on the graph header. This report presents the average percent correct by evidence statement for students who have a reportable summative scale score. Reportable scores are those records that have met attemptedness, are non-voided and are without a suppression code. 4. Graph The graph shown reflects the average percent correct per each evidence statement. DoDEA placement is represented by a blue square, district by a green circle and school by an orange triangle. The DoDEA level is connected by a solid line. District and school symbols are not connected because depending on the form assignment selection taken at the school and district, all evidence statements may not be represented. 5. Evidence Statements Items on the CCRS Summative Assessment are written to specific Evidence Statements, which are based on the College and Career Ready Standards (CCRS). Each item on the assessment is combined into an evidence statement group. For ELA/Literacy, items may be aligned to more than one evidence statement. These items are aligned on the report in every evidence statement group that applied to that item. This means that the same item could be represented several times on the report depending on the alignment. The evidence statements on the bottom of the graph are placed in order from most, to least difficult. This determination is made by the overall performance level of each item based on the DoDEA level. 6. Writing Tasks This section will only show for ELA/Literacy and will not show for mathematics. For ELA/Literacy this will chart information related to the performance of writing tasks included in the test. 7. Written Expression and Writing Knowledge Written Expression includes the development of ideas, organization, and clarification of language that the student demonstrates in the written response. Writing Knowledge assesses the student’s command of the conventions of standard English, including grammar and usage. Aggregate percent correct is displayed at the DoDEA, district, and school levels. 8. Prose Constructive Response (PCR) This section breaks down the writing tasks by the three types of PCR items included in the CCRS Summative Assessment. The PCRs ask for a student response that analyzes some aspect of either literary pieces or information pieces in the categories of Literary Analysis, Research Simulation, and Narrative Writing.

Page | 23
9. Evidence Statement Evidence Statements are listed in the same order as page 1, from most to least difficult. 10. College and Career Ready Standards (CCRS) The CCRS linked to the Evidence Statements are listed in the third column. An evidence statement could be connected to multiple standards. There are some evidence statements that do not directly align to a CCRS. For those statements that are considered Modeling or Modeling & Reasoning – Securely Help Knowledge, that verbiage is indicated on the chart on page 2. Additionally, some integrated evidence statements are across multiple domains and are also not firmly linked to a specific CCRS. Those statements will indicate "Multiple" on the report. 11. Domain The Common Core domain level is listed in this column. 12. Item Type The item type column includes all item types for the items included in each Evidence Statement category. If more than one item type applies, all item types will be listed in the "Item Type" column on page 2 of the report. Mathematics item types are Mathematics - Type I (tasks assessing concepts, skills and procedures), Mathematics - Type II (tasks assessing expressing mathematical reasoning), and Mathematics - Type III (tasks assessing modeling/applications). ELA/Literacy item types are Prose Constructed Response (PCR), Evidence Based Selected Response-Multiple Choice (EBSR), and Technology Enhanced Constructed Response (TECR). For samples of item types, please visit: https://dodea.mypearsonsupport.com/practice-tests/.
9 10 11 12 13

Page | 24
13. Student Count The student count represents the number of students whose form of the assessment contained an item or items written to the evidence statement listed in column A. The count may differ by row as there are different forms of the assessment and not all forms include all items or evidence statements
How can the Evidence Statement Analysis Report help students?
The School Evidence Statement Analysis Report provides information on school overall performance for
evidence statements for content areas tested. This report compares the school performance on each
evidence statement with the district and DoDEA.
How will Directors of Student Excellence use this report with Superintendent and Community
Superintendents?
• Discuss goal setting and professional learning needs of principals and district leaders.
How can principals use this report with the School Leadership team?
• Discuss the overall school performance with the faculty.
• Review the CCRS Summative Assessment Report Guide with the faculty.
• Discuss the results with the Leadership team. Remind the team of the confidential nature of the
report.

Page | 25
3.5 Understanding the DoDEA CCRS Summative Content Standards Roster DoDEA schools around the world administered the College and Career Ready Standards (CCRS) Summative Assessment for students in mathematics (Grades 3–6), Algebra I, Geometry, Algebra II, and in English-language arts/literacy (ELA/Literacy) for Grades 6–8 and for Grade 10. The Content Standards Roster analyzes the student performance on operational items on the CCRS
Summative Assessment based on the CCR Standards. Information is reported for each grade
level/content area at a school level.
1
2
3
4
2
5
2
6
2

Page | 26
7
2
8
2

Page | 27
1. Identifying Information The top section of the page identifies the grade of the course assessed, school name, and district name. 2. Assessment Information The report header provides the content area (English Language Arts/Literacy or Mathematics) and grade level/course assessed, as well as the assessment year. 3. Student Information Students will be listed by last name in alphabetical order. Students are listed if a valid score is available. 4. College and Career Ready Domain and Standard All operational items are combined into the CCRS Domain and Standard group into which it applies. Some items represent multiple standards and may therefore be included in multiple groups on this report. If a domain has more than one standard for that grade level/course, then a total column will also be provided. A description of the standards and their domains can be found at the link https://www.dodea.edu/collegeCareerReady/ccr-standards.cfm
9
2

Page | 28
5. DoDEA and Student Average This column shows the overall DoDEA average percent achieved for all students with valid scores for each domain, as well as the percent achieved for each student listed in the report. Groups with fewer than 6 maximum points will have “< 6” listed in this column, not the student’s percent correct.
6. Core Form This column indicates the operational core form taken by each student listed for the Spring 2019 administration. The form is determined by the core operational form. Form codes starting with the letter P are paper; forms starting with the letter O are online and forms starting with the letter A are accommodated forms. Information for all columns (Total Points Possible, Student Percent Achieved, State Average Percent Achieved) are for that student's individual operational form combination. Comparisons cannot be made for students across domains unless both students took the exact form for the report administration.
7. Writing Categories ELA/Literacy reports include a breakdown for writing categories. Written Expression includes the development of ideas, organization, and clarity of language that the student demonstrates in the written response. Writing Knowledge assesses the student's command of the conventions of standard English, including grammar, and usage. 8. Prose Constructed Response (PCR) ELA/Literacy reports include a breakdown of the PCR. This section breaks down the writing tasks by the three types of PCR items included on the CCRS Summative Assessment. The PCRs ask for a student response that analyzes some aspect of either literary pieces or informational pieces in the categories of Literary Analysis, Research Simulation, and Narrative Writing.
9. Modeling and Reasoning Mathematics includes Evidence Statements that are in the category of Modeling and Reasoning. When linked to the CCRS, Modeling and Reasoning items are considered either On Grade Level (OGL) or Securely Held Knowledge (SHK). On Grade Level items are aligned to standards that are the same grade as the grade of the current assessment. For Example, a Grade 3 Math assessment may have Modeling and Reasoning items that are aligned to Grade 3 level standards (3.OA.A, 3.MD.B). These are considered On Grade Level. Securely Held Knowledge items are aligned to standards that are a grade below the grade of the test given. For example, a Grade 3 Math assessment may have Modeling and Reasoning items that area aligned to grade 2 standards (2.OA.A, 2.MD.B). These are considered Securely Held Knowledge.
The Content Standards Roster Report provides information on students’ performance for groups of
standards on the CCRS Summative Assessment. This report contains information on the student
performance for a set group of standards.
How can principals use this report with School Leadership team?
• Discuss the overall school performance with the faculty.
• Review the CCRS Summative Assessment Report Guide with the faculty.

Page | 29
• Share hard copies of the Content Standards Roster Report to grade level/course teachers for
discussion during Focused Collaboration meeting. Remind the teachers of the confidential
nature of the report.
• Discuss goal setting and professional learning needs of instructional staff.

Page | 30
This page intentionally left blank.

Page | 31
Appendix A
Scale Score Ranges

Page | 32
Grade 6 ELA/L Level 1 Cut 650 Level 1 Range 650–699
Level 2 Cut 700 Level 2 Range 700–724
Level 3 Cut 725 Level 3 Range 725–749
Level 4 Cut 750 Level 4 Range 750–789
Level 5 Cut 790 Level 5 Range 790–850
Grade 7 ELA/L Level 1 Cut 650 Level 1 Range 650–699
Level 2 Cut 700 Level 2 Range 700–724
Level 3 Cut 725 Level 3 Range 725–749
Level 4 Cut 750 Level 4 Range 750–784
Level 5 Cut 785 Level 5 Range 785–850
Grade 8 ELA/L Level 1 Cut 650 Level 1 Range 650–699
Level 2 Cut 700 Level 2 Range 700–724
Level 3 Cut 725 Level 3 Range 725–749
Level 4 Cut 750 Level 4 Range 750–793
Level 5 Cut 794 Level 5 Range 794–850
Grade 10 ELA/L Level 1 Cut 650 Level 1 Range 650–699
Level 2 Cut 700 Level 2 Range 700–724
Level 3 Cut 725 Level 3 Range 725–749
Level 4 Cut 750 Level 4 Range 750–793
Level 5 Cut 794 Level 5 Range 794–850
Grade 3 Mathematics Level 1 Cut 650 Level 1 Range 650–699
Level 2 Cut 700 Level 2 Range 700–724
Level 3 Cut 725 Level 3 Range 725–749
Level 4 Cut 750 Level 4 Range 750–789
Level 5 Cut 790 Level 5 Range 790–850

Page | 33
Grade 4 Mathematics Level 1 Cut 650 Level 1 Range 650–699
Level 2 Cut 700 Level 2 Range 700–724
Level 3 Cut 725 Level 3 Range 725–749
Level 4 Cut 750 Level 4 Range 750–795
Level 5 Cut 796 Level 5 Range 796–850
Grade 5 Mathematics Level 1 Cut 650 Level 1 Range 650–699
Level 2 Cut 700 Level 2 Range 700–724
Level 3 Cut 725 Level 3 Range 725–749
Level 4 Cut 750 Level 4 Range 750–789
Level 5 Cut 790 Level 5 Range 790–850
Grade 6 Mathematics Level 1 Cut 650 Level 1 Range 650–699
Level 2 Cut 700 Level 2 Range 700–724
Level 3 Cut 725 Level 3 Range 725–749
Level 4 Cut 750 Level 4 Range 750–787
Level 5 Cut 788 Level 5 Range 788–850
Algebra I Level 1 Cut 650 Level 1 Range 650–699
Level 2 Cut 700 Level 2 Range 700–724
Level 3 Cut 725 Level 3 Range 725–749
Level 4 Cut 750 Level 4 Range 750–804
Level 5 Cut 805 Level 5 Range 805–850

Page | 34
Algebra II Level 1 Cut 650 Level 1 Range 650–699
Level 2 Cut 700 Level 2 Range 700–724
Level 3 Cut 725 Level 3 Range 725–749
Level 4 Cut 750 Level 4 Range 750–807
Level 5 Cut 808 Level 5 Range 808–850
Geometry Level 1 Cut 650 Level 1 Range 650–699
Level 2 Cut 700 Level 2 Range 700–724
Level 3 Cut 725 Level 3 Range 725–749
Level 4 Cut 750 Level 4 Range 750–782
Level 5 Cut 783 Level 5 Range 783–850

Page | 35
Appendix B
Glossary

Page | 36
Claims: The claim structures for ELA/Literacy and mathematics, grounded in the Standards, inform the
design and development of the summative assessments.
College and Career Ready Domain: Domains are larger groups of related standards. Standards from
different domains may sometimes be closely related.
College and Career Ready Standard (CCRS): Standards define what students should understand and be
able to do for the subject and grade level.
Content Standard Roster Report: The Content Standards Roster Report analyzes the student
performance of operational items on the Spring 2019 Assessment based on the Standard upon which
the Evidence Statements are based. The report is by grade level/course and content area at a school
level.
English Language Learner (ELL): A student who comes from non-English speaking homes and who are
learning English. Many ELL students have developed basic communication skills in English but still
struggle with academic language.
Ethnicity: Origin or descent; common national or cultural tradition. The category which most clearly
reflects the student's recognition of his or her community or with which the individual most identifies.
Evidence Statement: Statements that describe the knowledge and skills that an assessment item or a
task elicits from students. These are aligned directly to the CCRS, and highlight their advances especially
around the coherent nature of the standards.
Gender: Male or Female - as it appears on the student's birth certificate or the gender with which the
student identifies.
Item Type: Mathematics item types are Mathematics - Type I (tasks assessing concepts, skills and
procedures), Mathematics - Type II (tasks assessing expressing mathematical reasoning) and
Mathematics - Type III (tasks assessing modeling/applications). English Language Arts / Literacy item
types are Prose Constructed Response (PCR), Evidence Based Selected Response – Multiple-Choice
(EBSR), and Technology Enhanced Constructed Response (TECR).
PearsonAccessnext (PAN): PAN is the test delivery system for managing online test administration and
accessing CCRS Summative Assessment reports.
Performance Level 1 - Did not yet meet expectations: Students classified as either Level 1, Level 2 or
Level 3 have not yet met the grade level expectations.
Performance Level 2 - Partially met expectations: Students classified as either Level 1, Level 2 or Level
3 have not yet met the grade level expectations.

Page | 37
Performance Level 3 - Approached expectations: Students classified as either Level 1, Level 2 or Level 3
have not yet met the grade level expectations.
Performance Level 4 - Met expectations: Students classified as either Level 4 or Level 5 are meeting or
exceeding the grade level expectations.
Performance Level 5 - Exceeded expectations: Students classified as either Level 4 or Level 5 are
meeting or exceeding the grade level expectations.
Performance Levels: Performance levels are broad, categorical levels defined by a student's overall
scale score. These are used to classify students in terms of the level of knowledge and skill in the
content area as students progress in their K–12 education.
Prose Constructive Response (PCR): English Language Arts tasks that connect Reading and Writing
Standards. On this assessment the PCRs are broken down into categories of Literary Analysis, Research
Simulation, and Narrative Writing.
Race: General racial category which most clearly reflects the student's recognition of his or her
community or with which the individual most identifies.
Reporting Category: The ELA/Literacy assessment is also reported at Reading and Writing reporting
categories which provides a scale score in addition to the overall scale score.
Scale Score: The scale score is a numeric value that summarizes overall student performance on the
assessment based on a raw score to scale score equated conversion table.
School Evidence Statement Analysis: A two-page report which analyzes the performance of the
assessment evidence statements at a school level for each operational item on the Spring 2019
assessment. Information is reported for each grade level/course and content area.
Student with Disabilities: A student who has an Individualized Education Program (IEP) or an
Individualized Services Plan (ISP), regardless of the category or severity of the student's disability
(includes ""speech-only"" students).
Subclaim: Subclaim represents a group of standards that are identified for reporting.
Subclaim Category: Subclaim category reporting represents how well the student performed in a
subclaim. This is a measure of students proficiency for each subclaim.
Subclaim Performance Indicators: Indicators for performance on the subclaim categories are shown at
three levels: Did Not Yet Meet or Partially Met Expectations; Approached Expectations and Met or
Exceeded Expectations.

Page | 38
This page intentionally left blank.
Page | 39
This page intentionally left blank.
