@ccsa - amh ontario
TRANSCRIPT
@CCSA.CCDUS
@CCSAcanada • @CCDUScanada
Can Centre on Substance Use and Addiction / Centre
can sur les dépendances et l’usage de substances
www.ccsa.ca • www.ccdus.ca
Canadian Substance Use Costs and
Harms
Pamela Kent and Bridget Hall
May 28, 2019
Disclosure Statement
• We have no affiliation (financial or otherwise) with a
pharmaceutical, medical device or communications
organization.
Agenda
1. Overview of the Canadian Substance Use Costs and
Harms (CUSCH) study
2. Demonstration of the CSUCH tool
3. Activity – using the tool
4. Tool feedback and discussion
Before we begin…
• What type of work do you do?
– Research
– Policy development / analysis
– Program/service development / implementation
– Performance measurement and evaluation
– Other?
• What region of Canada do you represent?
Acknowledgement
6
This work is made possible through a
financial contribution from Health
Canada.
The views expressed herein do not
necessarily represent the views of Health
Canada.
About CCSA
• Vision: A healthier Canadian society where evidence
transforms approaches to substance use.
• Mission: To address issues of substance use in Canada by
providing national leadership and harnessing the power of
evidence to generate coordinated action.
• Value Proposition: Provide national leadership to address
substance use in Canada. A trusted counsel, we provide
guidance to decision makers by harnessing the power of
research, curating knowledge and bringing together diverse
perspectives.
• National non-profit organization with a pan-Canadian and
international role.
7www.ccsa.ca • www.ccdus.ca
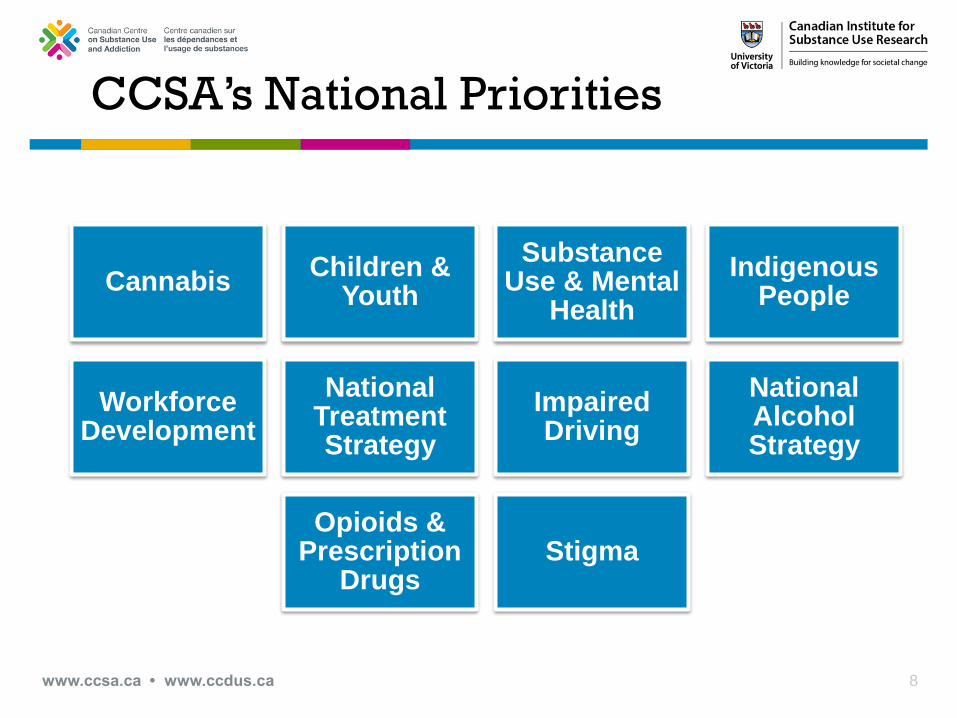
CCSA’s National Priorities
8www.ccsa.ca • www.ccdus.ca
CannabisChildren &
Youth
Substance Use & Mental
Health
Indigenous People
Workforce Development
National Treatment Strategy
Impaired Driving
National Alcohol Strategy
Opioids & Prescription
DrugsStigma

Background
• Most recent comprehensive
assessment on the harms and
economic burden of substance use
(SU) in Canada was the CCSA-led
study by Rehm and colleagues,
conducted in 2006 using 2002 data
• This study continues to be cited but
data is no longer current
• The ability to report costs and trends
in harms uniquely caused by the use
of different substances will be a
valuable support for federal,
provincial and territorial (FPT) efforts
to reduce these harms
10
Background
11
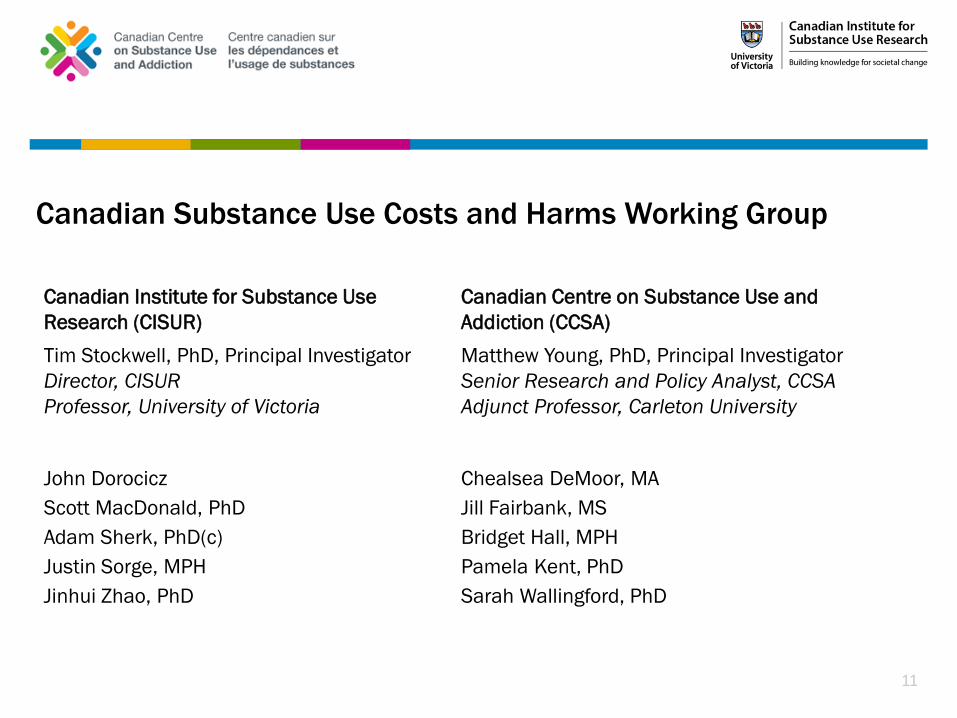
Canadian Institute for Substance Use
Research (CISUR)
Canadian Centre on Substance Use and
Addiction (CCSA)
Tim Stockwell, PhD, Principal Investigator
Director, CISUR
Professor, University of Victoria
Matthew Young, PhD, Principal Investigator
Senior Research and Policy Analyst, CCSA
Adjunct Professor, Carleton University
John Dorocicz Chealsea DeMoor, MA
Scott MacDonald, PhD Jill Fairbank, MS
Adam Sherk, PhD(c) Bridget Hall, MPH
Justin Sorge, MPH Pamela Kent, PhD
Jinhui Zhao, PhD Sarah Wallingford, PhD
Canadian Substance Use Costs and Harms Working Group
www.ccsa.ca • www.ccdus.ca 12
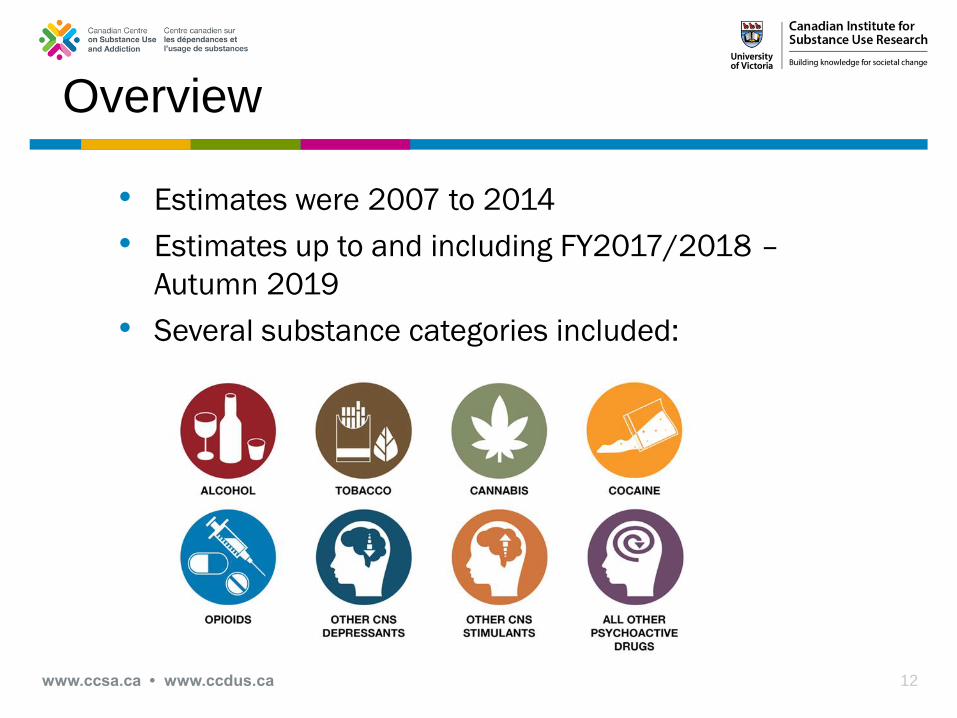
• Estimates were 2007 to 2014
• Estimates up to and including FY2017/2018 –
Autumn 2019
• Several substance categories included:
Overview
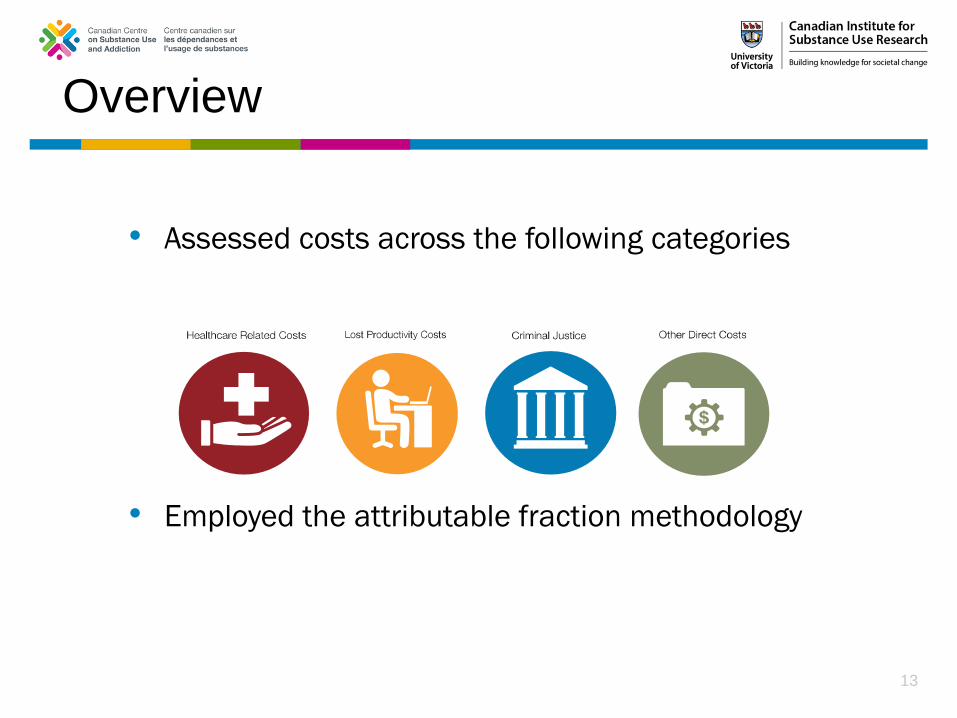
• Assessed costs across the following categories
• Employed the attributable fraction methodology
13
Overview
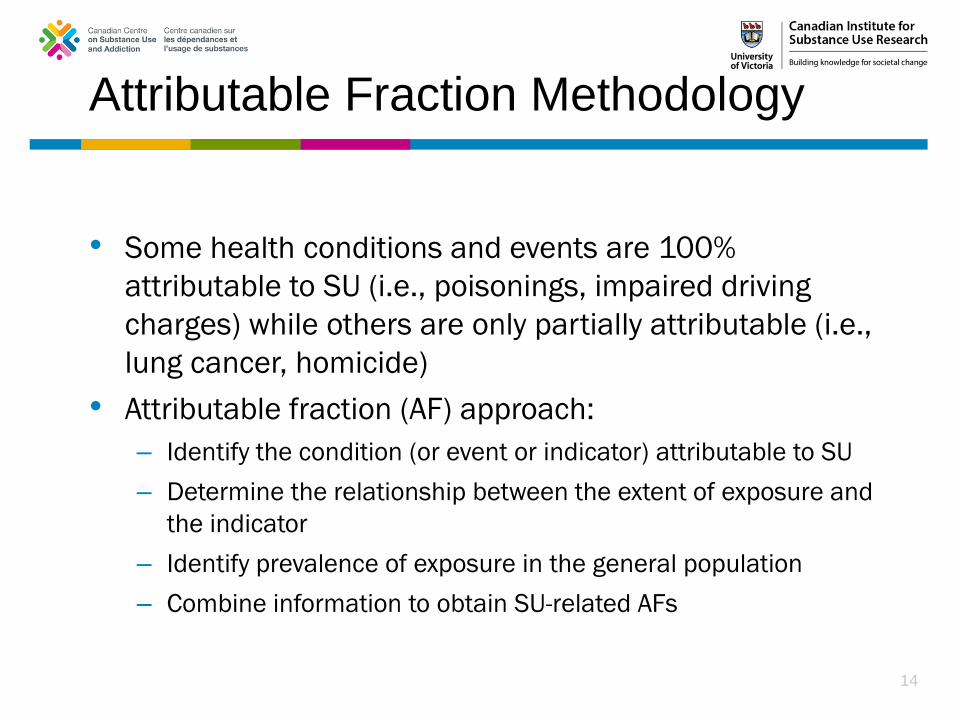
Attributable Fraction Methodology
• Some health conditions and events are 100%
attributable to SU (i.e., poisonings, impaired driving
charges) while others are only partially attributable (i.e.,
lung cancer, homicide)
• Attributable fraction (AF) approach:
– Identify the condition (or event or indicator) attributable to SU
– Determine the relationship between the extent of exposure and
the indicator
– Identify prevalence of exposure in the general population
– Combine information to obtain SU-related AFs
14
15
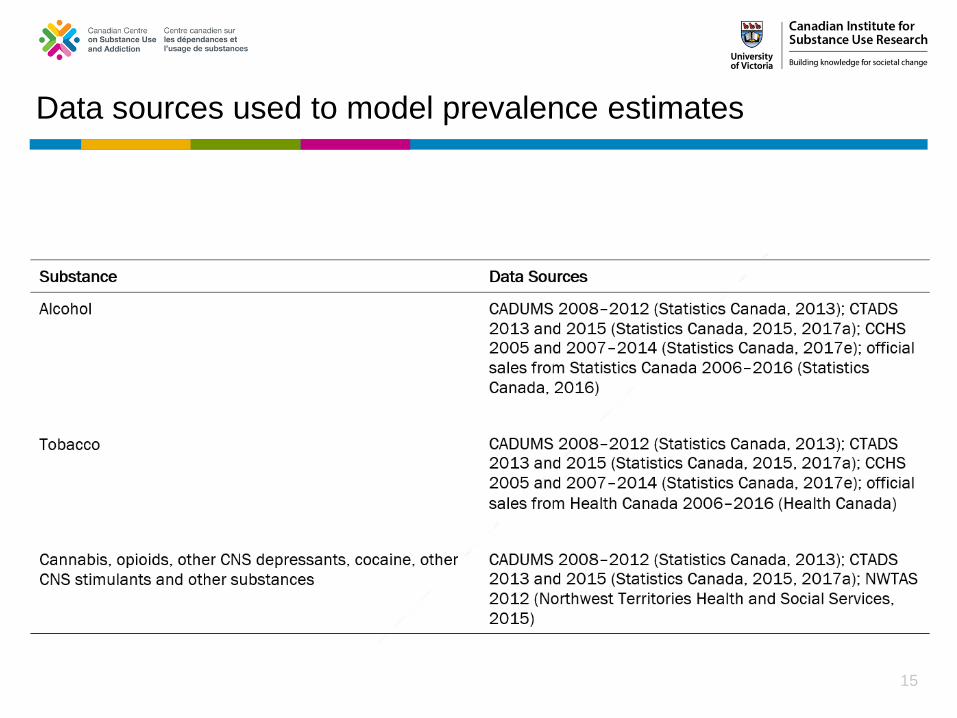
Data sources used to model prevalence estimates
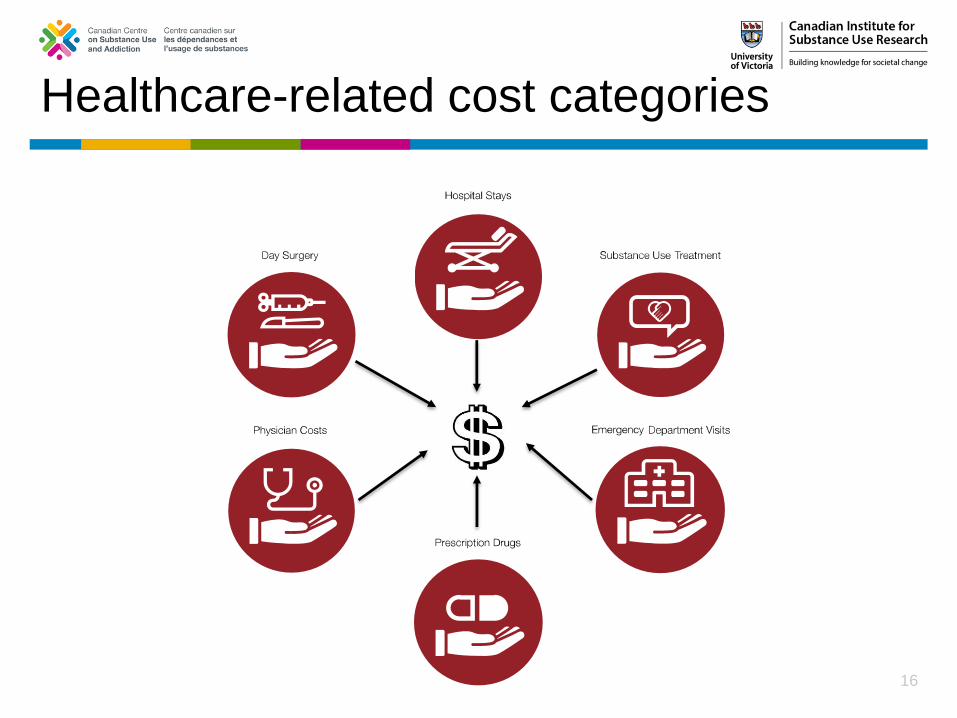
Healthcare-related cost categories
16
17
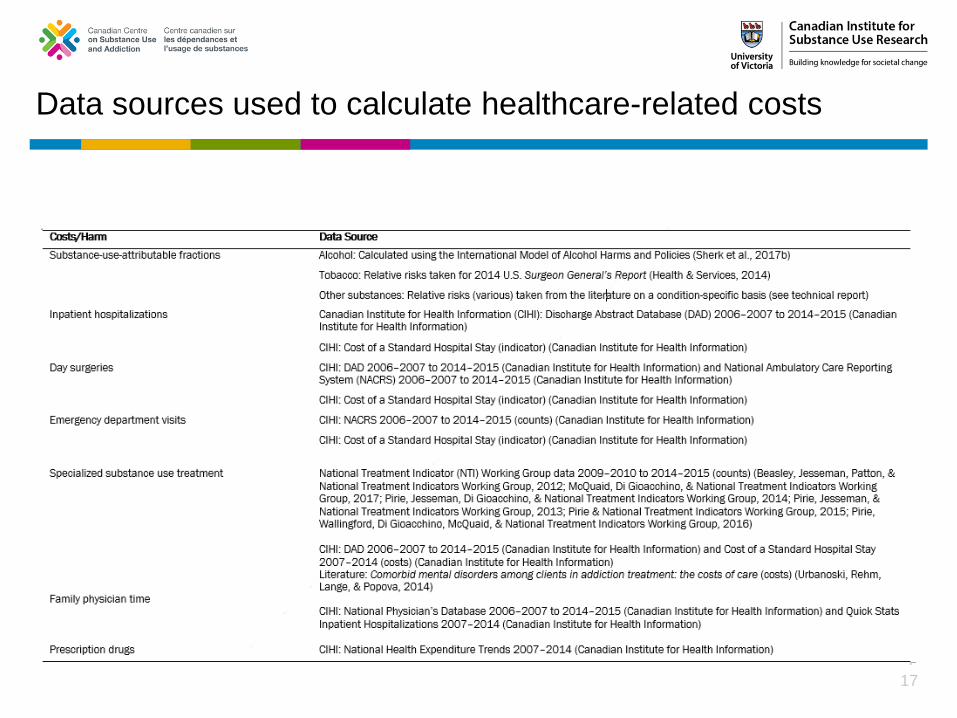
Data sources used to calculate healthcare-related costs
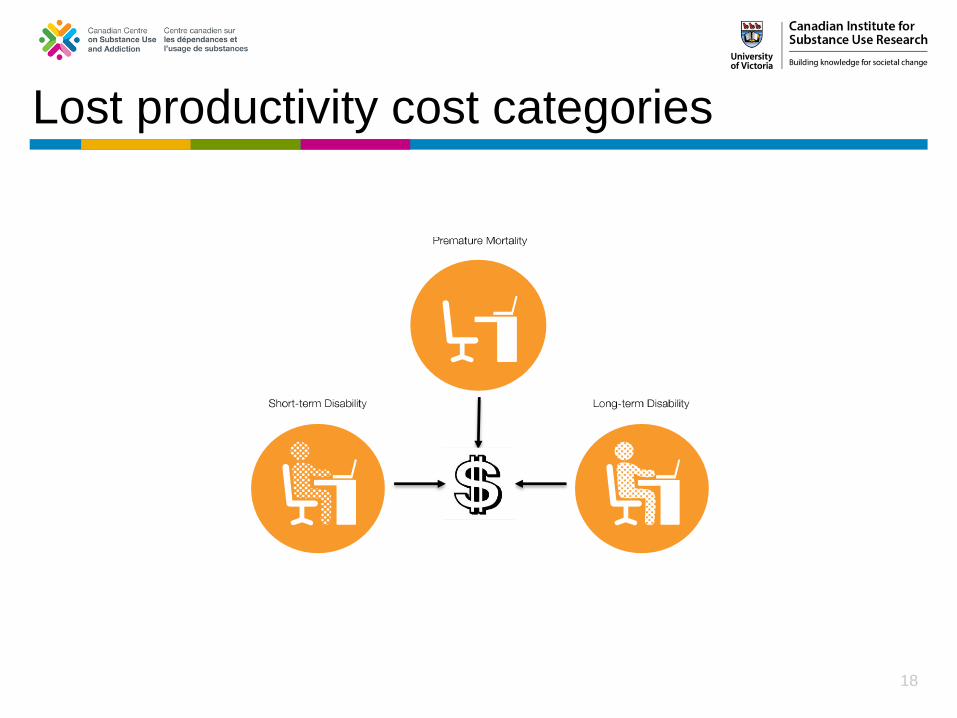
Lost productivity cost categories
18
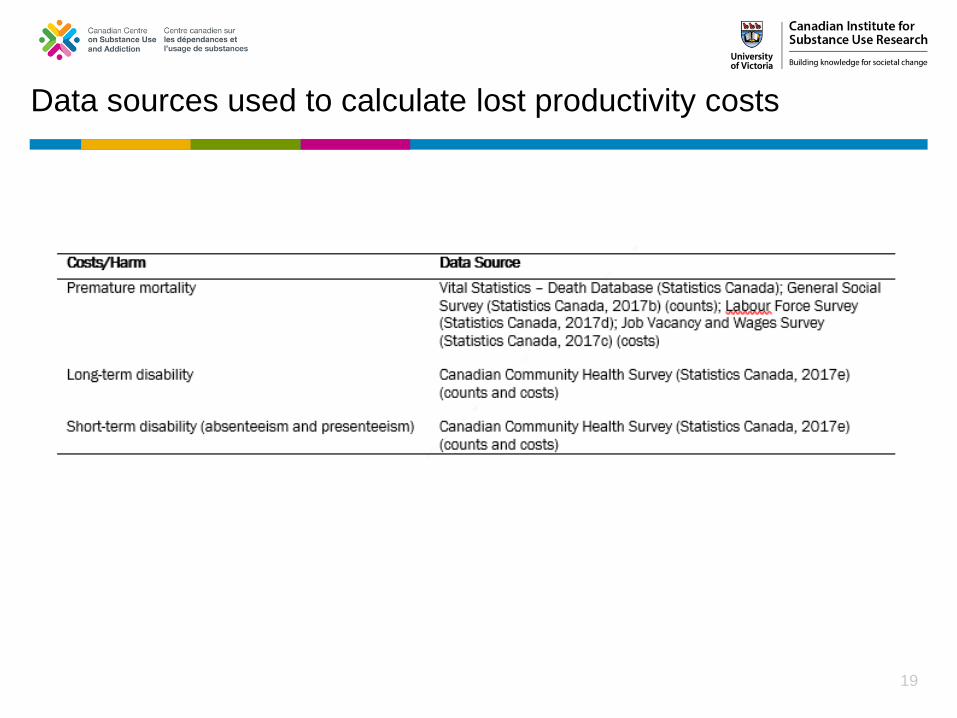
19
Data sources used to calculate lost productivity costs
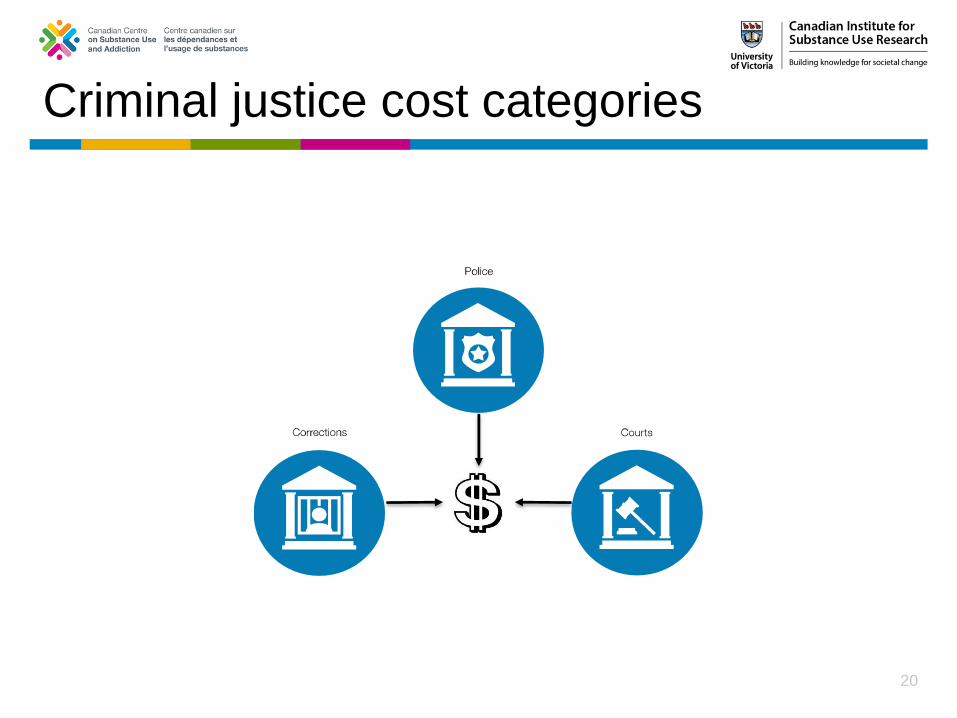
Criminal justice cost categories
20
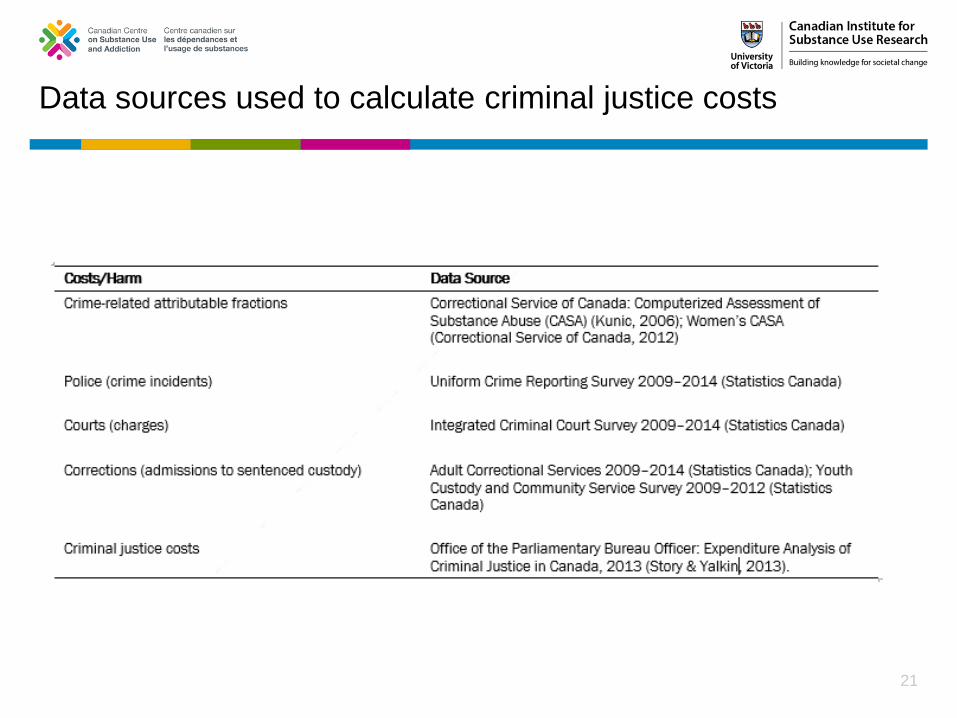
21
Data sources used to calculate criminal justice costs
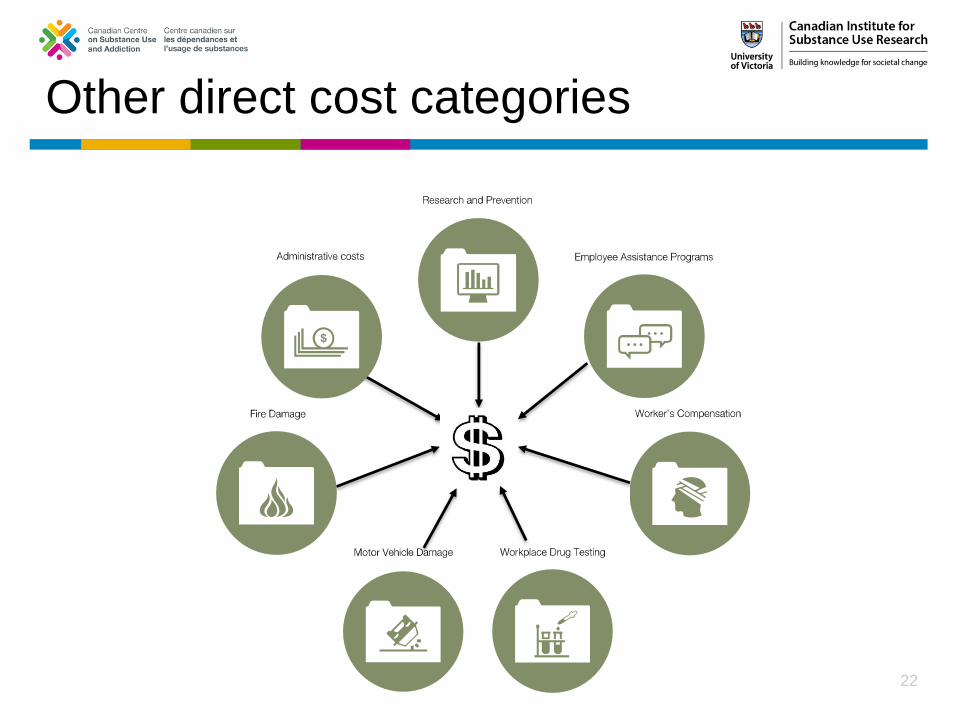
Other direct cost categories
22
23
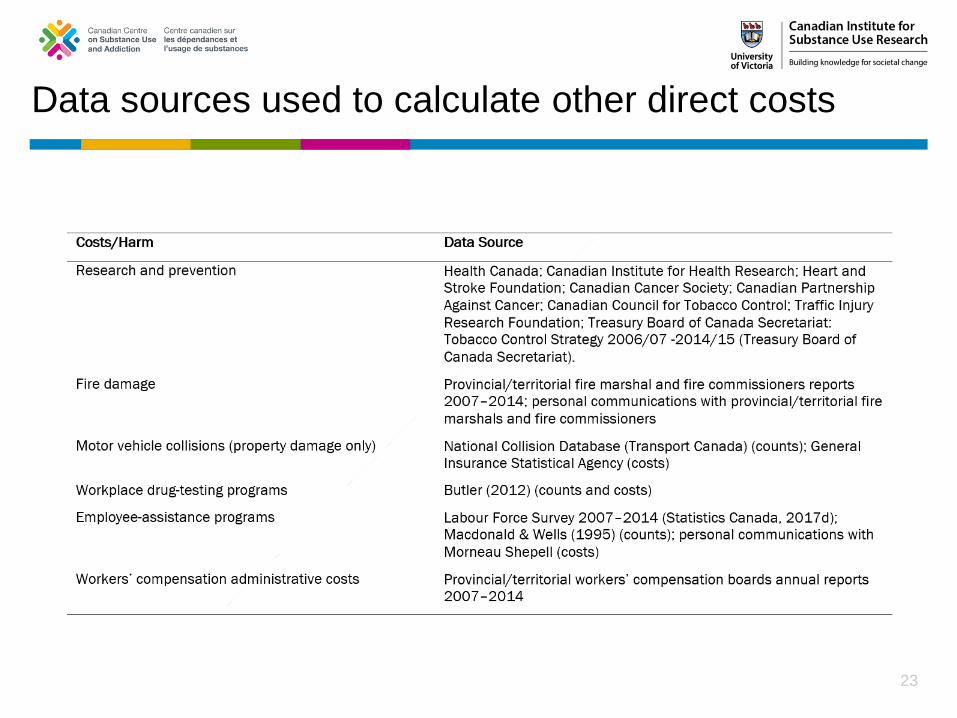
Data sources used to calculate other direct costs
www.ccsa.ca • www.ccdus.ca 24
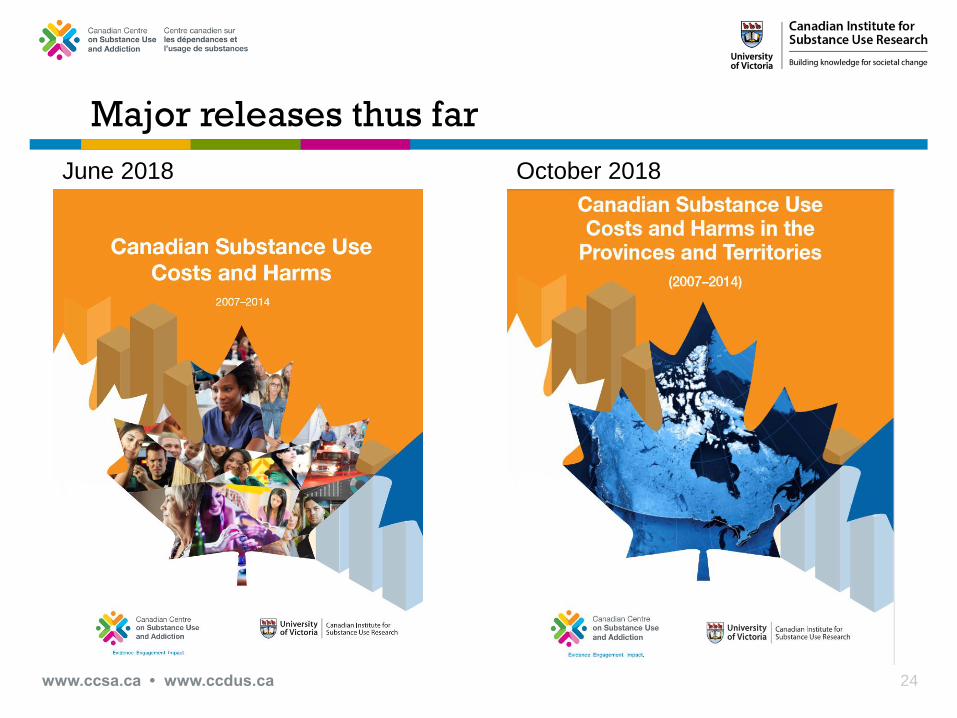
June 2018 October 2018
Major releases thus far

Findings
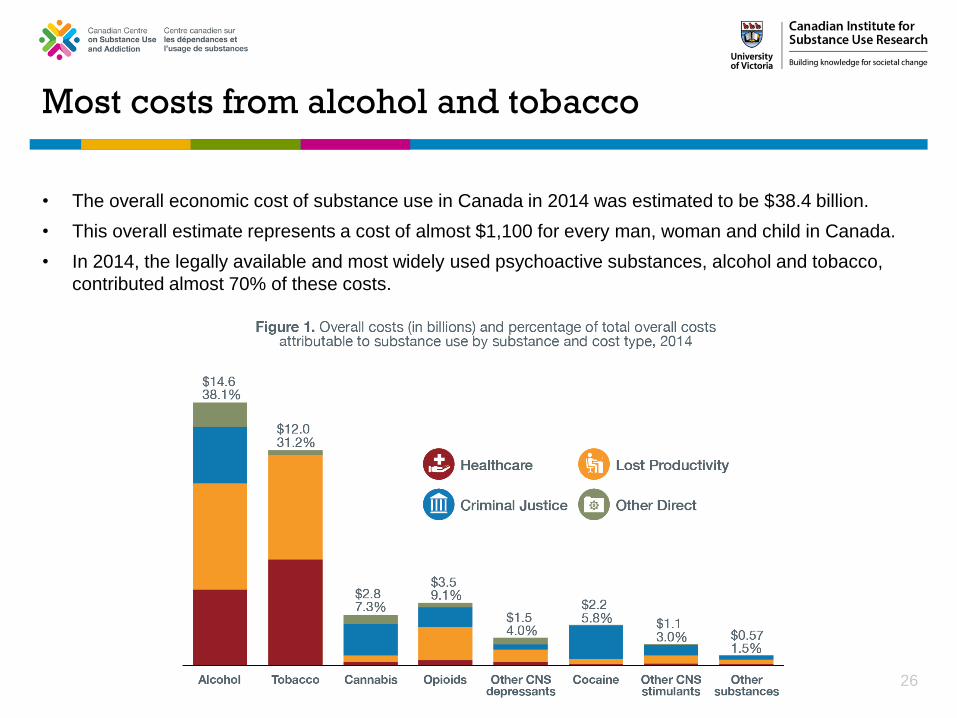
Most costs from alcohol and tobacco
26
• The overall economic cost of substance use in Canada in 2014 was estimated to be $38.4 billion.
• This overall estimate represents a cost of almost $1,100 for every man, woman and child in Canada.
• In 2014, the legally available and most widely used psychoactive substances, alcohol and tobacco,
contributed almost 70% of these costs.
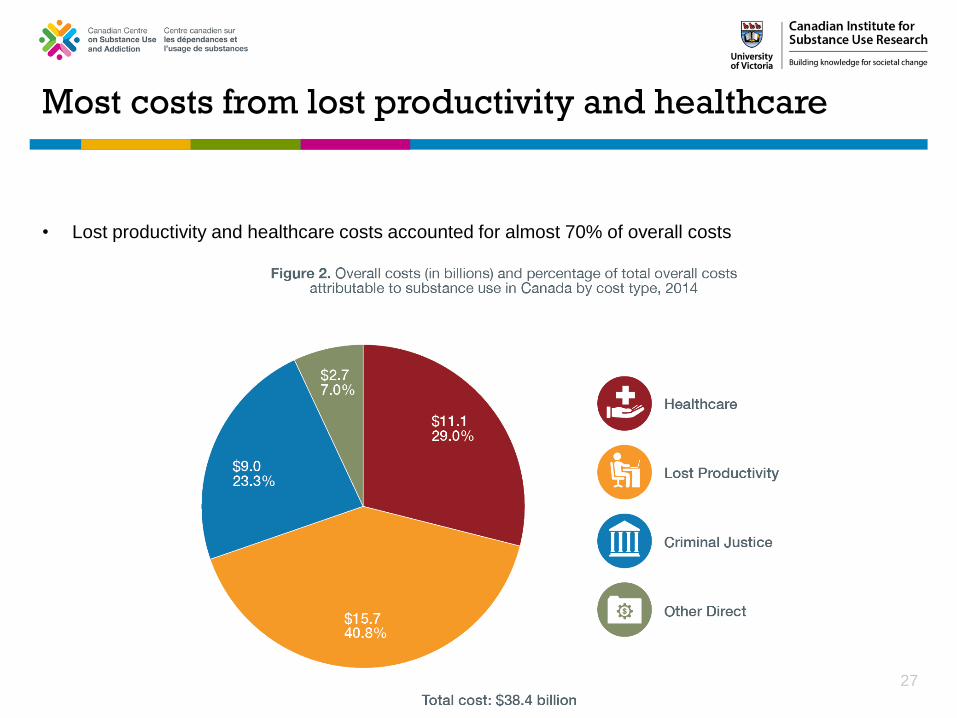
Most costs from lost productivity and healthcare
27
• Lost productivity and healthcare costs accounted for almost 70% of overall costs
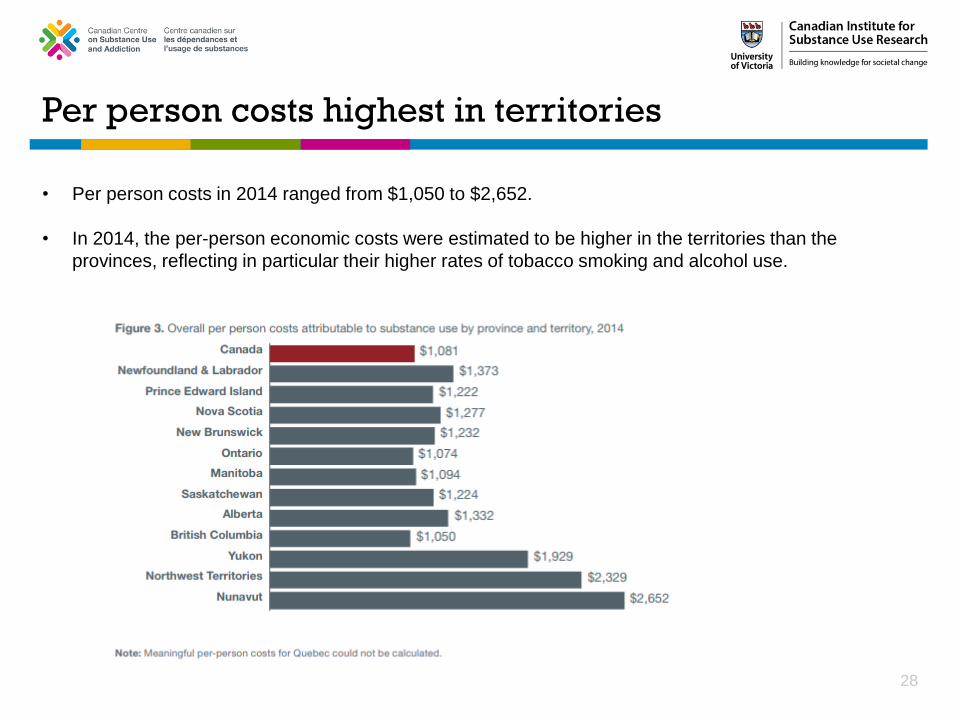
Per person costs highest in territories
28
• Per person costs in 2014 ranged from $1,050 to $2,652.
• In 2014, the per-person economic costs were estimated to be higher in the territories than the
provinces, reflecting in particular their higher rates of tobacco smoking and alcohol use.
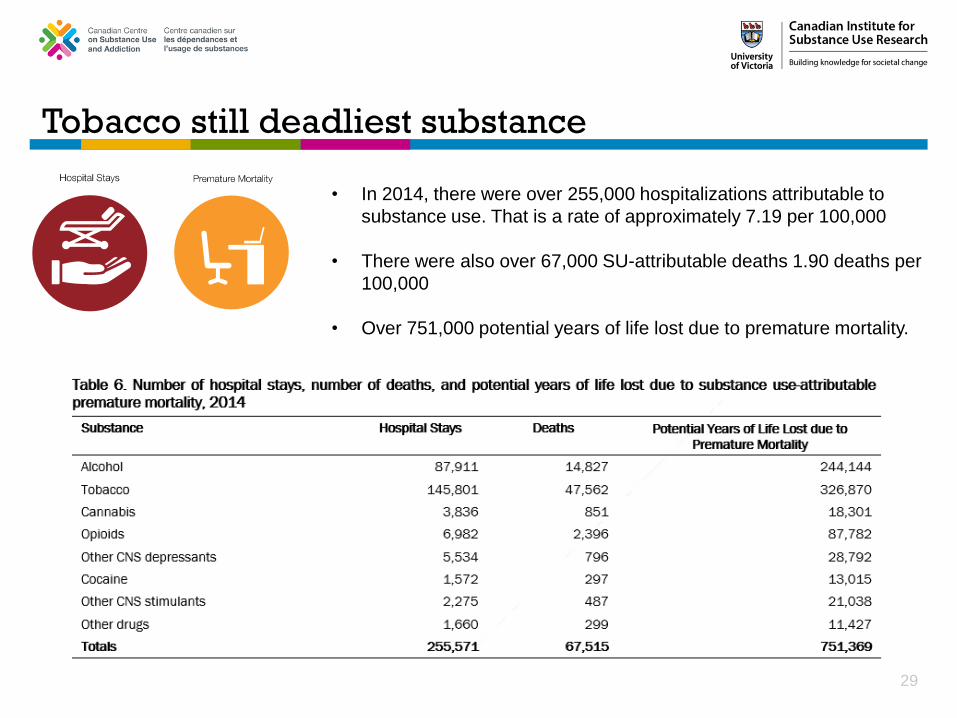
Tobacco still deadliest substance
29
• In 2014, there were over 255,000 hospitalizations attributable to
substance use. That is a rate of approximately 7.19 per 100,000
• There were also over 67,000 SU-attributable deaths 1.90 deaths per
100,000
• Over 751,000 potential years of life lost due to premature mortality.
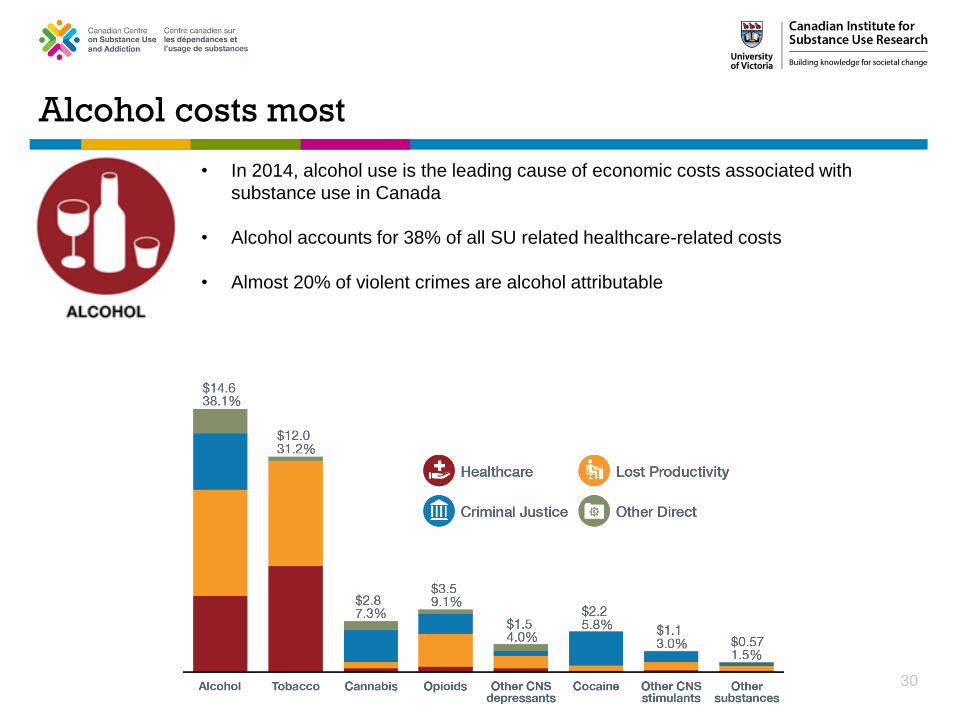
Alcohol costs most
30
• In 2014, alcohol use is the leading cause of economic costs associated with
substance use in Canada
• Alcohol accounts for 38% of all SU related healthcare-related costs
• Almost 20% of violent crimes are alcohol attributable
31
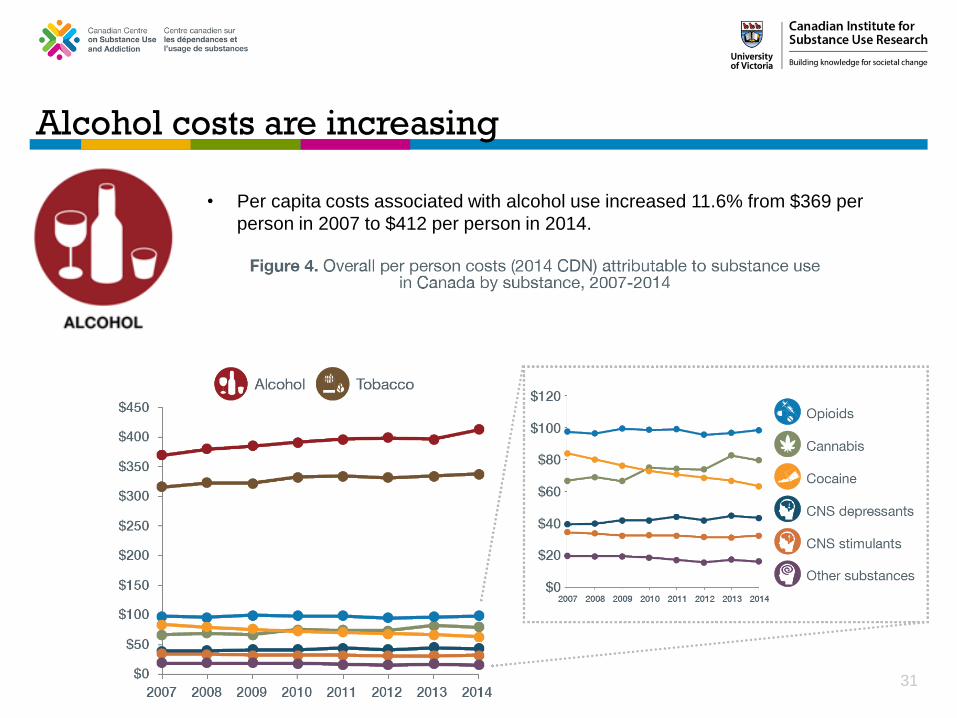
• Per capita costs associated with alcohol use increased 11.6% from $369 per
person in 2007 to $412 per person in 2014.
Alcohol costs are increasing
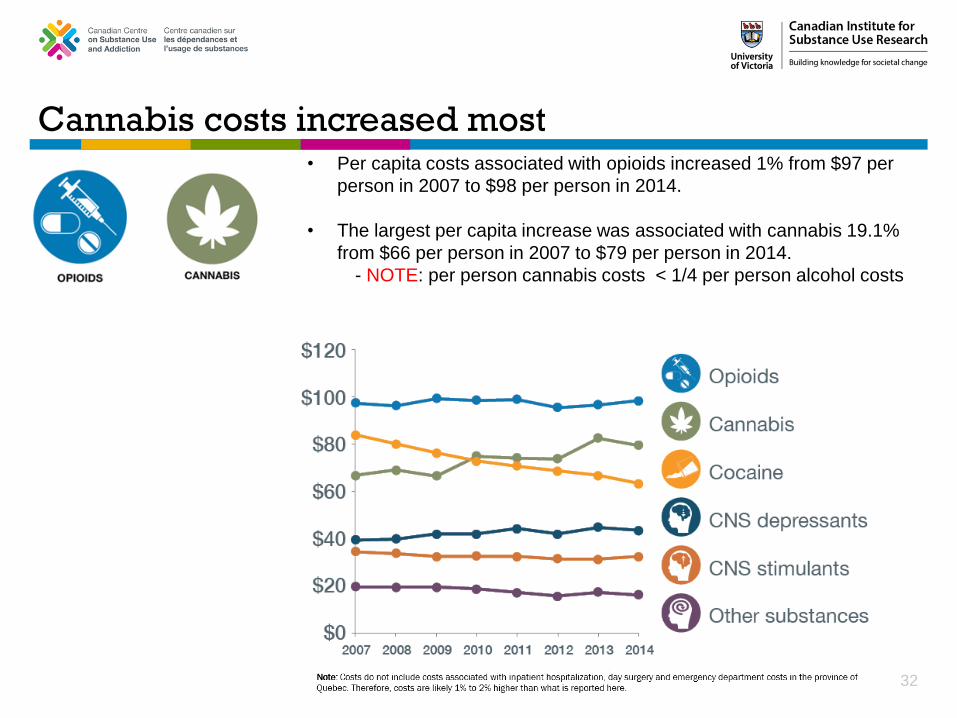
Cannabis costs increased most
32
• Per capita costs associated with opioids increased 1% from $97 per
person in 2007 to $98 per person in 2014.
• The largest per capita increase was associated with cannabis 19.1%
from $66 per person in 2007 to $79 per person in 2014.
- NOTE: per person cannabis costs < 1/4 per person alcohol costs
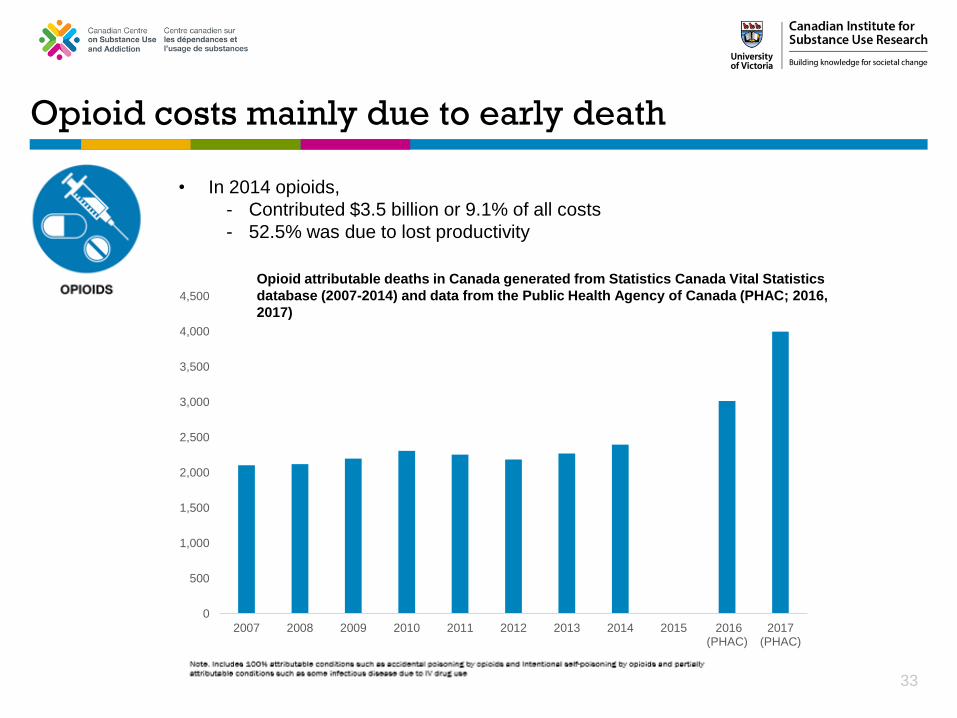
Opioid costs mainly due to early death
33
• In 2014 opioids,
- Contributed $3.5 billion or 9.1% of all costs
- 52.5% was due to lost productivity
0
500
1,000
1,500
2,000
2,500
3,000
3,500
4,000
4,500
2007 2008 2009 2010 2011 2012 2013 2014 2015 2016(PHAC)
2017(PHAC)
Opioid attributable deaths in Canada generated from Statistics Canada Vital Statistics
database (2007-2014) and data from the Public Health Agency of Canada (PHAC; 2016,
2017)

Online Data Visualization Tool
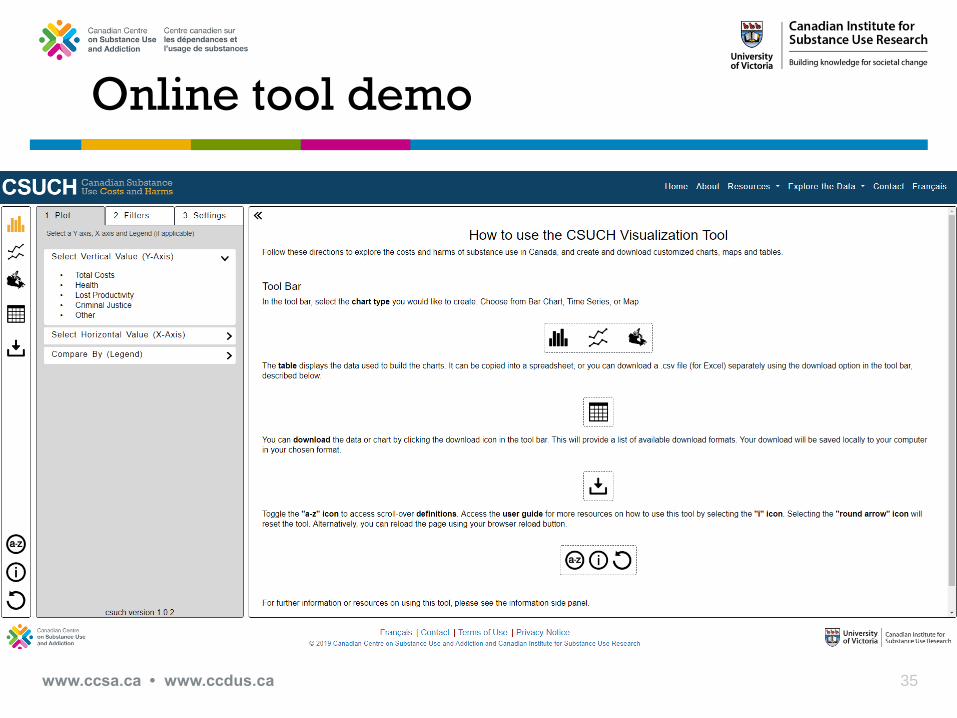
www.ccsa.ca • www.ccdus.ca 35
Online tool demo
1. What was the total cost of lost productivity in Ontario in 2014?
2. What was the unstandardized rate of day surgeries for alcohol in 2007?
3. In 2014, what was the cost of fire damage due tobacco in Ontario?
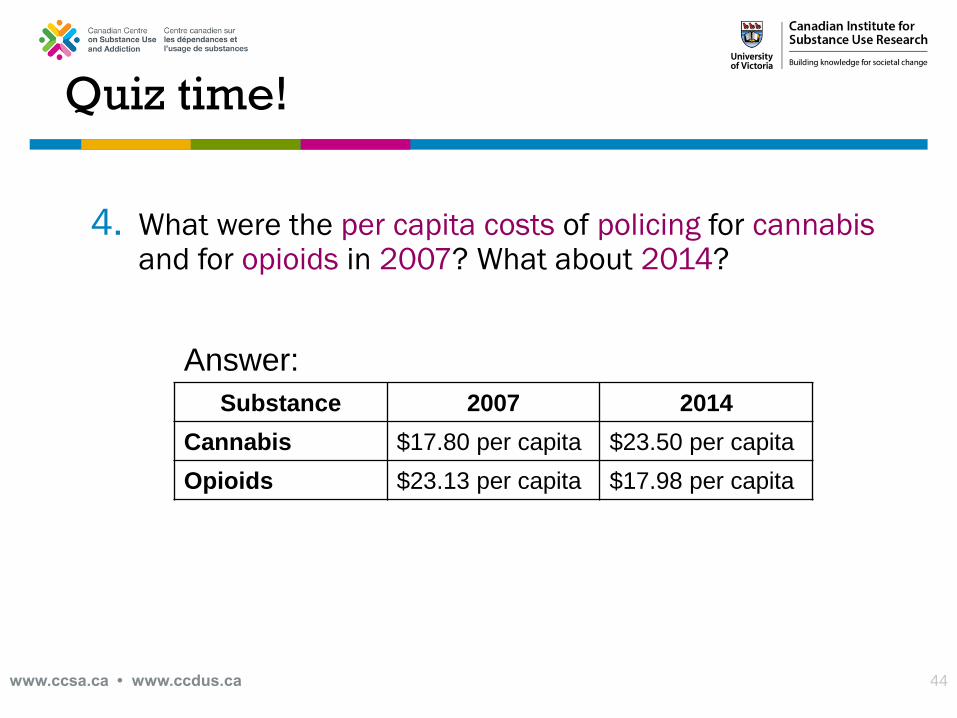
4. What were the per capita costs of policing for cannabis and for opioids in 2007? What about 2014?
5. In 2014, what was the number of inpatient hospitalizations for males aged 35-64 for cardiovascular conditions due to alcohol?
Quiz time!
www.ccsa.ca • www.ccdus.ca 36
1. What was the total cost of lost productivity in Ontarioin 2014?
Quiz time!
www.ccsa.ca • www.ccdus.ca 37
1. What was the total cost of lost productivity in Ontarioin 2014?
Quiz time!
www.ccsa.ca • www.ccdus.ca 38
Answer: $5.72 billion
2. What was the unstandardized rate of day surgeries for alcohol in 2007?
Quiz time!
www.ccsa.ca • www.ccdus.ca 39
2. What was the unstandardized rate of day surgeries for alcohol in 2007?
Quiz time!
www.ccsa.ca • www.ccdus.ca 40
Answer: 44.87 per 100,000
3. In 2014, what was the cost of fire damage due tobacco in Ontario?
Quiz time!
www.ccsa.ca • www.ccdus.ca 41
3. In 2014, what was the cost of fire damage due tobacco in Ontario?
Quiz time!
www.ccsa.ca • www.ccdus.ca 42
Answer: $56.57 million
4. What were the per capita costs of policing for cannabisand for opioids in 2007? What about 2014?
Quiz time!
www.ccsa.ca • www.ccdus.ca 43
4. What were the per capita costs of policing for cannabisand for opioids in 2007? What about 2014?
Quiz time!
www.ccsa.ca • www.ccdus.ca 44
Answer:
Substance 2007 2014
Cannabis $17.80 per capita $23.50 per capita
Opioids $23.13 per capita $17.98 per capita
5. In 2014, what was the number of inpatient hospitalizations for males aged 35-64 for cardiovascular conditions due to alcohol?
Quiz time!
www.ccsa.ca • www.ccdus.ca 45
5. In 2014, what was the number of inpatient hospitalizations for males aged 35-64 for cardiovascular conditions due to alcohol?
Quiz time!
www.ccsa.ca • www.ccdus.ca 46
Answer: 2,718.48
www.ccsa.ca • www.cclt.ca 47
• Can this tool be used in your work?
• What can we do to make the tool more user friendly
and valuable?
• Other feedback
Discussion and feedback
www.ccsa.ca • www.cclt.ca 48
• Submit your examples of using the tool to csuch.ca and
be part of a growing community of recognized data
experts
Be a champion!
www.ccsa.ca • www.ccdus.ca 49
CCSA’s Issues of Substance 2019
• CCSA’s Issues of Substance is Canada’s premier
conference for the substance use and addiction field
• Registration opens March 2019
• #CCSAConference
Evidence and Perspectives, Compassion and Action.

www.ccsa.ca • www.ccdus.ca 50
Questions and Comments
!?
Contact Information
www.ccsa.ca • www.ccdus.ca 51
Canadian Centre on Substance Use and Addiction
75 Albert Street, Suite 500
Ottawa, ON K1P 5E7
Canada
Research & Policy Analyst
613-235-4048 243
Bridget Hall, MPH
Associate Director of Research
613-235-4048 ext.253
Pamela Kent, PhD