ccus development pathway for the efw sector
TRANSCRIPT
CCUS Development Pathway for the EfW Sector
A Final Report for Viridor
Andrew Coulthurst
Leyla Lugal
Gabriella Franchi
Katharine Rowland
1st October 2021

Report for Viridor
Prepared by Andrew Coulthurst, Leyla Lugal, Gabriella Franchi and Katharine Rowland
Approved by
………………………………………………….
Sam Taylor
(Project Director)
Eunomia Research & Consulting Ltd 37 Queen Square Bristol BS1 4QS
United Kingdom
Tel: +44 (0)117 9172250 Fax: +44 (0)8717 142942
Web: www.eunomia.co.uk
Disclaimer
Eunomia Research & Consulting has taken due care in the preparation of this report to ensure that all facts and analysis presented are as accurate as possible within the scope of the project. However no guarantee is provided in respect of the information presented, and Eunomia Research & Consulting is not responsible for decisions or actions taken on the basis of the content of this report.

Version Control Table
Version Date Author Description
V1.0 17/09/21 As listed Draft final (sent to client)
V2.0 01/10/21 As listed Final (sent to client)

CCUS Development Pathway for the EfW Sector i
Executive Summary
The UK Energy from Waste (EfW) sector has rapidly evolved over the last fifteen years. In total, there are now 48 operational sites, with a further 16 under construction. In 2020 a total of just under 14 million tonnes of residual waste was processed in UK EfWs, up from 12.6 million tonnes in 2019.1 Broadly speaking, for every tonne of waste treated via EfW, one tonne of CO2 is emitted. In line with the UK's commitment to combat climate change, emissions from the waste sector will need to be reduced to net zero.
As the amount of residual waste going to landfill (and being exported) continues to fall, EfW will likely be the dominant technology, and with this, CO2 emissions associated with it will rise.
In light of the ongoing and increasing need for EfW, and the limitations on the ability to decarbonise residual waste feedstock, Carbon Capture Utilisation and Storage (CCUS) offers the only current viable solution to large-scale CO2 abatement of the UK EfW fleet.
Given the ongoing need for waste to be treated by EfW in the UK, this is not an industry that can realistically be 'offshored'. Furthermore, EfW facilities are built to last. This means that the UK’s relatively young EfW fleet is well placed to retrofit CCUS economically, in the sense that the technology will be attached to an asset for a significant time period.
There is recognition that in terms of practical reality, large CO2 emitters in close proximity to each other will likely form into a CCUS ‘cluster’ that can share transport and storage (T&S) solutions. This has the benefit of improving the resilience of the CO2 supply and providing significant economies of scale due to shared infrastructure.
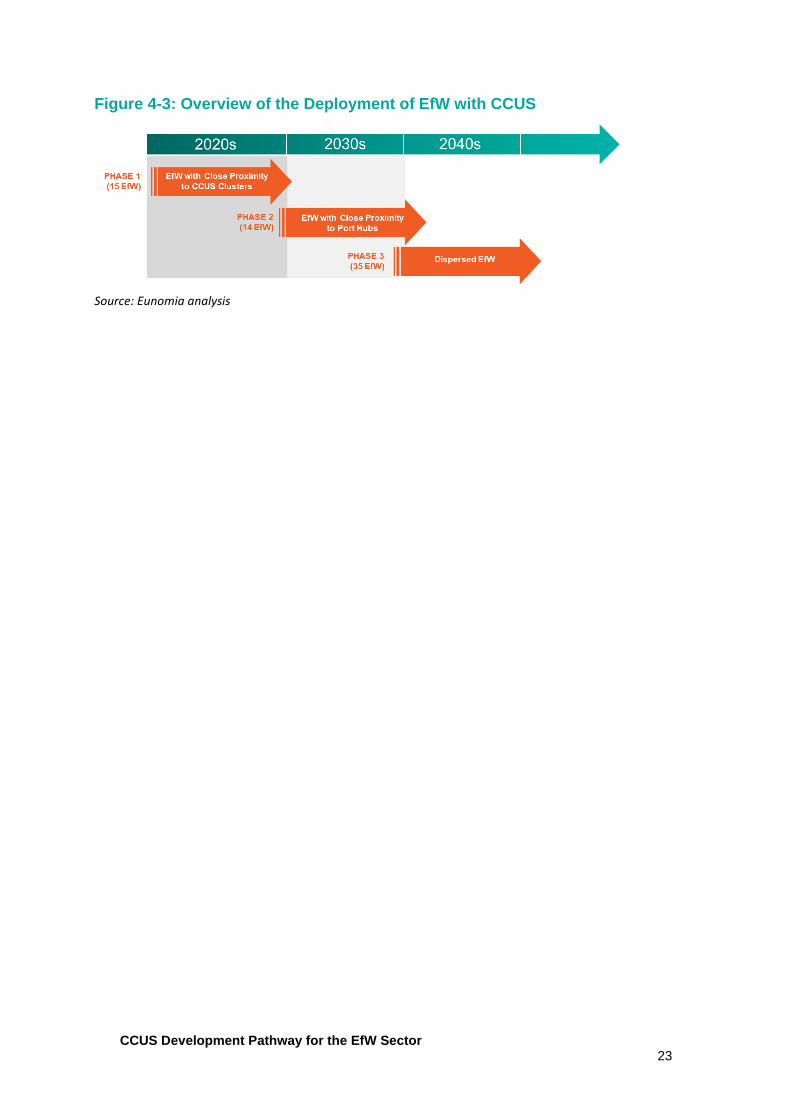
This report has identified 15 EfWs within close proximity of the leading five UK CCUS cluster projects. As such these facilities are likely to represent the first phase of EfW with CCUS in the UK, should these clusters be developed. A further 14 EfWs have been identified within close proximity of port hubs that have the potential to support a second phase of CCUS deployment. A third phase is likely to include all remaining EfWs where CCUS is deemed feasible. These three distinct phases and timings are summarised in Figure E 1-1.
1 Tolvik (2021) UK EfW Statistics 2020, Tolvik, https://www.tolvik.com/wp-content/uploads/2021/05/Tolvik-UK-EfW-Statistics-2020-Report_Published-May-2021.pdf
ii
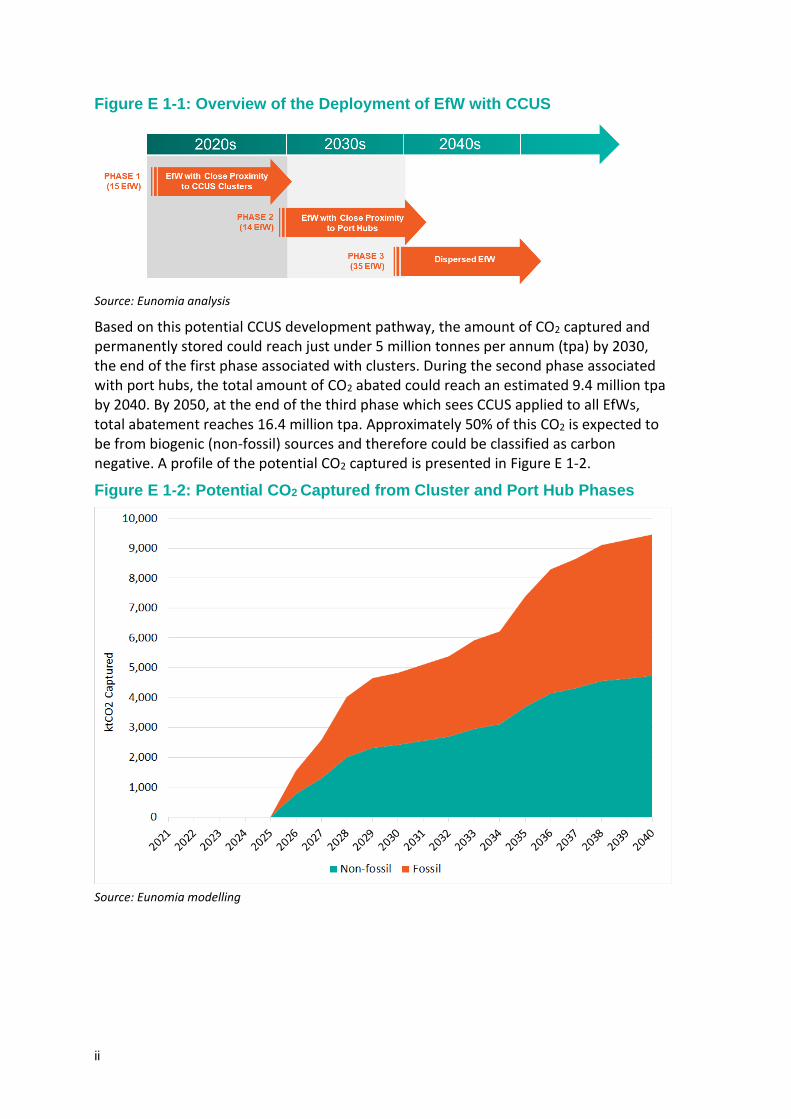
Figure E 1-1: Overview of the Deployment of EfW with CCUS
Source: Eunomia analysis
Based on this potential CCUS development pathway, the amount of CO2 captured and permanently stored could reach just under 5 million tonnes per annum (tpa) by 2030, the end of the first phase associated with clusters. During the second phase associated with port hubs, the total amount of CO2 abated could reach an estimated 9.4 million tpa by 2040. By 2050, at the end of the third phase which sees CCUS applied to all EfWs, total abatement reaches 16.4 million tpa. Approximately 50% of this CO2 is expected to be from biogenic (non-fossil) sources and therefore could be classified as carbon negative. A profile of the potential CO2 captured is presented in Figure E 1-2.
Figure E 1-2: Potential CO2 Captured from Cluster and Port Hub Phases
Source: Eunomia modelling
CCUS Development Pathway for the EfW Sector iii
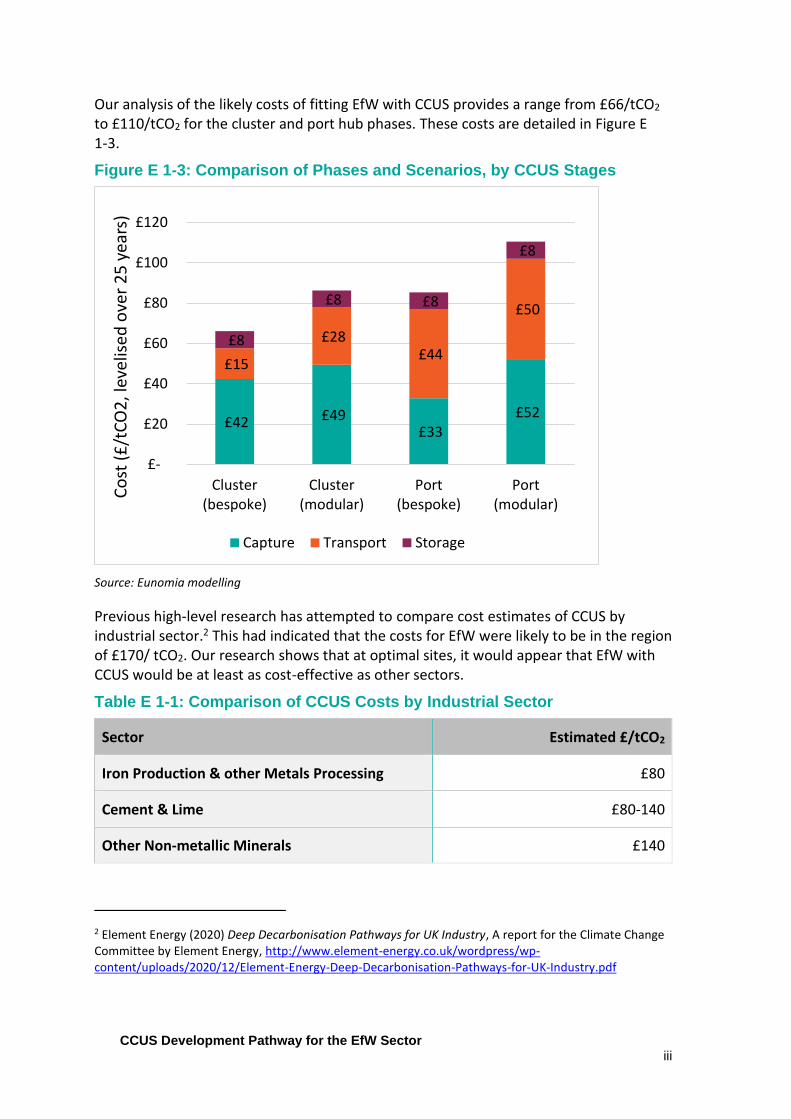
Our analysis of the likely costs of fitting EfW with CCUS provides a range from £66/tCO2 to £110/tCO2 for the cluster and port hub phases. These costs are detailed in Figure E 1-3.
Figure E 1-3: Comparison of Phases and Scenarios, by CCUS Stages
Source: Eunomia modelling
Previous high-level research has attempted to compare cost estimates of CCUS by industrial sector.2 This had indicated that the costs for EfW were likely to be in the region of £170/ tCO2. Our research shows that at optimal sites, it would appear that EfW with CCUS would be at least as cost-effective as other sectors.
Table E 1-1: Comparison of CCUS Costs by Industrial Sector
Sector Estimated £/tCO2
Iron Production & other Metals Processing £80
Cement & Lime £80-140
Other Non-metallic Minerals £140
2 Element Energy (2020) Deep Decarbonisation Pathways for UK Industry, A report for the Climate Change Committee by Element Energy, http://www.element-energy.co.uk/wordpress/wp-content/uploads/2020/12/Element-Energy-Deep-Decarbonisation-Pathways-for-UK-Industry.pdf
£42 £49 £33
£52
£15
£28 £44
£50
£8
£8 £8
£8
£-
£20
£40
£60
£80
£100
£120
Cluster(bespoke)
Cluster(modular)
Port(bespoke)
Port(modular)
Co
st (
£/t
CO
2, l
evel
ised
ove
r 2
5 y
ears
)
Capture Transport Storage

iv
Glass £100-150
Refining & Chemicals £140-200
EfW £170
Source: Adapted from Element Energy3
This report also shows that beyond costs, there are potentially significant benefits associated with EfW with CCUS. Most prominent of these is the prospect of negative emission reductions associated with the storage of biogenic CO2 which may amount to nearly 5 million tpa by 2040. These may have the potential to be monetised in the future, and therefore represent a significant opportunity for the EfW sector versus other sectors concerning the costs of CCUS.
3 Element Energy (2020) Deep Decarbonisation Pathways for UK Industry, A report for the Climate Change Committee by Element Energy, http://www.element-energy.co.uk/wordpress/wp-content/uploads/2020/12/Element-Energy-Deep-Decarbonisation-Pathways-for-UK-Industry.pdf
CCUS Development Pathway for the EfW Sector v
Contents
1.0 Background and Introduction ................................................................................ 1
2.0 The UK Energy from Waste Sector ......................................................................... 3
3.0 CCUS in the UK ...................................................................................................... 6
3.1 What is CCUS? .......................................................................................................... 6
3.1.1 Carbon Capture ................................................................................................ 7
3.1.2 Transport .......................................................................................................... 7
3.1.3 Storage ............................................................................................................. 8
3.1.4 Utilisation ......................................................................................................... 8
3.2 CCUS Case Studies .................................................................................................... 9
3.3 UK Policy for CCUS .................................................................................................. 12
3.4 Development of a UK CCUS Market ....................................................................... 13
3.4.1 Current CCUS Programme .............................................................................. 13
4.0 Potential Development Pathway for EfW with CCUS in the UK .............................. 17
4.1 EfWs Likely to Install Carbon Capture .................................................................... 17
4.2 Phasing of EfW CCUS Development ....................................................................... 17
4.2.1 First Phase (2026-2030): EfW in Close Proximity to CCUS Clusters ................ 18
4.2.2 Second Phase (2031-2040): EfWs with Close Proximity to Port Hubs ............ 20
4.2.3 Third Phase (2040-2050): Remaining Dispersed EfWs ................................... 22
4.3 Summary of Development ..................................................................................... 22
5.0 Potential CO2 Abatement ...................................................................................... 24
6.0 Estimated Costs of EfW with CCUS ........................................................................ 28
6.1 Overview of Approach ............................................................................................ 28
6.1.1 Capture ........................................................................................................... 29
6.1.2 Transport ........................................................................................................ 29
6.1.3 Storage ........................................................................................................... 30
6.1.4 Utilisation ....................................................................................................... 30
6.2 First Phase: The Cluster Phase ............................................................................... 30
6.3 Second Phase: The Ports Phase .............................................................................. 33
6.4 Summary of Costs ................................................................................................... 36

vi
6.4.1 Limitations ...................................................................................................... 38
6.5 Comparison of Costs to Other Sectors ................................................................... 38
7.0 Further Benefits of EfW with CCUS ....................................................................... 40
7.1 Negative Emissions ................................................................................................. 40
7.2 Potential Improvements to Air Quality .................................................................. 41
7.3 Employment Opportunities .................................................................................... 41
8.0 Conclusions .......................................................................................................... 44
A.1.0 Key Assumptions ............................................................................................ 47
CCUS Development Pathway for the EfW Sector 1
1.0 Background and Introduction
In June 2019, the UK government signed into law a commitment to achieve net zero greenhouse gas emissions by 2050. This legal requirement replaced the previous target to reduce emissions by 80% compared to a 1990 baseline. It was recommended by the Climate Change Committee (CCC), in response to developments in climate science communicated through the work of the Intergovernmental Panel on Climate Change. In making the change, the UK became the first major economy to pass net zero emissions into law.4
The EfW sector has been somewhat overlooked in terms of its applicability for carbon capture, utilisation and storage (CCUS). For example, a Department for Business, Energy & Industrial Strategy (BEIS) study completed in August 2020 looked at industrial sectors including glass, chemical, cement, iron and steel, lime, refining, and processing and distribution of natural gas, deeming these:
"as most suited for CCS".5
There is substantial evidence that demonstrates that EfW is well suited to CCUS, not least that there are three EfW facilities in Europe incorporating CCUS at a significant scale.6 In light of the above backdrop, it is critical that the waste sector remains engaged in the CCUS deployment debate to ensure as early adoption of the technology as possible. This report aims to fulfil this objective by providing an independent assessment of the likely costs associated with EfW CCUS in the UK, and a high-level comparison of the costs to other industrial sectors. Consideration is also be given to how the deployment of EfW CCUS might develop over time, and the potential associated CO2
abated.
The report is structured as follows:
• Section 2.0: The UK EfW Sector. High-level summary of the UK EfW sector.
• Section 3.0: CCUS in the UK. Overview of CCUS and associated policies.
• Section 4.0: Potential Development Pathway for EfW with CCUS in the UK. Assessment of the potential deployment of CCUS on EfW.
• Section 5.0: Potential CO2 Abatement. In line with the potential development pathway, an assessment of the amount of CO2 that could be captured and permanently stored.
4 UK Government (2019) UK becomes first major economy to pass net zero emissions law, UK Government, https://www.gov.uk/government/news/uk-becomes-first-major-economy-to-pass-net-zero-emissions-law 5 BEIS (2020) CCS deployment at dispersed industrial sites, A report by Element Energy for the Department for Business, Energy & Industrial Strategy, https://assets.publishing.service.gov.uk/government/uploads/system/uploads/attachment_data/file/929282/BEIS_-_CCUS_at_dispersed_sites_-_Report__1_.pdf 6 AVR Duiven and Twence Hengelo in the Netherlands, and Fortum Oslo Varne in Norway

2
• Section 7.0: Estimated Costs of EfW with CCUS. Evaluation of the likely costs associated with the deployment of CCUS on EfW.
• Section 8.0: Further Benefits of EfW with CCUS. Additional potential benefits associated with EfWs installing CCUS.
• Section 8.0: Conclusions.

CCUS Development Pathway for the EfW Sector 3
2.0 The UK Energy from Waste Sector
Within the Energy from Waste (EfW) sector, incineration represents the most significant proportion of the waste thermal treatment market. From a technological and economic perspective, the development of CCUS is therefore expected to focus initially on incineration facilities. Incineration technology is also relatively consistent, making replication across facilities easier than it might be for more complex EfW facilities, such as gasification and pyrolysis. For the purpose of this report, where the term EfW is used, this is in fact referring to incineration facilities only.
The development of the EfW sector in the UK has been rapidly evolving and has been transformed in recent years. Of the 48 operational EfW facilities, 29 have become operational since 2010.7
Established by the UK government in 2006, the Waste Infrastructure Delivery Programme (WIDP) sought to accelerate residual waste treatment infrastructure delivery, such as EfW facilities. This was imperative at the time to meet strict landfill diversion targets and to offer support to councils. Approximately 24 local authority-led waste management projects (largely EfW schemes) were developed under the Public Finance Initiative (PFI). Supported by the landfill tax escalator, which makes landfill the most expensive form of residual waste treatment, the UK has moved away from PFI and towards a merchant model of delivery (i.e. not procured by any governmental authority). This evolution has led to a diverse set of EfW infrastructure and owners.
As shown in Figure 2-1, there are currently 48 operational sites, with a further 16 under construction. The sites are located throughout the UK, but typically close to population centres as to minimise the transportation of waste. In 2020 a total of just under 14 million tonnes of residual waste was processed in UK EfWs, up from 12.6 million tonnes in 2019.8
EfW facilities are underpinned by long-term waste contracts, typically 20 years, which means that those that operate them can take an enduring view on investment. This is a key advantage, with respect to CCUS deployment, over many other industrial sectors, which generally have a shorter horizon when considering return on investment.
Given the ongoing need for waste to be treated by EfW in the UK, this is not an industry that can realistically be 'offshored'. Furthermore, EfW facilities are built to last. The Edmonton EfW became operational in 1974 and is not due to be replaced until 2025. This means that the UK’s relatively young EfW fleet is well placed to operate CCUS equipment over a long duration.
7 Eunomia EfW database 8 Tolvik (2021) UK EfW Statistics 2020, Tolvik, https://www.tolvik.com/wp-content/uploads/2021/05/Tolvik-UK-EfW-Statistics-2020-Report_Published-May-2021.pdf

4
Waste sector emissions accounted for 6% (32.9 million tonnes CO2) of UK GHG emissions in 2018 and were 63% below 1990 levels.9 EfW facilities were responsible for approximately 5 million tonnes CO2 in 2018. However, these figures exclude the biogenic carbon associated with EfW facilities (in line with international reporting). In total, it is estimated that EfW facilities in the UK currently emit around 11 million tonnes CO2 per year.10
Recent years have seen an increase in EfW related emissions due to more residual waste diverted from landfills into new EfW facilities. However, landfill remains the largest contributor to waste sector emissions at just under 60%.11
EfW is forecast to play an increasingly important role in UK residual waste management. Whilst recycling and waste prevention levels are likely to rise, there will be a need for treatment capacity for residual waste in the foreseeable future. As the amount of residual waste going to landfill (and being exported) continues to fall, EfW will likely be the dominant technology, and with this, CO2 emissions associated with it will rise. This is acknowledged in recent modelling undertaken for the government, which states that EfW:
"…is a rare sector where emissions grow from 2020 to 2050 even when accounting for resource and energy efficiencies."12
In light of the ongoing and increasing need for EfW, and the limitations on the ability to decarbonise residual waste feedstock, CCUS offers the only current viable solution to large-scale CO2 abatement of the UK EfW fleet. This is acknowledged by BEIS, who are increasingly aware of the role EfW could play in relation to CCUS:
“Deployment of CCUS at EfW facilities is essential for meeting the net zero and the deep decarbonisation of industry and critical assets.”13
9 Climate Change Committee (2020) The Sixth Carbon Budget – Waste, Climate Change Committee report for UK Government https://www.theccc.org.uk/wp-content/uploads/2020/12/Sector-summary-Waste.pdf 10 Energy Systems Catapult (2020) Energy from Waste Plants UK with Carbon Capture, Energy Systems Catapult, https://es.catapult.org.uk/reports/energy-from-waste-plants-with-carbon-capture/ 11 Climate Change Committee (2020) The Sixth Carbon Budget, Climate Change Committee report for UK Government, https://www.theccc.org.uk/publication/sixth-carbon-budget/ 12 Element Energy (2020) Deep Decarbonisation Pathways for UK Industry, A report for the Climate Change Committee by Element Energy, http://www.element-energy.co.uk/wordpress/wp-content/uploads/2020/12/Element-Energy-Deep-Decarbonisation-Pathways-for-UK-Industry.pdf 13 Department for Business, Energy & Industrial Strategy (2021) Carbon Capture, Usage and Storage, An update on the business model for Industrial Carbon Capture, https://assets.publishing.service.gov.uk/government/uploads/system/uploads/attachment_data/file/984119/industrial-carbon-capture-icc.pdf

CCUS Development Pathway for the EfW Sector 5
Figure 2-1: UK EfW (Incinerator) Fleet by Capacity and Status
Source: Eunomia EfW Database
6
3.0 CCUS in the UK
In the following sub-sections, the CCUS process is briefly described, along with the current UK policy for CCUS, and the development of a CCUS market in the UK.
3.1 What is CCUS?
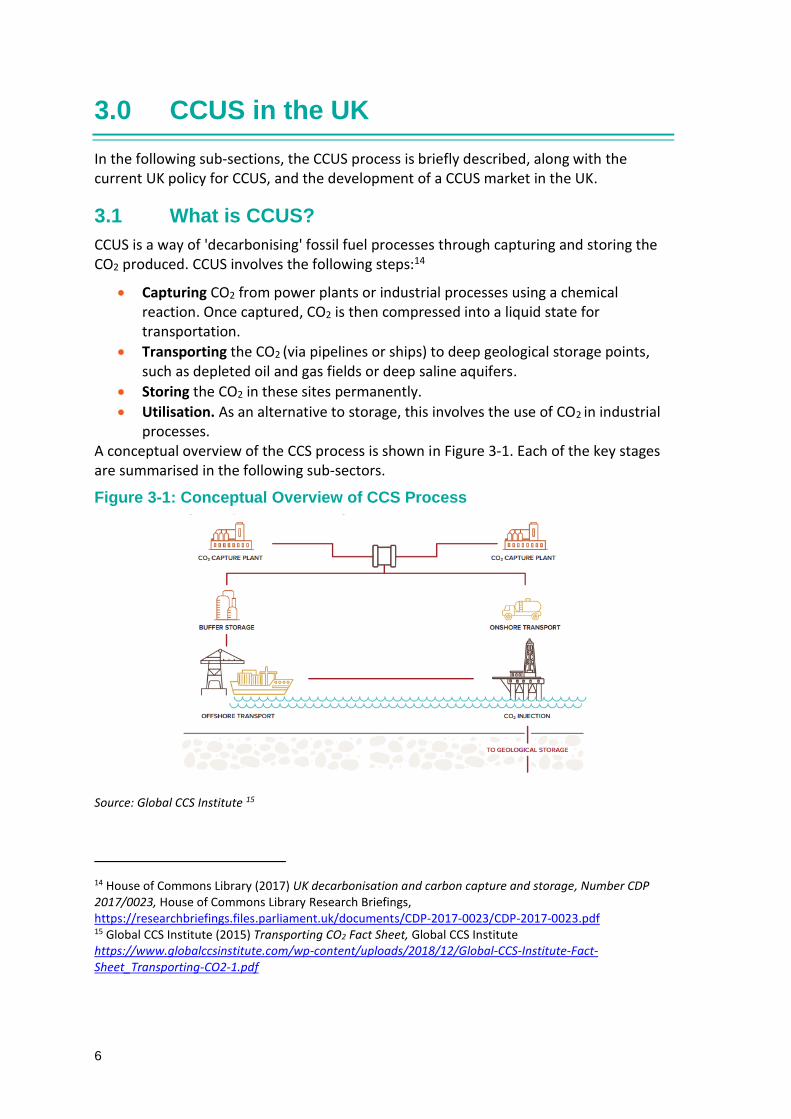
CCUS is a way of 'decarbonising' fossil fuel processes through capturing and storing the CO2 produced. CCUS involves the following steps:14
• Capturing CO2 from power plants or industrial processes using a chemical reaction. Once captured, CO2 is then compressed into a liquid state for transportation.
• Transporting the CO2 (via pipelines or ships) to deep geological storage points, such as depleted oil and gas fields or deep saline aquifers.
• Storing the CO2 in these sites permanently.
• Utilisation. As an alternative to storage, this involves the use of CO2 in industrial
processes. A conceptual overview of the CCS process is shown in Figure 3-1. Each of the key stages are summarised in the following sub-sectors.
Figure 3-1: Conceptual Overview of CCS Process
Source: Global CCS Institute 15
14 House of Commons Library (2017) UK decarbonisation and carbon capture and storage, Number CDP 2017/0023, House of Commons Library Research Briefings, https://researchbriefings.files.parliament.uk/documents/CDP-2017-0023/CDP-2017-0023.pdf 15 Global CCS Institute (2015) Transporting CO2 Fact Sheet, Global CCS Institute https://www.globalccsinstitute.com/wp-content/uploads/2018/12/Global-CCS-Institute-Fact-Sheet_Transporting-CO2-1.pdf
CCUS Development Pathway for the EfW Sector 7
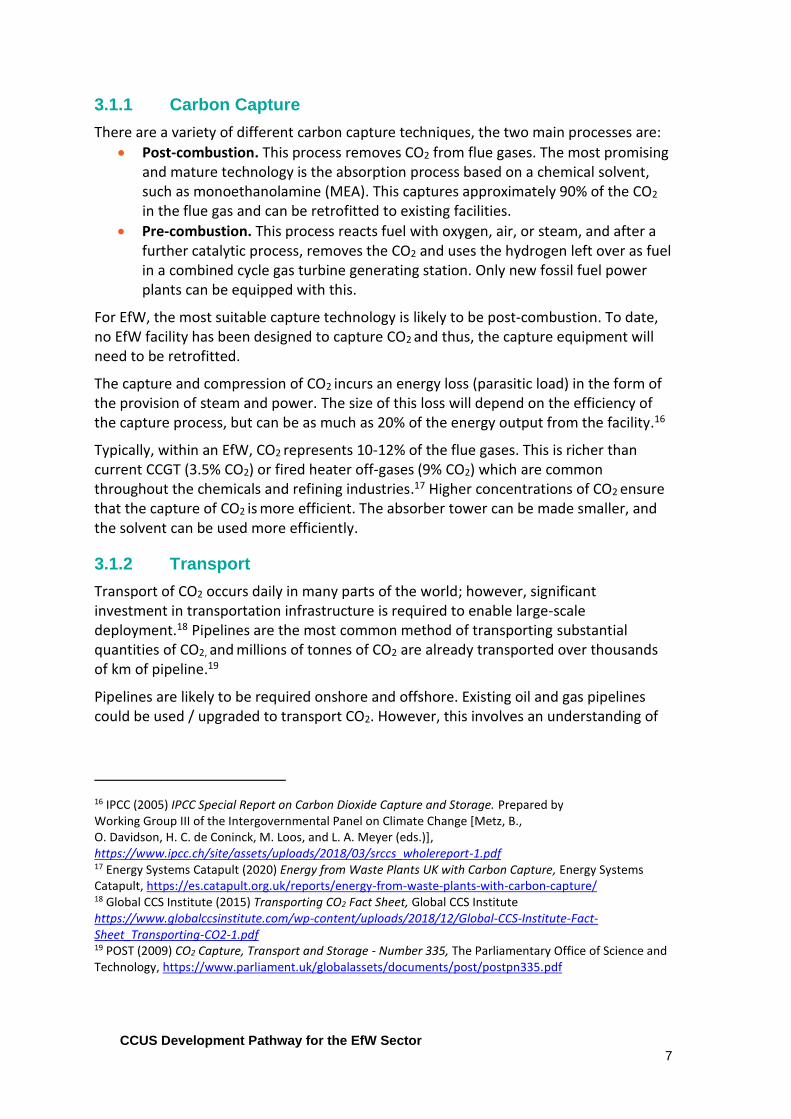
3.1.1 Carbon Capture
There are a variety of different carbon capture techniques, the two main processes are:
• Post-combustion. This process removes CO2 from flue gases. The most promising and mature technology is the absorption process based on a chemical solvent, such as monoethanolamine (MEA). This captures approximately 90% of the CO2 in the flue gas and can be retrofitted to existing facilities.
• Pre-combustion. This process reacts fuel with oxygen, air, or steam, and after a further catalytic process, removes the CO2 and uses the hydrogen left over as fuel in a combined cycle gas turbine generating station. Only new fossil fuel power plants can be equipped with this.
For EfW, the most suitable capture technology is likely to be post-combustion. To date, no EfW facility has been designed to capture CO2
and thus, the capture equipment will need to be retrofitted.
The capture and compression of CO2 incurs an energy loss (parasitic load) in the form of
the provision of steam and power. The size of this loss will depend on the efficiency of the capture process, but can be as much as 20% of the energy output from the facility.16
Typically, within an EfW, CO2 represents 10-12% of the flue gases. This is richer than current CCGT (3.5% CO2) or fired heater off-gases (9% CO2) which are common throughout the chemicals and refining industries.17 Higher concentrations of CO2 ensure that the capture of CO2 is more efficient. The absorber tower can be made smaller, and the solvent can be used more efficiently.
3.1.2 Transport
Transport of CO2 occurs daily in many parts of the world; however, significant investment in transportation infrastructure is required to enable large-scale deployment.18 Pipelines are the most common method of transporting substantial quantities of CO2, and millions of tonnes of CO2 are already transported over thousands of km of pipeline.19
Pipelines are likely to be required onshore and offshore. Existing oil and gas pipelines could be used / upgraded to transport CO2. However, this involves an understanding of
16 IPCC (2005) IPCC Special Report on Carbon Dioxide Capture and Storage. Prepared by Working Group III of the Intergovernmental Panel on Climate Change [Metz, B., O. Davidson, H. C. de Coninck, M. Loos, and L. A. Meyer (eds.)], https://www.ipcc.ch/site/assets/uploads/2018/03/srccs_wholereport-1.pdf 17 Energy Systems Catapult (2020) Energy from Waste Plants UK with Carbon Capture, Energy Systems Catapult, https://es.catapult.org.uk/reports/energy-from-waste-plants-with-carbon-capture/ 18 Global CCS Institute (2015) Transporting CO2 Fact Sheet, Global CCS Institute https://www.globalccsinstitute.com/wp-content/uploads/2018/12/Global-CCS-Institute-Fact-Sheet_Transporting-CO2-1.pdf 19 POST (2009) CO2 Capture, Transport and Storage - Number 335, The Parliamentary Office of Science and Technology, https://www.parliament.uk/globalassets/documents/post/postpn335.pdf
8
the extent to which existing pipelines are no longer required for their original purpose, as well as analysis of the costs of pipeline decommissioning versus reuse.
CO2 can also be transported via specialised ships, from ports to ports (to be later
transported in pipelines), or from ports to offshore storage sites directly. Shipping of CO2 presents the opportunity to link to CO2 clusters (described later in Section 3.4.1.1). It also represents a more flexible approach than pipeline transport.
Shipment of CO2 already takes place on a small scale in Europe, where ships transport food-quality CO2 (around 1,000 tonnes) from large point sources to coastal distribution terminals.20 For CCUS larger scale shipment of CO2, with capacities of 10,000 to 40,000 cubic metres, is likely to be required. CO2 shipping is expected to have much in common with the shipment of liquefied petroleum gas (LPG).
3.1.3 Storage
Once CO2 has been captured and transported, it needs to be stored safely and permanently. Geological storage involves injecting CO2 underground at depths of around 800m or more. At such depths, the CO2 will be held at many times atmospheric pressure and temperature. Storage options include depleted oil and gas reservoirs or deep saline aquifers (an underground layer of saltwater bearing permeable rock).21 These geological features have successfully trapped liquids and gases for millennia.
The UK is blessed with one of the best CO2 storage potentials of any country in the world. It is estimated that the UK continental shelf could safely store 78 billion tonnes of CO2, equivalent to 200 years of the UK's annual emissions.22
Given the maturity of the UK’s oil and gas industry, this storage potential is well characterised. In recent years substantial work has been undertaken to understand this storage potential in direct relation to CCUS.
3.1.4 Utilisation
CO2 can be utilised in a broad range of applications and has been deployed in the UK for several decades. For example, CO2 is widely applied in the food and drink sector, primarily in beverage carbonation, and to a lesser extent in food freezing, chilling and packing applications. The fertiliser industry is also a significant user of CO2, though the industry captures the CO2 emitted during ammonia production and reuses it during the
20 Global CCS Institute (2015) Transporting CO2 Fact Sheet, Global CCS Institute https://www.globalccsinstitute.com/wp-content/uploads/2018/12/Global-CCS-Institute-Fact-Sheet_Transporting-CO2-1.pdf 21 POST (2009) CO2 Capture, Transport and Storage - Number 335, The Parliamentary Office of Science and Technology, https://www.parliament.uk/globalassets/documents/post/postpn335.pdf 22 BEIS (2021) A Government Response on potential business models for Carbon Capture, Usage and Storage, Department for Business, Energy & Industrial Strategy, https://assets.publishing.service.gov.uk/government/uploads/system/uploads/attachment_data/file/909706/CCUS-government-response-business-models.pdf
CCUS Development Pathway for the EfW Sector 9
urea production process.23 As such the industry is unlikely to require additional CO2
volumes from elsewhere.
More recently, Carbon8 has begun operating two plants that treat industrial waste and contaminated soils using waste CO2 from bioethanol and fertiliser production. The product is an aggregate substitute, which is sold to breeze block manufacturers.
It is important to recognise that CO2 used is not the same as CO2 avoided, as the use does not necessarily reduce emissions. CO2 utilisation can provide climate benefits where the application is scalable, uses low-carbon energy, and displaces a product with higher lifecycle emissions. CO2 derived products that involve permanent carbon retention, such as building materials, can offer larger emissions reductions than products that ultimately release CO2 to the atmosphere, such as fuels and chemicals.
It is estimated that the total size of the UK market in 2016 was in the range of 400-500kt CO2.24 Whilst this market is growing incrementally, given the amount of CO2 being produced in the UK, large scale demand can be considered saturated.
The future market potential for CO2 derived products and services is difficult to assess. In contrast to existing uses of CO2, most of which involve direct use, emerging trends focus on indirect uses involving conversion into other molecules.
The production of CO2 based fuels and chemicals is energy-intensive and requires large amounts of hydrogen. The carbon in CO2 enables the conversion of hydrogen into a fuel that is easier to handle and use, for example, as aviation fuel.
Such emerging markets are challenging to predict as there is currently limited information on the carbon abatement potential for candidate CCU technologies. In addition, there is no formally agreed lifecycle assessment methodology with which calculations should be performed. Furthermore, emission reductions achieved by utilising and storing CO2 in products are often not accounted for in many emission reduction policies, such as the UK Emissions Trading Scheme (UK ETS).
3.2 CCUS Case Studies
To give a sense of the stage of development of pioneering projects involving CCUS on EfW facilities, two European case studies are provided as follows.
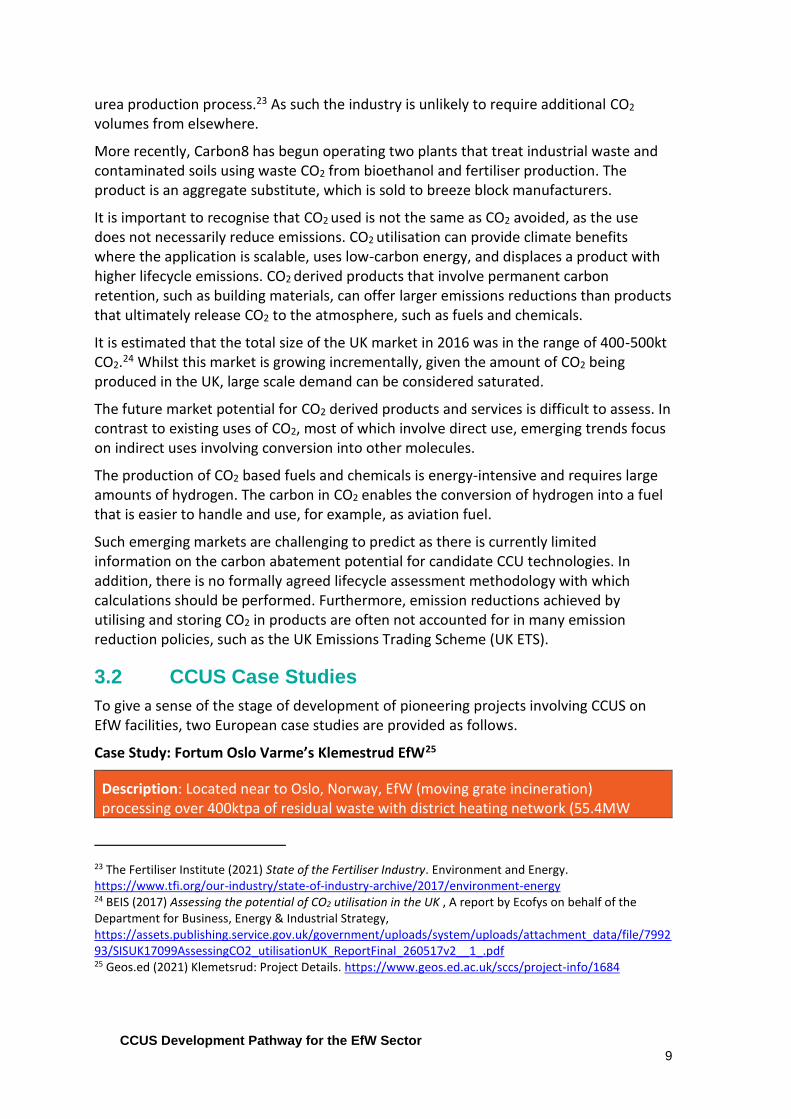
Case Study: Fortum Oslo Varme’s Klemestrud EfW25
Description: Located near to Oslo, Norway, EfW (moving grate incineration) processing over 400ktpa of residual waste with district heating network (55.4MW
23 The Fertiliser Institute (2021) State of the Fertiliser Industry. Environment and Energy. https://www.tfi.org/our-industry/state-of-industry-archive/2017/environment-energy 24 BEIS (2017) Assessing the potential of CO2 utilisation in the UK , A report by Ecofys on behalf of the Department for Business, Energy & Industrial Strategy, https://assets.publishing.service.gov.uk/government/uploads/system/uploads/attachment_data/file/799293/SISUK17099AssessingCO2_utilisationUK_ReportFinal_260517v2__1_.pdf 25 Geos.ed (2021) Klemetsrud: Project Details. https://www.geos.ed.ac.uk/sccs/project-info/1684
10
thermal, 10.5MW electric). The facility currently represents 15% of Oslo’s carbon emissions (largest single source contribution).
Klemestrud is part of the Norwegian Longship Project, the Norwegian Government’s fully funded, full-scale, first ever cross-border, open-source CO2 T&S infrastructure network.
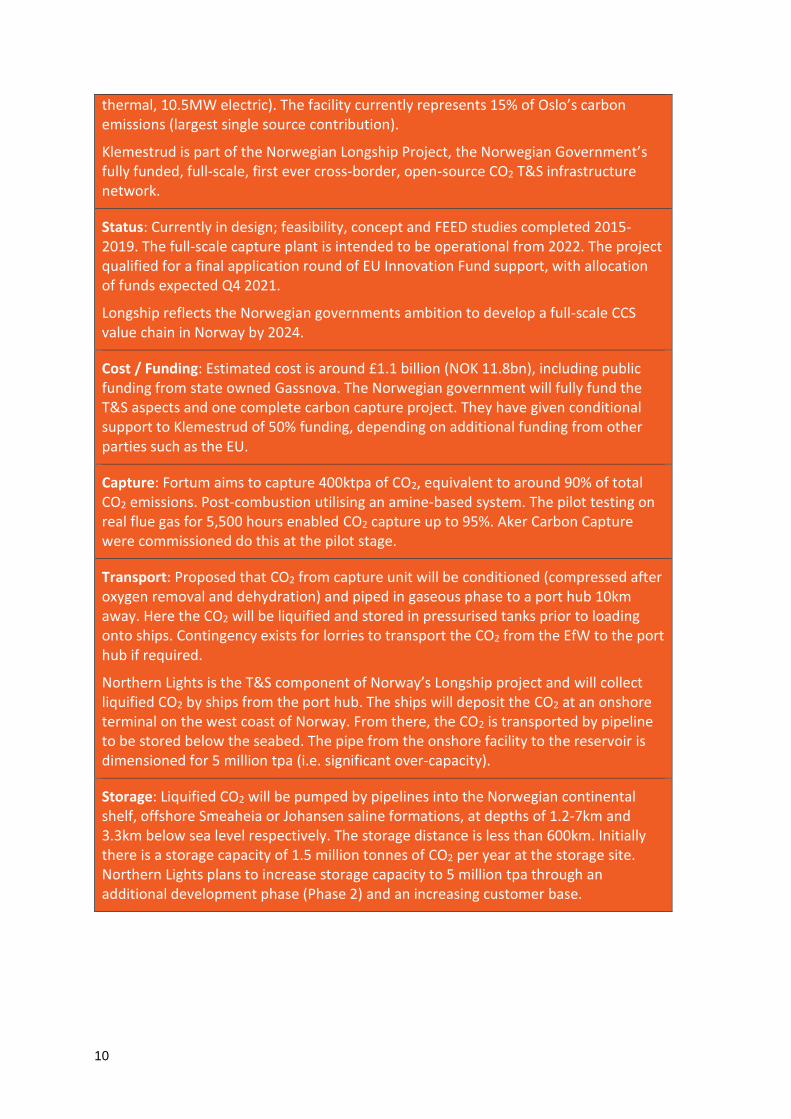
Status: Currently in design; feasibility, concept and FEED studies completed 2015-2019. The full-scale capture plant is intended to be operational from 2022. The project qualified for a final application round of EU Innovation Fund support, with allocation of funds expected Q4 2021.
Longship reflects the Norwegian governments ambition to develop a full-scale CCS value chain in Norway by 2024.
Cost / Funding: Estimated cost is around £1.1 billion (NOK 11.8bn), including public funding from state owned Gassnova. The Norwegian government will fully fund the T&S aspects and one complete carbon capture project. They have given conditional support to Klemestrud of 50% funding, depending on additional funding from other parties such as the EU.
Capture: Fortum aims to capture 400ktpa of CO2, equivalent to around 90% of total CO2 emissions. Post-combustion utilising an amine-based system. The pilot testing on real flue gas for 5,500 hours enabled CO2 capture up to 95%. Aker Carbon Capture were commissioned do this at the pilot stage.
Transport: Proposed that CO2 from capture unit will be conditioned (compressed after oxygen removal and dehydration) and piped in gaseous phase to a port hub 10km away. Here the CO2 will be liquified and stored in pressurised tanks prior to loading onto ships. Contingency exists for lorries to transport the CO2 from the EfW to the port hub if required.
Northern Lights is the T&S component of Norway’s Longship project and will collect liquified CO2 by ships from the port hub. The ships will deposit the CO2 at an onshore terminal on the west coast of Norway. From there, the CO2 is transported by pipeline to be stored below the seabed. The pipe from the onshore facility to the reservoir is dimensioned for 5 million tpa (i.e. significant over-capacity).
Storage: Liquified CO2 will be pumped by pipelines into the Norwegian continental shelf, offshore Smeaheia or Johansen saline formations, at depths of 1.2-7km and 3.3km below sea level respectively. The storage distance is less than 600km. Initially there is a storage capacity of 1.5 million tonnes of CO2 per year at the storage site. Northern Lights plans to increase storage capacity to 5 million tpa through an additional development phase (Phase 2) and an increasing customer base.

CCUS Development Pathway for the EfW Sector 11
Case Study: Twence Hengelo EfW26
Description: Located in Hengelo, the Netherlands, and operated by Twence. EfW processing over 830ktpa of residual waste, with a district heating network (73MW Thermal, 20 MW Electric).27
Status: In 2014 Twence introduced the first CCUS installation to an EfW facility, converting the CO2 into sodium bicarbonate which is used to cleanse flue gases. The next step has been, since July 2020, capturing 3,600 tpa of CO2 which is liquified and delivered by tanker as a raw material for commercial greenhouse horticulture.
Twence has recently procured a 100ktpa modular capture plant. This is intended to be operational in late 2021. The CO2 captured will again supply greenhouse horticulture.
Cost / Funding: The European Commission has provided €14.3 million investment aid for the capture facility, representing 37% of the eligible investment costs of the project.28 The development is associated with the ACT-NEWEST CCSUS Project, which will compare the lifecycle-analysis and economic analysis of the operation with the alternative of geological storage for the CO2.
Capture: The new 100ktpa modular capture plant will be provided by Aker Carbon Capture as a turnkey solution. The system is designed to be easy to fabricate (lead in time of around 15 months), transport to site, install and operate. The compact design measures only 25m x 18m.
Transport: Liquified CO2 will be transported in road tankers to the greenhouses for utilisation.
Utilisation: In greenhouses for the horticulture sector, where it will be used to enhance crop growth. CO2 is already immediately applicable as ‘fertilisation’ in greenhouse horticulture, which means this sector can switch to clean energy sources.
CO2 used in this way is clearly not permanently stored, and hence the CO2 is not abated in the same way as via geological storage (see Section 3.1.4).
26 Geos.ed (2021) Twence Details. https://www.geos.ed.ac.uk/sccs/project-info/2623 27 JFE Engineering Group (2021) Biomass power plant BEC Twence, Hengelo, The Netherlands https://www.standardkessel-baumgarte.com/en/plants-and-components/references/biomass-power-plant-bmc-twence.html 28 Aker Carbon Capture (2021) EU approves funding for Twencce’s carbon capture project. https://news.cision.com/aker-carbon-capture-as/r/eu-approves-funding-for-twence-s-carbon-capture-project,c3391623

12
3.3 UK Policy for CCUS
The need to decarbonise the UK and wider global economy has received substantial and growing attention in recent years. Significant commitments have been made, namely the overarching target for the UK to achieve net zero carbon emissions by 2050.
The UK has been the focus of additional attention in 2021, as it prepares to host the UN climate talks ('COP26'), which brings with it political responsibility to implement effective climate action. Achievements to date in the UK have been encouraging; from 1990 to 2019 emissions have fallen by 40%, whilst GDP increased by 78%. But the future targets are ambitious, with reductions of a further 63% required from 2019 to 2035 on the way to net zero by 2050.29
To deliver these ambitious targets, there is now widespread recognition that CCUS can play a significant role in this transition. In October 2017, the government announced its new approach to CCUS in the Clean Growth Strategy.30 This approach is designed to enable the UK to become a global leader in CCUS.
The independent and influential CCC also recognises the need for CCUS to be delivered at scale. Through its Sixth Carbon Budget (2033-37), the CCC proposes deploying CCUS on EfW facilities.31 The most ambitious scenario suggests that CCUS starts being installed on EfW facilities from the late 2020s, whereas the 'Balanced Net Zero Pathway'32 assumes CCUS installation begins in the early 2040s, with all facilities covered by 2050.
The balanced pathway sees gas power stations with CCUS deployed from the second half of the 2020s, with no unabated gas from 2035. For the manufacturing and construction sectors, the balanced pathway suggests CCUS deployment from 2025, with smaller-scale emitters deploying in the late 2030s / early 2040s.33
The CCC acknowledges that EfW could be considered carbon negative with CCUS on a lifecycle basis. This means that the waste sector has the potential to reach net zero and support other economic sectors for which it may not be possible to fully decarbonise without offsetting. This is discussed in more detail in Section 7.1.
29 CCC (2021) 2021 Progress Report to Parliament, Climate Change Committee, https://www.theccc.org.uk/publication/2021-progress-report-to-parliament/ 30 BEIS (2017) Clean Growth Strategy, Department for Business, Energy & Industrial Strategy https://www.gov.uk/government/publications/clean-growth-strategy 31 Climate Change Committee (2020) The Sixth Carbon Budget – Waste, Climate Change Committee report for UK Government https://www.theccc.org.uk/wp-content/uploads/2020/12/Sector-summary-Waste.pdf
32 Definition of Balanced Net Zero Pathway, generally based on cost effectiveness and technical certainty 33 CCC (2020) Sixth Carbon Budget - Manufacturing and construction, Climate Change Committee, https://www.theccc.org.uk/wp-content/uploads/2020/12/Sector-summary-Manufacturing-and-construction.pdf
CCUS Development Pathway for the EfW Sector 13
3.4 Development of a UK CCUS Market
A CCUS market in the UK has not yet been established. The barriers to deploying CCUS projects in the UK, and globally, are said to be primarily commercial, rather than technical. Therefore, without government support, the sector is unlikely to be developed. Accordingly, the focus of successive governments has been on the provision of financial support mechanisms.
The UK Government has been seeking to finance CCUS since 2007. Efforts were initially focused on demonstrating full chain CCUS with large emitters of CO2
(power stations). Government support was structured around two sequential competitions, each seeking to offer £1 billion of grant funding. However, each were withdrawn following Spending Review decisions.
3.4.1 Current CCUS Programme
The UK government remains engaged in exploring the potential for commercial-scale CCUS across a range of sectors. As outlined in the Ten Point Plan, the government has the ambition to deploy four clusters and capture at least 10 million tonnes of CO2 annually by 2030.34
The government's latest position presents a major change from the UK's previous efforts to commercialise CCUS technology. Rather than focusing on demonstrating CCUS on a single facility (typically power generation), the government aims to support CCUS clusters, in which a range of non-power generating "industrial emitters" play a central part; this is expected to include EfW facilities.35
The government has focused on developing a package of various business models, alongside an infrastructure fund to support the different aspects of CCUS. The business models consider the reuse of existing assets and the efficient allocation of risk to develop a model that will incentivise deployment of early projects. Three key aspects have been the focus to date; a high-level description of each business model is as follows:
• The Carbon Capture and Storage Infrastructure Fund (CIF). The CIF was first announced at Budget in March 2020, and its allocation of £1 billion was confirmed at the Spending Review in November 2020. The CIF will primarily support capital expenditure on T&S networks and industrial carbon capture (ICC) projects.36 The CIF will be focused on the strategic deployment of the
34 HM Government (2020) The Ten Point Plan for a Green Industrial Revolution, HM Government, https://assets.publishing.service.gov.uk/government/uploads/system/uploads/attachment_data/file/936567/10_POINT_PLAN_BOOKLET.pdf 35 BEIS has announced a ‘minded-to’ position on the inclusion of EfW in the ICC business model. A final decision is expected by November 2021. 36 BEIS (2021) The Carbon Capture and Storage Infrastructure Fund: an update on its design, The Department for Business, Energy & Industrial Strategy, https://www.gov.uk/government/publications/design-of-the-carbon-capture-and-storage-ccs-

14
infrastructure and facilities necessary to capture a significant volume of carbon emissions in the near future.
• Business models for T&S. This model is expected to encourage the development of dedicated organisations that will be responsible for the T&S of CO2 through the development, construction, financing, maintenance, operation and decommissioning of the T&S network. Roles for involved organisations would include asset owners and system operators in a network that would gradually grow, utilised across different sectors, with the intent to drive higher utilisation and benefit from economies of scale.37 The structure of the model is subject to change but would likely include a revenue model to collect fees from users of the T&S network, a framework to determine allowed revenue return, and a contractual arrangements package to provide protection for investors against risks.
• Business models for Hydrogen, Power and Industrial Carbon Capture (ICC). These models focus on developing (amongst other aspects) potential revenue models to ensure commercial viability and opportunities for future growth. Under the ICC business model, government support would be provided via payments under the ICC contract to an industrial emitter (for example, the EfW should the government follow through on its ‘minded-to’ position). The implementation of ICC imposes costs associated with capital investment, in addition to operational and systems costs, onto the emitter, and hence the ICC business model provides a commercial offer that aims to incentivise existing facilities to invest in CCUS. Eligibility is designed to be inclusive of all existing and new facilities, with expectations of a capture rate of at least 90%. Metering would be used to establish capture rates and subsequent payments. This method would also be compatible with carbon pricing policy. The price would likely follow a fixed trajectory to imitate the ‘avoided’ cost of carbon, but as first-of-a-kind (FOAK) ICC projects mature to nth of-a-kind (NOAK), the model will similarly evolve to use the market price of carbon as reference for future projects. This model is derived to provide predictability to investors and to reduce the need for subsidies as the market grows.4,5
3.4.1.1 The Development of Clusters
There is recognition that in terms of practical reality, large CO2 emitters in close proximity to each other and a T&S solution will likely form into a CCUS' cluster'. This has the benefit of improving the resilience of the CO2 supply and providing significant
infrastructure-fund/the-carbon-capture-and-storage-infrastructure-fund-an-update-on-its-design-accessible-webpage 37 BEIS (2021) Carbon Capture, Usage and Storage: an update on the business model for Transport and Storage, The Department for Business, Energy & Industrial Strategy, https://assets.publishing.service. gov.uk/government/uploads/system/uploads/attachment_data/file/983903/ccus-transport-services-business-model-commercial-update.pdf

CCUS Development Pathway for the EfW Sector 15
economies of scale due to shared infrastructure. Eunomia recognised the potential of the cluster concept in 2011, through a report on the East Irish Sea CCS Cluster.38
In May 2021, BEIS launched the 'Cluster Sequencing for CCUS Deployment: Phase-1', with the ambition of deploying CCUS in two industrial clusters by the mid-2020s and a further two clusters by 2030. The government received submissions from five clusters for potential support. Following review, all five met the eligibility criteria in July 2021 and proceeded to the assessment stage.
Publication of the cluster projects that BEIS will negotiate with is not due until 25th October 2021 at the earliest. There continues to be a degree of flexibility and pragmatism in the programme. For instance, the guidance for cluster submission states that:
"…if it becomes clear in the course of negotiations that government's affordability envelope could support an additional Track-1 cluster"
It therefore appears possible that all five cluster projects could in theory be supported by 2030.
The five clusters, which in some cases have undergone several mergers and name changes over time, were – at the time of writing – identified in alphabetic order as:
1) DelpHYnus – Capture from the South Humber Industrial area, repurposing the existing CMS pipeline with storage linked to the Cygnus offshore gas facility.39
2) East Coast Cluster – collaboration between the Northern Endurance Partnership, Net Zero Teesside and Zero Carbon Humber. CO2 from these regions largest emitters will be compressed at Easington, before being piped to the Endurance Field in the Southern North Sea for storage.40
3) HyNet – capturing CO2 from industry in NW England and North Wales, with storage in depleted natural gas field beneath Liverpool Bay.41
4) Scottish Cluster – centred on the St Fergus gas terminal in NE Scotland, seeking to use the existing offshore Goldeneye Pipeline to access storage site and onshore Feeder 10 pipeline to link St Fergus with Scotland's industrial central belt.42
5) V Net Zero – repurposing existing 118km LOGGS offshore pipeline to access the depleted gas reservoirs in the Viking Area (Southern North Sea) to sequester CO2
38 Eunomia Research & Consulting (2011) The East Irish Sea CCS Cluster: A Conceptual Design, https://www.ccstlm.com/site/system/resources/interfaces/The_East_Irish_Sea_CCS_Cluster_Summary_Brochure2728.pdf?id=16 39 Neptune Energy (2021) DelpHYnus project, UK North Sea, Neptune Energy, https://www.neptuneenergy.com/esg/new-energy/delphynus-project 40 East Coast Cluster (2021) The East Coast Cluster Website, accessed September 2021 https://eastcoastcluster.co.uk/ 41 HyNet (2021) The HyNet North West Cluster Website, accessed September 2021, https://hynet.co.uk/ 42 The Scottish Cluster (2021) The Scottish Cluster Website, accessed September 2021, https://www.backthescottishcluster.co.uk/
16
from Immingham, via new 50km onshore pipeline to Theddlethorpe Gas Terminal.43
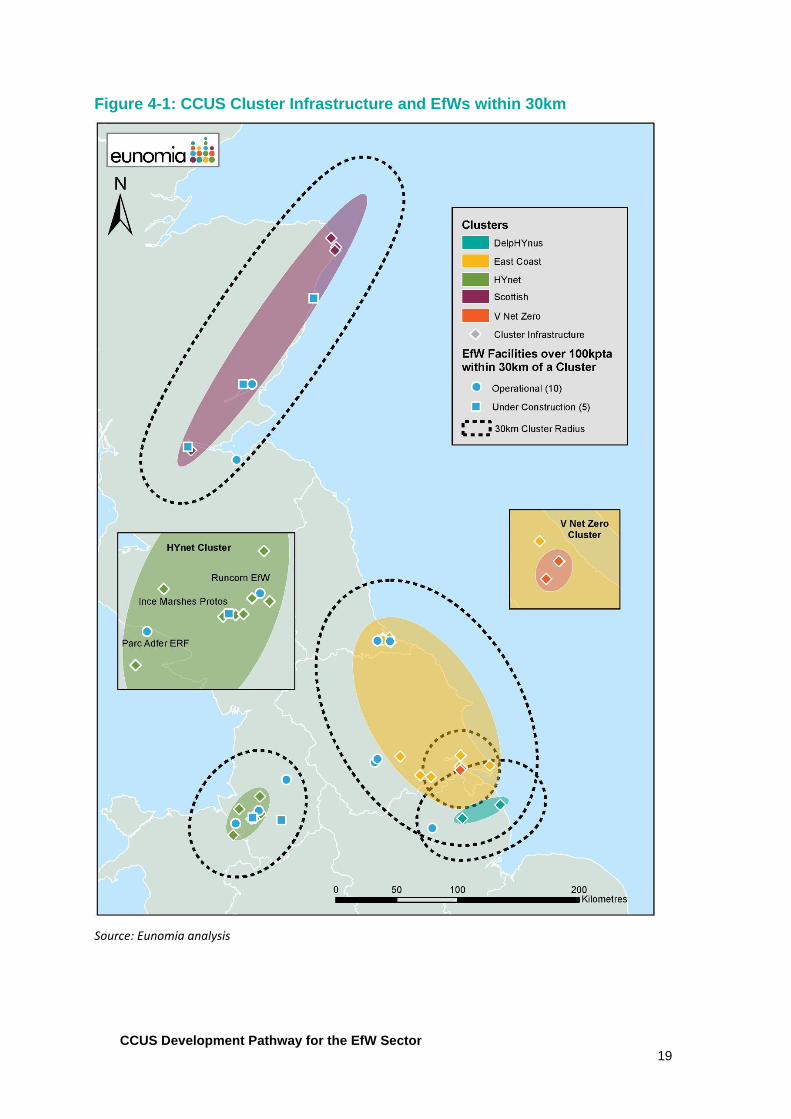
Given the geographical proximity of the DelpHYnus, East Coast Cluster and V Net Zero (see Figure 4-1) projects it is feasible that there could be further agglomeration, as has already been seen within the East Coast Cluster. Therefore, whilst the total number of cluster projects might be reduced, the number of industrial emitters that could be feasibly linked would not necessarily shrink.
EfW facilities are suitable candidates to join such clusters and are already aligning themselves with such projects. For example, in May 2021, Viridor announced it had joined the HyNet consortium, targeting CCUS operations from the Runcorn EfW by 2026.44 Similarly, Suez's Haverton Hill EfW is aligned to the Net Zero Teeside CCUS project, which forms part of the East Coast Cluster.45
43 Harbour Energy (2021) V Net Zero Project website, accessed September 2021, https://www.harbourenergy.com/sustainability/vnz-co2-transportation-storage/ 44 Viridor (2021) Viridor commits to fight against climate crisis by becoming first UK net negative emissions waste company news release, Viridor, https://www.viridor.co.uk/who-we-are/latest-news/2021-news/viridor-commits-to-fight-against-climate-crisis-by-becoming-first-uk-net-negative-emissions-waste-company/ 45 Suez (2020) Reduction of CO₂ emissions by 2030: SUEZ and BP sign a Memorandum of Understanding to explore “Net Zero Teesside” news release, SUEZ , https://www.suez.com/en/news/press-releases/reduction-co2-emissions-by-2030-suez-and-bp-sign-memorandum-net-zero-teesside-uk-first-decarbonised-industrial-hub
CCUS Development Pathway for the EfW Sector 17
4.0 Potential Development Pathway for
EfW with CCUS in the UK
As identified in Section 3.4, the development of CCUS in the UK will depend on government policies currently being established. Once policy is established, each individual EfW operator will determine their own strategy to decarbonise their facility/facilities, including whether the installation and operation of CCUS infrastructure is technically and economically optimal.
We anticipate the development of CCUS in a phased manner, led by the locational attributes of EfW facilities (and wider industry) which strongly influence technical and economic viability.
In the following sections, we have sought to outline how EfW with CCUS could potentially develop in the UK.
4.1 EfWs Likely to Install Carbon Capture
As outlined in Section 2.0, from a technological and economic perspective, the development of CCUS is expected to focus initially on incineration facilities.
In broad terms, one tonne of waste input to an incinerator, results in one tonne of CO2 being emitted. Whilst Figure 2-1 shows all operational (48) and under construction (16) EfW facilities (incinerators), we have assumed a minimum capacity threshold of 100ktpa, below which CCUS was not deemed to be financially viable due to economies of scale. That is not to say CCUS could not be developed on these facilities at some point in the future (see Section 4.2.3).
With this 100ktpa threshold, seven (six operational and one under construction) EfWs were removed from the initial analysis.
It was beyond the scope of this study to consider each EfW facilities’ design configuration in any detail. Whilst all EfW facilities should in theory be capable of retrofitting CCUS to some extent, there are certain technical characteristics which will have an impact on costs. These include boiler efficiency, whether or not the facility operates in combined heat and power (CHP) mode, and the type of emission reduction equipment fitted. For this report, all EfWs were therefore considered equal with regard to these aspects.
4.2 Phasing of EfW CCUS Development
The development of EfW with CCUS is likely to be iterative, with individual facilities making investment decisions on a facility-by-facility basis. We anticipate the rollout to be primarily determined by location, specifically the proximity to potential T&S networks that are expected to be established through the five clusters identified in Section 3.4.1.1.
For the purpose of this assessment, we have assumed that EfW facilities within 30km of an identified cluster are within the first phase of CCUS deployment.

18
Following this, we anticipate facilities that are close (again within 30km) to potentially suitable port facilities to be developed next (second phase). For the purpose of this report we have included UK ports that currently handle over 1million tpa of liquified gas or other liquid bulk product. This was on the basis that given existing infrastructure, these ports would likely represent the most likely future 'hubs' through which captured carbon would be transported (via ship) to cluster locations.
Finally, we anticipate that the remaining EfWs would be fitted with CCUS in the period 2040 to 2050 (in line with CCC scenarios46). Whilst the more remote location of these facilities means that transport solutions for these facilities are likely to be expensive, this third phase will clearly benefit from the substantial wider learning and cost reductions of the cluster and port hub phases. There is also the distinct possibility that policy will by then mandate CCUS on EfW. It is acknowledged, however, that for some of these EfWs the costs of applying CCUS may be prohibitively expensive. In such cases operators will face a choice of meeting the cost of CCUS, or look to closing the facility (should it be mandatory by then).
The following sub-sections summarise the development of each of these phases.
4.2.1 First Phase (2026-2030): EfW in Close Proximity to CCUS Clusters
As stated in Section 3.1.3, the UK is fortunate to have significant viable geological storage options for CO2. The five CCUS clusters identified in Section 3.4.1.1 have passed BEIS eligibility criteria which include credible operation by 2027 and an associated T&S network, defined as:
"…a set of onshore pipelines, offshore pipelines and an associated offshore storage facility. The pipelines must be capable of transporting CO2 to the storage site that must be able to store this CO2 safely and permanently."47
In essence, these five clusters represent the most likely (and earliest) mechanism to develop CCUS projects in the UK. By extension, it has been assumed that these five clusters represent the first wave of EfW with CCUS projects in the UK.
Figure 4-1 shows 15 EfW (10 operational and 5 under construction) with a capacity over 100ktpa and within a viable onshore pipeline distance (30km) of a cluster. We would suggest that this is the maximum number of facilities that could viably install CCUS between the mid-2020s and 2030. EfWs that opt to install capture equipment in this period are likely to experience FOAK costs unless significant coordination between operators occurs.
46 Climate Change Committee (2020) The Sixth Carbon Budget – Waste, Climate Change Committee report for UK Government https://www.theccc.org.uk/wp-content/uploads/2020/12/Sector-summary-Waste.pdf 47BEIS (2021), Update on Phase-1 eligible clusters and Phase-2 timeline Guidance, Department for Business, Energy & Industrial Strategy, https://www.gov.uk/government/publications/cluster-sequencing-for-carbon-capture-usage-and-storage-ccus-deployment-phase-1-expressions-of-interest/update-on-phase-1-eligible-clusters-and-phase-2-timeline
CCUS Development Pathway for the EfW Sector 19
Figure 4-1: CCUS Cluster Infrastructure and EfWs within 30km
Source: Eunomia analysis
20
4.2.2 Second Phase (2031-2040): EfWs with Close Proximity to Port Hubs
The next phase of EfW with CCUS development is expected to be those located within close proximity to the potentially suitable port hubs described in Section 4.2. It is anticipated that a dedicated pipeline would connect these EfW to their nearest port hub, where the CO2 would be bulk stored temporarily. From here, CO2 would be shipped to an onshore cluster terminal (likely to be the nearest cluster, but this will depend on several factors, including cost and T&S capacity), from where a subsea pipeline would deliver the CO2 to the injection site for onward geological storage. We'd anticipate CCUS being installed on EfW in this second phase throughout the 2030s.
Figure 4-2 illustrates that a further 14 (12 operational and 2 under construction) EfWs with a capacity over 100ktpa are within 30km of an identified port hub. As such, it is assumed that this is the maximum number that could form the second phase of CCUS development.
We anticipate facilities within this phase to benefit from learning and optimisation from the first phase of installation of CCUS, therefore we anticipate EfWs that opt to install capture equipment in this period to experience NOAK costs.

CCUS Development Pathway for the EfW Sector 21
Figure 4-2: CCUS Cluster Infrastructure, Port Hubs and EfWs within 30km
Source: Eunomia analysis

22
4.2.3 Third Phase (2040-2050): Remaining Dispersed EfWs
The remaining EfWs, not covered by the first cluster phase (2026-2030) and the second port hub phase (2031-2040), total 35 (including the 7 under 100ktpa), will need to consider whether it is suitable to install CCUS equipment. We anticipate that significant technical and economic barriers are likely to exist for most facilities in this phase. There are also practical considerations as well as the expense of linking more dispersed sites to the CCUS network. For example, where CO2 is transported by road it will require significant additional onsite infrastructure, namely intermediate storage, and lorry bays for loading.
By way of example, the 400ktpa Fortum Oslo Varne incinerator anticipates requiring 6,600m2 for this enterprise, considerably more than that required for the bespoke capture plant.48 The additional lorry movements to and from the site, even if conducted with low carbon fuels49, are likely to be a significant additional barrier in terms of planning consent.
Over time, it may be possible for these facilities to benefit from the likely expanding nature of the CCUS onshore network. Following this logic, assuming those EfW within 30km of clusters and port hubs are connected to CCUS infrastructure, it is entirely feasible that other facilities in close proximity to those EfWs now connected could later join the network.
Furthermore, this would not necessarily depend on EfW linking to other EfW facilities; it could include any significant CO2 emitter from wider industrial sectors. Such development would be further boosted as CCUS costs fall, as well as the cost of carbon continuing to rise. In addition, some EfWs could benefit from CO2 utilisation, as discussed in Section 3.1.4, as that market develops.
Based on net zero pathways developed by the CCC, of which even the most pessimistic scenario sees 100% of EfWs fitted with CCUS by 2050,50 we therefore anticipate that all remaining EfWs will be fitted with CCUS in the 2040s.
4.3 Summary of Development
Overall, we consider the location of EfW, and more specifically its location to CCUS clusters, to be one of the key determinants in the sequencing of the development of EfW with CCUS. Based on our analysis, we anticipate three distinct phases of the development of CCUS. These are summarised in Figure 4-3.
48 Carbon Capture Oslo, March 2018 49 Electric, hybrid or fuel cell options are not currently mature for lorry transport 50 Climate Change Committee (2020) The Sixth Carbon Budget – Waste, Climate Change Committee report for UK Government https://www.theccc.org.uk/wp-content/uploads/2020/12/Sector-summary-Waste.pdf
CCUS Development Pathway for the EfW Sector 23
Figure 4-3: Overview of the Deployment of EfW with CCUS
Source: Eunomia analysis
24
5.0 Potential CO2 Abatement
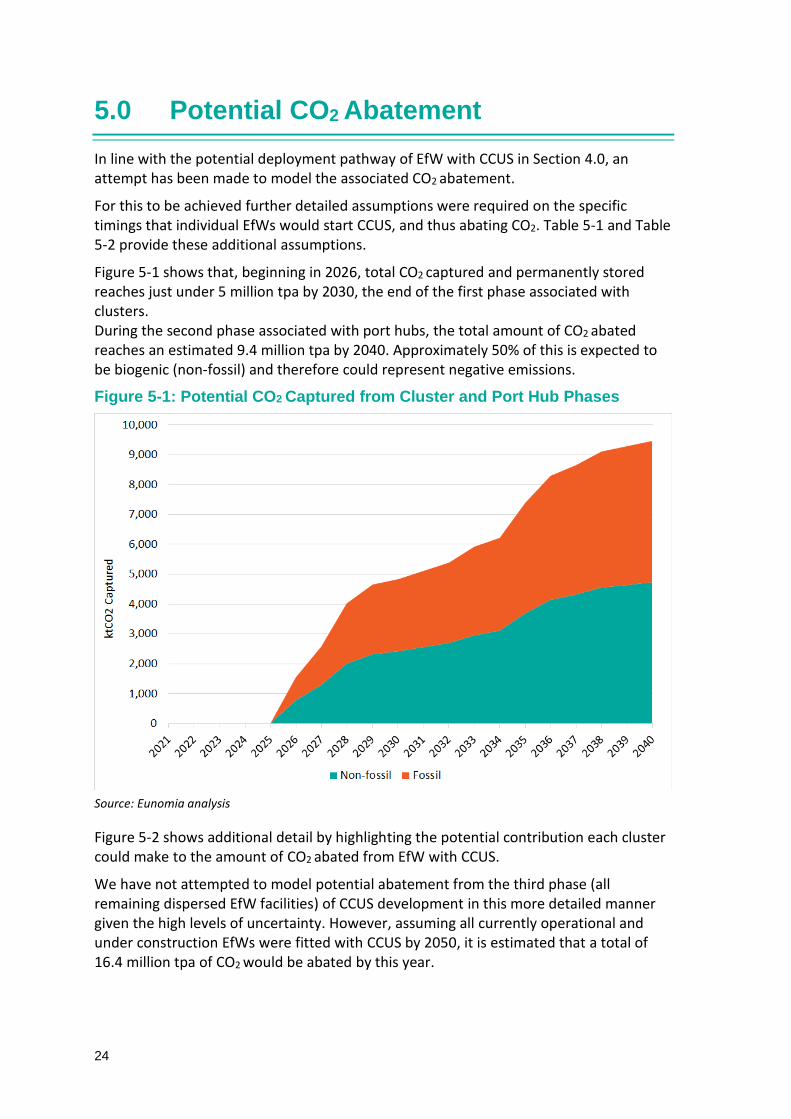
In line with the potential deployment pathway of EfW with CCUS in Section 4.0, an attempt has been made to model the associated CO2 abatement.
For this to be achieved further detailed assumptions were required on the specific timings that individual EfWs would start CCUS, and thus abating CO2. Table 5-1 and Table 5-2 provide these additional assumptions.
Figure 5-1 shows that, beginning in 2026, total CO2 captured and permanently stored reaches just under 5 million tpa by 2030, the end of the first phase associated with clusters. During the second phase associated with port hubs, the total amount of CO2 abated reaches an estimated 9.4 million tpa by 2040. Approximately 50% of this is expected to be biogenic (non-fossil) and therefore could represent negative emissions.
Figure 5-1: Potential CO2 Captured from Cluster and Port Hub Phases
Source: Eunomia analysis
Figure 5-2 shows additional detail by highlighting the potential contribution each cluster could make to the amount of CO2 abated from EfW with CCUS.
We have not attempted to model potential abatement from the third phase (all remaining dispersed EfW facilities) of CCUS development in this more detailed manner given the high levels of uncertainty. However, assuming all currently operational and under construction EfWs were fitted with CCUS by 2050, it is estimated that a total of 16.4 million tpa of CO2 would be abated by this year.

CCUS Development Pathway for the EfW Sector 25
Figure 5-2: Potential CO2 Captured from Each Cluster and Port Hub Phases
Source: Eunomia analysis

26
Table 5-1: EfW at CCUS Clusters
Cluster Stated Date Cluster Potentially Operational From
Date EfW Could Potentially be Linked Comment / Assumption
DelpHYnus 20251 2026: Lincolnshire EfW The dates of cluster operation are based on stated projections from the developers of the clusters, and should therefore be considered as optimistic. The estimated date that each EfW could potentially be linked to the cluster is assumed to be one year later in the first instance. This assumption is supported by the Runcorn EfW which is stated as being linked to the HYnet cluster a year after it becomes operational. Where there are multiple EfWs, the assumption is that one EfW is linked to the cluster in each subsequent year. The order of these EfWs is determined by their proximity to the industrial cluster, thus reflecting the possible pipeline network infrastructure growth.2
East Coast 20253
2026: Wilton 11 EfW 2027: Teesside EfW 2028: Ferrybridge Multifuel 1 and 2
HYnet
20254
2026: Runcorn EfW 2027: Ince Marshes Protos 2028: Parc Adfer ERF 2029: Lostock Sustainable Energy Plant 2030: Bolton TRF
Scottish
20255
2026: Earls Gate Park 2027: Dundee Energy Recycling 2028: Baldovie 2029: East Tullos 2030: Millerhill
Humber Zero N/A N/A [No EfWs over 100ktpa within 30km]
CCUS Development Pathway for the EfW Sector 27
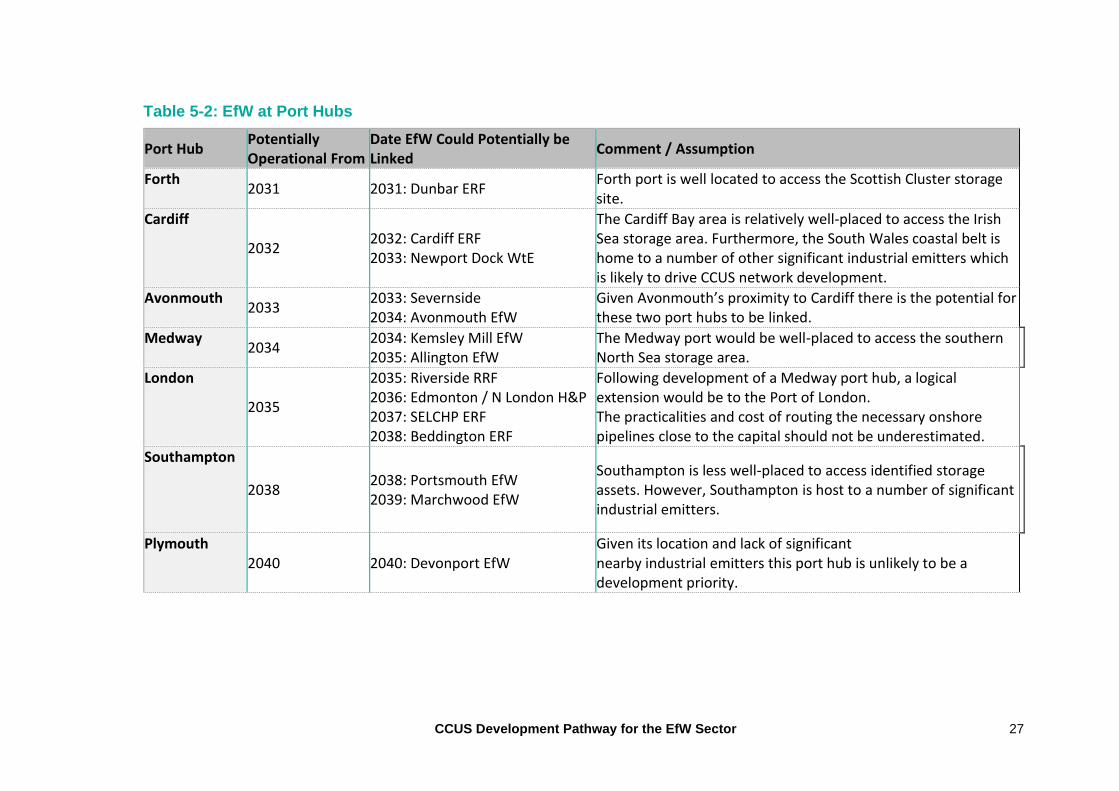
Table 5-2: EfW at Port Hubs
Port Hub Potentially Operational From
Date EfW Could Potentially be Linked
Comment / Assumption
Forth 2031 2031: Dunbar ERF
Forth port is well located to access the Scottish Cluster storage site.
Cardiff
2032 2032: Cardiff ERF 2033: Newport Dock WtE
The Cardiff Bay area is relatively well-placed to access the Irish Sea storage area. Furthermore, the South Wales coastal belt is home to a number of other significant industrial emitters which is likely to drive CCUS network development.
Avonmouth 2033
2033: Severnside 2034: Avonmouth EfW
Given Avonmouth’s proximity to Cardiff there is the potential for these two port hubs to be linked.
Medway 2034
2034: Kemsley Mill EfW 2035: Allington EfW
The Medway port would be well-placed to access the southern North Sea storage area.
London
2035
2035: Riverside RRF 2036: Edmonton / N London H&P 2037: SELCHP ERF 2038: Beddington ERF
Following development of a Medway port hub, a logical extension would be to the Port of London. The practicalities and cost of routing the necessary onshore pipelines close to the capital should not be underestimated.
Southampton
2038 2038: Portsmouth EfW 2039: Marchwood EfW
Southampton is less well-placed to access identified storage assets. However, Southampton is host to a number of significant industrial emitters.
Plymouth 2040 2040: Devonport EfW
Given its location and lack of significant nearby industrial emitters this port hub is unlikely to be a development priority.
28
6.0 Estimated Costs of EfW with CCUS
A critical factor in assessing whether EfW with CCUS is likely to be viable is to understand the likely associated costs. This section, therefore, summarises the results of modelling carried by Eunomia, drawing on estimated costs presented in relevant techno-economic studies, case studies and interviews with relevant industry representatives.
As identified in Section 3.4.1, the commercial models associated with the delivery of CCUS will likely involve the provision of dedicated organisations responsible for the T&S of CO2 within clusters (T&S providers). Accordingly, the costs of this service are expected to be similar for users of this service. Individual facilities, however, would still be expected to incur costs associated with capturing their CO2 and transporting it to the T&S providers; as both of these costs will be bespoke for each individual facility.
This section provides a forecast of the levelised costs of developing CCUS for EfW in the UK, including the capital expenditure (CAPEX) and operational expenditure (OPEX) of the capture, transport and storage of CO2, on a per tCO2 basis, across a lifetime of 25 years. These levelised costs have not been discounted.
6.1 Overview of Approach
The costs are presented for the phases outlined in Section 4.2. These are:
• First Phase (2026-2030): EfWs with close proximity to CCUS Clusters – 'The Cluster Phase'. This includes EfW within 30km of one of the five defined CCUS clusters described in Section 3.4.1.1. It is assumed that onshore pipelines will be utilised to connect to the cluster pipeline network. EfWs in this phase are assumed to develop CCUS first, and therefore have FOAK costs (though modular capture is already operating closer to NOAK costs – this is discussed further in Section 6.1.1).
• Second Phase (2031-2040): EfWs with close proximity to Port Hubs – 'The Ports Phase'. This includes EfW within 30km of major liquid/gas ports. These sites are expected to be the second tier of EfW to develop CCUS, benefiting from knowledge and efficiencies gleaned from the Cluster Phase. It is assumed that onshore pipelines and shipping will be utilised.
• Third Phase (2040-2050): Remaining Dispersed EfWs: This includes the remaining EfW within the UK. Due to the highly bespoke nature of the transport solutions needed for each of these facilities, the costs for these facilities are not presented in this report. 2040 is also a long time into the future in the context of CCUS technology development. As such any cost estimates associated with this third phase is inappropriate at this time.
Where reviewed data was presented in euros or dollars it has been converted to pounds sterling at the September 2021 rate. All costs are presented in real terms (2021 prices). A set of key input assumption tables can be found in Appendix A.1.0.

CCUS Development Pathway for the EfW Sector 29
There are three distinct stages to CCUS: capture, transport, and geological storage. All three have associated CAPEX and OPEX costs.
6.1.1 Capture
The CAPEX is the cost of the capture plant itself and its installation. OPEX includes costs such as labour, solvent, energy loss (parasitic load), and digital operation centre. Both of these costs will vary according to the EfW facility in question.
One interesting sensitivity to the CO2 capture units is the option for either a bespoke or a modular solution. Modular solutions are now available to purchase 'off the shelf', for example, Aker Carbon Capture offers its Just Catch™ standardised design in either 40ktpa or 100ktpa. The advantage of these modular systems is that they:
• offer an automated turn-key solution;
• are compact and therefore relatively easy to transport and install;
• can be delivered in around 15 months; and
• benefit from economies of scale, so CAPEX is relatively low (closer to NOAK than FOAK).
The main disadvantage of such a system is that it will not be optimised for the EfW to which it is to be retrofitted, both in terms of size51 and integration. This means that OPEX will be higher. Conversely, bespoke capture systems have a higher CAPEX but benefit from greater optimisation, so OPEX is lower.
For this study, we have therefore separated the EfW in each of the phases into two groups:
• Those that deploy a modular approach. This approach is applicable for smaller EfW facilities of <225ktpa, which generate a smaller volume of CO2. These facilities are assumed to install one or a maximum of two 100,000 tCO2 capture units (beyond this number the modular system is not considered to be as economical as the bespoke approach).
• Those that deploy a bespoke approach. This would apply to larger EfW (>225ktpa) and allow the capture unit to be tailored in size to the specific facility. Furthermore, for the largest facilities (over 400ktpa), these are assumed to have a lower cost than bespoke capture units for facilities between 225ktpa and 400ktpa.
6.1.2 Transport
As identified in the earlier section, it is likely that two types of transport costs will be incurred:
• Bespoke costs for each facility to the T&S provider; and
51 For example, a 120ktpa EfW would have one 100ktpa modular unit attached. Assuming 90% capture efficiency from the modular unit, the overall capture would only by 75% (90ktpa/120ktpa). This has been reflected in the model.
30
• Costs charged by the T&S provider
In this analysis, transport costs are not split into these two aspects, but instead considered as one single cost.
The cost of transport is forecast to vary significantly for each of the two phases modelled, principally with additional costs estimated for EfWs within the second phase (due to the need to ship CO2). For both phases, the cost of offshore pipeline transport has been consistently modelled (at £12/tCO2
52) in addition to costs for onshore transport, or shipping. OPEX is assumed to be 5% of the CAPEX cost.
6.1.3 Storage
Offshore storage costs are derived from the CCC's assessment of decarbonisation pathways.53 Across a 25-year timeframe, the levelised cost is assumed to be approximately £8/tCO2 across all phases and scenarios.
6.1.4 Utilisation
Given the total size of the current UK CO2 utilisation market (less than the annual CO2
emissions of a medium-sized EfW facility), the issues around non-permanent storage and the uncertainty of future market potential, utilisation has not been considered a potential route for EfW CO2 emissions in this report. It is, however, acknowledged that niche opportunities may exist in the future, and these are likely to be very location-specific.
6.2 First Phase: The Cluster Phase
The cluster phase includes 15 EfW (10 operational and 5 under construction) within 30km of a defined cluster, with a capacity over 100ktpa. Combined, they are anticipated to treat almost 5.6mtpa of residual waste. A summary of the facilities is shown in Table 6-1.
52 BEIS (2020) CCS deployment at dispersed industrial sites, A report by Element Energy for the Department for Business, Energy & Industrial Strategy, https://assets.publishing.service.gov.uk/government/uploads/system/uploads/attachment_data/file/929282/BEIS_-_CCUS_at_dispersed_sites_-_Report__1_.pdf 53 Element Energy (2020) Deep Decarbonisation Pathways for UK Industry, A report for the Climate Change Committee by Element Energy, http://www.element-energy.co.uk/wordpress/wp-content/uploads/2020/12/Element-Energy-Deep-Decarbonisation-Pathways-for-UK-Industry.pdf

CCUS Development Pathway for the EfW Sector 31
Table 6-1: First Phase EfW Facilities
Facility Name Operator Current Status Capacity (tpa)54
Carbon Capture Used
Runcorn EfW Viridor Operational 1,100,000 Bespoke
Ferrybridge Multifuel Plant (FM1) Ferrybridge MFE Limited Operational 675,000 Bespoke
Ferrybridge (FM2) Multifuel Energy/3SE (SSE & Shanks) Operational 675,000 Bespoke
Wilton 11 EfW Suez / Sembcorp Operational 430,000 Bespoke
Teesside EfW Suez UK Operational 646,000 Bespoke
Parc Adfer Energy Recovery Facility (Deeside)
Enfinium Operational 200,000 Modular
Lincolnshire EfW Facility FCC Environment (Lincolnshire) Limited Operational 190,000 Modular
Millerhill FCC Environment Operational 155,000 Modular
Dundee Energy Recycling MVV Operational 120,000 Modular
Bolton TRF Suez Operational 100,000 Modular
Lostock Sustainable Energy Plant Lostock Sustainable Energy Plant Limited (FCC)
Under Construction 600,000 Bespoke
Ince Marshes (Protos) Covanta Under Construction 400,000 Bespoke
Earls Gate Park CNIM Under Construction 216,000 Modular
East Tullos, Aberdeen Indaver Under Construction 150,000 Modular
Baldovie MVV Environment Under Construction 110,000 Modular
Source: Eunomia analysis
54 This table denotes permitted capacity. Where possible, 2019 throughput data was used in the modelling of throughput (and hence CO2 abated) for operational sites for increased accuracy. Throughput tends to be slightly lower than permitted capacity.

32
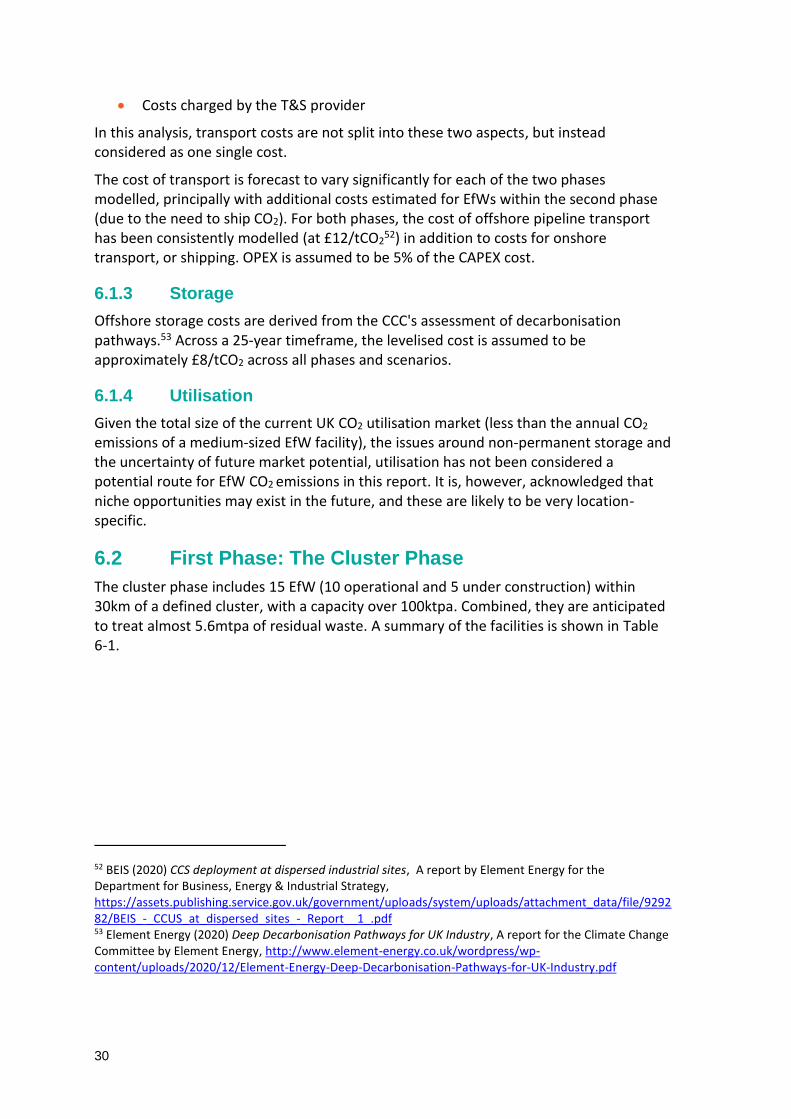
Figure 6-1 shows the total costs (CAPEX + OPEX) of each CCUS stage for the bespoke and modular scenarios. The bespoke scenario is estimated to cost approximately £66/tCO2.55 Approximately £42/tCO2 (64%) relates to capture costs, followed by transport at £15/tCO2 (23%) and finally storage at £8/tCO2 (13%).
For the modular scenario, a total cost of £86/tCO2 is estimated.56 Approximately £49/tCO2 (57%) of these costs relates to capture. Transport costs increase by £13/tCO2 from the bespoke to modular scenario. Although the cost of (shared) offshore transport is expected to remain the same in both scenarios, the onshore pipeline costs increase for the modular scenario as the size of facilities are smaller.
Figure 6-1: Total Costs by CCUS Stage – Cluster Phase
Source: Eunomia modelling
Figure 6-2 splits the bespoke stages into CAPEX (£41/tCO2)57 and OPEX (£25/tCO2), whilst the modular scenario's CAPEX is higher at £54/tCO2 due to increased transport costs, as is OPEX at £32/tCO2
58 due to increased capture costs.
55 CAPEX and OPEX add up to £66/tCO2 when accounting for rounding. 56 CAPEX and OPEX add up to £86/tCO2 when accounting for rounding. 57 CAPEX adds up to £41/tCO2 when accounting for rounding. 58 OPEX adds up to £32/tCO2 when accounting for rounding.
CCUS Development Pathway for the EfW Sector 33
Figure 6-2: CCUS Costs by Stage, split by CAPEX & OPEX – Cluster Phase
Source: Eunomia modelling
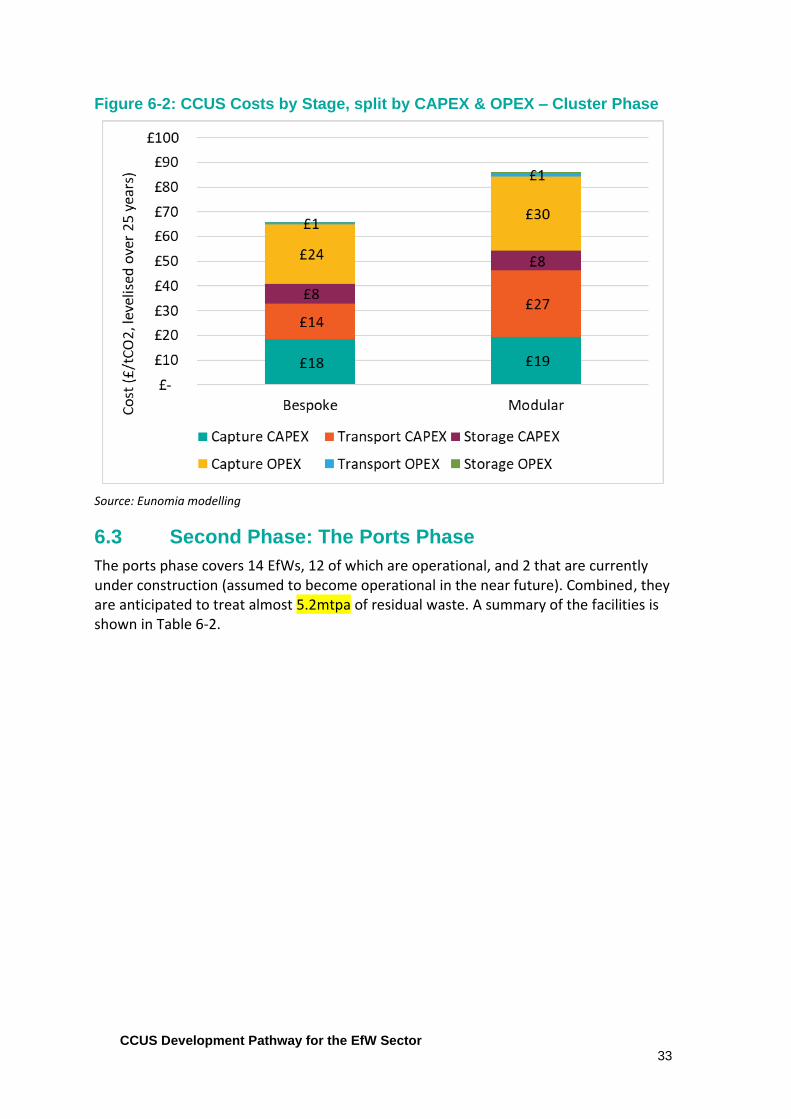
6.3 Second Phase: The Ports Phase
The ports phase covers 14 EfWs, 12 of which are operational, and 2 that are currently under construction (assumed to become operational in the near future). Combined, they are anticipated to treat almost 5.2mtpa of residual waste. A summary of the facilities is shown in Table 6-2.

34
Table 6-2: Phase 2 EfW Facilities
Facility Name Operator Current Status Capacity (t)^ Carbon Capture Used
Riverside Resource Recovery Facility (RRRF)
Cory Environmental
Operational 900,000 Bespoke
Edmonton (to be replaced
by North London Heat & Power)
London Waste Operational 700,000 Bespoke
Kemsley Mill EfW / K3 CHP ERF
Enfinium Operational 550,000 Bespoke
Allington EfW / Allington Quarry
Kent Enviropower (FCC)
Operational 500,000 Bespoke
Severnside Suez UK Operational 500,000 Bespoke
SELCHP ERF (South East London Combined Heat and Power)
Veolia (SELCHP) Operational 488,000 Bespoke
Cardiff Energy Recovery Facility
Viridor Operational 425,000 Bespoke
Dunbar Energy Recovery Facility
Viridor Operational 300,000 Bespoke
Beddington EfW Viridor Operational 275,000 Bespoke
Devonport EfW Facility MVV Environment Devonport Ltd
Operational 245,000 Modular*
Marchwood ERF Veolia Operational 220,000 Modular
Portsmouth ERF Veolia Operational 180,000 Modular
Avonmouth EfW Viridor Under Construction 320,000 Bespoke
Newport Dock WtE Aviva Under Construction 220,000 Modular
Source: Eunomia analysis; * Reported throughput for Devonport EfW was about 216ktpa, making the facility suitable for the modular system by our assessment standards. However, in practice, the operator may prefer a bespoke approach. ^ This table denotes permitted capacity. Where possible, 2019 throughput data was used in the modelling of throughput (and hence CO2 abated) for operational sites for increased accuracy. Throughput tends to be slightly lower than permitted capacity.

CCUS Development Pathway for the EfW Sector 35
Figure 6-3 shows the total costs of each CCUS stage for the bespoke and modular scenarios. The bespoke scenario is estimated to capture about 3.9mtpa of CO2 at a cost of £85/t CO2; £33/tCO2 (39%) of which relates to capture costs; £44/tCO2 (51%) transport; and the remaining £8/tCO2 is storage (10%).
For the modular scenario, only 4 EfWs are of appropriate size and are estimated to capture 0.7mtpa of CO2 at a cost of £110/tCO2; £52/tCO2 (47%) of which relates to capture; £50/tCO2 (45%) to transport.
The increase in the cost of transport from the bespoke to modular scenario similarly relate to the average size of the plants: as the modular scenario has smaller sized plants, the cost per tonne is assumed to be more expensive than that of the larger plants in the bespoke scenario (see Table A. 2).
Figure 6-3: Total Costs by CCUS Stage – Ports Phase
Source: Eunomia modelling
Figure 6-4 splits the bespoke stages into CAPEX (£61/tCO2) and OPEX (£24/tCO2), whilst the modular scenario's CAPEX is higher at £81/tCO2
59 due to increased capture and
slightly increased transport costs, as is OPEX at £30/tCO260 due to increased capture
costs.
59 CAPEX adds up to £81/tCO2 when accounting for rounding. 60 OPEX add up to £30/tCO2 when accounting for rounding.
£33
£52
£44
£50 £8
£8
£-
£20
£40
£60
£80
£100
£120
Bespoke ModularCo
st (
£/t
CO
2, l
evel
ised
ove
r 2
5 y
ears
)
Capture Transport Storage

36
Figure 6-4: Costs by Stage, split by CAPEX and OPEX – Ports Phase
Source: Eunomia modelling (rounding occurs)
6.4 Summary of Costs
Overall, the total costs of EfW with CCUS range from £66/tCO2 to £110/tCO2. The bespoke cluster phase is the cheapest option, with the modular ports phase being the most expensive of the modelled costs. The cost range is demonstrated in Figure 6-5.
£11 £25
£42
£47 £8
£8 £22
£27
£2
£2
£-
£20
£40
£60
£80
£100
£120
Bespoke ModularCo
st (
£/t
CO
2, l
evel
ised
ove
r 2
5 y
ears
)
Capture CAPEX Transport CAPEX Storage CAPEX
Capture OPEX Transport OPEX Storage OPEX
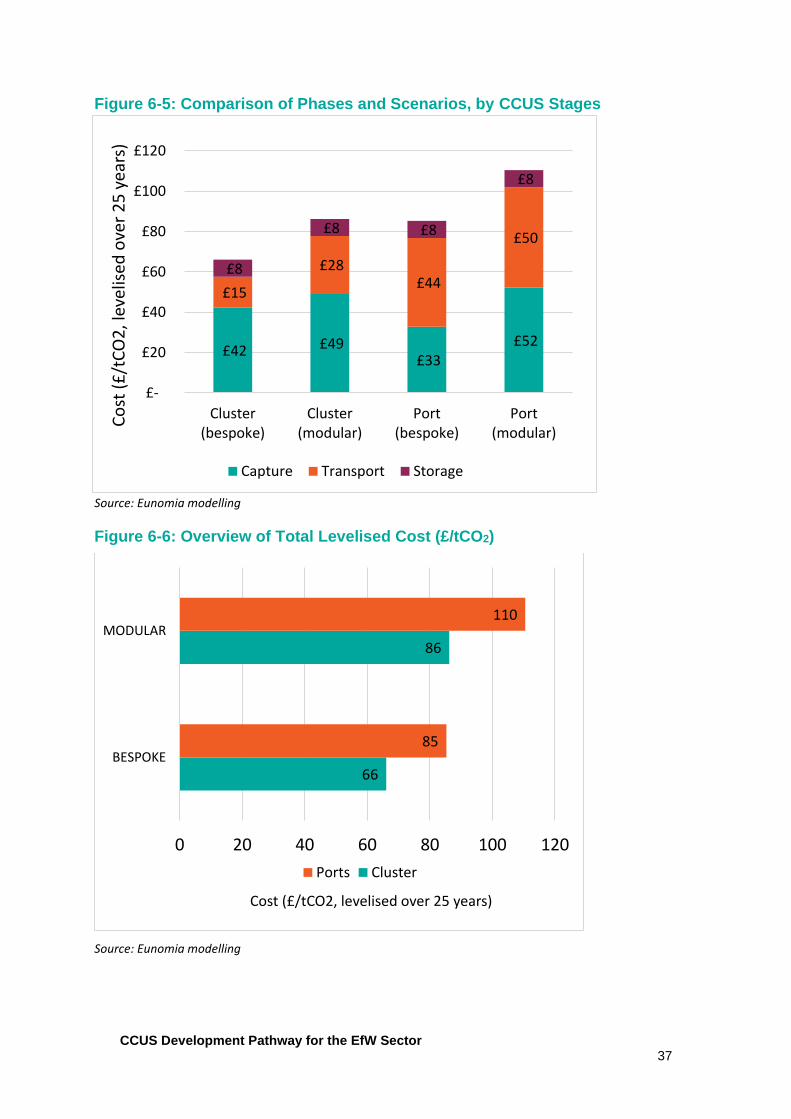
CCUS Development Pathway for the EfW Sector 37
Figure 6-5: Comparison of Phases and Scenarios, by CCUS Stages
Source: Eunomia modelling
Figure 6-6: Overview of Total Levelised Cost (£/tCO2)
Source: Eunomia modelling
66
86
85
110
0 20 40 60 80 100 120
BESPOKE
MODULAR
Cost (£/tCO2, levelised over 25 years)
Ports Cluster
£42 £49 £33
£52
£15
£28 £44
£50
£8
£8 £8
£8
£-
£20
£40
£60
£80
£100
£120
Cluster(bespoke)
Cluster(modular)
Port(bespoke)
Port(modular)
Co
st (
£/t
CO
2, l
evel
ised
ove
r 2
5 y
ears
)
Capture Transport Storage
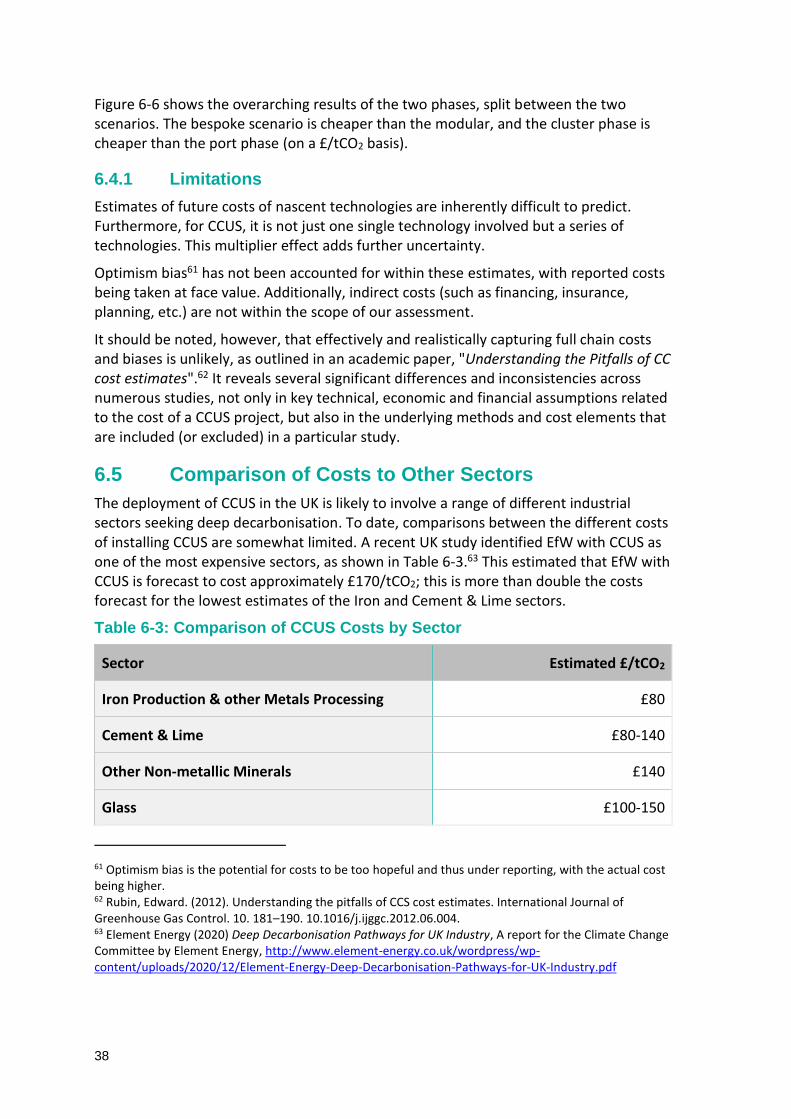
38
Figure 6-6 shows the overarching results of the two phases, split between the two scenarios. The bespoke scenario is cheaper than the modular, and the cluster phase is cheaper than the port phase (on a £/tCO2 basis).
6.4.1 Limitations
Estimates of future costs of nascent technologies are inherently difficult to predict. Furthermore, for CCUS, it is not just one single technology involved but a series of technologies. This multiplier effect adds further uncertainty.
Optimism bias61 has not been accounted for within these estimates, with reported costs being taken at face value. Additionally, indirect costs (such as financing, insurance, planning, etc.) are not within the scope of our assessment.
It should be noted, however, that effectively and realistically capturing full chain costs and biases is unlikely, as outlined in an academic paper, "Understanding the Pitfalls of CC cost estimates".62 It reveals several significant differences and inconsistencies across numerous studies, not only in key technical, economic and financial assumptions related to the cost of a CCUS project, but also in the underlying methods and cost elements that are included (or excluded) in a particular study.
6.5 Comparison of Costs to Other Sectors
The deployment of CCUS in the UK is likely to involve a range of different industrial sectors seeking deep decarbonisation. To date, comparisons between the different costs of installing CCUS are somewhat limited. A recent UK study identified EfW with CCUS as one of the most expensive sectors, as shown in Table 6-3.63 This estimated that EfW with CCUS is forecast to cost approximately £170/tCO2; this is more than double the costs forecast for the lowest estimates of the Iron and Cement & Lime sectors.
Table 6-3: Comparison of CCUS Costs by Sector
Sector Estimated £/tCO2
Iron Production & other Metals Processing £80
Cement & Lime £80-140
Other Non-metallic Minerals £140
Glass £100-150
61 Optimism bias is the potential for costs to be too hopeful and thus under reporting, with the actual cost being higher. 62 Rubin, Edward. (2012). Understanding the pitfalls of CCS cost estimates. International Journal of Greenhouse Gas Control. 10. 181–190. 10.1016/j.ijggc.2012.06.004. 63 Element Energy (2020) Deep Decarbonisation Pathways for UK Industry, A report for the Climate Change Committee by Element Energy, http://www.element-energy.co.uk/wordpress/wp-content/uploads/2020/12/Element-Energy-Deep-Decarbonisation-Pathways-for-UK-Industry.pdf

CCUS Development Pathway for the EfW Sector 39
Refining & Chemicals £140-200
EfW £170
Source: Adapted from Element Energy64
However, this analysis appears not to have considered the specific location of EfW, particularly with reference to those within close proximity of clusters. As identified in Section 6.4, our analysis shows that EfW facilities are likely to experience a range of different costs, depending largely on their location, timing and size.
For all industrial sectors, proximity to clusters is likely to be the most significant factor affecting costs. For facilities within clusters, we anticipate similar T&S costs. Thus, the key differentiator will be the cost of capture. The cost of capture is not expected to be any more expensive for EfW than other industrial sectors. For facilities outside of clusters, the transport costs associated with moving CO2 are an important differentiator.
The high-level research underpinning the costs in Table 6-3 does not appear to include sufficient appreciation of the impact of facility location on CCUS costs. As such it does not allow a reliable direct comparison of CCUS costs between sectors. Based on our analysis, EfW would appear to be at least as competitive as other sectors.
64 Element Energy (2020) Deep Decarbonisation Pathways for UK Industry, A report for the Climate Change Committee by Element Energy, http://www.element-energy.co.uk/wordpress/wp-content/uploads/2020/12/Element-Energy-Deep-Decarbonisation-Pathways-for-UK-Industry.pdf

40
7.0 Further Benefits of EfW with CCUS
Beyond the carbon captured, there are expected to be additional benefits associated with the installation of CCUS equipment. The following sub-sections seek to outline some of the key benefits.
7.1 Negative Emissions
There is significant potential for negative emissions through the application of CCUS to the combustion of feedstocks with biogenic content in EfW. This would result from the capture of biogenic CO2 emissions, which are then subsequently permanently sequestered underground, thus resulting in negative emissions.
The biogenic content of residual waste will vary according to its composition. For example, residual waste collected from households that do not have a food waste collection service is likely to have a higher proportion of biogenic content than households that do have a food waste collection. Estimates from EfW operators, place biogenic contents between 40% and 50% of their overall carbon emissions. As well as variation between each facility now, it is likely to change in the future, as materials placed on the market and the recycling of different materials will vary. Accordingly, it is not possible to be definitive on the overall proportion of emissions that will be biogenic in the future.
Based on the assumption that 50% of EfW CO2 emissions are biogenic, if the 15 EfWs identified in close proximity to clusters, and the 14 facilities near port hubs were fitted with CCUS, we anticipate that almost 5 million tpa of negative emissions could be stored at the current level of residual waste being sent to EfW. This would represent a significant environmental benefit.
Currently, there is no clear mechanism for the monetisation of negative emissions. Within the Industrial Decarbonisation Strategy65, the government has committed to considering how the UK ETS could be developed to incentivise negative emissions. However, the EfW sector does not currently participate in the scheme and it is unclear what impacts the negative emissions will have on incentivising (or otherwise) emission reductions.
An alternative monetisation route might be the informal offsetting market. Whilst this market is still being developed, there is a shift towards carbon removal rather than carbon reductions.66
65 HM Government (2021) Industrial Decarbonisation Strategy, HM Government, https://assets.publishing.service.gov.uk/government/uploads/system/uploads/attachment_data/file/970229/Industrial_Decarbonisation_Strategy_March_2021.pdf 66 University of Oxford (2020) The Oxford Principles for Net Zero Aligned Carbon Offsetting, University of Oxford, https://www.smithschool.ox.ac.uk/publications/reports/Oxford-Offsetting-Principles-2020.pdf
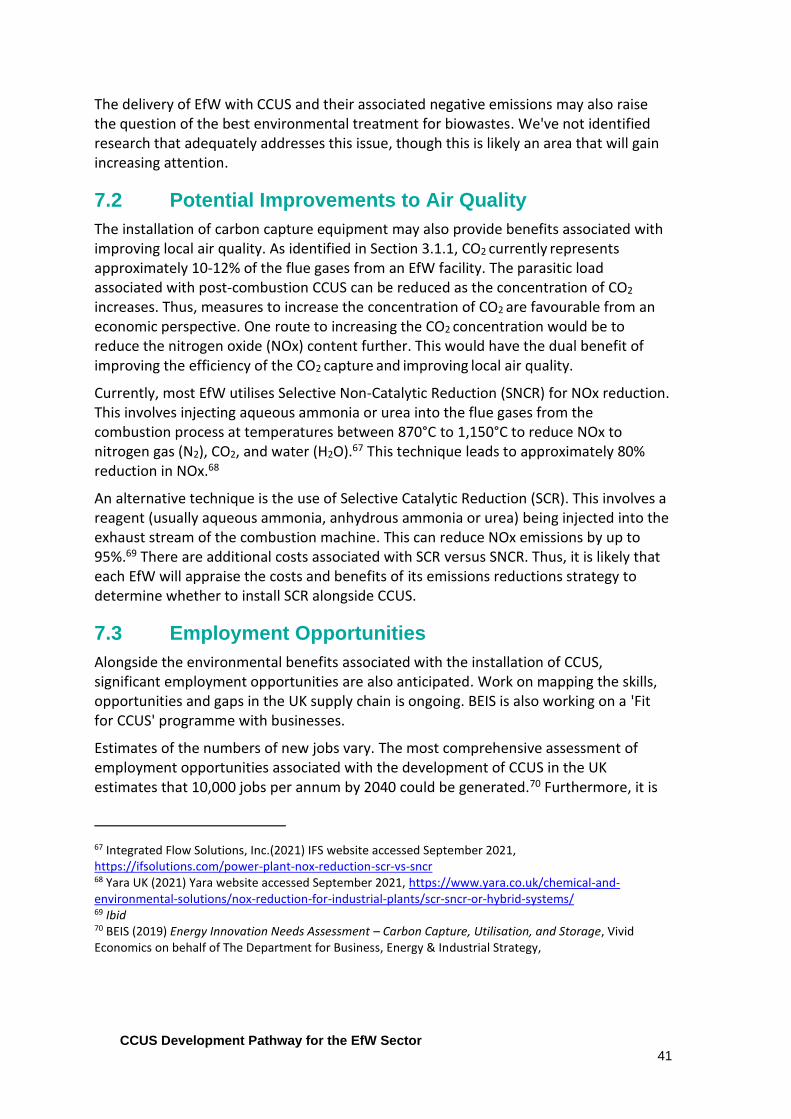
CCUS Development Pathway for the EfW Sector 41
The delivery of EfW with CCUS and their associated negative emissions may also raise the question of the best environmental treatment for biowastes. We've not identified research that adequately addresses this issue, though this is likely an area that will gain increasing attention.
7.2 Potential Improvements to Air Quality
The installation of carbon capture equipment may also provide benefits associated with improving local air quality. As identified in Section 3.1.1, CO2 currently represents approximately 10-12% of the flue gases from an EfW facility. The parasitic load associated with post-combustion CCUS can be reduced as the concentration of CO2 increases. Thus, measures to increase the concentration of CO2 are favourable from an economic perspective. One route to increasing the CO2 concentration would be to reduce the nitrogen oxide (NOx) content further. This would have the dual benefit of improving the efficiency of the CO2 capture and improving local air quality.
Currently, most EfW utilises Selective Non-Catalytic Reduction (SNCR) for NOx reduction. This involves injecting aqueous ammonia or urea into the flue gases from the combustion process at temperatures between 870°C to 1,150°C to reduce NOx to nitrogen gas (N2), CO2, and water (H2O).67 This technique leads to approximately 80% reduction in NOx.68
An alternative technique is the use of Selective Catalytic Reduction (SCR). This involves a reagent (usually aqueous ammonia, anhydrous ammonia or urea) being injected into the exhaust stream of the combustion machine. This can reduce NOx emissions by up to 95%.69 There are additional costs associated with SCR versus SNCR. Thus, it is likely that each EfW will appraise the costs and benefits of its emissions reductions strategy to determine whether to install SCR alongside CCUS.
7.3 Employment Opportunities
Alongside the environmental benefits associated with the installation of CCUS, significant employment opportunities are also anticipated. Work on mapping the skills, opportunities and gaps in the UK supply chain is ongoing. BEIS is also working on a 'Fit for CCUS' programme with businesses.
Estimates of the numbers of new jobs vary. The most comprehensive assessment of employment opportunities associated with the development of CCUS in the UK estimates that 10,000 jobs per annum by 2040 could be generated.70 Furthermore, it is
67 Integrated Flow Solutions, Inc.(2021) IFS website accessed September 2021, https://ifsolutions.com/power-plant-nox-reduction-scr-vs-sncr 68 Yara UK (2021) Yara website accessed September 2021, https://www.yara.co.uk/chemical-and-environmental-solutions/nox-reduction-for-industrial-plants/scr-sncr-or-hybrid-systems/ 69 Ibid 70 BEIS (2019) Energy Innovation Needs Assessment – Carbon Capture, Utilisation, and Storage, Vivid Economics on behalf of The Department for Business, Energy & Industrial Strategy,
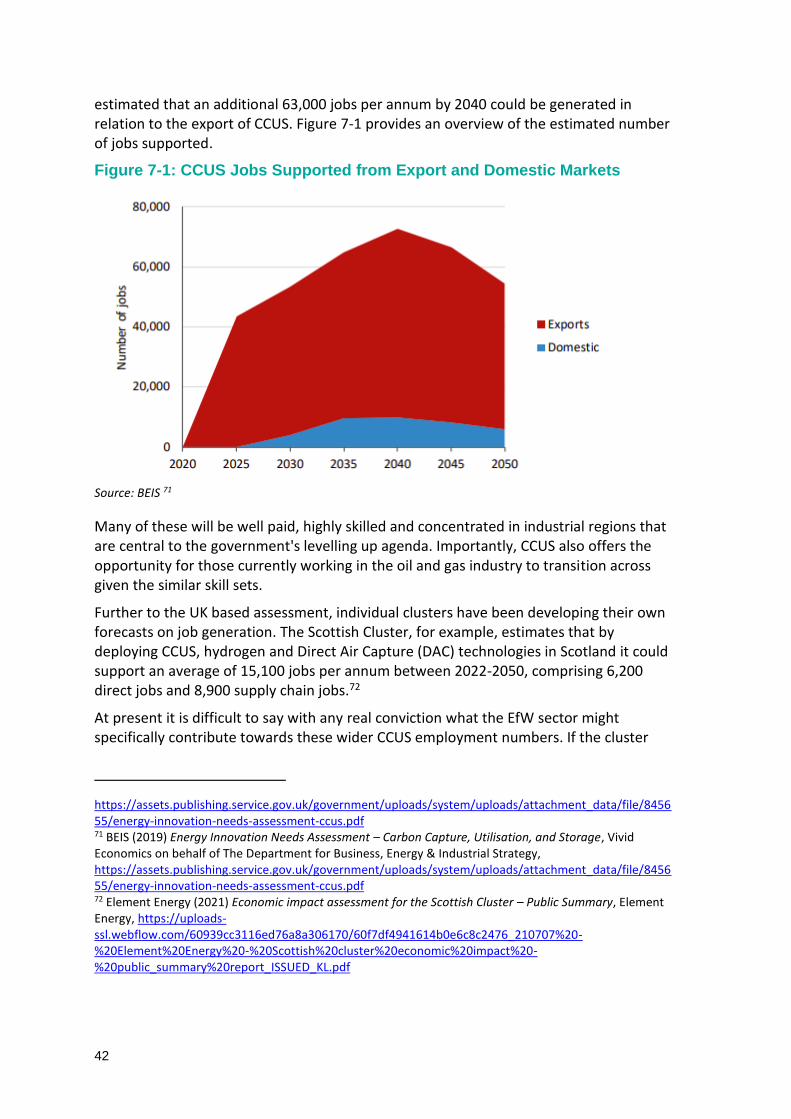
42
estimated that an additional 63,000 jobs per annum by 2040 could be generated in relation to the export of CCUS. Figure 7-1 provides an overview of the estimated number of jobs supported.
Figure 7-1: CCUS Jobs Supported from Export and Domestic Markets
Source: BEIS 71
Many of these will be well paid, highly skilled and concentrated in industrial regions that are central to the government's levelling up agenda. Importantly, CCUS also offers the opportunity for those currently working in the oil and gas industry to transition across given the similar skill sets.
Further to the UK based assessment, individual clusters have been developing their own forecasts on job generation. The Scottish Cluster, for example, estimates that by deploying CCUS, hydrogen and Direct Air Capture (DAC) technologies in Scotland it could support an average of 15,100 jobs per annum between 2022-2050, comprising 6,200 direct jobs and 8,900 supply chain jobs.72
At present it is difficult to say with any real conviction what the EfW sector might specifically contribute towards these wider CCUS employment numbers. If the cluster
https://assets.publishing.service.gov.uk/government/uploads/system/uploads/attachment_data/file/845655/energy-innovation-needs-assessment-ccus.pdf 71 BEIS (2019) Energy Innovation Needs Assessment – Carbon Capture, Utilisation, and Storage, Vivid Economics on behalf of The Department for Business, Energy & Industrial Strategy, https://assets.publishing.service.gov.uk/government/uploads/system/uploads/attachment_data/file/845655/energy-innovation-needs-assessment-ccus.pdf 72 Element Energy (2021) Economic impact assessment for the Scottish Cluster – Public Summary, Element Energy, https://uploads-ssl.webflow.com/60939cc3116ed76a8a306170/60f7df4941614b0e6c8c2476_210707%20-%20Element%20Energy%20-%20Scottish%20cluster%20economic%20impact%20-%20public_summary%20report_ISSUED_KL.pdf

CCUS Development Pathway for the EfW Sector 43
and port hub phases were to be developed as outlined in this report, it is certainly feasible that hundreds of jobs a year would be supported.

44
8.0 Conclusions
This research has sought to consider a potential CCUS development pathway for the EfW sector. This is in light of CCUS offering the only current viable solution to large-scale CO2 abatement of the UK EfW fleet, something that is necessary to help the sector, and wider economy, meet challenging net zero targets.
The analysis undertaken here demonstrates that location is the critical factor in determining the practical application and cost effectiveness of CCUS on EfW. Location drives the potential CCUS development pathway by identifying those EfW facilities within close proximity of identified cluster projects (15 in first phase), and those within close proximity of identified port hubs (14 in second phase).
EfW facilities not included in these first two phases (35, including 7 <100ktpa) are more dispersed and as such will likely need to wait for CCUS networks to spread, costs to come down and/or policy to possibly mandate application (third phase).
Modelling this CCUS development pathway in terms of potential CO2 abatement demonstrates that EfW can make a significant contribution towards net zero goals. By the end of the first cluster phase (2030) our analysis suggests that the amount of CO2 captured and permanently stored could reach just under 5 million tpa. During the second phase associated with port hubs, the total amount of CO2 abated almost doubles to an estimated 9.4 million tpa by 2040. If all remaining 35 EfWs fitted CCUS by 2050 as part of a third and final phase (in line with CCC scenarios), total CO2 abatement from the EfW sector would reach 16.4 million tpa. Approximately 50% of this CO2 is expected to be from biogenic (non-fossil) sources and therefore could be classified as carbon negative emissions.
Costs for the deployment of CCUS on EfW have been modelled as a range of £66/tCO2 to £110/tCO2 for the cluster and port hub phases. As for all industrial sectors, proximity to clusters is likely to be the most significant factor affecting costs. For facilities within clusters, we anticipate similar T&S costs. Thus, the key differentiator will be the cost of CO2 capture. The cost of capture is not expected to be any more expensive for EfW than other industrial sectors. As such, CCUS clusters represent a significant opportunity for nearby EfW facilities to decarbonise at relatively low cost. For facilities outside of clusters, the transport costs associated with moving CO2 are likely an important differentiator.
The cost range presented here is significantly lower than that put forward by high-level research commissioned by the CCC, which estimated that CCUS on EfW could cost £170/tCO2. At optimal sites (e.g. those larger facilities located within potential CCUS clusters), it would appear that EfW with CCUS would be at least as cost-effective as other industrial sectors.

CCUS Development Pathway for the EfW Sector 45
Another key advantage for the EfW sector relates to the prospect of negative emission reductions associated with the storage of 50% biogenic CO2. Negative emissions have the potential to be monetised in the future, and therefore represent a significant opportunity for the EfW sector versus other sectors concerning the costs of CCUS.
This report provides the most detailed assessment of the potential deployment of CCUS in the UK EfW sector to date. In light of this independent analysis it is hoped that government will further recognise the suitability of EfW as a candidate for CCUS in technical and economic terms, as well as the significant contribution the sector can make to climate change targets.
The EfW sector is already engaged in steps to make CCUS a reality, for example through the inclusion of the Runcorn EfW in the HyNet cluster, with operational ambition by 2026. Through its Sixth Carbon Budget, the CCC proposes deploying CCUS on EfW facilities.73 The most ambitious scenario suggests that CCUS starts being installed on EfW facilities from the late 2020s, whereas the 'Balanced Net Zero Pathway'74 assumes CCUS installation begins in the early 2040s, with all facilities covered by 2050.
Further policy support is required if EfW operator willingness to engage in CCUS is to be fully harnessed.
73 Climate Change Committee (2020) The Sixth Carbon Budget – Waste, Climate Change Committee report for UK Government https://www.theccc.org.uk/wp-content/uploads/2020/12/Sector-summary-Waste.pdf
74 Definition of Balanced Net Zero Pathway, generally based on cost effectiveness and technical certainty

46
APPENDICES

CCUS Development Pathway for the EfW Sector 47
A.1.0 Key Assumptions
Table A. 1: Cost Assumptions Overview
(£/tCO2, unless otherwise specified)
Cluster Phase Ports Phase
Bespoke Modular Bespoke Modular
Capture CAPEX
Large Sites75
18
14
10
13 Small Sites
22 13
Transport CAPEX
Onshore Pipeline
£3m/km See Source: Various
sources including BEIS, Catapult, Arup, DNV.GL,
the CCC, and stakeholder feedback
from Aker Carbon Capture and Viridor
Table A. 2
Offshore Transport
12
Storage CAPEX 8
Capture OPEX 24 30 22 27
Transport OPEX 5% of CAPEX
Storage OPEX 5% of CAPEX
75 Large site throughput is greater than 400ktpa.
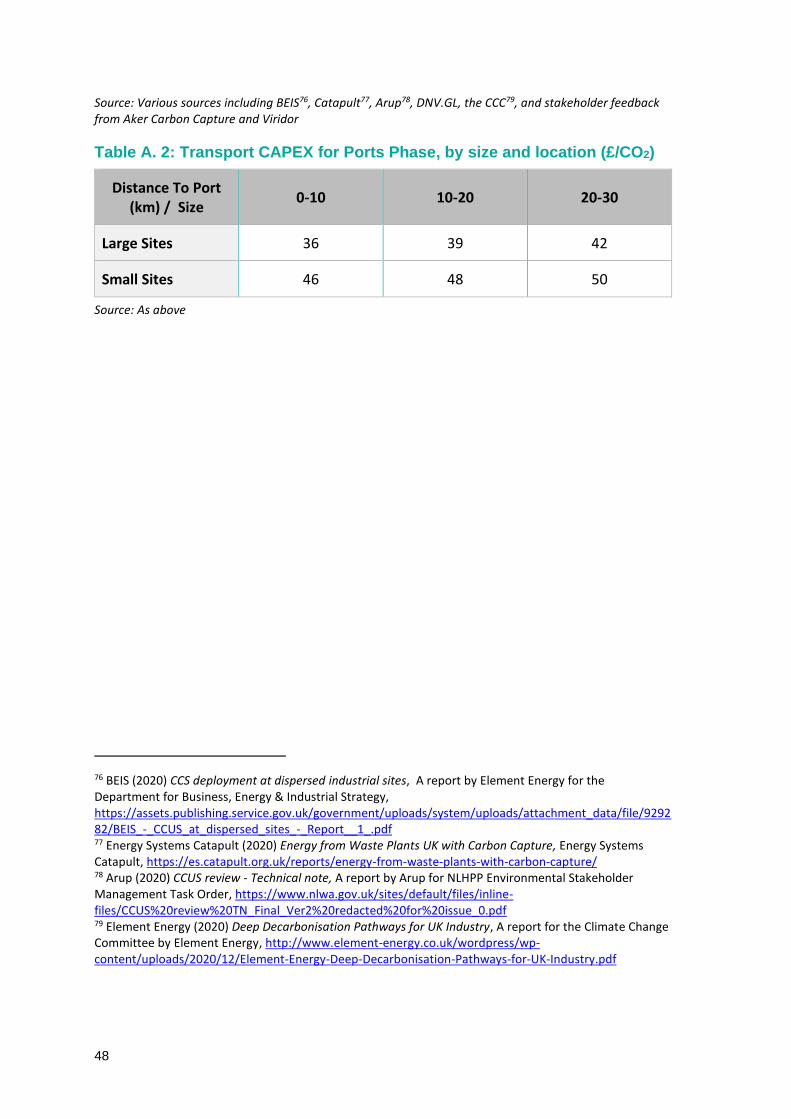
48
Source: Various sources including BEIS76, Catapult77, Arup78, DNV.GL, the CCC79, and stakeholder feedback from Aker Carbon Capture and Viridor
Table A. 2: Transport CAPEX for Ports Phase, by size and location (£/CO2)
Distance To Port (km) / Size
0-10 10-20 20-30
Large Sites 36 39 42
Small Sites 46 48 50
Source: As above
76 BEIS (2020) CCS deployment at dispersed industrial sites, A report by Element Energy for the Department for Business, Energy & Industrial Strategy, https://assets.publishing.service.gov.uk/government/uploads/system/uploads/attachment_data/file/929282/BEIS_-_CCUS_at_dispersed_sites_-_Report__1_.pdf 77 Energy Systems Catapult (2020) Energy from Waste Plants UK with Carbon Capture, Energy Systems Catapult, https://es.catapult.org.uk/reports/energy-from-waste-plants-with-carbon-capture/ 78 Arup (2020) CCUS review - Technical note, A report by Arup for NLHPP Environmental Stakeholder Management Task Order, https://www.nlwa.gov.uk/sites/default/files/inline-files/CCUS%20review%20TN_Final_Ver2%20redacted%20for%20issue_0.pdf 79 Element Energy (2020) Deep Decarbonisation Pathways for UK Industry, A report for the Climate Change Committee by Element Energy, http://www.element-energy.co.uk/wordpress/wp-content/uploads/2020/12/Element-Energy-Deep-Decarbonisation-Pathways-for-UK-Industry.pdf