cdc group plc annual accounts 2013 publications/cdc annual... · cdc group plc annual accounts 2013...
TRANSCRIPT
CD
C G
rou
p plc A
nn
ual A
ccou
nts 2013
CDC Group plc Annual Accounts 2013

Performance Review
Financial Performance 1
Financial Accounts
Auditor’s Report 15Consolidated Statement of Financial Position 16Consolidated Statement of Comprehensive Income 17Consolidated Statement of Cash Flows 18Consolidated Statement of Changes in Equity 20Company Statement of Changes in Equity 20Company Statement of Financial Position 21Company Statement of Cash Flows 22Notes to the Accounts 23
Directors’ Reports
Board of Directors 6Directors’ and Strategic Report 8Directors’ Remuneration Report 12Statement of Directors’ Responsibilities 14
Performance Review
Directors’ ReportsFinancial Accounts
CDC Group plc Annual Accounts 2013
1
No country has succeeded in reducing poverty in a sustainable manner in the absence of economic growth. Commercially sustainable private sector businesses are critical to such growth: they employ and train people, pay taxes, invest in research and development, build and operate infrastructure and services.
In 2012 CDC decided to concentrate on high impact sectors that were chosen because of their propensity to create jobs. Prior to 2012 CDC did not prioritise particular sectors. CDC will continue to invest outside these high impact sectors in the most challenging regions as new capital supporting any sector in capital starved regions is highly developmental. CDC now invests in debt and direct equity as well as continuing its fund of funds business in sub-Saharan Africa and South Asia.
CDC and the businesses in which its capital is invested will:
— comply with all applicable laws; — minimise adverse impacts and enhance positive
effects on the environment, workers and all stakeholders as appropriate;
— commit to continuous improvements with respect to management of the environment, social policies and governance (“ESG”);
— work to apply relevant international best practice standards, with appropriate targets and timetables for achieving them; and
— employ management systems which effectively address ESG risks and realise ESG opportunities as a fundamental part of a company’s value.
Strategies for achieving the objectives of the business CDC expects its investments to achieve results that are appropriate to the opportunities and risks in the relevant market. Amongst the features that CDC seeks in making a decision to commit to an investment are:
— a credible thesis aimed at CDC’s preferred markets with appropriate development impact;
— a strong management team; — prospective returns which are commensurate with
the potential risk; and — a management team that will apply high standards
of business ethics and corporate governance.
CDC evaluates investment performance according to financial performance and development impact.
Taxation CDC recognises the right of governments to tax and respects the tax policies established by governments. CDC requires its investee companies to pay the taxes required in the countries in which they operate and CDC pays taxes wherever they are liable. However, under the CDC Act 1999, CDC Group plc was granted exemption from UK Corporation Tax from May 2003. This allows CDC to recycle more portfolio receipts into new investments in developing countries. CDC only uses offshore financial centres to meet its priority to mobilise capital into developing countries. Offshore financial centres can provide straightforward and stable financial, judiciary and legal systems which facilitate investment.
Financial Performance
CDC is a UK government-owned investment company that invests in private sector businesses in developing countries, where it has been an innovative investor for over 60 years. CDC builds businesses to create jobs and make a lasting difference to people’s lives in some of the world’s poorest places. Since CDC’s foundation, two objectives have remained constant: the need to achieve lasting development impact; while generating sustainable financial returns.
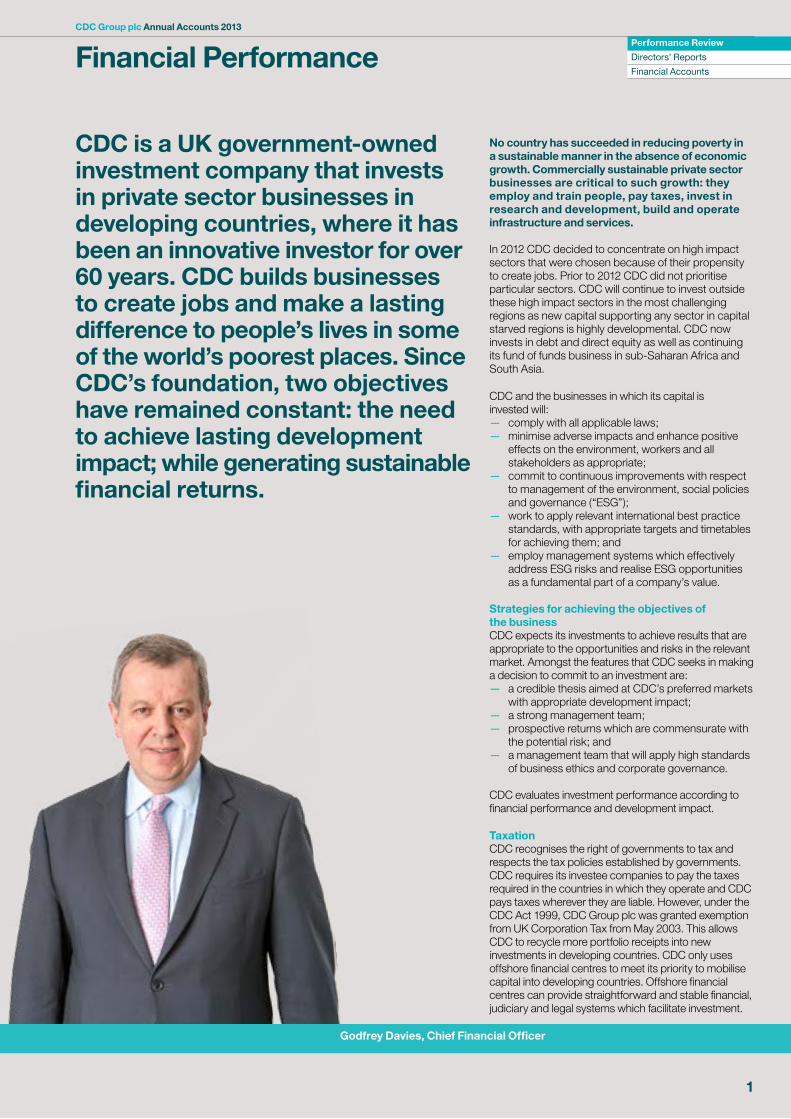
Godfrey Davies, Chief Financial Officer
CDC Group plc Annual Accounts 2013
2
Financial Performancecontinued
CDC will therefore often introduce such jurisdictions into transactions for non-tax related purposes. This may include insulating companies from legal risk, insulating classes of security from cross-default or improving the financial terms or security for different investors. Certain investments may include structures that reduce the tax burden on investors. CDC will only acquiesce to such structures in order to facilitate a developmental impact, increasing investment and consequent job creation and economic growth. CDC prefers to use offshore financial centres that are successfully participating in the OECD’s Global Forum on Transparency and Exchange of Information for Tax Purposes (the “Global Forum”). CDC will avoid making investments through a jurisdiction that does not adequately exchange tax information internationally. CDC would only invest through a jurisdiction that is not successfully participating in the Global Forum in exceptional cases, and only if it is considered that the developmental benefits of the investment justify the use of an intermediary located in such a jurisdiction.
Presentation of results CDC’s financial results are presented in accordance with International Financial Reporting Standards as adopted by the European Union. CDC consolidates all businesses where it has a controlling interest. These audited consolidated accounts can be found in full from page 16 onwards. The Directors’ and Strategic Report gives a summary of those results. During the year, CDC sold a 45% portion of its shareholding in the subsidiary DFCU Limited. The subsidiary has been classified as a discontinued operation. Further details can be found in note 3 to the accounts. CDC has retained a 15% non-controlling interest in DFCU Limited.
However, in order to manage and explain more fully CDC’s investment activities as an investment company, CDC provides information, in note 2 to the accounts on pages 24 and 25 and on pages 2 to 5, on a full investment valuation basis where all its investments are included at fair value, consolidating only subsidiaries that are investment holding companies.
Market conditions The MSCI Emerging Markets Index is designed to measure quoted equity performance in global emerging markets. In 2013, it fell by 3% (2012: 18% rise). Index movements of individual countries varied widely in 2013 with rises from Ghana of 55%, Kenya 48%, Nigeria 29% and China 4%. However there were falls from South Africa of 6% and India of 4%.
The current strategy that requires CDC to invest in more challenging regions, utilising unquoted equity and debt, makes a quoted equity index increasingly unconnected to CDC’s performance. However, it is a useful indicator of general market sentiment in CDC’s geographies.
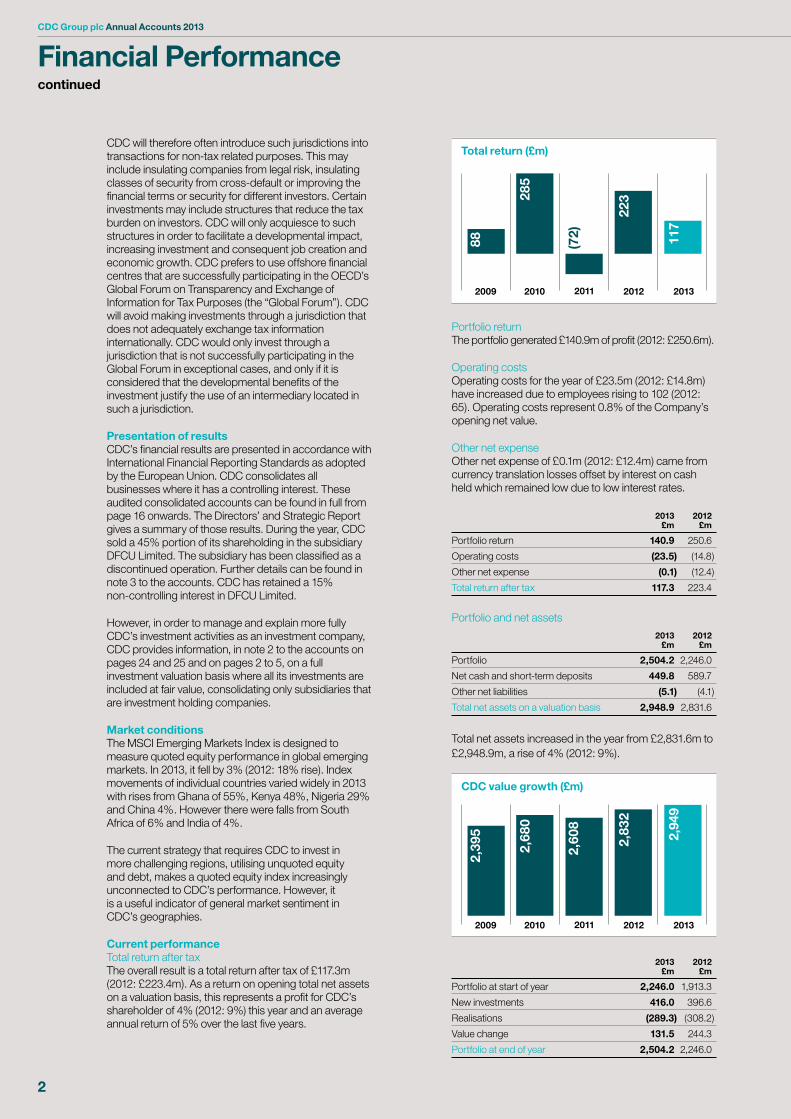
Current performanceTotal return after taxThe overall result is a total return after tax of £117.3m (2012: £223.4m). As a return on opening total net assets on a valuation basis, this represents a profit for CDC’s shareholder of 4% (2012: 9%) this year and an average annual return of 5% over the last five years.
Total return (£m)
20132009 2010 2011 2012
88 117
285
(72)
223
Portfolio returnThe portfolio generated £140.9m of profit (2012: £250.6m).
Operating costsOperating costs for the year of £23.5m (2012: £14.8m) have increased due to employees rising to 102 (2012: 65). Operating costs represent 0.8% of the Company’s opening net value.
Other net expenseOther net expense of £0.1m (2012: £12.4m) came from currency translation losses offset by interest on cash held which remained low due to low interest rates.
2013 2012 £m £m
Portfolio return 140.9 250.6
Operating costs (23.5) (14.8)
Other net expense (0.1) (12.4)
Total return after tax 117.3 223.4
Portfolio and net assets
2013 2012 £m £m
Portfolio 2,504.2 2,246.0
Net cash and short-term deposits 449.8 589.7
Other net liabilities (5.1) (4.1)
Total net assets on a valuation basis 2,948.9 2,831.6
Total net assets increased in the year from £2,831.6m to £2,948.9m, a rise of 4% (2012: 9%).
CDC value growth (£m)
20132009 2010 2011 2012
2,39
5 2,94
9
2,68
0
2,60
8
2,83
2
2013 2012 £m £m
Portfolio at start of year 2,246.0 1,913.3
New investments 416.0 396.6
Realisations (289.3) (308.2)
Value change 131.5 244.3
Portfolio at end of year 2,504.2 2,246.0
Performance Review
Directors’ ReportsFinancial Accounts
CDC Group plc Annual Accounts 2013
3
The portfolio, which consists mostly of investments in funds managed by fund managers, increased from £2,246.0m to £2,504.2m. The increase came from net new investments and valuation gains driven by the growth of underlying companies.
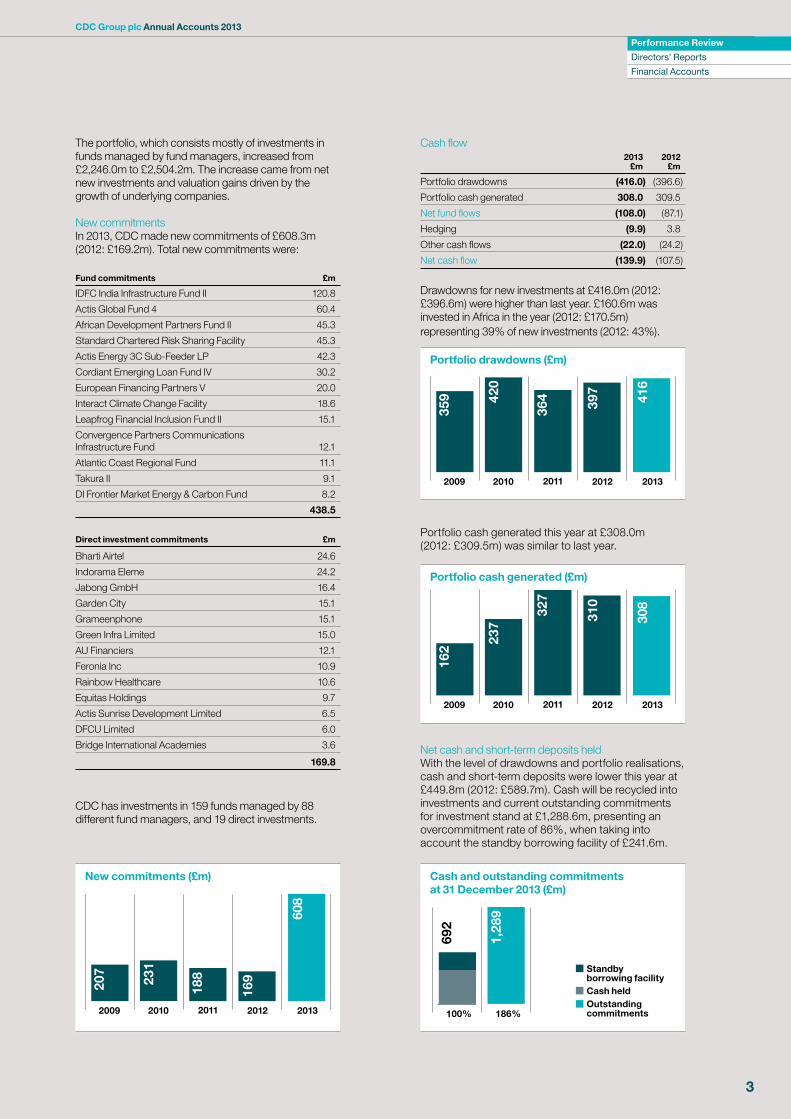
New commitmentsIn 2013, CDC made new commitments of £608.3m (2012: £169.2m). Total new commitments were: Fund commitments £m
IDFC India Infrastructure Fund II 120.8
Actis Global Fund 4 60.4
African Development Partners Fund II 45.3
Standard Chartered Risk Sharing Facility 45.3
Actis Energy 3C Sub-Feeder LP 42.3
Cordiant Emerging Loan Fund IV 30.2
European Financing Partners V 20.0
Interact Climate Change Facility 18.6
Leapfrog Financial Inclusion Fund II 15.1
Convergence Partners Communications Infrastructure Fund 12.1
Atlantic Coast Regional Fund 11.1
Takura II 9.1
DI Frontier Market Energy & Carbon Fund 8.2
438.5
Direct investment commitments £m
Bharti Airtel 24.6
Indorama Eleme 24.2
Jabong GmbH 16.4
Garden City 15.1
Grameenphone 15.1
Green Infra Limited 15.0
AU Financiers 12.1
Feronia Inc 10.9
Rainbow Healthcare 10.6
Equitas Holdings 9.7
Actis Sunrise Development Limited 6.5
DFCU Limited 6.0
Bridge International Academies 3.6
169.8
CDC has investments in 159 funds managed by 88 different fund managers, and 19 direct investments.
Cash flow 2013 2012 £m £m
Portfolio drawdowns (416.0) (396.6)
Portfolio cash generated 308.0 309.5
Net fund flows (108.0) (87.1)
Hedging (9.9) 3.8
Other cash flows (22.0) (24.2)
Net cash flow (139.9) (107.5)
Drawdowns for new investments at £416.0m (2012: £396.6m) were higher than last year. £160.6m was invested in Africa in the year (2012: £170.5m) representing 39% of new investments (2012: 43%).
Portfolio cash generated this year at £308.0m (2012: £309.5m) was similar to last year.
Net cash and short-term deposits heldWith the level of drawdowns and portfolio realisations, cash and short-term deposits were lower this year at £449.8m (2012: £589.7m). Cash will be recycled into investments and current outstanding commitments for investment stand at £1,288.6m, presenting an overcommitment rate of 86%, when taking into account the standby borrowing facility of £241.6m.
New commitments (£m)
20132009 2010 2011 2012
207
608
231
188
169
Cash and outstanding commitments at 31 December 2013 (£m)
100% 186%
692
1,28
9
Portfolio drawdowns (£m)
20132009 2010 2011 2012
359 41
6
420
364 397
Portfolio cash generated (£m)
20132009 2010 2011 2012
162
308
237
327
310
Standbyborrowing facilityCash heldOutstandingcommitments

CDC Group plc Annual Accounts 2013
4
Capital structure Since 2004, CDC has mostly invested in illiquid private equity funds and is currently funded by equity.
Cash flow forecasting CDC’s investments are long-term in nature and individual cash flows are difficult to predict. However, CDC models best estimates of the performance and future long-term cash flows of its investments which are reviewed and approved by the Board.
Risks and risk management CDC’s operations are managed within limits defined by the Board. The Board regularly reviews the overall risks inherent in CDC’s business and the actions taken to mitigate those risks where appropriate. The principal risks are considered to be as follows:
Reputational riskAs mentioned earlier, CDC expects its fund managers and underlying portfolio companies to aim for the highest levels of achievement with regard to environmental, social and governance issues. However, there inevitably remains the possibility with such a diverse investment portfolio that an incident at a fund or underlying portfolio company fails to comply with CDC’s Investment Code and CDC’s reputation is damaged. Investments are monitored twice a year and there is a more extensive evaluation of performance twice during the life of an investment to review adherence to the Investment Code, assess development impact and learn lessons for the future.
General financial risks associated with investmentCDC has invested in developing countries. Such investments are inherently risky with the potential for loss of portfolio value leading to lower cash inflows than expected. A long-term commitment is required from CDC, with no certainty of return. A wholly owned subsidiary of CDC has a committed standby borrowing facility of US$400.0m (£241.6m). At 31 December 2013, CDC had significant undrawn commitments of £1,288.6m (2012: £1,019.4m), which is normal for a fund of funds business, representing 186% of cash and borrowing facility held. The Board regularly considers cash flow forecasts at Board meetings and expects to meet its undrawn commitments, as well as commitments to future funds, from distributions received from its investments and the current cash balance held of £449.8m. However, market values have decreased as well as increased in the past. The timing of cash distributions from investments is uncertain and not within the direct control of CDC. The sale of interest in funds may require a lengthy time since there is only a limited market for secondary sales of emerging markets private equity interests. Further, sales usually require the consent of the general partner of the fund, the granting of which may be at its discretion.
A diversified portfolio of investments mitigate these risks within the policy objectives set by CDC’s shareholder. Portfolio exposure targets help to mitigate the portfolio risk. However, given CDC’s history the portfolio does remain concentrated with respect to the private equity fund manager Actis. The percentage of funds under management (CDC investment in funds plus outstanding commitments to the funds) by Actis was 39% (2012: 42%) at the end of 2013.
2
Funds under management by fund manager
1 Actis 39%
2 Abraaj 4%
3 Others 57%
2
1
23
CDC has investments in 159 private equity funds providing it with a portfolio of 1,301 underlying companies that are diversified by vintage year, size, geography and industry sector. CDC’s highest sector exposures are 25% in Infrastructure and 13% in Trade. The top 20 investments represent 41% of the portfolio with the largest individual investment representing 12%.
Underlying portfolio by sector
1 Infrastructure 25%2 Trade 13%3 Manufacturing 12%4 Financial services 11%5 Business services 10%6 Real estate 7%7 Health and education 5%8 Communications 5%9 Agribusiness 5%10 Mineral extraction 4%11 Microfinance 3%
1
2
34
5
6
7
8
910 11
Financial Performancecontinued
Performance Review
Directors’ ReportsFinancial Accounts
CDC Group plc Annual Accounts 2013
5
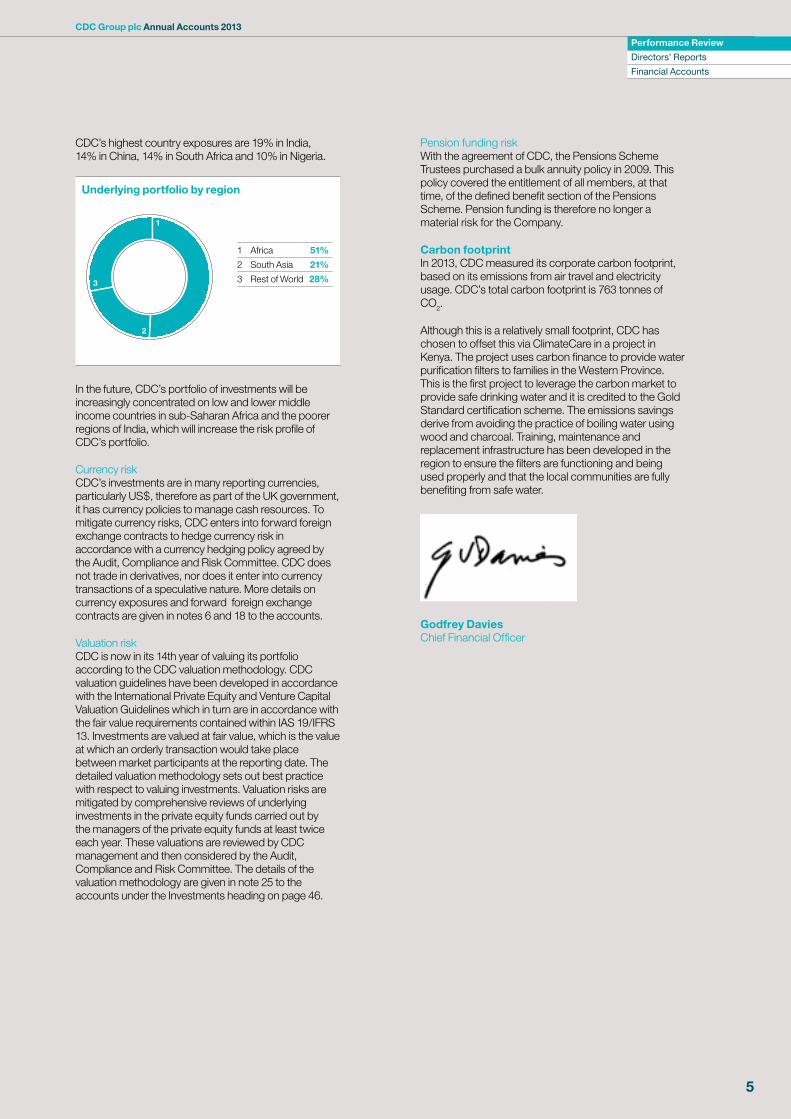
CDC’s highest country exposures are 19% in India, 14% in China, 14% in South Africa and 10% in Nigeria.
1 Africa 51%
2 South Asia 21%
3 Rest of World 28%
Underlying portfolio by region
1
3
1
2
3
In the future, CDC’s portfolio of investments will be increasingly concentrated on low and lower middle income countries in sub-Saharan Africa and the poorer regions of India, which will increase the risk profile of CDC’s portfolio.
Currency riskCDC’s investments are in many reporting currencies, particularly US$, therefore as part of the UK government, it has currency policies to manage cash resources. To mitigate currency risks, CDC enters into forward foreign exchange contracts to hedge currency risk in accordance with a currency hedging policy agreed by the Audit, Compliance and Risk Committee. CDC does not trade in derivatives, nor does it enter into currency transactions of a speculative nature. More details on currency exposures and forward foreign exchange contracts are given in notes 6 and 18 to the accounts.
Valuation riskCDC is now in its 14th year of valuing its portfolio according to the CDC valuation methodology. CDC valuation guidelines have been developed in accordance with the International Private Equity and Venture Capital Valuation Guidelines which in turn are in accordance with the fair value requirements contained within IAS 19/IFRS 13. Investments are valued at fair value, which is the value at which an orderly transaction would take place between market participants at the reporting date. The detailed valuation methodology sets out best practice with respect to valuing investments. Valuation risks are mitigated by comprehensive reviews of underlying investments in the private equity funds carried out by the managers of the private equity funds at least twice each year. These valuations are reviewed by CDC management and then considered by the Audit, Compliance and Risk Committee. The details of the valuation methodology are given in note 25 to the accounts under the Investments heading on page 46.
Pension funding riskWith the agreement of CDC, the Pensions Scheme Trustees purchased a bulk annuity policy in 2009. This policy covered the entitlement of all members, at that time, of the defined benefit section of the Pensions Scheme. Pension funding is therefore no longer a material risk for the Company.
Carbon footprint In 2013, CDC measured its corporate carbon footprint, based on its emissions from air travel and electricity usage. CDC’s total carbon footprint is 763 tonnes of CO
2.
Although this is a relatively small footprint, CDC has chosen to offset this via ClimateCare in a project in Kenya. The project uses carbon finance to provide water purification filters to families in the Western Province. This is the first project to leverage the carbon market to provide safe drinking water and it is credited to the Gold Standard certification scheme. The emissions savings derive from avoiding the practice of boiling water using wood and charcoal. Training, maintenance and replacement infrastructure has been developed in the region to ensure the filters are functioning and being used properly and that the local communities are fully benefiting from safe water.
Godfrey Davies Chief Financial Officer

CDC Group plc Annual Accounts 2013
6
Graham Wrigley Chairman
Nominations Chair, Co-Investment Chair
Appointed Chairman and Non-executive Director in December 2013
Appointed Chief Executive and Executive Director in November 2011
Appointed in May 2010
Graham previously worked in private equity where he was a founder Partner of Permira and a member of the firm’s management board as it grew into one of the leading private equity firms in the world with US$30bn under management. He stepped down from the firm in 2006 to ‘retrain’ for a new career by completing an MSC in development economics at The School of Oriental and African Studies in London. Since then he has worked in two areas of private sector development in Africa and South Asia – small and medium-sized enterprise finance and microfinance. Prior to Permira, Graham worked for Bain & Co and studied at Cambridge University. He also has an MBA from INSEAD, where is he is an adjunct professor.
Diana’s background is in private equity, venture capital and international development. She was a Partner at Schroder Ventures (now Permira) for 12 years, founder CEO of e-Ventures and founder Managing Director of Reed Elsevier Ventures. Diana joined CDC after five years with the Clinton Foundation’s Health Access Initiative where she undertook a number of roles, including EVP Operations, responsible for 43 countries and five global teams, and oversaw the scale-up of a global programme to give children equal access to HIV/AIDS care and treatment as that available to adults. She has also been an Advisor to the Supervisory Board of Actis. Diana has a first class Law degree and completed the Advanced Management Program at Harvard Business School.
Valentine is an entrepreneur in Zambia and Southern Africa, specialising in private equity and general investments. In the early part of his career, he worked at KPMG in London. Valentine was previously Chief Executive Officer at the Zambia Privatisation Agency where he was responsible for the divestiture of over 240 enterprises. He later worked for CDC in London and Lusaka as an investment executive.
He holds several other board positions in Zambia, Australia and the UK. He is currently Chairman of Zambian Breweries, MTN (Z) Limited and the Phatisa Group.
Diana Noble Chief Executive
Valentine Chitalu Non-executive Director
Audit, Compliance and Risk Chair
The terms and conditions of appointment of Non-executive Directors are available for review on CDC’s website.
Board of Directors

Performance ReviewDirectors’ Reports
Financial Accounts
CDC Group plc Annual Accounts 2013
7
Richard Gillingwater CBE ChairmanNominations Chair, Co-Investment Chair
Ian Goldin Senior Independent Director and Non-executive DirectorRemuneration Chair
Retired December 2013
Appointed in January 2010 Appointed in March 2011 Appointed in October 2004
Richard has previously held senior appointments in the City and government and was recently Dean of Cass Business School. Prior to this he was founder Chief Executive of the Shareholder Executive, the body created in September 2003 to improve the government’s performance as a shareholder in government-owned businesses.
He is currently Chairman of Henderson Group and holds Non-executive Directorships at Scottish and Southern Energy plc, Helical Bar plc and WM Morrison Supermarkets plc. He is a Senior Independent Director at Hiscox Ltd and was awarded a CBE in 2008 in recognition of his services to the financial services industry.
Ian is Director of Oxford University’s Oxford Martin School. Ian is also University Professor of Globalisation and Development and a Professorial Fellow at Oxford University’s Balliol College.
From 2001 to 2006, Ian was at the World Bank, firstly as Director of Development Policy then as a Vice President. From 1996 to 2001 he was Chief Executive of the Development Bank of Southern Africa. Previously, Ian worked at the European Bank for Reconstruction and Development as Principal Economist.
Jeremy is the Managing Partner and Co-Founder of Spencer House Partners, a firm specialising in providing advice and capital to the asset management industry. Prior to that he had a 30-year career in investment banking, first at Lazard where he ran international capital markets and then at Bear Stearns where he was Chairman of the European business.
He sits on a number of boards including that of Martin Currie (Holdings) Limited, the Edinburgh based global equities manager.
Fields is a Partner of Leaders’ Quest, which she helped establish in 2002. Leaders’ Quest is a social enterprise that works with leaders from all sectors and from around the globe. Fields is also a Non-executive Director of BNP Paribas (Paris), SCOR se, the world’s 4th largest reinsurance company, and of Ballarpur Industries, India’s largest pulp and writing paper company, where she chairs the CSR Committee. She is also an independent member of the board of the UK Ministry of Justice. Previously, she was CFO and Director of Strategy of the London Stock Exchange, where she led significant structural change in the London markets. She has served as a Non-executive Director at the UK’s Department for Business and chaired the Investment Committee advising on all government subsidies to business. Fields was awarded an OBE in 2007 in recognition of her services to international business.
Jeremy Sillem Non-executive Director
Fields Wicker-Miurin OBE Non-executive Director
Development Chair
CDC Group plc Annual Accounts 2013
8
Directors’ and Strategic Report
The Directors submit their report and the audited financial statements of CDC Group plc (CDC or the Company) and its subsidiaries (the Group) for the year ended 31 December 2013. The Directors’ Remuneration Report on pages 12 to 13 details Directors’ interests and Director and employee incentive arrangements during the year.
Principal activities and investment policy CDC is a development finance institution, which invests its capital in private sector businesses in developing countries. Its principal activity is risk capital investment. It invests directly in companies through debt and equity instruments. It also invests in companies indirectly through investment funds and other investment vehicles managed by third party investment fund managers.
Strategic reviewThe information that fulfils the requirements of the Strategic Review may be found in the Performance Review on pages 1 to 5, which is incorporated into this report by reference.
Responsible investmentCDC’s investments are underpinned by a firm commitment to responsible investment and evolving international investment best practice. CDC’s Code of Responsible Investing (formerly, CDC’s Investment Code) includes procedures to ensure that business integrity, environmental, health and safety and social issues are assessed as key components of the Company’s investment and monitoring processes. The Company requires its fund managers to ensure that the portfolio companies in which its capital is invested are themselves committed to international investment best practice in these areas and that any shortfalls are addressed through effective action plans.
Developing countries remain characterised by poor labour standards, inadequate environmental protection and weak corporate governance. Employee representation and legislation may be weak or poorly enforced. In addition, pressure to strengthen regulation and improve performance in these areas may not be as strong as in more developed countries.
CDC seeks to apply principles of responsible investment when it invests directly and requires its fund managers to encourage their portfolio companies to adopt higher standards when it invests indirectly.
Financial statementsBasis of preparationThe audited financial statements of the Group are prepared in accordance with applicable law and International Financial Reporting Standards (IFRS) as adopted by the European Union.
Profit from continuing operationsThe profit from continuing operations before tax of £129.7m compares with a profit of £232.6m for 2012; mainly due to reduced fair value gains.
Changes in equityThe profit for the year attributable to the equity holders of CDC was £131.7m (2012: profit of £238.3m). Comprehensive income for the year attributable to the equity holders of CDC was £123.3m (2012: £228.8m).
Cash flowsCash flows from operating activities were an inflow of £27.8m (2012: outflow of £32.0m).
Statement of financial positionTotal equity has increased from £2,828.0m to £2,948.9m.
PensionsCDC operates a single pension scheme in the United Kingdom. The defined benefits section of this scheme has been closed to new entrants since 1 April 2000. CDC makes contributions to the defined benefits section in accordance with an agreed schedule of contributions. CDC has adopted International Accounting Standard 19 (revised), which shows a net pension deficit of £3.4m (2012: £2.2m). Further details are shown in note 17 to the audited financial statements.
Dividend recommendedThe Directors do not recommend payment of a dividend for the year (2012: nil).
Regulation CDC is authorised and regulated by the Financial Conduct Authority under the Financial Services and Markets Act 2000. Where applicable, certain Group subsidiaries’ businesses outside the United Kingdom are regulated by local authorities.
Directors Financial statementsThe Statement of Directors’ Responsibilities is shown separately.
CDC’s objectives, business activities, performance, financial position, cash flows and liquidity position are described in the Performance Review on pages 1 to 5.
In addition, note 19 to the financial statements includes the Group’s policies and processes for managing its financial risk, details of its financial instruments and hedging activities and its exposures to credit and liquidity risk. The Directors believe that the Group is well placed to manage its business risks successfully.
After making enquiries, the Directors have a reasonable expectation that the Company and the Group have adequate resources to continue in operational existence for the foreseeable future. Accordingly, they continue to adopt the going concern basis in preparing the Company and Group financial statements.
Disclosure of information to auditorSo far as each Director is aware at the date of approval of this report, there is no relevant audit information of which the Company’s auditor is unaware and each Director confirms that he or she has taken all the steps that he or she ought to have taken as a Director in order to make himself or herself aware of any relevant audit information and to establish that the Company’s auditor is aware of that information.
Performance ReviewDirectors’ Reports
Financial Accounts
CDC Group plc Annual Accounts 2013
9
Role of Chairman and Chief ExecutiveThere is a clear division of responsibility and authority between the Chairman and the Chief Executive. The Chairman is responsible for leading the Board in determining CDC’s strategy and objectives, but does not participate in the management of the Company. The Chief Executive is responsible for the management of the Company on a day-to-day basis and is accountable to the Board as such.
Role of the Board and processesThe role of the Board is to:
i. determine the direction and strategy of CDC in accordance with the Company’s investment policy;
ii. monitor the achievement of the Company’s business objectives;
iii. ensure that the Company’s responsibilities to its shareholder are met;
iv. ensure that risks are identified and controls are in place; and
v. ensure that the Company’s employees apply appropriate ethical standards in the performance of their duties in accordance with CDC’s Code of Responsible Investing.
Certain matters are reserved for Board approval or decision and there is a clear delegation of authority to the Chief Executive and other senior executives within the Company for other specific matters.
Board membership The Board structure ensures that no single individual or group dominates. CDC has procedures for planning, investing, reporting and measuring performance. The Company’s articles of association provide that one third of the Directors retire by rotation at each annual general meeting. The Directors retiring by rotation at the forthcoming annual general meeting are Graham Wrigley, Ian Goldin, Jeremy Sillemand Diana Noble. Being eligible, Graham Wrigley, Ian Goldin and Diana Noble offer themselves for re-election.
The Board met six times during 2013. It also visited Nigeria for a week in 2013, meeting state government officials and fund managers. The Chairman and the Chief Executive agree the agenda for Board meetings, but all Board members are entitled to raise other issues. The Chairman ensures that the Board is properly briefed on all issues arising at its meetings. The Chief Executive supplies the Board with information which is timely and of a quality that enables it to carry out its duties. Training, where appropriate, is provided to the Board and employees. All Directors have access to the advice and services of the General Counsel and Company Secretary and they may obtain independent professional advice at CDC’s expense, if required. All Board and Committee meetings are appropriately minuted.
The Non-executive Directors are regarded as independent and are from varied business and other backgrounds. The UK Department for International Development (DFID) has appointed two of the Company’s Non-executive Directors (one of whom is its senior independent director) who are deemed to be independent. The Non-executive Directors exercise judgement and carry substantial weight in Board decisions. They contribute to strategy and policy formation and monitor CDC’s financial and managerial performance.
The Company’s articles of association permit the Board to grant indemnities to the Directors in relation to their duties as directors. Such indemnities are in respect of liabilities incurred by a Director in connection with any negligence, default, breach of duty or breach of trust in relation to the Company unless the Director is ultimately held to be at fault. In line with market practice, each Director benefits from an indemnity which includes provisions in relation to duties as a Director of the Company or an associated company and protection against derivative actions.
Board directors The table below indicates attendance of all the Directors, whose biographies are on pages 6 to 7, during the year ended 31 December 2013:
Number of meetings during the year 6Richard Gillingwater CBE (Chair to 4 December) 6Diana Noble 6Fields Wicker-Miurin OBE 6Ian Goldin 6Jeremy Sillem 6Valentine Chitalu 6Graham Wrigley (Chair from 4 December) 1
Richard Gillingwater held five directorships during 2013 excluding his CDC directorship. The Board considers that he had sufficient time to undertake his duties at CDC. Richard Gillingwater stepped down from the Board on 4 December 2013 with Graham Wrigley becoming Chairman with effect from that date.
An internal evaluation of Board and Committee performance has been carried out by Graham Wrigley and reported to and considered by the Board.
Board committees The Board has five principal committees to assist it in fulfilling its responsibilities. The terms of reference of all Board Committees are available for inspection on CDC’s website.
Audit, Compliance and RiskThe table below indicates the members and their attendance at scheduled meetings during the year. The quorum is two members. The Chief Executive, the Chief Operating Officer and the Chief Financial Officer attend by invitation.
Number of meetings during the year 4Valentine Chitalu (Chair) 4Fields Wicker-Miurin OBE 4Jeremy Sillem 3Richard Gillingwater CBE 4Graham Wrigley 1
CDC Group plc Annual Accounts 2013
10
Directors’ and Strategic Reportcontinued
The Audit, Compliance and Risk Committee’s main duties are to oversee the affairs of CDC, in particular to review the financial statements; review the findings of the external auditor; review the independence of the external auditor; direct the internal audit programme; monitor the management accounting and valuations procedures and policies; investigate any irregularities; oversee the Company’s regulated activities and compliance function; and monitor the Company’s risk management function.
The Audit, Compliance and Risk Committee also reviews CDC’s system of internal control, further details of which are set out below. It also oversees changes in the Company’s external auditor in accordance with best practice. It has satisfied itself as to the independence of the external auditor. In doing so, it considered the following factors, having regard to the views of management, internal audit and the external auditor:
i. the external auditor’s procedures in place for maintaining and monitoring independence, including those to ensure that the partners and staff have no personal or business relationships with the Company, other than those in the normal course of business permitted by ethical guidance in the United Kingdom;
ii. the external auditor’s policies for the rotation of the lead partner and key audit personnel; and
iii. adherence by management and the external auditor during the year to the Group’s policies for the procurement of non-audit services and the employment of former audit staff.
The Audit, Compliance and Risk Committee has established policies determining the non-audit services that the external auditor can provide and the procedures required for pre-approval of any such engagement. These policies provide for the auditor to be engaged only for work that is not prohibited by professional or other regulatory requirements. This essentially limits work to tax services and assurance services that are of an audit nature, but excludes internal audit services. Even where the policy allows for the external auditor to be engaged to provide non-audit services, prior approval is required from the Chief Financial Officer.
RemunerationThe table below indicates the members and their attendance at scheduled meetings during the year. The quorum is two members. The Chief Executive attended all meetings by invitation.
Number of meetings during the year 2Ian Goldin (Chair) 2Fields Wicker-Miurin OBE 2Jeremy Sillem 2Richard Gillingwater CBE 2Graham Wrigley 1
The Remuneration Committee’s remit includes determining remuneration packages for the Chief Executive and senior management and making recommendations to the Board on the Company’s policy on executive remuneration. Details are set out in the Directors’ Remuneration Report on pages 12 to 13.
DevelopmentThe table below indicates the members and their attendance at scheduled meetings during the year. The quorum is two members, which must include those nominated by DFID. The Chief Executive attended all meetings by invitation. The Chief Operating Officer also attends by invitation.
Number of meetings during the year 6Fields Wicker-Miurin OBE (Chair) 5Ian Goldin 5Richard Gillingwater CBE 5Valentine Chitalu 6Jeremy Sillem 4Graham Wrigley 1
The Development Committee reviews the impact of CDC’s investments with oversight of the application of CDC’s Code of Responsible Investing. Specific responsibilities include reviewing investment evaluations and operational updates relating to ESG and Development Impact. The Committee delivers insights and recommendations to the internal teams, aiding CDC’s drive to ensure that those with whom CDC deals adhere to best practice environmental, social and governance standards.
NominationsThe table below indicates the members and their attendance at scheduled meetings during the year. The Nominations Committee meets as required, with a quorum of two members who are Non-executive Directors. Its remit includes appointing new Board members and reviewing the Board’s independence, structure, size and composition. It also considers Board refreshment and succession planning (having regard to the rights of the Secretary of State for International Development as holder of a special share in the Company).
Number of meetings during the year 3Richard Gillingwater CBE (Chair) 3Diana Noble 3Fields Wicker-Miurin OBE 3Ian Goldin 3Jeremy Sillem 3Valentine Chitalu 3Graham Wrigley 1
Investment CommitteesThe Board has delegated certain of its investment decision making powers to the Chief Executive acting through the Company’s investment committees. The Company now has seven investment committees, namely Funds Africa, Funds Asia, Direct Equity Africa, Direct Equity Asia, Credit Africa, Credit Asia and Impact.
The membership of the investment committees includes independent members, certain Non-executive Directors and members of senior executive management. Individuals who performed this role in 2013 include Valentine Chitalu, Jeremy Sillem, Donald Peck, Graham Wrigley, Nicholas Rouse and Zarir Cama.
Directors’ conflicts of interest Directors have a statutory duty to avoid conflicts of interest with the Company. The Company has processes to disclose and identify potential and actual conflicts of interest. Such conflicts are then considered for approval by the Board, subject, if necessary, to appropriate conditions.
Performance ReviewDirectors’ Reports
Financial Accounts
CDC Group plc Annual Accounts 2013
11
General counsel and company secretaryThe Directors have access to the advice and services of the General Counsel and Company Secretary, who is responsible for advising the Board on corporate governance and secretarial matters through the Chairman.
Internal control The Board is ultimately responsible for the Group’s internal control system and for reviewing its effectiveness. The design and operation of the system is delegated to the executive management team. Its effectiveness is regularly reviewed by the Audit, Compliance and Risk Committee. CDC’s internal control system provides the Board with reasonable assurance that potential problems will typically be prevented or detected early with appropriate action taken. Material breaches are reported to the Audit, Compliance and Risk Committee and are properly actioned. As with any system of internal control, CDC’s system is designed to manage, rather than eliminate, the risk of failure and therefore cannot provide absolute assurance against material misstatement or loss.
The Audit, Compliance and Risk Committee reviews the effectiveness of the Group’s internal controls. The key elements of the system include:
i. detailed business planning and control systems, including annual budgeting, business planning and quarterly reporting against financial and business targets;
ii. regular reviews by the Chief Executive of corporate strategies, best practice principles and commercial objectives;
iii. appropriate management authorisation, approval and control levels, from the Chief Executive downwards. The Board must specifically approve transactions above these levels; and
iv. a regular portfolio valuation process.
The most material financial risk to CDC is a significant reduction in the value of its portfolio and any subsequent impact on cash flows. This can be affected considerably by external factors beyond CDC’s control. However, the Board is satisfied that the valuation process, described in note 25 to the financial statements, is rigorous and effective. It is also satisfied that CDC has robust cash forecasting and management techniques. CDC has an internal audit function, which operates to a programme approved by the Audit, Compliance and Risk Committee. CDC’s executive management team operates a continuous process, agreed with the Audit, Compliance and Risk Committee, of identifying, evaluating and managing any significant risk, financial or non-financial, faced by the Company. This process also ensures that appropriate internal control mechanisms are in place. The team provides regular reports to the Audit, Compliance and Risk Committee.
Ownership The Secretary of State for International Development holds 765,036,042 ordinary shares of £1 each and one special rights redeemable preference share of £1 in the capital of the Company. The remaining one issued ordinary share of £1 is held by the Solicitor for the Affairs of Her Majesty’s Treasury.
Auditor In accordance with Section 489 of the Companies Act 2006, a resolution proposing the reappointment of KPMG LLP as the Company’s auditor will be put to members at the forthcoming annual general meeting.
The auditor was commissioned to undertake non-audit work during the year. This was within the Group policy for non-audit work by the auditor and did not affect the objectivity and independence of the auditor.
Employees CDC’s policy on employment is one of equal opportunity in the recruitment, training, career development and promotion of employees, whether disabled or otherwise. Formal employee appraisals and informal discussions are CDC’s principal means of updating itself on the views and opinions of its employees. In addition, CDC’s managers are responsible for keeping their employees up to date with developments and performance of the business, which is achieved by way of regularly scheduled meetings.
Website The maintenance and integrity of CDC’s website is the responsibility of the Directors. The work carried out by the auditor does not involve consideration of these matters and, accordingly, the auditor accepts no responsibility for any changes that may have occurred to the financial statements since they were initially presented on the website. Legislation in the United Kingdom governing the preparation and dissemination of financial statements may differ from legislation in other jurisdictions.
By order of the Board
Mark Kenderdine-DaviesGeneral Counsel and Company SecretaryCDC Group plcOn behalf of the Board of Directors26 March 2014Registered in England No. 3877777
CDC Group plc Annual Accounts 2013
12
Directors’ Remuneration Report
Remuneration framework Base salaryIndividual base salaries reflect the job responsibilities, as well as experience and skills of each individual and are benchmarked to the comparator group. The comparator group for benchmarking purposes will be based on Development Finance Institutions.
Annual increases to base salaries will be considered by the Remuneration Committee having regard to the change in Consumer Price Index (CPI) and other economic factors. In this respect, the annual increase in January 2014 was 2.2% which was the CPI for the year to October 2013.
Annual personal performance plan (APPP)Every employee in CDC, with the exception of the CEO, will qualify for an APPP award, subject to the achievement of annual individual and team objectives. Following discussions with DFID and the Secretary of State during 2013, it was agreed that payments to staff will average 15% over a five year period, commencing in 2013.
Long term development performance plan (LTDPP)Senior CDC staff will qualify for an LTDPP, capped relative to an individual’s salary and determined on tenure and development outcome. The CEO’s LTDPP will be capped at £40,000 p.a. Payment of the LTDPP pool will be closely linked to the development impact potential and, over time, actual performance of CDC’s portfolio.
No payments were made in the current year relating to the previous long-term incentive plan which terminated on 31 December 2013.
Benefits Benefits offered to all staff including Executive Directors:
— life assurance cover, which will pay a lump sum equivalent to either four times base salary in the event of death, plus a dependent pension of 30% of salary, or eight times base salary with no dependent pension;
— permanent health insurance, which provides cover in the event that they are unable, through ill health, to continue to work for the Company;
— private medical insurance, which can include cover for family members; and
— medical check-ups for all staff that frequently travel overseas on business.
Pension arrangements Diana Noble is eligible for contributions at the rate of 22.5% of base salary into a pension plan of her choice. Details of her pension contributions are disclosed on page 13.
Remuneration committee CDC’s Remuneration Committee during 2013 comprised Ian Goldin (Chair), Fields Wicker-Miurin, Richard Gillingwater and Jeremy Sillem. Graham Wrigley attended Remuneration Committee meetings held in December, prior to his formal appointment in January 2014.
Service agreements Diana Noble has a service agreement which is terminable on both sides by 12 months’ notice. Diana Noble will receive a salary of £262,400 for 2014 (2013: £256,750). She will not participate in the APPP but will be entitled to participate in CDC’s LTDPP subject to the cap mentioned above.
The Non-executive Directors have letters of appointment. The appointments of Non-executive Directors are fixed for three-year terms from the effective date of appointment, renewable for further three-year terms at the election of CDC and each Non-executive Director will be subject to re-election at an annual general meeting in accordance with the provisions for retirement of Directors by rotation contained in CDC’s Articles of Association. Richard Gillingwater’s term of office expired on 31 December 2013 and Graham Wrigley was appointed as Chairman with effect from 4 December 2013.
The remuneration of the Non-executive Directors takes the form of fees which have been agreed with DFID. The basic fee for all current Non-executive Directors (except for the Chairman) is £22,000 per annum (2012: £22,000).
The outgoing Chairman, Richard Gillingwater, received a basic fee of £40,000 per annum during 2013 (2012: £40,000). The new Chairman, Graham Wrigley, will receive a basic fee of £35,000 per annum. Current
Non-executive Directors, except the Chairman, received an additional £2,000 per annum (2012: £2,000) for each committee membership and £4,000 per annum (2012: £4,000) for each committee they chair.
In addition, Valentine Chitalu received £15,000 per annum for being Chair of the Direct Equity Investment Committee for Africa and Jeremy Sillem received £15,000 per annum for being Deputy Chair of the Direct Equity Investment Committee for Africa and Asia. Graham Wrigley received a fee of £15,000 per annum for advising both of these Committees. This payment ceased with effect from 4 December, on his appointment to the role of Chairman of CDC.
The Board are currently reviewing the interaction between investment committees and the Board to improve processes. The fees paid to Non-executive Directors in 2013 are set out in the table below. The Non-executive Directors do not participate in any of the incentive or benefit schemes of the Company.
Performance ReviewDirectors’ Reports
Financial Accounts
CDC Group plc Annual Accounts 2013
13
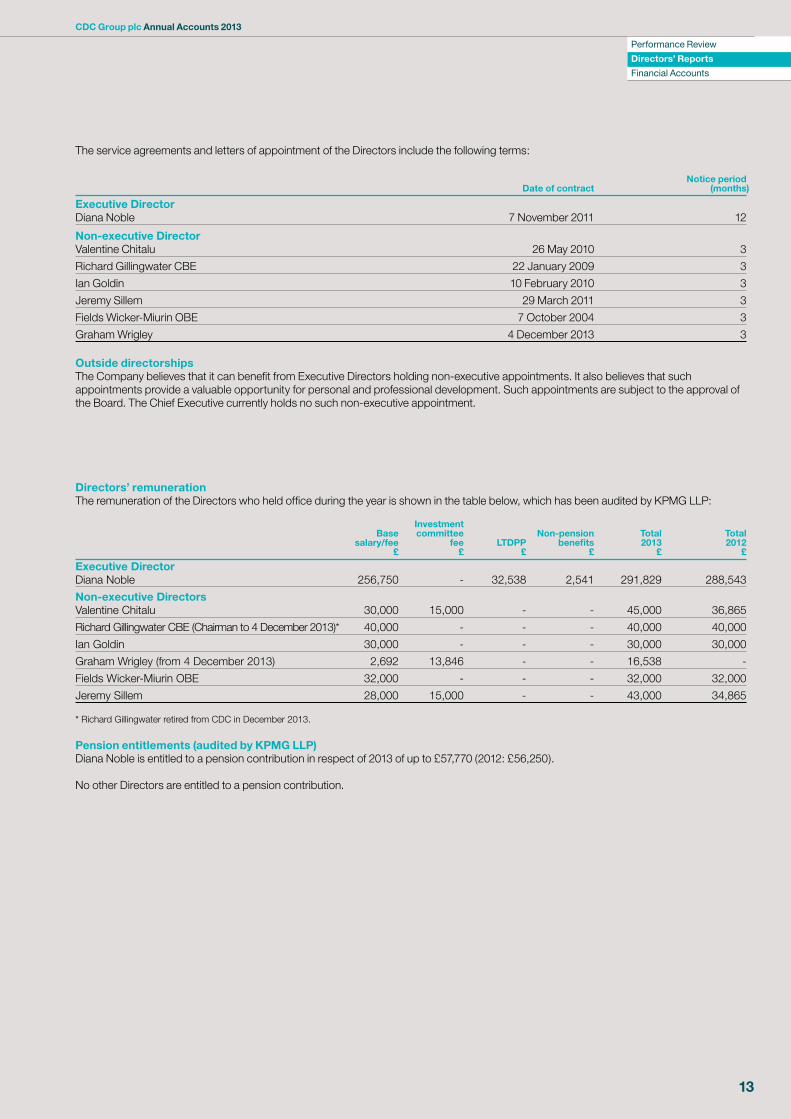
The service agreements and letters of appointment of the Directors include the following terms:
Notice period Date of contract (months)
Executive Director Diana Noble 7 November 2011 12
Non-executive Director Valentine Chitalu 26 May 2010 3
Richard Gillingwater CBE 22 January 2009 3
Ian Goldin 10 February 2010 3
Jeremy Sillem 29 March 2011 3
Fields Wicker-Miurin OBE 7 October 2004 3
Graham Wrigley 4 December 2013 3 Outside directorships The Company believes that it can benefit from Executive Directors holding non-executive appointments. It also believes that such appointments provide a valuable opportunity for personal and professional development. Such appointments are subject to the approval of the Board. The Chief Executive currently holds no such non-executive appointment.
Directors’ remuneration The remuneration of the Directors who held office during the year is shown in the table below, which has been audited by KPMG LLP:
Investment Base committee Non-pension Total Total salary/fee fee LTDPP benefits 2013 2012 £ £ £ £ £ £
Executive Director Diana Noble 256,750 - 32,538 2,541 291,829 288,543
Non-executive Directors Valentine Chitalu 30,000 15,000 - - 45,000 36,865
Richard Gillingwater CBE (Chairman to 4 December 2013)* 40,000 - - - 40,000 40,000
Ian Goldin 30,000 - - - 30,000 30,000
Graham Wrigley (from 4 December 2013) 2,692 13,846 - - 16,538 -
Fields Wicker-Miurin OBE 32,000 - - - 32,000 32,000
Jeremy Sillem 28,000 15,000 - - 43,000 34,865
* Richard Gillingwater retired from CDC in December 2013.
Pension entitlements (audited by KPMG LLP) Diana Noble is entitled to a pension contribution in respect of 2013 of up to £57,770 (2012: £56,250).
No other Directors are entitled to a pension contribution.
CDC Group plc Annual Accounts 2013
14
Statement of Directors’ Responsibilities in respect of the Annual Accounts, Directors’ and Strategic Report and the Financial Statements
The Directors are responsible for preparing the Annual Accounts, Directors’ and Strategic Report and the financial statements in accordance with applicable law and regulations.
Company law requires the Directors to prepare Group and Company financial statements for each financial year. Under that law they have elected to prepare both the Group and the Company financial statements in accordance with IFRSs as adopted by the EU and applicable law.
Under company law the Directors must not approve the financial statements unless they are satisfied that they give a true and fair view of the state of affairs of the Group and Company and of their profit or loss for that period. In preparing each of the Group and Company financial statements, the Directors are required to:
— select suitable accounting policies and then apply them consistently;
— make judgements and estimates that are reasonable and prudent;
— state whether they have been prepared in accordance with IFRSs as adopted by the EU; and
— prepare the financial statements on the going concern basis unless it is inappropriate to presume that the Group and the Company will continue in business.
The Directors are responsible for keeping adequate accounting records that are sufficient to show and explain the Company’s transactions and disclose with reasonable accuracy at any time the financial position of the Company and enable them to ensure that its financial statements comply with the Companies Act 2006. They have general responsibility for taking such steps as are reasonably open to them to safeguard the assets of the Group and the Company and to prevent and detect fraud and other irregularities.
The Directors are responsible for the maintenance and integrity of the corporate and financial information included on the Company’s website. Legislation in the UK governing the preparation and dissemination of financial statements may differ from legislation in other jurisdictions.
Performance ReviewDirectors’ ReportsFinancial Accounts
CDC Group plc Annual Accounts 2013
15
Independent Auditor’s Report to the members of CDC Group plc
We have audited the financial statements of CDC Group plc for the year ended 31 December 2013 set out on pages 16 to 48. The financial reporting framework that has been applied in their preparation is applicable law and International Financial Reporting Standards (IFRSs) as adopted by the EU and, as regards the parent company financial statements, as applied in accordance with the provisions of the Companies Act 2006.
This report is made solely to the company’s members, as a body, in accordance with Chapter 3 of Part 16 of the Companies Act 2006. Our audit work has been undertaken so that we might state to the company’s members those matters we are required to state to them in an auditor’s report and for no other purpose. To the fullest extent permitted by law, we do not accept or assume responsibility to anyone other than the company and the company’s members, as a body, for our audit work, for this report, or for the opinions we have formed.
Respective responsibilities of directors and auditor As explained more fully in the Directors’ Responsibilities Statement set out on page 14, the directors are responsible for the preparation of the financial statements and for being satisfied that they give a true and fair view. Our responsibility is to audit, and express an opinion on, the financial statements in accordance with applicable law and International Standards on Auditing (UK and Ireland). Those standards require us to comply with the Auditing Practices Board’s Ethical Standards for Auditors. Scope of the audit of the financial statements A description of the scope of an audit of financial statements is provided on the Financial Reporting Council’s website at www.frc.org.uk/auditscopeukprivate.
Opinion on financial statements In our opinion:
— the financial statements give a true and fair view of the state of the group’s and of the parent company’s affairs as at 31 December 2013 and of the group’s profit for the year then ended;
— the group financial statements have been properly prepared in accordance with IFRSs as adopted by the EU;
— the parent company financial statements have been properly prepared in accordance with IFRSs as adopted by the EU and as applied in accordance with the provisions of the Companies Act 2006; and
— the financial statements have been prepared in accordance with the requirements of the Companies Act 2006.
Opinion on other matter prescribed by the Companies Act 2006 In our opinion the information given in the Directors’ and Strategic Report for the financial year for which the financial statements are prepared is consistent with the financial statements.
Matters on which we are required to report by exception We have nothing to report in respect of the following matters where the Companies Act 2006 requires us to report to you if, in our opinion:
— adequate accounting records have not been kept by the parent company, or returns adequate for our audit have not been received from branches not visited by us; or
— the parent company financial statements are not in agreement with the accounting records and returns; or
— certain disclosures of directors’ remuneration specified by law are not made; or
— we have not received all the information and explanations we require for our audit.
Lord Rockley(Senior Statutory Auditor) for and on behalf of KPMG LLP, Statutory Auditor Chartered Accountants 8 Salisbury SquareLondonEC4Y 8BB26 March 2014
CDC Group plc Annual Accounts 2013
16
Consolidated Statement of Financial PositionAt 31 December
Notes2013
£m2012
£m
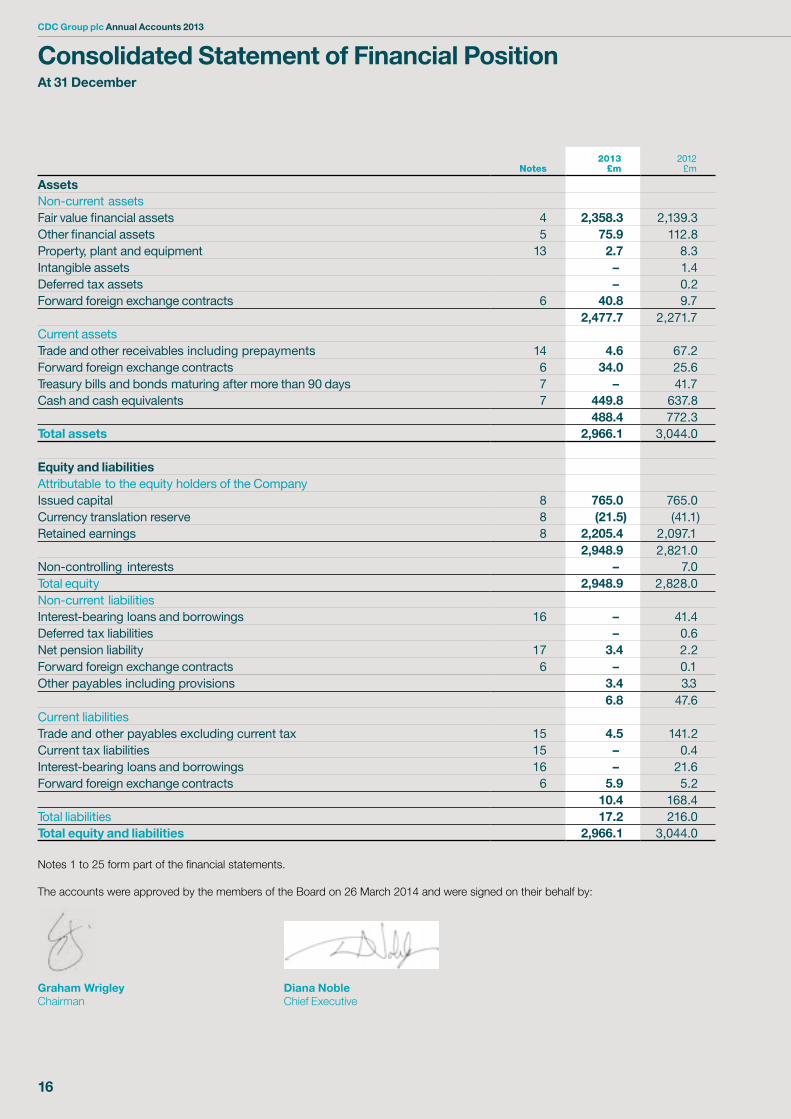
AssetsNon-current assetsFair value financial assets 4 2,358.3 2,139.3Other financial assets 5 75.9 112.8Property, plant and equipment 13 2.7 8.3Intangible assets – 1.4Deferred tax assets – 0.2Forward foreign exchange contracts 6 40.8 9.7
2,477.7 2,271.7Current assetsTrade and other receivables including prepayments 14 4.6 67.2Forward foreign exchange contracts 6 34.0 25.6Treasury bills and bonds maturing after more than 90 days 7 – 41.7Cash and cash equivalents 7 449.8 637.8
488.4 772.3Total assets 2,966.1 3,044.0
Equity and liabilitiesAttributable to the equity holders of the CompanyIssued capital 8 765.0 765.0Currency translation reserve 8 (21.5) (41.1)Retained earnings 8 2,205.4 2,097.1
2,948.9 2,821.0Non-controlling interests – 7.0Total equity 2,948.9 2,828.0Non-current liabilitiesInterest-bearing loans and borrowings 16 – 41.4Deferred tax liabilities – 0.6Net pension liability 17 3.4 2.2Forward foreign exchange contracts 6 – 0.1Other payables including provisions 3.4 3.3
6.8 47.6Current liabilitiesTrade and other payables excluding current tax 15 4.5 141.2Current tax liabilities 15 – 0.4Interest-bearing loans and borrowings 16 – 21.6Forward foreign exchange contracts 6 5.9 5.2
10.4 168.4Total liabilities 17.2 216.0Total equity and liabilities 2,966.1 3,044.0
Notes 1 to 25 form part of the financial statements.
The accounts were approved by the members of the Board on 26 March 2014 and were signed on their behalf by:
Graham Wrigley Diana NobleChairman Chief Executive
Performance Review
Directors’ Reports
Financial Accounts
CDC Group plc Annual Accounts 2013
17
Consolidated Statement of Comprehensive IncomeFor the 12 months to 31 December
Notes
2013
Total£m
2012restated
Total£m
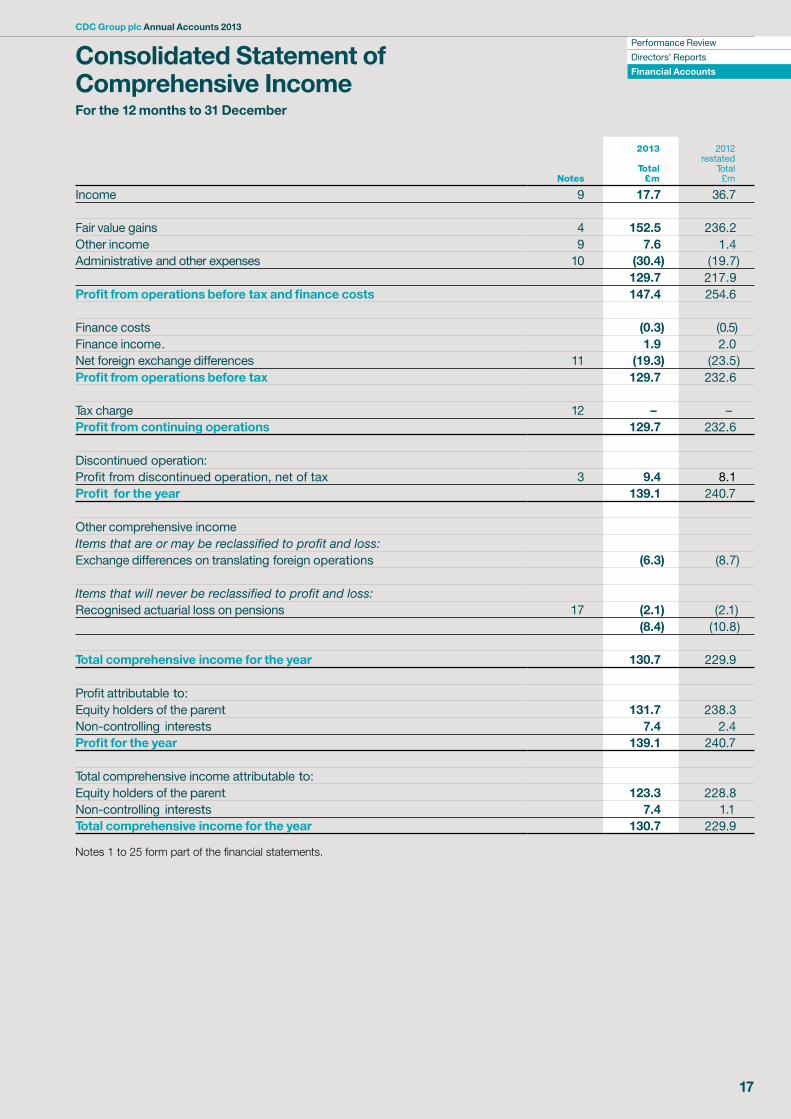
Income 9 17.7 36.7
Fair value gains 4 152.5 236.2Other income 9 7.6 1.4Administrative and other expenses 10 (30.4) (19.7)
129.7 217.9Profit from operations before tax and finance costs 147.4 254.6
Finance costs (0.3) (0.5)Finance income . 1.9 2.0Net foreign exchange differences 11 (19.3) (23.5)Profit from operations before tax 129.7 232.6
Tax charge 12 – –Profit from continuing operations 129.7 232.6
Discontinued operation:Profit from discontinued operation, net of tax 3 9.4 8.1Profit for the year 139.1 240.7
Other comprehensive incomeItems that are or may be reclassified to profit and loss:Exchange differences on translating foreign operations (6.3) (8.7)
Items that will never be reclassified to profit and loss:Recognised actuarial loss on pensions 17 (2.1) (2.1)
(8.4) (10.8)
Total comprehensive income for the year 130.7 229.9
Profit attributable to:Equity holders of the parent 131.7 238.3Non-controlling interests 7.4 2.4Profit for the year 139.1 240.7
Total comprehensive income attributable to:Equity holders of the parent 123.3 228.8Non-controlling interests 7.4 1.1Total comprehensive income for the year 130.7 229.9
Notes 1 to 25 form part of the financial statements.
CDC Group plc Annual Accounts 2013
18
Consolidated Statement of Cash FlowsFor the 12 months to 31 December
Notes2013
£m2012
£m
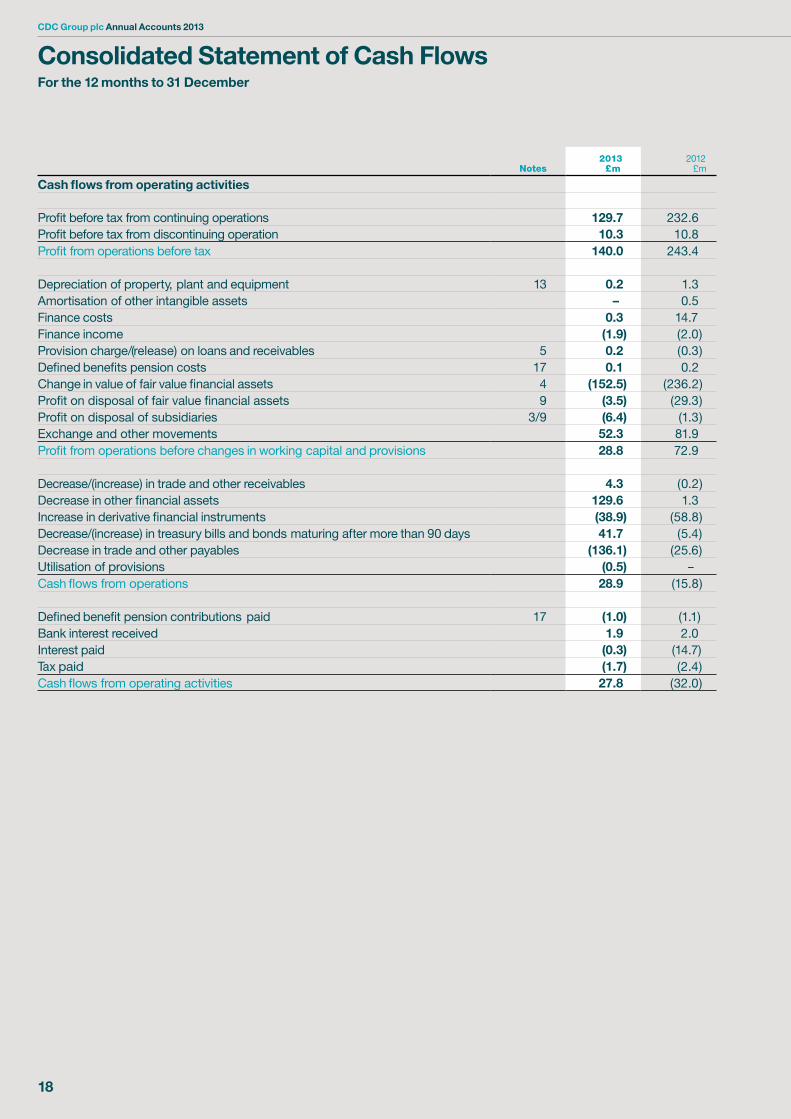
Cash flows from operating activities
Profit before tax from continuing operations 129.7 232.6Profit before tax from discontinuing operation 10.3 10.8Profit from operations before tax 140.0 243.4
Depreciation of property, plant and equipment 13 0.2 1.3Amortisation of other intangible assets – 0.5Finance costs 0.3 14.7Finance income (1.9) (2.0)Provision charge/(release) on loans and receivables 5 0.2 (0.3)Defined benefits pension costs 17 0.1 0.2Change in value of fair value financial assets 4 (152.5) (236.2)Profit on disposal of fair value financial assets 9 (3.5) (29.3)Profit on disposal of subsidiaries 3/9 (6.4) (1.3)Exchange and other movements 52.3 81.9Profit from operations before changes in working capital and provisions 28.8 72.9
Decrease/(increase) in trade and other receivables 4.3 (0.2)Decrease in other financial assets 129.6 1.3Increase in derivative financial instruments (38.9) (58.8)Decrease/(increase) in treasury bills and bonds maturing after more than 90 days 41.7 (5.4)Decrease in trade and other payables (136.1) (25.6)Utilisation of provisions (0.5) –Cash flows from operations 28.9 (15.8)
Defined benefit pension contributions paid 17 (1.0) (1.1)Bank interest received 1.9 2.0Interest paid (0.3) (14.7)Tax paid (1.7) (2.4)Cash flows from operating activities 27.8 (32.0)
Performance Review
Directors’ Reports
Financial Accounts
CDC Group plc Annual Accounts 2013
19
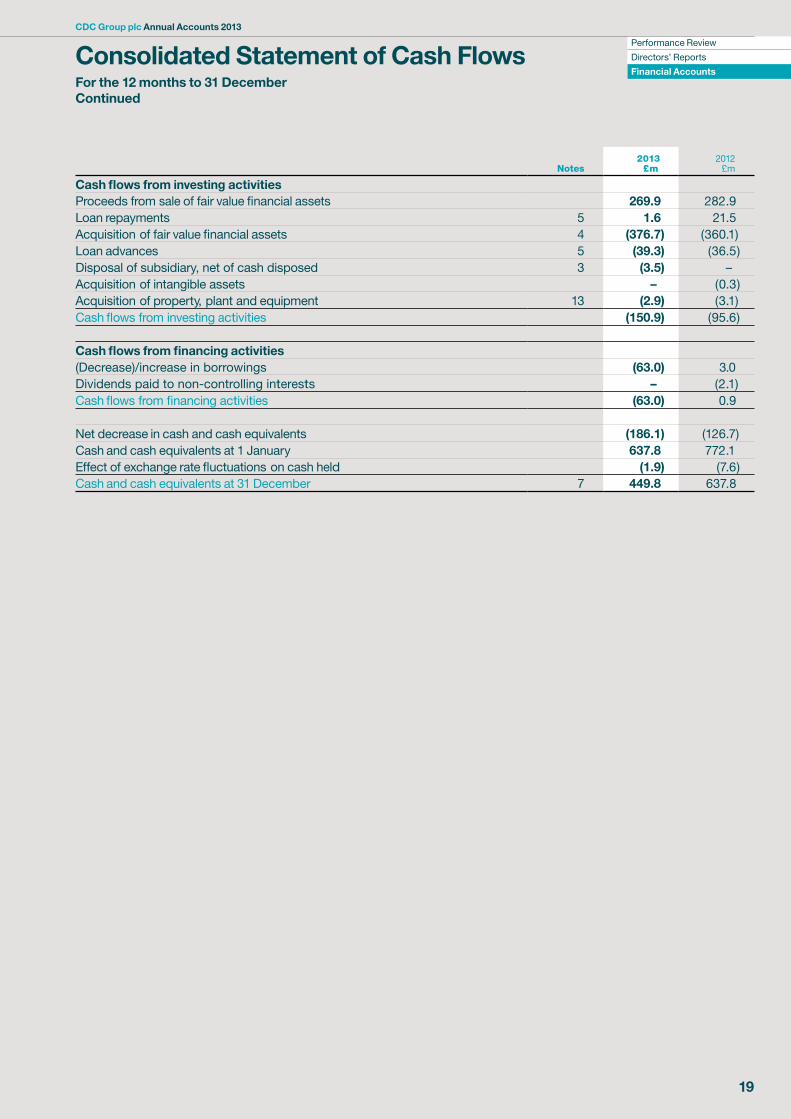
Consolidated Statement of Cash FlowsFor the 12 months to 31 DecemberContinued
Notes2013
£m2012
£m
Cash flows from investing activitiesProceeds from sale of fair value financial assets 269.9 282.9Loan repayments 5 1.6 21.5Acquisition of fair value financial assets 4 (376.7) (360.1)Loan advances 5 (39.3) (36.5)Disposal of subsidiary, net of cash disposed 3 (3.5) –Acquisition of intangible assets – (0.3)Acquisition of property, plant and equipment 13 (2.9) (3.1)Cash flows from investing activities (150.9) (95.6)
Cash flows from financing activities(Decrease)/increase in borrowings (63.0) 3.0Dividends paid to non-controlling interests – (2.1)Cash flows from financing activities (63.0) 0.9
Net decrease in cash and cash equivalents (186.1) (126.7)Cash and cash equivalents at 1 January 637.8 772.1Effect of exchange rate fluctuations on cash held (1.9) (7.6)Cash and cash equivalents at 31 December 7 449.8 637.8
CDC Group plc Annual Accounts 2013
20
Consolidated Statement of Changes in Equity
Company Statement of Changes in Equity
Attributable to equity holders of the Company
Share capital
£m
Currency translation
reserve£m
Retained earnings
£mTotal
£m
Non- controlling
interests£m
Total equity
£m
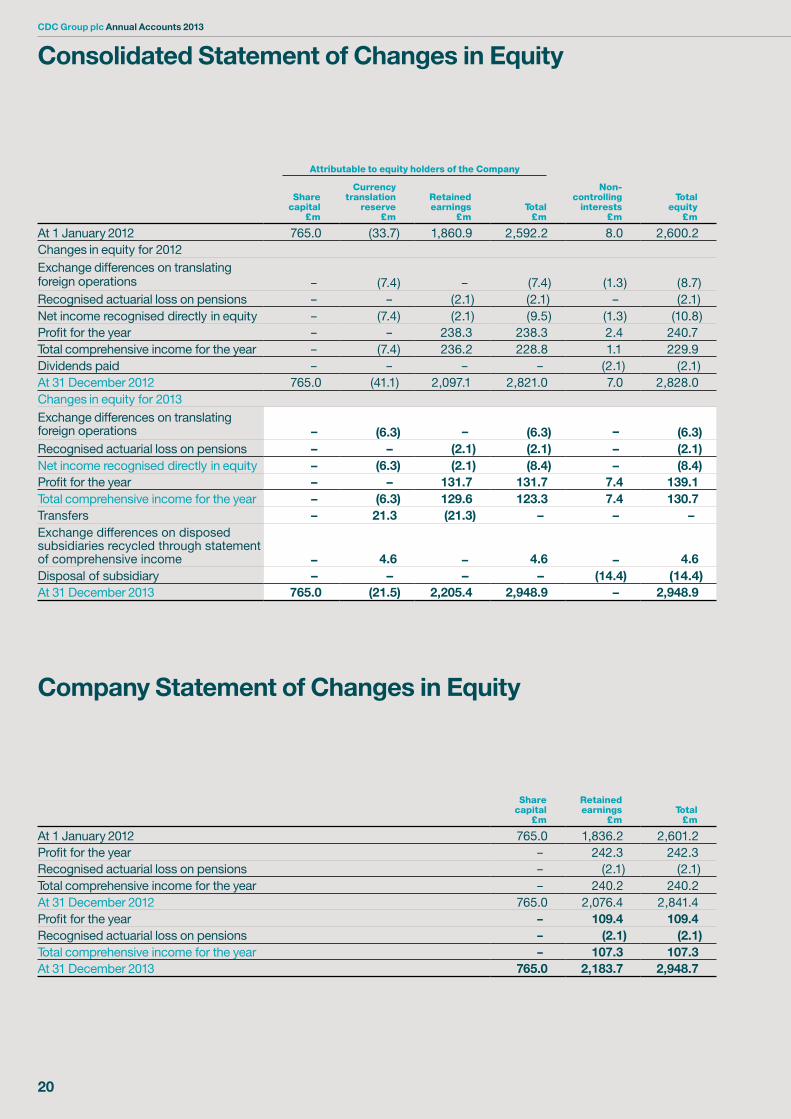
At 1 January 2012 765.0 (33.7) 1,860.9 2,592.2 8.0 2,600.2Changes in equity for 2012Exchange differences on translating foreign operations – (7.4) – (7.4) (1.3) (8.7)Recognised actuarial loss on pensions – – (2.1) (2.1) – (2.1)Net income recognised directly in equity – (7.4) (2.1) (9.5) (1.3) (10.8)Profit for the year – – 238.3 238.3 2.4 240.7Total comprehensive income for the year – (7.4) 236.2 228.8 1.1 229.9Dividends paid – – – – (2.1) (2.1)At 31 December 2012 765.0 (41.1) 2,097.1 2,821.0 7.0 2,828.0Changes in equity for 2013Exchange differences on translating foreign operations – (6.3) – (6.3) – (6.3)Recognised actuarial loss on pensions – – (2.1) (2.1) – (2.1)Net income recognised directly in equity – (6.3) (2.1) (8.4) – (8.4)Profit for the year – – 131.7 131.7 7.4 139.1Total comprehensive income for the year – (6.3) 129.6 123.3 7.4 130.7Transfers – 21.3 (21.3) – – –Exchange differences on disposed subsidiaries recycled through statement of comprehensive income
–
4.6
–
4.6
–
4.6Disposal of subsidiary – – – – (14.4) (14.4)At 31 December 2013 765.0 (21.5) 2,205.4 2,948.9 – 2,948.9
Share capital
£m
Retained earnings
£mTotal
£m
At 1 January 2012 765.0 1,836.2 2,601.2Profit for the year – 242.3 242.3Recognised actuarial loss on pensions – (2.1) (2.1)Total comprehensive income for the year – 240.2 240.2At 31 December 2012 765.0 2,076.4 2,841.4Profit for the year – 109.4 109.4Recognised actuarial loss on pensions – (2.1) (2.1)Total comprehensive income for the year – 107.3 107.3At 31 December 2013 765.0 2,183.7 2,948.7

Performance Review
Directors’ Reports
Financial Accounts
CDC Group plc Annual Accounts 2013
21
Notes 2013
£m 2012
£m
AssetsNon-current assetsFair value financial assets 4 1,640.8 1,477.0Other financial assets 5 831.8 759.4Plant and equipment 13 2.7 –Forward foreign exchange contracts 6 41.1 9.7
2,516.4 2,246.1Current assetsTrade and other receivables including prepayments 14 21.8 21.4Forward foreign exchange contracts 6 34.0 25.6Cash and cash equivalents 7 406.7 587.4
462.5 634.4Total assets 2,978.9 2,880.5
Equity and liabilitiesIssued capital 8 765.0 765.0Retained earnings 8 2,183.7 2,076.4Total equity 2,948.7 2,841.4Non-current liabilitiesNet pension liability 17 3.4 2.2Forward foreign exchange contracts 6 – 0.1Other payables including provisions 3.4 0.5
6.8 2.8Current liabilitiesTrade and other payables 15 22.0 35.6Forward foreign exchange contracts 6 1.4 0.7
23.4 36.3Total liabilities 30.2 39.1Total equity and liabilities 2,978.9 2,880.5
Notes 1 to 25 form part of the financial statements.
The accounts were approved by the members of the Board on 26 March 2014 and were signed on their behalf by:
Graham Wrigley Diana NobleChairman Chief Executive
Company Statement of Financial PositionAt 31 December
CDC Group plc Annual Accounts 2013
22
Company Statement of Cash FlowsFor the 12 months to 31 December
Notes 2013
£m 2012
£m
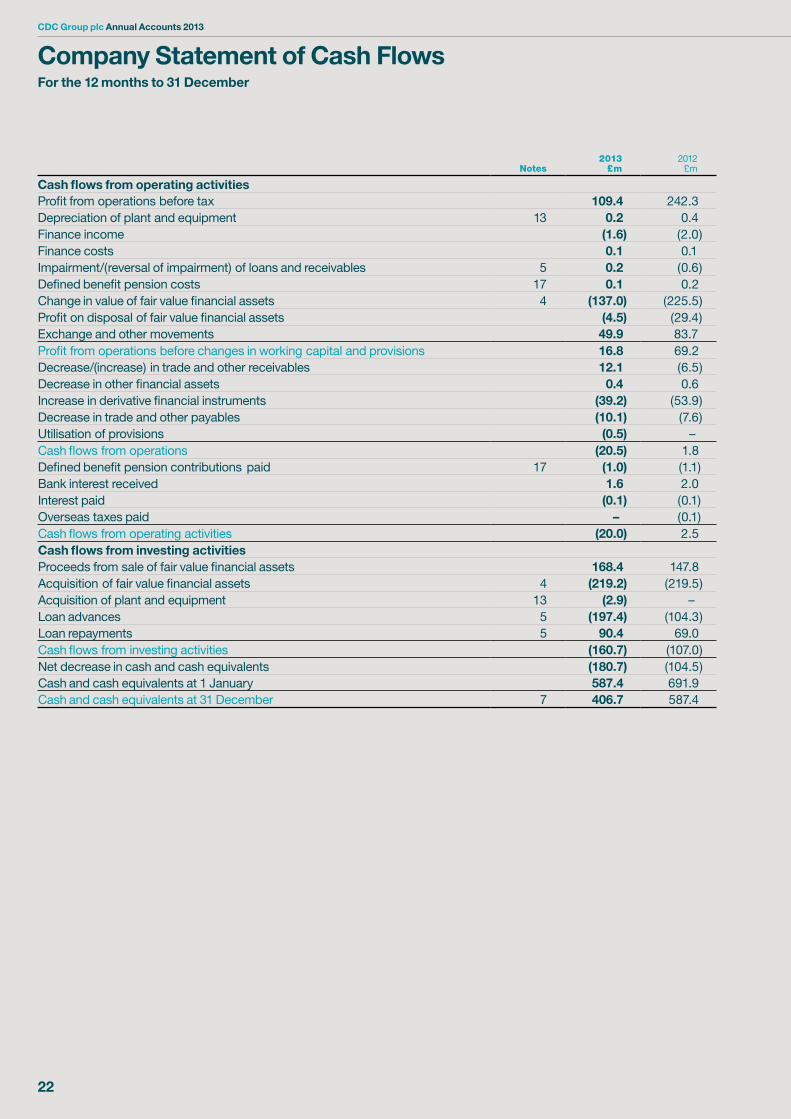
Cash flows from operating activitiesProfit from operations before tax 109.4 242.3Depreciation of plant and equipment 13 0.2 0.4Finance income (1.6) (2.0) Finance costs 0.1 0.1Impairment/(reversal of impairment) of loans and receivables 5 0.2 (0.6) Defined benefit pension costs 17 0.1 0.2Change in value of fair value financial assets 4 (137.0) (225.5) Profit on disposal of fair value financial assets (4.5) (29.4) Exchange and other movements 49.9 83.7Profit from operations before changes in working capital and provisions 16.8 69.2 Decrease/(increase) in trade and other receivables 12.1 (6.5) Decrease in other financial assets 0.4 0.6Increase in derivative financial instruments (39.2) (53.9)Decrease in trade and other payables (10.1) (7.6)Utilisation of provisions (0.5) –Cash flows from operations (20.5) 1.8Defined benefit pension contributions paid 17 (1.0) (1.1)Bank interest received 1.6 2.0Interest paid (0.1) (0.1)Overseas taxes paid – (0.1)Cash flows from operating activities (20.0) 2.5Cash flows from investing activitiesProceeds from sale of fair value financial assets 168.4 147.8Acquisition of fair value financial assets 4 (219.2) (219.5)Acquisition of plant and equipment 13 (2.9) – Loan advances 5 (197.4) (104.3) Loan repayments 5 90.4 69.0Cash flows from investing activities (160.7) (107.0) Net decrease in cash and cash equivalents (180.7) (104.5) Cash and cash equivalents at 1 January 587.4 691.9Cash and cash equivalents at 31 December 7 406.7 587.4
Performance Review
Directors’ Reports
Financial Accounts
CDC Group plc Annual Accounts 2013
23
1. Corporate information and accounts preparation The financial statements of CDC Group plc (CDC or the Company) for the year ended 31 December 2013 were authorised for issue in accordance with a resolution of the Directors on 26 March 2014. CDC is a limited company incorporated in England and Wales whose shares are not publicly traded.
The Group’s primary activity is investing in emerging markets. Both the Company and some of the Group’s subsidiaries make investments.
The financial statements of the Group and Company have been prepared in accordance with International Financial Reporting Standards (IFRS) and its interpretations adopted by the International Accounting Standards Board (IASB) and as adopted by the European Union.
The Company has taken advantage of the exemption provided under section 408 of the Companies Act 2006 not to publish its individual statement of comprehensive income and related notes.
The financial statements have been prepared on a historical cost basis, except for derivative financial instruments and other financial instruments that have been presented and measured at fair value in accordance with relevant accounting standards. The financial statements are presented on a going concern basis and in Pounds Sterling and all values are rounded to the nearest one hundred thousand pounds except where otherwise indicated.
The preparation of financial statements under IFRS requires management to make judgements, estimates and assumptions that affect the application of policies and reported amounts of assets and liabilities, income and expenses. The estimates and associated assumptions are based on historical experience and other factors that are believed to be reasonable under the circumstances, the results of which form the basis for making judgements about carrying values of assets and liabilities that are not readily apparent from other sources. The estimates are reviewed on an ongoing basis. Revisions to estimates are recognised in the period in which the estimate is revised. The area on which the most significant estimates and judgements are made is on fair value financial assets.
ConsolidationSubsidiariesThe consolidated financial statements comprise the financial statements of the Company and its subsidiaries for the year ended 31 December 2013. The financial statements of subsidiaries are prepared for the same reporting year as the Company. Consistent accounting policies are applied, with adjustments being made to bring into line any dissimilar accounting policies.
Subsidiaries are all entities over which the Company has control. Control is defined as the power to govern the financial and operating policies of an entity so as to obtain benefits from its activities. This generally results from a shareholding of more than one half of voting rights. The existence and effect of potential voting rights that are currently exercisable or convertible are also considered when assessing whether the Company controls another entity. Subsidiaries are fully consolidated from the date on which control passes to the Company and consolidation ceases from the date that control ends. All intercompany balances and transactions, including unrealised profits arising from intra-group transactions, are eliminated in full on consolidation.
Acquisitions are accounted for under the purchase method. The cost of an acquisition is measured as the fair value of the assets given, equity instruments issued, liabilities incurred and contingent liabilities at the date of exchange. Identifiable assets and liabilities acquired and contingent liabilities are measured at fair value. Acquisition costs, other than those associated with the issue of debt or equity securities, are expensed as incurred.
Non-controlling interests represent the portion of profit or loss and net assets in subsidiaries that are not held by the Group and are presented within equity in the consolidated statement of financial position, separately from the Company’s shareholder’s equity.
AssociatesUnder the provisions of IAS 28, the Group has adopted the exemption for investment and venture capital companies to account for all investments where the Group has significant influence (presumed in all 20% to 50% holdings) under the provisions of IAS 39 ‘Financial Instruments: recognition and measurement’. These are designated as fair value through profit and loss account, with changes in fair value being recognised in the statement of comprehensive income for the period.
Foreign currency translationItems included in the financial statements of each of the Group’s entities are measured using the currency of the primary economic environment in which the entity operates (the ‘functional currency’). The consolidated financial statements are presented in Pounds Sterling.
Foreign currency transactions are translated into the functional currency of the underlying reporting entity using the exchange rate prevailing at the date of the transaction. Monetary items are retranslated at spot rates at the statement of financial position date. Foreign exchange gains and losses resulting from the settlement of such transactions and from translation of monetary assets and liabilities denominated in foreign currencies at the year end exchange rate are recognised in the statement of comprehensive income. Translation differences on non-monetary items that are measured at fair value, such as equities held at fair value through profit and loss, are translated at the year end rate and reported as an exchange gain or loss in the statement of comprehensive income.
The results and financial position of all subsidiaries that have a functional currency different from the reporting currency of the Group are translated into the presentation currency as follows:
Assets and liabilities: Closing rate at the date of the statement of financial positionIncome and expenses: Average rateCash flows: Average rate
Resulting exchange differences on translation of subsidiary financial statements are taken to a currency translation reserve as a separate component of equity. Upon disposal of subsidiaries, the related exchange gains and losses are taken to the statement of comprehensive income.
A summary of significant accounting policies can be found inNote 25.
Notes to the Accounts
CDC Group plc Annual Accounts 2013
24
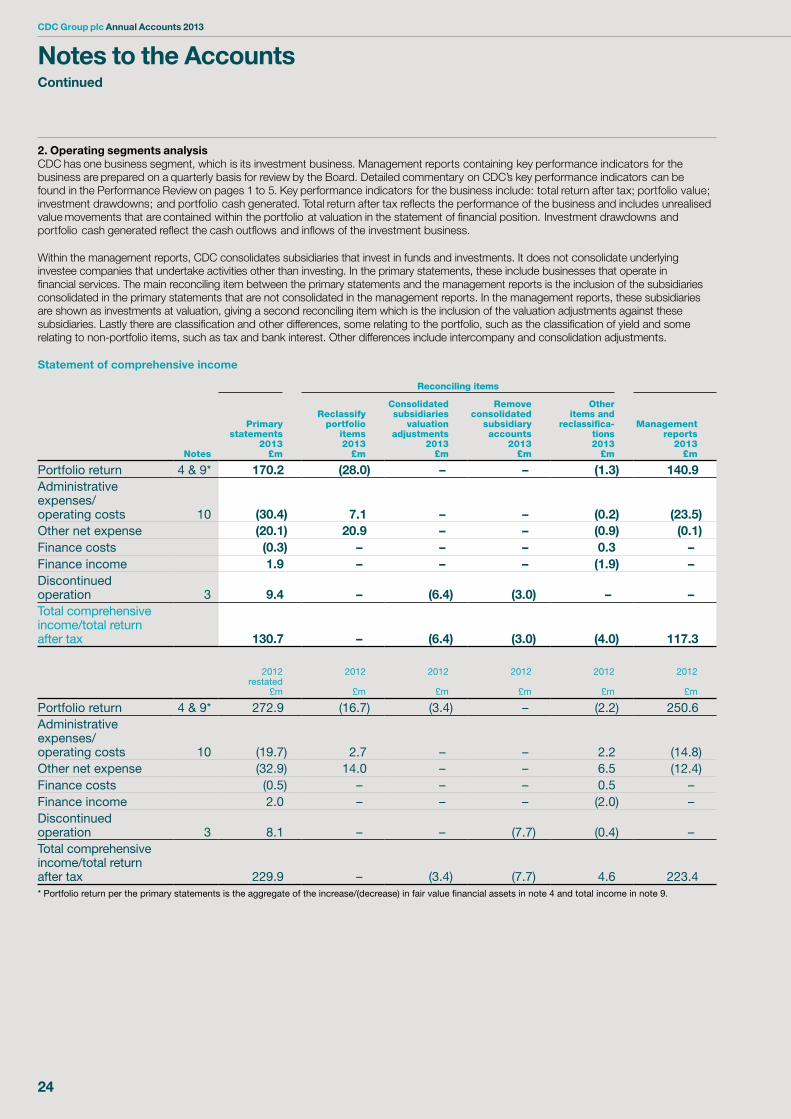
2. Operating segments analysisCDC has one business segment, which is its investment business. Management reports containing key performance indicators for the business are prepared on a quarterly basis for review by the Board. Detailed commentary on CDC’s key performance indicators can be found in the Performance Review on pages 1 to 5. Key performance indicators for the business include: total return after tax; portfolio value; investment drawdowns; and portfolio cash generated. Total return after tax reflects the performance of the business and includes unrealised value movements that are contained within the portfolio at valuation in the statement of financial position. Investment drawdowns and portfolio cash generated reflect the cash outflows and inflows of the investment business.
Within the management reports, CDC consolidates subsidiaries that invest in funds and investments. It does not consolidate underlying investee companies that undertake activities other than investing. In the primary statements, these include businesses that operate in financial services. The main reconciling item between the primary statements and the management reports is the inclusion of the subsidiaries consolidated in the primary statements that are not consolidated in the management reports. In the management reports, these subsidiaries are shown as investments at valuation, giving a second reconciling item which is the inclusion of the valuation adjustments against these subsidiaries. Lastly there are classification and other differences, some relating to the portfolio, such as the classification of yield and some relating to non-portfolio items, such as tax and bank interest. Other differences include intercompany and consolidation adjustments.
Statement of comprehensive income
Reconciling items
Notes
Primary statements
2013£m
Reclassify portfolio
items2013
£m
Consolidated subsidiaries
valuation adjustments
2013£m
Remove consolidated
subsidiary accounts
2013£m
Other items and
reclassifica- tions2013
£m
Management reports
2013£m
Portfolio return 4 & 9* 170.2 (28.0) – – (1.3) 140.9 Administrative expenses/ operating costs 10 (30.4) 7.1 – – (0.2) (23.5)Other net expense (20.1) 20.9 – – (0.9) (0.1)Finance costs (0.3) – – – 0.3 – Finance income 1.9 – – – (1.9) – Discontinued operation 3 9.4 – (6.4) (3.0) – – Total comprehensive income/total return after tax
130.7 – (6.4) (3.0) (4.0) 117.3
2012 restated
£m
2012
£m
2012
£m
2012
£m
2012
£m
2012
£m
Portfolio return 4 & 9* 272.9 (16.7) (3.4) – (2.2) 250.6 Administrative expenses/ operating costs 10 (19.7) 2.7 – – 2.2 (14.8)Other net expense (32.9) 14.0 – – 6.5 (12.4)Finance costs (0.5) – – – 0.5 – Finance income 2.0 – – – (2.0) – Discontinued operation 3 8.1 – – (7.7) (0.4) – Total comprehensive income/total return after tax 229.9 – (3.4) (7.7) 4.6 223.4 * Portfolio return per the primary statements is the aggregate of the increase/(decrease) in fair value financial assets in note 4 and total income in note 9.
Notes to the AccountsContinued
Performance Review
Directors’ Reports
Financial Accounts
CDC Group plc Annual Accounts 2013
25
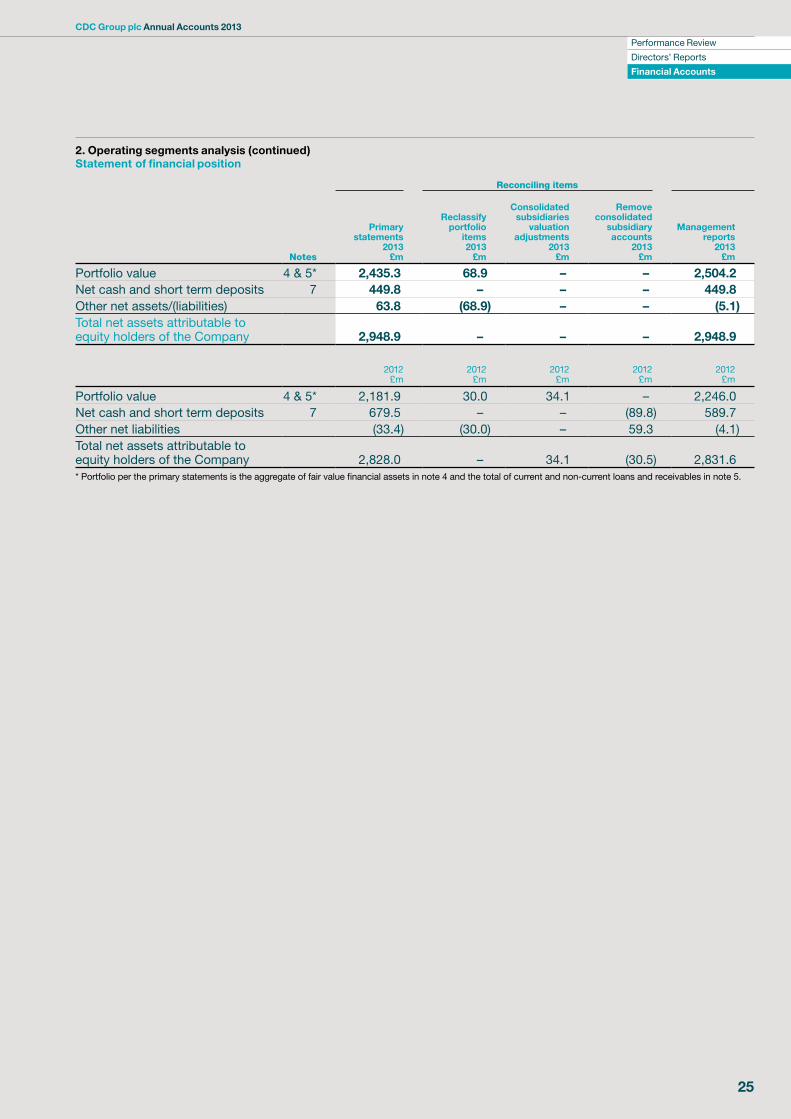
2. Operating segments analysis (continued)Statement of financial position
Reconciling items
Notes
Primary statements
2013 £m
Reclassify portfolio
items 2013
£m
Consolidated subsidiaries
valuation adjustments
2013 £m
Remove consolidated
subsidiary accounts
2013 £m
Management reports
2013 £m
Portfolio value 4 & 5* 2,435.3 68.9 – – 2,504.2Net cash and short term deposits 7 449.8 – – – 449.8Other net assets/(liabilities) 63.8 (68.9) – – (5.1)Total net assets attributable to equity holders of the Company 2,948.9 – – – 2,948.9
2012£m
2012£m
2012£m
2012£m
2012£m
Portfolio value 4 & 5* 2,181.9 30.0 34.1 – 2,246.0Net cash and short term deposits 7 679.5 – – (89.8) 589.7Other net liabilities (33.4) (30.0) – 59.3 (4.1)Total net assets attributable to equity holders of the Company 2,828.0 – 34.1 (30.5) 2,831.6* Portfolio per the primary statements is the aggregate of fair value financial assets in note 4 and the total of current and non-current loans and receivables in note 5.
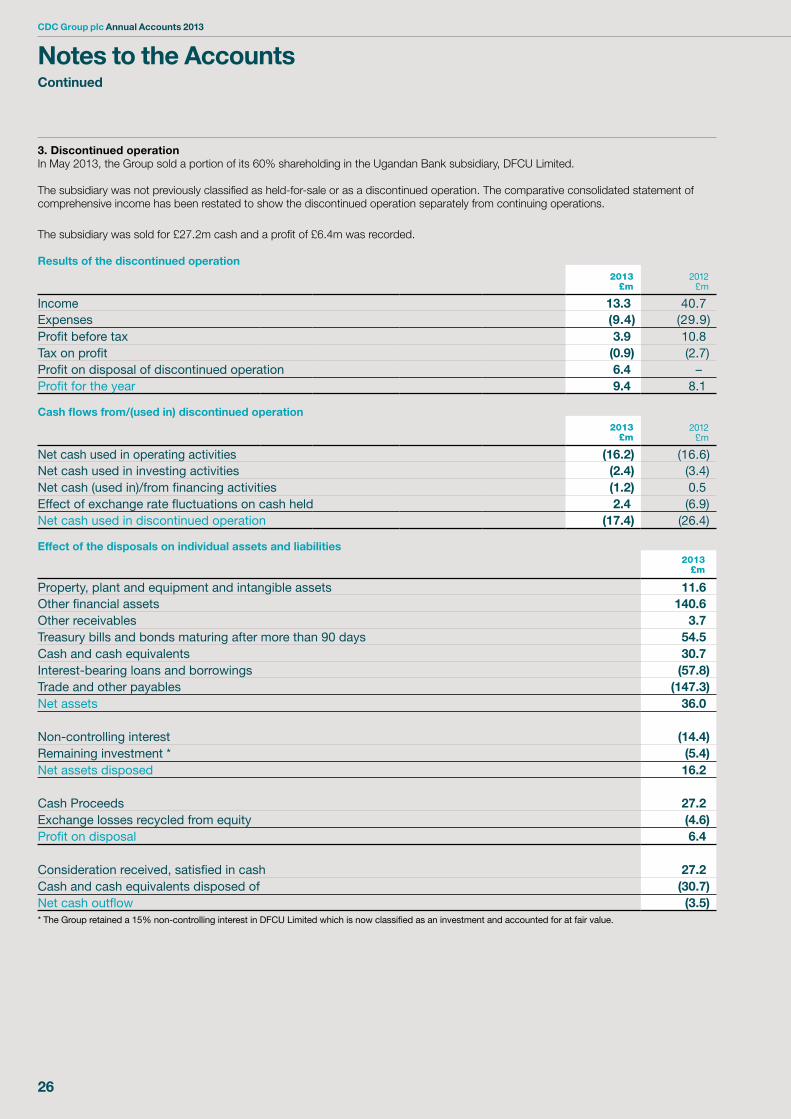
CDC Group plc Annual Accounts 2013
26
3. Discontinued operationIn May 2013, the Group sold a portion of its 60% shareholding in the Ugandan Bank subsidiary, DFCU Limited.
The subsidiary was not previously classified as held-for-sale or as a discontinued operation. The comparative consolidated statement of comprehensive income has been restated to show the discontinued operation separately from continuing operations.
The subsidiary was sold for £27.2m cash and a profit of £6.4m was recorded.
Results of the discontinued operation2013
£m2012
£m
Income 13.3 40.7Expenses (9.4) (29.9)Profit before tax 3.9 10.8Tax on profit (0.9) (2.7)Profit on disposal of discontinued operation 6.4 –Profit for the year 9.4 8.1
Cash flows from/(used in) discontinued operation2013
£m2012
£m
Net cash used in operating activities (16.2) (16.6)Net cash used in investing activities (2.4) (3.4)Net cash (used in)/from financing activities (1.2) 0.5Effect of exchange rate fluctuations on cash held 2.4 (6.9)Net cash used in discontinued operation (17.4) (26.4)
Effect of the disposals on individual assets and liabilities
2013
£m
Property, plant and equipment and intangible assets 11.6 Other financial assets 140.6 Other receivables 3.7 Treasury bills and bonds maturing after more than 90 days 54.5 Cash and cash equivalents 30.7 Interest-bearing loans and borrowings (57.8)Trade and other payables (147.3)Net assets 36.0
Non-controlling interest (14.4)Remaining investment * (5.4)Net assets disposed 16.2
Cash Proceeds 27.2 Exchange losses recycled from equity (4.6)Profit on disposal 6.4
Consideration received, satisfied in cash 27.2 Cash and cash equivalents disposed of (30.7)Net cash outflow (3.5)* The Group retained a 15% non-controlling interest in DFCU Limited which is now classified as an investment and accounted for at fair value.
Notes to the AccountsContinued
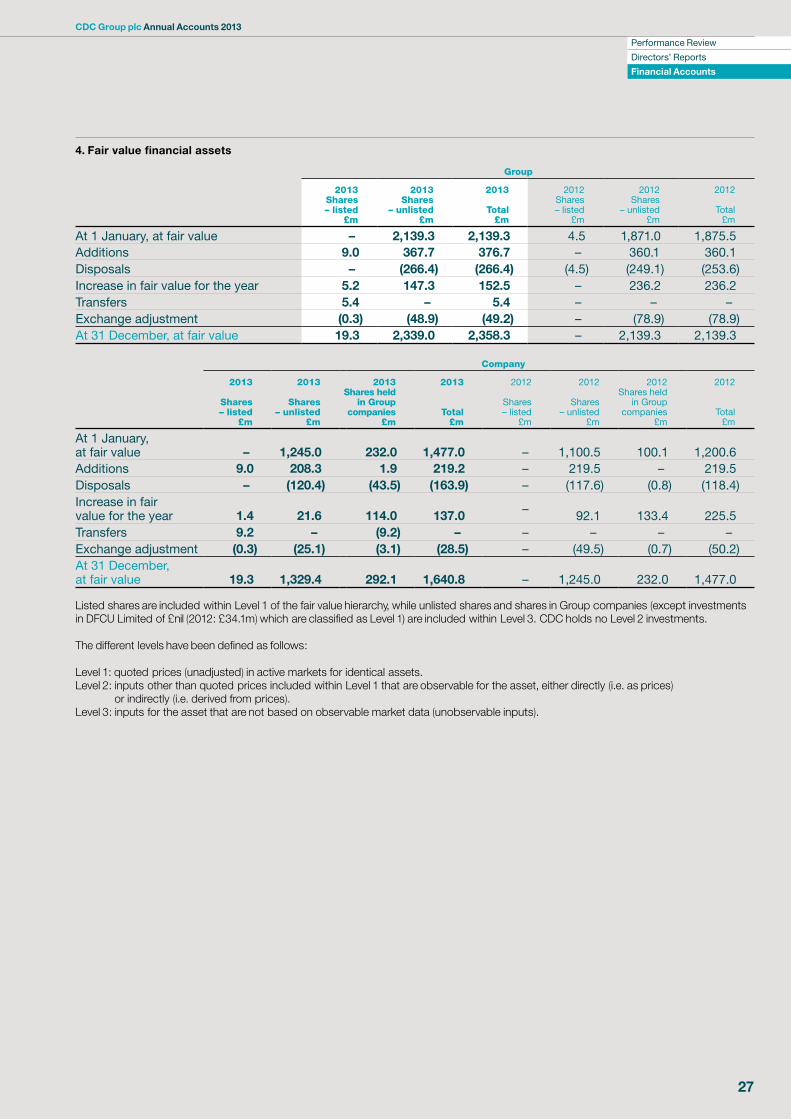
Performance Review
Directors’ Reports
Financial Accounts
CDC Group plc Annual Accounts 2013
27
4. Fair value financial assets
Group
2013Shares– listed
£m
2013Shares
– unlisted£m
2013
Total£m
2012Shares– listed
£m
2012Shares
– unlisted £m
2012
Total£m
At 1 January, at fair value – 2,139.3 2,139.3 4.5 1,871.0 1,875.5Additions 9.0 367.7 376.7 – 360.1 360.1Disposals – (266.4) (266.4) (4.5) (249.1) (253.6)Increase in fair value for the year 5.2 147.3 152.5 – 236.2 236.2Transfers 5.4 – 5.4 – – –Exchange adjustment (0.3) (48.9) (49.2) – (78.9) (78.9)At 31 December, at fair value 19.3 2,339.0 2,358.3 – 2,139.3 2,139.3
Company
2013
Shares– listed
£m
2013
Shares– unlisted
£m
2013Shares held
in Group companies
£m
2013
Total£m
2012
Shares– listed
£m
2012
Shares– unlisted
£m
2012Shares held
in Group companies
£m
2012
Total£m
At 1 January, at fair value – 1,245.0 232.0 1,477.0 – 1,100.5 100.1 1,200.6Additions 9.0 208.3 1.9 219.2 – 219.5 – 219.5Disposals – (120.4) (43.5) (163.9) – (117.6) (0.8) (118.4)Increase in fair value for the year 1.4 21.6 114.0 137.0 – 92.1 133.4 225.5Transfers 9.2 – (9.2) – – – – –Exchange adjustment (0.3) (25.1) (3.1) (28.5) – (49.5) (0.7) (50.2)At 31 December, at fair value 19.3 1,329.4 292.1 1,640.8 – 1,245.0 232.0 1,477.0
Listed shares are included within Level 1 of the fair value hierarchy, while unlisted shares and shares in Group companies (except investments in DFCU Limited of £nil (2012: £34.1m) which are classified as Level 1) are included within Level 3. CDC holds no Level 2 investments.
The different levels have been defined as follows:
Level 1: quoted prices (unadjusted) in active markets for identical assets.Level 2: inputs other than quoted prices included within Level 1 that are observable for the asset, either directly (i.e. as prices)
or indirectly (i.e. derived from prices).Level 3: inputs for the asset that are not based on observable market data (unobservable inputs).
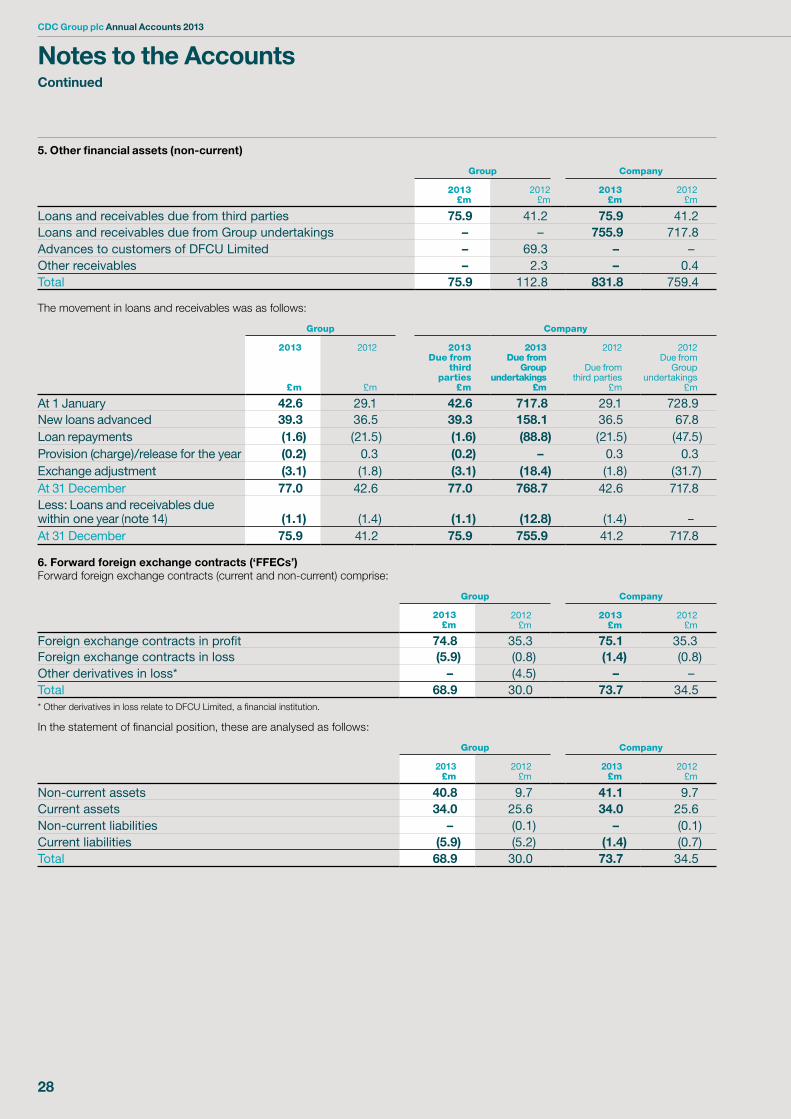
CDC Group plc Annual Accounts 2013
28
5. Other financial assets (non-current)
Group Company
2013£m
2012£m
2013£m
2012£m
Loans and receivables due from third parties 75.9 41.2 75.9 41.2Loans and receivables due from Group undertakings – – 755.9 717.8Advances to customers of DFCU Limited – 69.3 – –Other receivables – 2.3 – 0.4Total 75.9 112.8 831.8 759.4
The movement in loans and receivables was as follows:
Group Company
2013
£m
2012
£m
2013Due from
third parties
£m
2013Due from
Group undertakings
£m
2012
Due from third parties
£m
2012Due from
Group undertakings
£m
At 1 January 42.6 29.1 42.6 717.8 29.1 728.9New loans advanced 39.3 36.5 39.3 158.1 36.5 67.8Loan repayments (1.6) (21.5) (1.6) (88.8) (21.5) (47.5)Provision (charge)/release for the year (0.2) 0.3 (0.2) – 0.3 0.3Exchange adjustment (3.1) (1.8) (3.1) (18.4) (1.8) (31.7)At 31 December 77.0 42.6 77.0 768.7 42.6 717.8Less: Loans and receivables due within one year (note 14) (1.1) (1.4) (1.1) (12.8) (1.4) –At 31 December 75.9 41.2 75.9 755.9 41.2 717.8
6. Forward foreign exchange contracts (‘FFECs’)Forward foreign exchange contracts (current and non-current) comprise:
Group Company
2013£m
2012£m
2013£m
2012£m
Foreign exchange contracts in profit 74.8 35.3 75.1 35.3Foreign exchange contracts in loss (5.9) (0.8) (1.4) (0.8)Other derivatives in loss* – (4.5) – –Total 68.9 30.0 73.7 34.5* Other derivatives in loss relate to DFCU Limited, a financial institution.
In the statement of financial position, these are analysed as follows:
Group Company
2013£m
2012£m
2013£m
2012£m
Non-current assets 40.8 9.7 41.1 9.7Current assets 34.0 25.6 34.0 25.6Non-current liabilities – (0.1) – (0.1)Current liabilities (5.9) (5.2) (1.4) (0.7)Total 68.9 30.0 73.7 34.5
Notes to the AccountsContinued
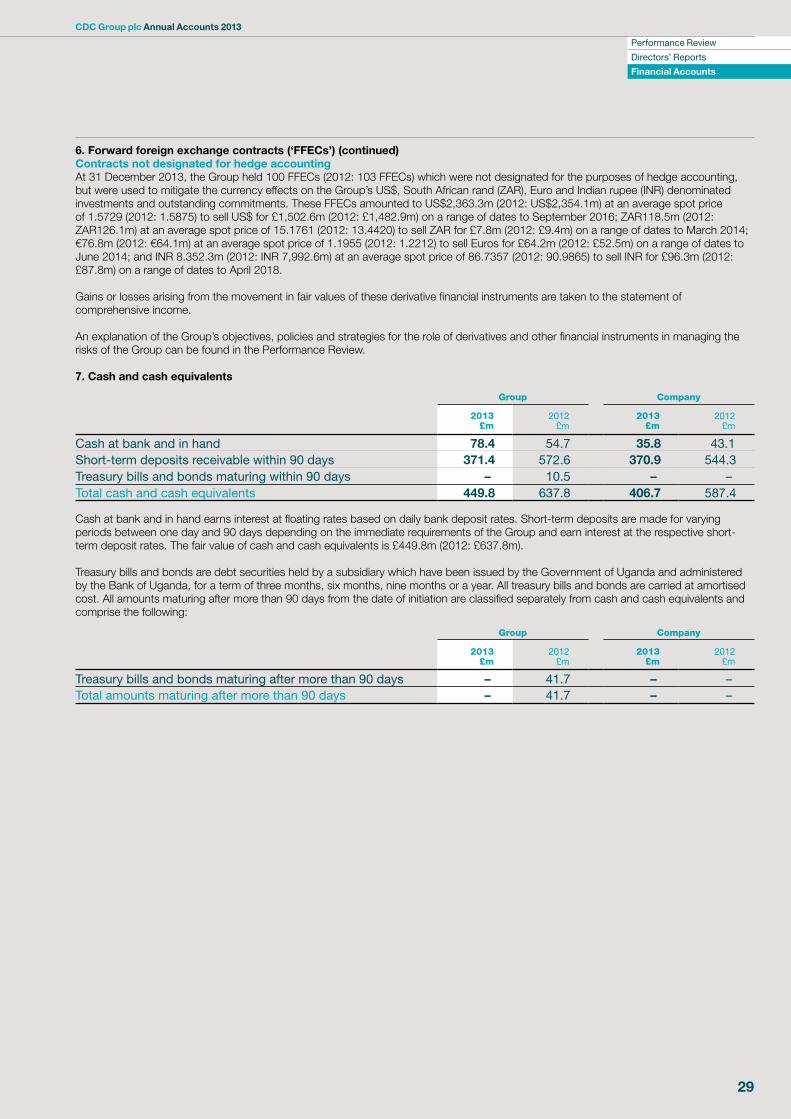
Performance Review
Directors’ Reports
Financial Accounts
CDC Group plc Annual Accounts 2013
29
6. Forward foreign exchange contracts (‘FFECs’) (continued) Contracts not designated for hedge accountingAt 31 December 2013, the Group held 100 FFECs (2012: 103 FFECs) which were not designated for the purposes of hedge accounting, but were used to mitigate the currency effects on the Group’s US$, South African rand (ZAR), Euro and Indian rupee (INR) denominated investments and outstanding commitments. These FFECs amounted to US$2,363.3m (2012: US$2,354.1m) at an average spot price of 1.5729 (2012: 1.5875) to sell US$ for £1,502.6m (2012: £1,482.9m) on a range of dates to September 2016; ZAR118.5m (2012: ZAR126.1m) at an average spot price of 15.1761 (2012: 13.4420) to sell ZAR for £7.8m (2012: £9.4m) on a range of dates to March 2014; €76.8m (2012: €64.1m) at an average spot price of 1.1955 (2012: 1.2212) to sell Euros for £64.2m (2012: £52.5m) on a range of dates to June 2014; and INR 8.352.3m (2012: INR 7,992.6m) at an average spot price of 86.7357 (2012: 90.9865) to sell INR for £96.3m (2012: £87.8m) on a range of dates to April 2018.
Gains or losses arising from the movement in fair values of these derivative financial instruments are taken to the statement of comprehensive income.
An explanation of the Group’s objectives, policies and strategies for the role of derivatives and other financial instruments in managing the risks of the Group can be found in the Performance Review.
7. Cash and cash equivalents
Group Company
2013£m
2012£m
2013£m
2012£m
Cash at bank and in hand 78.4 54.7 35.8 43.1Short-term deposits receivable within 90 days 371.4 572.6 370.9 544.3Treasury bills and bonds maturing within 90 days – 10.5 – –Total cash and cash equivalents 449.8 637.8 406.7 587.4
Cash at bank and in hand earns interest at floating rates based on daily bank deposit rates. Short-term deposits are made for varying periods between one day and 90 days depending on the immediate requirements of the Group and earn interest at the respective short-term deposit rates. The fair value of cash and cash equivalents is £449.8m (2012: £637.8m).
Treasury bills and bonds are debt securities held by a subsidiary which have been issued by the Government of Uganda and administered by the Bank of Uganda, for a term of three months, six months, nine months or a year. All treasury bills and bonds are carried at amortised cost. All amounts maturing after more than 90 days from the date of initiation are classified separately from cash and cash equivalents and comprise the following:
Group Company
2013£m
2012£m
2013£m
2012£m
Treasury bills and bonds maturing after more than 90 days – 41.7 – –Total amounts maturing after more than 90 days – 41.7 – –
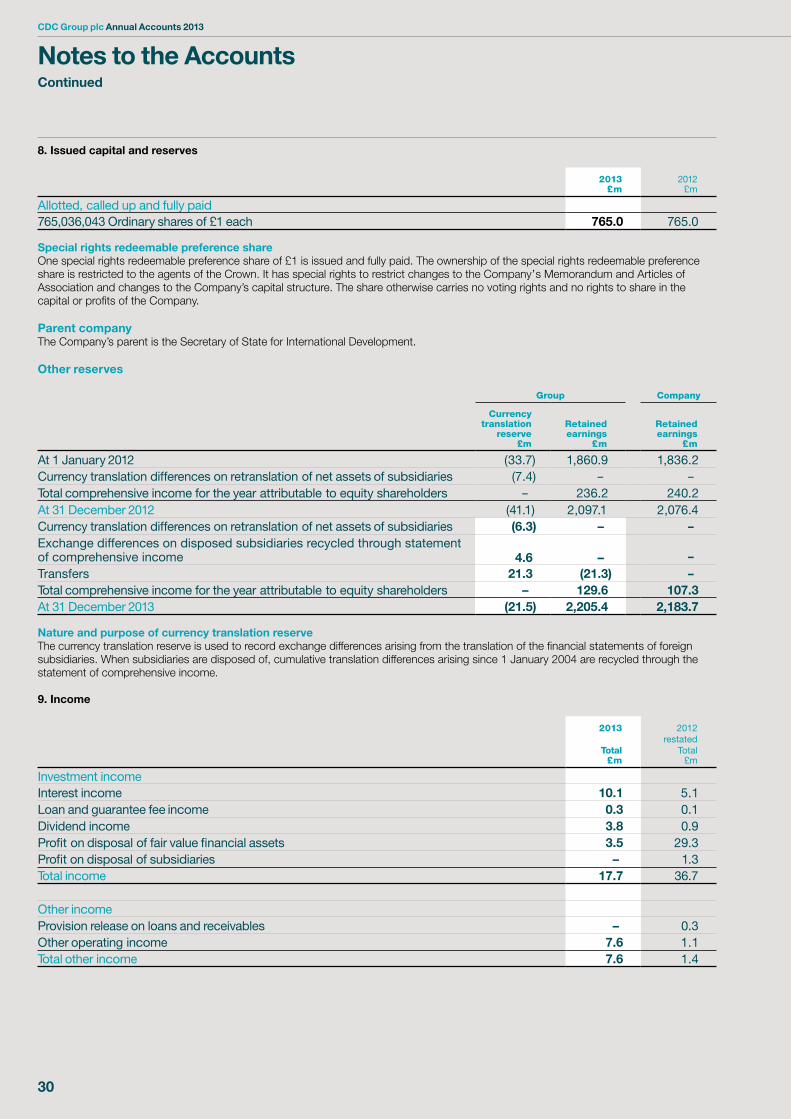
CDC Group plc Annual Accounts 2013
30
8. Issued capital and reserves
2013£m
2012£m
Allotted, called up and fully paid765,036,043 Ordinary shares of £1 each 765.0 765.0
Special rights redeemable preference shareOne special rights redeemable preference share of £1 is issued and fully paid. The ownership of the special rights redeemable preference share is restricted to the agents of the Crown. It has special rights to restrict changes to the Company’s Memorandum and Articles of Association and changes to the Company’s capital structure. The share otherwise carries no voting rights and no rights to share in the capital or profits of the Company.
Parent companyThe Company’s parent is the Secretary of State for International Development.
Other reserves
Group Company
Currency translation
reserve £m
Retained earnings
£m
Retained earnings
£m
At 1 January 2012 (33.7) 1,860.9 1,836.2Currency translation differences on retranslation of net assets of subsidiaries (7.4) – –Total comprehensive income for the year attributable to equity shareholders – 236.2 240.2At 31 December 2012 (41.1) 2,097.1 2,076.4Currency translation differences on retranslation of net assets of subsidiaries (6.3) – –Exchange differences on disposed subsidiaries recycled through statement of comprehensive income 4.6 – –Transfers 21.3 (21.3) –Total comprehensive income for the year attributable to equity shareholders – 129.6 107.3At 31 December 2013 (21.5) 2,205.4 2,183.7
Nature and purpose of currency translation reserveThe currency translation reserve is used to record exchange differences arising from the translation of the financial statements of foreign subsidiaries. When subsidiaries are disposed of, cumulative translation differences arising since 1 January 2004 are recycled through the statement of comprehensive income.
9. Income
2013
Total£m
2012restated
Total£m
Investment incomeInterest income 10.1 5.1Loan and guarantee fee income 0.3 0.1Dividend income 3.8 0.9Profit on disposal of fair value financial assets 3.5 29.3Profit on disposal of subsidiaries – 1.3Total income 17.7 36.7
Other incomeProvision release on loans and receivables – 0.3Other operating income 7.6 1.1Total other income 7.6 1.4
Notes to the AccountsContinued
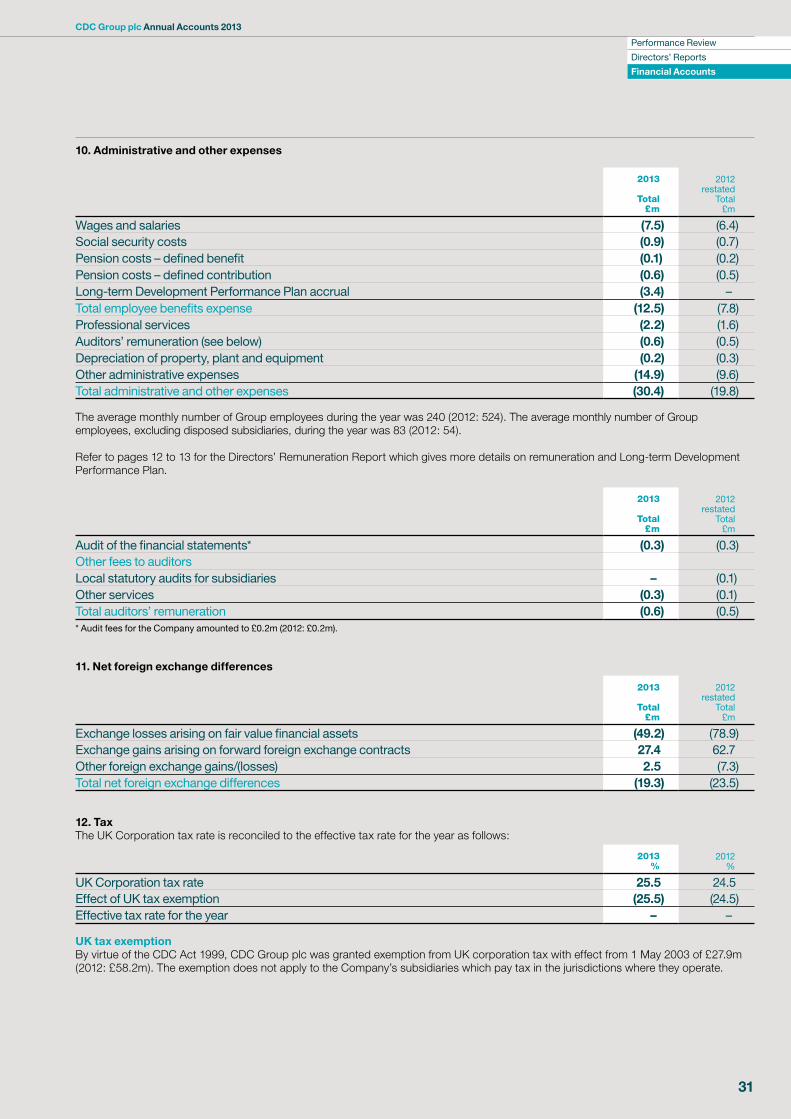
Performance Review
Directors’ Reports
Financial Accounts
CDC Group plc Annual Accounts 2013
31
10. Administrative and other expenses
2013
Total£m
2012restated
Total£m
Wages and salaries (7.5) (6.4)Social security costs (0.9) (0.7)Pension costs – defined benefit (0.1) (0.2)Pension costs – defined contribution (0.6) (0.5)Long-term Development Performance Plan accrual (3.4) –Total employee benefits expense (12.5) (7.8)Professional services (2.2) (1.6)Auditors’ remuneration (see below) (0.6) (0.5)Depreciation of property, plant and equipment (0.2) (0.3)Other administrative expenses (14.9) (9.6)Total administrative and other expenses (30.4) (19.8)
The average monthly number of Group employees during the year was 240 (2012: 524). The average monthly number of Group employees, excluding disposed subsidiaries, during the year was 83 (2012: 54).
Refer to pages 12 to 13 for the Directors’ Remuneration Report which gives more details on remuneration and Long-term Development Performance Plan.
2013
Total£m
2012restated
Total£m
Audit of the financial statements* (0.3) (0.3)Other fees to auditorsLocal statutory audits for subsidiaries – (0.1)Other services (0.3) (0.1)Total auditors’ remuneration (0.6) (0.5)* Audit fees for the Company amounted to £0.2m (2012: £0.2m).
11. Net foreign exchange differences
2013
Total£m
2012 restated
Total£m
Exchange losses arising on fair value financial assets (49.2) (78.9)Exchange gains arising on forward foreign exchange contracts 27.4 62.7Other foreign exchange gains/(losses) 2.5 (7.3)Total net foreign exchange differences (19.3) (23.5)
12. TaxThe UK Corporation tax rate is reconciled to the effective tax rate for the year as follows:
2013%
2012%
UK Corporation tax rate 25.5 24.5Effect of UK tax exemption (25.5) (24.5)Effective tax rate for the year – –
UK tax exemption By virtue of the CDC Act 1999, CDC Group plc was granted exemption from UK corporation tax with effect from 1 May 2003 of £27.9m (2012: £58.2m). The exemption does not apply to the Company’s subsidiaries which pay tax in the jurisdictions where they operate.
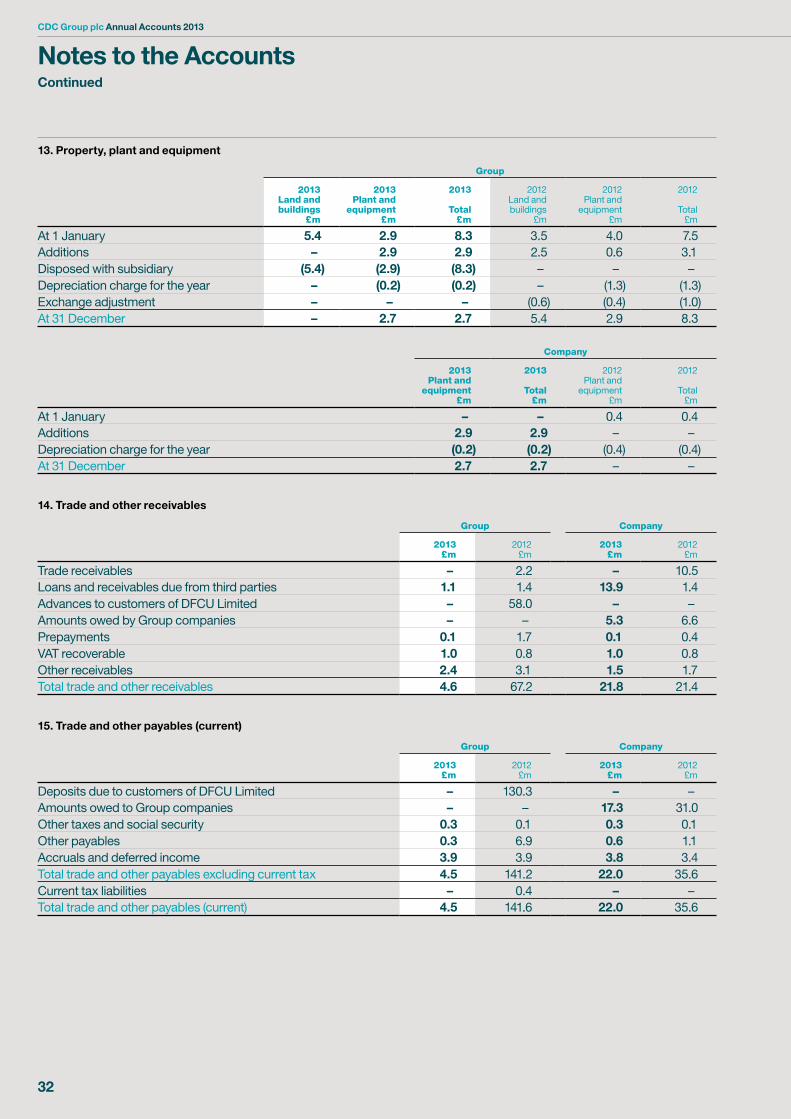
CDC Group plc Annual Accounts 2013
32
13. Property, plant and equipment
Group
2013Land and buildings
£m
2013Plant and
equipment£m
2013
Total£m
2012Land and buildings
£m
2012Plant and
equipment£m
2012
Total£m
At 1 January 5.4 2.9 8.3 3.5 4.0 7.5Additions – 2.9 2.9 2.5 0.6 3.1Disposed with subsidiary (5.4) (2.9) (8.3) – – –Depreciation charge for the year – (0.2) (0.2) – (1.3) (1.3)Exchange adjustment – – – (0.6) (0.4) (1.0)At 31 December – 2.7 2.7 5.4 2.9 8.3
Company
2013Plant and
equipment£m
2013
Total£m
2012Plant and
equipment£m
2012
Total£m
At 1 January – – 0.4 0.4Additions 2.9 2.9 – –Depreciation charge for the year (0.2) (0.2) (0.4) (0.4)At 31 December 2.7 2.7 – –
14. Trade and other receivables
Group Company
2013 £m
2012 £m
2013 £m
2012 £m
Trade receivables – 2.2 – 10.5Loans and receivables due from third parties 1.1 1.4 13.9 1.4Advances to customers of DFCU Limited – 58.0 – –Amounts owed by Group companies – – 5.3 6.6Prepayments 0.1 1.7 0.1 0.4VAT recoverable 1.0 0.8 1.0 0.8Other receivables 2.4 3.1 1.5 1.7Total trade and other receivables 4.6 67.2 21.8 21.4
15. Trade and other payables (current)
Group Company
2013 £m
2012 £m
2013 £m
2012 £m
Deposits due to customers of DFCU Limited – 130.3 – –Amounts owed to Group companies – – 17.3 31.0Other taxes and social security 0.3 0.1 0.3 0.1Other payables 0.3 6.9 0.6 1.1Accruals and deferred income 3.9 3.9 3.8 3.4Total trade and other payables excluding current tax 4.5 141.2 22.0 35.6Current tax liabilities – 0.4 – –Total trade and other payables (current) 4.5 141.6 22.0 35.6
Notes to the AccountsContinued
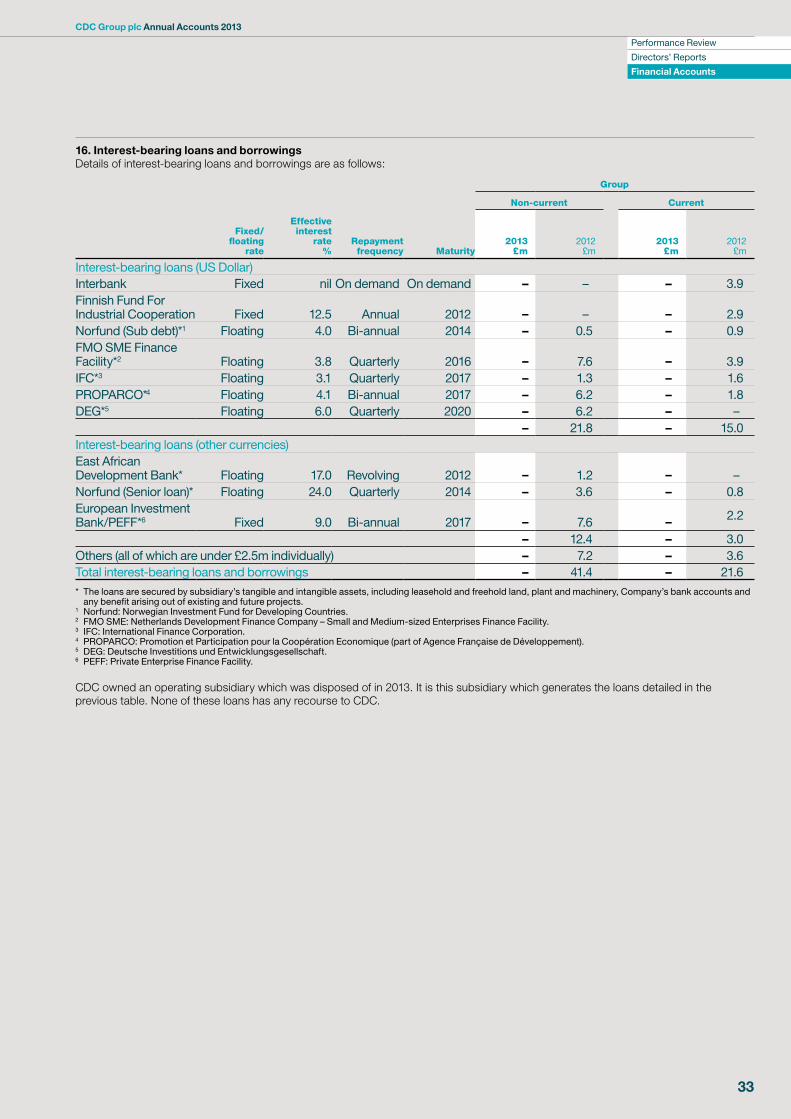
Performance Review
Directors’ Reports
Financial Accounts
CDC Group plc Annual Accounts 2013
33
16. Interest-bearing loans and borrowingsDetails of interest-bearing loans and borrowings are as follows:
Group
Non-current Current
Fixed/floating
rate
Effectiveinterest
rate %
Repaymentfrequency Maturity
2013£m
2012£m
2013£m
2012£m
Interest-bearing loans (US Dollar)Interbank Fixed nil On demand On demand – – – 3.9Finnish Fund For Industrial Cooperation Fixed 12.5 Annual 2012 – – – 2.9Norfund (Sub debt)*1 Floating 4.0 Bi-annual 2014 – 0.5 – 0.9FMO SME Finance Facility*2 Floating 3.8 Quarterly 2016 – 7.6 – 3.9IFC*3 Floating 3.1 Quarterly 2017 – 1.3 – 1.6PROPARCO*4 Floating 4.1 Bi-annual 2017 – 6.2 – 1.8DEG*5 Floating 6.0 Quarterly 2020 – 6.2 – –
– 21.8 – 15.0Interest-bearing loans (other currencies)East African Development Bank* Floating 17.0 Revolving 2012 – 1.2 – –Norfund (Senior loan)* Floating 24.0 Quarterly 2014 – 3.6 – 0.8European Investment Bank/PEFF*6 Fixed 9.0 Bi-annual 2017 – 7.6 – 2.2
– 12.4 – 3.0Others (all of which are under £2.5m individually) – 7.2 – 3.6Total interest-bearing loans and borrowings – 41.4 – 21.6
* The loans are secured by subsidiary’s tangible and intangible assets, including leasehold and freehold land, plant and machinery, Company’s bank accounts and any benefit arising out of existing and future projects.
1 Norfund: Norwegian Investment Fund for Developing Countries. 2 FMO SME: Netherlands Development Finance Company – Small and Medium-sized Enterprises Finance Facility. 3 IFC: International Finance Corporation. 4 PROPARCO: Promotion et Participation pour la Coopération Economique (part of Agence Française de Développement). 5 DEG: Deutsche Investitions und Entwicklungsgesellschaft. 6 PEFF: Private Enterprise Finance Facility.
CDC owned an operating subsidiary which was disposed of in 2013. It is this subsidiary which generates the loans detailed in the previous table. None of these loans has any recourse to CDC.
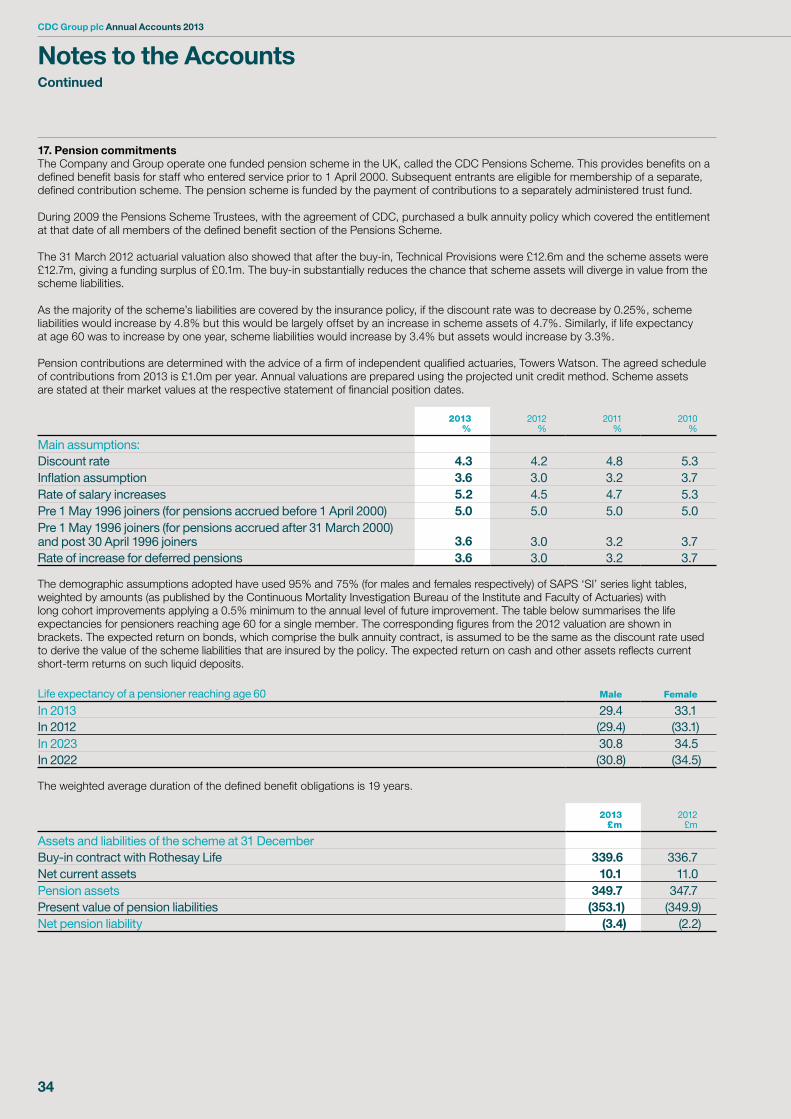
CDC Group plc Annual Accounts 2013
34
17. Pension commitmentsThe Company and Group operate one funded pension scheme in the UK, called the CDC Pensions Scheme. This provides benefits on a defined benefit basis for staff who entered service prior to 1 April 2000. Subsequent entrants are eligible for membership of a separate, defined contribution scheme. The pension scheme is funded by the payment of contributions to a separately administered trust fund.
During 2009 the Pensions Scheme Trustees, with the agreement of CDC, purchased a bulk annuity policy which covered the entitlement at that date of all members of the defined benefit section of the Pensions Scheme.
The 31 March 2012 actuarial valuation also showed that after the buy-in, Technical Provisions were £12.6m and the scheme assets were £12.7m, giving a funding surplus of £0.1m. The buy-in substantially reduces the chance that scheme assets will diverge in value from the scheme liabilities.
As the majority of the scheme’s liabilities are covered by the insurance policy, if the discount rate was to decrease by 0.25%, scheme liabilities would increase by 4.8% but this would be largely offset by an increase in scheme assets of 4.7%. Similarly, if life expectancy at age 60 was to increase by one year, scheme liabilities would increase by 3.4% but assets would increase by 3.3%.
Pension contributions are determined with the advice of a firm of independent qualified actuaries, Towers Watson. The agreed schedule of contributions from 2013 is £1.0m per year. Annual valuations are prepared using the projected unit credit method. Scheme assets are stated at their market values at the respective statement of financial position dates.
2013%
2012%
2011%
2010%
Main assumptions:Discount rate 4.3 4.2 4.8 5.3Inflation assumption 3.6 3.0 3.2 3.7Rate of salary increases 5.2 4.5 4.7 5.3Pre 1 May 1996 joiners (for pensions accrued before 1 April 2000) 5.0 5.0 5.0 5.0Pre 1 May 1996 joiners (for pensions accrued after 31 March 2000) and post 30 April 1996 joiners 3.6 3.0 3.2 3.7Rate of increase for deferred pensions 3.6 3.0 3.2 3.7
The demographic assumptions adopted have used 95% and 75% (for males and females respectively) of SAPS ‘SI’ series light tables, weighted by amounts (as published by the Continuous Mortality Investigation Bureau of the Institute and Faculty of Actuaries) with long cohort improvements applying a 0.5% minimum to the annual level of future improvement. The table below summarises the life expectancies for pensioners reaching age 60 for a single member. The corresponding figures from the 2012 valuation are shown in brackets. The expected return on bonds, which comprise the bulk annuity contract, is assumed to be the same as the discount rate used to derive the value of the scheme liabilities that are insured by the policy. The expected return on cash and other assets reflects current short-term returns on such liquid deposits.
Life expectancy of a pensioner reaching age 60 Male Female
In 2013 29.4 33.1In 2012 (29.4) (33.1)In 2023 30.8 34.5In 2022 (30.8) (34.5)
The weighted average duration of the defined benefit obligations is 19 years.
2013£m
2012£m
Assets and liabilities of the scheme at 31 DecemberBuy-in contract with Rothesay Life 339.6 336.7Net current assets 10.1 11.0Pension assets 349.7 347.7Present value of pension liabilities (353.1) (349.9)Net pension liability (3.4) (2.2)
Notes to the AccountsContinued
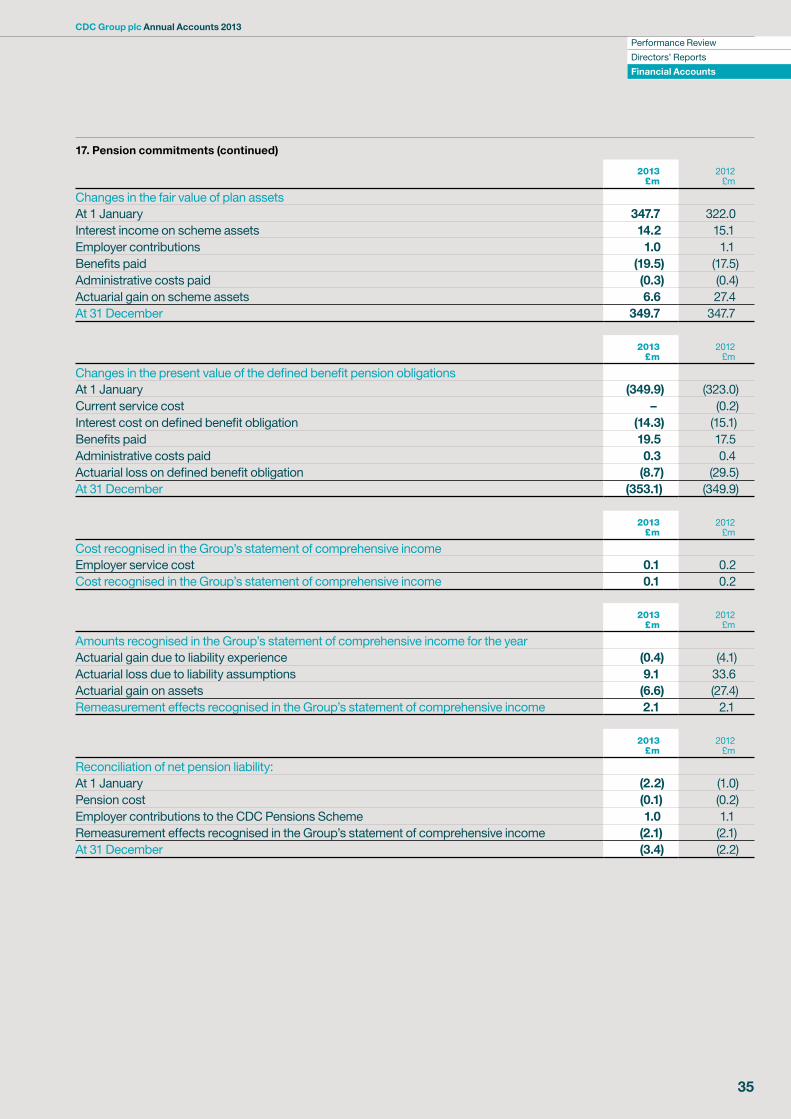
Performance Review
Directors’ Reports
Financial Accounts
CDC Group plc Annual Accounts 2013
35
17. Pension commitments (continued)
2013£m
2012£m
Changes in the fair value of plan assetsAt 1 January 347.7 322.0Interest income on scheme assets 14.2 15.1Employer contributions 1.0 1.1Benefits paid (19.5) (17.5)Administrative costs paid (0.3) (0.4)Actuarial gain on scheme assets 6.6 27.4At 31 December 349.7 347.7
2013£m
2012£m
Changes in the present value of the defined benefit pension obligationsAt 1 January (349.9) (323.0)Current service cost – (0.2)Interest cost on defined benefit obligation (14.3) (15.1)Benefits paid 19.5 17.5Administrative costs paid 0.3 0.4Actuarial loss on defined benefit obligation (8.7) (29.5)At 31 December (353.1) (349.9)
2013£m
2012£m
Cost recognised in the Group’s statement of comprehensive incomeEmployer service cost 0.1 0.2Cost recognised in the Group’s statement of comprehensive income 0.1 0.2
2013£m
2012£m
Amounts recognised in the Group’s statement of comprehensive income for the yearActuarial gain due to liability experience (0.4) (4.1)Actuarial loss due to liability assumptions 9.1 33.6Actuarial gain on assets (6.6) (27.4)Remeasurement effects recognised in the Group’s statement of comprehensive income 2.1 2.1
2013£m
2012£m
Reconciliation of net pension liability:At 1 January (2.2) (1.0)Pension cost (0.1) (0.2)Employer contributions to the CDC Pensions Scheme 1.0 1.1Remeasurement effects recognised in the Group’s statement of comprehensive income (2.1) (2.1)At 31 December (3.4) (2.2)
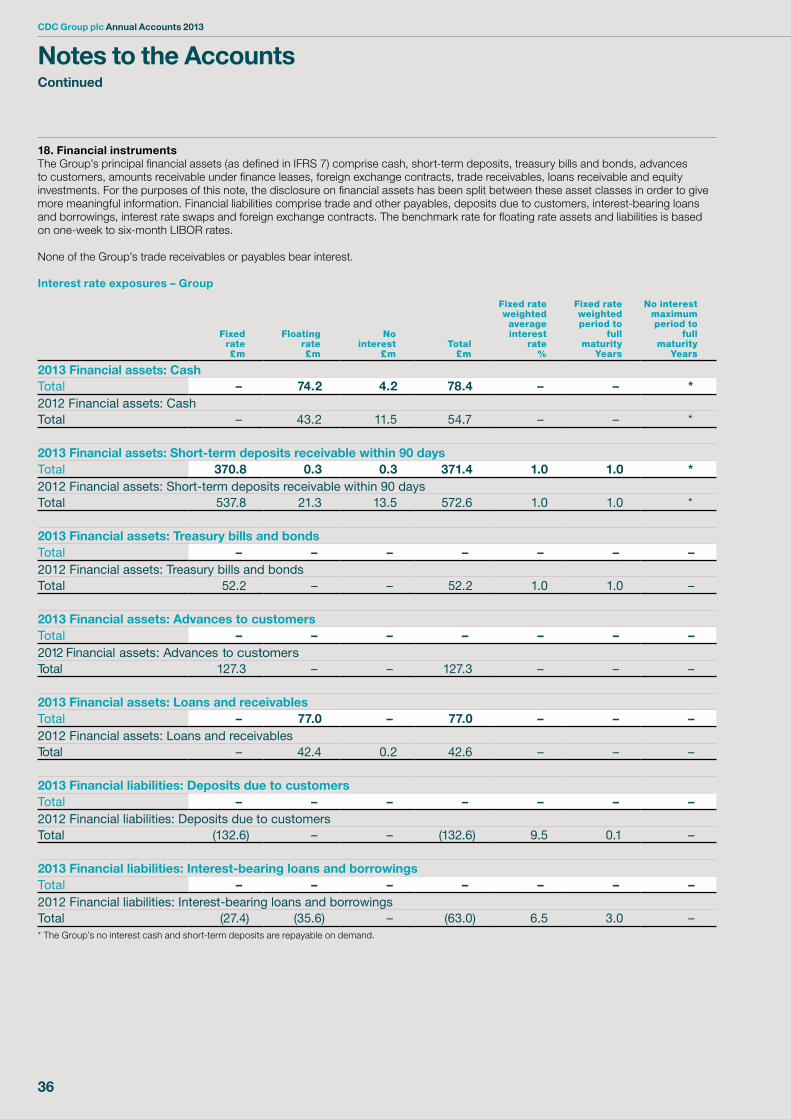
CDC Group plc Annual Accounts 2013
36
18. Financial instrumentsThe Group’s principal financial assets (as defined in IFRS 7) comprise cash, short-term deposits, treasury bills and bonds, advances to customers, amounts receivable under finance leases, foreign exchange contracts, trade receivables, loans receivable and equity investments. For the purposes of this note, the disclosure on financial assets has been split between these asset classes in order to give more meaningful information. Financial liabilities comprise trade and other payables, deposits due to customers, interest-bearing loans and borrowings, interest rate swaps and foreign exchange contracts. The benchmark rate for floating rate assets and liabilities is based on one-week to six-month LIBOR rates.
None of the Group’s trade receivables or payables bear interest.
Interest rate exposures – Group
Fixedrate£m
Floatingrate£m
Nointerest
£mTotal
£m
Fixed rate weighted
averageinterest
rate%
Fixed rate weightedperiod to
full maturity
Years
No interest maximumperiod to
full maturity
Years
2013 Financial assets: CashTotal – 74.2 4.2 78.4 – – *2012 Financial assets: CashTotal – 43.2 11.5 54.7 – – *
2013 Financial assets: Short-term deposits receivable within 90 daysTotal 370.8 0.3 0.3 371.4 1.0 1.0 *2012 Financial assets: Short-term deposits receivable within 90 daysTotal 537.8 21.3 13.5 572.6 1.0 1.0 *
2013 Financial assets: Treasury bills and bondsTotal – – – – – – –2012 Financial assets: Treasury bills and bondsTotal 52.2 – – 52.2 1.0 1.0 –
2013 Financial assets: Advances to customersTotal – – – – – – –2012 Financial assets: Advances to customersTotal 127.3 – – 127.3 – – –
2013 Financial assets: Loans and receivablesTotal – 77.0 – 77.0 – – –2012 Financial assets: Loans and receivablesTotal – 42.4 0.2 42.6 – – –
2013 Financial liabilities: Deposits due to customersTotal – – – – – – –2012 Financial liabilities: Deposits due to customersTotal (132.6) – – (132.6) 9.5 0.1 –
2013 Financial liabilities: Interest-bearing loans and borrowingsTotal – – – – – – –2012 Financial liabilities: Interest-bearing loans and borrowingsTotal (27.4) (35.6) – (63.0) 6.5 3.0 –* The Group’s no interest cash and short-term deposits are repayable on demand.
Notes to the AccountsContinued
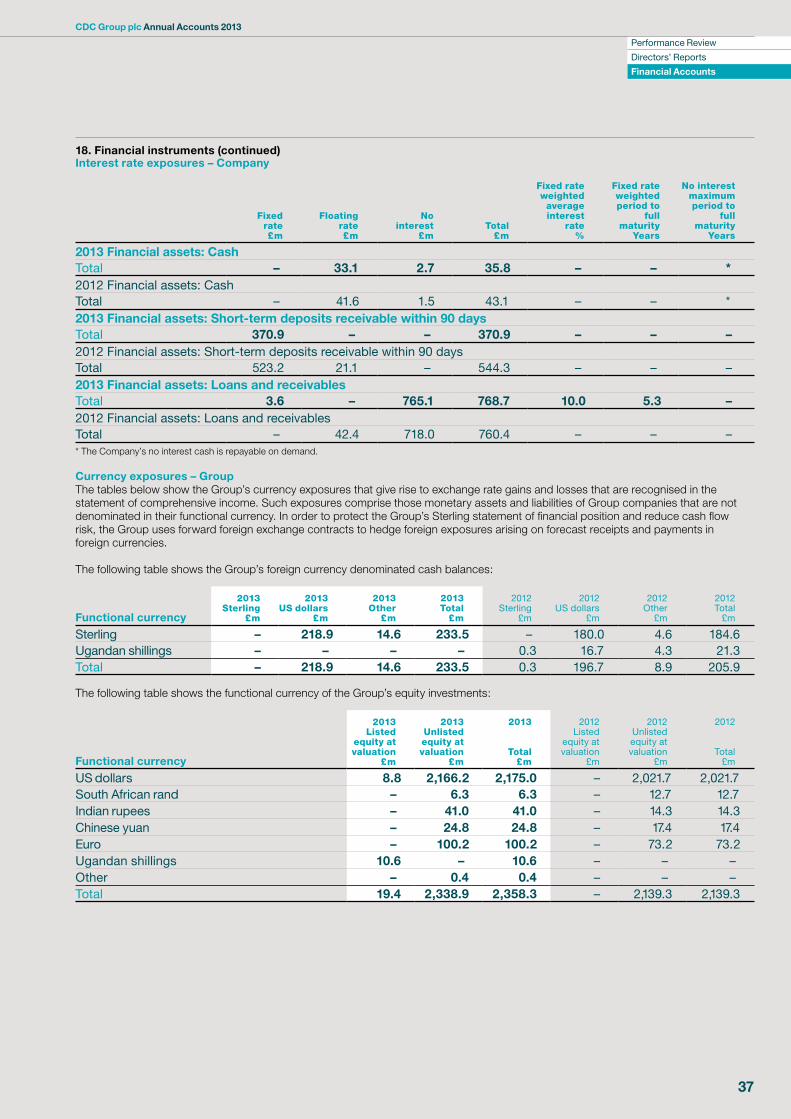
Performance Review
Directors’ Reports
Financial Accounts
CDC Group plc Annual Accounts 2013
37
18. Financial instruments (continued)Interest rate exposures – Company
Fixedrate£m
Floatingrate£m
Nointerest
£mTotal
£m
Fixed rate weighted
averageinterest
rate%
Fixed rate weightedperiod to
full maturity
Years
No interest maximumperiod to
full maturity
Years
2013 Financial assets: CashTotal – 33.1 2.7 35.8 – – *2012 Financial assets: CashTotal – 41.6 1.5 43.1 – – *2013 Financial assets: Short-term deposits receivable within 90 daysTotal 370.9 – – 370.9 – – –2012 Financial assets: Short-term deposits receivable within 90 daysTotal 523.2 21.1 – 544.3 – – –2013 Financial assets: Loans and receivablesTotal 3.6 – 765.1 768.7 10.0 5.3 –2012 Financial assets: Loans and receivablesTotal – 42.4 718.0 760.4 – – –* The Company’s no interest cash is repayable on demand.
Currency exposures – GroupThe tables below show the Group’s currency exposures that give rise to exchange rate gains and losses that are recognised in the statement of comprehensive income. Such exposures comprise those monetary assets and liabilities of Group companies that are not denominated in their functional currency. In order to protect the Group’s Sterling statement of financial position and reduce cash flow risk, the Group uses forward foreign exchange contracts to hedge foreign exposures arising on forecast receipts and payments in foreign currencies.
The following table shows the Group’s foreign currency denominated cash balances:
Functional currency
2013Sterling
£m
2013US dollars
£m
2013Other
£m
2013Total
£m
2012Sterling
£m
2012US dollars
£m
2012Other
£m
2012Total
£m
Sterling – 218.9 14.6 233.5 – 180.0 4.6 184.6Ugandan shillings – – – – 0.3 16.7 4.3 21.3Total – 218.9 14.6 233.5 0.3 196.7 8.9 205.9
The following table shows the functional currency of the Group’s equity investments:
Functional currency
2013 Listed
equity at valuation
£m
2013 Unlisted equity at valuation
£m
2013
Total £m
2012 Listed
equity at valuation
£m
2012 Unlisted equity at valuation
£m
2012
Total £m
US dollars 8.8 2,166.2 2,175.0 – 2,021.7 2,021.7South African rand – 6.3 6.3 – 12.7 12.7Indian rupees – 41.0 41.0 – 14.3 14.3Chinese yuan – 24.8 24.8 – 17.4 17.4Euro – 100.2 100.2 – 73.2 73.2Ugandan shillings 10.6 – 10.6 – – –Other – 0.4 0.4 – – –Total 19.4 2,338.9 2,358.3 – 2,139.3 2,139.3
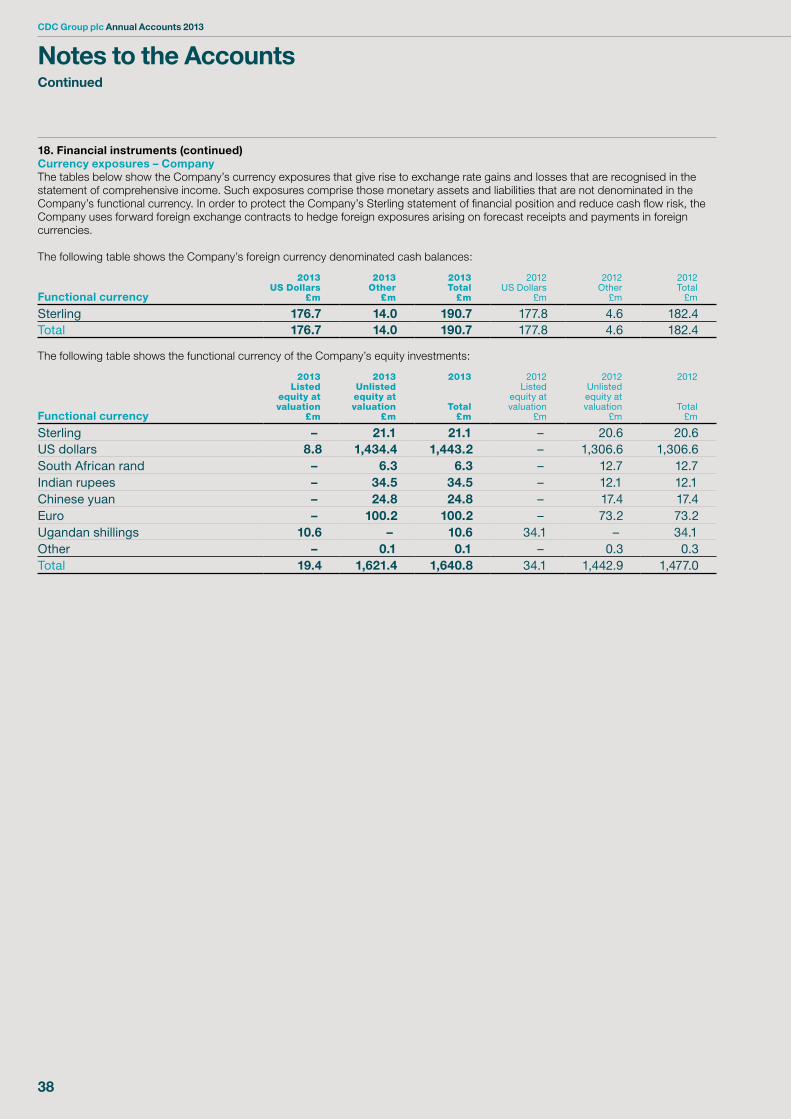
CDC Group plc Annual Accounts 2013
38
18. Financial instruments (continued) Currency exposures – CompanyThe tables below show the Company’s currency exposures that give rise to exchange rate gains and losses that are recognised in the statement of comprehensive income. Such exposures comprise those monetary assets and liabilities that are not denominated in the Company’s functional currency. In order to protect the Company’s Sterling statement of financial position and reduce cash flow risk, the Company uses forward foreign exchange contracts to hedge foreign exposures arising on forecast receipts and payments in foreign currencies.
The following table shows the Company’s foreign currency denominated cash balances:
Functional currency
2013US Dollars
£m
2013Other
£m
2013Total
£m
2012US Dollars
£m
2012Other
£m
2012Total
£m
Sterling 176.7 14.0 190.7 177.8 4.6 182.4Total 176.7 14.0 190.7 177.8 4.6 182.4
The following table shows the functional currency of the Company’s equity investments:
Functional currency
2013Listed
equity atvaluation
£m
2013Unlistedequity atvaluation
£m
2013
Total£m
2012Listed
equity atvaluation
£m
2012Unlistedequity atvaluation
£m
2012
Total£m
Sterling – 21.1 21.1 – 20.6 20.6US dollars 8.8 1,434.4 1,443.2 – 1,306.6 1,306.6South African rand – 6.3 6.3 – 12.7 12.7Indian rupees – 34.5 34.5 – 12.1 12.1Chinese yuan – 24.8 24.8 – 17.4 17.4Euro – 100.2 100.2 – 73.2 73.2Ugandan shillings 10.6 – 10.6 34.1 – 34.1Other – 0.1 0.1 – 0.3 0.3Total 19.4 1,621.4 1,640.8 34.1 1,442.9 1,477.0
Notes to the AccountsContinued
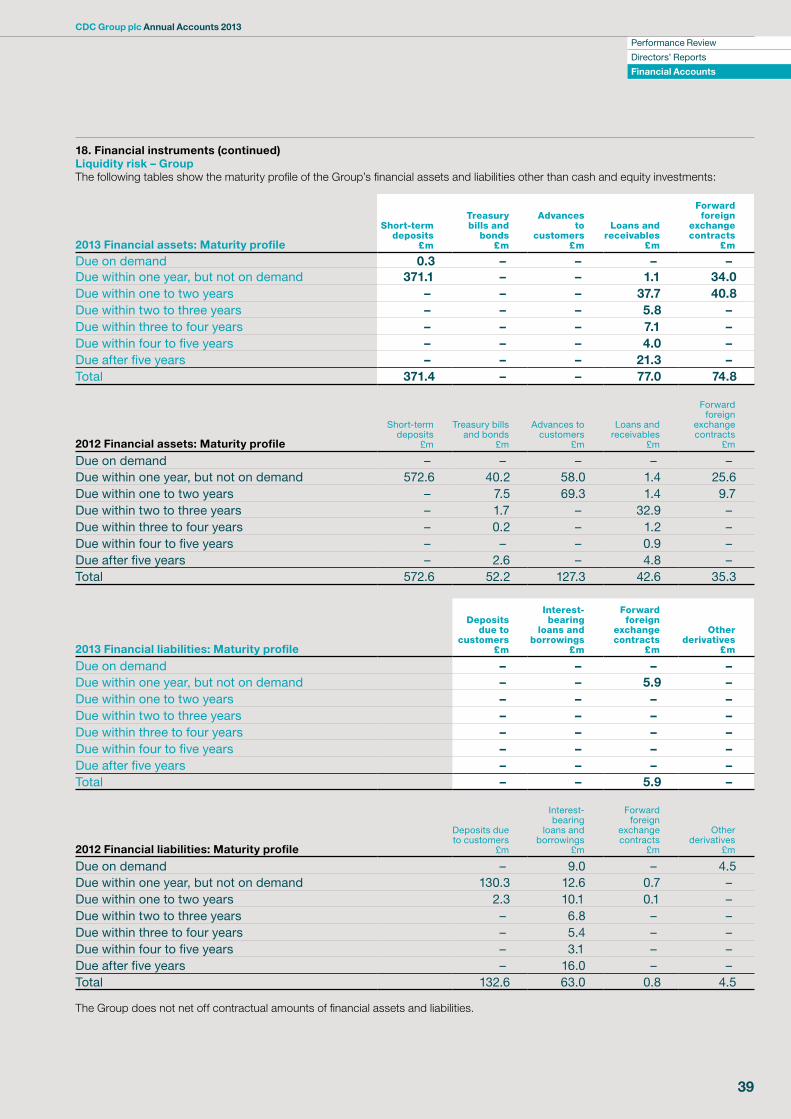
Performance Review
Directors’ Reports
Financial Accounts
CDC Group plc Annual Accounts 2013
39
18. Financial instruments (continued) Liquidity risk – GroupThe following tables show the maturity profile of the Group’s financial assets and liabilities other than cash and equity investments:
2013 Financial assets: Maturity profile
Short-term deposits
£m
Treasury bills and
bonds£m
Advances to
customers£m
Loans and receivables
£m
Forward foreign
exchange contracts
£m
Due on demand 0.3 – – – –Due within one year, but not on demand 371.1 – – 1.1 34.0Due within one to two years – – – 37.7 40.8Due within two to three years – – – 5.8 –Due within three to four years – – – 7.1 –Due within four to five years – – – 4.0 –Due after five years – – – 21.3 –Total 371.4 – – 77.0 74.8
2012 Financial assets: Maturity profile
Short-term deposits
£m
Treasury bills and bonds
£m
Advances to customers
£m
Loans and receivables
£m
Forward foreign
exchange contracts
£m
Due on demand – – – – –Due within one year, but not on demand 572.6 40.2 58.0 1.4 25.6Due within one to two years – 7.5 69.3 1.4 9.7Due within two to three years – 1.7 – 32.9 –Due within three to four years – 0.2 – 1.2 –Due within four to five years – – – 0.9 –Due after five years – 2.6 – 4.8 –Total 572.6 52.2 127.3 42.6 35.3
2013 Financial liabilities: Maturity profile
Deposits due to
customers£m
Interest-bearing
loans and borrowings
£m
Forward foreign
exchange contracts
£m
Other derivatives
£m
Due on demand – – – –Due within one year, but not on demand – – 5.9 –Due within one to two years – – – –Due within two to three years – – – –Due within three to four years – – – –Due within four to five years – – – –Due after five years – – – –Total – – 5.9 –
2012 Financial liabilities: Maturity profile
Deposits due to customers
£m
Interest-bearing
loans and borrowings
£m
Forward foreign
exchange contracts
£m
Other derivatives
£m
Due on demand – 9.0 – 4.5Due within one year, but not on demand 130.3 12.6 0.7 –Due within one to two years 2.3 10.1 0.1 –Due within two to three years – 6.8 – –Due within three to four years – 5.4 – –Due within four to five years – 3.1 – –Due after five years – 16.0 – –Total 132.6 63.0 0.8 4.5
The Group does not net off contractual amounts of financial assets and liabilities.
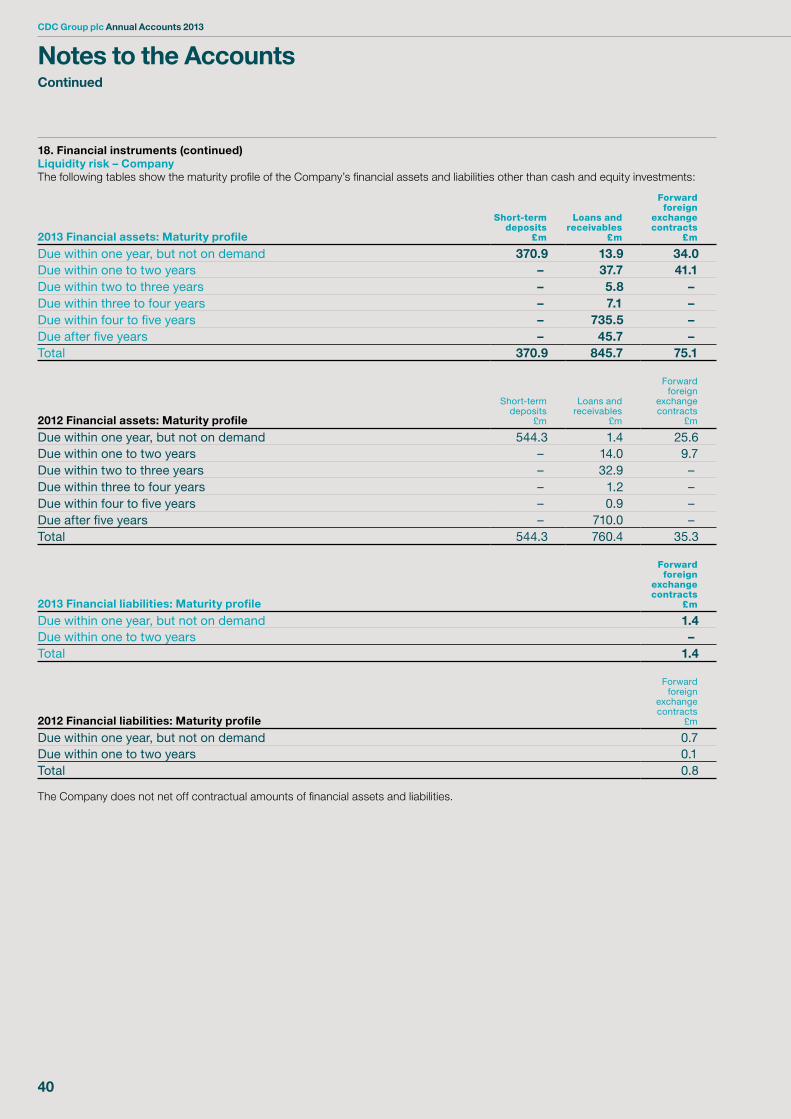
CDC Group plc Annual Accounts 2013
40
18. Financial instruments (continued) Liquidity risk – CompanyThe following tables show the maturity profile of the Company’s financial assets and liabilities other than cash and equity investments:
2013 Financial assets: Maturity profile
Short-term deposits
£m
Loans and receivables
£m
Forward foreign
exchange contracts
£m
Due within one year, but not on demand 370.9 13.9 34.0Due within one to two years – 37.7 41.1Due within two to three years – 5.8 –Due within three to four years – 7.1 –Due within four to five years – 735.5 –Due after five years – 45.7 –Total 370.9 845.7 75.1
2012 Financial assets: Maturity profile
Short-term deposits
£m
Loans and receivables
£m
Forward foreign
exchange contracts
£m
Due within one year, but not on demand 544.3 1.4 25.6Due within one to two years – 14.0 9.7Due within two to three years – 32.9 –Due within three to four years – 1.2 –Due within four to five years – 0.9 –Due after five years – 710.0 –Total 544.3 760.4 35.3
2013 Financial liabilities: Maturity profile
Forward foreign
exchange contracts
£m
Due within one year, but not on demand 1.4Due within one to two years –Total 1.4
2012 Financial liabilities: Maturity profile
Forward foreign
exchange contracts
£m
Due within one year, but not on demand 0.7Due within one to two years 0.1Total 0.8
The Company does not net off contractual amounts of financial assets and liabilities.
Notes to the AccountsContinued
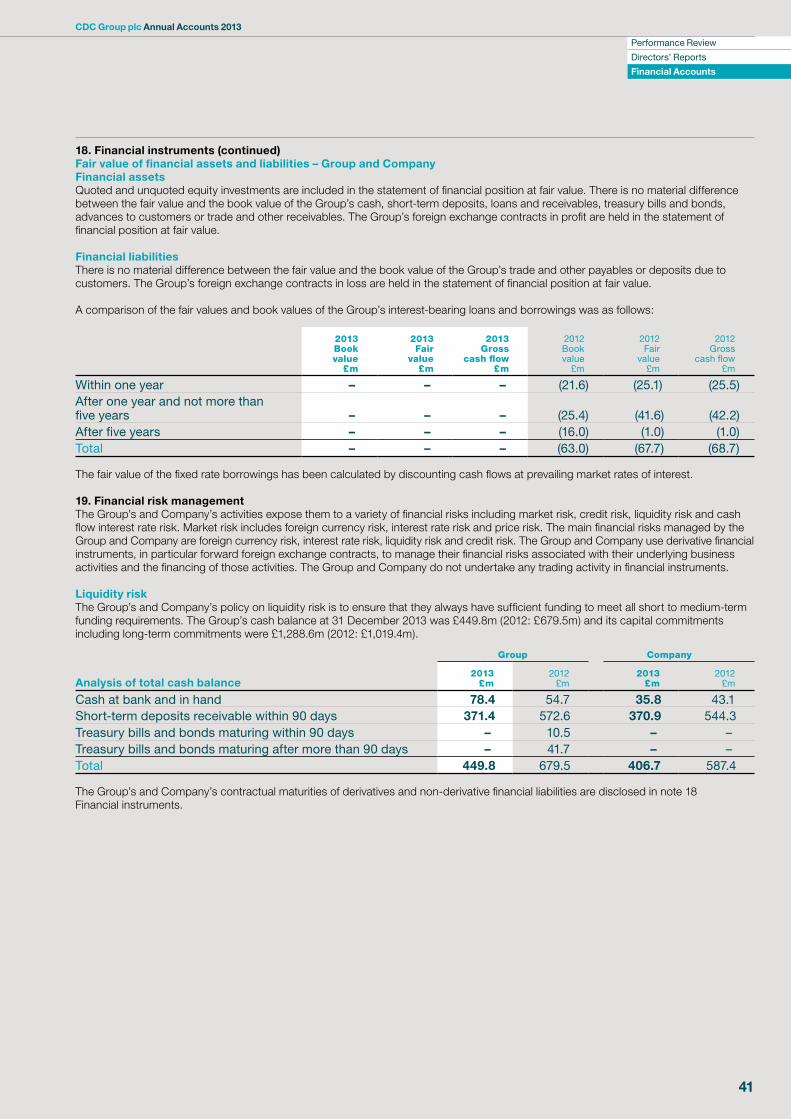
Performance Review
Directors’ Reports
Financial Accounts
CDC Group plc Annual Accounts 2013
41
18. Financial instruments (continued)Fair value of financial assets and liabilities – Group and CompanyFinancial assetsQuoted and unquoted equity investments are included in the statement of financial position at fair value. There is no material difference between the fair value and the book value of the Group’s cash, short-term deposits, loans and receivables, treasury bills and bonds, advances to customers or trade and other receivables. The Group’s foreign exchange contracts in profit are held in the statement of financial position at fair value.
Financial liabilitiesThere is no material difference between the fair value and the book value of the Group’s trade and other payables or deposits due to customers. The Group’s foreign exchange contracts in loss are held in the statement of financial position at fair value.
A comparison of the fair values and book values of the Group’s interest-bearing loans and borrowings was as follows:
2013Book value
£m
2013Fair
value£m
2013Gross
cash flow£m
2012Book value
£m
2012Fair
value£m
2012Gross
cash flow£m
Within one year – – – (21.6) (25.1) (25.5)After one year and not more than five years – – – (25.4) (41.6) (42.2)After five years – – – (16.0) (1.0) (1.0)Total – – – (63.0) (67.7) (68.7)
The fair value of the fixed rate borrowings has been calculated by discounting cash flows at prevailing market rates of interest.
19. Financial risk managementThe Group’s and Company’s activities expose them to a variety of financial risks including market risk, credit risk, liquidity risk and cash flow interest rate risk. Market risk includes foreign currency risk, interest rate risk and price risk. The main financial risks managed by the Group and Company are foreign currency risk, interest rate risk, liquidity risk and credit risk. The Group and Company use derivative financial instruments, in particular forward foreign exchange contracts, to manage their financial risks associated with their underlying business activities and the financing of those activities. The Group and Company do not undertake any trading activity in financial instruments.
Liquidity riskThe Group’s and Company’s policy on liquidity risk is to ensure that they always have sufficient funding to meet all short to medium-term funding requirements. The Group’s cash balance at 31 December 2013 was £449.8m (2012: £679.5m) and its capital commitments including long-term commitments were £1,288.6m (2012: £1,019.4m).
Group Company
Analysis of total cash balance2013
£m2012
£m2013
£m2012
£m
Cash at bank and in hand 78.4 54.7 35.8 43.1Short-term deposits receivable within 90 days 371.4 572.6 370.9 544.3Treasury bills and bonds maturing within 90 days – 10.5 – –Treasury bills and bonds maturing after more than 90 days – 41.7 – –Total 449.8 679.5 406.7 587.4
The Group’s and Company’s contractual maturities of derivatives and non-derivative financial liabilities are disclosed in note 18 Financial instruments.
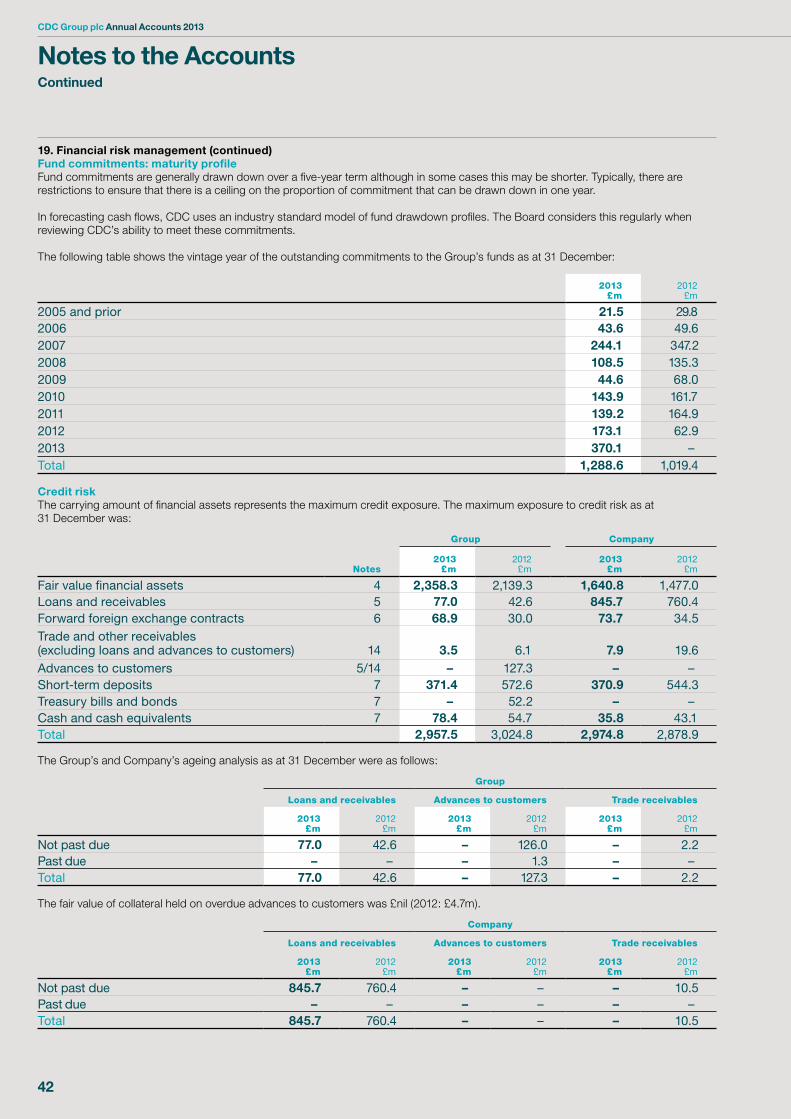
CDC Group plc Annual Accounts 2013
42
19. Financial risk management (continued) Fund commitments: maturity profileFund commitments are generally drawn down over a five-year term although in some cases this may be shorter. Typically, there are restrictions to ensure that there is a ceiling on the proportion of commitment that can be drawn down in one year.
In forecasting cash flows, CDC uses an industry standard model of fund drawdown profiles. The Board considers this regularly when reviewing CDC’s ability to meet these commitments.
The following table shows the vintage year of the outstanding commitments to the Group’s funds as at 31 December:
2013£m
2012£m
2005 and prior 21.5 29.82006 43.6 49.62007 244.1 347.22008 108.5 135.32009 44.6 68.02010 143.9 161.72011 139.2 164.92012 173.1 62.92013 370.1 –Total 1,288.6 1,019.4
Credit riskThe carrying amount of financial assets represents the maximum credit exposure. The maximum exposure to credit risk as at 31 December was:
Group Company
Notes2013
£m2012
£m2013
£m2012
£m
Fair value financial assets 4 2,358.3 2,139.3 1,640.8 1,477.0Loans and receivables 5 77.0 42.6 845.7 760.4Forward foreign exchange contracts 6 68.9 30.0 73.7 34.5Trade and other receivables(excluding loans and advances to customers)
14 3.5
6.1 7.9
19.6
Advances to customers 5/14 – 127.3 – –Short-term deposits 7 371.4 572.6 370.9 544.3Treasury bills and bonds 7 – 52.2 – –Cash and cash equivalents 7 78.4 54.7 35.8 43.1Total 2,957.5 3,024.8 2,974.8 2,878.9
The Group’s and Company’s ageing analysis as at 31 December were as follows:
Group
Loans and receivables Advances to customers Trade receivables
2013£m
2012£m
2013£m
2012£m
2013£m
2012£m
Not past due 77.0 42.6 – 126.0 – 2.2Past due – – – 1.3 – –Total 77.0 42.6 – 127.3 – 2.2
The fair value of collateral held on overdue advances to customers was £nil (2012: £4.7m).
Company
Loans and receivables Advances to customers Trade receivables
2013£m
2012£m
2013£m
2012£m
2013£m
2012£m
Not past due 845.7 760.4 – – – 10.5Past due – – – – – –Total 845.7 760.4 – – – 10.5
Notes to the AccountsContinued
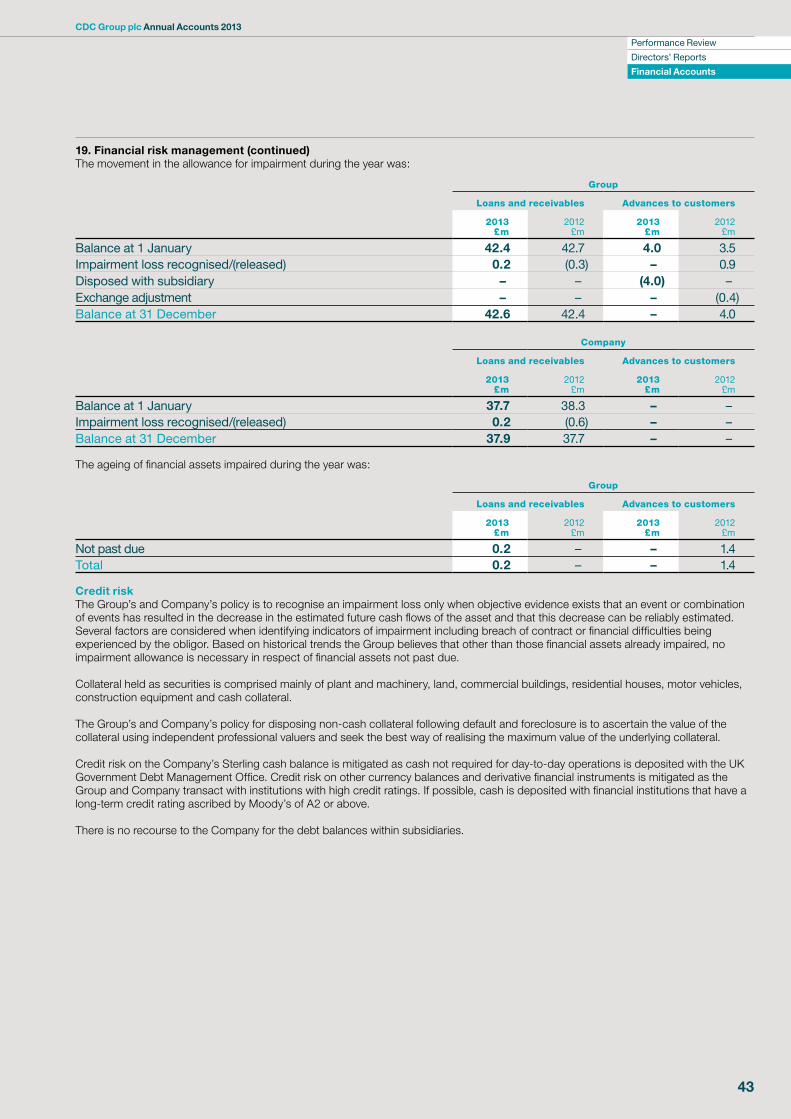
Performance Review
Directors’ Reports
Financial Accounts
CDC Group plc Annual Accounts 2013
43
19. Financial risk management (continued)The movement in the allowance for impairment during the year was:
Group
Loans and receivables Advances to customers
2013£m
2012£m
2013£m
2012£m
Balance at 1 January 42.4 42.7 4.0 3.5Impairment loss recognised/(released) 0.2 (0.3) – 0.9Disposed with subsidiary – – (4.0) –Exchange adjustment – – – (0.4)Balance at 31 December 42.6 42.4 – 4.0
Company
Loans and receivables Advances to customers
2013£m
2012£m
2013£m
2012£m
Balance at 1 January 37.7 38.3 – –Impairment loss recognised/(released) 0.2 (0.6) – –Balance at 31 December 37.9 37.7 – –
The ageing of financial assets impaired during the year was:
Group
Loans and receivables Advances to customers
2013£m
2012£m
2013£m
2012£m
Not past due 0.2 – – 1.4Total 0.2 – – 1.4
Credit riskThe Group’s and Company’s policy is to recognise an impairment loss only when objective evidence exists that an event or combination of events has resulted in the decrease in the estimated future cash flows of the asset and that this decrease can be reliably estimated. Several factors are considered when identifying indicators of impairment including breach of contract or financial difficulties being experienced by the obligor. Based on historical trends the Group believes that other than those financial assets already impaired, no impairment allowance is necessary in respect of financial assets not past due.
Collateral held as securities is comprised mainly of plant and machinery, land, commercial buildings, residential houses, motor vehicles, construction equipment and cash collateral.
The Group’s and Company’s policy for disposing non-cash collateral following default and foreclosure is to ascertain the value of the collateral using independent professional valuers and seek the best way of realising the maximum value of the underlying collateral.
Credit risk on the Company’s Sterling cash balance is mitigated as cash not required for day-to-day operations is deposited with the UK Government Debt Management Office. Credit risk on other currency balances and derivative financial instruments is mitigated as the Group and Company transact with institutions with high credit ratings. If possible, cash is deposited with financial institutions that have a long-term credit rating ascribed by Moody’s of A2 or above.
There is no recourse to the Company for the debt balances within subsidiaries.
CDC Group plc Annual Accounts 2013
44
19. Financial risk management (continued)Market riskInterest rate riskThe Group’s and Company’s interest rate risk arises primarily from fixed rate deposits (fair value risk) and floating rate deposits (cash flow risk).
As at 31 December 2013, the average interest rate earned on the Group’s and Company’s bank deposit was 0.8% (2012: 0.7%). A 0.75% (2012: 0.75%) change in all interest rates, with all other variables held constant, would have a 0.1%, £0.1m impact on the Group’s profit before tax (2012: 0.1%, £0.3m). Although this is within the range the Company regards as acceptable, it is envisaged that the Company will use the majority of its cash balance in meeting its capital commitments.
Foreign currency riskThe Group’s largest exposure is to the US dollar. As at 31 December 2013, £2,175.0m, 92.2% of the investments of the Group and Company, are denominated in US dollars (2012: £2,021.7m, 94.5%). In order to protect the Group’s Sterling statement of financial position and reduce cash flow risk, the Group uses forward foreign exchange contracts to hedge foreign exposures arising on forecast receipts and payments in foreign currencies.
A 17 cent, 10% movement in the average exchange rate for the US dollar against Sterling with all other variables held constant would impact profit by £83.1m (2012: 16 cent (10%) movement, impact: £63.7m).
Equity price riskThe Group and Company invest in a wide range of funds managed by a variety of fund managers, along with a range of direct equity investments.
As at 31 December 2013, the Group and Company had legal commitments to invest in 159 funds (2012: 155 funds) with 88 fund managers (2012: 84 fund managers) as well as 19 direct investments (2012: 7 direct investments). As at 31 December 2013 and 2012, one outstanding balance to Actis Infrastructure Fund II exceeded 5% of the Group’s net assets.
A 10% change in the fair value of the Group’s equity investment would impact the Group’s profit by £235.8m (2012: 10% change, impact £213.9m).
Valuation riskThe Group values its portfolio according to CDC valuation methodology. CDC valuation guidelines have been developed in accordance with the International Private Equity and Venture Capital Valuation Guidelines. Investments are valued at fair value, which is the value at which an orderly transaction would take place between market participants at the reporting date. The detailed valuation methodology sets out best practice with respect to valuing investments. Valuation risks are mitigated by comprehensive reviews of underlying investments in the private equity funds carried out by the managers of the private equity funds at least twice a year. These valuations are reviewed by CDC management and then considered by the Audit, Compliance and Risk Committee. The details of the valuation methodology are given in note 25 to the accounts under the investments heading.
Capital managementCDC considers its capital to be the total equity shown in note 8. The Company’s objectives when managing capital are:
• to comply with the capital requirements set by DFID;
• to safeguard the Group’s ability to continue as a going concern, so that it can continue to provide returns and benefits for stakeholders; and
• to maintain a strong capital base to support the development of the Group’s businesses. The Board monitors the results of the Group and its financial position.
20. Capital commitments and guaranteesAmounts contracted for but not provided for in the accounts amounted to £1,288.6m (2011: £1,019.4m) for subscriptions to debentures, loans and shares.
21. Operating leasesGroup and Company as lesseeFuture minimum rentals payable under non-cancellable operating leases are as follows:
Group Company
2013£m
2012£m
2013£m
2012£m
Within one year 1.7 1.3 1.7 1.3After one year but not more than five years 6.6 6.6 6.6 6.6More than five years 14.3 15.9 14.3 15.9Total 22.6 23.8 22.6 23.8
Notes to the AccountsContinued
Performance Review
Directors’ Reports
Financial Accounts
CDC Group plc Annual Accounts 2013
45
22. Contingent liabilitiesThe Group and the Company had the following contingent liabilities:
• in support of the borrowings of third parties which had a principal value of £42.8m (2012: £nil); and
• in respect of undertakings to power distributors and governments in connection with the operation of power generating subsidiaries with a maximum legal liability of £9.3m (2012: £9.4m).
These may, but probably will not, require an outflow of resources.
23. Related party transactionsDuring the year, the Company entered into transactions with its subsidiary companies.
The transactions entered into and trading balances outstanding at 31 December were as follows:
2013£m
2012£m
Statement of comprehensive incomeInterest income 0.1 1.0Dividend income – 9.2Management fee income 6.4 14.5Interest payable (0.1) (0.1)Statement of financial positionFair value financial assets 292.1 232.0Loans and receivables with CDC subsidiaries 768.7 717.8Trade and other receivables 5.3 15.8Trade and other payables (17.3) (31.0)
24. Principal subsidiariesThe principal subsidiaries of CDC Group plc at the end of the year and the percentage of equity capital are set out below. The Company has taken advantage of section 410(2) of the Companies Act 2006 in not detailing all subsidiaries due to the length of the disclosure. A complete list of investments in subsidiaries will be attached to the Company’s annual return made to the Registrar of Companies.
Region/country of incorporation Company Class of sharePercentage
held by CDC Principal activities
AfricaMauritius CDC South Asia Limited Ordinary 100 Investment holdingEuropeGuernsey CDC Holdings Guernsey Limited Ordinary 100 Investment holding
CDC Group plc Annual Accounts 2013
46
25. Summary of significant accounting policiesThe accounting policies for intangible assets, property, plant and equipment are no longer specified as they are no longer material to the Group or Company.
Non-current assetsInvestmentsThe Group and Company classify their investments, including the Company’s investments in subsidiaries, as financial assets at fair value through profit and loss and loans and receivables. Management determines the classification of its investments at initial recognition. Apart from loans and receivables, financial instruments are designated as fair value through profit and loss because the fair value can usually be measured reliably and the fair value of the investment portfolio is a key performance indicator for the Group.
Financial assets at fair value through profit and lossThese financial assets are designated as assets held at fair value through profit and loss by management at the date of inception. Derivatives are also classified as held for trading in this category unless they are designated as hedges. Assets in this category are classified as current assets if they are either held for trading or are expected to be realised within 12 months of the statement of financial position date.
The Group’s fair value methodology has been derived using the International Private Equity and Venture Capital Valuation Guidelines. This methodology is applied to direct investments and investments held within funds. The approach to calculating the fair value is as follows:
• the enterprise value is determined for the investee company or fund using a methodology that is appropriate in light of the nature, facts and circumstances of the investment and its materiality in the context of the total investment portfolio using reasonable assumptions and estimates;
• the enterprise value is adjusted for surplus assets or liabilities or any other relevant factor;
• higher ranking financial instruments are deducted taking into account any financial structuring that may dilute the investment holding;
• the net attributable enterprise value is apportioned between the financial instruments held according to their ranking; and
• the amounts derived are allocated according to the holding in each financial instrument, representing their fair value.
Valuation methodologies used are as follows:
• investments where fair value derives mainly from the underlying assets, such as funds managed by fund managers, are valued at net asset value using appropriate valuation measures for the underlying assets and liabilities;
• quoted equity is valued at the bid price;
• realisations in process are valued at the expected realisation proceeds, although discounts are applied to reflect the level of certainty of the transaction completion;
• if there has been a recent investment in the company, the price of the recent investment, less any impairment charge, is used to determine fair value;
• early stage companies without positive cash flow or profit are valued using an appropriate industry benchmark if that gives a reliable estimate of fair value;
• companies with maintainable profits or cash flows are valued on an earnings basis using an appropriate earnings multiple from companies in similar sectors and markets;
• companies in industries with specific valuation metrics are valued using those specific valuation metrics where they provide the most reliable estimate of fair value;
• companies with no maintainable profits or cash flows at present, but whose cash flows can be forecast with confidence, are valued using future cash flows discounted at the appropriate risk-adjusted discount rate; and
• in exceptional cases, where fair value cannot be reliably measured, the investment is valued at the previous carrying value unless there is evidence of value impairment, in which case value is reduced to reflect the extent of estimated impairment.
Gains and losses realised on disposal or redemption, by reference to the valuation at the previous statement of financial position date and unrealised gains and losses from changes in the fair values of the equity portfolio are taken to the statement of comprehensive income.
The Group uses settlement date accounting when accounting for regular purchases or sales. When the Group becomes party to a sales contract of an equity investment, it de-recognises the asset on the day ownership is transferred. Any gains or losses arising on purchases between trade and settlement date are accounted for in the statement of comprehensive income.
Loans and receivablesLoans and receivables are non-derivative financial assets with fixed or determinable payments that are not quoted in an active market. These arise either when the Group provides money to a counterparty in the form of loans with no intention of trading it, or, in the case of trade receivables, in the normal course of business.
Loans are recognised at amortised cost; initially, this is measured as the fair value of the cash given to originate the loan. They are subsequently measured at amortised cost using the effective interest method. Maturities greater than 12 months are included in non-current assets with the remainder in current assets. Gains or losses are recognised in the statement of comprehensive income when the loan is de-recognised or impaired, as well as through the amortisation process. Where there is objective evidence that a loan’s carrying value exceeds the present value of the discounted future cash flows expected to be generated from the asset, the loan is deemed to be impaired and the carrying value reduced accordingly, with the loss recognised in the statement of comprehensive income.
Forward foreign exchange contracts (‘FFECs’)The Group and Company use FFECs as part of their asset management activities to manage exposures to foreign currency risk. The Company does not use FFECs for speculative purposes.
Gains and losses on FFECs transacted as economic hedges but not qualifying for hedge accounting are taken to the statement of comprehensive income.
Notes to the AccountsContinued
Performance Review
Directors’ Reports
Financial Accounts
CDC Group plc Annual Accounts 2013
47
25. Summary of significant accounting policies (continued)Cash and cash equivalentsCash and cash equivalents include cash in hand, deposits held at call with banks and other short-term highly liquid investments, such as short-term deposits, with maturities of three months or less on initial recognition.
Impairment of assetsThe carrying amounts of assets, other than inventories, deferred tax assets, financial instruments, investment properties, biological assets and retirement benefit assets are reviewed at each statement of financial position date to determine whether there is any indication of impairment.
If any such indication exists, the recoverable amount of the asset is estimated. For goodwill, the recoverable amount is estimated at each statement of financial position date. An impairment loss is recognised whenever the carrying amount of an asset or its cash-generating unit exceeds its recoverable amount. Impairment losses are recognised in the statement of comprehensive income.
The recoverable amount of the Group’s assets is the greater of their fair value less costs to sell and value in use, calculated as the present value of expected future cash flows. For an asset that does not generate largely independent cash inflows, the recoverable amount is determined for the cash-generating unit to which the asset belongs.
An impairment loss in respect of all assets other than goodwill is reversed if a subsequent increase in recoverable amount can be related objectively to an event occurring after the impairment loss was recognised or if there has been a change in the estimates used to calculate the recoverable amount. An impairment loss is reversed only to the extent that the asset’s carrying amount does not exceed the carrying amount that would have been determined, net of depreciation or amortisation, if no impairment loss had been recognised.
Financial liabilitiesFinancial liabilities are initially measured at fair value less any directly attributable transaction costs. Subsequent to initial recognition, contractual obligations, excluding derivative financial instruments, to deliver cash or another financial asset to another entity are measured at amortised cost using the effective interest method.
Provisions, contingent liabilities and contingent assets Provisions are recognised if there is a present obligation, whether legal or constructive, which has arisen as a result of a past event; it is probable that an outflow of resources will be required to settle the obligation; and a reliable estimate can be made of the amount of the obligation.
Contingent liabilities are disclosed where the existence of an obligation will only be confirmed by future events or where the amount of the obligation cannot be measured with reasonable reliability.
Contingent assets are not recognised, but are disclosed where an inflow of economic benefits is probable.
IncomeIncome is recognised to the extent that it is probable that the economic benefits will flow to the Group and can be reliably measured. The following specific recognition criteria must also be met before income is recognised:
DividendsDividend income is recognised when the right to receive payment is established. Where the right to receive a dividend is in doubt, dividends are recorded on the date of receipt.
InterestThe interest on a loan investment and guarantees is recognised on a time apportioned basis so as to reflect the effective yield on the loan. Where there is objective evidence of loss of value or uncollectibility of loan interest, for example where loan interest remains unpaid after 90 days, a provision is recognised.
Fees and commission income that are an integral part of the effective interest rate of a financial instrument, such as a loan instrument, are recognised as an adjustment to the effective interest rate.
Employee benefitsThe Company operates a funded defined benefit pension scheme in the UK, called the CDC Pensions Scheme, for staff who entered service prior to 1 April 2000. There is a defined contribution section for subsequent entrants.
The CDC Pensions Scheme is funded by the payment of contributions to a separately administered trust fund. The cost of providing benefits under the Company’s funded defined benefit plan is determined using the projected unit credit actuarial valuation method, with actuarial valuations being carried out triennially.
The costs of providing defined contribution pensions are charged to the statement of comprehensive income as they become payable.
The cost of the performance related compensation programme is accrued across the lifetime of the scheme.
Income taxThe CDC Act 1999 provided the Company with exemption from UK corporation tax with effect from 1 May 2003. This does not affect overseas taxation of the Company or of its overseas subsidiaries.
Current tax is recognised as income or expense and is included in the net profit for the year, unless it relates to a transaction or event which is recognised directly in equity, whereupon the current tax is charged or credited to equity accordingly.
Current and deferred tax assets and liabilities are offset only when they arise from the same tax reporting group and relate to the same tax authority and when the legal right to offset exists.
Current and deferred taxes are recognised as a tax credit or expense in the year in which they arise except for deferred taxes recognised or disposed of upon the acquisition or disposal of a subsidiary.
CDC Group plc Annual Accounts 2013
48
25. Summary of significant accounting policies (continued)Deferred tax is provided in full using the liability method on temporary differences arising between the tax bases of assets and liabilities and their carrying amounts in the Group financial statements. Deferred tax is measured on an undiscounted basis at the tax rates that are expected to apply in the periods in which temporary differences reverse, based on tax rates and laws enacted or substantially enacted at the statement of financial position date.
Deferred tax assets are recognised only to the extent that the Directors consider that it is probable that there will be suitable taxable profits from which the future reversal of the underlying temporary differences can be deducted.
Operating leasesWhere the Group does not retain the risks and rewardsof ownership on a leased asset, the lease is classified as an operating lease. Payments on operating leases are recognised as an expense in the statement of comprehensive income on a straight-line basis over the lease term.
Assets leased out under operating leases are included in property, plant and equipment and depreciated over their estimated useful lives. Rental income, including the effect of lease incentives, is recognised on a straight-line basis over the lease term.
Operating segmentsIFRS 8 Operating Segments requires an entity to present segment information on the same basis as the financial information which is reviewed regularly by management to assess performance. The information set out in note 2 presents the summarised financial information in order to explain more fully CDC’s investment activities, together with the financial results that are presented under IFRS in which CDC consolidates all businesses where it has a controlling interest.
Discontinued operationA discontinued operation is a component of the Group’s business, the operations and cash flows of which can be clearly distinguished from the rest of the Group and which:
• represents a separate major line of the business or geographical area of operations;
• is part of a single co-ordinated plan to dispose of a separate major line of business or geographical area of operations; or
• is a subsidiary acquired exclusively with a view to resale.
Classification as a discontinued operation occurs at the earlier of disposal or when the operation meets the criteria to be classified as held-for-sale.
When an operation is classified as a discontinued operation, the comparative statement of comprehensive income is re-presented as if the operation had been discontinued from the start of the comparative year.
IFRSs issued but not yet effectiveThe accounting policies set out in these financial statements have been applied consistently to all periods presented. The following standards are issued but not yet effective, and have not been applied to these financial statements. The impact of these is not expected to be material.
• IFRS 9: Financial Instruments (replacement of IAS 39);
• IFRS 10: Consolidation Financial Statements;
• IFRS 11: Joint Arrangements;
• IFRS 12: Disclosure of Interests in Other Entities;
• Offsetting Financial Assets and Financials Liabilities (amendments to IAS 32);
• IAS 27: Consolidated and Separate Financial Statements; and
• IAS 28: Investments in Associates and Joint Ventures.

CDC Group plcFirst Floor123 Victoria StreetLondon SW1E 6DE
T +44 (0)20 7963 4700F +44 (0)20 7963 [email protected]
Registered in England No 3877777
VAT registration number 774 1067 28
This report is printed on Evolution 100 recycled which is FSC accredited and made from 100% post-consumer recycled fibre.
Designed and produced by Rare Corporate Design, London. www.rarecorporate.co.ukwww.fsc.org
Cert no. TT-COC-003106
CDC Group plc Annual Accounts 2013

CD
C G
rou
p plc A
nn
ual A
ccou
nts 2013