cdcs’ quality assurance and harmonization activities · cdcs’ quality assurance and...
TRANSCRIPT
CDC’s Quality Assurance and Harmonizat ion Act ivit ies
Normalizat ion of NBS Laboratory MS/MS Biomarker Results and the Development of a New Generat ion of Proficiency Test ing Materials
Kostas Petrit is, PhD Chief, Biochemical Mass Spectrometry Laboratory Newborn Screening and Molecular Biology Branch
Secretary’s Advisory Committee on Heritable Disorders in Newborns and Children Meeting
Washington, D.C., May 9, 2018
National Center for Environmental Health Division of Laboratory Sciences

Services Provided by CDC’s Newborn Screening Quality Assurance Program (NSQAP)
The only comprehensive NBS quality assurance program using dried blood spots
Proficiency testing Quality control materials Linearity materials
Filter paper evaluation Training and consultation NBS translation research
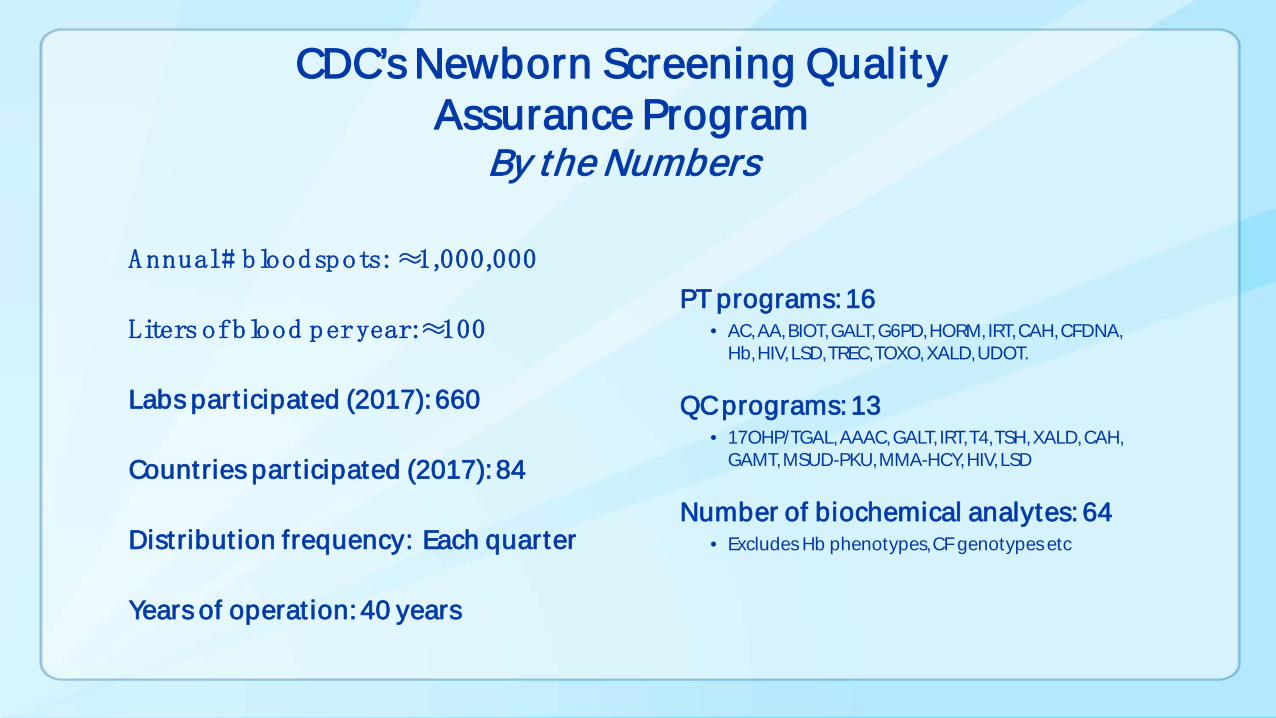
CDC’s Newborn Screening Quality Assurance Program
By the Numbers
PT programs: 16 • AC, AA, BIOT, GALT, G6PD, HORM, IRT, CAH, CFDNA,
Hb, HIV, LSD, TREC, TOXO, XALD, UDOT.
QC programs: 13 • 17OHP/TGAL, AAAC, GALT, IRT, T4, TSH, XALD, CAH,
GAMT, MSUD-PKU, MMA-HCY, HIV, LSD
Number of biochemical analytes: 64 • Excludes Hb phenotypes, CF genotypes etc
A nnual # bloodspots: ≈ 1,000,000
Liters of blood per year: ≈ 100
Labs part icipated (2017): 660
Countries part icipated (2017): 84
Distribut ion frequency: Each quarter
Years of operat ion: 40 years

NORMALIZATION OF NBS LABORATORY MS/MS BIOMARKER RESULTS

MS/MS Biomarker Measurements and Cutoffs Can Vary Significant ly Among Different Labs
>70% (23/32) of RUSP bloodspot disorders can be screened by MS/MS
Extraction methodologies Derivatized vs. non-derivatized Failure to account for analyte recovery
efficiency (most labs do not) Use of additional/different analytes per disorder
or second-tier screening
Population tested Instrumentation Internal standards Calibration Techniques Standard Calibration Materials
MS/MS analyte results and cutoff values vary due to:
Major Contributors
• Extraction methodologies • Derivatized vs. non-derivatized • Few labs account for analyte recovery, most labs do not • Use of additional/different analytes per disorder or
second-tier screening
Other Factors
• Population tested • Instrumentation • Internal standards • Calibration techniques
RUSP: Recommended Uniform Screening Panel

Method-specific Variability in C5DC Cutoffs in U.S. NBS Laboratories
[C5D
C cu
toff]
(µM
ol/L
)
+SD
Mean cutoff
-SD
0.75
0.50
0.25
0.00
1 2 3 4 Method Platform
C5DC: Glutarylcarnit ine, CV: Coefficient of Variat ion, SD: Standard Deviat ion

How normalizat ion works: Simple analogy: Normalizat ion of thermometer results
Liquid-in-Glass Thermometer (⁰C)
Fever at: 38 ⁰C
Cutoff for Fever
Fever at: 100.4 ⁰F
Plat inum Resistance Thermometer (⁰F)
Plat
inum
Res
ista
nce
Ther
mom
eter
(⁰F)
Room Temperature
Oven
Refrigerator
Liquid-in-Glass Thermometer (⁰C)
Freezer -150
-100
-50
0
50
100
150
200
250
-100 -50 0 50 100 150
y = 1.8x + 32

How normalizat ion works: Use of CDC Quality Control (QC) bloodspot materials
to normalize mass spectrometry results
Same idea as previous slide but instead of :
Thermometers … we use Mass Spectrometers Four different temperatures … we use 4 different concentrations of each biomarker in QC Samples
QC Mass Spectrometry Materials for Amino Acids and Acylcarnit ines (AAAC)
NBS laboratories could use the QC materials to answer the following quest ions:
29 biomarkers
4 concentration levels
5 duplicate MS/MS inter-day
runs of each level
Data reported back to CDC
What is the variability of each instrument within the same day?
What is the variability of each instrument
between days?
How similar are the results between instruments?

Addressing Succinylacetone (SUAC) Lab-to-Lab Variability by Normalizing Results
St
ate
Lab
[SUA
C] (µ
Mol
/L)
CDC [SUAC] (µMol/L)
Use QCs to normalize Use PTs to validate the normalization worked
Expectation:
NBS labs receive the same PT specimens PT analytical results should be the same
Methods: FIA-MS/MS results PT specimens are analyzed only once QC and PT results from US Q3 2016
event
Concentrat ions at µmol/L, SUAC: Succinylacetone, PT: Proficiency Test, FIA: Flow Inject ion Analysis

Addressing SUAC Lab-to-Lab Variability by Normalizing Results
Times Difference between Lab A and Lab C
Normalizat ion Before After 5.9 1.12
Normalizat ion Before After 5.4 1.28
CDC cut-off : The mean of all US State laboratories non-normalized cut-offs
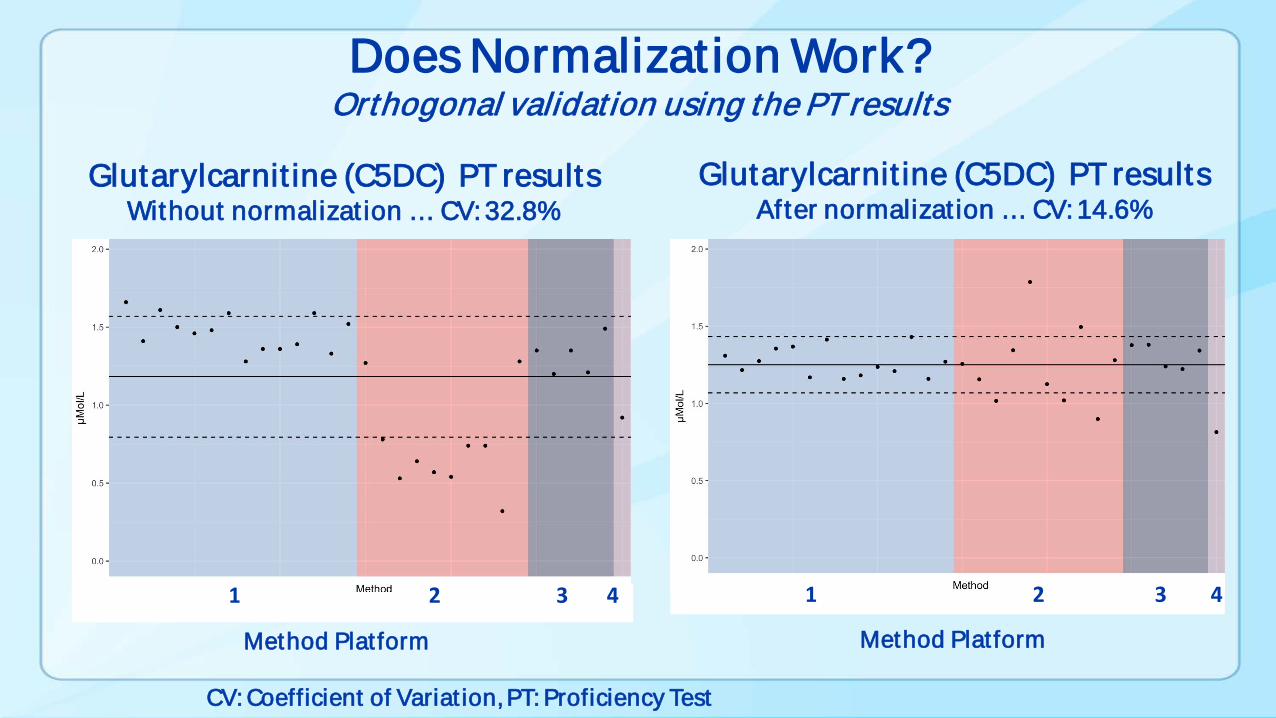
Does Normalizat ion Work? Orthogonal validat ion using the PT results
Glutarylcarnit ine (C5DC) PT results Without normalizat ion … CV: 32.8%
Glutarylcarnit ine (C5DC) PT results After normalizat ion … CV: 14.6%
CV: Coefficient of Variat ion, PT: Proficiency Test
Method Platform Method Platform
1 2 3 4 1 2 3 4
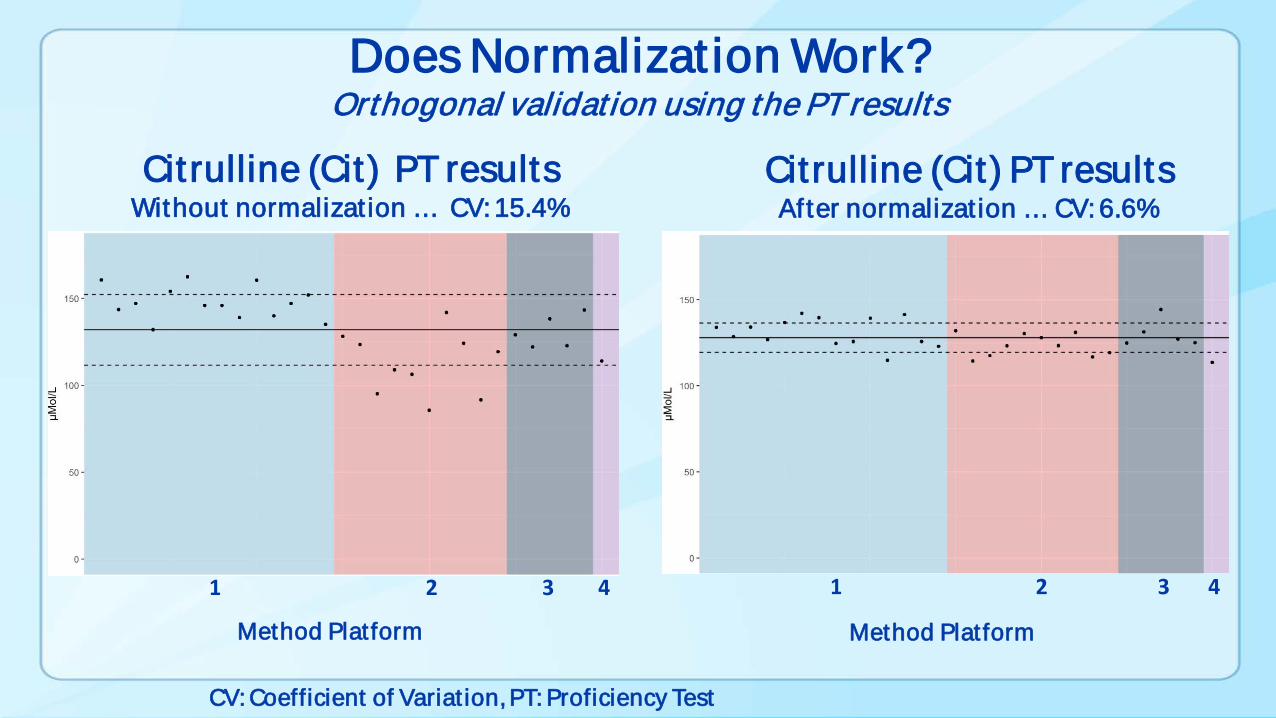
Does Normalizat ion Work? Orthogonal validat ion using the PT results
Citrulline (Cit) PT results Without normalizat ion … CV: 15.4%
Citrulline (Cit) PT results After normalizat ion … CV: 6.6%
1 2 3 4
Method Platform
1 2 3 4
Method Platform
CV: Coefficient of Variat ion, PT: Proficiency Test

Does Normalizat ion Work? Orthogonal validat ion using the PT results
Malonylcarnit ine (C3DC) PT results Without normalizat ion … CV: 56.7%
Malonylcarnit ine (C3DC) PT results After normalizat ion … CV: 18.7%
1 2
Method Platform
1 2
Method Platform
CV: Coefficient of Variat ion, PT: Proficiency Test
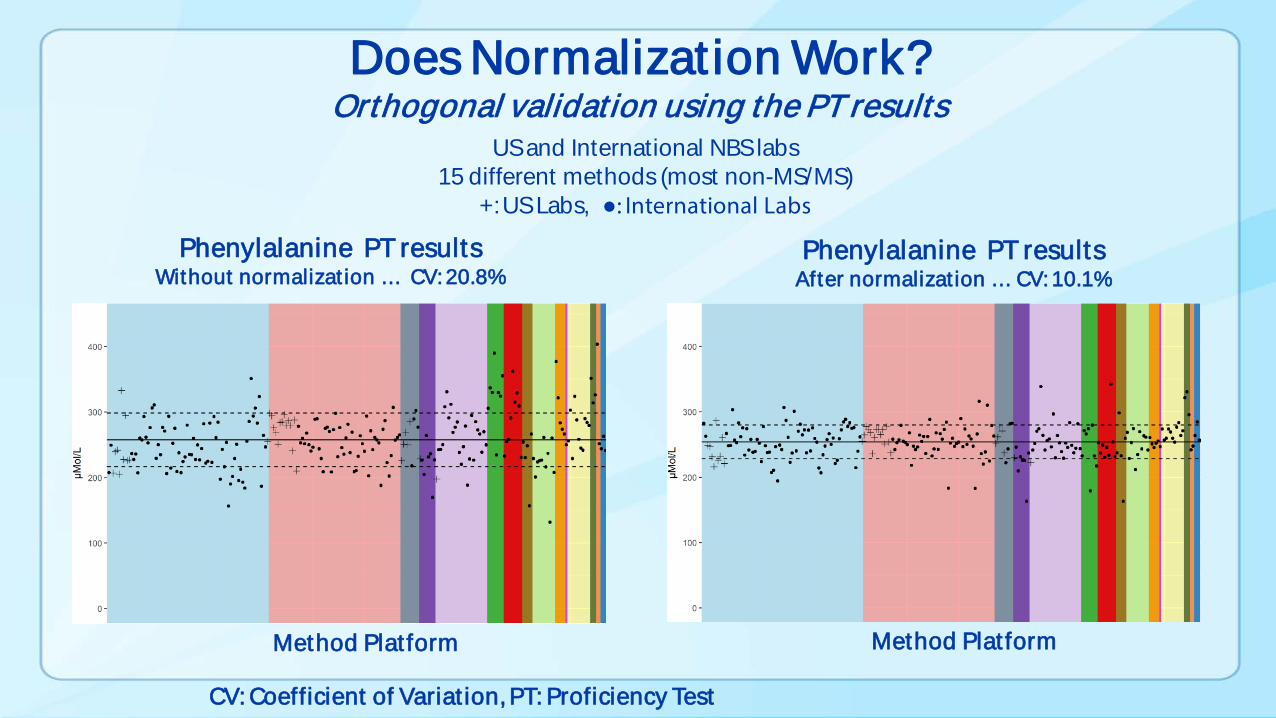
Does Normalizat ion Work? Orthogonal validat ion using the PT results
US and International NBS labs 15 different methods (most non-MS/MS)
+: US Labs, ●: International Labs Phenylalanine PT results
Without normalizat ion … CV: 20.8% Phenylalanine PT results
After normalizat ion … CV: 10.1%
Method Platform Method Platform
CV: Coefficient of Variat ion, PT: Proficiency Test

NBS labs LC-MS/MS biomarker CV results before and after normalizat ion
Biomarker Raw Normalized Raw NormalizedC3DC 56.7% 18.7% 54.5% 24.3%SUAC 50.8% 24.5% 148.4% 31.7%Arg 34.7% 18.2% 37.3% 22.1%
C5DC 32.8% 14.6% 39.5% 19.5%C16OH 23.1% 14.9% 70.5% 21.4%
Val 19.9% 15.0% 22.9% 12.6%C5OH 19.8% 16.2% 36.0% 14.8%C0(L) 19.0% 15.9% 20.5% 13.7%
C5 18.8% 13.2% 17.9% 12.0%C10 17.7% 12.3% 24.1% 12.9%Cit 15.4% 6.6% 22.6% 13.0%C18 15.3% 11.6% 20.2% 16.8%
US Labs US + International labsBiomarker Raw Normalized Raw Normalized
Met 14.8% 9.5% 22.9% 12.4%C4 14.3% 10.0% 18.0% 12.0%
C18OH 13.3% 11.7% 49.4% 21.9%Phe 13.1% 7.9% 20.8% 10.1%Tyr 12.7% 9.0% 19.0% 15.7%C8 12.2% 11.9% 19.7% 15.1%C3 12.1% 9.7% 20.4% 16.6%C6 10.9% 10.7% 20.9% 15.5%
Leu 10.8% 8.2% 18.2% 10.1%C14 8.5% 8.2% 19.1% 15.2%C16 7.2% 7.1% 14.9% 13.3%
US Labs US + International labs
Note: The represents data from CDC’s NSQAP Proficiency Test ing Program in the 3rd Quarter of 2016

Normalizat ion of MS/MS results allows the normalizat ion of cutoffs
Glutarylcarnit ine (C5DC) US labs cutoffs Without normalizat ion … CV: 45.55%
Glutarylcarnit ine (C5DC) US labs cutoffs After normalizat ion … CV: 30.22%
NBS labs with high biomarker normalized cutoffs could reevaluate them
1 2 3 4
Method Platform 1 2 3 4
Method Platform
C5DC: Glutarylcarnit ine, CV: Coefficient of Variat ion, PT: Proficiency Test

DEVELOPMENT OF A NEW GENERATION OF PROFICIENCY TESTING MATERIALS
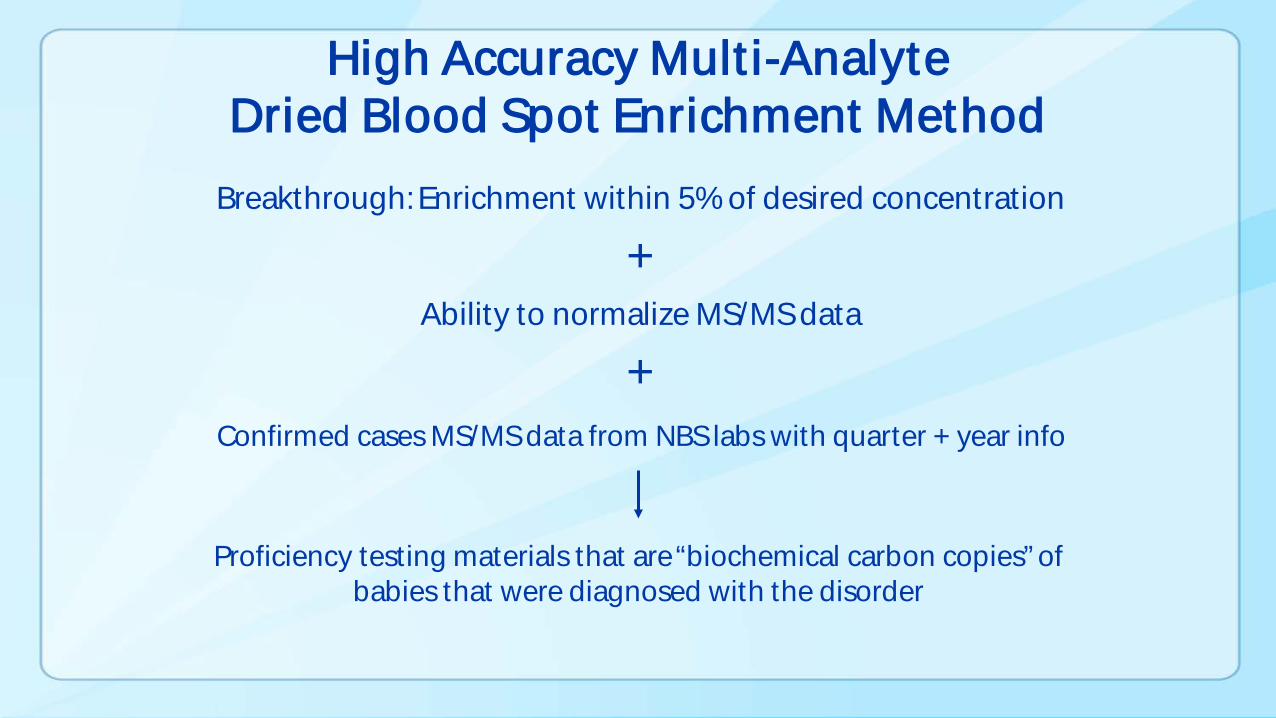
High Accuracy Mult i-Analyte Dried Blood Spot Enrichment Method
Breakthrough: Enrichment within 5% of desired concentration
+ Ability to normalize MS/MS data
+ Confirmed cases MS/MS data from NBS labs with quarter + year info
Proficiency testing materials that are “biochemical carbon copies” of babies that were diagnosed with the disorder

New Generat ion of PT materials When: July Shipment (Q3-2018 PT event) What: Proficiency testing materials that are “biochemical carbon copies” of babies that were diagnosed with the disorder for the analytes and ratios of interest Which ones: Amino acid, Fatty Acid Oxidation and Organic Acid Disorders Where: From MS/MS data submitted to CDC from US state labs that contained quarter and year of specimen collection information How: Report as usual, working on updating NSQAP website Interpret ive algorithms: Q3 2018 PTs should work with any workflow, including reflex to biochemical second-tier screening
Looking forward to feedback from NBS labs!

Future Direct ions CDC will continue to improve normalization and visualization of the results and
will expand the number of analytes in QC materials
High accuracy multi-analyte bloodspot enrichment will allow the creation of borderline materials for educational purposes
CDC will be creating reference materials for MS/MS kits to use for difference applications, including: Changes of instrumentation, method, kit lots Abnormal and borderline specimens to assess cut-offs Linearity materials for method performance Provide assistance for method development, validation
CDC is redesigning the data reporting website to improve QC and PT data
submission and to accommodate expanded programs
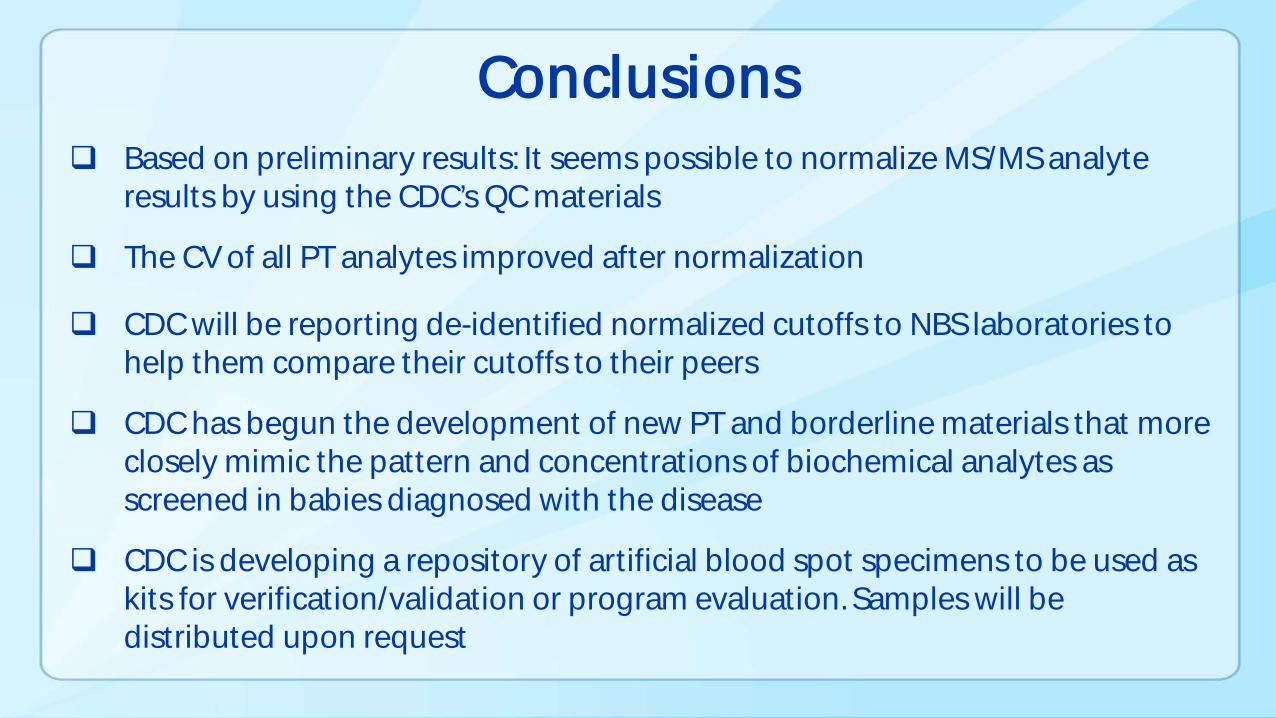
Conclusions Based on preliminary results: It seems possible to normalize MS/MS analyte
results by using the CDC’s QC materials
The CV of all PT analytes improved after normalization CDC will be reporting de-identified normalized cutoffs to NBS laboratories to
help them compare their cutoffs to their peers
CDC has begun the development of new PT and borderline materials that more closely mimic the pattern and concentrations of biochemical analytes as screened in babies diagnosed with the disease
CDC is developing a repository of artificial blood spot specimens to be used as kits for verification/validation or program evaluation. Samples will be distributed upon request

Acknowledgments
CDC
Austin Pickens Brandon Kenwood
Chris Haynes Tim Lim
Sharon Flores Carter Asef
Elizabeth Hall Gyliann Pena
Victor De Jesus Joanne Mei
Carla Cuthbert
US NBS labs (normalizat ion)
Mary Seeterlin, Michigan Patrice Held, Wisconsin
Adrienne Manning, Connecticut Sonal Bhakta, Arizona
Mark Morrissey, New York
Many thanks to all NBS laboratories that submitted
de-identified confirmed cases data to CDC

Thank you for your attention!
For more information please contact Centers for Disease Control and Prevention 1600 Clifton Road NE, Atlanta, GA 30333 Telephone: 1-800-CDC-INFO (232-4636)/TTY: 1-888-232-6348 Visit: www.cdc.gov | Contact CDC at: 1-800-CDC-INFO or www.cdc.gov/info The findings and conclusions in this report are those of the authors and do not necessarily represent the official position of the Centers for Disease Control and Prevention.
Use of trade names and commercial sources in this presentation is for identification only and does not imply endorsement by the Division of Laboratory Sciences,, National Center for Environmental Health, Centers for Disease Control and Prevention, the Public Health Service, or the U.S. Department of Health and Human Services.
National Center for Environmental Health Division of Laboratory Sciences