cdm executive board project design document ...viet ma co., ltd. currently produces approximately...
TRANSCRIPT

PROJECT DESIGN DOCUMENT FORM (CDM-SSC-PDD) - Version 03 CDM – Executive Board
1
CLEAN DEVELOPMENT MECHANISM PROJECT DESIGN DOCUMENT FORM (CDM-SSC-PDD)
Version 03 - in effect as of: 22 December 2006
CONTENTS A. General description of the small scale project activity B. Application of a baseline and monitoring methodology C. Duration of the project activity / crediting period D. Environmental impacts E. Stakeholders’ comments
Annexes Annex 1: Contact information on participants in the proposed small scale project activity Annex 2: Information regarding public funding Annex 3: Baseline information
Annex 4: Monitoring Information
Appendix
Appendix 1: Additional Information

PROJECT DESIGN DOCUMENT FORM (CDM-SSC-PDD) - Version 03 CDM – Executive Board
2
Revision history of this document Version Number
Date Description and reason of revision
01 21 January 2003
Initial adoption
02 8 July 2005 The Board agreed to revise the CDM SSC PDD to reflect guidance and clarifications provided by the Board since version 01 of this document.
As a consequence, the guidelines for completing CDM SSC PDD have been revised accordingly to version 2. The latest version can be found at <http://cdm.unfccc.int/Reference/Documents>.
03 22 December 2006
The Board agreed to revise the CDM project design document for small-scale activities (CDM-SSC-PDD), taking into account CDM-PDD and CDM-NM.

PROJECT DESIGN DOCUMENT FORM (CDM-SSC-PDD) - Version 03 CDM – Executive Board
3
SECTION A. General descr iption of small-scale project activity A.1 Title of the small-scale project activity: >> Title: Wastewater treatment with Anaerobic Digester at Viet Ma starch processing plant in Tay Ninh,
Vietnam Version 1.0, 16 June 2008 A.2. Description of the small-scale project activity: >> Purpose of the project activity By capturing the biogas with the installation of an anaerobic digester, the amount of CO2 emissions
derived from the emitted methane gases at existing open lagoons into the atmosphere will be significantly reduced.
Captured biogas from the anaerobic digester will be used to generate heat energy for substituting coal. Therefore the amount of CO2 emissions derived from combustion of coal as fossil fuels.
Descr iption of the project activity VIET MA CO., LTD. is capable of producing 120 tons per day of Tapioca starch.
VIET MA CO., LTD. currently produces approximately 33,000 tons of Tapioca starch per year, and its production process emits approximately 2,300 m3/day of wastewater from the plant.
The project activity involves the installation of an anaerobic digester with biogas extraction capacity for the treatment of organic wastewater treatment of Tapioca starch processing plant of VIET MA CO., LTD. located in Tay Ninh Province, Vietnam.
In the project activity, biogas will be captured in the anaerobic digester of the methane fermentation facilities. The captured biogas will be utilised as the fuel of the thermal energy generation facilities, which is composed of boiler and furnace for tapioca starch-processing plant.
At an existing plant, open lagoons store wastewater for a long time, and so organic substances contained in the wastewater decompose, generating large amounts of methane gases that are emitted into the atmosphere. Coal is used as the fuel in the existing coal furnace, and electricity consumed at the plant is supplied from grid.
In the project activity, total amount of 39,814 tCO2 /year is expected to reduce by avoiding methane gas emissions from the existing open lagoons, by substituting coal with captured biogas.
Sustainable Development Benefit of the Project The project activity will contribute to the sustainable development and meets the sustainability criteria of
Vietnam as follows.
Contribution to Environmental Sustainability: The project activity will reduce the uncontrolled emissions of methane from the existing open lagoons, and
replacing the use of fossil fuels by utilizing the captured biogas for heat generation, thus reducing the GHG emission into the atmosphere and the impact on global warming.
The project activity will contribute to reduce the organic substance load flowing into the lagoons, thus

PROJECT DESIGN DOCUMENT FORM (CDM-SSC-PDD) - Version 03 CDM – Executive Board
4
improving the quality of treated water and consequently, contributing to improve the water quality in nearby water areas.
The project activity will contribute to reduce the generation of offensive odour from the lagoons.
Contribution to Economic Sustainability: The project activity will contribute to promote energy saving and will enhance the production efficiency
of the plant, producing economic effects.
Contribution to Social Sustainability: The project activity will contribute to enable transfer of wastewater treatment technology that uses a
digester, which is not generally used in the starch plants in Vietnam. The transfer of these technologies will promote wastewater treatment improvement in the future
through training and fostering of human resources.
A.3. Project par ticipants: >> Name of Party involved (*) ((host) indicates a host Party)
Private and/or public entity(ies) project participants (*) (as applicable)
Kindly indicate if the Party involved wishes to be considered as project participants (Yes/No)
Socialist Republic of Vietnam (host)
VIET MA CO., LTD No
Japan TOSHIBA CORPORATION No A.4. Technical descr iption of the small-scale project activity: A.4.1. Location of the small-scale project activity: >> A.4.1.1. Host Par ty(ies): >> Socialist Republic of Vietnam A.4.1.2. Region/State/Province etc.: >> Tay Ninh Province A.4.1.3. City/Town/Community etc: >> Tan Chau District, Tan Hiep Village
PROJECT DESIGN DOCUMENT FORM (CDM-SSC-PDD) - Version 03 CDM – Executive Board
5
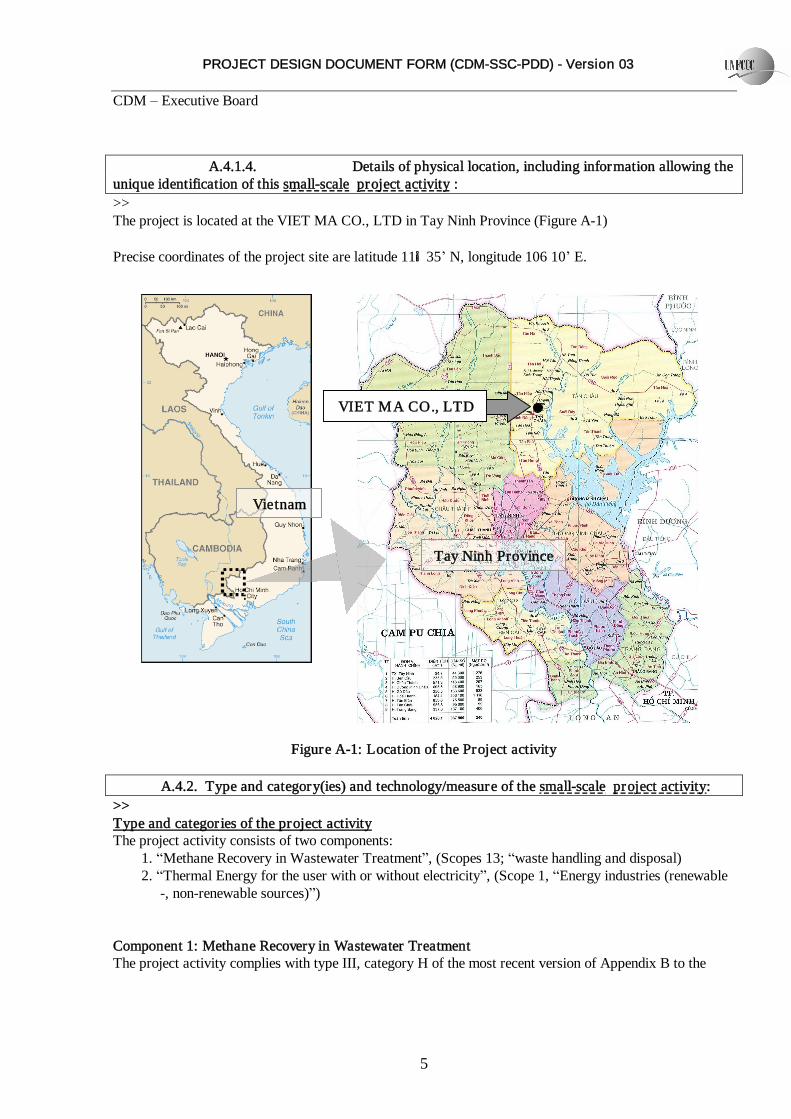
A.4.1.4. Details of physical location, including information allowing the unique identification of this small-scale project activity : >> The project is located at the VIET MA CO., LTD in Tay Ninh Province (Figure A-1) Precise coordinates of the project site are latitude 11° 35’ N, longitude 106 10’ E.
Figure A-1: Location of the Project activity A.4.2. Type and category(ies) and technology/measure of the small-scale project activity: >> Type and categories of the project activity The project activity consists of two components:
1. “Methane Recovery in Wastewater Treatment”, (Scopes 13; “waste handling and disposal) 2. “Thermal Energy for the user with or without electricity”, (Scope 1, “Energy industries (renewable
-, non-renewable sources)”)
Component 1: Methane Recovery in Wastewater Treatment The project activity complies with type III, category H of the most recent version of Appendix B to the
Vietnam
Tay Ninh Province
VIET MA CO., LTD

PROJECT DESIGN DOCUMENT FORM (CDM-SSC-PDD) - Version 03 CDM – Executive Board
6
simplified modalities and procedures for small-scale CDM project activities, because: The project activity introduces a sequential stage of wastewater treatment with methane recovery and
combustion to an existing anaerobic wastewater treatment which consists of open lagoons. Component 2: Thermal energy for the user with or without electricity The project activity complies with type I, category C of the most recent version of Appendix B to the simplified modalities and procedures for small-scale CDM project activities, because:
The project activity supplies heat from renewable biogas to the starch processing.
Hence, the project is carried out under AMS III H and AMS I C. Technology/measure of the project activity The scope of this project includes additional installation of methane fermentation facilities,
desulfurizing facilities, and energy generation facilities in the existing wastewater treatment facilities. (Figure A-2)
Wastewater emitted by the plant containing sludge will be pumped from the existing holding pool to methane fermentation facilities installed in this project.
Wastewater will be fermented in the methane fermentation facilities using a digester, in which organic components contained in the wastewater are decomposed under an anaerobic condition, to produce biogases whose main component is methane. The methane fermentation process in the digester will decompose and remove about 85% of organic substances in the wastewater, and the fermented wastewater will flow into the existing lagoons.
Biogases produced in the methane fermentation facilities will be fed to the desulfurizing facilities, which will remove impurities such as hydrogen sulfide contained in biogases. By removing impurities, the operational safety of the equipment when biogases are used as energy will be enhanced, enabling sound operation of the project facilities for a long time.
Part of the biogases treated in the desulfurizing facilities will be fed to the boiler as one of the energy generation facilities for producing steam. Produced steam will be consumed as a heat source for heating the digester.
The remaining biogases will be used as a fuel of the furnace as one of the energy generation facilities for supplying heat energy to the starch production process, substituting coal that has been used in the existing coal furnace.
The furnace installed in the project will be co-fired system, which uses both the captured biogas and Fuel Oil as a fuel. The furnace will mainly use captured biogas and not Fuel Oil, except when the biogas is short for continuous operation of the furnace.
In principle, biogases that will be generated and recovered in the methane fermentation facilities will almost be used in the boiler and furnace. When these energy generation facilities are not running and excessive biogases are generated, these gases will be burnt in the flaring system.
PROJECT DESIGN DOCUMENT FORM (CDM-SSC-PDD) - Version 03 CDM – Executive Board
7
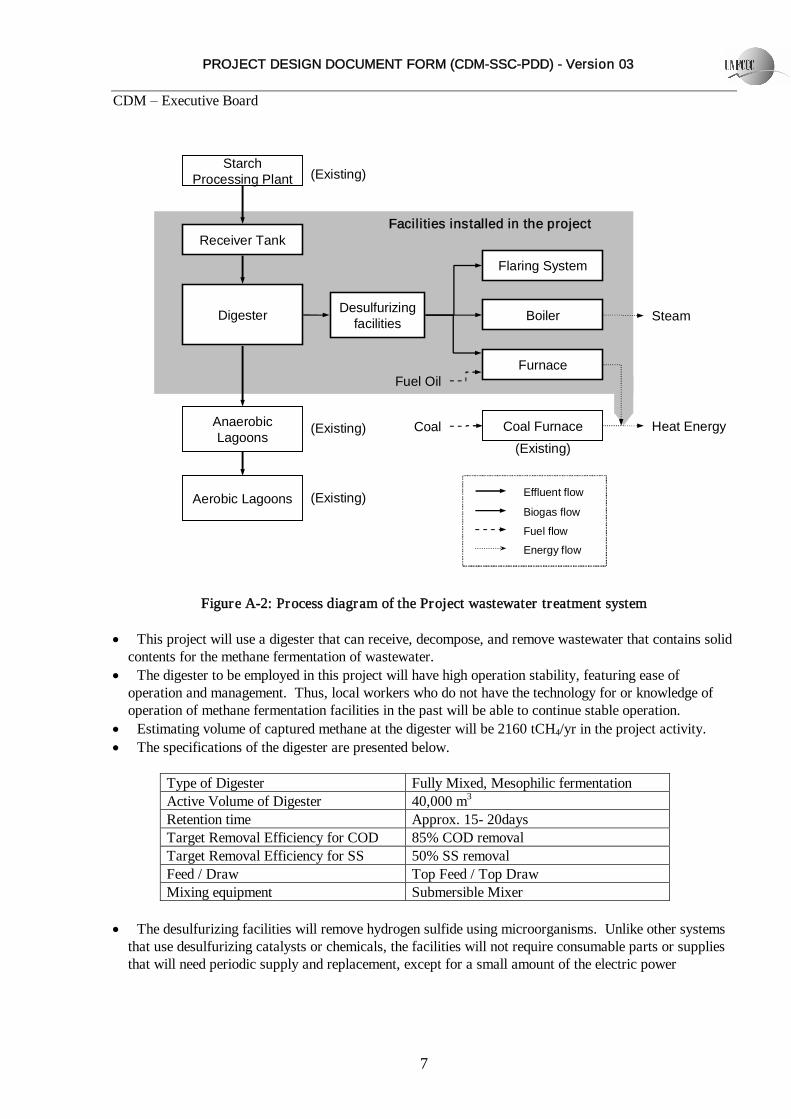
Figure A-2: Process diagram of the Project wastewater treatment system This project will use a digester that can receive, decompose, and remove wastewater that contains solid
contents for the methane fermentation of wastewater. The digester to be employed in this project will have high operation stability, featuring ease of
operation and management. Thus, local workers who do not have the technology for or knowledge of operation of methane fermentation facilities in the past will be able to continue stable operation.
Estimating volume of captured methane at the digester will be 2160 tCH4/yr in the project activity. The specifications of the digester are presented below.
Type of Digester Fully Mixed, Mesophilic fermentation Active Volume of Digester 40,000 m3 Retention time Approx. 15- 20days Target Removal Efficiency for COD 85% COD removal Target Removal Efficiency for SS 50% SS removal Feed / Draw Top Feed / Top Draw Mixing equipment Submersible Mixer
The desulfurizing facilities will remove hydrogen sulfide using microorganisms. Unlike other systems
that use desulfurizing catalysts or chemicals, the facilities will not require consumable parts or supplies that will need periodic supply and replacement, except for a small amount of the electric power
Starch Processing Plant
Receiver Tank
Digester Desulfurizingfacilities
Furnace
Boiler
Facilities installed in the projectFacilities installed in the project
(Existing)
Steam
Heat Energy
Flaring System
Aerobic Lagoons (Existing)
Anaerobic Lagoons
(Existing)
Fuel Oil
Coal Furnace(Existing)
Coal
Effluent flow
Biogas flow
Energy flow
Fuel flow
Effluent flow
Biogas flow
Energy flow
Fuel flow

PROJECT DESIGN DOCUMENT FORM (CDM-SSC-PDD) - Version 03 CDM – Executive Board
8
consumed by the pump and other equipment. The running cost of the facilities will be low, and a contribution will be made to the sustainable development of rural regions of Vietnam, which are faced with issues such as availability of chemicals and other materials, transportation problems, and economic problems.
The boiler will be used to generate steam for heating digester by using captured biogas. Steam producing capacity of the boiler will be 1.5t/h, and the boiler will be consumed 563tCH4/yr of captured methane in the project activity.
The furnace will be used to generate heat energy for starch drying process of the plant. The capacity of energy output of the furnace will be 2900kW, as same as existing coal furnace. The furnace will be consumed 1169tCH4/yr of captured methane in the project activity. The furnace will be consumed no Fuel Oil in the normal operation because captured methane will be more than the capacity of furnace.
The flaring system will burn 428tCH4/yr of methane as excessive biogases. Sludge (solid contents) that is emitted from the plant and mixed in the wastewater will be transported to
the digester together with the wastewater. Part of the sludge will be dissolved and made soluble in the digester and will flow into the lagoons together with digester effluent.
The wastewater treatment facilities of this project will not have a process to separate sludge from wastewater and to dewater it, thus producing no additional sludge in the wastewater treatment process.
A.4.3 Estimated amount of emission reductions over the chosen crediting per iod: >> This project will reduce GHGs by 39,814tCO2 every year, and the total acquired CERs during the crediting period of 10 years will be 398,140tCO2.
Years Annual estimation of emission reductions in tonnes of tCO2e
2009 (Apr. 1-) 29,861 2010 39,814 2011 39,814 2012 39,814 2013 39,814 2014 39,814 2015 39,814 2016 39,814 2017 39,814 2018 39,814
2019 (- Mar. 31) 9,953 Total estimated reductions (tCO2e) 398,140
Total number of crediting years 10 years Annual average over the crediting
period of estimated reductions (tCO2e) 39,814

PROJECT DESIGN DOCUMENT FORM (CDM-SSC-PDD) - Version 03 CDM – Executive Board
9
A.4.4. Public funding of the small-scale project activity: >> Neither public funding nor official development assistance will be utilized to finance the Project activity. A.4.5. Confirmation that the small-scale project activity is not a debundled component of a large scale project activity: Appendix C of the Simplified Modalities and Procedures for Small-Scale CDM project activities specify de-bundling in a small scale CDM project as follows: A proposed small-scale project activity shall be deemed to be a debundled component of a large project activity if there is a registered small-scale CDM project activity or an application to register another small-scale CDM project activity:
With the same project participants In the same project category and technology/measure Registered within the previous 2 years and Whose project boundary is within 1 km of the project boundary of the proposed small-scale activity at the
closest point. Eventually, the project participants do not have any other ongoing or future activity related to this project in anyway. Hence the project is not a debundled activity of a larger project.

PROJECT DESIGN DOCUMENT FORM (CDM-SSC-PDD) - Version 03 CDM – Executive Board
10
SECTION B. Application of a baseline and monitor ing methodology B.1. Title and reference of the approved baseline and monitor ing methodology applied to the small-scale project activity: >> Component 1: AMS-III.H Methane Recovery in Waste Water Treatment (Version 09, Scope 13, published at EB38) Component 2: AMS- I.C. Thermal energy for the user with or without electricity (Version 13, Scope 01, published at EB38) B.2 Justification of the choice of the project category: >> Since the emission reductions are less than or equal to 60ktCO2 equivalent, it is justified that the project is eligible for Type III project activities of small scale CDM project. The emission reduction of Component 1 will be 34,989tCO2/yr and thus below the limit 60ktCO2/yr for type III project activity. And the recovered methane is used for heat generation that component of the project activity can use a corresponding category under type I.C. The total of maximum output capacity of the boiler and the furnace will be 4.1MWthermal and thus below the limit 45MWthermal for type I.C. projects. The project activity qualifies as a small-scale project activity and that it will remain under the limits of small-scale project activity types during every year of the crediting period. Component 1: AMS- III.H. Methane Recovery in Wastewater Treatment
The applicability criteria for the methodology “AMS- III.H.” is as follows.
Options for technology/ measure for AMS- III.H. Justification Applicability of the project category
1. This project category comprises measures that recover methane from biogenic organic matter in wastewaters by means of one of the following options:
-
(i) Substitution of aerobic wastewater or sludge treatment systems with anaerobic systems with methane recovery and combustion.
Not applicable; The baseline wastewater treatment scenario comprises anaerobic lagoons.
(ii) Introduction of anaerobic sludge treatment system with methane recovery and combustion to an existing wastewater treatment plant without sludge treatment.
Not applicable; The project does not introduce a sludge treatment process.
(iii) Introduction of methane recovery and combustion to an existing sludge treatment system.
Not applicable; There is no existing sludge

PROJECT DESIGN DOCUMENT FORM (CDM-SSC-PDD) - Version 03 CDM – Executive Board
11
treatment system.
(iv) Introduction of methane recovery and combustion to an existing anaerobic wastewater treatment system such as anaerobic reactor, lagoon, septic tank or an on site industrial plant.
Not applicable; The project involves introduction of a sequential stage of wastewater treatment to an existing anaerobic wastewater treatment system.
(v) Introduction of anaerobic wastewater treatment with methane recovery and combustion, with or without anaerobic sludge treatment, to an untreated wastewater stream.
Not applicable; In the baseline scenario there is no untreated wastewater stream.
(vi) Introduction of a sequential stage of wastewater treatment with methane recovery and combustion, with or without sludge treatment, to an existing wastewater treatment system without methane recovery (e.g. introduction of treatment in an anaerobic reactor with methane recovery as a sequential treatment step for the wastewater that is presently being treated in an anaerobic lagoon without methane recovery).
Applicable; The project involves introduction of a sequential stage of wastewater treatment.
2. The recovered methane from the above measures may also be utilised for the following applications instead of combustion/flaring:
-
(a) Thermal or electrical energy generation directly; or Applicable;
The recovered methane is used for thermal energy generation directly.
(b) Thermal or electrical energy generation after bottling of upgraded biogas; or
(c) Thermal or electrical energy generation after upgrading and distribution: (i) Upgrading and injection of biogas into a natural gas
distribution grid with no significant transmission constraints; or
(ii) Upgrading and transportation of biogas via a dedicated piped network to a group of end users; or
(d) Hydrogen production.
Not applicable; The recovered methane is used for thermal energy generation directly.
3. If the recovered methane is used for project activities covered under paragraph 2 (a), that component of the project activity can use a corresponding category under type I.
Applicable Type I.C. : The recovered methane
is used for heat generation by the project, therefore Type I.C. will be applied.
4. If the recovered methane is utilized for production of hydrogen (project activities covered under paragraph 2 (d)), that component of project activity shall use corresponding category AMS III.O.
Not applicable; No hydrogen production will be applied in the project activity.
5. In case of project activities covered under paragraph 2 (b) if bottles with upgraded biogas are sold outside the project boundary the end-use of the biogas shall be ensured via a contract between the bottled biogas vendor and the end-user. No emission reductions may be claimed from the displacement of fuels from the end use of bottled biogas in such situations. If
Not applicable; No biogas bottling will be applied in the project activity.

PROJECT DESIGN DOCUMENT FORM (CDM-SSC-PDD) - Version 03 CDM – Executive Board
12
however the end use of the bottled biogas is included in the project boundary and is monitored during the crediting period CO2 emissions avoided by the displacement of the fuels is eligible under a corresponding type I methodology, e.g. AMS I.C.
6. In case of project activities covered under paragraph 2 (c i) emission reductions from the displacement of the use of natural gas is eligible under this methodology, provided the geographical extent of the natural gas distribution grid is within the host country boundaries.
Not applicable; No biogas upgrading will be applied in the project activity.
7. In case of project activities covered under paragraph 2 (c ii) emission reductions for the displacement of the use of fuels can be claimed following the provision in the corresponding type I methodology, e.g. AMS I.C.
Not applicable; No biogas upgrading will be applied in the project activity.
8. In case of project activities covered under paragraph 2 (b) and (c), methodology is only applicable if upgrade is done by way of absorption with water (with or without recovery of methane emissions from discharge) such that the methane content of the upgraded biogas shall be in accordance with national regulations (where these exist) or a minimum of 96% (by volume). These conditions are necessary to ensure that the recovered biogas is completely destroyed through combustion in an end use.
Not applicable; No biogas bottling and no biogas upgrading will be applied in the project activity.
9. Measures are limited to those that result in aggregate emission reductions of less than or equal to 60 kt CO2 equivalent annually from all type III components of the project activity.
Applicable; The annual emission reductions are less than 60kt CO2 equivalent
As can be seen, scenario (vi) “Introduction of a sequential stage of wastewater treatment with methane recovery and combustion, with or without sludge treatment, to an existing wastewater treatment system without methane recovery” is applicable for the calculations of the emission reductions achieved by the project activity. Component 2: AMS- I.C. Thermal energy for the user with or without electricity
The applicability criteria for the methodology “AMS- I.C.” is as follows.
Options for technology/ measure for AMS- I.C. Justification Applicability of the project category
1. This category comprises renewable energy technologies that supply individual households or users with thermal energy that displaces fossil fuels. Examples include solar thermal water heaters and dryers, solar cookers, energy derived from renewable biomass for water heating, space heating, or drying, and other technologies that provide thermal energy that displaces fossil fuel. Biomass-based co-generating systems that produce heat and electricity are included in this category.
Applicable for: Supply users with
thermal energy that displaces fossil fuels
Heat is generated by captured methane from Component 1
2. Where thermal generation capacity is specified by the manufacturer, it shall be less than 45MW.
Applicable; The thermal energy generation capacity will not exceed 45MW.

PROJECT DESIGN DOCUMENT FORM (CDM-SSC-PDD) - Version 03 CDM – Executive Board
13
3. For co-fired1 systems the aggregate installed capacity (specified for fossil fuel use) of all systems affected by the project activity shall not exceed 45 MWth. Cogeneration projects that displace/ avoid fossil fuel consumption in the production of thermal energy (e.g. steam or process heat) and/or electricity shall use this methodology. The capacity of the project in this case shall be the thermal energy production capacity i.e. 45 MWth.
Applicable; Co-fired furnace will be used. Total of thermal energy generation capacity will not exceed 45MW.
4. In the case of project activities that involve the addition of renewable energy units at an existing renewable energy facility, the total capacity of the units added by the project should be lower than 45 MWth and should be physically distinct from the existing units.
Not Applicable; There is no existing renewable energy facility.
The total installed capacity of the boiler and the furnace included in the project activity is 4.1MWthermal this is below the threshold of 45MWthermal. The breakdown of the installed capacity can be found in the table below.
Table; Breakdown installed capacity of boiler and furnace
Facility Installed capacity (MWthermal) Boiler 1.2
Furnace 2.9 Total 4.1
Thus, it is justified that the project is eligible for approved small scale baseline methodology AMS-I.C.
B.3. Descr iption of the project boundary: >>
In accordance with the project boundary for type III.H (AMS-III.H) projects, the project boundary is the physical, geographical site where the wastewater and sludge treatment takes place.
In accordance with the project boundary for type I.C (AMS-I.C) projects, the physical, geographical site of
the renewable generation delineates the project boundary.
These all definitions have been included in the determination of the project boundary. A representation of the project boundary can be seen in the Figure B-1 below.

PROJECT DESIGN DOCUMENT FORM (CDM-SSC-PDD) - Version 03 CDM – Executive Board
14
Figure B-1: Project Boundary
B.4. Descr iption of baseline and its development: >> The project reduces greenhouse gas emissions in two ways: (1) by methane capture and combustion in a wastewater treatment system : Component 1 (2) by replacement of fossil fuel used for heat generation at starch processing with captured methane
(thermal energy for the user) : Component 2 The baseline for the two components is identified as follows. Component 1: AMS- III.H. Methane Recovery in Wastewater Treatment
The existing wastewater treatment system consists of anaerobic and aerobic open lagoons. The effluent of starch processing plant first flows into the anaerobic lagoons. Depth of the anaerobic lagoons are around 3.5m, thus these lagoons are kept in anaerobic condition. The anaerobic lagoons store wastewater for a long time, and organic substances contained in the wastewater decompose, generating large amounts of methane gases that are emitted into the atmosphere. Afterwards the treated wastewater flows into the aerobic lagoons.
Starch Processing Plant
Receiver Tank
Digester Desulfurizingfacilities
Furnace
Boiler
Project Boundary
(Existing)
Steam
Flaring System
Aerobic Lagoons (Existing)
Anaerobic Lagoons
(Existing)Fuel Oil
Effluent flow
Biogas flow
Energy flow
Fuel flow
Effluent flow
Biogas flow
Energy flow
Fuel flow
Heat EnergyCoal Furnace
(Existing)Coal

PROJECT DESIGN DOCUMENT FORM (CDM-SSC-PDD) - Version 03 CDM – Executive Board
15
Existing open lagoon based wastewater treatment system can be operated easily, and needs low running cost and no additional investment. Thus, the baseline scenario is continuation of the present open lagoon based treatment and release of methane into the atmosphere. In accordance with the methodology AMS- III.H., the above stated conditions fit well with paragraph 23 scenario (vi) of AMS-III.H./Version 09. Applicable situation is shown in the following table.
The baseline scenario of AMS- III.H./Version 09 Applicability
(i) The existing aerobic wastewater or sludge treatment system, in the case of substitution of one or both of these systems for anaerobic ones with methane recovery and combustion.
Not applicable; The existing wastewater treatment system has no methane recovery and combustion.
(ii) The existing sludge disposal system, in the case of introduction of anaerobic sludge treatment system with methane recovery and combustion to an existing wastewater treatment plant.
Not applicable; There is no existing sludge disposal system.
(iii) The existing sludge treatment system without methane recovery and combustion.
Not applicable; There is no existing sludge treatment system.
(iv) The existing anaerobic wastewater treatment system without methane recovery and combustion.
Not applicable; The project introduces a sequential anaerobic wastewater treatment system with methane recovery.
(v) The untreated wastewater being discharged into sea, river, lake, stagnant sewer or flowing sewer, in the case of introducing the anaerobic treatment to an untreated wastewater stream.
Not applicable; Effluent of the plant has been treated by existing lagoons.
(vi) The existing anaerobic wastewater treatment system without methane recovery for the case of introduction of a sequential anaerobic wastewater treatment system with methane recovery.
Applicable
The baseline emission of Component 1 is calculated to be 41,393tCO2/year for this project.
Component 2: AMS- I.C. Thermal energy for the user with or without electricity The captured biogas in Component 1 will be used to produce thermal energy for starch processing. Without the implementation of installing project facilities, it is impossible to use renewable energy for production of thermal energy. In this case, the baseline scenario is continuation of using coal to generate heat energy for the starch drying process. At an existing plant, coal is used as a fuel in the starch processing because of its low fuel cost. Therefore large amount of carbon dioxide is emitted into the atmosphere with exhaust gas from starch processing by coal combustion.

PROJECT DESIGN DOCUMENT FORM (CDM-SSC-PDD) - Version 03 CDM – Executive Board
16
The baseline emission of Component 2 is calculated to be 4,825tCO2/year for this project.
B.5. Descr iption of how the anthropogenic emissions of GHG by sources are reduced below those that would have occurred in the absence of the registered small-scale CDM project activity: Following explanation on the barriers can demonstrate that the proposed project activity is additional as per options provided under attachment A to Appendix B of the simplified modalities and procedures for small-scale CDM project activities. The project activity would not have occurred anyway due to the following barriers: Investment barr iers An investment analysis of the project activity was conducted with IRR (Internal Rate of Return) as a financial indicator. The investments, costs and revenues to be used in calculations of IRR for the project implementation are shown in the following table.
Parameter Value Capital cost inclusive of:
Engineering, procurement & construction 2.30 million USD
Operation & maintenance cost inclusive of: Labour, administration, repair, fuel and power cost
63,685 USD/year
Revenue from sales of biogas for coal alternative 184,643 USD/year CER price 0, 5, 10, 15 US$/tCO2
Based on the foregoing data, IRR with and without CER was calculated. In the calculations, the CER trading price was set at 5 USD/tCER to 15 USD/tCER, and evaluation was made taking fluctuations of the trading price into consideration. The benchmarks of IRR can be derived as 6.875% from Vietnam government bonds. The IRR to be cleared in business is 6.875% (10-year Vietnam government bonds, coupons (yield)). The results of IRR calculations are shown in the following table. (The details of the IRR calculations are shown in Appendix 1.)
With CER trading price With/without
CER Without 5USD 10USD 15USD
Benchmark
IRR (%)
-10
3
14
24 6.875
* IRR is a value in Year 10 of the project. As shown in the above table, IRR of the project depends on the CER price and a higher CER price produces higher IRR. The project without CER trading has the lower than the benchmark. In this case, the project cannot be considered as financially attractive. Only in use of CER trading, the project can be considered as financially attractive. Therefore, the project cannot carry out in the Business as Usual (BAU) situation.

PROJECT DESIGN DOCUMENT FORM (CDM-SSC-PDD) - Version 03 CDM – Executive Board
17
Thus, the additionally of the CDM project can be demonstrated. The starting date of the project activity was 08/12/2007 that was the date to making "Emission Reduction Purchase Agreement" between Vietma Co., Ltd and Toshiba Corporation which is corresponding to the "Date of real action of the project begins". Toshiba intends to purchase CERs generated by the project, and Vietma intends to apply Toshiba’s payment for the installation of the project facilities in the above agreement. Vietma and Toshiba had carried out the feasibility study for the project implementation since 2005 as the CDM project. According to the result of the feasibility study, both of parties have confirmed that the project could be performed, only when CDM was applied. Therefore, the incentive from the CDM was seriously considered in the decision to proceed with the project activity since the beginning of the feasibility study report preparation work, and the above contract can be provided as the documentary evidence for the additionality of the project. B.6. Emission reductions:
B.6.1. Explanation of methodological choices: >> The project follows the AMS III .H. small-scale methodology for Methane Recovery in Wastewater Treatment, Version 09, Sectoral Scope 13 published at EB38. (Component 1) In addition, the project follows the AMS I .C. small-scale methodology for thermal energy for the user with or without electricity, Version 13, Sectoral Scope 01 published at EB38. (Component 2) Component 1: AMS- III.H. Methane Recovery in Wastewater Treatment
The ex-ante emission reductions for the methane recovery are calculated as per AMS-III.H. according to the scenario (vi) that applies to the project activity. The project introduces an anaerobic digester with methane recovery as a sequential step for the wastewater that is presently treated in anaerobic lagoons without methane recovery. Recovered methane is destroyed by the boiler, the furnace and the flare that are introduced in the project activity. The ex-post calculation of emission reductions are based on the amount of methane recovered and fuelled or flared by the project activity during a year. The amount of methane used in the boiler and the furnace to produce thermal energy and flared in the enclosed type flare is monitored to determine the emission reductions. (See B.7.1) Component 2: AMS- I.C. Thermal energy for the user with or without electricity
The emission reductions resulting from the generation of heat are estimated by use of approved small scale CDM baseline methodology AMS-I.C./Version 09. The ex-ante emission reductions are estimated from the coal consumption in the existing coal furnace. In the project activity, the furnace using captured biogas will be installed as substituting the existing coal furnace. Capacity of the furnace installed in the project activity will be as same as the existing coal furnace and captured biogas will be enough to operate the installed

PROJECT DESIGN DOCUMENT FORM (CDM-SSC-PDD) - Version 03 CDM – Executive Board
18
furnace. Therefore, all coal consumption will be displaced by captured methane in the normal operation. The furnace applied in the project activity will be co-fired system which use both captured methane and Fuel Oil. The furnace will mainly use captured methane, and will use Fuel Oil only in the case of methane shortage. Thus the ex-post calculation of emission reductions are based on the amount of heat output of the furnace except Fuel Oil based heat output. (See B.7.1)
B.6.2. Data and parameters that are available at validation: Data / Parameter : Qy,ww Data unit: m3/y Description: Volume of wastewater treated in the year “y” Source of data used: Annex 3 BASELINE INFORMATION Value applied: 724,240 Justification of the choice of data or description of measurement methods and procedures actually applied :
The feasibility study for the project gives the expected production of tapioca starch and wastewater flow rate per starch production. This is based on the expected tapioca starch production multiplied by the wastewater flow rate per production.
Any comment: -
Data / Parameter : CODy,removed,i Data unit: tonnes/m3 Description: Chemical oxygen demand removed by the anaerobic wastewater treatment
system “i” in the baseline situation in the year “y” Source of data used: Annex 3 BASELINE INFORMATION Value applied: 0.0162 Justification of the choice of data or description of measurement methods and procedures actually applied :
The feasibility study for the project gives the COD value of wastewater and removal efficiency of organic carbon at existing anaerobic lagoons. This is based on the COD of wastewater multiplied by the removal efficiency of organic carbon at the existing anaerobic lagoons.
Any comment: - Data / Parameter : B0,ww Data unit: kgCH4/kgCOD Description: Methane producing capacity of the wastewater Source of data used: IPCC default value for domestic wastewater Value applied: 0.21 Justification of the choice of data or description of
The default IPCC value for B0, the maximum amount of CH4 that can be produced from given quantity of wastewater, is 0.25 (kgCH4/kgCOD). Taking into account the uncertainty of this estimate, a value of 0.21 (kgCH4/kgCOD) is

PROJECT DESIGN DOCUMENT FORM (CDM-SSC-PDD) - Version 03 CDM – Executive Board
19
measurement methods and procedures actually applied :
used as a conservative assumption for B0.
Any comment: -
Data / Parameter : MCFww,treatment,i Data unit: Fraction Description: Methane correction factor for the anaerobic wastewater treatment system “i” Source of data used: Table III.H.1. IPCC default values for Methane Correction Factor (MCF) of
AMS III.H./Version 09 Value applied: 0.8 Justification of the choice of data or description of measurement methods and procedures actually applied :
MCF higher value of Anaerobic deep lagoon (depth more than 2 meters)” in table III.H.1 is used.
Any comment: -
Data / Parameter : GWP_CH4 Data unit: tCO2e/tCH4 Description: Global Warming Potential for methane Source of data used: IPCC default value Value applied: 21 Justification of the choice of data or description of measurement methods and procedures actually applied :
IPCC default value of 21 is used.
Any comment: - Data / Parameter : PCy Data unit: MWh/y Description: The amount of electricity in the year y that is consumed at the project site for the
project activity Source of data used: Calculations based on the feasibility study Value applied: 635 Justification of the choice of data or description of measurement methods and procedures actually applied :
This value is based on the installed capacity of the project facilities and average electricity consumption.
Any comment: Actual electricity consumption of the project facilities will be monitored to calculate ex-post project emissions.

PROJECT DESIGN DOCUMENT FORM (CDM-SSC-PDD) - Version 03 CDM – Executive Board
20
Data / Parameter : CEFgrid Data unit: tCO2e/MWh Description: CO2 emissions factor for electricity consumed at the project site during the
project activity Source of data used: Annex 3 BASELINE INFORMATION Value applied: 0.496 Justification of the choice of data or description of measurement methods and procedures actually applied :
The carbon emission factor is calculated by applying the calculation formula for combined margins based on Category I.D. Renewable electricity generation for a grid, which is a methodology for small-scale CDMs, to the electricity generation unit requirement in Viet Nam.
Any comment: - Data / Parameter : CODy,ww,treated Data unit: tonnes/m3 Description: Chemical oxygen demand of the treated wastewater in the year “y” Source of data used: Vietnam environmental standard (TCVN 5945 -2005) Value applied: 0.00005 Justification of the choice of data or description of measurement methods and procedures actually applied :
This is based on the Vietnam environmental standard (TCVN 5945 -2005). 50mg/L of discharging limit in type A category is used as a conservative assumption.
Any comment: -
Data / Parameter : MCFww,final Data unit: Fraction Description: Methane correction factor based on type of treatment and discharge pathway of
the wastewater Source of data used: IPCC default value for domestic wastewater Value applied: 0.2 Justification of the choice of data or description of measurement methods and procedures actually applied :
MCF higher value in table III.H.1 for sea, river and lake discharge i.e. 0.2 is used.
Any comment: -
Data / Parameter : CODy,removed,j Data unit: tonnes/m3 Description: Chemical oxygen demand removed by the treatment system “j” of the project
activity equipped with methane recovery in the year “y”

PROJECT DESIGN DOCUMENT FORM (CDM-SSC-PDD) - Version 03 CDM – Executive Board
21
Source of data used: Calculations based on the feasibility study Value applied: 0.0142 Justification of the choice of data or description of measurement methods and procedures actually applied :
This is based on the average value of the result of water content analysis according to APHA 5220 C. multiplied by the COD removal rate of digester employed in the project activity. 0.85 of COD removal rate is used.
Any comment: - Data / Parameter : MCFww,j Data unit: Fraction Description: Methane correction factor for the wastewater treatment system that will be
equipped with methane recovery and combustion Source of data used: IPCC default value for wastewater treatment system “j” equipped with methane
recovery and combustion/flare/utilization equipment Value applied: 1.0 Justification of the choice of data or description of measurement methods and procedures actually applied :
MCF higher value of “Anaerobic reactor” in table III.H.1 is used.
Any comment: -
Data / Parameter : CFEww Data unit: Fraction Description: Capture and flare efficiency of the methane recovery and combustion equipment
in the wastewater treatment Source of data used: Default value from UNFCCC methodological tool to determine project emissions
from flaring gases containing methane Value applied: 0.9 Justification of the choice of data or description of measurement methods and procedures actually applied :
There is no other appropriate value to represent this parameter, so the default value of the AMS III.H. is used.
Any comment: -
Data / Parameter : [CH4]y,ww,treated Data unit: tCH4/m3 Description: Dissolved methane content in the treated wastewater (tonnes/m3) Source of data used: IPCC default value and AMS III.H. Value applied: 0.0001 Justification of the Default value of the AMS III.H. is used

PROJECT DESIGN DOCUMENT FORM (CDM-SSC-PDD) - Version 03 CDM – Executive Board
22
choice of data or description of measurement methods and procedures actually applied : Any comment: -
Data / Parameter : CCy Data unit: tonnes/y Description: Amount of coal consumed in existing coal furnace in year y in tonnes Source of data used: Feasibility study Value applied: 1975.2 Justification of the choice of data or description of measurement methods and procedures actually applied :
This value is based on the coal consumption per starch production provided by the plant owner multiplied by the estimated starch production volume.
Any comment: -
Data / Parameter : NCVcoal Data unit: TJ/Gg Description: Net Calorific Value of coal Source of data used: 2006 IPCC Guidelines for National Greenhouse Gas Inventories Vol.2 Value applied: 25.8 Justification of the choice of data or description of measurement methods and procedures actually applied :
Default value of “Other Bituminous Coal” in Table 1.2 of 2006 IPCC Guidelines is used.
Any comment: -
Data / Parameter : EF CO2 Data unit: tCO2/TJ Description: The CO2 emission factor per unit of energy of the fuel that would have been used
in the baseline plant in (tCO2 / TJ) Source of data used: 2006 IPCC Guidelines for National Greenhouse Gas Inventories Vol.2 Value applied: 94.6 Justification of the choice of data or description of measurement methods and procedures actually applied :
Default value of “Other Bituminous Coal” in Table 1.4 of 2006 IPCC Guidelines is used.
Any comment: -

PROJECT DESIGN DOCUMENT FORM (CDM-SSC-PDD) - Version 03 CDM – Executive Board
23
Data / Parameter : ηth,existing Data unit: Fraction Description: The efficiency of the plant using fossil fuel that would have been used in the
absence of the project activity. Source of data used: IPCC default value and AMS I.C. Value applied: 1.0 Justification of the choice of data or description of measurement methods and procedures actually applied :
In accordance with No. 13 (c) of methodology AMS-I.C./Version 13, maximum efficiency of 100% is used as a conservative assumption for ηth. This data is required to calculate ex-post estimation of emission reductions.
Any comment: - Data / Parameter : ηth,furnace Data unit: Fraction Description: The efficiency of the plant using renewable energy technology in the project
activity. Source of data used: Manufacturer’s specifications Value applied: 0.865 Justification of the choice of data or description of measurement methods and procedures actually applied :
This value is based on the specifications of manufacturer. This data is required to calculate ex-post estimation of emission reductions.
Any comment: -
Data / Parameter : NCVCH4 Data unit: TJ/Gg Description: Net Calorific Value of coal Source of data used: 2006 IPCC Guidelines for National Greenhouse Gas Inventories Vol.2 Value applied: 50.4 Justification of the choice of data or description of measurement methods and procedures actually applied :
Default value of “Other Biogas” in Table 1.2 of 2006 IPCC Guidelines is used. This data is required to calculate ex-post estimation of emission reductions.
Any comment: - B.6.3 Ex-ante calculation of emission reductions: >>
The description of the ex-post emission reductions can be found under B.7.1

PROJECT DESIGN DOCUMENT FORM (CDM-SSC-PDD) - Version 03 CDM – Executive Board
24
The ex-ante approach described in this section is used for an estimation of the emission reductions. Component 1: AMS- III.H. Methane Recovery in Wastewater Treatment
Ex-ante estimation of the baseline emissions: The ex-ante baseline emissions of Component 1 are calculated by using the formulae given in paragraph 24 (d) of AMS III. H/Version 09 shown as follows.
BEy,1 = Qy,ww * i
(CODy,removed,i * Bo,ww * MCFww,treatment,i * GWP_CH4 )
Where: BEy,1 Baseline emissions of Component 1 in the year “y” (tCO2 e) Qy,ww Volume of wastewater treated in the year “y” (m3) CODy,removed,i Chemical oxygen demand removed by the anaerobic wastewater treatment system “i” in
the baseline situation in the year “y” to which the sequential anaerobic treatment step is being introduced (tonnes/m3)
Bo,ww methane producing capacity of the wastewater (IPCC default value for domestic wastewater of 0.21 kgCH4/kgCOD)1
MCFww, treatment,i Methane correction factor for the anaerobic wastewater treatment system “i” to which the sequential anaerobic treatment step is being introduced (MCF lower values in table III.H.1).
GWP_CH4 Global Warming Potential for methane (value of 21 is used) Hence, with using the values given in Section B.6.2, the ex-ante baseline emissions of Component 1 are calculated as follows. BEy,1 = 724240 (m3/yr) * 0.0162 (tones/m3) * 0.21 (kgCH4/kgCOD) * 0.8 * 21
= 41393 (tCO2e/y) Ex-ante estimation of the project activity emissions: PEy,1 = PEy, power + PEy,ww,treated + PEy,s,final + PEy,fugitive + PEy,dissolved + PEy,upgrading + PEy,leakage,pipeline Where: PEy,1 Project activity emissions of Component 1 in the year “y” (tCO2e) PEy,power Emissions from electricity or diesel consumption in the year “y” PEy,ww,treated Emissions from degradable organic carbon in treated wastewater in year “y” PEy,s,final Emissions from anaerobic decay of the final sludge produced in the year “y”. PEy,fugitive Emissions from methane release in capture and utilization/combustion/flare systems in
year “y”. PEy,dissolved Emissions from dissolved methane in treated wastewater in year “y”. PEy,upgrading Emissions related to the upgrading and compression of biogas in year “y” PEy,leakage,pipeline Emissions due to physical leakage from the dedicated piped network in year “y”

PROJECT DESIGN DOCUMENT FORM (CDM-SSC-PDD) - Version 03 CDM – Executive Board
25
(i) CO2 emissions on account of power used by the project activity facilities; Electricity consumed at the project facilities will be supplied from grid in this project activity. Fuel oil will be used only in the case of shortage of methane generation at digester. In the normal operation, methane generated by digester will be enough to consume at furnace, therefore Fuel Oil consumption is not considered in ex-ante calculation of project emissions. Fuel Oil consumption will be monitored for calculating ex-post project emissions. PEy, power = PCy * CEFgrid
Where: PCy is the amount of electricity in the year y that is consumed at the project site for the project
activity (MWh) CEFgrid is the CO2 emissions factor for electricity consumed at the project site during the project
activity (tCO2/MWh), estimated under the simplified methodology AMS-I.D. Hence: PEy, power = 635 (MWh/y) * 0.496 (tCO2e/MWh)
= 315 (tCO2e/y)
(ii) Project activity emissions from degradable organic carbon in treated wastewater; PEy,ww,treated = Qy,ww * GWP_CH4 * Bo,ww * CODy,ww,treated * MCFww,final
Where: Qy,ww Volume of wastewater treated in the year “y” (m3) CODy,ww,treated Chemical oxygen demand of the final treated wastewater discharged into sea, river or
lake in the year “y” (tonnes/m3) Bo,ww methane producing capacity of the wastewater (IPCC default value for domestic
wastewater of 0.21 kgCH4/kgCOD) MCFww,final Methane correction factor based on type of treatment and discharge pathway of the
wastewater (fraction) (MCF Higher Value in table III.H.1 for sea, river and lake discharge i.e. 0.2 ).
GWP_CH4 Global Warming Potential for methane (value of 21 is used)
Hence: PEy,ww,treated = 724240 (m3/y) * 21 (tCO2/tCH4) * 0.21 (kgCH4/kgCOD) * 0.00005 (tones/m3) * 0.2
= 32 (tCO2e/y) (iii) Project activity emissions from anaerobic decay of the final sludge produced; In this project, sludge will flow into lagoons together with wastewater through the methane fermentation facilities, and there will be no process to separate sludge from wastewater.

PROJECT DESIGN DOCUMENT FORM (CDM-SSC-PDD) - Version 03 CDM – Executive Board
26
PEy,s,final = 0 (tCO2e/y) (iv) Project activity emissions from methane release in capture and utilization/combustion/ flare systems; PEy,fugitive = PEy,fugitive,ww + PEy,fugitive,s Where: PEy,fugitive,ww Fugitive emissions through capture and utilization/combustion/flare inefficiencies in the
anaerobic wastewater treatment in the year “y” (tCO2e) PEy,fugitive,s Fugitive emissions through capture and utilization/combustion/flare inefficiencies in the
anaerobic sludge treatment in the year “y” (tCO2e)
MEPy,ww,treatment = Qy,ww * Bo,ww * j
CODy,removed,j * MCFww,j
Where: MEPy,ww,treatment Methane emission potential of wastewater treatment plant in the year “y” (tonnes) CODy,removed,j The chemical oxygen demand removed by the treatment system “j” of the project activity
equipped with methane recovery in the year “y” (tonnes/m3) MCFww, j Methane correction factor for the wastewater treatment system “j” equipped with
methane recovery and combustion/flare/utilization equipment (MCF higher values in table III.H.1).
Hence: MEPy,ww,treatment = 724240 (m3/y) * 0.21 (kgCH4/kgCOD) * 0.0142 (t/m3) * 1.0
= 2160 (tCH4/y) PEy,fugitive,ww = (1 – CFEww) * MEPy,ww,treatment * GWP_CH4 Where: CFEww Capture and utilization/combustion/flare efficiency of the methane recovery and
combustion/utilization equipment in the wastewater treatment (a default value of 0.9 shall be used, given no other appropriate value)
Hence: PEy,fugitive,ww = (1- 0.9) * 2160 (tCH4/y) * 21 (tCO2/tCH4)
= 4536 (tCO2e/y) In this project, sludge will flow into lagoons together with wastewater through the methane fermentation facilities, and there will be no process to separate sludge from wastewater. Hence: PEy,fugitive,s = 0 (tCO2e/y)
PROJECT DESIGN DOCUMENT FORM (CDM-SSC-PDD) - Version 03 CDM – Executive Board
27
Hence: PEy,fugitive = 4536 (tCO2e/y) + 0 (tCO2e/y)
= 4536 (tCO2e/y) (v) Project activity emissions from dissolved methane in treated wastewater. Project emissions of this source are considered according to the choice of the case (vi) “Introduction of sequential stage of wastewater treatment with methane recovery and combustion” of paragraph 1 of AMS-III.H./Version 09. PEy,dissolved = Qy,ww * [CH4]y,ww,treated * GWP_CH4 Where: [CH4]y,ww,treated Dissolved methane content in the treated wastewater (tonnes/m3). In aerobic wastewater
treatment default value is zero, in anaerobic treatment it can be measured, or a default value of 10e-4 tonnes/m3 can be used.
Hence: PEy,dissolved = Qy,ww * [CH4]y,ww,treated * GWP_CH4
= 724240 (m3/y) * 0.0001 (tCH4/m3) * 21 (tCO2/tCH4) = 1521 (tCO2e/y)
(vi) Emissions related to the upgrading and compression of biogas
In this project, no biogas upgrading system will be applied. Hence: PEy,upgrading = 0 (tCO2e/y) (vii) Emissions due to physical leakage from the dedicated piped network In this project, upgrading and transportation of biogas via a dedicated piped network will not be applied. Hence: PEy,leakage, pipeline = 0 (tCO2e/y) (viii) Amount of project activity emissions Hence: PEy,1 = PEy, power + PEy,ww,treated + PEy,s,final + PEy,fugitive + PEy,dissolved + PEy,upgrading + PEy,leakage, pipeline
= 315 (tCO2e/y) + 32 (tCO2e/y) + 0 (tCO2e/y) + 4536 (tCO2e/y) + 1521 (tCO2e/y) + 0 (tCO2e/y) + 0 (tCO2e/y)
= 6404 (tCO2e/y)

PROJECT DESIGN DOCUMENT FORM (CDM-SSC-PDD) - Version 03 CDM – Executive Board
28
Ex-ante estimation of the Leakage: No technological equipment will be transferred from another activity and no existing equipment will be transferred to another activity. Hence: Leakage y,1 = 0 (tCO2e/y) Ex-ante estimation of the emission reductions: ERy,1 = BEy,1 - PEy,1 - Leakage y,1
= 41393 (tCO2e/y) - 6404 (tCO2e/y) - 0 (tCO2e/y) = 34989 (tCO2e/y)
Component 2: AMS- I.C. Thermal energy for the user with or without electricity
Ex-ante estimation of the Baseline emissions: The baseline for the GHG emissions from fossil fuel combustion in the existing coal furnace is determined by the fuel consumption in the absence of the project activity. In the project activity, the consumed coal in the existing coal furnace will be displaced to the captured methane fueled in the furnace. BEy,2 = HGy * EFCO2 Where; BEy,2 the baseline emissions from steam/heat displaced by the project activity during the year y
in tCO2e. HGy the net quantity of steam/heat supplied by the project activity during the year y in TJ. EFCO2 the CO2 emission factor per unit of energy of the fuel that would have been used in the
baseline plant in (tCO2 / TJ), obtained from reliable local or national data if available, otherwise, IPCC default emission factors are used.
HGy = CCy * NCVcoal Where; CCy Amount of coal which would have been consumed in existing coal furnace in year y in
tonnes. NCVcoal Net Calorific Value of coal in TJ/Gg (= GJ/t) Hence: HGy = 1975.2 (t/y) * 25.8 (GJ /t)
= 50960 (GJ/y) = 51.0 (TJ /y)

PROJECT DESIGN DOCUMENT FORM (CDM-SSC-PDD) - Version 03 CDM – Executive Board
29
Hence: BEy,2 = 51.0 (TJ) * 94.6 (tCO2/TJ)
= 4825 (tCO2e/y) Ex-ante estimation of the Leakage: No energy generating equipment will be transferred from another activity and no existing equipment will be transferred to another activity. Hence: Leakagey,2 = 0 (tCO2e/y) Ex-ante estimation of the emission reductions: ERy,2 = BEy,2 - Leakagey,2
= 4825 (tCO2e/y) - 0 (tCO2e/y) = 4825 (tCO2e/y)
B.6.4 Summary of the ex-ante estimation of emission reductions: >>
Summarize the results of the ex-ante estimation of emission reductions for all years of the crediting period, using the table below. The project activity involves two components, Component 1: AMS-III.H. and Component 2: AMS-I.C. Two separate tables for each Components of the approved project category are applied as show in Table B.6-1 and B.6-2. Table B.6-3 shows the aggregate emission reductions of the project activity for 10 years crediting period.
Table B.6-1 Component 1 : AMS-III.H Methane Recovery in Waste Water Treatment
Year
Estimation of project activity
emissions
(Tonnes of CO2e)
Estimation of baseline Methane
emissions
(Tonnes of CO2e)
Estimation of
Leakage
(Tonnes of CO2e)
Estimation of emission reductions
by Methane Recovery
(Tonnes of CO2e) 2009 4,803 31,045 0 26,242 2010 6,404 41,393 0 34,989 2011 6,404 41,393 0 34,989 2012 6,404 41,393 0 34,989 2013 6,404 41,393 0 34,989 2014 6,404 41,393 0 34,989 2015 6,404 41,393 0 34,989 2016 6,404 41,393 0 34,989 2017 6,404 41,393 0 34,989 2018 6,404 41,393 0 34,989

PROJECT DESIGN DOCUMENT FORM (CDM-SSC-PDD) - Version 03 CDM – Executive Board
30
2019 1,601 10,348 0 8,747 Total
(tCO2e) 64,040 413,930 0 349,890
Table B.6-2 Component 2 : AMS-I.C. Thermal energy for the user with or without electricity Year Estimation of
project activity emissions
(Tonnes of CO2e)
Estimation of baseline emissions by coal combustion (Tonnes of CO2e)
Estimation of Leakage
(Tonnes of CO2e)
Estimation of emission reductions for thermal Energy (Tonnes of CO2e)
2009 0 3,619 0 3,619 2010 0 4,825 0 4,825 2011 0 4,825 0 4,825 2012 0 4,825 0 4,825 2013 0 4,825 0 4,825 2014 0 4,825 0 4,825 2015 0 4,825 0 4,825 2016 0 4,825 0 4,825 2017 0 4,825 0 4,825 2018 0 4,825 0 4,825 2019 0 1,206 0 1,206 Total
(tCO2e) 0 48,250 0 48,250
Table B.6-3 Summary of estimation of overall emission reductions
Year Estimation of project activity
emissions (Tonnes of CO2e)
Estimation of baseline emissions (Tonnes of CO2e)
Estimation of Leakage
(Tonnes of CO2e)
Estimation of overall emission
reductions (Tonnes of CO2e)
2009 4,803 34,664 0 29,861 2010 6,404 46,218 0 39,814 2011 6,404 46,218 0 39,814 2012 6,404 46,218 0 39,814 2013 6,404 46,218 0 39,814 2014 6,404 46,218 0 39,814 2015 6,404 46,218 0 39,814 2016 6,404 46,218 0 39,814 2017 6,404 46,218 0 39,814 2018 6,404 46,218 0 39,814 2019 1,601 11,554 0 9,953 Total
(tCO2e) 64,040 462,180 0 398,140

PROJECT DESIGN DOCUMENT FORM (CDM-SSC-PDD) - Version 03 CDM – Executive Board
31
B.7 Application of a monitor ing methodology and descr iption of the monitor ing plan:
B.7.1 Data and parameters monitored:
Data / Parameter : ECy (ID_1) Data unit: GWh/yr Description: Annual electricity consumption at the project site for the project activity Source of data to be used:
Measurements by project participants by using a watt-hour meter (kWh)
Value of data Value of data would be used to calculate project emissions Description of measurement methods and procedures to be applied:
The electricity consumption of project facilities installed in project activity is measured continuously. The frequency for this measurement is at least weekly and depends on accumulated values of electricity consumption. A high level of accuracy of the measurements will be achieved due to the use of high precision equipment. Data should be kept two years after last issuance of CERs.
QA/QC procedures to be applied:
Calibration as per manufacturer’s recommendations or at least every year. Maintenance will be done in strict compliance with the maintenance schedule recommended by the supplier.
Any comment: -
Data / Parameter : WCH4,y (ID_2) Data unit: m3
CH4/m3biogas
Description: Fraction of methane in the biogas Source of data to be used:
Measurements by project participants with using a periodical gas analyzer
Value of data Value of data would be used to calculate baseline emissions Description of measurement methods and procedures to be applied:
The methane fraction will be measured and registered periodically using an electronic gas analyzer. This measurement will be performed with a frequency to satisfy statistical 95% confidence level and at least quarterly. A high level of accuracy of the measurements will be achieved due to the use of high precision equipment. Data should be kept two years after last issuance of CERs.
QA/QC procedures to be applied:
Calibration as per manufacturer’s recommendations or at least every year. Maintenance will be done in strict compliance with the maintenance schedule recommended by the supplier.
Any comment: -
Data / Parameter : BGflare,y (ID_3) Data unit: Nm3/yr Description: Volumetric flow rate of biogas flowed into the flaring system in year y Source of data to be used:
Measurements by project participants by using flow meter
Value of data Value of data would be used to calculate baseline emissions Description of The volumetric flow rate measured by flow meter will be automatically corrected

PROJECT DESIGN DOCUMENT FORM (CDM-SSC-PDD) - Version 03 CDM – Executive Board
32
measurement methods and procedures to be applied:
to standard conditions by measuring equipment. The corrected data is automatically recorded and stored as accumulated values of volumetric flow in the monitoring system’s interface, SCADA (Supervisory Control and Data Acquisition). A high level of accuracy of the measurements will be achieved due to the use of high precision equipment. Data should be kept two years after last issuance of CERs.
QA/QC procedures to be applied:
Calibration as per manufacturer’s recommendations or at least every year. Maintenance will be done in strict compliance with the maintenance schedule recommended by the supplier.
Any comment: -
Data / Parameter : BGboiler,y (ID_4) Data unit: Nm3/yr Description: Volumetric flow rate of biogas flowed into the boiler in year y Source of data to be used:
Measurements by project participants by using flow meter
Value of data Value of data would be used to calculate baseline emissions Description of measurement methods and procedures to be applied:
The volumetric flow rate measured by flow meter will be automatically corrected to standard conditions by measuring equipment. The corrected data is automatically recorded and stored as accumulated values of volumetric flow in the monitoring system’s interface, SCADA (Supervisory Control and Data Acquisition). A high level of accuracy of the measurements will be achieved due to the use of high precision equipment. Data should be kept two years after last issuance of CERs.
QA/QC procedures to be applied:
Calibration as per manufacturer’s recommendations or at least every year. Maintenance will be done in strict compliance with the maintenance schedule recommended by the supplier.
Any comment: -
Data / Parameter : BGfurnace,y (ID_5) Data unit: Nm3/yr Description: Volumetric flow rate of biogas flowed into the furnace in year y Source of data to be used:
Measurements by project participants by using flow meter
Value of data Value of data would be used to calculate baseline emissions Description of measurement methods and procedures to be applied:
The volumetric flow rate measured by flow meter will be automatically corrected to standard conditions by measuring equipment. The corrected data is automatically recorded and stored as accumulated values of volumetric flow in the monitoring system’s interface, SCADA (Supervisory Control and Data Acquisition). A high level of accuracy of the measurements will be achieved due to the use of high precision equipment. Data should be kept two years after last issuance of CERs.
QA/QC procedures to be applied:
Calibration as per manufacturer’s recommendations or at least every year. Maintenance will be done in strict compliance with the maintenance schedule recommended by the supplier.
Any comment: -

PROJECT DESIGN DOCUMENT FORM (CDM-SSC-PDD) - Version 03 CDM – Executive Board
33
Data / Parameter : Tflare (ID_6) Data unit: deg C Description: Flame temperature of burner of flare Source of data to be used:
Measurements by project participants by using thermocouple
Value of data >500 Description of measurement methods and procedures to be applied:
The temperature is measured continuously with a thermocouple sensor to demonstrate that the flare is operated in optimal condition. A high level of accuracy of the measurements will be achieved due to the use of high precision equipment. The monitored data is automatically recorded and stored in the monitoring system’s interface, SCADA (Supervisory Control and Data Acquisition). Data should be kept two years after last issuance of CERs.
QA/QC procedures to be applied:
Calibration as per manufacturer’s recommendations or at least every year. Maintenance will be done in strict compliance with the maintenance schedule recommended by the supplier.
Any comment: -
Ex-post calculations of emission reductions: The ex-post emission reductions are calculated according to sum of the calculation results of each component. ERy = ER1,y + ER2,y Where:
ER1,y = Emission reductions by the methane captured and destroyed by the project activity in the year “y” in tones CO2-eq in Component 1.
ER2,y = Emission reduction from steam/heat displaced by the project activity during the year y in tones CO2e in Component 2.
Component 1: Methane Recovery in Wastewater Treatment The ex-post emission reductions are determined by measuring the methane captured and destroyed by the project activity during a year. The monitored volume of biogas (BGi) is automatically corrected to standard conditions by the measuring equipment, therefore no temperature and pressure measurement are required. The standard value for the density is derived from the standard conditions used for correction of the volume. The project emissions are resulting from incomplete combustion of the biogas. Since the boiler and the furnace have a combustion efficiency of 100%, the only project emissions occur at the flare. The project emissions are determined as paragraph 38 in Monitoring of AMS-III.H./Version 09. The

PROJECT DESIGN DOCUMENT FORM (CDM-SSC-PDD) - Version 03 CDM – Executive Board
34
project uses an enclosed flare, and continuous check of compliance with manufacturers specification of the flare device (temperature, biogas flow rate) will be done. Therefore the default value will be used in the ex-post calculation of emission reductions. By monitoring the above parameters the amount of methane captured and destroyed can be calculated according to: ER1,y = (MDy * GWP_CH4) – (ECy * CEFgrid) Where:
MDy = Amount of methane fuelled and flared in year “y” in tonnes ECy = Electricity consumption from the biogas capture equipment in the year “y” GWh/year Note: in the baseline situation there is no electricity usage. CEFgrid = Emission factor of grid in tCO2-eq/GWh. Determined under ex-ante estimation and
fixed throughout the crediting period. GWP_CH4 = Global warming potential for CH4 (value of 21 is used)
The amount of methane destroyed is determined by adding the methane fed into the boiler, the furnace and the flare: MDy = MDboiler,y + MDfurnace,y + MDflare,y Where:
MDboiler,y = Amount of methane destroyed in year “y” by boiler in tonnes MDfurnace,y = Amount of methane destroyed in year “y” by furnace in tonnes MDflare,y = Amount of methane destroyed in year “y” by flare in tonnes
The amount of methane destroyed in the boiler and the furnace is calculated according to; MDboiler,y = BGboiler,y * WCH4,y * DCH4 MDairdryer,y = BGfurnace,y * WCH4,y * DCH4 Where:
BGboiler,y = The quantity of biogas fed into boiler in year “y” by boiler in Nm3 BGfurnace,y = The quantity of biogas fed into furnace in year “y” by furnace in Nm3 WCH4,y = The average methane fraction of the biogas as measured during the year “y” and
expressed as a fraction (in m3CH4/m3Biogas) DCH4 = The methane density expressed in tones of methane per cubic meter of methane
(tCH4/m3CH4) The amount of methane destroyed in the flare is calculated according to; MDflare,y = BGflare,y * WCH4,y * DCH4 * ηflare Where:
BGflare,y = The quantity of biogas fed into flare in year “y” by boiler in Nm3
PROJECT DESIGN DOCUMENT FORM (CDM-SSC-PDD) - Version 03 CDM – Executive Board
35
ηflare = Flare efficiency (enclosed flare, 90%)
90% of default value is adopted as flare efficiency. The flare system applied in the project has automatic control system and is stopped automatically by detecting abnormal flame temperature. Thus, the flare can not operate when any of the parameters is out of the range of specifications.
Component 2: Thermal energy for the user with or without electricity
The ex-post emission reductions are determined by measuring the heat output of the furnace installed in the project activity. The ex-post emission reductions are calculated according to the No. 10 of simplified baseline methodology AMS I.C. ER2,y = HGy * EF CO2 /ηth,existing Where;
HGy = The net quantity of steam/heat supplied by the project activity during the year y in TJ. EF CO2 = The CO2 emission factor per unit of energy of the fuel that would have been used in
the baseline plant in (tCO2 / TJ), obtained from reliable local or national data if available, otherwise, IPCC default emission factors are used.
ηth,existing = The efficiency of the existing plant using fossil fuel that would have been used in the absence of the project activity. (In accordance with No. 14 (c) of methodology AMS-I.C., maximum efficiency of 100% is used as a conservative assumption)
The net quantity of steam/heat supplied by the project activity means the heat output of the furnace. The heat output of the furnace can be calculated according to: HGy = MDfurnace,y * NCVCH4 *ηth,furnace Where;
NCVCH4 = Net Calorific Value of methane in TJ/ (50.4TJ/Gg, default value of “Other Biogas” in Table 1.2 of 2006 IPCC Guidelines is used.)
ηth,furnace = The efficiency of the furnace supplied as a manufacturer’s specifications (heat efficiency of 86.5% is used.)
B.7.2 Descr iption of the monitor ing plan: >> Monitor ing parameters: The monitoring parameters are shown in Figure B-2. The Numbers in the diagram indicate ID Numbers.

PROJECT DESIGN DOCUMENT FORM (CDM-SSC-PDD) - Version 03 CDM – Executive Board
36
Figure B-2: Monitoring parameters The monitored data is sent automatically from measurement devices to the PLC (Programmable Logic Controller) and stored in a data management system SCADA (Supervisory Control and Data Acquisition) directly connected to the PLC. SCADA is the main interface of the monitoring system, although the data stored will be also kept in an external hard drive for back up. This system will be able to represent the collected data graphically. At least every month a copy of this information will be stored in an external hard drive as backup. Organization of monitor ing: Organization of CDM implementation will be composed by staff of Viet Ma Co., Ltd and external entities which will be operation adviser and CDM consultant.
Digester
Flaringsystem
Lagoons(existing)
Furnace
Wastewater
1. Electricity Consumption of project facilities
6. Flame Temperature
Boiler
3. Biogas flow rate
2. CH4 fraction in the Biogas
4. Biogas flow rate 5. Biogas flow rate
Biogas
Plant

PROJECT DESIGN DOCUMENT FORM (CDM-SSC-PDD) - Version 03 CDM – Executive Board
37
Figure B-3: Organization of the project The monitoring tasks will be distributed as follows.
Description of tasks President Plant manager
Operators Technicians Operation adviser
CDM consultant
Plant operation ○ ○ Calibration and maintenance of monitoring equipments
○ ○
Gathering the raw data Checking the stored data in SCADA
○ ○
Data backup ○ Checking the completeness and errors of the data
○
Integrating the data for calculation Comparing the data with planning
○ ○
Calculation of emission reductions
○ ○
Preparation of monitoring report for verification
○ ○ ○
Training of Personnel: The personnel of Viet Ma Co., Ltd will receive training of plant operation, trouble shooting, maintenance and monitoring procedure of the project facilities by the technology provider in the start up period. The operators will operate the project facilities with receiving advices from the external operation adviser.
President
Plant manager
Technicians•Mechanic•Electric
Operators
Operationadviser
CDMconsultant
Viet Ma Co., Ltd

PROJECT DESIGN DOCUMENT FORM (CDM-SSC-PDD) - Version 03 CDM – Executive Board
38
All new workers will be given a briefing of safety and operation manual before going the site. Then they will undergo on job training with plant manager and former operators and plant manager will give a certificate of plant operation after completion of training period. Monitoring procedure will be undertaken by plant manager with receiving advices and check of CDM consultant. Corrective and preventive actions for unusual operation: In the monitoring of the emissions reduction, the uncertainties of monitoring procedure should be reduced. Therefore, unusual operation of the project activity that may effect the monitoring will be identified and analyzed, and issued as an unusual operation report. Preventive and corrective actions will be implemented simultaneously. B.8 Date of completion of the application of the baseline and monitor ing methodology and the name of the responsible person(s)/entity(ies) >> Date of completion: 16 June 2008 Persons responsible: Mr. Seiichiro Sano Environmental Systems Engineering Department TOSHIBA CORPORATION 1-1, Shibaura 1-Chome, Minato-ku, Tokyo 105-8001 Japan Tel No: +81-3-3457-4181 Email: [email protected]
PROJECT DESIGN DOCUMENT FORM (CDM-SSC-PDD) - Version 03 CDM – Executive Board
39
SECTION C. Duration of the project activity / crediting per iod C.1 Duration of the project activity: C.1.1. Star ting date of the project activity: >> 08/12/2007 C.1.2. Expected operational lifetime of the project activity: >> 11 years C.2 Choice of the crediting per iod and related information: C.2.1. Renewable crediting per iod C.2.1.1. Star ting date of the first crediting per iod: >> Not applicable C.2.1.2. Length of the first crediting per iod: >> Not applicable C.2.2. Fixed crediting per iod: C.2.2.1. Star ting date: >> 01/04/2009 or the date of project registered, whichever is later C.2.2.2. Length: >> 10 years
PROJECT DESIGN DOCUMENT FORM (CDM-SSC-PDD) - Version 03 CDM – Executive Board
40
SECTION D. Environmental impacts >> The conclusion of Environmental Impact Assessment Report of CDM project is that environmental impacts such air pollution, water contamination may occur along with construction and operation, however, the project’s overall impact on environment will not only be small but also be reduced to minimum by implementation of project. Negative impacts on environment during construction include air pollution, water pollution and noise to some extent, as material transportation, increase of number of worker, installing of digester and pipelines. These negative impacts shall be reduced by taking the following mitigation measure: use truck with closed body for transportation of material, minimize the transport activities in the peak hours, spray water at site in the very hot and windy days etc. Negative impacts on environment during operation include water and groundwater pollution, air pollution due to discharge of treated water to Tan Hiep channel and methane gas from flare and air-heating furnace may occur in case of incident happen with digester and flare. These negative impacts shall be reduced by taking the following mitigation measure: the stacks of flare and air-heating furnace will be installed with considering ventilation for good dispersion of flue gas. The bottom of the digester will be reinforced for prevention of groundwater pollution. The characteristics of inlet and outlet wastewater from the project facilities will be watched. The positive environmental impacts of the project activity are as follows: -The project activity will reduce methane emission from existing lagoons to the atmosphere. This will improve working condition of employees of the factory and also improve living environmental conditions of the residents in surrounding area of the plant. -The project will reduce the surface and ground water pollution by improving the treated wastewater quality before entering the lagoons. - The project activity will reduce CO2 emissions from coal combustion at the existing furnace by displacing coal to biogas, which is captured from installed anaerobic digester. Other emission from coal burning such as SOX is also reduced - In the project activity, reduction of GHGs emission is expected to reduce by avoiding methane gas emissions from the existing open lagoons and by substituting coal with captured biogas. Conclusion: Construction and operation period of the project will not bring out any negative impacts to the environment but will improve current environmental conditions as said above. D.1. If required by the host Par ty, documentation on the analysis of the environmental impacts of the project activity: >> The project participants have conducted the Environmental Impact Assessment Report of CDM project. The contents of Environmental Impact Assessment Report which is required for approval process of CDM project in Vietnam is corresponding with the requirements of new Environmental Protection Law of 2006
The Environmental Impact Assessment Report was submitted to People’s Committee and Department of Natural Resource and Environment of Tay Ninh in June 2008. People’s Committee of Tay Ninh formed a

PROJECT DESIGN DOCUMENT FORM (CDM-SSC-PDD) - Version 03 CDM – Executive Board
41
Committee for review EIA Report. It takes about 30 days from submitting EIA report to Tay Ninh people’s committee to receiving approval. During preparation of EIA report, project participants have received the comments from people‘s Committee of Tan Hiep Village and Fatherland Front of Tan Hiep Village. This is formal procedure required by Environmental Protection Law of 2006.
The certificate of approval of EIA is given by Chairman of Tay Ninh people’s committee on beginning of July 2008. D.2. If environmental impacts are considered significant by the project par ticipants or the host Par ty, please provide conclusions and all references to support documentation of an environmental impact assessment under taken in accordance with the procedures as required by the host Par ty: >> Not applicable SECTION E. Stakeholders’ comments >> E.1. Brief descr iption how comments by local stakeholders have been invited and compiled: >> To collect stakeholders’ comments, following activities have been carried out:
On June 02nd 2008, Viet Ma Co., Ltd. has submitted Official Letter to the People’s Committee of Tan Hiep Village to present activities of CDM project, including potential environmental impacts if project developed and request comments and/feedbacks from Village authority and community who are neighbours of project site and may be affected by project’s impacts.
Review on explanation of Viet Ma Co., Ltd., on June 04th, 2008, People’s Committee of Tan Hiep Village has issued Official Letter to upper authority and the project’s participants with agreement for project development in the local.
Besides, to get public comments and satisfy question of neighbours who maybe affect by project activities, on June 06th, 2008, Viet Ma Co., Ltd. (the owner of project) and Techcom Development JS Co., have mutually cooperated in holding a public meeting with authority and community of Tan Hiep Village. Comments or claims of related parties are recorded in Minute of Meeting with their confirmation in evidence.
E.2. Summary of the comments received: >> Extraction from Minute of Meeting on June 06th, 2008 for CDM project of “Wastewater treatment with Anaerobic Digester at Viet Ma starch processing plant in Tay Ninh, Vietnam” has taken place during 14:15 am to 16:00 am with following details:
1. Mr. Tạ Văn Minh, on behalf of Viet Ma Co., Ltd. has given opening speech. 2. Mr. Nguyễn Huy Vũ & Mr. Nguyễn Kim Huệ, on behalf of Consultants, has presented about
activities of CDM project which will be developed in Viet Ma starch processing plant, summarize

PROJECT DESIGN DOCUMENT FORM (CDM-SSC-PDD) - Version 03 CDM – Executive Board
42
its impacts and contribution to carbon emission reduction through anaerobic digester for wastewater treatment and biogas utilization: Project based on anaerobic digester for wastewater treatment and biogas to energy by using modern technology and facilities from Toshiba. Project can contribute to reduce pollution of COD in wastewater, reduce smell by using closed digester and degrading organic substances in wastewater and consequently reduce contamination for soil and groundwater. Project can reduce carbon emission by biogas collection and combustion activities to give energy and transform CH4 into CO2.
3. Related parties have discussed and given comments for project, summarized in following table:
Question Answer Does it generate smell from project activities? Is smell strictly solved as one of targets of project?
Smell from existing lagoons consists of mainly acid smell depending on storing wastewater, which contains high concentration of organic substances, in the open lagoons. The digester installed in the project activity is closed pond and degrades the organic substances in the wastewater. Thus, acid smell will be reduced by the project activity.
How is treatment method applied for collected biogas?
Biogas generated from project will be collected and burnt for energy production. Surplus gas will be burnt at flare.
Can wastewater in anaerobic digestion ponds permeate into soil and influence in groundwater?
No, ponds used for anaerobic digestion process separated by HDPE lining. Therefore, wastewater permeation into soil and groundwater can be avoided.
How to reduce GHG effect from project establishment?
Project includes activity of methane collection and storage, one of GHGs, and using it as fuel in furnace and boiler, and surplus gas will be burnt at flare. Therefore it is not released directly into environment. Burning CH4 to transform into CO2 is also contribution to reducing 21 fold of GHG effect, relatively.
When does project start? At the moment, project is still in constructional step. At least until April 2009, project is coming to operation stage.
4. Closing speech with presentation of Mr. Tạ Văn Minh.

PROJECT DESIGN DOCUMENT FORM (CDM-SSC-PDD) - Version 03 CDM – Executive Board
43
Overall, in the public meeting, all related parties have fully agreed to develop project as suggestion and plan of project participants, no rejection or opposition or further requirements.
E.3. Report on how due account was taken of any comments received: >> All comments have been recorded in Minute of Meeting and in Part E.2 Any claim or feedback of community and local authority will be included in PDD.

PROJECT DESIGN DOCUMENT FORM (CDM-SSC-PDD) - Version 03 CDM – Executive Board
44
Annex 1
CONTACT INFORMATION ON PARTICIPANTS IN THE PROJECT ACTIVITY Organization: TOSHIBA CORPORATION Street/P.O.Box: 1-1, Shibaura 1-Chome Building: TOSHIBA Building City: Minato-ku State/Region: Tokyo Postfix/ZIP: 105-8001 Country: Japan Telephone: +81-3-3457-4511 FAX: - E-Mail: - URL: http://www.toshiba.co.jp/index_j3.htm Represented by: - Title: - Salutation: Mr. Last Name: Tajiri Middle Name: - First Name: Sumio Department: Environmental Systems Department 2 Mobile: - Direct FAX: +81-3-5444-9290 Direct tel: +81-3-3457-4305 Personal E-Mail: [email protected] Organization: VIET MA CO., LTD Street/P.O.Box: Tan Chau District, Tan Hiep Village Building: - City: - State/Region: Tay Ninh Province Postfix/ZIP: - Country: People’s Republic of Vietnam Telephone: +84-66-732191 FAX: +84-66-732192 E-Mail: - URL: - Represented by: - Title: President, CEO Salutation: Mr. Last Name: Vu Middle Name: Van First Name: Thieu Department: -

PROJECT DESIGN DOCUMENT FORM (CDM-SSC-PDD) - Version 03 CDM – Executive Board
45
Mobile: - Direct FAX: - Direct tel: - Personal E-Mail: -

PROJECT DESIGN DOCUMENT FORM (CDM-SSC-PDD) - Version 03 CDM – Executive Board
46
Annex 2
INFORMATION REGARDING PUBLIC FUNDING No public funding will be utilized to finance the project activity.

PROJECT DESIGN DOCUMENT FORM (CDM-SSC-PDD) - Version 03 CDM – Executive Board
47
Annex 3
BASELINE INFORMATION
The following tables “Table Annex 3.1 –6” summarises the data used in the ex-ante calculations of baseline emissions. Determination of Qy,ww : Table Annex 3.1 Actual results of starch production (2006)
Year Month Production volume Remarks 2006 Jan. 3,079 t
Feb. 2,576 t Mar. 2,976 t Apr. 3,112 t May 3,068 t June 3,072 t July 2,478 t Aug. 0 t Operation stop for maintenance Sep. 3,100 t Oct. 2,980 t Nov. 3,324 t Dec. 3,155 t Annual amount 32,920 t/yr
Viet Ma Co., Ltd started operation in January 2005, and regular operation has been kept since September 2005. Starch production volume of Viet Ma Co., Ltd after project implementation is estimated according to the actual production volume in 2006. Table Annex 3.2 Measurement results of wastewater flow volume (June. 27, 2007 - Aug.18, 2007)
Item Value Term of measurement June. 27, 2007 - Aug.18, 2007 Hours for measurement 1241.33 h Accumulated flow volume of wastewater 80,112m3 Amount of starch production volume during the measurement term
3,641 t
Wastewater flow per production 22.0 m3/t Actual wastewater flow rate of Viet Ma Co., Ltd was measured by an electro-magnetic flow meter from June. 27, 2007 to Aug.18, 2007 for estimating wastewater flow during project activity. Wastewater flow during project activity can be estimated according to the wastewater flow rate per production multiplied by the estimated annual production volume. Thus, annual wastewater flow rate (Qy,ww) will be 724,240m3/yr.

PROJECT DESIGN DOCUMENT FORM (CDM-SSC-PDD) - Version 03 CDM – Executive Board
48
Determination of CODy,removed,i : Table Annex 3.3 Analysis results of water content (June, 2006 - Nov., 2006)
Sampling date COD June 30, 2006 24,828 mg/L Sep. 11, 2006 12,632 mg/L Nov. 6, 2006 10,230 mg/L Nov. 9, 2006 19,038 mg/L
Average 16,682 mg/L Table Annex 3.4 Information of existing wastewater treatment system
Facilities Total area Average depth Removal rate of organic matter Anaerobic lagoon 31,000 m2 3.5 m 97 % Aerobic lagoon 10,400 m2 1.3 m 3 %
* According to the original EIA report of existing facilities of Viet Ma Co., Ltd Chemical oxygen demand removed by the existing anaerobic lagoons in the baseline situation is calculated according to the average of analyzed COD multiplied by the removal rate of existing anaerobic lagoons. CODy,removed,i = 0.0167 tonnes/m3 * 0.97 = 0.0162 tonnes/m3 Determination of CEFgrid : All the electricity to be consumed at the site of this project will be supplied by AC power through the grid. CEFgrid was calculated by applying the calculation formula for combined margins based on Category I.D. Renewable electricity generation for a grid, which is a methodology for small-scale CDMs, to the electricity generation unit requirement in Viet Nam. Tables Annex 3.5 and 3.6, respectively, show the operating margins and build margins.
Table Annex 3.5 The average emission coefficient of operating margin from 2004 to 2006 Applied technology EG η EF CEF OMsimple
(MWh) Average net energyconversion efficiency of
power unit in year(%)
CO2 Emission Factor(kg-CO2/TJ)
CO2 Emissions Factor(kg-CO2/kWh)
Average Operating MarginCO2 Emissions Factor
(kg-CO2/kWh)
Hydoro (Excluding)Coal-thermal (Other Bit.) Subcritical (after 2000) 7,982,667 39.0 94,600 0.87Fuel Oil-thermal Steam turbine (after 2000) 626,667 39.0 77,400 0.71Diesel oil thermal Steam turbine (after 2000) 46,333 39.0 74,100 0.68Natural Gas Steam turbine (after 2000) 16,331,333 37.5 56,100 0.54Total ΣP= 24,987,000 0.650Data Source Select the most conservative
condiition from EB35 ReportAnnexⅠIn the case of EG increase
ELECTRICYTY OFVIETNAM 2004-2005EVN Anuual Report 2005-2006EVN Corporate Profile 2006-2007
Default valueEB35 Report Annex12 "Toolto calculate the emissionfactor an electricity system"Annex I
Default value2006 IPCC Guidelines forNational Greenhouse GasInventories Vol.2Table1.4Table2.2
CalculationCEF=EF*3.6/η/10,000
Calculation
Type of plants

PROJECT DESIGN DOCUMENT FORM (CDM-SSC-PDD) - Version 03 CDM – Executive Board
49
Based on these margins, the electricity generation unit requirement of a baseline grid can be calculated as follows:
CEFgrid = (0.650+0.342)/2=0.496 (kg-CO2/kWh)
Table Annex 3.6 The average emission coefficient of build margin Year of operation Names of plants Type of plants Applied technology EG η EF CEF BM
(MWh) Average net energyconversion efficiency of
power unit in year(%)
CO2 Emission Factor(kg-CO2/TJ)
CO2 Emissions Factor(kg-CO2/kWh)
Build MarginCO2 emissions factor
(kg-CO2/kWh)
2006 Cao Ngan Coal(Other Bit.) CFBS 445,000 40.0 94,600 0.852006 Se San 3 Hydro 1,190,000 0.002006 Se San 3A Hydro 345,000 0.002004 Na Duong, Coal(Other Bit.) CFBS 744,000 40.0 94,600 0.852004 Phu my 4 Gas Combined-cycle 3,142,000 60.0 56,100 0.342004 Phu my 2.2 Gas Combined-cycle 5,004,000 60.0 56,100 0.342003 Phu my 2.1 Gas Combined-cycle 5,843,000 60.0 56,100 0.34
Total 16,713,000 0.342Data Source Default value
EB35 Report Annex12"Tool to calculate theemission factor anelectricity system" AnnexI
Default value2006 IPCC Guidelines forNational Greenhouse GasInventories Vol.2Table1.4Table2.2
CalculationCEF =EF*3.6/η/10,000
Calculation
Note Total EG is over 20% of total generation (MWh) in 2006CFBS:Atmospheric Circulating Fluidised Bed Combustion
Report from National Load Dispatching Center of EVN

PROJECT DESIGN DOCUMENT FORM (CDM-SSC-PDD) - Version 03 CDM – Executive Board
50
Annex 4
MONITORING INFORMATION Please refer to section B.7.

PROJECT DESIGN DOCUMENT FORM (CDM-SSC-PDD) - Version 03 CDM – Executive Board
51
APPENDIX 1: ADDITIONAL INFORMATION IRR Calculation without CER
CER trading price: 0 USD/tCO2
■Input dataValue Unit
0.0 USD
2%
(in VND) 877 VND/kWh
(in USD) 54 USD/MWh
(in VND) 1,523 VND/kg
(in USD) 93 USD/t
EPC of project facilities 2,300,000 USD
CDM procedure before implementation 0 USD
Exchange rate VND / USD 16,290.5 VND/USD * June 9, 2008
■Profit and loss statement 0 0.5 1.5 2.5 3.5 4.5 5.5 6.5 7.5 8.5 9.5 10
2008 2009 2010 2011 2012 2013 2014 2015 2016 2017 2018 2019
CER (tCO2/yr) 0 0 0 0 0 0 0 0 0 0 0
Coal alternative (t-coal/yr) 1,481 1,975 1,975 1,975 1,975 1,975 1,975 1,975 1,975 1,975 494
Electricity consumption (MWh/yr) 476 635 635 635 635 635 635 635 635 635 159
Sales of CER 0 0 0 0 0 0 0 0 0 0 0 0
Sales of biogas for coal alternative 0 138,459 184,643 184,643 184,643 184,643 184,643 184,643 184,643 184,643 184,643 46,184
TOTAL REVENUES 0 138,459 184,643 184,643 184,643 184,643 184,643 184,643 184,643 184,643 184,643 46,184
Maintenance 0 17,500 17,500 17,500 17,500 17,500 17,500 17,500 17,500 17,500 17,500 17,500
Electricity consumption 0 25,625 34,185 34,185 34,185 34,185 34,185 34,185 34,185 34,185 34,185 8,560
O&M staff 0 12,000 12,000 12,000 12,000 12,000 12,000 12,000 12,000 12,000 12,000 12,000
CDM procedure 0 0 0 0 0 0 0 0 0 0 0 0
Depreciation 0 230,000 230,000 230,000 230,000 230,000 230,000 230,000 230,000 230,000 230,000 0
TOTAL EXPENCES 0 285,125 293,685 293,685 293,685 293,685 293,685 293,685 293,685 293,685 293,685 38,060
Operating proft 0 -146,667 -109,042 -109,042 -109,042 -109,042 -109,042 -109,042 -109,042 -109,042 -109,042 8,124
Other profit and loss Interest of loan 0 0 0 0 0 0 0 0 0 0 0 0
Ordinary profit (excluding tax) 0 -146,667 -109,042 -109,042 -109,042 -109,042 -109,042 -109,042 -109,042 -109,042 -109,042 8,124
Accumulated ordinary profit (excluding tax) 0 -146,667 -255,709 -364,751 -473,794 -582,836 -691,879 -800,921 -909,963 -1,019,006 -1,128,048 -1,119,924
(Unit:USD)
■Cash flow statement 0 0.5 1.5 2.5 3.5 4.5 5.5 6.5 7.5 8.5 9.5 10
Item 2008 2009 2010 2011 2012 2013 2014 2015 2016 2017 2018 2019
Net profit (before tax) 0 -146,667 -109,042 -109,042 -109,042 -109,042 -109,042 -109,042 -109,042 -109,042 -109,042 8,124
Depreciation 0 230,000 230,000 230,000 230,000 230,000 230,000 230,000 230,000 230,000 230,000 0
Free cash flow (FCF) -2,300,000 83,333 120,958 120,958 120,958 120,958 120,958 120,958 120,958 120,958 120,958 8,124
Accumulated FCF -2,300,000 -2,216,667 -2,095,709 -1,974,751 -1,853,794 -1,732,836 -1,611,879 -1,490,921 -1,369,963 -1,249,006 -1,128,048 -1,119,924
IRR -20% -16% -13% -11% -10%
(Unit:USD)
Item
Unit price of CER
Fee for CER acquisition
Item
Unit price of electricity
Unit price of coal
Data for calculation
Investment cost
Revenue
Operatingexpences

PROJECT DESIGN DOCUMENT FORM (CDM-SSC-PDD) - Version 03 CDM – Executive Board
52
APPENDIX 1: ADDITIONAL INFORMATION IRR Calculation with CER
CER trading price: 5 USD/tCO2
■Input dataValue Unit
5.0 USD
2%
(in VND) 877 VND/kWh
(in USD) 54 USD/MWh
(in VND) 1,523 VND/kg
(in USD) 93 USD/t
EPC of project facilities 2,300,000 USD
CDM procedure before implementation 45,000 USD
Exchange rate VND / USD 16,290.5 VND/USD * June 9, 2008
■Profit and loss statement 0 0.5 1.5 2.5 3.5 4.5 5.5 6.5 7.5 8.5 9.5 10
2008 2009 2010 2011 2012 2013 2014 2015 2016 2017 2018 2019
CER (tCO2/yr) 29,861 39,814 39,814 39,814 39,814 39,814 39,814 39,814 39,814 39,814 9,953
Coal alternative (t-coal/yr) 1,481 1,975 1,975 1,975 1,975 1,975 1,975 1,975 1,975 1,975 494
Electricity consumption (MWh/yr) 476 635 635 635 635 635 635 635 635 635 159
Sales of CER 0 146,319 195,089 195,089 195,089 195,089 195,089 195,089 195,089 195,089 195,089 48,770
Sales of biogas for coal alternative 0 138,459 184,643 184,643 184,643 184,643 184,643 184,643 184,643 184,643 184,643 46,184
TOTAL REVENUES 0 284,778 379,731 379,731 379,731 379,731 379,731 379,731 379,731 379,731 379,731 94,954
Maintenance 0 17,500 17,500 17,500 17,500 17,500 17,500 17,500 17,500 17,500 17,500 17,500
Electricity consumption 0 25,625 34,185 34,185 34,185 34,185 34,185 34,185 34,185 34,185 34,185 8,560
O&M staff 0 12,000 12,000 12,000 12,000 12,000 12,000 12,000 12,000 12,000 12,000 12,000
CDM procedure 0 35,000 35,000 35,000 35,000 35,000 35,000 35,000 35,000 35,000 35,000 35,000
Depreciation 0 230,000 230,000 230,000 230,000 230,000 230,000 230,000 230,000 230,000 230,000 0
TOTAL EXPENCES 0 320,125 328,685 328,685 328,685 328,685 328,685 328,685 328,685 328,685 328,685 73,060
Operating proft 0 -35,348 51,046 51,046 51,046 51,046 51,046 51,046 51,046 51,046 51,046 21,894
Other profit and loss Interest of loan 0 0 0 0 0 0 0 0 0 0 0 0
Ordinary profit (excluding tax) 0 -35,348 51,046 51,046 51,046 51,046 51,046 51,046 51,046 51,046 51,046 21,894
Accumulated ordinary profit (excluding tax) 0 -35,348 15,698 66,745 117,791 168,837 219,883 270,930 321,976 373,022 424,068 445,962
(Unit:USD)
■Cash flow statement 0 0.5 1.5 2.5 3.5 4.5 5.5 6.5 7.5 8.5 9.5 10
Item 2008 2009 2010 2011 2012 2013 2014 2015 2016 2017 2018 2019
Net profit (before tax) 0 -35,348 51,046 51,046 51,046 51,046 51,046 51,046 51,046 51,046 51,046 21,894
Depreciation 0 230,000 230,000 230,000 230,000 230,000 230,000 230,000 230,000 230,000 230,000 0
Free cash flow (FCF) -2,345,000 194,652 281,046 281,046 281,046 281,046 281,046 281,046 281,046 281,046 281,046 21,894
Accumulated FCF -2,345,000 -2,150,348 -1,869,302 -1,588,255 -1,307,209 -1,026,163 -745,117 -464,070 -183,024 98,022 379,068 400,962
IRR -16% -10% -5% -2% 1% 3% 3%
(Unit:USD)
Item
Unit price of CER
Fee for CER acquisition
Unit price of electricity
Operatingexpences
Unit price of coal
Data for calculation
Investment cost
Revenue
Item

PROJECT DESIGN DOCUMENT FORM (CDM-SSC-PDD) - Version 03 CDM – Executive Board
53
APPENDIX 1: ADDITIONAL INFORMATION IRR Calculation with CER
CER trading price: 10 USD/tCO2
■Input dataValue Unit
10.0 USD
2%
(in VND) 877 VND/kWh
(in USD) 54 USD/MWh
(in VND) 1,523 VND/kg
(in USD) 93 USD/t
EPC of project facilities 2,300,000 USD
CDM procedure before implementation 45,000 USD
Exchange rate VND / USD 16,290.5 VND/USD * June 9, 2008
■Profit and loss statement 0 0.5 1.5 2.5 3.5 4.5 5.5 6.5 7.5 8.5 9.5 10
2008 2009 2010 2011 2012 2013 2014 2015 2016 2017 2018 2019
CER (tCO2/yr) 29,861 39,814 39,814 39,814 39,814 39,814 39,814 39,814 39,814 39,814 9,953
Coal alternative (t-coal/yr) 1,481 1,975 1,975 1,975 1,975 1,975 1,975 1,975 1,975 1,975 494
Electricity consumption (MWh/yr) 476 635 635 635 635 635 635 635 635 635 159
Sales of CER 0 292,638 390,177 390,177 390,177 390,177 390,177 390,177 390,177 390,177 390,177 97,539
Sales of biogas for coal alternative 0 138,459 184,643 184,643 184,643 184,643 184,643 184,643 184,643 184,643 184,643 46,184
TOTAL REVENUES 0 431,097 574,820 574,820 574,820 574,820 574,820 574,820 574,820 574,820 574,820 143,723
Maintenance 0 17,500 17,500 17,500 17,500 17,500 17,500 17,500 17,500 17,500 17,500 17,500
Electricity consumption 0 25,625 34,185 34,185 34,185 34,185 34,185 34,185 34,185 34,185 34,185 8,560
O&M staff 0 12,000 12,000 12,000 12,000 12,000 12,000 12,000 12,000 12,000 12,000 12,000
CDM procedure 0 35,000 35,000 35,000 35,000 35,000 35,000 35,000 35,000 35,000 35,000 35,000
Depreciation 0 230,000 230,000 230,000 230,000 230,000 230,000 230,000 230,000 230,000 230,000 0
TOTAL EXPENCES 0 320,125 328,685 328,685 328,685 328,685 328,685 328,685 328,685 328,685 328,685 73,060
Operating proft 0 110,971 246,135 246,135 246,135 246,135 246,135 246,135 246,135 246,135 246,135 70,664
Other profit and loss Interest of loan 0 0 0 0 0 0 0 0 0 0 0 0
Ordinary profit (excluding tax) 0 110,971 246,135 246,135 246,135 246,135 246,135 246,135 246,135 246,135 246,135 70,664
Accumulated ordinary profit (excluding tax) 0 110,971 357,106 603,241 849,376 1,095,510 1,341,645 1,587,780 1,833,915 2,080,050 2,326,185 2,396,848
(Unit:USD)
■Cash flow statement 0 0.5 1.5 2.5 3.5 4.5 5.5 6.5 7.5 8.5 9.5 10
Item 2008 2009 2010 2011 2012 2013 2014 2015 2016 2017 2018 2019
Net profit (before tax) 0 110,971 246,135 246,135 246,135 246,135 246,135 246,135 246,135 246,135 246,135 70,664
Depreciation 0 230,000 230,000 230,000 230,000 230,000 230,000 230,000 230,000 230,000 230,000 0
Free cash flow (FCF) -2,345,000 340,971 476,135 476,135 476,135 476,135 476,135 476,135 476,135 476,135 476,135 70,664
Accumulated FCF -2,345,000 -2,004,029 -1,527,894 -1,051,759 -575,624 -99,490 376,645 852,780 1,328,915 1,805,050 2,281,185 2,351,848
IRR -1% 4% 8% 11% 13% 14% 14%
(Unit:USD)
Item
Unit price of CER
Fee for CER acquisition
Unit price of electricity
Operatingexpences
Item
Unit price of coal
Data for calculation
Investment cost
Revenue

PROJECT DESIGN DOCUMENT FORM (CDM-SSC-PDD) - Version 03 CDM – Executive Board
54
APPENDIX 1: ADDITIONAL INFORMATION IRR Calculation with CER
CER trading price: 15 USD/tCO2
■Input dataValue Unit
15.0 USD
2%
(in VND) 877 VND/kWh
(in USD) 54 USD/MWh
(in VND) 1,523 VND/kg
(in USD) 93 USD/t
EPC of project facilities 2,300,000 USD
CDM procedure before implementation 45,000 USD
Exchange rate VND / USD 16,290.5 VND/USD * June 9, 2008
■Profit and loss statement 0 0.5 1.5 2.5 3.5 4.5 5.5 6.5 7.5 8.5 9.5 10
2008 2009 2010 2011 2012 2013 2014 2015 2016 2017 2018 2019
CER (tCO2/yr) 29,861 39,814 39,814 39,814 39,814 39,814 39,814 39,814 39,814 39,814 9,953
Coal alternative (t-coal/yr) 1,481 1,975 1,975 1,975 1,975 1,975 1,975 1,975 1,975 1,975 494
Electricity consumption (MWh/yr) 476 635 635 635 635 635 635 635 635 635 159
Sales of CER 0 438,957 585,266 585,266 585,266 585,266 585,266 585,266 585,266 585,266 585,266 146,309
Sales of biogas for coal alternative 0 138,459 184,643 184,643 184,643 184,643 184,643 184,643 184,643 184,643 184,643 46,184
TOTAL REVENUES 0 577,415 769,909 769,909 769,909 769,909 769,909 769,909 769,909 769,909 769,909 192,493
Maintenance 0 17,500 17,500 17,500 17,500 17,500 17,500 17,500 17,500 17,500 17,500 17,500
Electricity consumption 0 25,625 34,185 34,185 34,185 34,185 34,185 34,185 34,185 34,185 34,185 8,560
O&M staff 0 12,000 12,000 12,000 12,000 12,000 12,000 12,000 12,000 12,000 12,000 12,000
CDM procedure 0 35,000 35,000 35,000 35,000 35,000 35,000 35,000 35,000 35,000 35,000 35,000
Depreciation 0 230,000 230,000 230,000 230,000 230,000 230,000 230,000 230,000 230,000 230,000 0
TOTAL EXPENCES 0 320,125 328,685 328,685 328,685 328,685 328,685 328,685 328,685 328,685 328,685 73,060
Operating proft 0 257,290 441,223 441,223 441,223 441,223 441,223 441,223 441,223 441,223 441,223 119,433
Other profit and loss Interest of loan 0 0 0 0 0 0 0 0 0 0 0 0
Ordinary profit (excluding tax) 0 257,290 441,223 441,223 441,223 441,223 441,223 441,223 441,223 441,223 441,223 119,433
Accumulated ordinary profit (excluding tax) 0 257,290 698,513 1,139,737 1,580,960 2,022,184 2,463,407 2,904,631 3,345,854 3,787,077 4,228,301 4,347,734
(Unit:USD)
■Cash flow statement 0 0.5 1.5 2.5 3.5 4.5 5.5 6.5 7.5 8.5 9.5 10
Item 2008 2009 2010 2011 2012 2013 2014 2015 2016 2017 2018 2019
Net profit (before tax) 0 257,290 441,223 441,223 441,223 441,223 441,223 441,223 441,223 441,223 441,223 119,433
Depreciation 0 230,000 230,000 230,000 230,000 230,000 230,000 230,000 230,000 230,000 230,000 0
Free cash flow (FCF) -2,345,000 487,290 671,223 671,223 671,223 671,223 671,223 671,223 671,223 671,223 671,223 119,433
Accumulated FCF -2,345,000 -1,857,710 -1,186,487 -515,263 155,960 827,184 1,498,407 2,169,631 2,840,854 3,512,077 4,183,301 4,302,734
IRR 11% 16% 19% 21% 23% 24% 24%
(Unit:USD)
Operatingexpences
Unit price of coal
Data for calculation
Investment cost
Revenue
Item
Item
Unit price of CER
Fee for CER acquisition
Unit price of electricity