ce 004 432 ranson, james t.; and others changes in ... · ed 110 645. author. title. document...
TRANSCRIPT

ED 110 645
AUTHORTITLE
DOCUMENT RESUME
CE 004 432
Ranson, James T.; And OthersChanges in Students' Attitudes as Measured by aSemantic Differential Instrument; prnployer-BasedCareer Education; Technical Report%No. 39.
INSTITUTION Appalachia Educational Lab., Charleston, W. Va.SPONS AGENCY National Inst. of Education (DREW), Washington,
D.C.TR-39Sep 73NE-C-00-4-000832p.; For related documents, see CE 004 429-431 andCE 004 433-438
REPORT NOPUB DATECONTRACTNOTE
EDRS PRICE MF-$0.76 HC-$1.95 Plus PostageDESCRIPTORS Attitude Tests; *Career Education; Changing
Attitudes; Demonstration Programs; EducationalPrograms; Evaluation; Individualized Programs; PilotProjects; Rating Scales; Secondary Education;Secondary School Students; Self Concept; *SemanticDifferential; Standardized Tests; *Student Attitudes;Student Characteristics; Tables (Data); Testing;*Test Results; *Work Experience Programs
IDENTIFIERS Appalachia Educational Laboratory; EBCE; *EmployerBased Career Education
ABSTRACTThe report evaluates attitudinal changes among the 44
Appalachia Educational Labora tory's Employer-Based Career Education(AEI. /EBCE) students during the 1972-73 academic year, as measured bythe semantic differential, a test in which students were asked toselect one of seven spaces separating bipolar adjectives for each of20 pairs of adjectives describing nine different concepts orabstractions. Students examined at the beginning of their involvementin the program (Group One beginning in September 1972 and Group Twobeginning in January 1973) indicated a positive attitude to only oneconcept, education; all other concepts were viewed as neutral. Thedata also indicated that the attitudes of Group One students remainedfairly stable during the year. A comparative analysis of the GroupOne and Group Two students showed that none of the group main effectswere statistically significant on any of the nine concepts, and thatalthough some group by adjective interaction effects were found, nonewere meaningful in terms of the questions for which answers weresought. Of the report's three appendixes, one reproduces the semanticdifferential test instrument, and two provide statistical tablesdepicting analyses of variance for the test concepts. (Author/JR)


''''''-'' '''''''''''''' -',:. ; , , ,..,4 , t r: 0,1 ,...., 741`4,,,,;T".:."`.''',.'
,, ,i," '',. 't.7.;,
...4 ...s '.' ' ,, ,' -,°-3-rj- ,, .; '
p
:T4g
-
If
;
1'
; ,"- -", "--' -
""- -4 - ,- ,,',-"..--,.1. -.,,-, / ,,,,'-4 ` ',f 1, ''. '.;
I..:,-, ;.,
-
0 '°''''.!:", ,':' . 4*" '" '', '., ;-/. , '- ,_
E
,.. ;...
V-' te
', 0 1
: t
10-
'-'),' .
Vti '
15'
.....
' -..
,
',
'- :, ,..
:
i,,.1f-/
,
.,..
C -1,
''' ', ' '
'"
, .,..'''
:,":4:;;,-,
,,
:
,
,,...,°
-.-I
;., ., - .4;7,1; r i.,''',:..C*
1: 0 T. C,.1:
7,: , it
4 14

Employer-Based Career Education
Changes in Students' Attitudesas Measured by aSemantic Differential Instrument
Dr. James T. Ranson
Dr. James H. Sanders
Dr. Charles L. Bertram
TECHNICAL REPORT NO. 39
RESEARCH AND EVALUATION DIVISIONAPPALACHIA EDUCATIONAL LABORATORY, INC.
CHARLESTON, WEST VIRGINIA 25325

Preface
The following report is one of a series resulting from the evaluation
of the Employer-Based Career Education (EBCE) program as conducted by the
Appalachia Educational Laboratory, Inc., from September, 1972, through
May, 1973. The EBCE program has been designed as an educational alternative
to conventional high schools through which students learn from planned
experiences at employer sites as well as through individually guided academic
exercises.
The focus of this report is the changes in attitude toward certain
concepts by the students in the EBCE program. A semantic differential was
designed and used as an attempt to measure changes in attitude during this
first test year for the AEL/EBCE program.
The data were analyzed and the report was written by Dr. James T. Ranson
of the West Virginia College of Graduate Studies under contract to the
Laboratory. Dr. James H. Sanders was responsible for conducting and super-
vising the evaluation, including the design of the instrument. Summative
evaluation at the Laboratory is under the general direction of Dr. Charles L.
Bertram, Director of Research and Evaluation.

Preface
Table of Contents
Introduction 1
The Design 1
The Measure 3
Results 5
Initial Student Attitude 5
Change in Attitude 7
Comparison of Group I and Group II Attitudes 8
Summary and Implications 13
Appendix A 14
Appendix B 21
Appendix C 23
iii

r r. '
List of Tables
iv
1 Means, Variances, Regions of Rejection and DecisionsConcerning the Meaningfulness of Nine Conceptsfor Group I Autumn Test Results 6
2 Means of the Concepts of Group I across the ThreeObservation Periods, F-Ratios, and Levels ofSignificance 8
3 Pooled Winter and Spring Means for Group I and Group II,F-Ratios and Probability Levels for Differencebetween Groups 10
4 Group I and Group II Means and Mean Differences forWinter and Spring Testing Period with F-Ratios andProbability Levels for Group by Testing PeriodInteractions 12
List of Figures
Figures
1 Diagram of the Treatment and Testing Periods of theStudents in the EBCE Program 2
2 Comparison Mean Scores on the Nine Concepts of the
Semantic Differential according to the Autumn,Winter, and Spring Testing Periods for Group I 9

Introduction
The purpose of this report is to document the evaluation of
attitudinal changes in subjects who participated in the Employer-Based
Career Education (EBCE) program at Appalachia Educational Laboratory,
Inc. during the 1972-73 academic year. This purpose is in response to
the need for the EBCE program developers to have pertinent information
on which to make decisions related to the EBCE program.
The setting of the AEL/EBCE program is in the Charleston, West Virginia,
metropolitan area. Participants in the AEL/EBCE program were high school
seniors from the Kanawha County school system.
The 42 students were in two different groups of 21 each. One group
(Group I) participated in the program during the entire 1972-73 academic
year, and the other group (Group II) participated during the second semester
of the 1972-73 academic year. Group II originally contained 23 students,
but 21 students were randomly selected for data analysis so that the two
groups would -ontain an equal number of students. Of the 42 students for
whom data were analyzed, 11 were girls and 31 were boys.
The purpose of this evaluation was to monitor the attitudes of the
subjects as they progressed through the AEL/EBCE program. This purpose
seemed particularly relevant since the assumption was made that any
significant change in cognitive traits would also show up in affective areas
as well.
The Design
As indicated earlier two groups of 21 pupils were the data sources
for this evaluation. The two groups differed mostly by the length of time

2
which they participated in the EBCE program. The sequence of EBCE treatment
and testing periods is diagramed in Figure 1.
Treatment Autumn
TestingWinter
TestingSpring
Testing
September 1972 February 1973 May 1973A A A
Group I
[
01 1---- 1---EBCE 03EBCE 02
Group II I- No exposure --4 04 I.-- EBCE I 05
Figure 1
Diagram of the Treatment and Testing Periods of the Studentsin the EBCE Program
As indicated in Figure 1, Group I was tested three timesSeptember,
1972, February, 1973, and May, 1973; and Group II was tested two times --
February, 1973, and May, 1973. Given these conditions, the following
questions provided direction to the investigation:
1. What were the attitudes of the pupils toward identified
school, community, and career education concepts at the
beginning of the EBCE program?
2. How did the attitudes held by the students at the beginning
of the program compare with the attitudes held at midyear
'nd at the termination of the program?
3. How did the attitudes of the group of pupils who entered the
program at midyear compare with the attitudes of the pupils
who had been in the program since the beginning of the academic
year?

3
The Measure
The testing procedure used to measure the attitudes of the pupils
was the semantic differential (SD). The SD is a product of research
under the direction of Charles E. Osgoodl on the measurement of meaning.
A set of bipolar adjectives divided by seven spaces is the response setting
for the subject, and when the adjectives are so organized that the respondent
associates the adjectives with the concept, an attitude measurement can be
obtained. The AEL/EBCE semantic differential was designed by Dr. James H.
Sander:. according to procedures described by Kerlinger.2 The instrument is
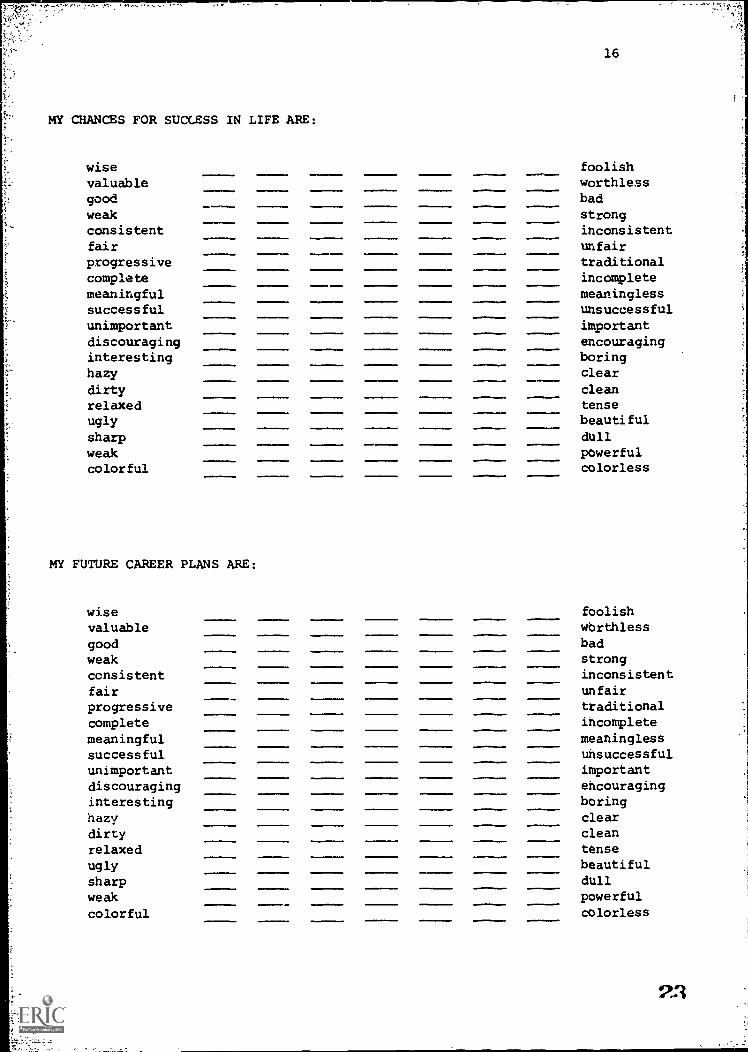
attached as Appendix A.
One purpose of the semantic differential is to measure some. of the
attitudes which respondents hold about abstract ideas on concepts. This
purpose is accomplished by having the respondent to place a check mark in
one of seven spaces which separate the bipolar adjectives.
In this study, nine different concepts or abstractions were used and
the students checked each of the same 20 bipolar adjectives for each concept.
Most of the bipolar adjectives (15 of 20) have been validated by Osgood,
but others were added in order to produce a more efficient measure of
attitude. The use of this semantic differential during the 1972-73 academic
year was the first use, and any findings are therefore considered provisional.
The nine concepts were:
(1) My chances for success in life are:
(2) My future career plans are:
1Charles E. Osgood, George J. Suri, and Percy H. Tannenbaum. TheMeasurement of Meaning.. (Urbana: University of Illinois Press, 1957, 1965).
2Fred N. Kerlinger. Foundations of Behavioral Research. (New York:
Holt, Rinehart and Winston, Inc., 1967), p. 564-580.
10

4
(3) My responsibility to the governance of my community is:
(4) Education is:
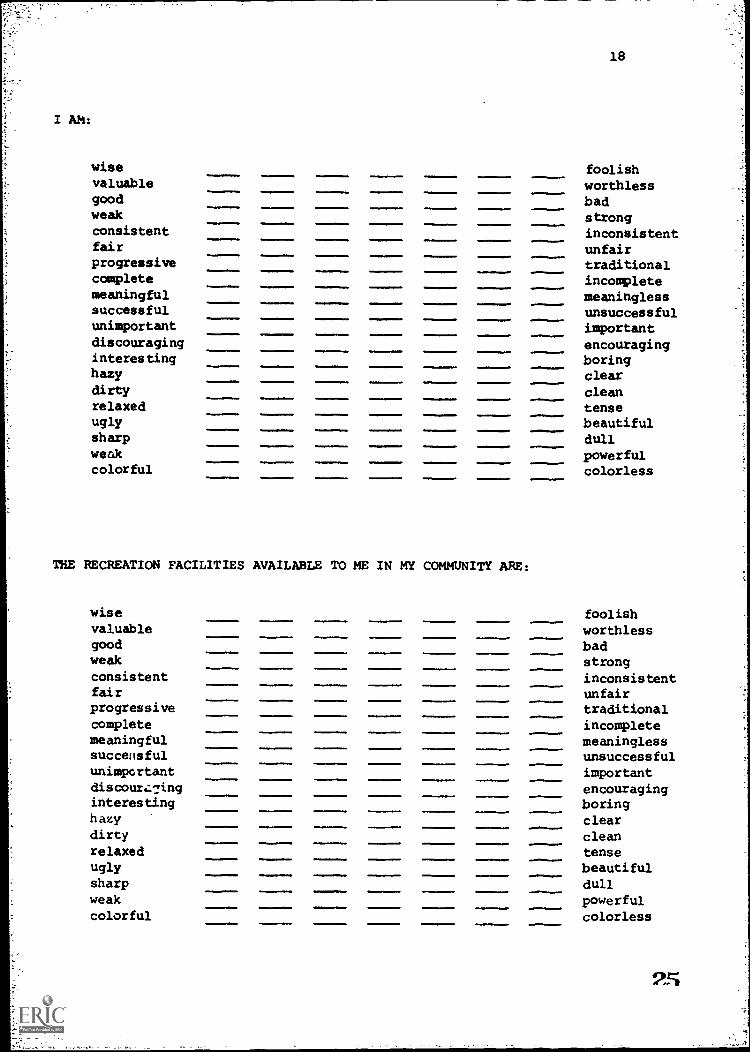
(5) I am
(6) The recreation facilities available to me in my community are:
( The social contributions of my community to my well being are:
(8) All occupations are:
(9) My contributions to my community are:
The 20 bipolar adjectives were:
(1) Wise - foolish (11) Important - unimportant
(2) Valuable - worthless (12) Encouraging - discouraging
(3) Good - bad (13) Interesting - boring
(4) Weak - strong (14) Clear - hazy
(5) Consistent - inconsistent (15) Clean - dirty
(6) Fair - unfair (16) Relaxed - tense
(7) Progressive - traditional (17) Beautiful - ugly
(8) Complete - incomplete (18) Sharp - dull
(9) Meaningful - meaningless (19) Powerful - weak
(10) Successful - unsuccessful (20) Colorful - colorless
The respondent is asked to place a check mark on one of the seven spaces
between each adjective. Each space is assigned a number, i.e., 1, 2, 3, 4,
5, 6, 7, depending where it is located between the adjectives. The space
located next to the positive pole in the adjective pair is designated "7"
aad the number next to the negative pole is "1". The unit of measure is
therefore a "1" through "7" with "7" being the most positive and "1" being
the most negative.

5
The preponderance of the data that have been geflerated about the SD
suggest three primary factors make up the meaning space of adjectives.1'2
These three factors, which were identified 131 Osgood through a factor
analysis procedure, were designated evaluative, potency, and activity.
These same data also suggest that in general the evaluative factor is
usually the strongest factor, and eight of the 20 adjective pairs had been
identified as evaluative in other studies. One preliminary assumption of
this study is that the adjectives as a whole are evaluative in nature.
Results
Initial Student Attitude
The first question was, "What was the general nature of the attitudes
of the pupils at the beginning of the EBCE program?" To arrive at an answer
to this question, an assumption was made that "4" on the seven point scale
indicated a neutral attitude toward a concept, and that variation from a "4"
indicated a positive or negative attitude. Given this assumption, the error
term of the F-ratio for testing the statistical significance of the differences
for the three testing periods was used as an estimate of the variance of the
meaning space in the population. Another assumption was that the mean semantic
differential score for the Autumn testing was an estimate of the strength of
meaning for the sample. Given these assumptions, a probability level of .05
!two- tailed test) was used to define a region of rejection for the hypotheses
that the observed means were equal to "4". The results of this analysis are
presented in Table 1. The only concept of the nine which was determined to
be other than neutral was Concept No. 4, "Education is". The mean for elis
1Kerlinger, p. 567.
2Osgood, p. 36-38.
12

6
concept was 5.52 which indicated a positive attitude toward education held
by the pupils at the beginning of the program.
Table 1
Means, Variances, Regions of Rejection and Decisions Concerningthe Meaningfulness of Nine Concepts for Group I
Autumn Test Results
Concept* S2Region ofRejection** Meaningful
1 5.04 10.12 2.56>i>5.44 No
2 5.31 11.18 2.49>7>5.51 No
3 4.24 , 8.93 2.65 >X >5.35 No
4 5.52 10.86 2.51>i>5.49 Yes
5 4.86 9.70 2.59>i>5.41 No
6 3.79 13.78 2.32 >X >5.68 No
7 4.10 15.42 2.23 >X >5.77 No
8 4.86 5.39 2.95>i>5.05 No
9 4.34 9.16 2.63 >X >5.37 No
*Concept identification: (1) Chances for success, (2) career plans,
(3) responsibility to governance of community, (4) education, (5) myself,
(6) recreation facilities, (7) social contributions of my community,(8) occupations, and (9) my contribution to my community.
**Two-tailed test p < .05.
In c.7e preceding discussion the means were compared with an external
value, namely, the value of "4" because the assumption was made that "4"
indicated a neutral attitude. For the ensuing discussion the comparison will
wI

be based on internal criteria using the mean scores to determine whether any
significant attitudinal differences existed among the nine concepts. To make
this comparison, the variances used in the error terms of the F-ratio to
test differences across the three testing periods were pooled and used as
the variance estimate for the "q "- statistic.. No statistically significant
differences emerged as a result of this analysis. Therefore, at the Autumn
observation period the subjects held no differential attitudes with respect
to the nine concepts.
Change in Attitude
The second question was, "How did the attitudes held by the students
at the beginning of the program compare with the attitudes held at midyear
and at the termination of the program?" To arrive at an answer to this
question a "treatment by treatment by subject" analysis of variance was con-
ducted on Group I aata. The first "treatment" was the three observation
periods--Autumn, Winter, and Spring, and the second "treatment" was the set
of 20 bipolar adjectives. The ANOVA summary table is included as Appendix
B. The semantic differential means for the three observation periods, the
F-test of the means for each of the nine concepts, and the probability
associated with each F-test are given in Table 2. Figure 2 graphically
depicts the means for the three testing periods and the nine concepts.
Although all but one of the attitudes appeared to become more positive
between Autumn and Spring testing, none of the F-tests were statistically
significant using a criterion probability of .05. _The positive change in
Concept No. 9, "My contributions to my community are", was significant at the
.10 level and would provide some evidence that the EBCE program participants
began to regard their role in their community more positively. In general,
the attitudes of Group I students remained fairly stable during the year.

Table 2
Means of the Concepts of Group I across the Three ObservationPeriods, F-Ratios, and Levels of Significance
Concept* Fall Winter Spring F P
,1 5.04 5.27 5.36 1.17 WS
2 5.31 5.22 5.45 0.47 NS
3 4.24 4.46 4.64 1.91 NS
4 5.52 5.05 5.16 2.31 NS
5 4.86 4.75 5.04 0.92 NS
6 3.79 3.70 4.12 1.50 NS
7 4.10 4.04 4.44 1.28 NS
8 4.86 4.80 5.12 2.29 NS
9 4.34 4.49 4.80 2.44 0.10
*Concept identification: (1) Chances for success, (2) career plans,(3) responsibility to governance of community, (4) education, (5) myself,(6) recreation facilities, (7) social contributions of my community,(8) occupations, and (9) my contribution to my community.
Comparison of Group I and Group II Attitudes
The third question was, "How did the attitudes of Group II students
who entered the program at midyear compare with those of Group I students
who participated in the program for the entire academic year?* To arrive at
an answer to this question a mixed model analysis of variance design was used.
This ANOVA design controlled for group differences, Winter and Spring testing
periods, and the 20 adjective pairs. The group main effects and the group
by testing period interaction were of interest in comparing the two groups
across the two testing periods.
15

6 5 4
Distance from Neutral Point of "4"
Concepts 1
2
4r,
;""2
.4.':
;),
34
Figure 2
5
KEY: Autumn
Winter
Spring
6
L=
3 7
Comparison Mean Scores on the Nine Concepts of the Semantic Differential
according to the Autumn, Winter, and Spring
Testing Periods for Group I
B9

10
The group main effect was a test on the pooled Winter and Spring means
for Group I and Group II. None of the group main effects were statistically
significant on any of the ninetconcepts. The pooled Winter and Spring means,
the F-ratios, and the probability levels for each of the nine concepts are
presented in Table 3.
Table 3
Pooled Winter and Spring Means for Group I and Group II, F-Ratiosand Probability Levels for Difference between Groups
Concept* Group I Group II F-Ratio P
1 5.32 5.34 0.01 NS
2 5.33 5.39 0.06 NS
3 4.55 4.70 0.19 NS
4 5.11 5.39 1.03 NS
5 4.90 5.19 1.13 NS
6 3.92 4.13 0.32 NS
7 4.24 4.48 0.51 NS
8 4.96 4.79 0.47 NS
9 4.64 4.61 0.02 NS
*Concept identification: (1) Chances for success, (2) career plans,(3) responsibility to governance of community, (4) education, (5) myself,(6) recreation facilities, (7) social contributions of my community,(8) occupations, and (9) my contribution to my community.
After evaluating the group main effect, the group by testing period
interaction for each of the nine concepts was evaluated. The means for
Group I and Group II at the Winter and Spring testing periods, the group
17

11
by testing period interaction, F-ratio, and the probability levels are
given in Table 4. None of the interaction effects with the exception of
Concept No. 9 were statistically significant.
Concept No. 9 was specifically "My contributions to my community were".
This concept had a statistically significant interaction (p < .03) which
was apparently due to a reversal in attitude at the Spring testing. At the
Winter testing Group II had a more positive attitude than did Group I, and
at the Spring testing, Group I had a more positive attitude than did Group II.
The differences between the means for Group I and Group II the Winter
and Spring testing periods is also presented in Table 4. With the assumption
that the error value for the group by period interaction was a variance
estimate of differences between the two means, the critical region for the
differences between the means was calculated and yielded no differences which
were statistically significant at the .05 level (two-tailed test). Based
on the statistical analyses, no significant differences were found between
Group I and Group II in relation to the two testing periods.
Other statistically significant findings did emerge in the analysis.
One such finding concerned group by adjective interactions on concepts 1, 2,
4, 7, and 8. In concept 1 ("My chances for success") the two groups rated
the good-bad" and the "strong-weak" differently with Group I expressing a
stronger negative reading than Group II on these two bipolar adjective pairs.
This finding could be quite significant because these two adjective pairs
measure strength of meaning about a concept.
The adjectives main effect was statistically significant in the analyses
for each of the nine concepts. The adjectives were selected to assess the
attitudes of the participants in the program. Probably the most useful method
1 ti

Table 4
Group I and Group II Means and Mean Differences for Winter andSpring Testing
Periods with F-Ratios and Probability Levels for
Group by Testing Period Interactions
Concept
Winter
S.rin-
Group I
Group II
Difference*
Group I
Group II
Difference*
F-Ratio**
p**
15.27
5.36
0.09
5.36
5.33
0.03
0.17
NS
25.22
5.43
0.21
5.45
5.35
0.10
0.96
NS
34.46
4.79
0.33
4.61
4.61
0.03
1.55
NS
45.05
5.42
0.37
5.16
5.36
0.20
0.31
NS
54.75
5.20
0.45
5.04
5.18
0.14
1.79
NS
63.70
4.06
0.36
4.12
4.60
0.48
0.74
NS
74.04
4.51
0.47
4.44
4.45
0.01
1.60
NS
84.80
4.77
0.03
5.12
4.81
0.31
1.69
NS
94.49
4.80
0.31
4.80
4.42
0.38
4.81
0.03
*Based on the assumption that the denominator of
the Fmratio was a valid variance estimate, the calculatedt-test
for the difference between means indicated that
none of the differences between groups were statistically significant.
**For group by testing period interaction.
N

13
for analyzing and interpreting the adjecries would be to conduct a factor
analytic study to isolate common variance among the adjectives; however, this
type of analysis is beyond the scope of this study.
Summary and Implications
Assuming that the middle space in the seven space scale of the bipolar
adjectives is indicative of meaninglessness, i.e., a neutral position, the
only concept which was meaningful at the beginning of the year was "Education
is". Subsequent analysis indicated that no change occurred across the three
testing periods except for the students' attitude toward their community
which became progressively and significantly more positive with succeeding
testing periods. No differences between Group I and Group II were detected.
Some group by adjective interaction effects were found, but were not meaningful
in terms of the questions for which answers were sought.
The purpose of this study was to monitor the attitudes of the participants
in the AEL/EBCE program during the 1972-73 academic year. The attitudes
do not appear to have been affected either for good or bad. In fact, the
attitudes remained constant in Group I during the year, and Group II which
entered at midyear was equal to Group I for the period of time which they
were in the program.
Education appears to be the most meaningful of the nine concepts which
were used. The positive attitude recorded at the first of the year remained
high throughout the program. This could indicate that the pupils enter
school with a high degree of motivation and expectation. However, these
conclusions war -ant more investigation before they can be taken very seriously.
2.0
X
0
0
;

Name
DIRECTIONS
Age Sex
1. This survey is to let you describe how you feel or what you think.
2. Show what you think about the concept (phrase) on the top of eachpage by placing an "X" in one of the seven blanks between each setof adjectives (from very good to very bad).
3. Use only one mark for each pair of adjectives, but each pair shouldhave one mark.
4. There are no right or wrong answers. Your first thought is usuallythe best one to record.
Example:
Please react to the concept:
ICE CREAM
Good Bad
15
You might have reacted to the concept ICE CREAM in one of seven ways.The following illustrates the seven different ways you might have markedwith an interpretation of each alternative.
GoodVery GoodModerately GoodSomewhat GoodSo-So orMaybe no Meaning
X
X
X
X
Bad
X Somewhat BadX Moderately Bad
X Very Bad
MY CHANCES FOR SUCCESS IN LIFE ARE:
16
wise foolish
valuable worthlessgood badweak strongconsistent inconsistentfair unfairprogressive traditionalcomplete incompletemeaningful meaninglesssuccessful unsuccessfulunimportant importantdiscouraging encouraginginteresting boringhazy clear
dirty cleanrelaxed tenseugly beautiful
sharp dull
weak powerfulcolorful colorless
MY FUTURE CAREER PLANS ARE:
wise foolish
valuable worthless
good badweak strong
consistent inconsistent
fair unfair
progressive traditional
complete incomplete
meaningful meaninglesssuccessful unsuccessful
unimportant importantdiscouraging encouraging
interesting boringhazy clear
dirty clean
relaxed tense
ugly beautiful
sharp dull
weak powerful
colorful colorless
2.3

MY RESPONSIBILITY TO THE GOVERNANCE OF MY COPUIUNITY IS:
17
wisefoolish
valuableworthless
good badweak
strongconsistent
inconsistentfair
unfairprogressive traditionalcomplete
incompletemeaningful
meaninglesssuccessful unsuccessfulunimportant importantdiscouraging encouraginginteresting boringhazy cleardirty cleanrelaxed tenseugly beautifulsharp dullweak powerfulcolorful colorless
wisevaluablegoodweak
consistentfair
progressivecompletemeaningfulsuccessfulunimportantdiscouraginginteresting
dirtfrelaxedugly
sharpweakcolorful
foolishworthlessbadstrong
inconsistentunfair
traditionalincompletemeaninglessunsuccessfulimportantencouragingboringclearcleantensebeautifuldullpowerfulcolorless
24
I AM:
18
wise foolishvaluable worthlessgood badweak strongconsistent inconsistentfair unfairprogressive traditionalcomplete incompletemeaningful meaninglesssuccessful unsuccessfulunimportant importantdiscouraging encouraginginteresting boringhazy cleardirty cleanrelaxed tenseugly beautifulsharp dullweak powerfulcolorful colorless
THE RECREATION FACILITIES AVAILABLE TO ME IN MY COMMUNITY ARE:
wise foolishvaluable worthlessgood badweak strongconsistent inconsistentfair unfairprogressive traditionalcomplete incompletemeaningful meaninglesssuccei ;sful unsuccessfulunimportant importantdiscourz7ing encouraginginteresting boringhazy cleardirty cleanrelaxed tenseugly beautifulsharp dullweak powerfulcolorful colorless
25

THE SOCIAL CONTRIBUTIONS OF MY COMMUNITY TO MY WELL BEING ARE:
wisevaluablegoodweakconsistentfairprogressivecompletemeaningfulsuccessfulunimportantdiscouraginginterestinghazydirtyrelaxedugly
sharpweakcolorful
ALL OCCUPATIONS ARE:
moms olumNIMI.
.M.1.71.11111
11=1==.
....,
19
foolishworthlessbadstronginconsistentunfairtraditionalincompletemeaninglessunsuccessfulimportantencouragingboringclearcleantensebeautifuldullpowerfulcolorless
wise foolishvaluable worthlessgood badweak strongconsistent inconsistentfair unfairprogressive traditionalcomplete incompletemeaningful meaninglesssuccessful =successfulunimportant importantdiscouraging encouraginginteresting boringhazy cleardirty cleanrelaxed tenseugly beautifulsharp dullweak powerfulcolorful colorless
2G

MY CONTRIBUTIONS TO MY COMMUNITY ARE:
wisevaluablegoodweakconsistentfairprogressivcompletemeaningfulsuccessfulunimportantdiscouraginginterestinghazydirtyrelaxeduglysharpweakcolorful
6.11.
20
foolishworthlessbadstronginconsistentunfairtraditlonalincompletemeaningless
unsuccessfulimportantencouragingboringclearcleantensebeautifuldullpowerfulcolorless
2.7

Appendix B
F-Ratios and Levels of Significance for Group I Analysisof Variance by Their Testing Periods and Twenty Adjectives

22
F -Ratios and Levels of Significance for Group I Analysis ofVariance by Their Testing Periods and Twenty Adjectives
Concepts* Period Adjective Period x Adjective
Concept 1 5.48, p<.0001
Concept 2 8.09, p<.0001
Concept 3 2.49, p<.001
Concept 4 14.08, p<.0001 1.52, p<.05
Concept 5 3.68, p<.0001 2.17, p<.001
Concept 6 1.75, p<.05
Concept 7 3.16, p<.0001
Concept 8 9.07, p<.0001
Concept 9 2.44, p<.10 2.62, p<.001
*Concept identification: (1) Chances for success, (2) career plans, (3) responsibilityto governance of community, (4) education, (5) myself, (6) recreation facilities,(7) social contributions of my community, (8) occupations, and (9) my contributionto my community.
29

Appendix C
Patios and Levels of Significance for Main Effects andInteractions of Two Groups Over Two Testing Periods

F-Ratios and Levels of Significance for Main Effects and
Interactions of Two Groups Over Two Testing Periods
Concepts*
Group
Period
Adjective
Group x
Period
Group x
Adjective
Period x
Adjective
Group x Period
x Adjective
Concept 1
9.28,
p<.001
1.75,
p<.05
410.
Concept 2
10.39,
p<.001
1.86,
p<.05
Concept 3
--
3.99,
p<.001
--
--
Concept 4
--
19.23,
p<.001
-2.11,p<.01
2.11,p<.01
-
Concept 5
-6.26,
p<.001
--
2.26,
p<.01
-
Concept 6
--
3.'56,p<.001
--
1.76,
p<.05
Concept 7
--
4.87,
p<.001
-1.63,
p<.05
Concept 8
-2.92, p<.10
11.89,
p<.001
1.49,
p<.10
Concept 9
-3.49,p<.001
4.81, p<.05
-
*Concept identification:
(1) Chances for success, (2) career plans, (3) responsibility to governance of community,
(4) education, (5) myself, (6) recreation facilities, (7) social contributions of my community, (8) occupations,
and (9) my contribution to my community.

This report is published by the Appalachia Educational Laboratory,Inc., pursuant to Contract No. NE-C-00-4-0008 with the National Institute
of Education, U.S. Department of Health, Education, and Welfare. The
opinions expressed in this publication do not necessarily reflect theposition of policy of the National Institute of Education and no officialendorsement by that office should be inferred. The Appalachia Educa-tional Laboratory, Inc., is an equal opportunity employer.