celebrating the “year of the carbon - california public ... the “year of the carbon ”1 _____...
TRANSCRIPT

Celebrating the “Year of the Carbon" This paper provides a summary of major cap and trade systems covering GHG emissions
2016
5/1/2016

Page 1
Celebrating the “Year of the Carbon”1
_____________________________________________________________________
I. Executive Summary Since the establishment of the world’s first international cap-and-trade system for greenhouse gas
emissions, the European Union Emissions Trading System, there has been a surge in the number of
countries implementing policy instruments using carbon prices to curb greenhouse gas emissions.
According to the World Bank, “in 2015, about 40 national and over 20 subnational jurisdictions,
representing almost a quarter of global greenhouse gas emissions (GHG), are putting a price on carbon”2
in the form of carbon tax or emission trading systems (ETS). These instruments cover 12% of the global
GHG emissions, 8% by ETSs and 4% by carbon taxes. Pricing of these instruments ranges between less
than $1 and $130/tCO2e, with 85% of the emissions being priced under $10/tCO2e, and generate proceeds
just below $50 billion per year.3 Let’s keep in mind that top three GHG emitters of the world are China,
the United States, and the European Union (28).4 Only the latter two have established cap-and-trade
programs, and China is in the planning and testing stage.
With the global commitment shown at the 2015 United Nations Climate Change Conference held in Paris,
China starting a cap-and-trade system in 2017, and the possibility of more states joining cap-and-trade
systems in compliance with the Clean Power Plan, carbon pricing has been in the spotlight more than ever
and appears to be on its way to become a conventional policy instrument. Many policymakers still
wonder though whether a cap-and-trade approach is effective, and if it is, how it compares to taxing
carbon. Lately, a number of studies discussing the lessons learned from emission trading markets and/or
analyzing the root causes of declining emissions in areas where a cap and trade system has been in
operation have been published. While the verdict is not definitely out yet, the number of countries
implementing either approach is increasing every year. Given that, the goal of this document is to
summarize the recent developments and performance results of the existing carbon markets and highlight
some of the findings and suggested lessons learned provided by the experts in the field. The findings and
1 Grant, A.”'Year of the Carbon': Power industry prepares to roll up sleeves for 2016,” January 11, 2016, SNL News.
2 Kossoy, Alexandre; Peszko, Grzegorz; Oppermann, Klaus; Prytz, Nicolai; Gilbert, Alyssa; Klein, Noemie; Lam,
Long; Wong, Lindee. 2015. Carbon Pricing Watch 2015. Washington, DC. World Bank. 3 Ibid. p.21.
4 Based on the 2012 data provided by the World Resources Institute Climate Data Explorer.
http://cait.wri.org/historical/Country%20GHG%20Emissions?indicator[]=Total%20GHG%20Emissions%20Excludi
ng%20Land-
Use%20Change%20and%20Forestry&indicator[]=Total%20GHG%20Emissions%20Including%20Land-
Use%20Change%20and%20Forestry&year[]=2012&sortIdx=NaN&chartType=geo

Page 2
suggested lessons in this document do not necessarily reflect the views, official policy, or position of the
California Public Utilities Commission or other agencies of the State of California.
Below you will find a table summarizing the characteristics of the three major cap-and-trade markets
reviewed in the paper.
Table I. Summary of the Major Cap-and-Trade Systems Covering GHG Emissions
System Geographic
Scope
Sectors
Covered
Time
Period
Allowance
Allocation
Method
Cost
Containment
Mechanisms
Environmental &
Economic
Performance California-
Québec
linked
programs
CA and
Québec
Electric
power,
large
stationary
sources,
and fuels
2013-
2020
Transitions
from free to
increasing
amount
through
auctions
Banking,
Allowance Price
Containment
Reserve,
Limited Use of
Offsets
Design works as
expected, but too soon to
evaluate
environmental/economic
performance
RGGI Nine
northeastern
states
Electric
power
2009-
2020
Nearly 100%
Auction
Banking, Cost
Containment
Reserve,
Auction
Reservation
Price
Mixed opinions
EU ETS 27 EU
Member
States plus
Iceland,
Lichtenstein,
& Norway
Electric
power,
large
industrial,
and
aviation
2005-
2020
Transitions
from free to
increased use
of auctions
Limited
Banking,
previous use of
offsets from
CDM
Mixed opinions
Page 3
Table of Contents I. Executive Summary ................................................................................................................. 1
II. Background .......................................................................................................................... 4
III. Domestic Markets ................................................................................................................ 4
A. California’s Cap-and-Trade System ................................................................................. 5
B. RGGI .............................................................................................................................. 10
IV. Foreign and International Markets ..................................................................................... 15
A. EU ETS .......................................................................................................................... 15
B. Canada ............................................................................................................................ 21
C. Emerging Markets .......................................................................................................... 22
V. Carbon Taxes ..................................................................................................................... 23
VI. Conclusion ......................................................................................................................... 25

Page 4
II. Background There have been many promising developments in domestic and international climate change policy
lately. The 2015 United Nations Climate Change Conference held in Paris brought hope and new
prospects for international and national/subnational carbon pricing schemes. Recently, China announced
that it will start a cap-and-trade system in 2017 – it is already testing different model systems in seven
provinces. In the United States the Clean Power Plan, proposed federal legislation to reduce emissions
from power plants, has started discussions on more states joining existing cap-and-trade systems or
starting their own.5 Results of the California and RGGI carbon markets have been changing the view that
carbon pricing might be detrimental to the health of the local economy.
On the other hand, we witnessed disappointments and set backs on carbon pricing as well. For example,
Australia repealed its carbon tax in 2014 and scrapped plans for permit trading after the measures were
blamed for destroying jobs.6 In the US, New Jersey exited the Regional Greenhouse Gas Initiative
(RGGI) in 2011, “declaring it an ineffective way to reduce carbon dioxide emissions.”7
Given all the media attention on climate change policy instruments, up-and-coming policy initiatives, and
interest in carbon pricing, including cap-and-trade systems, our goal in this paper is to provide a short
update on the most recent developments in carbon pricing schemes, briefly review current structures of
the existing systems in California, the Northeastern US, and Europe and summarize various experts’
findings on the economic and environmental performance of these systems. We will also report on
countries implementing a carbon tax in lieu of or in conjunction with a cap-and-trade system.
III. Domestic Markets In this section, we will provide a general overview of the California cap-and-trade system (CaT) and
RGGI as well as their economic and environmental effectiveness. Both systems are typical regulatory
5 The Clean Power Plan, implementation of which was recently stayed by the U.S. Supreme Court pending a hearing
on the merits by the DC Circuit Court of Appeals, aims to regulate greenhouse gas emissions from existing power
plants. To comply, states must meet mass emissions or emissions-rate targets between 2022 and 2030. States have
flexibility to design their own implementation plans. Carbon pricing programs, cap-and-trade programs, carbon
taxes or fees, as well as linking of state programs are not mandated, but encouraged.
For more on how states’ actions on the Clean Power Plan, see Harball, E et al. 2016. Carbon trading finds a foothold
in at least 20 states. ClimateWire. Accessed on 2/12/2016.
http://www.eenews.net/stories/1060030764?utm_source=Sailthru&utm_medium=email&utm_campaign=Issue:%20
2016-01-19%20Utility%20Dive%20Newsletter&utm_term=Utility%20DiveSee 6 Carr, M, A. Vitelli. The Cost of Carbon, Bloomberg News, 24 December, 2015. Available at:
http://www.bloombergview.com/quicktake/carbon-markets-2-0 7 Navarro, M. “Christie Pulls New Jersey from 10-State Climate Initiative,” New York Times, May 26, 2011.
Available at:
http://www.nytimes.com/2011/05/27/nyregion/christie-pulls-nj-from-greenhouse-gas-coalition.html?_r=0

Page 5
cap-and-trade programs, where the regulator sets a firm cap on the target emissions and issues allowances
for each ton of emission allowed under the cap. Allowances are allocated through various mechanisms,
including through auctions, and trading allowances sets the market price for them. Those who can reduce
emissions at a lower cost can sell the allowances they own, so that the emission reduction goal is reached
in a cost-effective manner. Even though the general structure of the policy instrument is similar in both
systems, key design features vary, which also might affect the performance of these systems.
A. California’s Cap-and-Trade System Pursuant to Assembly Bill (AB) 32 enacted in 2006, the California Air Resources Board (CARB)
established a comprehensive suite of measures to reduce the state’s greenhouse gas (GHG) emissions to
their 1990 levels by 2020. This suite of measures included implementing a cap-and-trade system, among
many other measures. California’s cap-and-trade program (CaT) is a market instrument used to reduce
GHG8 emissions in a cost-effective manner. The program covers about 450 entities in a variety of
sectors.9 The first compliance period started in January 2013 for electricity generators and importers and
large industrial facilities emitting 25,000 million metric tons of carbon dioxide equivalent (MTCO2e)10
or
more annually. Since 2015 distributors of transportation, natural gas, and other fuels have been included
as well. Currently, almost 85% of California’s GHG emissions are covered by the cap-and-trade program,
which is in its second phase covering 2015 through 2017.
In April 2015, Governor Jerry Brown issued Executive Order B-30-15, which calls for a 40% reduction in
GHG emissions from 1990 levels by 2030.11
As mandated by this Executive Order, CARB is currently
updating the AB 32 Climate Change Scoping Plan to reflect this 2030 emission reduction goal. A key
strategy in California’s emissions reduction program to 2020 and beyond is California’s cap-and-trade
program, the key design elements of which can be summarized as follows:
8 Carbon Dioxide (CO2), Methane (CH4), Nitrous Oxide (N2O),Sulphur Hexafluoride (SF6), Hydrofluorocarbons
(HFCs), Perfluorocarbons (PFCs), Nitrogen Trifluoride and other fluorinated GHGs. 9 Cement production, cogeneration, glass production, hydrogen production, iron and steel production, lead
production, lime manufacturing, nitric acid production, petroleum and natural gas systems, petroleum refining, pulp
and paper manufacturing, self-generation of electricity, stationary combustion, CO2 suppliers, first deliverers of
electricity, suppliers of natural gas, suppliers of reformulated blend stock for oxygenate blending (RBOB) and
distillate fuel oil, refineries that produce liquid petroleum gas in California, facilities that process natural gas liquids
to produce liquid petroleum gas, and suppliers of liquefied natural gas. 10
MTCO2e is a metric used to compare emissions of various greenhouse gases. It is the mass of carbon dioxide that
would produce the same estimated radiative forcing as a given mass of another greenhouse gas. Carbon dioxide
equivalents are computed by multiplying the mass of the gas emitted by its global warming potential. (Source:
CARB) 11
https://www.gov.ca.gov/news.php?id=18938

Page 6
Table II. Key Design Elements of the California’s Cap-and-Trade System
Cap
12 98% of anticipated 2012 emissions
Declines about 2 percent in 2014
Declines about 3 percent annually from 2015 to 2020
Sectors
Covered
Electricity (including imports) and large stationary sources
Transportation fuels and residential and commercial natural gas were included starting January
1, 2015
Allowances Free allocation plus auctioning, transitioning to increased amount of allowances distributed
through auctions
Banking
Allowed
Offsets Allowed – up to 8 percent of a covered entity’s compliance obligation
Price collar An auction reserve price sets the minimum price at which allowances are available for
purchase at auction. In 2016, the auction reserve price is $12.73. Allowances are also available
for purchase at set prices from an Allowance Price Containment Reserve, There are three price
tiers for reserve allowances; in 2016, the price tiers are $47.54, $53.49, and $59.43 These
allowances are available at reserve sales offered quarterly, not through the regular auctions.
Free
Allocation
Has granted free allowances to industrial sectors for emissions leakage prevention and
transition assistance (primarily based on product-based emissions intensity benchmarks), and
to electrical distribution utilities and natural gas suppliers for ratepayer protection. Universities
and public service facilities, public water, and legacy contract generators also receive
allocation for transition assistance.
Linked California’s system was linked to a very similar system in Québec in 2014 as part of a broader
Western Climate Initiative linkage
In fall 2015, ARB began a public process to draft amendments to the Cap-and-Trade Regulation that will
extend the program to help the state meet the 2030 emissions reduction target.
To date, CARB has held 14 quarterly cap-and-trade auctions (the last 6 of which were joint auctions with
Québec) where the settlement price has ranged from $10.09 (November 2012) to $12.73 (February 2016).
The highest settlement price was $14.00 observed in May 2013. The most recent carbon prices in the state
observed was $12.44 in 2015 and $12.73 in Q1 2016. The prices have been tracking the minimum
allowance price, as shown in Figure II. The minimum allowance price was set at $10 in 2012 and
increases annually by 5% plus the rate of inflation (calculated by Consumer Price index). ICIS industries
forecasts California CO2 allowance prices to hit $45 per short ton by 2030.13
So far, the CaT auctions have generated about $3.5 billion in proceeds. Clearing prices of the auctions
and the amount of proceeds from each auction (excluding Q1 2016) are shown in Figures I and II.
12
This is a statewide cap, not sector or company-specific. 13
Luckow, P. et al., 2015. 2015 Carbon Dioxide Price Forecast, Synapse.
http://www.synapse-energy.com/sites/default/files/2015%20Carbon%20Dioxide%20Price%20Report.pdf

Page 7
Figure I. Auction Clearing Prices
Data Source: CARB Auction Summary Reports available at -
http://www.arb.ca.gov/cc/capandtrade/auction/auction.htm
$0.00
$2.00
$4.00
$6.00
$8.00
$10.00
$12.00
$14.00
$16.00Current Auction Settlement Price
Advance Auction Settlement Price
Page 8
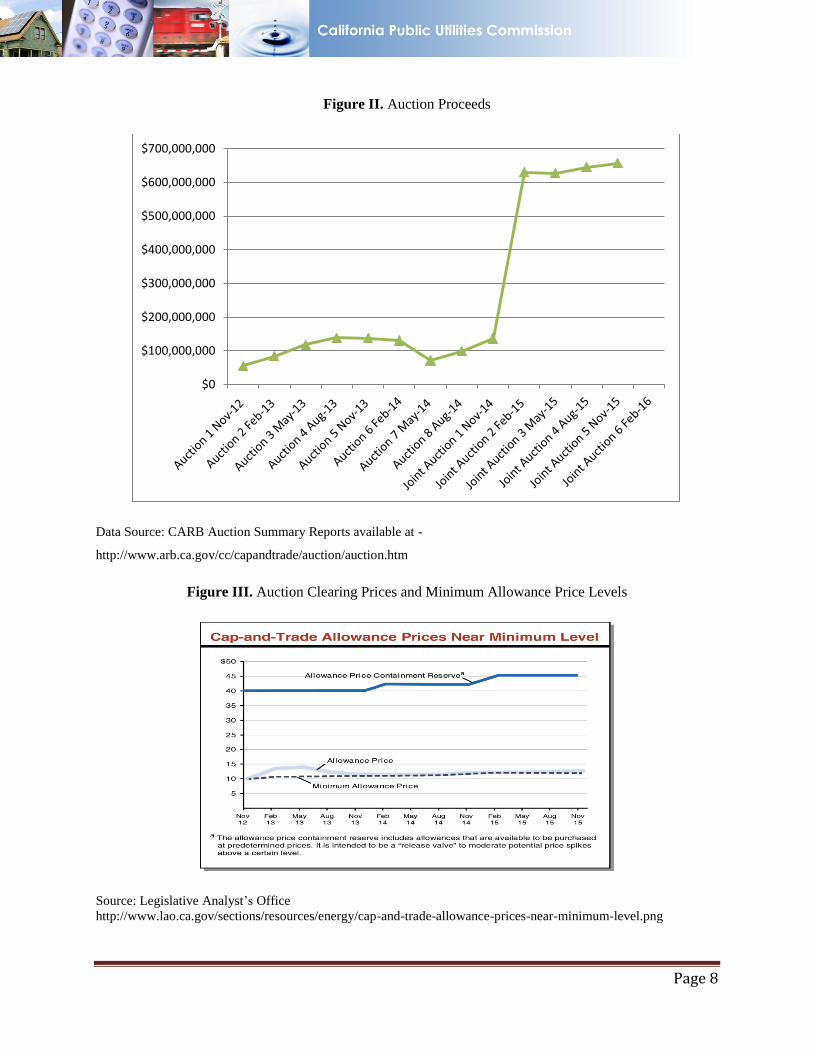
Figure II. Auction Proceeds
Data Source: CARB Auction Summary Reports available at -
http://www.arb.ca.gov/cc/capandtrade/auction/auction.htm
Figure III. Auction Clearing Prices and Minimum Allowance Price Levels
Source: Legislative Analyst’s Office
http://www.lao.ca.gov/sections/resources/energy/cap-and-trade-allowance-prices-near-minimum-level.png
$0
$100,000,000
$200,000,000
$300,000,000
$400,000,000
$500,000,000
$600,000,000
$700,000,000
Page 9
Many experts have positive reviews for the first two years of the program: All allowances have been
sold,14
the secondary market shows signs of stability, and regulated companies are complying.15
Even
though the allowance prices have been close to the floor price as shown in Figure III, that probably has
made the cost of compliance less costly than previously thought. More importantly, California’s economy
is growing strong and emissions are declining. However, emissions have been showing a declining trend
since the 2000s. Over the period of 2000-2012, GHG emissions have decreased by 1.6%.16
Perhaps because the program is only three years old, scholarship has not yet econometrically and
precisely identified the attributing factors of the emission reduction and contribution of the CaT as
opposed to other policy programs such as renewables or energy efficiency mandates, being implemented
in the last three years.
Zuckerman et al. (2014) study the decision-making process in emissions abatement in the cement industry
and how they take into account carbon prices in their investment decisions. Based on the analysis and the
interviews made in the cement sector, the authors conclude that price signals generated by the market are
becoming a factor in the investment decisions. However, in most cases, the authors find that the carbon
price is not the most important factor in making an emissions reduction decision financially attractive. 17
Other experts note that the auction mechanism and the program design have functioned as expected;
however, it is too early to comment on the performance of the cap-and-trade system in California as it
only started in 2013. Schmalensee and Stavins (2015) suggest that some of the lessons learned from the
California experience include the following:18
According to statute, the proceeds from auctions are deposited into the Greenhouse Gas
Reduction Fund. These funds are used to reduce GHG emissions and, to the extent feasible,
14
Q1 2016 auction was the first one at which not all allowances were sold. 15
Please see Environmental Defense Fund’s Reports on the market performance for details and commentary.
Available at https://www.edf.org/media/first-year-report-market-strong-cap-and-trade-california-0 16
California Air Resources Board, California Greenhouse Gas Emissions for 2000 to 2012 – Trends of Emissions
and Other Indicators, 2014 Edition California GHG Emission Inventory.
http://www.arb.ca.gov/cc/inventory/data/misc/ghg_inventory_trends_00-12_2014-05-13.pdf
17 Zuckerman, J, et. al. “Cap-and-Trade in Practice: Barriers and Opportunities for Industrial Emission Reductions in
California” Climate Policy Initiative, June 2014. Available at:
http://climatepolicyinitiative.org/publication/cap-and-trade-in-practice-barriers-and-opportunities-for-industrial-
emissions-reductions-in-california/ 18
Schmalensee, R., R.N. Stavins, “Lessons Learned from Three Decades of Experience with Cap-and-Trade,” The
Harvard Project on Climate Agreements, Discussion Paper 15-80, November 2015.
Page 10
achieve economic, environmental, and public health co-benefits. In 2015-16 and beyond, statute
continuously appropriates 60 percent of cap-and-trade auction proceeds for high-speed rail,
transit, and affordable housing and sustainable community programs. The remaining 40 percent is
available for annual appropriation by the Legislature for programs that reduce GHG emissions
and further the purposes of AB 32.19
It is feasible to set an economy-wide system just like California’s, as opposed to other approaches
that treat different sectors differently.
An effective price collar does reduce the risk of volatility in allowance prices.
California has effectively addressed concerns about emissions leakage in energy-intensive trade-
exposed sectors. Free allowances have been provided to firms in these sectors in proportion to
sector-wide production levels, which in turn, subsidize production and directly prevents
emissions leakage.
Linkage to other systems is important for reducing abatement costs, reducing price volatility, and
controlling market power, as shown in California’s successful linkage with Québec.
Schmalensee and Stavins (2015) argue that complementary emission reduction policies, such as
those pursued under AB 32, may have negative impacts as they tend to increase the abatement
costs, lower the allowance prices, and discourage technological change. Schmalensee and Stavins
(2015) further argue that since refineries and transportation fuels are already covered by CaT, low
carbon fuel standard20
cannot reduce emissions further, unless it is binding. Because the standard
is binding, they contend, further emission reduction is achieved beyond what would be achieved
by CaT alone. This produces, they argue, 100% leakage to other sectors when allowances are
sold, and additional allowances reduce the allowance price, disincentivising the technological
change.
B. RGGI The Regional Greenhouse Gas Initiative (RGGI), established in 2009, is the first cap-and-trade system in
the country aimed at reducing carbon dioxide emissions. Nine northeastern states, Connecticut, Delaware,
19
Legislative Analyst’s Office, Governor’s May Revision: 2015-2016 Cap-and-Trade Expenditure Plan, May 2015.
http://www.lao.ca.gov/handouts/resources/2015/Cap-and-Trade-Expenditure-Plan-051715.pdf 20
The Low Carbon Fuel Standard (LCFS) was established in 2007 (Executive Order S-1-07) and promotes the use
of greenhouse-gas-reducing transportation fuels (such as liquid biofuels, renewable natural gas, electricity, and
hydrogen. The goal is to achieve a reduction of at least 10 percent in the carbon intensity of California's
transportation fuels by 2020. In order to achieve the GHG reductions at the lowest cost and in the most consumer-
responsive manner, the LCFS utilizes a market-based credit trading system to allow providers to choose how they
reduce emissions while responding to consumer demand. CARB is tasked with implementing the LCFS. (Source:
CARB) -- http://www.arb.ca.gov/fuels/lcfs/lcfs-background.htm
Page 11
Maine, Maryland, Massachusetts, New Hampshire, New York, Rhode Island, and Vermont, currently
participate in the program. New Jersey withdrew from the program at the end of 2011.
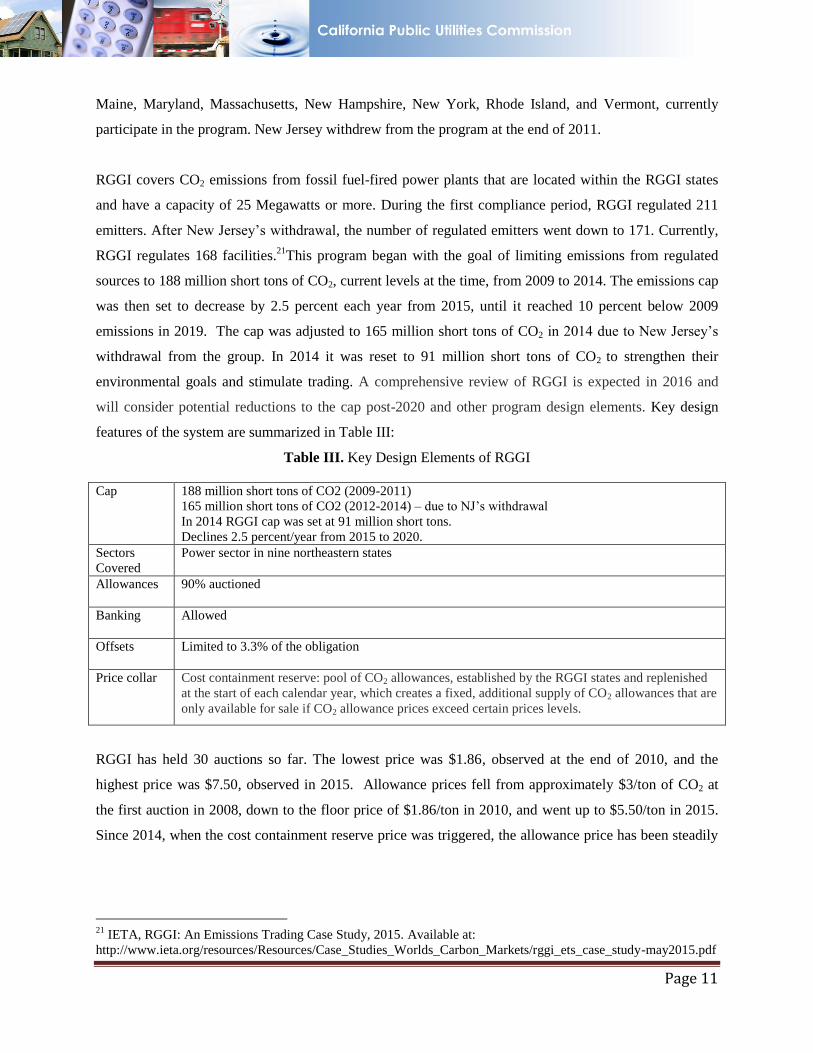
RGGI covers CO2 emissions from fossil fuel-fired power plants that are located within the RGGI states
and have a capacity of 25 Megawatts or more. During the first compliance period, RGGI regulated 211
emitters. After New Jersey’s withdrawal, the number of regulated emitters went down to 171. Currently,
RGGI regulates 168 facilities.21
This program began with the goal of limiting emissions from regulated
sources to 188 million short tons of CO2, current levels at the time, from 2009 to 2014. The emissions cap
was then set to decrease by 2.5 percent each year from 2015, until it reached 10 percent below 2009
emissions in 2019. The cap was adjusted to 165 million short tons of CO2 in 2014 due to New Jersey’s
withdrawal from the group. In 2014 it was reset to 91 million short tons of CO2 to strengthen their
environmental goals and stimulate trading. A comprehensive review of RGGI is expected in 2016 and
will consider potential reductions to the cap post-2020 and other program design elements. Key design
features of the system are summarized in Table III:
Table III. Key Design Elements of RGGI
Cap 188 million short tons of CO2 (2009-2011)
165 million short tons of CO2 (2012-2014) – due to NJ’s withdrawal
In 2014 RGGI cap was set at 91 million short tons.
Declines 2.5 percent/year from 2015 to 2020.
Sectors
Covered
Power sector in nine northeastern states
Allowances 90% auctioned
Banking
Allowed
Offsets Limited to 3.3% of the obligation
Price collar Cost containment reserve: pool of CO2 allowances, established by the RGGI states and replenished
at the start of each calendar year, which creates a fixed, additional supply of CO2 allowances that are
only available for sale if CO2 allowance prices exceed certain prices levels.
RGGI has held 30 auctions so far. The lowest price was $1.86, observed at the end of 2010, and the
highest price was $7.50, observed in 2015. Allowance prices fell from approximately $3/ton of CO2 at
the first auction in 2008, down to the floor price of $1.86/ton in 2010, and went up to $5.50/ton in 2015.
Since 2014, when the cost containment reserve price was triggered, the allowance price has been steadily
21
IETA, RGGI: An Emissions Trading Case Study, 2015. Available at:
http://www.ieta.org/resources/Resources/Case_Studies_Worlds_Carbon_Markets/rggi_ets_case_study-may2015.pdf

Page 12
increasing.22
As seen in Figure IV, even though the RGGI allowance prices have generally remained close
to the statutory minimum price, the RGGI auctions have generated significant revenues for the
participating states.
Figure IV. The RGGI Auction Clearing Prices and Total Proceeds
Source: RGGI
The RGGI auctions have generated over $2 billion in revenues since 2008. Proceeds from the auctions are
returned to the member states and invested in consumer benefit programs such as energy efficiency,
renewable energy production, climate change abatement, and direct energy bill assistance. The RGGI
states are required to invest a minimum of 25 percent of their auction proceeds for a “consumer benefit or
strategic energy purpose.” “RGGI has already invested over $1 billion, or more than 70 percent of its
22
The cost containment reserve price is set at $4 in 2014, $6 in 2015, $8 in 2016, $10 in 2017 and will be adjusted
by 2.5% in each calendar year thereafter.
$3.07
$7.50
$0
$20,000,000
$40,000,000
$60,000,000
$80,000,000
$100,000,000
$120,000,000
$140,000,000
$160,000,000
$180,000,000
$0.00
$1.00
$2.00
$3.00
$4.00
$5.00
$6.00
$7.00
$8.00
Au
ctio
n 1
9/2
5/2
00
8
Au
ctio
n 2
12
/17
/20
08
Au
ctio
n 3
3/1
8/2
00
9
Au
ctio
n 4
6/1
7/2
00
9
Au
ctio
n 5
9/9
/20
09
Au
ctio
n 6
12
/2/2
00
9
Au
ctio
n 7
3/1
0/2
01
0
Au
ctio
n 8
6/9
/20
10
Au
ctio
n 9
9/1
0/2
01
0
Au
ctio
n 1
0 1
2/1
/20
10
Au
ctio
n 1
1 3
/9/2
01
1
Au
ctio
n 1
2 6
/8/2
01
1
Au
ctio
n 1
3 9
/7/2
01
1
Au
ctio
n 1
4 1
2/7
/20
11
Au
ctio
n 1
5 3
/14
/20
12
Au
ctio
n 1
6 6
/6/2
01
2
Au
ctio
n 1
7 9
/5/2
01
2
Au
ctio
n 1
8 1
2/5
/20
12
Au
ctio
n 1
9 3
/13
/20
13
Au
ctio
n 2
0 6
/5/2
01
3
Au
ctio
n 2
1 9
/4/2
01
3
Au
ctio
n 2
2 1
2/4
/20
13
Au
ctio
n 2
3 3
/5/2
01
4
Au
ctio
n 2
4 6
/4/2
01
4
Au
ctio
n 2
5 9
/3/2
01
4
Au
ctio
n 2
6 1
2/3
/20
14
Au
ctio
n 2
7 3
/11
/20
15
Au
ctio
n 2
8 6
/3/2
01
5
Au
ctio
n 2
9 9
/9/2
01
5
Au
ctio
n 3
0 1
2/2
/20
15
Clearing Price (current offering)Clearing Price (future offering)Total Proceeds

Page 13
2008–13 ETS revenue, in projects on energy efficiency, renewable energy and GHG abatement, and
support for household energy bills. Almost all remaining revenue has been reserved for future projects in
those same areas. “23
Beyond the funding provided by the auction, there are no other regional
complementary policies to the cap-and-trade program, but individual states do have policy programs such
as renewable resource standards.24
Due to the low allowance prices, the effectiveness of the RGGI program has been a big question. From
the RGGI’s perspective, the program continues to cut emissions and provide benefits to consumers. In
particular, according to RGGI,
• The RGGI states have cut emissions by 40 percent since 2005, while their economies
grew by 8 percent during the same period.
• The $1.4 billion in auction proceeds invested to date will return more than $2.9
billion in lifetime energy bill savings to more than 3.7 million participating
households and 17,800 businesses.
• Much of the bill savings are driven by investments in energy efficiency, which were
also the largest share of the investments.25
Other reports also testify to the success of RGGI, arguing that emissions have declined throughout the life
of the program and the economic impacts have been substantial. The report "The Economic Impacts of
the Regional Greenhouse Gas Initiative on Nine Northeast and Mid-Atlantic States" states that
implementing RGGI from 2012-2014 added $1.3 billion in economic value to the nine-state RGGI region,
led to the creation of more than 14,000 new jobs, and cut electricity and heating bills, saving consumers
$460 million. Each individual state has seen economic benefits as the region cut annual carbon emissions
by more than a third from 2008 (133 million tons) to 2014 (86 million tons).26
Other reports attribute the
success of the program to factors other than the price signal generated by the cap-and-trade system. One
report argues that “external influences, including changes to fuel prices, caused a shift from coal and oil
to lower‐carbon natural gas generation. Compared to those external factors, the effect of the original
RGGI cap requirements was relatively minor in meeting the goals of reducing CO2 emissions in the
power sector.”27
23
RGGI, Investment of RGGI Proceeds through 2013, April 2015. 24
IETA, RGGI: An Emissions Trading Case Study, 2015. Available at:
http://www.ieta.org/resources/Resources/Case_Studies_Worlds_Carbon_Markets/rggi_ets_case_study-may2015.pdf 25
http://www.rggi.org/docs/ProceedsReport/2013Proceeds%20Report_PR_Final.pdf 26
The Analysis Group, “The Economic Impacts of the RGGI on Nine Northeast and Atlantic States,” 2015.
http://www.analysisgroup.com/uploadedfiles/content/insights/publishing/analysis_group_rggi_report_july_2015.pdf 27
Luckow, P. et al., 2015. 2015 Carbon Dioxide Price Forecast, Synapse.

Page 14
Figure V. Emissions in the RGGI States
Source: EIA available at: https://www.eia.gov/todayinenergy/detail.cfm?id=14851
As shown in Figure V, emissions in the RGGI states have been dropping since 2005. There are several
explanations offered for the emission reduction: The allowance price signal benefits low emitting sources
and makes them more competitive; the economic recession reduced economic activities as well as
emissions; natural gas became more abundant due to new exploration technologies such as fracking; and
the complementary environmental policies such as renewable portfolio standards are keeping the
emissions down.28
Murray and Maniloff (2016) show that even after controlling for the changes in fuel
prices, economic activity, and other policies, RGGI has had a strong effect on emissions: Emissions
would have been 24% higher in the region if the program were not in effect, controlling for all other
http://www.synapse-energy.com/sites/default/files/2015%20Carbon%20Dioxide%20Price%20Report.pdf 28
Murray, B.C., P.T. Maniloff, 2015. “Why have greenhouse emissions in RGGI states declined? An econometric
attribution to economic, energy market, and policy factors,” Energy Economics 51, 581-589.
Page 15
factors. That is, about half of the region’s reductions are attributed directly to RGGI, with the caveat that
it is difficult to isolate the effects of the RGGI carbon prices from the use of auction proceeds for low-
carbon technology.29
On the contrary, Schmalensee and Stavins (2015) conclude that the direct impacts of
the program have been small on the power sector emissions due to the low prices and non-binding cap
level. Emissions leakage is potentially found to be problematic as well, due to the geographically limited
scope of RGGI as well as interconnected electricity markets.
Some of the lessons learned, as argued by Schmalensee and Stavins (2015), include:
A cap-and-trade system that auctions its allowances can generate substantial revenue for
government, regardless of the impact of the system on the emissions.
The leakage problem is potentially severe for any state or regional program due to the
interconnected nature of electricity markets.
Price collars are important to reduce volatility. The RGGI’s reservation price is found to be an
effective floor on the price of allowances as it was able to keep the prices positive. However, the
effectiveness of price ceiling is still questioned. Schmalensee and Stavins (2015) argue that it
may be less effective because of the size of the cost containment reserve.
IV. Foreign and International Markets
A. EU ETS EU ETS is the largest cap-and-trade program in terms of the countries trading, emissions covered, and
sources under obligation. It covers about 13,500 stationary installations in the electric and major industrial
sectors as well as all domestic airline emissions (as of 2014).30
It was established in 2005 by the European
Commission with the goal of promoting “reductions of greenhouse gas emissions in a cost effective and
economically efficient manner.” The program has four phases, Phase 1 (2005-7), Phase 2 (2008-12),
Phase 3 (2013-20), and Phase 4 (2021 and forward), and its main design elements have changed over the
years. For example, significant revisions adopted in 2008 became effective in 2013 and onward,
including: adoption of a single EU-wide cap declining at 1.74% per year; adoption of auctioning as the
main allocation method, to be applicable in the electric utility sector in 2013 and phased in by 2027 for
29
Ibid. 30
Ellerman A.D., C. Marcantonini, A. Zaklan, “The European Union Emissions Trading System: Ten Years and
Counting,” Review of Environmental Economics and Policy, Volume 10, Issue 1, Winter 2016, p.89-107.
Page 16
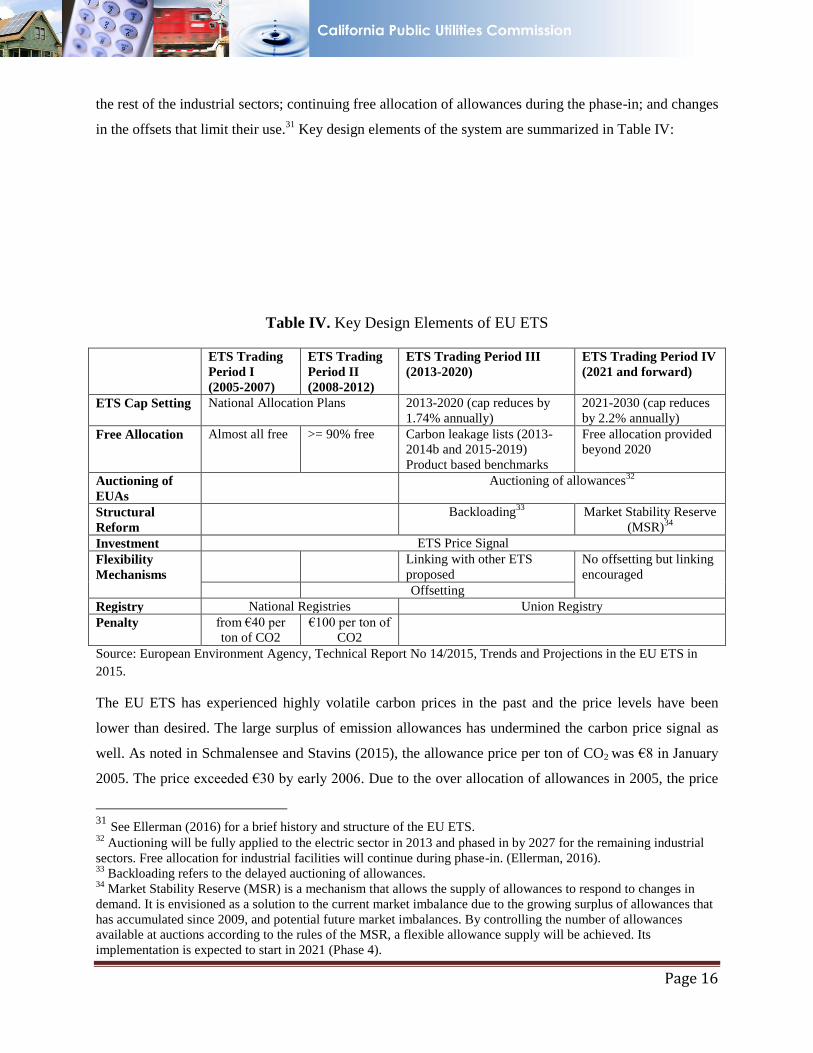
the rest of the industrial sectors; continuing free allocation of allowances during the phase-in; and changes
in the offsets that limit their use.31
Key design elements of the system are summarized in Table IV:
Table IV. Key Design Elements of EU ETS
ETS Trading
Period I
(2005-2007)
ETS Trading
Period II
(2008-2012)
ETS Trading Period III
(2013-2020)
ETS Trading Period IV
(2021 and forward)
ETS Cap Setting National Allocation Plans 2013-2020 (cap reduces by
1.74% annually)
2021-2030 (cap reduces
by 2.2% annually)
Free Allocation Almost all free >= 90% free Carbon leakage lists (2013-
2014b and 2015-2019)
Product based benchmarks
Free allocation provided
beyond 2020
Auctioning of
EUAs
Auctioning of allowances32
Structural
Reform
Backloading33
Market Stability Reserve
(MSR)34
Investment ETS Price Signal
Flexibility
Mechanisms
Linking with other ETS
proposed
No offsetting but linking
encouraged
Offsetting
Registry National Registries Union Registry
Penalty from €40 per
ton of CO2
€100 per ton of
CO2
Source: European Environment Agency, Technical Report No 14/2015, Trends and Projections in the EU ETS in
2015.
The EU ETS has experienced highly volatile carbon prices in the past and the price levels have been
lower than desired. The large surplus of emission allowances has undermined the carbon price signal as
well. As noted in Schmalensee and Stavins (2015), the allowance price per ton of CO2 was €8 in January
2005. The price exceeded €30 by early 2006. Due to the over allocation of allowances in 2005, the price
31
See Ellerman (2016) for a brief history and structure of the EU ETS. 32
Auctioning will be fully applied to the electric sector in 2013 and phased in by 2027 for the remaining industrial
sectors. Free allocation for industrial facilities will continue during phase-in. (Ellerman, 2016). 33
Backloading refers to the delayed auctioning of allowances. 34
Market Stability Reserve (MSR) is a mechanism that allows the supply of allowances to respond to changes in
demand. It is envisioned as a solution to the current market imbalance due to the growing surplus of allowances that
has accumulated since 2009, and potential future market imbalances. By controlling the number of allowances
available at auctions according to the rules of the MSR, a flexible allowance supply will be achieved. Its
implementation is expected to start in 2021 (Phase 4).

Page 17
fell by about half in one week of April 2006, before fluctuating and returning to about €8, and almost
collapsed to zero in 2007. This volatility was attributed to the absence of good emissions data at the
beginning of the program, a surplus of allowances, energy price volatility, and the inability to bank
allowances from Phase I to Phase II (Market Advisory Committee 2007).
In 2014, the price of allowances in the EU ETS has increased from less than €5/tCO2 (US$5/tCO2) to just
below €7/tCO2 (US$8/tCO2). The average price in 2014 was €6/tCO2 (US$7/tCO2).
The EU attempted to address the low price signal problem by the implementing backloading in 2014: The
EU decided to temporarily postpone the auctioning of 900 million EU allowances from the period 2014–
16 to the period 2019–20. Furthermore, another tool, market stability reserve (MSR) is introduced and
will be operational in 2019. Accordingly, allowances will be removed from the market if supply exceeds
demand significantly, and allowances will be introduced when demand exceeds supply, with the overall
goal to ensure market stability.
Figure VI. Allowance Prices
Source: Trends and projections in the EU ETS (EUA and CER),35
EEA Technical Report No 14/2015
35
EUAs represent allowances distributed to industry by European governments. Each represents the right to release
one tonne of carbon dioxide into the atmosphere. CERs are awarded by the United Nations to projects in the
developing world that reduce emissions. Companies in the EU Emission Trading Scheme are allowed to offset a
small proportion of their emissions using CERs.
Page 18
The EU ETS has been extended through its Phase III, 2013-2020, with a more stringent, centrally
determined cap (20% below 1990 emissions), a larger share of allowances to be auctioned, tighter limits
on the use of offsets, and unlimited banking of allowances between Phases II and III. However, concern
over low allowance prices continues: “These prices reflect the slow pace of European economic recovery
and the lack of a price floor, as well as the fact that other binding EU policies, particularly renewable
generation and energy efficiency standards, reduce emissions under the cap. In the absence of a binding
price floor, these other policies raise costs and reduce allowance prices without affecting total
emissions.”36
In 2016, the prices continue to be vulnerable to fluctuations. In fact, Point Carbon revised its outlook and
dropped its target prices. 37
The UK Minister of Environment reported that price has to go up to 30 euros
again in order to be effective. 38
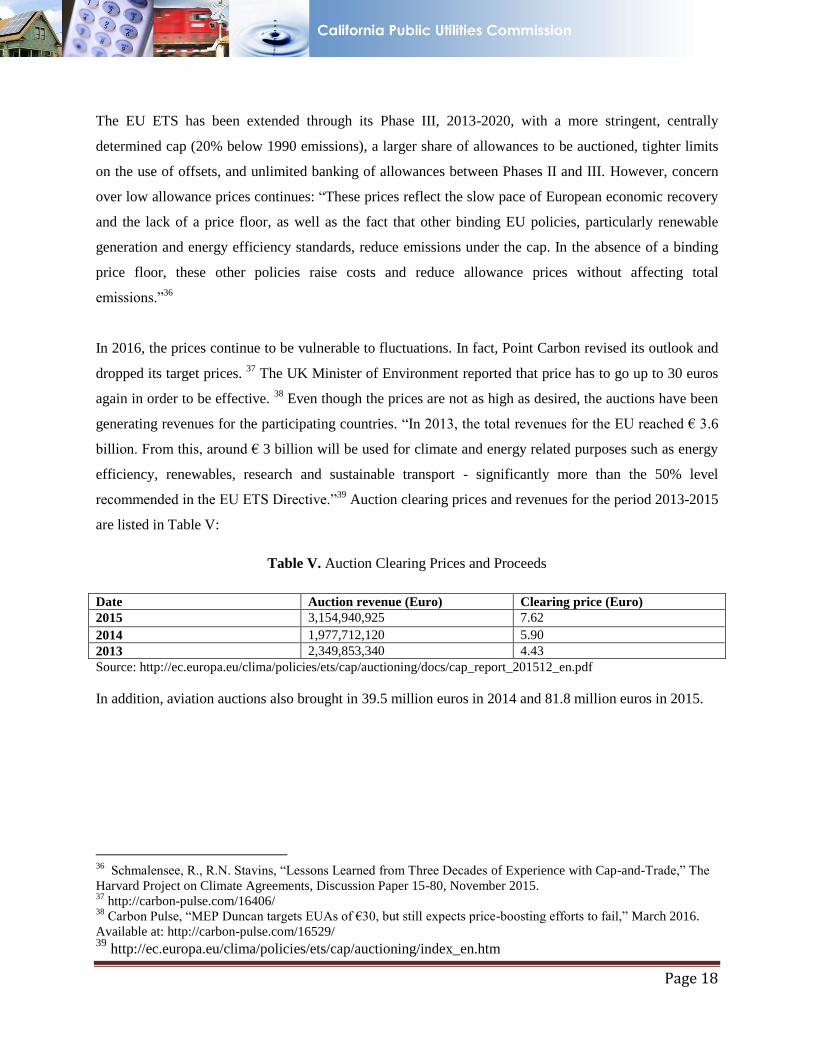
Even though the prices are not as high as desired, the auctions have been
generating revenues for the participating countries. “In 2013, the total revenues for the EU reached € 3.6
billion. From this, around € 3 billion will be used for climate and energy related purposes such as energy
efficiency, renewables, research and sustainable transport - significantly more than the 50% level
recommended in the EU ETS Directive.”39
Auction clearing prices and revenues for the period 2013-2015
are listed in Table V:
Table V. Auction Clearing Prices and Proceeds
Date Auction revenue (Euro) Clearing price (Euro)
2015 3,154,940,925 7.62
2014 1,977,712,120 5.90
2013 2,349,853,340 4.43
Source: http://ec.europa.eu/clima/policies/ets/cap/auctioning/docs/cap_report_201512_en.pdf
In addition, aviation auctions also brought in 39.5 million euros in 2014 and 81.8 million euros in 2015.
36
Schmalensee, R., R.N. Stavins, “Lessons Learned from Three Decades of Experience with Cap-and-Trade,” The
Harvard Project on Climate Agreements, Discussion Paper 15-80, November 2015. 37
http://carbon-pulse.com/16406/ 38
Carbon Pulse, “MEP Duncan targets EUAs of €30, but still expects price-boosting efforts to fail,” March 2016.
Available at: http://carbon-pulse.com/16529/ 39
http://ec.europa.eu/clima/policies/ets/cap/auctioning/index_en.htm
Page 19
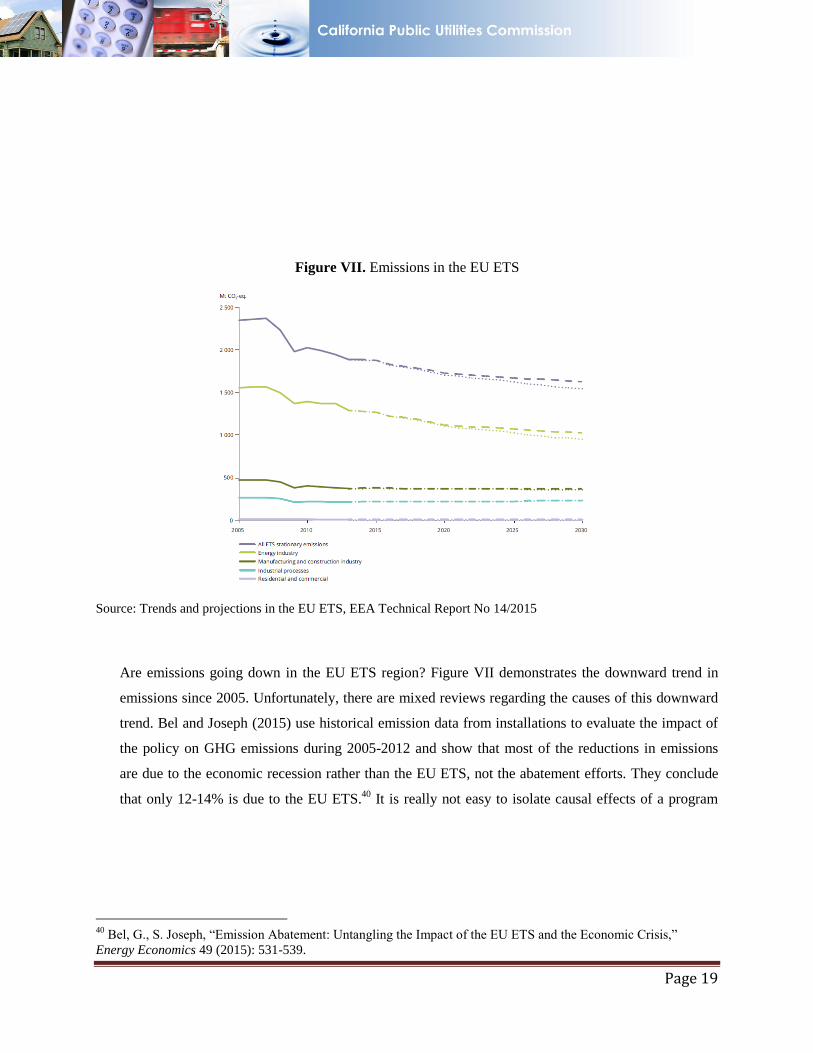
Figure VII. Emissions in the EU ETS
Source: Trends and projections in the EU ETS, EEA Technical Report No 14/2015
Are emissions going down in the EU ETS region? Figure VII demonstrates the downward trend in
emissions since 2005. Unfortunately, there are mixed reviews regarding the causes of this downward
trend. Bel and Joseph (2015) use historical emission data from installations to evaluate the impact of
the policy on GHG emissions during 2005-2012 and show that most of the reductions in emissions
are due to the economic recession rather than the EU ETS, not the abatement efforts. They conclude
that only 12-14% is due to the EU ETS.40
It is really not easy to isolate causal effects of a program
40
Bel, G., S. Joseph, “Emission Abatement: Untangling the Impact of the EU ETS and the Economic Crisis,”
Energy Economics 49 (2015): 531-539.

Page 20
from the rest of the competing factors such as the state of the economy, and complementary policies.
Martin et al (2016) find the following:41
The EU ETS has had a robust negative impact on carbon emissions. Sector level studies indicate
that emissions across all regulated sectors declined by 3% in Phase I and during the first two
years of Phase II, relative to estimated business-as-usual emissions. Firm level data shows that in
France and Germany, industrial firms reduced emission in the range of 10-26% during Phase II,
but not in Phase I.
There is no evidence that the EU ETS has had a strong negative effect on economic performance.
There is robust evidence that the EU ETS has a small impact on clean innovation. That is, other
factors such as renewable energy obligations are the drivers in innovation, not carbon trading.
Other scholars disagree on the effectiveness of the system. For example, Yam (2015) evaluates the EU
ETS from the perspective of political feasibility, environmental integrity, and cost-effectiveness. Her
conclusions follow:42
The system has not been successful in terms of environmental integrity. The use of questionable
offsets during Phase I and tax fraud events that had occurred during Phase II violated the integrity
of the system.
The system has not been successful in terms of cost-effectiveness. Volatility of the prices
discouraged the firms investing in emission abatement technologies.
The system was successful in terms of political feasibility as it still exists and is the biggest
trading system.
Whether it is effective or not, the EU ETS has provided valuable lessons for the whole world. As pointed
out by Schmalensee and Stavins (2015):
Good data are essential for effective allowance allocation and cap-setting decisions to avoid over-
allocation as occurred in Phase I of the EU ETS.
Banking is essential in order to avoid price collapse at the end of a compliance period. This is
observed at the end of Phase I in EU.
41
Martin, R., M. Muuls, U. J. Wagner,” The Impact of the European Union Emissions Trading Scheme on
Regulated Firms: What is Evidence after Ten Years,” Review of Environmental Economics and Policy, Volume 10,
Issue 1, Winter 2016, pp.129-148. 42
Yam, J.V., “The European Union Emissions Trading Scheme: Criteria Evaluations and Lessons Learned,”
Resources, Number 117, Canadian Institute of Resources Law.
Page 21
Just like CaT, the EU ETS suffers from the negative impact of complementary policies that are in
place in addition to the cap and trade system. As these policies address the same sources, they
increase abatement costs, and lower allowance prices.
Granting free allowances to selected sectors may serve political interests, but does not alleviate
competitiveness concerns. When the allocations are not linked to production, they do not affect
marginal costs. Thus, incentives to increase output or to relocate production or investment in
other jurisdictions remain unchanged.
The EU ETS presents a successful example that it is possible to move over time from a regime of
generally free allowances to one in which most are auctioned.
Despite the reforms made, the discontent with the system continues during Phase III of the EU ETS. A
recent report by the Center for European Policy Studies (CEPS) concluded that “The EU ETS is making a
difference in establishing a price for carbon and incentivizing, through its resilience, and direction
towards increased scarcity, significant corporate shadow prices. However, EUA prices at current levels
cannot trigger operational or medium-to-long term change, which is triggered by other, more costly
measures, which have other additional objectives, such as renewable energy policies. The need to find
mechanisms to incentivize innovation must be a significant concern.”43
That is, the low prices will not
induce the necessary technological change needed. May be, as Hintermann states: “The EU ETS will
likely never become a fully efficient – and therefore idealized – market but rather a compromise between
economic theory and political reality.”44
B. Canada On January 1, 2014, Québec successfully linked with the California cap-and-trade system. Success of the
linkage was attributed to the similarities between the two systems, as listed below:
Table VI. Similarities between California and Québec
California Québec
Population 38.8 million 8 million
Gross Regional product $1.9 trillion $304 billion
GHG covered Same Same
Sectors covered Same Same
Emission threshold Same Same
2013 Allowance budget 162.8 23.7
Max. Emissions Covered in 394.5 (2015) 63.3 (2015)
43
http://carbon-pulse.com/15995/ 44
Hintermann, B., S. Peterson, W. Rickels,”Price and Market Behavior in Phase II of the EU ETS: A Review of the
Literature,” Review of Environmental Economics and Policy, Volume 10, Issue 1, Winter 2016, p.1-21.
Page 22
million metric tons of CO2e
(Year of max allowance
availability)
Emission target 334.2 (2020) 51 (2020)
Offset Up to 8% of compliance
obligation
Up to 8% of compliance
obligation Source: Kroft, P.J., J. Drance, Examining California and Quebec’s cap-and-trade systems, California Energy Law.
In Québec, all revenue generated by the carbon market is allocated to the province’s Green Fund and re-
invested for full implementation of Québec’s Climate Change Action Plan that runs from 2013 to 2020.
As the program is relatively new, scholarship has not determined whether it has been effective.
Another Canadian province, Ontario, has also proposed legislation that would introduce a cap-and-trade
program in 2017. Ontario expects to raise C$1.9 billion per year starting in 2017 by auctioning off
emissions allowances with California and Québec. The province said it plans to reduce greenhouse gas
pollution to 37% below 1990 levels by 2030.45
Canada is also working on an economy-wide carbon tax.
C. Emerging Markets Every year new countries are joining the group of countries implementing some form of carbon pricing.
ETSs in Hubei and Chongqing of China and ETS in the Republic of Korea are the latest additions to the
ETS world in 2014, and 2015, respectively. Taiwan and Ontario have plans to implement ETSs as well.
World Bank provides annual updates on the most recent developments in the area of carbon pricing as
summarized below:46
China has 7 pilot ETSs. They form the largest national carbon pricing initiative in the world in terms of
volume, putting a cap on 1.3 GtCO2e. Since the start of the pilot ETSs in Beijing, Guangdong, Shanghai,
Shenzhen, and Tianjin in 2013 and in Chongqing and Hubei in 2014, the designs of some of these
systems have been evolving. Their scope has been expanding and their stringency has been increasing. A
nationwide ETS may be launched by the end of 2016 and get fully implemented in 2019.47
Korea established its ETS in 2015. It covers 23 subsectors, including steel, cement, petro-chemicals,
refinery, power, buildings, waste, and aviation. In the first phase (2015–17), allowances are allocated free
based on the average 2011-13 emissions and auctioning is not expected in the first phase. Offsets can be
used for up to 10% of their compliance obligation.
45
https://www.snl.com/InteractiveX/article.aspx?ID=35583493&KPLT=4 46
Kossoy, Alexandre; Peszko, Grzegorz; Oppermann, Klaus; Prytz, Nicolai; Gilbert, Alyssa; Klein, Noemie; Lam,
Long; Wong, Lindee. 2015. Carbon Pricing Watch 2015. Washington, DC. World Bank. 47
Ibid.
Page 23
Switzerland: The system was established in 2008 and covers 55 companies. The first auction of
allowances under its ETS was held in May 2014. As of August 1, 2015, four auctions have taken place,
showing a wide price range for emission allowances—ranging from CHF40/tCO2e (US$42/tCO2e) at the
first auction of May 2014 to CHF12/tCO2e (US$12/tCO2e) at the auction held in February 2015.48
Switzerland has also plans to link with the EU ETS; however the linkage date is uncertain. Political issues
such as immigration are reported to be affecting further negotiations, which demonstrate the difficulty of
establishing international systems.
V. Carbon Taxes Cap-and-trade systems are not the only policy instrument aimed to reduce GHG emissions in a cost-
effective manner. Due to the structural complexities of cap-and-trade systems, such as setting up a
successful auction mechanism design, many countries are also implementing carbon taxes in lieu or in
conjunction with ETSs. There are still competing views about the effectiveness of carbon tax versus other
market-based instruments. Some favor carbon tax while others favor cap-and-trade systems. For instance,
Stavins (2007) evaluates different carbon emission reduction instruments and concludes that a cap-and-
trade system can decrease carbon emissions more effectively and at a lower cost than a carbon tax or
industrial standards. Goulder and Schlein (2013) argue that if properly designed the two approaches are
equivalent and their performance depends on the specifics of their design.49
As more countries implement
carbon taxes, empirical studies are coming out to assess their impact. Murray and Rivers (2015) review
the British Columbia’s carbon tax and conclude that the carbon tax reduced emissions by five to 15 per
cent while having a “negligible impact” on economic activity.50
48
Ibid. 49
Goulder, L.H., A.R. Schein, 2013. “Carbon Taxes versus Cap and Trade: A Critical Review,” Climate Change
Economics, Vol 4 No 3. 50
B. Murray and N. Rivers. 2015. “British Columbia’s Revenue-Neutral Carbon Tax: A Review of the Latest
‘Grand Experiment’ in Environmental Policy.” NI WP 15-04. Durham, NC: Duke University.
http://nicholasinstitute.duke.edu/publication

Page 24
Figure VIII. Carbon tax vs. Cap-and-Trade (Nominal prices (US$/tCO2e) observed as carbon taxes and
on cap-and-trade markets)
Data Source: Kossoy, A. et al. 2015. Carbon Pricing Watch 2015. Washington, DC. World Bank.
More and more countries appear to be embracing a carbon tax and some are using it as a complementary
way to reduce emissions in sectors that are not targeted by the cap-and-trade system, as is the case in
France and Portugal. According to the World Bank, the choice depends on the circumstances, context of
the country, broader national economic priorities, and politics.
As shown in Figure VIII, the carbon tax range varies from $130 to less than one dollar. Most recently:
$130
$64 $62 $52 $48
$36 $28 $25 $23 $22 $19 $16 $13 $12 $9 $8 $7 $6 $5 $4 $3 $2 2 <1
$0
$20
$40
$60
$80
$100
$120
$140
Carbon Tax Cap-and-Trade

Page 25
France’s carbon tax became effective in April 2014, putting a carbon tax of €7/tCO2e
(US$8/tCO2e) on the use of fossil fuels not covered by the EU ETS. The carbon tax rate increased
to €14.5/tCO2e (US$16/tCO2e) in 2015 and will rise to €22/tCO2e (US$24/tCO2e) in 2016. This
augmentation in the carbon tax rate will be revenue-neutral, as other taxes will be lowered.
Portugal imposed a carbon tax of €5/tCO2e (US$5/tCO2e) in January 2015, as part of a green tax
reform package.
Alberta will implement an economy-wide carbon tax starting in 2017.
VI. Conclusion
So far, there appears to be mixed experiences, findings, and opinions regarding the success and
effectiveness of cap-and-trade systems. In California’s case, the cap-and-trade program is not old enough
to provide sufficient data for detailed analyses, but experts have been content with the design of the
system. The EU ETS has provided many lessons to be learned for other systems and experts are still
concerned as they think the revisions implemented are not sufficient to promote a healthy carbon market.
Despite some setbacks, RGGI is learning from mistakes and continuing on its path, while generating
significant revenues for its member states. In the meantime, many other countries are following the lead
of the US and EU and setting up their own cap-and-trade systems. The effectiveness of their economic
and environmental performance is yet to be seen.
As we finish the first quarter of 2016, carbon markets are active and keep sending mixed signals.
Domestic regional carbon markets are expected to grow as states contemplate how to comply with the
Clean Power Plan. It is reported that nearly half of the states are considering emission trading to meet
their obligation to curb emissions under the Clean Power Plan.51
Carbon market value, that is the value of
emission allowances and credits traded in the world’s carbon markets is expected to rise by 25% in 2016,
predicts Reuters. On the other hand, the EU ETS allowance prices lost all the increase it had gained in
2016, as allowances distributed in 2016 were being sold at great quantities by installations in smaller
countries. It appears the EU will have to keep on fine-tuning the EU ETS.
Nevertheless, nations continue to support policies that aim to mitigate climate change. Two-thirds (66%)
of Canadians support the idea of implementing cap-and-trade to combat climate change, according to
51
Harball, E et al. 2016. Carbon trading finds a foothold in at least 20 states. ClimateWire. Accessed on 2/12/2016.
http://www.eenews.net/stories/1060030764?utm_source=Sailthru&utm_medium=email&utm_campaign=Issue:%20
2016-01-19%20Utility%20Dive%20Newsletter&utm_term=Utility%20Dive
Page 26
research conducted by five universities -- the University of Montreal, University of California Santa
Barbara, Utah State University, Yale University, and University of Essex. It was found that a majority of
residents in every province supported carbon trading, with only 27% opposing it. The remainder of the
population was undecided.52
As the number of countries sharing the same concerns and supporting
policies that can make a change in efforts to combat climate change increases, the globe will embrace “the
year of the carbon.”53
-- assuming that the policies selected deliver what they promise.
52
Carbon Pulse, “Two-thirds of Canadians back cap-and-trade, study finds,” February 23, 2016.
http://carbon-pulse.com/16048/ 53
Grant, A.'Year of the Carbon': Power industry prepares to roll up sleeves for 2016, January 11, 2016, SNL News.