cell frogs - pnas.org · small cells exhibit the most complex tectal morphologies. increases in...
TRANSCRIPT
Proc. Nati. Acad. Sci. USAVol. 91, pp. 4796-4800, May 1994Neurobiology
Cell size predicts morphological complexity in the brains of frogsand salamandersGERHARD ROTH*t, JENS BLANKE*, AND DAVID B. WAKEO*Brain Research Institute, University of Bremen, D-28334 Bremen, Federal Republic of Germany; and tMuseum of Vertebrate Zoology and Department ofIntegrative Biology, University of California, Berkeley, CA 94720
Communicated by Stephen Jay Gould, February 14, 1994
ABSTRACT The morphological organization of the brainof frogs and salamanders varies greatly in the degree to whichit is subdivided and differentiated. Members of these taxa arevisually oriented predators, but the morphological complexityof the visual centers in the brain varies interspecifically. Wegive evidence that the morphological complexity of the am-phibian tectum mesencephali, the main visual center, can bepredicted from knowledge of cell size, which varies greatlyamong these taxa. Further, cell size is highiy correlated withgenome size. Frogs with small cells have more complex mor-phologies of the tectum than do those with large cells indepen-dent of body and brain size. In contrast, in salamandersbrain-body size relationships also are correlated with morpho-logical complexity of the brain. Small salamanders with largecells have the simplest tecta, whereas large salamanders withsmall cells exhibit the most complex tectal morphologies.Increases in genome, and consequently cell size, are associatedwith a decrease in the differentiation rate of nervous tissue,which leads to the observed differences in brain morphology.On the basis of these findings we hypothesize that importantfeatures of the structure of the brain can arise independently offunctional demands, from changes at a lower level of organ-ismal organization this case increase in genome size, whichinduces simpllifcation of brain morphology.
The morphological organization of the brain varies amongvertebrates in the degree to which it is subdivided anddifferentiated. Parts of brains exhibit, among other features,differences in lamination, presence of distinct nuclei, num-bers of different cell types, and degree of complexity ofneuronal connectivity. There is little understanding of theprocesses that lead to the observed differences, although themost prevalent explanations are forms of functionalism (i.e.,the observed differences are the result of environmentalselection regarding the specific function of brain parts) andphylogenetic history (older lineages generally have less com-plex brains). We have examined an alternative view: that thesimple brain morphology of salamanders is secondary, de-rived in large part by pedomorphic evolution associated withincreases in genome and cell size (1). We here argue thatvariation in morphological complexity in the brains of frogsand salamanders is based predominantly on such intrinsicfactors and is likely to be independent of direct selection.The brains of frogs (Order Anura) and salamanders (Order
Caudata) differ considerably within and among these ordersin the degree of morphological complexity. In general, frogshave more complex brain morphology than do salamanders,having morphologically distinct nuclei that often lie in mi-grated positions in the diencephalon, the pretectum, and themesencephalic tegmentum (2). In addition, multiple lamina-tion (an alternation of cellular and fibrous layers) is found in
the tectum opticum (3, 4), the torus semicircularis (5), and anumber of diencephalic nuclei (2).The brain of salamanders long has been known to be
morphologically much simpler than that of frogs and othervertebrates (6, 7). It has a compact periventricular cellularlayer (gray matter) and a superficial fiber layer (white mat-ter). Very few migrated nuclei can be recognized on mor-phological grounds. Few to very few migrated cells are foundin the superficial fiber layers ofthe mesencephalic tectum (8).The tegmentum mesencephali, including the torus semicir-cularis, resembles the tectum in that it has a relativelycompact periventricular layer (9).
Here, we report the results of a comparative study of braincomplexity in salamanders and frogs. We concentrate on thetectum mesencephali (optic tectum). Both frogs and sala-manders are predators that depend on vision, and the tectumis the most important visual center for localization andidentification ofprey objects. In addition, the tectum exhibitsthe most distinctive morphology and cytoarchitecture of anypart of the amphibian brain. A priori, one expects the tectumto present the most clear-cut influence of function on form,if such an influence exists. We demonstrate that cell size isthe most likely determinant of tectal morphology in frogs. Insalamanders, brain size is an additional important factor.These findings show that alternatives to strict functionalismmust be considered in explaining differences in brain mor-phology among taxa.
MATERIALS AND METHODSBrains of22 species of salamanders (3 families) and 17 speciesof frogs (11 families) were used in the present study (Tables1 and 2). Heads fixed in formalin were cut in 10-,um serialsections and silver-impregnated by using the Kluever-Barrera method (10). In addition, two specimens of thesalamander genus Parvimolge stained with the Giemsamethod (11) were used. To determine brain volume, we drewequidistant cross sections of the brain (30-50 sections) witha Zeiss camera lucida. Cell-size measurements were taken for50 neurons from three different tectal areas and from as manyspecimens per species as were available. Information ongenome size was obtained from the literature, and all valueswere converted to pg of DNA per haploid genome.For correlational analysis regarding cell size, brain size,
and morphological complexity, we established five classes infrogs and six classes of morphological complexity of thetectum in salamanders (including an undifferentiated state).The classes of morphological complexity for the frog
tectum are as follows (descriptions of layers are from refs. 3and 5).
Class 1. Separation of layers was indistinct and not con-tinuous in mediolateral extent. Layers 7-9 were diffuselyarranged; there was no distinct formation of a layer 8.
tTo whom reprint requests should be addressed.
4796
The publication costs of this article were defrayed in part by page chargepayment. This article must therefore be hereby marked "advertisement"in accordance with 18 U.S.C. §1734 solely to indicate this fact.
Dow
nloa
ded
by g
uest
on
Dec
embe
r 29
, 201
9
Proc. Natl. Acad. Sci. USA 91 (1994) 4797
Table 1. SalamandersClassification n GS* CSt BS* MC
Family PlethodontidaeSubfamily DesmognathinaeDesmognathus wrighti 4 14.1 7.7 1.2 1Desmognathus aeneus 2 7.5 1.8 1.5Desmognathus ochrophaeus 2 14.0 7.2 2.2 2.3Desmognathus monticola 1 15.0 9.2 10.1 4Desmognathus quadramaculatus 1 15.0 9.5 12.9 5
Subfamily PlethodontinaeTribe HemidactyliiniEurycea bislineata 1 20.8 8.8 3.0 1.5
Tribe PlethodontiniPlethodon cinereus 3 22.3 8.9 3.2 3Plethodon jordani 1 29.0 11.8 6.5 4
Tribe BolitoglossiniHydromantes italicus 2 76.2 15.1 12.5 0Hydromantes genei 2 15.1 16.3 0.5Batrachoseps attenuatus 2 37.0 11.3 2.3 0Parvimolge townsendi 3 20.3 8.1 1.4 1Thorius narisovalis 2 25.2 10.5 1.3 0.5Thorius pennatulus 2 9.0 0.5 0.5Bolitoglossa subpalmata 2 68.9 13.4 7.8 0Bolitoglossa dofleini 1 59.4 13.2 17.2 1
Family AmbystomatidaeAmbystoma opacum 2 20.5 12.2 8.1 3Ambystoma mexicanum 2 21.9 11.0 28.1 4.3
Family SalamandridaeSalamandrina terdigitata 1 20.5 11.0 1.8 3Salamandra salamandra 2 33.0 10.1 19.3 3Pleurodeles waltl 1 19.7 9.7 10.9 3Triturus alpestris 1 23.7 11.0
GS, genome size; CS, cell size; BS, brain size; MC, morphologicalcomplexity.*Data are reported as pg of DNA haploid genome.tData are reported as ,m3.tData are reported as mm3.
Class 2. Layer 6 was well separated, but layers 1-5 werediffusely arranged, particularly in the lateral portion; layers7-9 were arranged as in class 1.
Class 3. Layers 1-6 were well separated from each other;layer 8 was separated from layers 7 and 9 and contained60-80% of the migrated neurons with the rest dispersedthroughout layers 7 and 9.
Class 4. Layers were separated rostrocaudally, as well asmediolaterally but were without sharp borders, except forlayer 8, which contained 80-95% of the migrated neurons.
Class 5. There was a clear and sharp separation of all layersin all parts of the tectum; layer 8 contained >95% of themigrated neurons.
In salamanders, the tectum is never as differentiated as infrogs, so a different classification of morphological differen-tiation is used (description of layers is from ref. 12).
Class 0. There was a periventricular layer of denselypacked cells with no further subdivisions; no migrated cellsappeared in the superficial white matter.
Class 1. Gray matter was subdivided by short fiber bandsextending mediolaterally up to one-fourth of the width of thetectum; no migrated cells were present.
Class 2. Gray matter was subdivided by short fiber bandsextending mediolaterally up to one-half of the width of thetectum; very few migrated cells were present.
Class 3. Gray matter was more loosely arranged; cellularislands had formed, in addition to short bands of fibers; up to5% of the neurons had migrated.
Class 4. Fiber bands extended mediolaterally over theentire width of the tectum; gray matter was loosely arranged;up to 5% of neurons had migrated into superficial layers 1-4.
Table 2. AnuransFamily and species n GS* CSt BSt MC
BombinatoridaeBombina orientalis 3 10.3 9.9 10.9 2
DiscoglossidaeDiscoglossus pictus 3 5.3 8.0 15.6 3.7
PipidaeXenopus laevis 1 3.0 6.2 30.9 4
RanidaeRana temporaria 3 4.2 7.9 18.5 3Mantella aurantiaca 2 4.8 6.2 5.3 4.5Mantella cowani 2 6.8 6.5 4.2
HyperoliidaeHyperolius quinquevittatus 2 6.4 8.8 5Afrixalus fornasinii 2 6.9 4.5
HylidaeHyla septentrionalis 1 6.5 20.9 4Gastrotheca riobambae 2 3.7 7.3 19.2 3.5
BufonidaeBufo bufo 2 5.8 6.4 4
MyobatrachidaeLimnodynastes tasmaniensis 2 2.3 6.6 9.8 3.5Arenophryne rotunda 1 19.0 10.0 5.5 1.5
DendrobatidaeDendrobates pumilio 2 7.0 5.0 3
LeptodactylidaeEleutherodactylus coqui 2 5.8 14.0 4Sminthillus limbatus 2 5.1 1.4 3.5
RhacophoridaeRhacophorus leucomystax 1 7.2 18.6 3.8GS, genome size; CS, cell size; BS, brain size; MC, morphological
complexity.*Data are reported as pg of DNA haploid genome.tData are reported as ,um3.tData are reported as mm3.
Class 5. Fiber bands extended over the entire rostrocaudaland mediolateral width ofthe tectum, separating deep cellularlayers 6 and 8 and continuing into the tegmentum; 3-10%1 ofthe neurons had migrated.Specimens were ranked by complexity class. In cases
where specimens of the same species ranked differently,means were calculated. Statistical analysis (13) includedPearson's product moment correlation, used for analysis ofthe continuous variables of brain size, cell size, and genomesize, and Kendall's rank correlation, used for comparisons ofdegree of morphological differentiation. Felsenstein's con-trast method was used for phylogenetic comparisons (notpresented in detail here) (14).
RESULTSWe present results for frogs and for salamanders separately(Fig. 1).
Frogs. We recognize four groups based on our criteria formorphological complexity of the tectum. The first groupcontains frogs with small to very small brains and large tovery large cell sizes-i.e., Arenophryne rotunda and Bom-bina orientalis (9.8 ,um average cell diameter). Their tecta,with scores of 1.5-2, rank as the least differentiated amonganurans. In addition, the mesencephalic tegmentum andtorus semicircularis in these species show little, if any,lamination.The next group contains species that have intermediate cell
sizes-i.e., Gastrotheca riobambae, Dendrobates pumilio,and Discoglossus pictus (average cell diameter, 7.4 ,um).Tectal morphology ranks 3-3.7 in complexity.The next group consists of frogs with medium to small
cells-i.e., Mantella cowani, Rhacophorus leucomystax,
Neurobiology: Roth et aL
Dow
nloa
ded
by g
uest
on
Dec
embe
r 29
, 201
9

Proc. Nati. Acad. Sci. USA 91 (1994)Alvin a- . reea
*B
6'A:jotvIt
I
G _A_1ia.
''I'''~~fVF*
0
II.1'.':
:f Tb ,. t,M.:.,P,... i .",.u', .f*:.
I
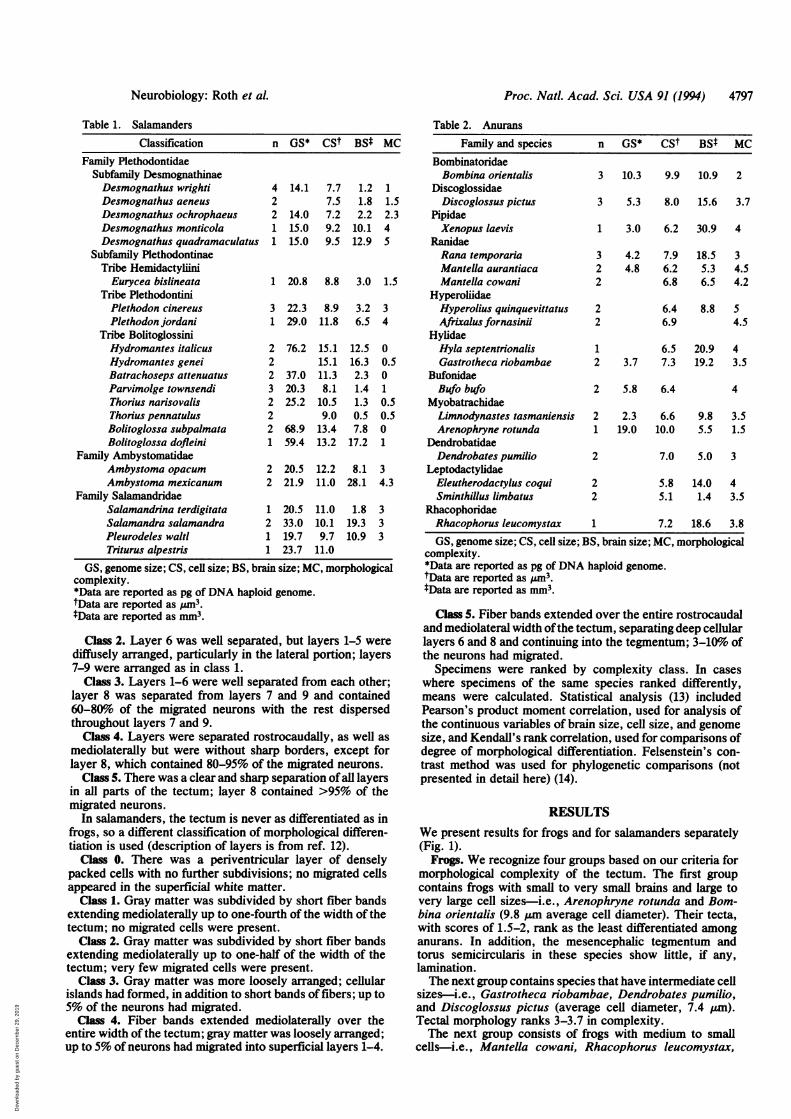
FIG. 1. Cross sections through brains of frogs and salamanders at the level of the tectum and the dorsal tegmentum/torus semicircularisshowing differences in cell size and morphological complexity. (A) Hydromantes italicus. (B) Arenophryne rotunda. (C) Desmognathusquadramaculatus. (D) Limnodynastes tasmaniensis. A and C represent the simplest and most complex morphologies among salamanders of thefamily Plethodontidae; B andD represent the simplest and most complex morphologies among frogs of the family Myobatrachidae. These crosssections also represent the extremes of morphological complexity encountered within the orders Caudata and Anura. Within each group,morphological complexity of the tectum, as well as the tegmentum and torus semicircularis, correlates negatively with cell size, which ispositively correlated with genome size. TE, tectum; TG, tegmentum/torus semicircularis. (Bar = 100 ,um.)
Rana temporaria, Limnodynastes tasmaniensis, and Hylaseptentrionalis (average cell diameter, 7 am). Tectal mor-phology ranks 3-4.2 in complexity. We include Sminthilluslimbatus in this group based on its complexity score, but notethat it has the smallest cells found among frogs (cell diameter,5.1 pum). Sminthillus is a miniaturized species that has by farthe smallest brain among the anurans sampled.The last group consists of frogs that have small to very
small cells: Hyperolius quinquevittatus, Xenopus laevis,Eleutherodactylus coqui, and Mantella aurantiaca (averagecell diameter, 6.2 ,um). Their tectal morphology ranks 4-5.
In frogs, brain size is neither correlated with cell size norwith morphological complexity of the tectum (0.1, P < 0.6;n = 15). Thus, larger brains do not necessarily have morecomplex morphologies. However, cell size is significantlynegatively correlated with morphological complexity of thetectum (-0.5, P < 0.01; n = 16). Thus, frogs with smallercells have more complex tecta (as well as other brain cen-ters), independent of brain size.
Salamanders. We recognize four groups based on thecombined criteria of rank in morphological complexity of thetectum and body size. The least differentiated tectum (aver-age rank per species, 0-0.5) is associated with cells ofmedium to large size (diameters, 9-11.3 pm) and found insmall species (13- to 42-mm snout-to-vent length): Thoriusnarisovalis, Thorius pennatulus, and Batrachoseps attenua-
tus. The second group also has a relatively undifferentiatedtectum (0-1) and even larger cells (diameters, 13.2-15.1 jam);species in this group are medium-sized to large (>45-mmsnout-to-vent length): Bolitoglossa subpalmata, Bolitoglossadofleini, Hydromantes italicus, and Hydromantes genei. Athird group has a more differentiated tectum (rank, 1-3), butcells that are small to medium in size (diameters, 7.2-11.0pum); members ofthis group are small (<42-mm snout-to-ventlength): Desmognathus wrighti, Desmognathus aeneus, Des-mognathus ochrophaeus, Parvimolge townsendi, Plethodoncinereus, Eurycea bislineata, and Salamandrina terdigitata.The tectum of the fourth group is the most differentiated(most fully developed) found among salamanders (rank, 3-5)and has cells that are of intermediate size (diameters, 9.2-12.2 jAm); species of this group are large to very large(>64-mm snout-to-vent length): Ambystoma opacum, Am-bystoma mexicanum, Desmognathus monticola, Desmog-nathus quadramaculatus, Plethodon jordani, Salamandrasalamandra, and Pleurodeles walti. The neotenic Am-bystoma mexicanum has a well differentiated tectum that ismore complex than that of its metamorphosed congener,Ambystoma opacum, which has slightly larger cells and amuch smaller brain than Ambystoma mexicanum.
In salamanders, in contrast to frogs, brain size (which ispositively correlated with body size; 0.90, P < 0.01; n = 20)and cell size correlate significantly (0.49, P < 0.02, n =
4798 Neurobiology: Roth et al.
I
-., .. ., v4
.. . I .
l"pl-1. t.,
i44
1_.#
_. 4|
Dow
nloa
ded
by g
uest
on
Dec
embe
r 29
, 201
9

Proc. Natl. Acad. Sci. USA 91 (1994) 4799
21)-i.e., salamanders with larger brains tend to have largercells, and those with smaller brains tend to have smaller cells.Furthermore, brain size and body size are significantly pos-itively correlated with the degree of morphological complex-ity of the tectum (0.49, P < 0.01, n = 20). Holding cell sizeconstant, salamanders with larger brains have more complextecta. In contrast, cell size is significantly negatively corre-lated with the degree of morphological complexity of thetectum. Holding brain size constant (i.e., by dividing oursample into small, 0.5-3 mm3, and large, 3.2-28.1 mm3,brain-size categories), salamanders with smaller cells havemore complex tecta (small brains: -0.8, P < 0.01, n = 8; largebrains: -0.53, P < 0.01, n = 13).
DISCUSSIONOur analysis demonstrates that, for frogs, cell size is signif-icantly correlated with morphological complexity of thetectum (as well as other brain parts). Thus, frogs with thelargest cells have the simplest brains, regardless of body andbrain size. Bombina orientalis has a much larger brain thando Hyperolius, Mantella, Sminthillus, or Dendrobates, yet ithas a much simpler brain. We attribute simplification (asopposed to retention ofan ancestral simplicity as determinedby our phylogenetic analysis, data not shown) of the brain inthis species to its large cells. The most complex brainmorphologies are found in frogs that have intermediate tosmall brains. An important exception is the case ofXenopuslaevis, which has by far the largest brain among the taxastudied but has a relatively differentiated tectum (rank, 4). Incontrast, Sminthillus also has a relatively complex brainmorphology (rank, 3.5), although its brain is the smallestamong the taxa studied. Both species have small cells.Although the degree ofmorphological differentiation ofthe
salamander tectum is significantly negatively correlated withcell size, as in frogs, there is also a significant positivecorrelation between brain size and tectal complexity. Smallcells and large brains are both important factors contributingto increased differentiation of the brain in salamanders andappear to exert a counteracting influence on brain morphol-ogy. Thus, in salamanders, the following generalities appearto apply: (i) Iftwo species have equal brain sizes, the specieswith smaller cells has the more complex brain morphology.(ii) If two species have cells of equal sizes, the species withthe larger brain has the more complex brain morphology.Accordingly, the least differentiated brains are found in smallspecies (with small brains) having large cells and in medium-sized to large species (with large brains) having large cells.Brains become increasingly complex in degree of morpho-logical differentiation in the following order: small specieswith small cells, medium-sized to large species with mediumto small cells, and large species with small cells.An extraordinarily broad range of cell sizes is found in
amphibians; within our samples both of frogs and sala-manders, cell diameters double. The simplest explanation forvariation in cell size is variation in genome size, which isknown to correlate positively with cell size and which showsnearly an order of magnitude variation within each group(15). The smallest genome among vertebrates is found inteleost fishes, with <1 pg of DNA per haploid genome.Amniote genome sizes are also relatively small and rangefrom 0.9 to 5.5 pg of DNA (15). The largest genome sizesamong animals are found in lungfishes (Dipnoi) (lepidosi-renids, 111 pg in Lepidosiren and 142 pg in Protopterus;ceratodontids, 80 pg in Neoceratodus; ref. 15), but sala-manders have the second largest genomes, ranging from 13.7pg in the plethodontid Desmognathus wrighti (16, 17) to 83 pgin the perennibranchiate proteid Necturus maculosus (15). Inanurans, genome sizes range from 0.95 pg in Limnodynastes
ornatus to 19 pg in Arenophryne rotunda (15, 18, 19), bothmembers of the family Myobatrachidae.
In our combined sample of amphibians, there is a signifi-cant correlation between genome size and tectal cell diameter[r = 0.87, by linear regression (P < 0.01) and 0.89, byexponential regression (P < 0.01)]. Accordingly, we con-clude that differences in genome size largely account for thegreat range in cell size and ultimately for the differences indegree of tectal morphological complexity in both frogs andsalamanders.Convenient for phylogenetic control is the fact that within
single families of both frogs and salamanders we find greatranges in genome size. The frog family Myobatrachidaeincludes taxa that display the full range ofanuran genome size(from Limnodynastes to Arenophryne), and the salamanderfamily Plethodontidae includes nearly the full range of sala-mandergenome size: the largest plethodontid genome is 77 pgper haploid genome in Hydromantes italicus (17, 20). In bothfamilies there is also a full range of morphological complexityof the tectum, and the general rule we have identifiedapplies-morphological differentiation is negatively corre-lated with genome and cell size.
Small genome size is plesiomorphic in amphibians, andlarge genomes have evolved independently at least twicewithin frogs and within salamanders (based on refs. 17 and 21and our independent phylogenetic analysis, data not shown).The correlation between genome and cell size arises from
the fact that large amounts of DNA necessitate large chro-mosomes and, in turn, large nuclei; consequently cell vol-umes also become large. In vertebrates, the correlationbetween genome size and erythrocyte volume is r = 0.85(statistically significant figure; ref. 15). Furthermore, in-creased cell sizes lead to decreases in rates of cell metabo-lism, cell proliferation, and differentiation (17, 21-26). Ani-mals with large genomes and large cells have fewer cells,including nerve cells, owing to reduced cell-proliferationrates. Brains of relatively large-celled amphibian taxa de-velop slowly and exhibit retarded differentiation of neuronaltissue, including degree of cell migration and formation ofanatomically distinct nuclei and layers (27). As a conse-quence, brains of animals with large genomes and cells havean "immature" or pedomorphic appearance when comparedwith related taxa having smaller genomes and cells. Thistrend is manifest even at high taxonomic levels, and we haveshown elsewhere that salamanders as a whole have second-arily simplified brains that we attribute to pedomorphosis (1).
Frogs and salamanders represent two independent cases oftectal simplification associated with increased cell sizes.Although living lungfishes (Dipnoi) lack taxonomic diversity,there is sufficient diversity to detect a third instance of thetrend we have reported in frogs and salamanders.'Lepidosi-renid lungfishes have much larger genomes than ceratodontidlungfishes (see above), which in turn have even larger ge-nome sizes than salamanders. As compared with those ofceratodontids, lepidosirenid tecta display much less struc-tural complexity; the extremely simplified brains of lepido-sirenids resemble those ofsalamanders in many respects (28),and we believe them to be pedomorphic (1).At present the favored explanation for intrataxon increases
in genome size is the "selfish DNA" hypothesis (21, 29, 30).No selective advantage has been identified for the many andapparently independent increases in genome size withinamphibian and dipnoan taxa. Particularly telling is the case ofthe plethodontid salamander tribe Bolitoglossini. These sala-manders are characterized by having the fastest and mostprecise feeding mechanisms found among amphibians (12,31). This feeding mechanism is paralleled by highly devel-oped stereoscopic vision (12, 32). In addition, many bolito-glossines, particularly the arboreal species, are true acrobats,making use of limb and tail specializations (33). At the same
Neurobiology: Roth et A
Dow
nloa
ded
by g
uest
on
Dec
embe
r 29
, 201
9

Proc. Natl. Acad. Sci. USA 91 (1994)
time, these animals have brains that show the lowest level ofmorphological complexity, not only for amphibians but alsoamong vertebrates in general. That simplification of brainmorphology is advantageous under conditions of increasedfunctional and biomechanical complexity contradicts stan-dard functionalist views in comparative neuroanatomy.Rather, a hierarchical perspective is required that recognizesgenome size increase as an independent event that has wideimplications and represents a "burden" (sensu ref. 34) forbrain function.We have shown that simplification of tectal morphology is
mainly the result of increased cell size, which is a conse-quence of increased genome size. The importance of thisfinding is that our hierarchical (both within the organism andamong taxa) approach is an alternative to strict functionalismand offers a simpler and more general structuralist explana-tion for patterns of morphological complexity of the brain inamphibians and lungfish.
We thank M. J. Tyler, University of Adelaide, and J. W. Wright,Museum of Natural History, Los Angeles, for providing specimensfor our study, and K. Nishikawa and M. Wake for helpful comments.This research was supported by the Deutsche Forschungsgemein-schaft and the National Science Foundation.
1. Roth, G., Naujoks-Manteuffel, C., Nishikawa, K., Schmidt, A.& Wake, D. B. (1993) Brain Behav. Evol. 42, 137-170.
2. Neary, T. J. & Northcutt, R. G. (1983) J. Comp. Neurol. 213,262-278.
3. Szdkely, G. & LAzdr, G. (1976) in Frog Neurobiology, eds.Llinas, R. & Precht, W. (Springer, Berlin), pp. 407-434.
4. LAzr, G. (1984) in Comparative Neurology of the OpticTectum, ed. Vanegas, H. (Plenum, New York), pp. 185-210.
5. Potter, H. D. (1969) J. Comp. Neurol. 136, 203-232.6. Herrick, C. J. (1948) The Brain of the Tiger Salamander
Ambystoma tigrinum (Univ. Chicago Press, Chicago), p. 409.7. Leghissa, S. (1962) Arch. Ital. Anat. Embriol. 67, 343-413.8. Roth, G., Naujoks-Manteuffel, C. & Grunwald, W. (1990) J.
Comp. Neurol. 291, 27-42.
9. Naujoks-Manteuffel, C. & Manteuffel, G. (1988) J. Comp.Neurol. 273, 187-206.
10. Kluever, H. & Barrera, F. (1953) J. Neuropathol. Exp. Neurol.12, 400-403.
11. Romeis, B. (1968) Mikroskopische Technik (Oldenbourg,Munich), p. 757.
12. Roth, G. (1987) Visual Behavior in Salamanders (Springer,Berlin), p. 301.
13. Sokal, R. R. & Rohlf, F. J. (1981) Biometry (Freeman, SanFrancisco), 2nd Ed., p. 859.
14. Felsenstein, J. (1985) Am. Nat. 125, 1-15.15. Olmo, E. (1983) Bas. Appl. Histochem. 27, 227-256.16. Hally, M. K., Rasch, E. M., Mainwaring, H. R. & Bruce,
R. C. (1986) Histochemistry 85, 85-192.17. Sessions, S. & Larson, A. (1987) Evolution 41, 1239-1251.18. Moreschalchi, A. (1990) in Cytogenetics of Amphibians and
Reptiles, ed. Olmo, E. (Birkhaeuser, Basel), pp. 1-19.19. Mahony, M. (1986) Ph.D. dissertation (Macquarie Univ., Ryde,
New South Wales, Australia).20. Sessions, S. K. & Kezer, J. (1991) in Amphibian Cytogenetics
and Evolution, eds. Green, D. M. & Sessions, S. K. (Academ-ic, San Diego), pp. 89-130.
21. Pagel, M. & Johnstone, R. A. (1992) Proc. R. Soc. London B.249, 119-124.
22. Homer, H. A. & Macgregor, H. (1983) J. Cell Sci. 63, 135-146.23. Szarski, H. (1976) Int. Rev. Cytology 44, 93-111.24. Szarski, H. (1983) J. Theor. Biol. 105, 201-209.25. Cavalier-Smith, T. (1978) J. Cell Sci. 34, 247-278.26. Cavalier-Smith, T. (1982) in The Evolution ofGenome Size, ed.
Cavalier-Smith, T. (Wiley, Chichester, U.K.), pp. 105-184.27. Schmidt, A. & Roth, G. (1993) Cell Tissue Res. 272, 273-287.28. Northcutt, R. G. (1986) J. Morphol. Suppl. 1, 277-297.29. Doolittle, W. F. & Sapienza, C. (1980) Nature (London) 284,
601-603.30. Orgel, L. & Crick, F. (1980) Nature (London) 284, 604-607.31. Thexton, A. J., Wake, D. B. & Wake, M. H. (1977) Arch. Oral
Biol. 22, 361-366.32. Wiggers, W. & Roth, G. (1991) J. Comp. Physiol. 169,165-176.33. Wake, D. B. (1987) Ann. Missouri Bot. Gard. 74, 242-246.34. Riedl, R. (1978) Order in Living Systems (Wiley, New York), p.
313.
4800 Neurobiology: Roth et al.
Dow
nloa
ded
by g
uest
on
Dec
embe
r 29
, 201
9