cell reports report - samantha morris lab
TRANSCRIPT
Cell Reports
Report
Developmental Plasticity Is Bound by Pluripotencyand the Fgf and Wnt Signaling PathwaysSamantha A. Morris,1,2,3 Yu Guo,1,2 and Magdalena Zernicka-Goetz1,2,*1Wellcome Trust/Cancer Research Gurdon Institute, Cambridge CB2 1QN, UK2Department of Physiology, Development and Neuroscience, University of Cambridge, Downing Street, Cambridge CB2 3DY, UK3Present address: Department of Biological Chemistry and Molecular Pharmacology, Harvard Medical School, and Boston Children’s
Hospital, Boston, MA 02115, USA
*Correspondence: [email protected]://dx.doi.org/10.1016/j.celrep.2012.08.029
SUMMARY
Plasticity is a well-known feature of mammaliandevelopment, and yet very little is known about itsunderlying mechanism. Here, we establish a modelsystem to examine the extent and limitations ofdevelopmental plasticity in living mouse embryos.We show that halved embryos follow the samestrict clock of developmental transitions as intactembryos, but their potential is not equal. We havedetermined that unless aminimum of four pluripotentcells is established before implantation, develop-ment will arrest. This failure can be rescued bymodulating Fgf and Wnt signaling to enhancepluripotent cell number, allowing the generation ofmonozygotic twins, which is an otherwise rarephenomenon. Knowledge of the minimum pluripo-tent-cell number required for development to birth,as well as the different potentials of blastomeres,allowed us to establish a protocol for splitting anembryo into one part that develops to adulthoodand another that provides embryonic stem cells forthat individual.
INTRODUCTION
One of the most distinguishing features of mammalian develop-
ment is the plasticity with which embryos adapt to experimental
perturbation, a process known as regulative development. Clas-
sically, following the destruction of one cell of the two-cell mouse
embryo, the remaining cell can often compensate and support
development to term (Nicholas and Hall, 1942; Tarkowski,
1959). This plasticity is preserved at later developmental stages,
at least in some cases. This is because although cells separated
from the four- or eight-cell mouse embryo cannot develop
beyond implantation (Rossant, 1976; Tarkowski and Wroblew-
ska, 1967), they can contribute to all tissues in chimeras (Kelly,
1977; Piotrowska-Nitsche and Zernicka-Goetz, 2005). In agree-
ment with this, when cells are repositioned, development often
readjusts (Rossant and Lis, 1979). Even chimeras built of
embryos placed together can regulate to generate only one indi-
756 Cell Reports 2, 756–765, October 25, 2012 ª2012 The Authors
vidual (Mintz, 1964; Tarkowski, 1961). This plasticity might indi-
cate that early mammalian development, in contrast to develop-
ment of other species, is stochastic. Yet there are indications in
earlier work that this developmental plasticity might not be as
universally applicable as generally assumed. For example,
many blastomeres separated at the two-cell stage do not
succeed in development to birth, and despite many efforts,
production of monozygotic twins through this route has been
practically unattainable (Papaioannou and Ebert, 1995; Tsunoda
and McLaren, 1983). Neither the reasons behind this limitation
nor the mechanism underlying developmental plasticity are
currently understood.
The objective to be attained before implantation is to
produce a blastocyst that has the three cell types required
for subsequent development: the epiblast (EPI), which provides
pluripotent cells (the foundation for the future body), and the
primitive endoderm (PE) and trophectoderm (TE), extraembry-
onic tissues that are essential for embryo patterning and devel-
opment of the placenta to ensure contact between the embryo
and the mother (Zernicka-Goetz et al., 2009). The TE comprises
the outer layer of cells of the blastocyst, whereas the EPI and
PE correspond respectively to the deep and surface layers of
the inner cell mass (ICM). These inside cells are generated in
the fourth and fifth cleavage divisions, typically through differ-
entiative divisions (Johnson and Ziomek, 1981; Pedersen
et al., 1986; Morris et al., 2010), although cell engulfment was
recently reported as an alternative route (McDole et al., 2011;
Yamanaka et al., 2010). The first inside cells to be generated
give rise predominantly to EPI, and the next set of inside cells
to be generated gives birth predominantly to PE (Morris et al.,
2010). These two cell types initially can be mixed, but they
subsequently sort into the two layers by the mature blastocyst
stage (Chazaud et al., 2006; Meilhac et al., 2009; Morris et al.,
2010; Plusa et al., 2008).
Here, we investigate why some embryos regulate their
development successfully, whereas in other cases develop-
ment fails. Our study determines the minimum number of
pluripotent cells that are essential for successful development
to birth, and shows that the potential of individual blastomeres
to provide this number differs. This allowed us to devise a
protocol for splitting an embryo into two parts: one that
develops to birth and one that provides an embryonic stem
cell (ESC) line for that individual.
RESULTS AND DISCUSSION
Developmental Clock in Regulative DevelopmentTo gain insight into the mechanisms that endow mammalian
embryos with developmental flexibility, and the reasons for its
limitations, we first split two-cell mouse embryos into halves
and followed their developmental dynamics in detail, in parallel
with normal-sized embryos (Figure 1). We used high-resolution,
long-term, four-dimensional (4D), live-embryo imaging to investi-
gate with spatial and temporal precision (1) the timing of all
cell divisions, (2) the division orientations of all cells, (3) the spatial
arrangementsof cells relative to eachother, (4) thedirectionof cell
movement, (5) the frequency of apoptosis (if it occurred), and (6)
the formation of the three distinct lineages at the mature blasto-
cyst stage. To visualize all cells continuously throughout these
first 3 days of development with precision, we studied embryos
expressing a glycosylphosphatidylinositol-tagged GFP mem-
brane marker (GFP-GPI). Cellular dynamics were tracked manu-
ally with the help of SimiBiocell software (Bischoff et al., 2008).
Our spatial and temporal analyses of half-embryo develop-
mental dynamics revealed that the processes of cell compac-
tion, polarization, generation of inside cells, blastocyst cavity
formation, and lineage allocation all occurred at the same time
as in whole embryos, albeit with half the number of total cells
(n = 81; Figures 1A–1C and S1A;Movies S1 andS2). Surprisingly,
we found that despite the severely reduced cell number, some
ICM cells of half embryos also underwent apoptosis, initiated
with exactly the same timing as in full-sized embryos. Thus,
key preimplantation events in half embryos follow a ‘‘clock’’
that runs at the same pace as in full-size embryos, in agreement
with earlier observations (Le Douarin and McLaren, 1984),
although, interestingly, the mechanisms of some of these devel-
opmental transitions differ (see further below).
Generation of Distinct Cell Lineages in the Courseof Regulative DevelopmentIn normal development, the allocation of cells to the ICM typically
occurs through differentiative, or asymmetric, cell divisions in
which outside cells divide in an orientation that directs one
daughter inward (Johnson and Ziomek, 1981). In contrast, both
daughters of conservative, or symmetric, divisions remain
outside and will contribute to TE. During whole-embryo develop-
ment, there are two major waves of such cell internalization, at
the 8- to 16-cell and 16- to 32-cell transitions, both of which
give rise to equal proportions of ICM (Bischoff et al., 2008; Morris
et al., 2010; Pedersen et al., 1986). Surprisingly, by following cell
division orientations and cell positioning, we observed that the
great majority of the ICM (90%; n = 81 cells, 9 embryos; p =
<0.001, t-test) in half embryos was generated in the first wave
(now the 4- to 8-cell transition), with the second wave generating
only 10% of ICM (Figure 1D).
Because the proportion of ICM generated in the first and
second waves differed drastically between half and whole
embryos, we examined the process of cell internalization in
greater detail. To follow this process with the highest possible
resolution, we injected synthetic mRNA for membrane-associ-
ated GAP43-RFP and imaged embryos by confocal microscopy
throughout the period when inside cells are generated by a first
C
asymmetric division wave (Figure 1E, Movie S3). Unexpectedly,
we observed that when cells divided in the half embryos, each
daughter cell had outside domains and subsequently one
daughter became engulfed. This accounted for the greatmajority
of cell internalizations in half embryos (93%, n = 18). In contrast,
we were able to detect cell engulfment in whole embryos in only
14% of cases (n = 18; Figures 1E and S1D; Movie S4).
Considering that experimental disruption of cell polarity was
reported to lead to similar cell engulfment in whole embryos
(Plusa et al., 2005), we wished to determine whether differences
in apical polarization between cells could account for the
observed engulfment. To that end, we examined the apical
polarization of half-embryo cells at the four-cell stage (i.e., devel-
opmentally at the eight-cell stage). Our results showed that all
exposed surfaces of cells were polarized, as assessed by apical
aPKCz staining. However, immediately following cell division,
20% (8/40) of outside cells in half embryos were devoid of
aPKCz, which was never observed in outside cells of whole
embryos (0/26; Figure 1F). Such unpolarized cells would be
expected to be engulfed by more polarized neighbors (Plusa
et al., 2005). This may also explain why cell engulfment was
recently observed after injection of eight-cell-stage blastomeres,
because such an injection could disrupt cell polarization (Morris,
2011; Yamanaka et al., 2010).
To confirm the engulfment of cells with reduced apical polarity,
we filmed cell divisions of embryos injected at the two-cell stage
with E-cadherin-GFP mRNA (Figure 1G). We observed that in
whole embryos, asymmetric divisions led inside rather than
outside cells to inherit basally localized E-cadherin-GFP (100%,
n = 8/8 dividing cells). In contrast, in half embryos, E-cadherin
was inherited by outside cells and, importantly, cells that in-
herited higher levels of E-cadherin were subsequently engulfed
(75%, n = 6/8 dividing cells; Figure 1G).
Relationship between Cell Fate and the Timingof Cell InternalizationWe previously reported that the first inside cells to be generated
in undisturbed development are biased to contribute to the EPI,
whereas those that arrive inside later are biased to differentiate
to the extraembryonic PE (Morris et al., 2010). To determine
whether a similar relationship between the timing of cell origin
and fate allocation is displayed during regulative development,
we carried out 4D lineage analyses of all cells. This revealed
that the first inside cells in half embryos contributed equally to
EPI and PE lineages (n = 71 cells). In contrast, inside cells that
arose later were significantly biased toward differentiating into
PE (90%, p < 0.001, n = 10 cells, t-test; Figure 1H), similar to
what was observed during undisturbed development.
In our next analyses we aimed to determine whether half-
embryos regulating their development show a relationship
between cell origin (wave 1 versus wave 2) on the one hand,
and cell position, apoptosis and final cell fate on the other, as
reported in normal development (Morris et al., 2010). Tracking
of all cell behaviors revealed that when the blastocyst formed,
the wave-2-derived inner cells were positioned at the ICM
surface and consequently gave rise to PE. Thus, the position of
these cells was ‘‘correct’’ in relation to their subsequent fate,
and indeed we did not observe these cells to change their
ell Reports 2, 756–765, October 25, 2012 ª2012 The Authors 757

Figure 1. Half-Embryo Development
(A) Developmental progression of half embryos (upper row, equivalent stages in parentheses) and whole embryos (lower row).
(B) Time-lapse imaging of half-embryo development. Lineage diagram: A, apoptosis; I, inside cell; O, outside cell; 1, wave 1 internalization; 2, wave 2 inter-
nalization.
(C) Compaction, division, and cavitation occur with the same timing in half and whole embryos imaged side by side (merged differential interference contrast and
GFP frames from Movie S1).
(D) Proportions of first- and second-wave internalizations in whole embryos (from Morris et al., 2010) and half embryos.
(E) Time-lapse imaging of cell internalization by asymmetric division (whole embryo) and engulfment (half embryos). Time: hours:minutes.
(F) aPKCz immunostaining of half and whole embryos in the 4(8)- to 8(16)-cell-stage transition. Scale bars: 50 mM (B) and 25 mM (D and E).
(G) Time-lapse imaging of cell internalization by asymmetric division (whole embryo) and engulfment (half embryos) in embryos expressing E-cadherin-GFP.
(H) Final fates of cells derived from the first and second waves in half embryos.
All error bars indicate standard error. See also Figure S1 and Movies S2, S3, and S4.
758 Cell Reports 2, 756–765, October 25, 2012 ª2012 The Authors

position and move into the deeper, EPI compartment. However,
we found that wave 1 cells could either be in a correct position
(i.e., deep within the ICM) or in an incorrect position (i.e., at the
surface) in relation to their future fate (Figure S1B). Interestingly,
our data revealed the highest incidence of apoptosis in cells
that were positioned incorrectly (Figure S1B). Moreover, despite
the lower cell content in the half embryos, the timed onset of
apoptosis was the same as in undisturbed development (Fig-
ure S1C). These findings indicate that the mechanisms used by
half embryos to form a blastocyst are similar to those employed
by their undisturbed counterparts, including apoptosis despite
low cell numbers. However, the exception is cell internalization,
which is driven nearly entirely by cell engulfment rather than dif-
ferentiative division, possibly due to geometrical constraints.
Relationship between Pluripotent Cell Numberand Successful DevelopmentOur detailed examination of each developmental transition
suggested that half embryos show high variability in ICM cell
number. To confirm this, we determined the precise numbers
of pluripotent (Nanog-positive), PE (Sox17-positive), and TE
(Cdx2-positive) cells at the end of preimplantation development.
We found that in contrast to undisturbed development, EPI cell
number in half embryos varied drastically, from 0 to 8 cells, in
comparison with 8–12 cells in full-sized embryos (Figure 2A).
This EPI cell number correlated with PE cell number, reflecting
the total ICM size, whereas the TE proportion was relatively
constant (Figure S2).
It was previously demonstrated that although all blastomeres
at the four-cell stage are pluripotent, they differ significantly in
developmental potential depending on the cleavage division
pattern by which they arise (Piotrowska-Nitsche et al., 2005;
Piotrowska-Nitsche and Zernicka-Goetz, 2005; Torres-Padilla
et al., 2007). We therefore wondered whether half embryos
with fewer ICM cells might be derived from blastomeres with
reduced potential. To test this hypothesis, wemonitored division
orientation and order at the two- to four-cell-stage transition to
identify and isolate individual blastomeres known to differ in
potential (Figure 2B). This allowed us to construct half-embryo
chimeras from two four-cell blastomeres (i.e., two animal-vegetal
[AV] parts [AV-AV]) that were previously shown to have full devel-
opmental potential (Piotrowska-Nitsche et al., 2005; see Experi-
mental Procedures and legend to Figure 2B), and half-embryo
chimeras from blastomeres of restricted potential (two vegetal
blastomeres [V-V]). When we compared their development, we
found that in contrast to the AV-AV half-embryo chimeras, the
V-V chimeras failed to form a substantial ICM, suggesting that
the developmental history of blastomeres can influence
successful development. In agreementwith this, whenwe gener-
ated chimeras in which V-blastomeres were paired with AV- or
A-blastomeres, cell allocation to the EPI was enhanced (p <
0.01, t-test; Figure 2B). On initial consideration, the larger EPI
population observed in A-V chimeras was unexpected, consid-
ering the reduced potential of their component blastomeres. It
can be reasoned, however, that the high Cdx2 expression and
cell polarization discovered in V-blastomere eight-cell stage
progeny (Jedrusik et al., 2008) may lead to the engulfment of
A-blastomere progeny, thus promoting ICM generation.
C
Because our experiments demonstrated a variable EPI cell
number in half embryos, it was important to determine whether
this correlates with embryo viability. Thus, we grouped embryos
according to EPI cell number using cell position as the criterion
for cell identity (deep cells: EPI; surface cells: PE; Morris et al.,
2010) and transferred them into foster mothers together with
whole-sized-embryo carriers of different genotype, handled
under the same conditions. We first recovered embryos 2 days
after implantation and correlated EPI cell number with develop-
mental success (Figure 2C). This revealed that a minimum of
four EPI cells was required for reliable development to embry-
onic day 6.5 (E6.5), demonstrating that development beyond
implantation correlates with the number of EPI cells attained
by implantation.
To confirm and extend these observations, we next sought
to determine whether EPI cell number correlates with successful
development to birth. To that end, we placed half embryos into
groups depending on whether they had low-EPI cell numbers
(0–2 EPI cells) or high-EPI cell numbers (4–5 EPI cells) together
with whole-embryo carriers. Only two live births resulted from
the transfer of 9 low-EPI half embryos (22%, n = 2/9), whereas
almost all (87%, n = 7/8) high-EPI half embryos developed to
term. Two weeks after birth, the half-embryo-derived pups
were comparable in size to their whole-embryo littermates (Fig-
ure 2D). Together with our lineage analysis, these results indicate
that insufficient allocation of cells to the EPI by the time of
implantation presents a barrier to successful development. Our
results also indicate that cell internalization, apoptosis, and the
developmental history of the cells all influence the size of this
population.
Expanding the Pluripotent Cell Population PromotesDevelopmentWe argued that if indeed EPI cell number is the primary limiting
factor for successful development, then half-embryo develop-
ment should be rescued by expanding the EPI population. It
was reported that small-molecule inhibitors of extracellular
signal-related kinase (ERK1/2) and glycogen synthase kinase
3b (GSK3) (2i; Ying et al., 2008) prevent PE formation and expand
EPI (Nichols et al., 2009). We therefore treated half embryos with
2i from four-cell to late-blastocyst stages. This resulted in a 30%
increase in the total ICM cell number (p < 0.05, t-test, n = 36
embryos; Figure 3A). However, after 2i treatment, all inner cells
developed as EPI. Because this would prevent development
due to the absence of PE (Chazaud et al., 2006), we next incu-
bated half embryos in 2i only until the mid-blastocyst stage
and then switched to inhibitor-free medium to permit PE forma-
tion (Nichols et al., 2009). This regimen increased the EPI
compartment from, on average, three cells to eight cells (p <
0.01, t-test) while maintaining PE integrity (Figure 3B). Because
this transient 2i treatment increased EPI cell number to a level
critical for development to birth, we transferred such half
embryos to foster mothers. We found that development of the
2i-treated half embryos was significantly rescued, doubling the
frequency of egg cylinder formation (63%, n = 18) relative to
untreated half embryos (33%, n = 16; Figure 3C).
We next addressed whether such a supplement of pluripotent
cells would increase the frequency of monozygotic twinning,
ell Reports 2, 756–765, October 25, 2012 ª2012 The Authors 759

Figure 2. ICM Size and Embryo Viability
(A) Nanog (EPI), Sox17 (PE), and Cdx2 (TE) immunostaining of whole and half embryos. Bar chart: EPI number frequency in half embryos.
760 Cell Reports 2, 756–765, October 25, 2012 ª2012 The Authors

which was previously shown to be very inefficient when splitting
embryos at the two-cell stage (Tsunoda and McLaren, 1983). To
assess twinning, we separated cells at the two-cell stage and
performed the 2i rescue treatment as described above before
transferring the twin half-blastocysts to foster mothers. We
found that this doubled the frequency of singletons and twins
recovered in comparison with 2i-untreated control twins (two
singletons and three pairs of twins versus two singletons and
one pair of twins, respectively; p < 0.05; Figure 3D). This provides
further support for the notion that developmental success relies
on adequate generation of a pluripotent cell population, and that
regulative development can be enhanced by treatments that
expand the pluripotent domain.
The Degree of 2i-Mediated Rescue Reflects theDevelopmental Potential of Four-Cell BlastomeresBecause we were able to identify a protocol that would increase
the efficiency of twinning, we considered whether it might also
be possible to rescue the development of embryos generated
from individual four-cell-stage blastomeres (referred to as
quarter embryos), which are known to form trophoblastic vesi-
cles and die after implantation (Rossant, 1976; Tarkowski and
Wroblewska, 1967). To determine this, we dissociated cells of
the four-cell embryo and then exposed individual blastomeres
transiently to 2i, followed by culture to the blastocyst stage, as
for half-size embryos. We found that these 2i-treated quarter
embryos had as much as 3-fold more EPI cells (as assessed
byNanog expression) comparedwith quartered control embryos
(n = 30 cells, p < 0.01, t-test; Figure 3E). However, the number of
EPI cells in these 2i-treated quarter embryos did not reach the
minimum threshold of four, and upon transfer to fosters, no
embryos developed to E6.5 (0/20 untreated, 0/20 treated, three
experiments; data not shown).
We observed that the quarter embryos differed in their ability
to generate pluripotent cells (6/14, 43%, with evident ICM),
even after 2i treatment through to E4.5 to maximize EPI, at the
expense of PE. We wondered whether this could be explained
by the known different developmental histories/origins of the
blastomeres. To address this, we monitored division patterns
at the two- to four-cell transition, as before, to identify individual
four-cell blastomeres, and then cultured them to the blastocyst
stage. This revealed that only embryos derived from AV blasto-
meres reliably generated pluripotent cells (Figure 3F), in agree-
ment with our findings in half embryos. Together, these results
indicate that blastomeres at the four-cell stage differ in their
potential to regulate development.
Establishing ES Cell Lines while MaintainingEmbryo ViabilityKnowing the developmental properties of different embryo
fragments led us to explore whether it might be possible to split
(B) EPI number in chimeric half embryos constructed from blastomeres with full d
(C) Development to postimplantation stages (E6.5) of H2B-GFP transgenic half e
carriers.
(D) Development to term of H2B-GFP transgenic half embryos with low or high E
Scale bars: 50 mM (A), 100 mM (C), and 10 mM (D, inset); 1 cm2 grid (D). All error
C
an embryo into two parts—one that could develop fully and
one that could reliably generate a pluripotent cell line for that
individual. Considering that quarter-embryo development could
not be fully rescued, removing a quarter fragment did not
seem appropriate to achieve this goal. Therefore, we decided
to remove three blastomeres from an eight-cell embryo (this
also avoids selecting only cells derived from compromised
V cells). We found that blastocysts developed from these three
blastomeres possessed an average of three EPI cells (Figure 4A).
In contrast, the remaining five blastomeres developed into
blastocysts containing more than five EPI cells (Figure 4A),
which, as we show here, should be a sufficient number for
development to birth. To check whether this is indeed the
case, we transferred the 5/8th part embryos to foster mothers
and found that they developed to term, similarly to whole
embryos (six out of eight 5/8th embryos versus five out of six
whole embryos developed to give P14 pups; Figure 4F). In
contrast, the 3/8th blastocysts did not develop following their
transfer (n = 13, data not shown).
To determine whether the 3/8th blastocysts could provide
a source of stem cells, we stimulated their inner cell allocation
using 2i, followed by ESC derivation (n = 14/17, 82%; Figures
4B, S3A, and S3B; Extended Experimental Procedures). This
allowed us to establish six independent ESC lines with an
overall efficiency of 82% (Figures 4C, S3, and S4) that con-
tributed to all germ layers, demonstrating their pluripotency
(Figures 4D, 4E, and S5). These results indicate that three
eight-cell blastomeres provide the minimum developmental
unit required to reliably establish pluripotent ESCs but not
embryo viability.
ConclusionsOur results indicate that for regulative development to be
successful, a critical minimum number of four pluripotent cells
must be generated before implantation, and this can be com-
promised by the strict developmental clock of cell polarization,
cell internalization, and blastocyst formation. This limitation
can be overcome by increasing the number of pluripotent cells
by modulating Fgf and Wnt signaling. Although blastomeres
separated at the two-cell stage can be rescued by this treatment,
blastomeres separated at the four-cell stage cannot. Knowing
the precise number of pluripotent cells required for development
to birth, and that not all blastomeres have equal potential
enabled us to devise a regime for splitting an embryo into two
parts: one that develops to birth and one that provides a source
of ESCs.
EXPERIMENTAL PROCEDURES
Embryo Culture and Disaggregation
Two-cell mouse embryos were collected in M2 medium from superovulated
(C57BL/6xCBA) females mated with wild-type, transgenic CAG::GFP-GPI
evelopmental potential (AV), reduced potential (A), and restricted potential (V).
mbryos grouped according to EPI number, relative to wild-type whole-embryo
PI number, relative to wild-type whole-embryo carriers.
bars indicate standard error. See also Figure S2.
ell Reports 2, 756–765, October 25, 2012 ª2012 The Authors 761

Figure 3. Rescue of Half-Embryo Development
(A) Nanog, Sox17, and Cdx2 immunostaining (projection) of 2i-treated (from four-cell stage to late blastocyst) and untreated half embryos: ICM and TE numbers.
(B) Nanog, Sox17, and Cdx2 immunostaining (projection) of transiently 2i-treated and untreated half embryos: EPI and PE numbers.
(C) Development to postimplantation stages (E6.5) of 2i-treated and untreated H2B-GFP transgenic half embryos, relative to wild-type whole-embryo carriers.
(D) Development to postimplantation stages (E6.5) of 2i-treated and untreated H2B-GFP transgenic twins (*p < 0.05, chi-square test).
(E) Attempted rescue of quarter-embryo development. Nanog, Sox17, and Cdx2 immunostaining (projection) of 2i-treated and untreated half embryos: EPI and
PE numbers.
(F) ICM size (Nanog immunostaining, projection) in 2i-treated quarter embryos with known full developmental potential (AV-derived), and restricted potential
(A- or V-derived).
Scale bars: 50 mM (A), 100 mM (B), and 50 mM (C and D). All error bars indicate standard error.
(Rhee et al., 2006) or H2B-GFP (Hadjantonakis and Papaioannou, 2004)males.
Half and quarter embryos were generated following zona pellucida removal,
with acidic Tyrode’s solution and pipetting to separate blastomeres. Embryos
762 Cell Reports 2, 756–765, October 25, 2012 ª2012 The Authors
were cultured in KSOM medium in 5% CO2 as previously described (Morris
et al., 2010). For half- and quarter-embryo rescues, KSOMwas supplemented
with 2i (1 mM PD0325901 and 3 mM Chiron; Cayman Chemical).

Figure 4. Generation of ESCs and Mice from Single Embryos
(A) Nanog, Sox17, and Cdx2 immunostaining of 5/8th and 3/8th blastocysts. Bar chart: EPI and PE numbers.
(B) Nanog and Oct4 immunostaining (single slice) of ES colonies derived from whole embryos and 3/8th blastocysts by immunosurgery, followed by culture in
2i+LIF. Nuclei were counterstained with DAPI.
(C) Nanog and Oct4 immunostaining (single slice) of ESC line 4, derived from H2B-GFP transgenic 3/8th embryos. Nuclei were counterstained with DAPI.
(D) Fluorescent and bright-field images of a chimera of a wild-type CBAxC57/BL6 embryo and H2B-GFP transgenic ESC line 4.
(E) Oct4 immunostaining of genital ridges from the embryo in (D) to visualize primordial germ cells derived from ESCs (white arrows). Nuclei were counterstained
with DAPI.
(F) Comparison of 2-week-old pups derived from 5/8th H2B-GFP embryos and wild-type whole-embryo littermates.
Scale bars: 50 mM (A–C), 1 mm (D), 50 mM (E, left panels), 10 mM (E, right panels), 10 mM (F, inset); 1 cm2 grid (F). All error bars indicate standard error. See also
Figures S3, S4, and S5.
Time-Lapse Imaging
Green-fluorescence and transmitted-light multisection images were acquired
every 15 min with a Hamamatsu ORCA ER CCD camera on 15 focal planes
every 4 mm, with an exposure of 4 ms for transmitted light and 200 ms for
C
fluorescence for 3 days. SimiBiocell software was used for cell tracking
(Bischoff et al., 2008). An Intelligent Imaging Solutions Spinning Disk confocal
microscope was used to image cell internalization by acquiring red-fluores-
cence and transmitted-light multisection images.
ell Reports 2, 756–765, October 25, 2012 ª2012 The Authors 763

Microinjection with mRNAs for GAP43-RFP or E-cadherin-GFP at a concen-
tration of 400 ng/ml, synthesized from the pRN3P construct, was carried out
as previously described (Zernicka-Goetz et al., 1997).
Immunostaining was carried out as previously described (Torres-Padilla
et al., 2007) with the following primary antibodies: goat anti-Sox17 (R&D
Systems), rabbit anti-Nanog (Abcam), mouse anti-Cdx2 (BioGenex), rabbit
anti-aPKCz (Santa Cruz), and mouse anti-Oct4. Nuclei were counterstained
with either DAPI or Hoechst.
Monitoring the Cleavage Pattern
Embryos were microinjected with rhodamine dextran at the two-cell stage,
and division orientation was monitored every 15 min until the three- and
four-cell stages. Embryos were grouped according to cleavage orientation
and sequence as described by Piotrowska-Nitsche et al. (2005), followed by
disaggregation and culture as quarter embryos or reaggregation into half
embryos.
Development of Embryos to E6.5, E11.5, or Term
To assess development, half, quarter, biopsied 5/8th embryos and 3/8th
embryos were transferred to pseudopregnant females (Weber et al., 1999).
Manipulated embryos from transgenic H2B-GFP mice were transferred
along with wild-type carriers to monitor the efficiency of transfer.
SUPPLEMENTAL INFORMATION
Supplemental Information includes Extended Experimental Procedures, five
figures, and four movies and can be found with this article online at http://
dx.doi.org/10.1016/j.celrep.2012.08.029.
LICENSING INFORMATION
This is an open-access article distributed under the terms of the Creative
Commons Attribution 3.0 Unported License (CC-BY; http://creativecommons.
org/licenses/by/3.0/legalcode).
ACKNOWLEDGMENTS
We thank Lewis Wolpert for the inspiration for this study; Sean Jeffries, Harry
Leitch, and David Glover for discussions; Emma Rawlins for help with imaging
the E11.5 embryos; and the M.Z.G. group for support. This work was sup-
ported by a Wellcome Trust grant to M.Z.G.
Received: July 9, 2012
Revised: August 15, 2012
Accepted: August 27, 2012
Published online: October 4, 2012
REFERENCES
Bischoff, M., Parfitt, D.E., and Zernicka-Goetz, M. (2008). Formation of the
embryonic-abembryonic axis of the mouse blastocyst: relationships between
orientation of early cleavage divisions and pattern of symmetric/asymmetric
divisions. Development 135, 953–962.
Chazaud, C., Yamanaka, Y., Pawson, T., and Rossant, J. (2006). Early lineage
segregation between epiblast and primitive endoderm in mouse blastocysts
through the Grb2-MAPK pathway. Dev. Cell 10, 615–624.
Eakin, G.S., and Hadjantonakis, A.K. (2006). Production of chimeras by aggre-
gation of embryonic stem cells with diploid or tetraploid mouse embryos. Nat.
Protoc. 1, 1145–1153.
Hadjantonakis, A.K., and Papaioannou, V.E. (2004). Dynamic in vivo imaging
and cell tracking using a histone fluorescent protein fusion in mice. BMC
Biotechnol. 4, 33.
Jedrusik, A., Parfitt, D.E., Guo, G., Skamagki, M., Grabarek, J.B., Johnson,
M.H., Robson, P., and Zernicka-Goetz, M. (2008). Role of Cdx2 and cell
polarity in cell allocation and specification of trophectoderm and inner cell
mass in the mouse embryo. Genes Dev. 22, 2692–2706.
764 Cell Reports 2, 756–765, October 25, 2012 ª2012 The Authors
Johnson, M.H., and Ziomek, C.A. (1981). The foundation of two distinct cell
lineages within the mouse morula. Cell 24, 71–80.
Kelly, S.J. (1977). Studies of the developmental potential of 4- and 8-cell stage
mouse blastomeres. J. Exp. Zool. 200, 365–376.
Le Douarin, N., and McLaren, A. (1984). Chimeras in Developmental Biology
(London, Orlando: Academic Press).
McDole, K., Xiong, Y., Iglesias, P.A., and Zheng, Y. (2011). Lineage mapping
the pre-implantation mouse embryo by two-photon microscopy, new insights
into the segregation of cell fates. Dev. Biol. 355, 239–249.
Meilhac, S.M., Adams, R.J., Morris, S.A., Danckaert, A., Le Garrec, J.F., and
Zernicka-Goetz, M. (2009). Active cell movements coupled to positional
induction are involved in lineage segregation in the mouse blastocyst. Dev.
Biol. 331, 210–221.
Mintz, B. (1964). Formation of genetically mosaic mouse embryos, and
early development of ‘‘lethal (T12/T12)-normal’’ mosaics. J. Exp. Zool. 157,
273–292.
Morris, S.A. (2011). Cell fate in the early mouse embryo: sorting out the
influence of developmental history on lineage choice. Reprod. Biomed. Online
22, 521–524.
Morris, S.A., Teo, R.T., Li, H., Robson, P., Glover, D.M., and Zernicka-Goetz,
M. (2010). Origin and formation of the first two distinct cell types of the
inner cell mass in the mouse embryo. Proc. Natl. Acad. Sci. USA 107, 6364–
6369.
Nichols, J., Silva, J., Roode, M., and Smith, A. (2009). Suppression of Erk
signalling promotes ground state pluripotency in the mouse embryo. Develop-
ment 136, 3215–3222.
Nicholas, J.S., and Hall, B.V. (1942). Experiments on developing rats. II.
The development of isolated blastomeres and fused eggs. J. Exp. Zool. 90,
441–459.
Papaioannou, V.E., and Ebert, K.M. (1995). Mouse half embryos: viability and
allocation of cells in the blastocyst. Dev. Dyn. 203, 393–398.
Pedersen, R.A., Wu, K., and Ba1akier, H. (1986). Origin of the inner cell mass
in mouse embryos: cell lineage analysis by microinjection. Dev. Biol. 117,
581–595.
Piotrowska-Nitsche, K., and Zernicka-Goetz, M. (2005). Spatial arrangement
of individual 4-cell stage blastomeres and the order in which they are gener-
ated correlate with blastocyst pattern in the mouse embryo. Mech. Dev.
122, 487–500.
Piotrowska-Nitsche, K., Perea-Gomez, A., Haraguchi, S., and Zernicka-Goetz,
M. (2005). Four-cell stage mouse blastomeres have different developmental
properties. Development 132, 479–490.
Plusa, B., Frankenberg, S., Chalmers, A., Hadjantonakis, A.K., Moore, C.A.,
Papalopulu, N., Papaioannou, V.E., Glover, D.M., and Zernicka-Goetz, M.
(2005). Downregulation of Par3 and aPKC function directs cells towards the
ICM in the preimplantation mouse embryo. J. Cell Sci. 118, 505–515.
Plusa, B., Piliszek, A., Frankenberg, S., Artus, J., and Hadjantonakis, A.K.
(2008). Distinct sequential cell behaviours direct primitive endoderm formation
in the mouse blastocyst. Development 135, 3081–3091.
Rhee, J.M., Pirity, M.K., Lackan, C.S., Long, J.Z., Kondoh, G., Takeda, J., and
Hadjantonakis, A.K. (2006). In vivo imaging and differential localization of
lipid-modified GFP-variant fusions in embryonic stem cells and mice. Genesis
44, 202–218.
Rossant, J. (1976). Postimplantation development of blastomeres isolated
from 4- and 8-cell mouse eggs. J. Embryol. Exp. Morphol. 36, 283–290.
Rossant, J., and Lis, W.T. (1979). Potential of isolated mouse inner cell masses
to form trophectoderm derivatives in vivo. Dev. Biol. 70, 255–261.
Tarkowski, A.K. (1959). Experiments on the development of isolated blasto-
mers of mouse eggs. Nature 184, 1286–1287.
Tarkowski, A.K. (1961). Mouse chimaeras developed from fused eggs. Nature
190, 857–860.

Tarkowski, A.K., and Wroblewska, J. (1967). Development of blastomeres of
mouse eggs isolated at the 4- and 8-cell stage. J. Embryol. Exp. Morphol.
18, 155–180.
Torres-Padilla, M.E., Parfitt, D.E., Kouzarides, T., and Zernicka-Goetz, M.
(2007). Histone arginine methylation regulates pluripotency in the early mouse
embryo. Nature 445, 214–218.
Tsunoda, Y., and McLaren, A. (1983). Effect of various procedures on the
viability of mouse embryos containing half the normal number of blastomeres.
J. Reprod. Fertil. 69, 315–322.
Weber, R.J., Pedersen, R.A., Wianny, F., Evans, M.J., and Zernicka-Goetz, M.
(1999). Polarity of the mouse embryo is anticipated before implantation.
Development 126, 5591–5598.
C
Yamanaka, Y., Lanner, F., and Rossant, J. (2010). FGF signal-dependent
segregation of primitive endoderm and epiblast in the mouse blastocyst.
Development 137, 715–724.
Ying, Q.L., Wray, J., Nichols, J., Batlle-Morera, L., Doble, B., Woodgett, J.,
Cohen, P., and Smith, A. (2008). The ground state of embryonic stem cell
self-renewal. Nature 453, 519–523.
Zernicka-Goetz, M., Pines, J., McLean Hunter, S., Dixon, J.P.C., Siemering,
K.R., Haseloff, J., and Evans,M.J. (1997). Following cell fate in the livingmouse
embryo. Development 124, 1133–1137.
Zernicka-Goetz, M., Morris, S.A., and Bruce, A.W. (2009). Making a firm
decision: multifaceted regulation of cell fate in the early mouse embryo. Nat.
Rev. Genet. 10, 467–477.
ell Reports 2, 756–765, October 25, 2012 ª2012 The Authors 765

Supplemental Information
EXTENDED EXPERIMENTAL PROCEDURES
Derivation of ES Colonies and ESC LinesWhole, quarter, and 3/8th embryos were cultured from the 8-cell stage (or the developmental equivalent) to early blastocyst stage in
KSOM+2i at 37�C, under 5% CO2, followed by 2 days of culture in N2B27+2i+LIF under the same conditions (Nichols et al., 2009).
ICM was recovered from the resulting expanded blastocysts by immunosurgery (Solter and Knowles, 1975), followed by culture on
laminin (Sigma L2020, 10 mg/ml) coated tissue culture plastic in N2B27+2i+LIF until the colonies had attached and significantly
increased in size (3-4 days). ES colonies were recovered by mouth pipette and disaggregated to single cells with 0.25% Trypsin
(Invitrogen) and plated on laminin-coated tissue culture plastic to establish ESC lines. Lines were passaged at least 5 times before
assessment of pluripotency by Nanog/Oct4 immunostaining and tissue contribution in chimeric embryos.
ChimerasThe pluripotency of H2B-GFP transgenic embryo-derived ESC lines was assessed by aggregation of small clumps of ES cells (10-15
cells) with wild-type C57BL/6xCBA embryos at the uncompacted 8-cell stage (Eakin and Hadjantonakis, 2006). These aggregation
chimeras were cultured until the early blastocyst stage and then transferred to foster females. Foetuses were recovered at E11.5.
Wholemount, 2-channel GFP and brightfield imaging was performed on a Zeiss inverted fluorescent dissection microscope.
Germline contribution was assessed by dissection of genital ridges and immunostaining of Oct4 to visualize H2B-GFP ESC contri-
bution to PGCs.
SUPPLEMENTAL REFERENCES
Eakin, G.S., and Hadjantonakis, A.K. (2006). Production of chimeras by aggregation of embryonic stem cells with diploid or tetraploid mouse embryos. Nat. Pro-
toc. 1, 1145–1153.
Nichols, J., Silva, J., Roode, M., and Smith, A. (2009). Suppression of Erk signaling promotes ground state pluripotency in the mouse embryo. Development 136,
3215–3222.
Solter, D., and Knowles, B.B. (1975). Immunosurgery of mouse blastocyst. Proc. Natl. Acad. Sci. USA 72, 5099–5102.
Cell Reports 2, 756–765, October 25, 2012 ª2012 The Authors S1

Figure S1. Time-Lapse Imaging and Lineage Tracing in Half Embryos, Related to Figure 1(A) Nanog and Sox17 immunostaining of EPI and PE, respectively, in imaged and cultured embryos shows that imaging conditions do not adversely affect
development or ICM cell sorting.
(B) Developmental origin, initial ICM position, and final fate of cells tracked in half embryos. Wave-2-derived cells initially are correctly positioned at the ICM
surface.Wave-1-derived cells positioned deep are most likely to be eliminated by apoptosis, a mechanism also employed by whole embryos (Morris et al., 2010).
(C) Incidence of apoptosis in half embryos. The average is similar to that previously reported for whole embryos (Morris et al., 2010).
(D) Multiple z-slices of a GAP43-RFP-expressing half embryo at a single time point. The yellow arrow marks an outside cell in the process of engulfment,
maintaining some small amount of outside contact. The red arrow marks a fully engulfed cell in the inside compartment.
All error bars indicate standard error.
S2 Cell Reports 2, 756–765, October 25, 2012 ª2012 The Authors

Figure S2. Half-Embryo Blastocyst Composition, Related to Figure 2
(A) Relationship between PE and EPI numbers in late-blastocyst-stage half embryos as assessed by Sox17 and Nanog immunostaining. EPI number correlates
with PE number.
(B) Relationship between ICM and TE numbers in late-blastocyst-stage half embryos as assessed by Sox17, Nanog, and Cdx2 immunostaining. There is no
significant correlation between ICM and TE numbers. n = 50 half embryos.
(C–E) EPI and PE numbers (C), TE number (D), and survival rates (E) of all embryo fragments and whole embryos observed in this study. The PE and TE numbers
do not significantly vary between untreated and 2i-rescued half embryos, whereas EPI number significantly increases. Thus, the increased survival rate of
2i-rescued half embryos can be accounted for by the increased EPI population.
All error bars indicate standard error.
Cell Reports 2, 756–765, October 25, 2012 ª2012 The Authors S3
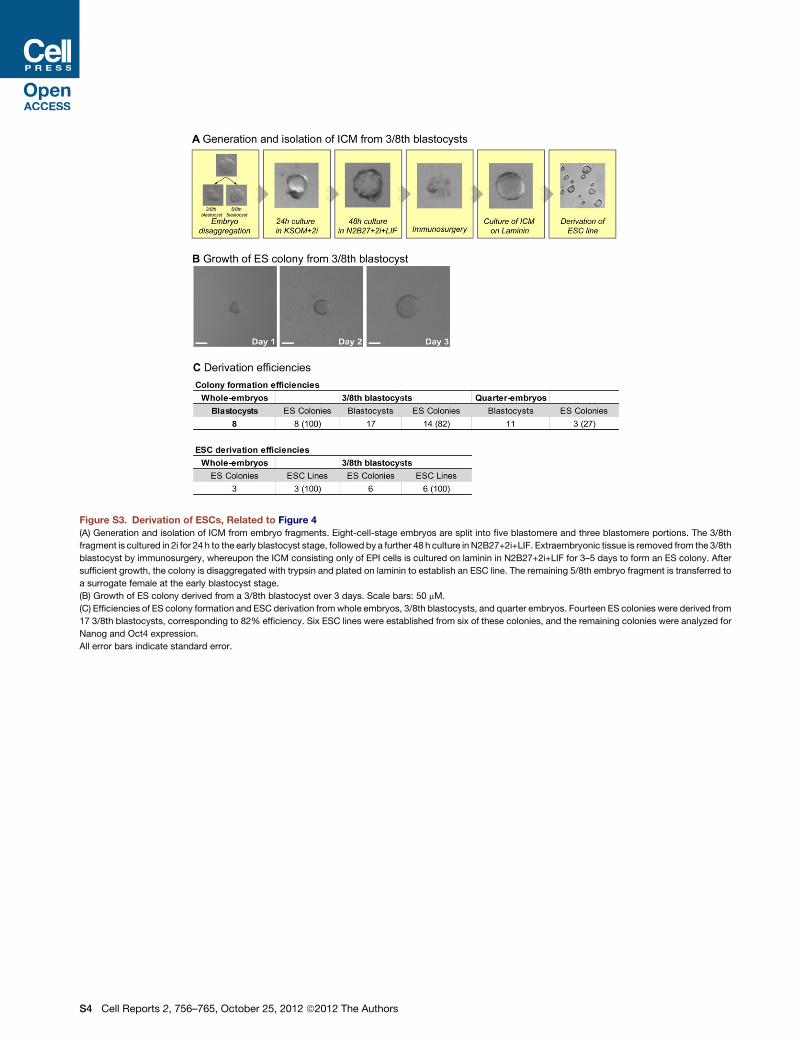
Figure S3. Derivation of ESCs, Related to Figure 4
(A) Generation and isolation of ICM from embryo fragments. Eight-cell-stage embryos are split into five blastomere and three blastomere portions. The 3/8th
fragment is cultured in 2i for 24 h to the early blastocyst stage, followed by a further 48 h culture in N2B27+2i+LIF. Extraembryonic tissue is removed from the 3/8th
blastocyst by immunosurgery, whereupon the ICM consisting only of EPI cells is cultured on laminin in N2B27+2i+LIF for 3–5 days to form an ES colony. After
sufficient growth, the colony is disaggregated with trypsin and plated on laminin to establish an ESC line. The remaining 5/8th embryo fragment is transferred to
a surrogate female at the early blastocyst stage.
(B) Growth of ES colony derived from a 3/8th blastocyst over 3 days. Scale bars: 50 mM.
(C) Efficiencies of ES colony formation and ESC derivation fromwhole embryos, 3/8th blastocysts, and quarter embryos. Fourteen ES colonies were derived from
17 3/8th blastocysts, corresponding to 82% efficiency. Six ESC lines were established from six of these colonies, and the remaining colonies were analyzed for
Nanog and Oct4 expression.
All error bars indicate standard error.
S4 Cell Reports 2, 756–765, October 25, 2012 ª2012 The Authors

Figure S4. ESC Lines Derived from 3/8th Embryos, Related to Figure 4
All six ESC lines derived from H2B-GFP transgenic 3/8th embryos were imaged in culture (differential interference contrast) and following fixation were
immunostained for Nanog and Oct4. Nuclei were counterstained with DAPI. ESCs derived from wild-type whole embryos were derived and immunostained for
comparison. Scale bars: 50 mM. All error bars indicate standard error.
Cell Reports 2, 756–765, October 25, 2012 ª2012 The Authors S5

Figure S5. ESC Contribution to Chimeras, Related to Figure 4
Three of the six ESC lines derived from 3/8th embryos were aggregated with wild-type embryos at the eight-cell stage and transferred to surrogate females at the
early blastocyst stage. Embryos recovered at E11.5 were imaged under fluorescence and bright field to visualize tissues derived from H2B-GFP ESC cells.
Tissues from all three germ layers were extensively contributed by all three ESC lines tested. Incidence of chimerism: ESC line 2: four of four embryos chimeric;
ESC line 4: four of four embryos chimeric; ESC line 5: two of three embryos chimeric. A wild-type embryo is included for comparison. Scale bars: 1 mm. All error
bars indicate standard error.
S6 Cell Reports 2, 756–765, October 25, 2012 ª2012 The Authors