cell-type-selective effects of intramembrane cavitation as ... filenovel tools and methods...
TRANSCRIPT

Novel Tools and Methods
Cell-Type-Selective Effects of IntramembraneCavitation as a Unifying Theoretical Frameworkfor Ultrasonic Neuromodulation1,2,3
Michael Plaksin, Eitan Kimmel, and Shy Shoham
DOI:http://dx.doi.org/10.1523/ENEURO.0136-15.2016
Faculty of Biomedical Engineering and Russell Berrie Nanotechnology Institute, Technion-Israel Institute ofTechnology, Haifa 32000, Israel
AbstractDiverse translational and research applications could benefit from the noninvasive ability to reversibly modulate(excite or suppress) CNS activity using ultrasound pulses, however, without clarifying the underlying mechanism,advanced design-based ultrasonic neuromodulation remains elusive. Recently, intramembrane cavitation withinthe bilayer membrane was proposed to underlie both the biomechanics and the biophysics of acoustic bio-effects, potentially explaining cortical stimulation results through a neuronal intramembrane cavitation excitation(NICE) model. Here, NICE theory is shown to provide a detailed predictive explanation for the ability of ultrasonic(US) pulses to also suppress neural circuits through cell-type-selective mechanisms: according to the predictedmechanism T-type calcium channels boost charge accumulation between short US pulses selectively in lowthreshold spiking interneurons, promoting net cortical network inhibition. The theoretical results fit and clarify awide array of earlier empirical observations in both the cortex and thalamus regarding the dependence ofultrasonic neuromodulation outcomes (excitation-suppression) on stimulation and network parameters. Theseresults further support a unifying hypothesis for ultrasonic neuromodulation, highlighting the potential of ad-vanced waveform design for obtaining cell-type-selective network control.
Key words: action potential; Hodgkin and Huxley; model; neurons; T-type calcium channels; ultrasound
IntroductionBoth classical and recently emerging data have dem-
onstrated that the interaction of therapeutic ultrasound(US) and excitable tissues leads to a diverse and complex
set of reversible physiological phenomena which are col-lectively referred to as ultrasonic neuromodulation (Bys-tritsky et al., 2011; Yoo et al., 2011a; Kim et al., 2015; Naoret al., 2016). US-induced neuromodulation phenomena
Received November 12, 2015; accepted May 10, 2016; First published May 31,2016.1The authors report no conflict of interest.
2Author contributions: M.P., E.K., and S.S. designed research; M.P. per-formed research; M.P., E.K., and S.S. analyzed data; M.P., E.K., and S.S. wrotethe paper.
Significance Statement
Recent studies have demonstrated that ultrasound waves are capable of stimulating or suppressing neuralcircuits, thereby opening up an important new route toward targeted noninvasive neuromodulation. However,the underlying mechanism for ultrasonically eliciting specific neuromodulatory effects has not been clarified. Ournew theoretical analysis reveals that ultrasound can selectively excite different cortical neuron subtypes simplyby changing the stimulation pattern, driven by the response properties of T-type calcium channels. Interestingly,the model’s predictions at the single-neuron and network levels are shown to closely agree with and explain theemerging field’s entire body of experimental results, spanning from rodents to humans, and can thus facilitatethe development of new ways of treating or diagnosing brain disorders.
New Research
May/June 2016, 3(3) e0136-15.2016 1–16

include the generation of action potentials (APs) in CNSneurons in the brain (Tyler et al., 2008; Tufail et al., 2010,2011; Kim et al., 2012, 2014; King et al., 2013, 2014) andthe retina (Naor et al., 2012; Menz et al., 2013), suppres-sion of CNS activity (Yoo et al., 2011a; Min et al., 2011;Kim et al., 2015) and of nerve conduction (Young andHenneman, 1961; Lele, 1963; Colucci et al., 2009), as wellas more subtle changes in excitability (Moore et al., 2000;Tsui et al., 2005). The development of ultrasonic neuro-modulation is largely motivated by future therapeutic ap-plications. This is the only neuromodulation technologycurrently capable of being selective, targeted, reversibleand noninvasive with millimeter-scale precision essen-tially across the entire human and nonhuman primatebrain (Deffieux et al., 2013; Coluccia et al., 2014; Legonet al., 2014; Lee et al., 2015) and peripheral nervoussystem (Tsui et al., 2005; Colucci et al., 2009; Juan et al.,2014). Although ultrasonic neuromodulation phenomenacould potentially result from a diverse set of differentbiophysical interaction modes, including temperature el-evation (Lele, 1963; Colucci et al., 2009), acoustic stream-ing (Tyler, 2011), radiation pressure (Tyler, 2011; Prietoet al., 2013), and stable or inertial cavitation (Tyler, 2011),only the recently proposed intramembrane cavitation hy-pothesis (Krasovitski et al., 2011) and the related neuronalintramembrane cavitation excitation (NICE) model (Plaksinet al., 2014) have led to a detailed predictive explanationof specific empirical results for CNS stimulation by low-intensity US. In the NICE framework, US-induced oscilla-tory expansions and contractions of small membraneregions, the bilayer sonophores (BLSs; Krasovitski et al.,2011), cause capacitive displacement currents that indi-rectly lead to slow membrane charge accumulation (on atime scale of tens of milliseconds), ultimately bringing theneurons to their AP discharge threshold. The NICE modelexplains the basic features of acoustic cortical neuro-stimulation of pyramidal neurons, including the long du-rations required and the apparent higher efficiency ofcontinuous wave (CW) versus pulse-mode (discontinu-ous) stimulation (Tufail et al., 2010, 2011; King et al.,2013), and its predictions have a very good agreementwith the recent experimental results of detailed para-meter-dependent efficacy for mouse motor cortex directultrasonic stimulation (King et al., 2013). In contrast, thebiophysical basis of CNS neural suppression (Yoo et al.,2011a; Kim et al., 2015) remains elusive, and the ability todifferentially mediate suppression simply by varying thestimulation parameters, did not receive a rigorous, quan-
titative, and predictive treatment. Fundamentally, it is un-clear whether suppression is mediated by directlysuppressing active excitatory neurons, by activating in-hibitory neurons, or by depleting excitatory synapticpools, to mention just a few possibilities.
Here, we extend the emerging intramembrane cavita-tion framework to examine the predicted effects of US onadditional cell types and stimulation modes. We analyzethe effect of pulsed mode US with parameters rangingfrom CW to low duty-cycle (previously shown to suppresscortical and thalamic activity; Yoo et al., 2011a; Min et al.,2011; Kim et al., 2015) on NICE-type models of multipletypes of cortical neurons and related thalamic neurons.The new analysis reveals that low-threshold spiking (LTS)inhibitory cortical neurons (Pospischil et al., 2008) andmajor types of thalamic neurons (Destexhe et al., 1998a)are hyper-sensitive during discontinuous pulsed US stim-ulation. In these neurons, the presence of T-type voltage-gated calcium channels boosts charge accumulationbetween the short US bursts, leading to their selectiveactivation when low duty-cycle waveforms are applied.These differential US-induced responses of differentcell types are shown to explain the emergence of neu-romodulation parameter ranges for obtaining networkstimulation or suppression that match and clarify em-pirical parameter choices. Moreover, how these effec-tive parameter ranges are modulated by baseline inputinto the cortical network provide further empirical pre-dictions regarding the dependence on thalamic input,anesthetic modulation, etc.
Theoretical frameworkThe biomechanical-biophysical models
We simulated and analyzed the expected effect of USon five types of mammalian cortical and thalamic celltypes where detailed BLS-type membrane interactionsare coupled with Hodgkin-Huxley (H&H) single-compartmentmodels of three cortical neuron types (Pospischil et al.,2008) and two central types of thalamic neurons(Destexhe et al., 1998a). The cortical neuron types includean excitatory regular spiking (RS) pyramidal neuron andtwo principal models for cortical inhibitory interneurons:LTS and fast spiking (FS) neurons, whereas the thalamictypes included thalamocortical (TC) and thalamic reticular(RE) neurons. The various NICE model parameters weretaken “as is” without retuning or post hoc adjustments,and are generally based on previously measured or esti-mated physical and biophysical quantities (summarized inTable 1 with the respective sources). In the model, acircular, uniform phospholipid bilayer membrane dome isbounded between immobile protein islands (Fig. 1A; Plak-sin et al.,2014); structured intramembrane cavities appearto be consistent with the observed clustering of proteindistributions in real cells’ membranes (Lillemeier et al.,2006, their Fig. 1, where protein-free patches of 50–100nm diameters are evident). Electrically, the bilayer mem-brane has a varying capacitance, and each ion has aNernst equilibrium potential and a time-dependent con-ductance (Fig. 1A, right), which generally depends on the
3This work was supported by the MAGNET program of the Israeli OCS at theministry of economy, the Russell Berrie Nanotechnology Institute, and theIsrael Science Foundation Grant 1725/13. We thank Steve Krupa, RomanShusterman, Omer Naor, Amit Livneh, and Josh Nehrer for their comments onthe paper.
Correspondence should be addressed to either Shy Shoham or Eitan Kim-mel, Technion-Israel Institute of Technology, Haifa 32000, Israel, E-mail:[email protected] or [email protected].
DOI:http://dx.doi.org/10.1523/ENEURO.0136-15.2016Copyright © 2016 Plaksin et al.This is an open-access article distributed under the terms of the CreativeCommons Attribution 4.0 International, which permits unrestricted use, distri-bution and reproduction in any medium provided that the original work isproperly attributed.
New Research 2 of 16
May/June 2016, 3(3) e0136-15.2016 eNeuro.sfn.org

Table 1. Biomechanical and biophysical parameters for the simulation runsParameter Symbol Unit Value Source
Biomechanical Parameters1 Thickness of the leaflet �0 nm 2 Plaksin et al., 20142 Initial gap between the two leaflets (uncharged) �� 1.43 Initial gap between the two leaflets (when charged) � 1.26 (RS) Calculated from equilibrium
state using Plaksin et al.,
2014, their Eq. 2
4 1.26 (FS)5 1.3 (LTS)6 1.28 (TC)7 1.21 (RE)8 Attraction/repulsion pressure coefficient Ar Pa 105 Plaksin et al., 20149 Exponent in the repulsion term x — 510 Exponent in the attraction term y — 3.311 Dynamic viscosity of the leaflets �s Pa·s 0.03512 Dynamic viscosity of the surrounding medium �I 0.7·10�3
13 Diffusion coefficient of air in the surrounding medium Da m2·s�1 3·10�9
14 Density of the surrounding medium �l kg·m�3 102815 Speed of sound in the surrounding medium c m·s�1 151516 Initial air molar concentration in the surrounding medium (O2�N2) Ca mol·m�3 0.6217 Henry’s constant for dissolved air in the surrounding medium ka Pa·m3·mol�1 1.63·105
18 Static pressure in the surrounding medium P0 Pa 105
19 Radius of the leaflets’ boundary a nm 3220 Width of the boundary layer between the surrounding medium and the leaflets � 0.521 Areal modulus of the bilayer membrane ks N·m�1 0.2422 Relative permittivity of the intramembrane cavity �r — 123 Membrane baseline capacitance per unit area Cm0
�F·cm�2 124 Surrounding medium temperature Tem K 309.15 Pospischil et al., 2008;
Destexhe et al., 1998aBiophysical parameters25 Maximal conductance of Na� channels G�
Na� mS·cm�2 56 (RS) Pospischil et al., 200850 (RS; Fig. 7)
26 58 (FS)50 (FS; Fig. 7)
27 50 (LTS)28 90 (TC) Destexhe et al., 1998a29 200 (RE)30 Maximal conductance of delayed-rectifier K� channels G�
K� 6 (RS) Pospischil et al., 20085 (RS; Fig. 7)
31 3.9 (FS)10 (FS; Fig. 7)
32 4 (LTS)5 (LTS; Fig. 7)
33 10 (TC) Destexhe et al., 1998a34 20 (RE)35 Maximal conductance of slow non-inactivating K� channels G� M 0.075 (RS) Pospischil et al., 2008
0.07 (RS; Fig. 7)36 0.0787 (FS)
0 (FS; Fig. 7)37 0.028 (LTS)
0.03 (LTS; Fig. 7)38 Maximal conductance of low-threshold Ca2� channels G� T 0.4 (LTS)39 2 (TC) Destexhe et al., 1998a40 Maximal conductance of low- threshold Ca2� channels G� Ts
3 (RE)41 Maximal conductance of leak potassium currents G� KL
� 0.0138 (TC)42 Maximal conductance of hyperpolarization-activated mixed cationic current G� h 0.0175 (TC)43 Maximal conductance of non-voltage-dependent, nonspecific ions channels G� Leak 0.0205 (RS) Pospischil et al., 2008
0.1 (RS; Fig. 7)44 0.038 (FS)
0.15 (FS; Fig. 7)45 0.019 (LTS)
0.01 (LTS; Fig. 7)46 0.01 (TC) Destexhe et al., 1998a47 0.05 (RE)48 Nernst potential of Na� V
Na� mV 50 Pospischil et al., 200849 Nernst potential of K� V
K� �9050 Nernst potential of Ca2� (LTS neuron) V
Ca2� 12051 Reversal potential of a hyperpolarization-activated mixed cationic current Vh �40 Destexhe et al., 1996a52 Nernst potential of non-voltage-dependent, nonspecific ion channels VLeak �70.3 (RS) Pospischil et al., 2008
�70 (RS; Fig. 7)53 �70.4 (FS)
�70 (FS; Fig. 7)54 �50 (LTS)
�85 (LTS; Fig. 7)55 �70 (TC) Destexhe et al., 1998a56 �90 (RE)57 Spike threshold adjustment parameter VT �56.2 (RS) Pospischil et al., 2008
�55 (RS; Fig. 7)58 �57.9 (FS)
�55 (FS; Fig. 7)(Continued)
New Research 3 of 16
May/June 2016, 3(3) e0136-15.2016 eNeuro.sfn.org

product probabilities of multiple voltage-dependent gates(M and H gates for sodium channels; N and P gates forpotassium channels and S and U for calcium channels;Pospischil et al., 2008). When US is applied, the mem-brane leaflets oscillate according to modified Rayleigh–
Plesset bubble dynamics (Krasovitski et al., 2011),causing oscillatory variations in the membrane capaci-tance (Fig. 1B), which lead to an oscillatory displacementcurrent VmdCm/dt that directly modulates the membranepotential (Plaksin et al., 2014). The responses of the
Table 1. ContinuedParameter Symbol Unit Value Source
59 �50 (LTS)�55 (LTS; Fig. 7)
60 �52 (TC) Destexhe et al., 1998b61 �67 (RE) Destexhe et al., 1996b62 Decay time constant for adaptation at slow non-inactivating K� channels max ms 608 (RS) Pospischil et al., 2008
1000 (RS; Fig. 7)63 502 (FS)
1000 (FS; Fig. 7)64 4000 (LTS)
1000 (LTS; Fig. 7)65 The resting potential of the cell membrane Vm0
mV �71.9 (RS) Calculated from Pospischil et al., 2008�70.4 (RS; Fig. 7)
66 �71.4 (FS)�70 (FS; Fig. 7)
67 �54 (LTS)�84.6 (LTS – Fig. 7)
68 �63.4 (TC) Calculated from Destexhe et al., 1998a69 �89.5 (RE)70 The effective depth beneath the membrane area for calcium concentration
calculations (for TC and RE neurons)
d nm 100 Destexhe et al., 1998a and Destexhe et al., 1996a
71 An extracellular Ca2� concentration (for TC and RE neurons) Cao2� mM 2
72 Decay time constants of Ca2� (for TC and RE neurons) Ca2� ms 5
73 Ih current Ca2� regulation factor k1 mM�4· ms�1 2.5·107
74 Ih current Ca2� regulation factor k2 ms�1 4·10�4
75 Ih current Ca2� regulation factor k3 0.176 Ih current Ca2� regulation factor k4 0.00177 FS to RS neuron thalamic input current ratio RTH — 1.4 Hayut et al., 201178 Thalamic DC current input to the RS neuron IThRS nA 0.17 Based on Destexhe and Paré.,199979 AMPA synaptic currents reversal potential VAMPA mV 0 Destexhe et al., 1996a80 GABAA synaptic currents reversal potential VGABAA
-8581 Total maximal synaptic conductance used for RS to RS connection g� RSRS �S 0.002 Calculated from Vierling-Claassen et al., 201082 Total maximal synaptic conductance used for RS to FS connection g� RSFS 0.0483 Total maximal synaptic conductance used for RS to LTS connection g� RSLTS 0.0984 Total maximal synaptic conductance used for FS to RS connection g� FSRS 0.01585 Total maximal synaptic conductance used for FS to FS connection g� FSFS 0.13586 Total maximal synaptic conductance used for FS to LTS connection g� FSLTS 0.8687 Total maximal synaptic conductance used for LTS to RS connection g� LTSRS 0.13588 Total maximal synaptic conductance used for LTS to FS connection g� LTSFS 0.0289 AMPA rise time constant t1 ms 0.1 Vierling-Claassen et al., 201090 AMPA decay time constant t2 391 GABAA rise time constant from FS neuron t1 0.592 GABAA decay time constant from FS neuron t2 893 GABAA rise time constant from LTS neuron t1 0.594 GABAA decay time constant from LTS neuron t2 5095 Short-term synaptic plasticity facilitation factor
(from RS to LTS)
f — 0.2
96 Short-term synaptic plasticity facilitation factor time constant
(from RS to LTS)
f ms 200
97 Short-term synaptic plasticity facilitation factor
(from RS to FS)
f — 0.5
98 Short-term synaptic plasticity facilitation factor time constant
(from RS to FS)
f ms 94
99 Short-term synaptic plasticity short-time depression factor
(from RS to FS)
d1 — 0.46
100 Short-term synaptic plasticity short-time depression factor time constant
(from RS to FS)
d1ms 380
101 Short-term synaptic plasticity long-time depression factor
(from RS to FS)
d2 — 0.975
102 Short-term synaptic plasticity long-time depression factor time constant
(from RS to FS)
d2ms 9200
103 Neuronal cell membrane area A �m2 11.88·103 (RS) Pospischil et al., 2008104 10.17·103 (FS)105 25·103 (LTS)106 29·103 (TC) Destexhe et al., 1998a107 14·103 (RE)
The synaptic strengths were calculated from Vierling-Claassen et al. (2010), multiplying their individual synaptic strengths by the average number of converg-ing connections from each type (Vierling-Claassen et al., 2010, their Table 3) and by the ratio of membrane areas between the NICE-neuron model and therespective model in their study. The latter normalization is consistent with an assumption that the total number of putative synapses on the dendrites andsoma are proportional to a neuron’s size (Gibbins et al., 1998).
New Research 4 of 16
May/June 2016, 3(3) e0136-15.2016 eNeuro.sfn.org

nanometer-scale BLS model to US are assumed to berepresentative of the responses of the whole cell; USwaves with sub-millihertz frequencies have wavelengthsof several millimeters, orders of magnitude larger than thedimensions of CNS cortical neuron somata, so all BLSelements are subject to essentially the same acousticeffect (Plaksin et al., 2014).
To explore the significance of network interactionsand baseline activity on acoustic neuromodulation weexplored the effect of US stimuli on a spiking corticalnetwork model with thalamic input (Fig. 1C; Hayut et al.,2011) where the RS, FS, and LTS cell types are cou-pled through excitatory (AMPA) and inhibitory (GABAA)synaptic connections whose strength and short-term
Figure 1. Cortical and thalamic NICE models. A, Geometrical and biophysical representation structure of the NICE models: topview (left) of the US-induced dome-shaped BLS intermembrane cavities (light gray) in the plasma membrane bare zones (darkgrey), bounded by cholesterol-rich protein islands (red areas). The equivalent electrical circuit of this biophysical complexstructure (right) includes a potential (Vm), time-varying capacitance (Cm), and Hodgkin–Huxley type ionic conductances (gi) andsources (Vi). Each neuron type channels’ composition is summarized in the neocortical and thalamic tables. B, Electricaldynamics during first three cycles of the model membrane exposed to US (f�0.69 MHz, 3.3 W/cm2): acoustic pressure (kPa),membrane capacitance (�F/cm2), and membrane potential (mV). C, A simplified network of RS, FS, and LTS cortical neurons.The filled black circles and open triangles are GABAA and AMPA- type synapses, respectively. The excitatory connections to thetwo FS and LTS inhibitory neurons are depressing and facilitating, respectively. The synaptic strength is represented by changesof the lines’ thickness (logarithmically scaled) and ITh-RS and ITh-FS are the thalamic inputs.
New Research 5 of 16
May/June 2016, 3(3) e0136-15.2016 eNeuro.sfn.org

dynamics are based on Vierling-Claassen et al.(2010).
Models’ equationsThe governing mathematical expression used in our studyare H&H-based single compartment model equations,adapted to mammalian RS, FS, and LTS cortical neurons(Pospischil et al., 2008) and thalamic TC and RE neurons(Destexhe et al., 1998a); in addition to the H&H ioniccurrents, the models include US-induced displacementcurrents (Plaksin et al., 2014). Excitatory and inhibitorysynaptic currents (Vierling-Claassen et al., 2010) and tha-lamic inputs to the RS and FS neurons (but not to the LTS)were added to the neocortical network simulations (Hayutet al., 2011):
Cm
dVm
dt� Vm
dCm
dt� I
Na� IK� IM IT/Ts
Ih
IKL� ILeak �
i
IGABAA IAMPA ITh ,
where Vm is the cell membrane potential; Cm is the cell
membrane capacitance;dCm
dtVm represents the capacitive
displacement current induced by the US-subjected BLSdynamics, leading to changes in the average membranecapacitance (Plaksin et al., 2014; Fig. 1B); I
Na�, IK�, IM, IT/Ts
,Ih, IKL
� and ILeak are the currents of the sodium, delayed-rectifier potassium, slow non-inactivating potassium, low-threshold calcium, hyperpolarization-activated mixed cat-ionic, leak potassium and the non-voltage-dependentnonspecific ion channels, respectively [I
Na�, IK�, and ILeak
exists in all NICE models and their dynamics were takenfrom Pospischil et al. (2008); ITs
only in the LTS and TCneurons, Huguenard and McCormick (1992); ITs
only in theRE neuron, Destexhe et al. (1996b); Ih and IKL
� only in theTC neuron, Destexhe et al. (1996a) and IM only in the RS,FS, and LTS neurons, Pospischil et al., (2008)]; �
iIGABAA
is
the sum of FS and LTS neurons related GABAA synapsesinduced inhibitory currents; IAMPA is the RS neuron relatedAMPA synapses induced excitatory current and ITh is thethalamic DC current input to the RS and FS neurons withITh-FS/ITh-RS�1.4, following Hayut et al. (2011; see alsoCruikshank et al., 2007), and ITh-RS �0.17 nA, which gen-erates baseline cortical pyramidal neuron average firingrate of about 7Hz, matching the average spontaneousfiring rate of ketamine-xylazine anesthetized animals(Destexhe and Paré., 1999).
The network model structure was adopted from Hayutet al. (2011), with synaptic currents modeled as in Vierling-Claassen et al. (2010):
IGABAA/AMPA � g� ijP(t)s(t)(Vm Vij) ,
where i and j indexes can be RS, FS, and LTS related tothe presynaptic and postsynaptic neurons, respectively;P�t� relates to the short term synaptic plasticity for theexcitatory connections to both the inhibitory neurons asdescribed by Vierling-Claassen et al. (2010) and modeledas by Varela et al. (1997); s�t� relates to synaptic open
probability modeled as bi-exponential function (Kleppeand Robinson, 1999) and Vij and g� ij represents the AMPAor GABAA synaptic currents reversal potentials andstrengths, respectively.
All the models’ biomechanical, biophysical, and synap-tic parameters and their respective sources can be foundin Table 1.
LTS and TC neurons T-type calcium channelscurrent dynamicsThe LTS inhibitory interneuron’s T-type calcium channelscurrent was modeled as by Pospischil et al. (2008):
IT � G� Ts2u(Vm VCa)dxdt
� (x�(Vm) x)/x(Vm),
where VCa is the Nernst potential of the calcium ions; s andu, designate the open probabilities of the activation andinactivation S-type and U-type gates, respectively, and x, x�,and x�Vm� are the open probability, voltage-dependentsteady state open probability and voltage-dependent timeconstant of the S-type or U-type gates, respectively.
The gates’ dynamics are based on Huguenard andMcCormick (1992):
s�(Vm) �1
1 � e(Vm�Vx�57)/6.2
u�(Vm) �1
1 � e(Vm�Vx�81)/4
s(Vm) �1
3.7�0.612 �1
e�Vm�Vx�132
16.7� � e�Vm�Vx�16.8
18.2��
u(Vm) � (Vm � Vx) 80 mV 13.7
e�Vm�Vx�467
66.6�
(Vm � Vx) � 80 mV 13.7
e�Vm�Vx�22
10.5� � 28�
,
where the time constants were adapted from of 24°C to36°C, using a Q10 factor of 3 (Pospischil et al., 2008) andVx��7 mV (Vx��2 mV for Fig. 7) is a voltage-dependence uniform shift factor defined by Pospischilet al. (2008). The TC neuron’s T-type calcium channelsgates’ dynamics are also described by these expressions,with Vx�0 mV (Huguenard and McCormick, 1992;Destexhe et al., 1998a).
Models’ implementationThe model’s set of equations was numerically solved inMATLAB (using the function ODE113). The time differencebetween the calculated points was set to 0.025/f �s(where f is the US frequency in megahertz). The NICEmodels, including the network model, were solved in thesame manner as explained in our previous study (Plaksinet al., 2014).
The US intensities (I) reported in this study were calculated inthe form of spatial peak-pulse average intensities for propagat-ing planar US waves (Hendee and Ritenour, 2002):
New Research 6 of 16
May/June 2016, 3(3) e0136-15.2016 eNeuro.sfn.org

I �PA
2
2�lc,
where PA is the pressure amplitude, �l is the surroundingmedium density, and c is the speed of sound in themedium.
ResultsPrediction I: the responses of cortical neurons toultrasound are strongly cell-type and waveform-dependentWe first studied the fundamental response of the threeNICE-type models of cortical neurons to CW and low duty-cycle (5%) US stimulation, as used by Yoo et al. (2011a) torespectively excite or suppress cortical activity (Fig. 2; 0.69MHz, acoustic pressure amplitude 320 kPa, intensity 3.3W/cm2). During CW excitation, the US-frequency-driven os-cillations of the NICE model neurons’ intramembrane spacelead to strongly hyperpolarized oscillations of the membranepotential, and the generation of a delayed AP train (after10–25 ms; Fig. 2A); this excitation process occurs as a resultof a charge accumulation mechanism described previously
for the RS-NICE model (Plaksin et al., 2014). In contrast tothis fairly uniform response of the three neuron types to CWexcitation, their responses to low duty-cycle excitation ishighly divergent (Fig. 2B), and only the LTS-type neuron iseffectively excited by this excitation mode and tonically firesa volley of APs. Pulsed excitation with a low 5% duty-cycle and with varying US durations and frequencies,has excitation thresholds for LTS neuron that are up-ward of three orders of magnitude lower than those forFS and RS neurons; this ratio decreased rapidly as theduty-cycle increased, down to comparable thresholdsat 50% duty-cycle (Fig. 2C–E). These excitation thresh-olds for the three cell types varied essentially indepen-dently of the excitation duration, and had only a weakdependence on US frequency, varying by �10% be-tween 0.2–1 MHz (data not shown).
What is the detailed biophysical basis underlyingthis selective AP generation by low duty-cycle US in thecortical LTS neurons? During US-on periods, the in-duced displacement currents cause a rapidly fluctuat-ing hyperpolarized membrane potentials (Fig. 1B) thatquickly suppresses the voltage-gated channels, whereas
Figure 2. Effect of continuous and pulsed US stimuli on the different cortical NICE-neurons (f�0.69 MHz). A, B, Effect of USstimulus (3.3 W/cm2, indicated by bars) on membrane potential and charge (top), sodium and potassium channels kinetics(middle), and on LTS neuron T-type calcium channels kinetics (bottom). Fifty millisecond continuous stimulus, effectivelystimulates all neuron types (A), whereas a 300-ms-long pulsed stimulus (pulse repetition frequency (PRF) 100 Hz and duty-cycle5%) causes only the LTS neuron to tonically fire a volley of APs (B). This selective LTS excitation is mediated through theelevation of the T-type calcium channels’ S-gates open probability during the US off times (right), which elevates these channels’conductance and consequently amplifies the charge accumulation process that occurs during US’s-on periods. C–E, Thresholdintensity versus duration required to generate a single AP using constant duty-cycle (PRF, 100 Hz). The excitation thresholdsfor the RS and FS neurons at 5% duty-cycle are �3.5 orders of magnitude higher than for the LTS neuron (E), decreasing rapidlyto �2� at 50% duty-cycle (C).
New Research 7 of 16
May/June 2016, 3(3) e0136-15.2016 eNeuro.sfn.org

the non-voltage-dependent (leak) ion channels accu-mulate charge (Fig. 3A, left). Examining this process inhigh temporal detail (Fig. 3B), the asymmetric hyperpo-larization is seen driving negative leak currents andcharge accumulation while acting to close voltage-gated activation gates and to open the inactivationgates. The main difference between the cell types oc-curs during the US-breaks: the LTS neuron’s T-typechannels are the only VGCs that continue the chargeaccumulation process during these extended durations(Fig. 3A, left, C, top), due to intrinsic features thatenhance their conductance during the US-off periods.Specifically, the contrast between the relatively slowrecovery time of U-type gates (15 ms) versus fastrecovery time (2 ms) of the S-type gates augmentsthe channels conductance by allowing activation torecover relatively quickly (Fig. 3C, left) and net chargeaccumulation (eg, compare to the Na� currents, whichare negligible prior to AP initiation; Fig. 3C, right).
Finally, to test whether the T-type channels’ impact onlow duty-cycle excitation is independent of the other spe-cific biophysical properties of the LTS neuron model (eg,different AP thresholds parameters), we added thesechannels to RS and FS neuron models. This chimericmanipulation was found to create similar orders-of-magnitude differences in the neural thresholds and sen-sitivity to low duty-cycle excitation (Fig. 3D) through thesame mechanisms.
Because the excitation thresholds are nearly independentof US frequency and duration, we next analyzed the jointdependence of the LTS and RS neurons on both duty-cycleand intensity, at a constant frequency and duration (0.69MHz and 500 ms; Fig. 4). This analysis lead to a two-dimensional phase diagram that naturally separates into twoactivation domains where either LTS neurons are activatedalone (at low duty-cycles) or both neuron types are jointlyactivated (at high duty-cycles). Our basic “first order” expec-tation (examined in detail in the next section) is that selec-
Figure 3. Detailed US response of LTS neurons (f�0.69 MHz). A, The contribution of each channel type to the accumulatedmembrane charge during 10 ms of CW versus a short-pulsed US stimulus (5% duty-cycle, PRF�100Hz): leak channels have thebiggest contribution during the US-on period, whereas the T-type calcium channels dominate the US-off period. B, Leak andcalcium channels’ dynamical response to the first few US cycles (1.3 W/cm2); the hyperpolarized phase drives negative leakcurrents that insert positive charge into the cell, while rapidly suppressing the calcium conductance due to the changes in S-and U-type gates open probability p(t), through dynamical perturbations of the steady state probability (p), and the gates’ timeconstants (). C, T-type calcium versus sodium channels’ dynamical responses during sparse stimulation (5% duty-cycle, 1.3W/cm2); the comparison highlights the dramatic changes during the US breaks in the calcium currents, open probability p(t) andthe steady-state open probability (p) of the S- and U-type gates, whereas the Na� gates are mostly dormant prior to actionpotential initiation (arrow). D, The pulsed US excitation thresholds of native RS and FS neurons versus following the chimericaddition of T-type calcium channels (RS� and FS�).
New Research 8 of 16
May/June 2016, 3(3) e0136-15.2016 eNeuro.sfn.org

tively exciting LTS inhibitory neurons will lead to networksuppression, whereas jointly activating all neuron types withgenerally similar rates (where �75% are excitatory; Markramet al., 2004) will lead to net network stimulation. Next, weexamined how these model-based predictions fit empiricaldata by marking on the parametric phase diagram theempirically-reported stimulation parameter ranges usedin nearly all cortical ultrasonic neuromodulation studies(color-coded according to whether the reported effectwas excitatory or suppressive). Strikingly, the result of thiscomparison (Fig. 4) demonstrates an excellent qualitativematch between the model-based phase diagram and es-sentially the entire range of empirical stimulation parametersused for ultrasonic excitation and suppression. The diagramalso shows that a two-order-of-magnitude variation in pulserepetition frequency (PRF changes from 10 to 1000 Hz) has
a relatively minor influence on the response thresholds; an-ecdotally, the lowest duty-cycle empirical activation condi-tions (leftmost borders for King et al., 2013 results, Fig. 4)correspond to an intermediate PRF of about 400 Hz, and areseen to be in a fairly good agreement with the expectedthresholds.
Prediction II: effect of ultrasound on cortical networkactivity reflects cell-type selective responses and ismodulated by thalamic inputs’ strengthTo examine how different US stimulation parameters af-fect cortical activity at the network level, we studied theresponses of a simplified but physiologically plausiblenetwork population model to US pulses with varying pa-rameters. The network contains the three cortical neuronpopulation types studied above, where the RS and FS
Figure 4. Phase plane diagram of single-neuron responses to varying US stimulation duty-cycle and intensity versus experi-mental cortical neuromodulation parameters. The phase diagram boundaries denote threshold intensities for US-mediatedresponses (frequency 0.69 MHz, duration 500 ms) from excitatory RS neurons (green dashed lines indicating 10 Hz and 1 kHzPRFs) and inhibitory LTS interneurons (red dashed lines, changes only slightly for different PRFs, not shown). These boundariesseparate the phase diagram into regions where either the inhibitory LTS neurons are activated alone (red, “suppression zone”)or the RS and the LTS neurons are jointly activated leading to net network stimulation (green, “activation zone”). The superposedbars indicate the experimental parameter ranges used in seven published cortical ultrasonic neuromodulation studies,color-coded according to the mediated responses: Ref. 1 (King et al., 2013; bars with diagonal lines), Ref. 2 (Yoo et al., 2011a),Ref. 3 (Kim et al., 2015), Ref. 4 (Kim et al., 2012), Ref. 5 (Kim et al., 2014), Ref. 6 (King et al., 2014), and Ref. 7 (Tufail et al., 2011).The excitation parameters reported for King et al. (2013) were those that caused stimulation success rates significantly higherthan their noise floor (�20%), with low-frequency CW intensities corrected for the expected formation of standing waves (Plaksinet al., 2014).
New Research 9 of 16
May/June 2016, 3(3) e0136-15.2016 eNeuro.sfn.org
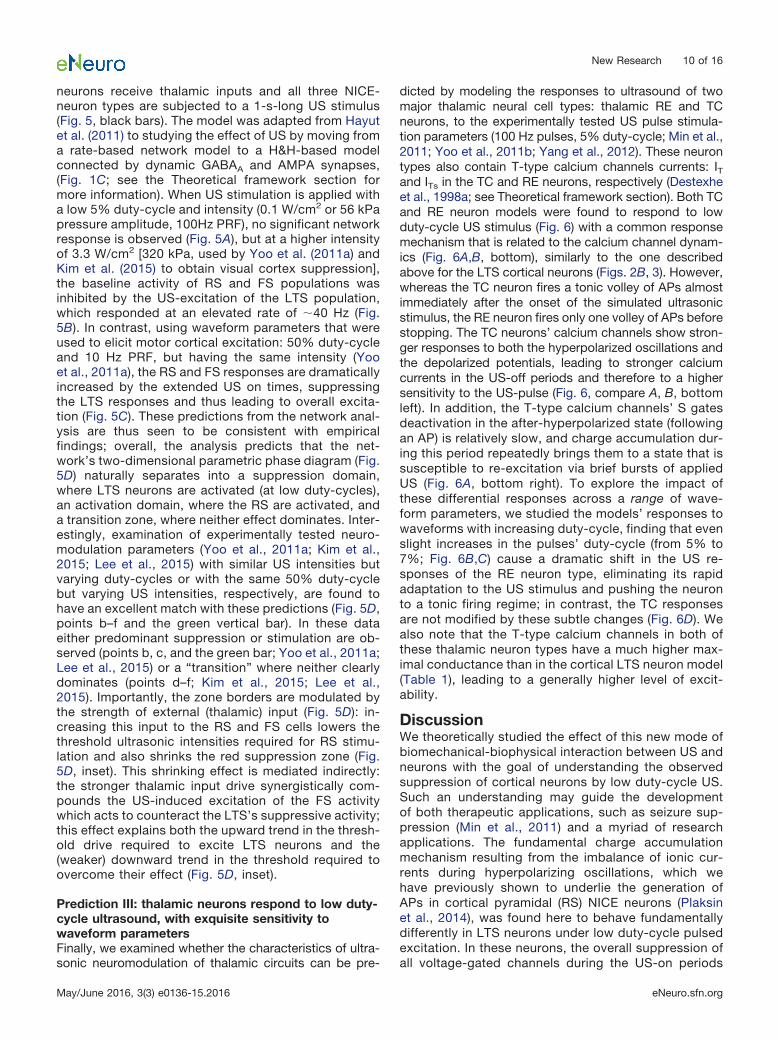
neurons receive thalamic inputs and all three NICE-neuron types are subjected to a 1-s-long US stimulus(Fig. 5, black bars). The model was adapted from Hayutet al. (2011) to studying the effect of US by moving froma rate-based network model to a H&H-based modelconnected by dynamic GABAA and AMPA synapses,(Fig. 1C; see the Theoretical framework section formore information). When US stimulation is applied witha low 5% duty-cycle and intensity (0.1 W/cm2 or 56 kPapressure amplitude, 100Hz PRF), no significant networkresponse is observed (Fig. 5A), but at a higher intensityof 3.3 W/cm2 [320 kPa, used by Yoo et al. (2011a) andKim et al. (2015) to obtain visual cortex suppression],the baseline activity of RS and FS populations wasinhibited by the US-excitation of the LTS population,which responded at an elevated rate of �40 Hz (Fig.5B). In contrast, using waveform parameters that wereused to elicit motor cortical excitation: 50% duty-cycleand 10 Hz PRF, but having the same intensity (Yooet al., 2011a), the RS and FS responses are dramaticallyincreased by the extended US on times, suppressingthe LTS responses and thus leading to overall excita-tion (Fig. 5C). These predictions from the network anal-ysis are thus seen to be consistent with empiricalfindings; overall, the analysis predicts that the net-work’s two-dimensional parametric phase diagram (Fig.5D) naturally separates into a suppression domain,where LTS neurons are activated (at low duty-cycles),an activation domain, where the RS are activated, anda transition zone, where neither effect dominates. Inter-estingly, examination of experimentally tested neuro-modulation parameters (Yoo et al., 2011a; Kim et al.,2015; Lee et al., 2015) with similar US intensities butvarying duty-cycles or with the same 50% duty-cyclebut varying US intensities, respectively, are found tohave an excellent match with these predictions (Fig. 5D,points b–f and the green vertical bar). In these dataeither predominant suppression or stimulation are ob-served (points b, c, and the green bar; Yoo et al., 2011a;Lee et al., 2015) or a “transition” where neither clearlydominates (points d–f; Kim et al., 2015; Lee et al.,2015). Importantly, the zone borders are modulated bythe strength of external (thalamic) input (Fig. 5D): in-creasing this input to the RS and FS cells lowers thethreshold ultrasonic intensities required for RS stimu-lation and also shrinks the red suppression zone (Fig.5D, inset). This shrinking effect is mediated indirectly:the stronger thalamic input drive synergistically com-pounds the US-induced excitation of the FS activitywhich acts to counteract the LTS’s suppressive activity;this effect explains both the upward trend in the thresh-old drive required to excite LTS neurons and the(weaker) downward trend in the threshold required toovercome their effect (Fig. 5D, inset).
Prediction III: thalamic neurons respond to low duty-cycle ultrasound, with exquisite sensitivity towaveform parametersFinally, we examined whether the characteristics of ultra-sonic neuromodulation of thalamic circuits can be pre-
dicted by modeling the responses to ultrasound of twomajor thalamic neural cell types: thalamic RE and TCneurons, to the experimentally tested US pulse stimula-tion parameters (100 Hz pulses, 5% duty-cycle; Min et al.,2011; Yoo et al., 2011b; Yang et al., 2012). These neurontypes also contain T-type calcium channels currents: ITand ITs in the TC and RE neurons, respectively (Destexheet al., 1998a; see Theoretical framework section). Both TCand RE neuron models were found to respond to lowduty-cycle US stimulus (Fig. 6) with a common responsemechanism that is related to the calcium channel dynam-ics (Fig. 6A,B, bottom), similarly to the one describedabove for the LTS cortical neurons (Figs. 2B, 3). However,whereas the TC neuron fires a tonic volley of APs almostimmediately after the onset of the simulated ultrasonicstimulus, the RE neuron fires only one volley of APs beforestopping. The TC neurons’ calcium channels show stron-ger responses to both the hyperpolarized oscillations andthe depolarized potentials, leading to stronger calciumcurrents in the US-off periods and therefore to a highersensitivity to the US-pulse (Fig. 6, compare A, B, bottomleft). In addition, the T-type calcium channels’ S gatesdeactivation in the after-hyperpolarized state (followingan AP) is relatively slow, and charge accumulation dur-ing this period repeatedly brings them to a state that issusceptible to re-excitation via brief bursts of appliedUS (Fig. 6A, bottom right). To explore the impact ofthese differential responses across a range of wave-form parameters, we studied the models’ responses towaveforms with increasing duty-cycle, finding that evenslight increases in the pulses’ duty-cycle (from 5% to7%; Fig. 6B,C) cause a dramatic shift in the US re-sponses of the RE neuron type, eliminating its rapidadaptation to the US stimulus and pushing the neuronto a tonic firing regime; in contrast, the TC responsesare not modified by these subtle changes (Fig. 6D). Wealso note that the T-type calcium channels in both ofthese thalamic neuron types have a much higher max-imal conductance than in the cortical LTS neuron model(Table 1), leading to a generally higher level of excit-ability.
DiscussionWe theoretically studied the effect of this new mode ofbiomechanical-biophysical interaction between US andneurons with the goal of understanding the observedsuppression of cortical neurons by low duty-cycle US.Such an understanding may guide the developmentof both therapeutic applications, such as seizure sup-pression (Min et al., 2011) and a myriad of researchapplications. The fundamental charge accumulationmechanism resulting from the imbalance of ionic cur-rents during hyperpolarizing oscillations, which wehave previously shown to underlie the generation ofAPs in cortical pyramidal (RS) NICE neurons (Plaksinet al., 2014), was found here to behave fundamentallydifferently in LTS neurons under low duty-cycle pulsedexcitation. In these neurons, the overall suppression ofall voltage-gated channels during the US-on periods
New Research 10 of 16
May/June 2016, 3(3) e0136-15.2016 eNeuro.sfn.org

Figure 5. Simplified cortical NICE-network responses to different US waveforms and intensities. The US stimuli (US frequency and duration: 0.69MHz and 1 s) are indicated by black bars (A–C). A, For a stimulus duty-cycle of 5% and 0.1 W/cm2 intensity (PRF, 100 Hz) no significant responseto US is observed. B, Increasing the intensity to 3.3 W/cm2 causes FS and RS activity suppression due to strong LTS activation (�40 Hz). C,Increasing the duty-cycle to 50% (PRF, 10 Hz) leads to high frequency activation of the RS and FS neurons, unsuppressed by the weaker LTSfiring (only at the beginning of each US pulse). D, Phase plane diagram for the network responses to US with varying duty-cycle and intensity (PRF,
New Research 11 of 16
May/June 2016, 3(3) e0136-15.2016 eNeuro.sfn.org

(Fig. 2B) is accompanied by partial opening of theT-type calcium channels’ U-gates; coupled with US-induced charge accumulation, this results in openingthe calcium channels’ S-gates, whose increased con-ductance effectively boosts membrane depolarizationduring the prolonged US-off periods (Fig. 3A, left, C,top) and leads to effective, cell-type selective excitation(Fig. 2B, bottom). Analysis of chimeric models of RSand FS neurons where the T-type channels were addedfurther demonstrates their crucial role in this selectiveexcitation (Fig. 3D).
The model-based predictions were found to provide apost hoc justification and understanding for the resultsof a significant body of experimental studies (Fig. 4),where parameter regimes naturally separated into sup-pression versus activation domains according to thepulse train’s duty-cycle, essentially independently ofother stimulation parameters. This separation in termsof cell-type-selective interactions is, to the best of ourknowledge, completely novel and was also found tocarry over to the network level (Fig. 5). Here, additionalinteresting issues were observed including modulationof the suppression and stimulation thresholds by thethalamic input level (Fig. 5D) and the emergence of atransition zone between the suppression and excitationdomains, where joint stimulation of multiple cell typesresults in a balanced state where none of the effectsdominate. The network model’s predictions have excel-lent agreement with very recently reported experimen-tal results in rats (Kim et al., 2015), as well as in humanprimary somatosensory cortex (Lee et al., 2015), whereartificial tactile sensations were reportedly evoked in allbut one subject (Fig. 5D). Additionally, we note thatthese network-level observations could also explainseveral other effects that were associated with USstimulation, for example, it predicts a dependence ofthe US excitation parameters on the doses and type ofanesthesia used, which is known to directly affect thelevel of thalamic activity (Alkire and Miller, 2005), more-over, it predicts that an extended ultrasonic suppres-sion regimen will strongly drive LTS neurons and canlead to post-tetanic potentiation of their synapses withplasticity effects that can last for minutes after thestimulation ends (Storozhuk et al., 2005; Yoo et al.,2011a). Finally, we note that the network analysis pre-dicts the existence of an optimum duty-cycle where theactivation threshold is minimal (�70%; Fig. 5D); thisconvex behavior, first predicted by Plaksin et al. (2014),reflects a tradeoff in RS and FS neurons betweencharge accumulation during US-on and the ability todischarge during US-off periods, and was recentlyexperimentally validated by Kim et al. (2014). It is im-
portant to note that the model apparently has a verystrong predictive power despite the multiple simplifyingassumptions that our theoretical approach invokes re-garding the biomechanics and biophysics of mem-branes, and ignoring the morphological complexity,which exists at both the single neuron and the networklevels. This robustness could potentially indicate thatthe presented model already captures the essentialfeatures of the underlying biophysics, a conclusionsupported by early analyses using NEURON models ofdetailed cortical NICE-networks and detailed analysesshowing negligible accessory effects from radiationpressure (Prieto et al., 2013; M. Plaksin, S. Shoham,and E. Kimmel, unpublished observations). Moreover,inspecting the responses of NICE models with differentsets of parameters adapted from cortical neuron mod-els for ferrets and cats (Fig. 7), shows an insensitivity ofthe basic model-based US-induced behavior, and sug-gests that ultrasonic neuromodulation and its underly-ing mechanisms may be fairly universal among differentmammalian species. In addition, NICE US-induced re-sponses are robust to partial sonophore membranecoverage and the associated reduced membrane po-tential oscillation range (Fig. 8), nor do they strictlydepend on the BLS biomechanics: the same qualitativeresults can be obtained by an arbitrary source of sinu-soidal membrane capacitance variations (Fig. 9).
In comparison to the relatively smooth parameter de-pendence observed in the cortical simulations, it appearsthat key thalamic neurons display an even stronger cell-type-selective dependence on stimulation parameters. In-terestingly, activity volleys in thalamic RE neurons play akey role in the formation of certain types of epilepticseizures (Slaght et al., 2002; Lee et al., 2014). The ob-served super-sensitivity of the NICE-RE model to thepulsed duty-cycle parameter could thus potentially under-lie a predicted transition from suppression to seizuresduring very mild corresponding increases in the duty-cycle of US applied to the thalamic structures (from 5% to7%), and perhaps explain why only 5% has been exper-imentally reported (Min et al., 2011; Yoo et al., 2011b;Yang et al., 2012).
In summary, we have demonstrated that the NICEframework, based on analyzing the expected effects ofintramembrane cavitation on multiple cell types using wellcharacterized, Hodgkin-Huxley type canonical models ofmembrane biophysics, not only agrees with, but alsosheds new light on a large array US neuromodulationexperimental results. Importantly, our results show thatwaveform modulation can potentially be used to selec-tively drive cell-type-selective responses leading to sup-pression. Achieving cell-type-selective stimulation is
continued100 Hz). Marks a–c indicate the conditions of the respective simulations (matching the experimental observations of Yoo et al. (2011a) and marksd, e, indicate parameters from Kim et al. (2015) where the experimental responses were no longer suppressive. The vertical green bar representhuman primary somatosensory cortex stimulation parameters used to evoke tactile sensations (Lee et al., 2015); f marks the only case where noresponse was observed. The green and red arrows and the inset depict the effect of increased thalamic input on the activation and suppressionthresholds.
New Research 12 of 16
May/June 2016, 3(3) e0136-15.2016 eNeuro.sfn.org

considered one of the crowning achievements of optoge-netics, and it is thus fascinating to consider that thiscapability can also be translated and further refined to thisnoninvasive neuromodulation modality and potentiallyeasily applied even to human subjects. While this studyexplored several major neural cell types of the neocortexand the thalamus, future studies could further explore the
responses of other neuron types in additional brain re-gions, to achieve a more complete selective ultrasonicstimulation ability. In fact, the T-type voltage gated cal-cium channels are expressed not only in the neocortexand the thalamus, but also in hippocampal pyramidalneurons (Nikonenko et al., 2005), putatively explaining theability to stimulate the hippocampus neurons by low duty-
Figure 6. The response of thalamic NICE-TC and NICE-RE models to low duty-cycle US stimulation waveforms. The US stimuli (USintensity: 5.2 W/cm2; US frequency: 0.69 MHz; PRF, 100 Hz) are indicated by black bars (A–C). A, B, For a 1.5 s, 5% duty-cycle USstimulus, the TC cell fires a tonic 100 Hz volley of APs, whereas the RE cell fires only one volley and stops. Bottom, The currents’profiles of the segments marked in the top, where IU is the sum of Ih, IKL
�, and ILeak currents (see complete channel composition in theTheoretical framework section). C, Increasing the duty-cycle to 6% and 7% brings the RE neurons to fire periodical volleys and aconstant volley of APs after two braked volleys, respectively. D, The relation between the TC and RE neurons’ spike rates and the USstimulation duty-cycle, calculated for the last 0.5 s period of the 1.5-s-long US stimulation.
New Research 13 of 16
May/June 2016, 3(3) e0136-15.2016 eNeuro.sfn.org
cycles and very low US intensities (Tyler et al., 2008; Tufailet al., 2010). Given the wide design space for acousticexcitation waveforms and strategies, these results high-
light the potential of this model-based approach to opti-mized design for various brain regions and targetapplications.
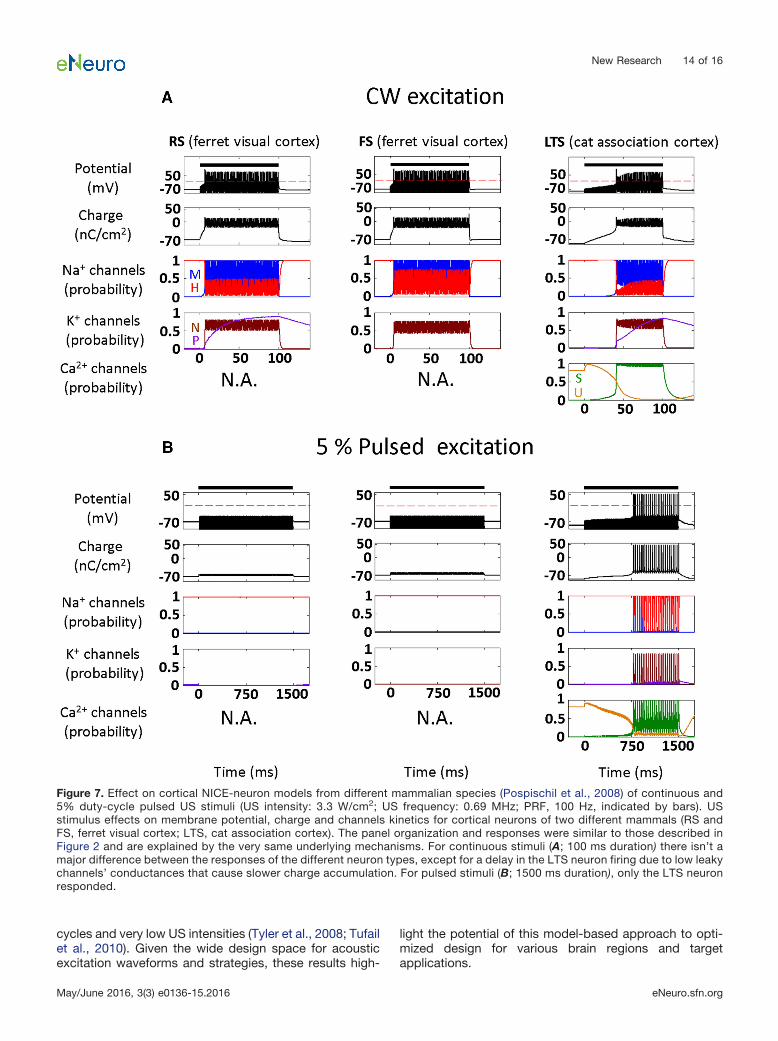
Figure 7. Effect on cortical NICE-neuron models from different mammalian species (Pospischil et al., 2008) of continuous and5% duty-cycle pulsed US stimuli (US intensity: 3.3 W/cm2; US frequency: 0.69 MHz; PRF, 100 Hz, indicated by bars). USstimulus effects on membrane potential, charge and channels kinetics for cortical neurons of two different mammals (RS andFS, ferret visual cortex; LTS, cat association cortex). The panel organization and responses were similar to those described inFigure 2 and are explained by the very same underlying mechanisms. For continuous stimuli (A; 100 ms duration) there isn’t amajor difference between the responses of the different neuron types, except for a delay in the LTS neuron firing due to low leakychannels’ conductances that cause slower charge accumulation. For pulsed stimuli (B; 1500 ms duration), only the LTS neuronresponded.
New Research 14 of 16
May/June 2016, 3(3) e0136-15.2016 eNeuro.sfn.org
ReferencesAlkire MT, Miller J (2005) General anesthesia and the neural corre-
lates of consciousness. Prog Brain Res 150:229-244. CrossRefMedline
Bystritsky A, Korb AS, Douglas PK, Cohen MS, Melega WP, Mulga-onkar AP, DeSalles A, Min BK, Yoo SS (2011) A review of low-intensity focused ultrasound pulsation. Brain Stimul. 4:125-136.CrossRef Medline
Colucci V, Strichartz G, Jolesz F, Vykhodtseva N, Hynynen K (2009)Focused ultrasound effects on nerve action potential in vitro.Ultrasound Med Biol 35:1737-1747. CrossRef Medline
Coluccia D, Fandino J, Schwyzer L, O’Gorman R, Remonda L, AnonJ, Martin E, Werner B (2014) First noninvasive thermal ablation ofa brain tumor with MR-guided focused ultrasound. J Ther Ultra-sound 2:17. CrossRef Medline
Cruikshank SJ, Lewis TJ, Connors BW (2007) Synaptic basis forintense thalamocortical activation of feedforward inhibitory cells inneocortex. Nat Neurosci 10:462-468. CrossRef Medline
Deffieux T, Younan Y, Wattiez N, Tanter M, Pouget P, Aubry JF(2013) Low-intensity focused ultrasound modulates monkey visuo-motor behavior. Curr Biol 23:2430-2433. CrossRef Medline
Destexhe A, Bal T, McCormick DA, Sejnowski TJ (1996a) Ionicmechanisms underlying synchronized oscillations and propagat-ing waves in a model of ferret thalamic slices. J Neurophysiol76:2049-2070. Medline
Destexhe A, Contreras D, Steriade M, Sejnowski TJ, Huguenard JR(1996b) In vivo, in vitro, and computational analysis of dendriticcalcium currents in thalamic reticular neurons. J Neurosci 16:169-185. Medline
Destexhe A, Contreras D, Steriade M (1998a) Mechanisms underly-ing the synchronizing action of corticothalamic feedback throughinhibition of thalamic relay cells. J Neurophysiol 79:999-1016.Medline
Destexhe A, Neubig M, Ulrich D, Huguenard J (1998b) Dendriticlow-threshold calcium currents in thalamic relay cells. J Neurosci18:3574-3588. Medline
Destexhe A, Paré D (1999) Impact of network activity on the integra-tive properties of neocortical pyramidal neurons in vivo. J Neuro-physiol 81:1531-1547. Medline
Gibbins IL, Rodgers HF, Matthew SE, Murphy SM (1998) Synapticorganisation of lumbar sympathetic ganglia of guinea pigs: serialsection ultrastructural analysis of dye�filled sympathetic final mo-tor neurons. J Comp Neurol 402:285-302. Medline
Hayut I, Fanselow EE, Connors BW, Golomb D (2011) LTS and FSinhibitory interneurons, short-term synaptic plasticity, and corticalcircuit dynamics. PLoS Comput Biol 7:e1002248. CrossRef Med-line
Hendee WR, Ritenour ER (2002) Medical imaging physics, Ed 4. NewYork, MA: Wiley.
Huguenard JR, McCormick DA (1992) Simulation of the currentsinvolved in rhythmic oscillations in thalamic relay neurons. J Neu-rophysiol 68:1373-1383. Medline
Juan EJ, González R, Albors G, Ward MP, Irazoqui P (2014) Vagusnerve modulation using focused pulsed ultrasound: potential ap-plications and preliminary observations in a rat. Int J Imaging SystTechnol 24:67-71. CrossRef
Kim H, Chiu A, Lee SD, Fischer K, Yoo SS (2014) Focusedultrasound-mediated non-invasive brain stimulation: examination
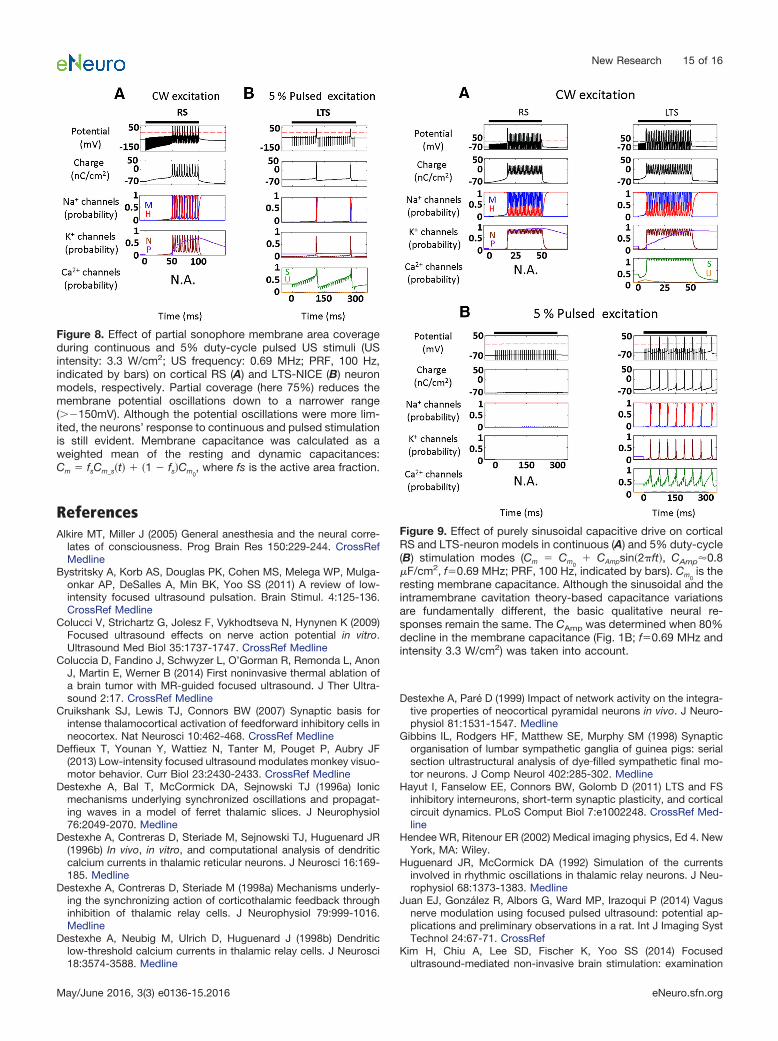
Figure 8. Effect of partial sonophore membrane area coverageduring continuous and 5% duty-cycle pulsed US stimuli (USintensity: 3.3 W/cm2; US frequency: 0.69 MHz; PRF, 100 Hz,indicated by bars) on cortical RS (A) and LTS-NICE (B) neuronmodels, respectively. Partial coverage (here 75%) reduces themembrane potential oscillations down to a narrower range(��150mV). Although the potential oscillations were more lim-ited, the neurons’ response to continuous and pulsed stimulationis still evident. Membrane capacitance was calculated as aweighted mean of the resting and dynamic capacitances:Cm � fsCm_s�t� � �1 fs�Cm0
, where fs is the active area fraction.
Figure 9. Effect of purely sinusoidal capacitive drive on corticalRS and LTS-neuron models in continuous (A) and 5% duty-cycle(B) stimulation modes (Cm � Cm0
� CAmpsin�2�ft�, CAmp0.8�F/cm2, f�0.69 MHz; PRF, 100 Hz, indicated by bars). Cm0
is theresting membrane capacitance. Although the sinusoidal and theintramembrane cavitation theory-based capacitance variationsare fundamentally different, the basic qualitative neural re-sponses remain the same. The CAmp was determined when 80%decline in the membrane capacitance (Fig. 1B; f�0.69 MHz andintensity 3.3 W/cm2) was taken into account.
New Research 15 of 16
May/June 2016, 3(3) e0136-15.2016 eNeuro.sfn.org

of sonication parameters. Brain Stimul 7:748-756. CrossRef Med-line
Kim H, Park MY, Lee SD, Lee W, Chiu A, Yoo SS (2015) Suppressionof EEG visual-evoked potentials in rats through neuromodulatoryfocused ultrasound. Neuroreport 26:211-215. CrossRef Medline
Kim H, Taghados SJ, Fischer K, Maeng LS, Park S, Yoo, SS (2012)Noninvasive transcranial stimulation of rat abducens nerve byfocused ultrasound. Ultrasound Med Biol 38:1568-1575. CrossRefMedline
King RL, Brown JR, Newsome WT, Pauly KB (2013) Effective param-eters for ultrasound-induced in vivo neurostimulation. UltrasoundMed Biol 39:312-331. CrossRef Medline
King RL, Brown JR, Pauly KB (2014) Localization of ultrasound-induced in vivo neurostimulation in the mouse model. UltrasoundMed Biol 40:1512-1522. CrossRef Medline
Kleppe IC, Robinson HP (1999) Determining the activation timecourse of synaptic AMPA receptors from openings of colocalizedNMDA receptors. Biophys J 77:1418-1427. CrossRef Medline
Krasovitski B, Frenkel V, Shoham S, Kimmel E (2011) Intramembranecavitation as a unifying mechanism for ultrasound-induced bioef-fects. Proc Natl Acad Sci U S A 108:3258-3263. CrossRef Medline
Lee SE, Lee J, Latchoumane C, Lee B, Oh SJ, Saud ZA, Park C, SunN, Cheong E, Chen CC, Choi EJ, Lee CJ, Shin HS (2014). Reboundburst firing in the reticular thalamus is not essential for pharmaco-logical absence seizures in mice. Proc Natl Acad Sci U S A111:11828-11833. CrossRef
Lee W, Kim H, Jung Y, Song IU, Chung YA, Yoo SS (2015) Image-guided transcranial focused ultrasound stimulates human primarysomatosensory cortex. Sci Rep 5:8743. CrossRef Medline
Legon W, Sato TF, Opitz A, Mueller J, Barbour A, Williams A, TylerWJ (2014) Transcranial focused ultrasound modulates the activityof primary somatosensory cortex in humans. Nat Neurosci 17:322-329. CrossRef Medline
Lele PP (1963) Effects of focused ultrasonic radiation on peripheralnerve, with observations on local heating. Exp Neurol 8:47-83.CrossRef
Lillemeier BF, Pfeiffer JR, Surviladze Z, Wilson BS, Davis MM (2006)Plasma membrane-associated proteins are clustered into islandsattached to the cytoskeleton. Proc Natl Acad Sci U S A 103:18992-18997. CrossRef Medline
Markram H, Toledo-Rodriguez M, Wang Y, Gupta A, Silberberg G,Wu C (2004) Interneurons of the neocortical inhibitory system. NatRev Neurosci 5:793-807. CrossRef Medline
Menz MD, Oralkan O, Khuri-Yakub PT, Baccus SA (2013) Preciseneural stimulation in the retina using focused ultrasound. J Neu-rosci 33:4550-4560. CrossRef Medline
Min BK, Bystritsky A, Jung KI, Fischer K, Zhang Y, Maeng LS, ParkSI, Chung YA, Jolesz FA, Yoo SS (2011) Focused ultrasound-mediated suppression of chemically-induced acute epileptic EEGactivity. BMC Neurosci 12:23. CrossRef Medline
Moore JH, Gieck JH, Saliba EN, Perrin DH, Ball DW, McCue FC(2000) The biophysical effects of ultrasound on median nerve distallatencies. Electromyogr Clin Neurophysiol 40:169-180. Medline
Naor O, Hertzberg Y, Zemel E, Kimmel E, Shoham S (2012) Towardsmultifocal ultrasonic neural stimulation II: design considerations foran acoustic retinal prosthesis. J Neural Eng 9:026006. CrossRefMedline
Naor O, Krupa S, Shoham S (2016) Ultrasonic neuromodulation. JNeural Eng 13:031003. CrossRef Medline
Nikonenko I, Bancila M, Bloc A, Muller D, Bijlenga P (2005) Inhibitionof T-type calcium channels protects neurons from delayed
ischemia-induced damage. Mol Pharmacol 68:84-89. CrossRefMedline
Plaksin M, Shoham S, Kimmel E (2014) Intramembrane cavitation asa predictive bio-piezoelectric mechanism for ultrasonic brain stim-ulation. Phys Rev X 4:011004. CrossRef
Pospischil M, Rodriguez MT, Monier C, Piwkowska Z, Bal T, FrégnacY, Markram H, Destexhe A (2008) Minimal Hodgkin–Huxley typemodels for different classes of cortical and thalamic neurons. BiolCybern 99:427-441. CrossRef Medline
Prieto ML, Oralkan Ö, Khuri-Yakub BT, Maduke MC (2013) Dynamicresponse of model lipid membranes to ultrasonic radiation forcePLoS ONE 8:e77115. CrossRef Medline
Slaght SJ, Leresche N, Deniau JM, Crunelli V, Charpier S (2002)Activity of thalamic reticular neurons during spontaneous geneti-cally determined spike and wave discharges. J Neurosci 22:2323-2334. Medline
Storozhuk MV, Ivanova SY, Balaban PM, Kostyuk PG (2005) Possiblerole of mitochondria in posttetanic potentiation of GABAergicsynaptic transmission in rat neocortical cell cultures. Synapse58:45-52. CrossRef Medline
Tsui PH, Wang SH, Huang CC (2005) In vitro effects of ultrasoundwith different energies on the conduction properties of neuraltissue. Ultrasonics 43:560-565. CrossRef Medline
Tufail Y, Matyushov A, Baldwin N, Tauchmann ML, Georges J,Yoshihiro A, Tillery SI, Tyler WJ (2010) Transcranial pulsed ultra-sound stimulates intact brain circuits. Neuron 66:681-694. Cross-Ref Medline
Tufail Y, Yoshihiro A, Pati S, Li MM, Tyler WJ (2011) Ultrasonicneuromodulation by brain stimulation with transcranial ultrasound.Nat Protoc 6:1453-1470. CrossRef Medline
Tyler WJ (2011) Noninvasive neuromodulation with ultrasound? Acontinuum mechanics hypothesis. Neuroscientist 17:25-36.CrossRef Medline
Tyler WJ, Tufail Y, Finsterwald M, Tauchmann ML, Olson EJ, Majes-tic C (2008) Remote excitation of neuronal circuits using low-intensity, low-frequency ultrasound. PLoS ONE 3:e3511. CrossRefMedline
Varela JA, Sen K, Gibson J, Fost J, Abbott LF, Nelson SB (1997) Aquantitative description of short-term plasticity at excitatory syn-apses in layer 2/3 of rat primary visual cortex. J Neurosci 17:7926-7940. Medline
Vierling-Claassen D, Cardin JA, Moore CI, Jones SR (2010) Compu-tational modeling of distinct neocortical oscillations driven by cell-type selective optogenetic drive: separable resonant circuitscontrolled by low-threshold spiking and fast-spiking interneurons.Front Hum Neurosci 4:198. CrossRef Medline
Yang PS, Kim H, Lee W, Bohlke M, Park S, Maher TJ, Yoo SS (2012)Transcranial focused ultrasound to the thalamus is associated withreduced extracellular GABA levels in rats. Neuropsychobiology65:153-160. CrossRef Medline
Yoo SS, Bystritsky A, Lee JH, Zhang Y, Fischer K, Min BK, McDan-nold NJ, Pascual-Leone A, Jolesz FA (2011a) Focused ultrasoundmodulates region-specific brain activity. Neuroimage 56:1267-1275. Medline
Yoo SS, Kim H, Min BK, Franck SPE (2011b) Transcranial focusedultrasound to the thalamus alters anesthesia time in rats. Neurore-port 22:783-787. CrossRef Medline
Young RR, Henneman E (1961) Functional effects of focusedultrasound on mammalian nerves. Science 134:1521-1522. Med-line
New Research 16 of 16
May/June 2016, 3(3) e0136-15.2016 eNeuro.sfn.org